Embed Size (px)
Citation preview
1
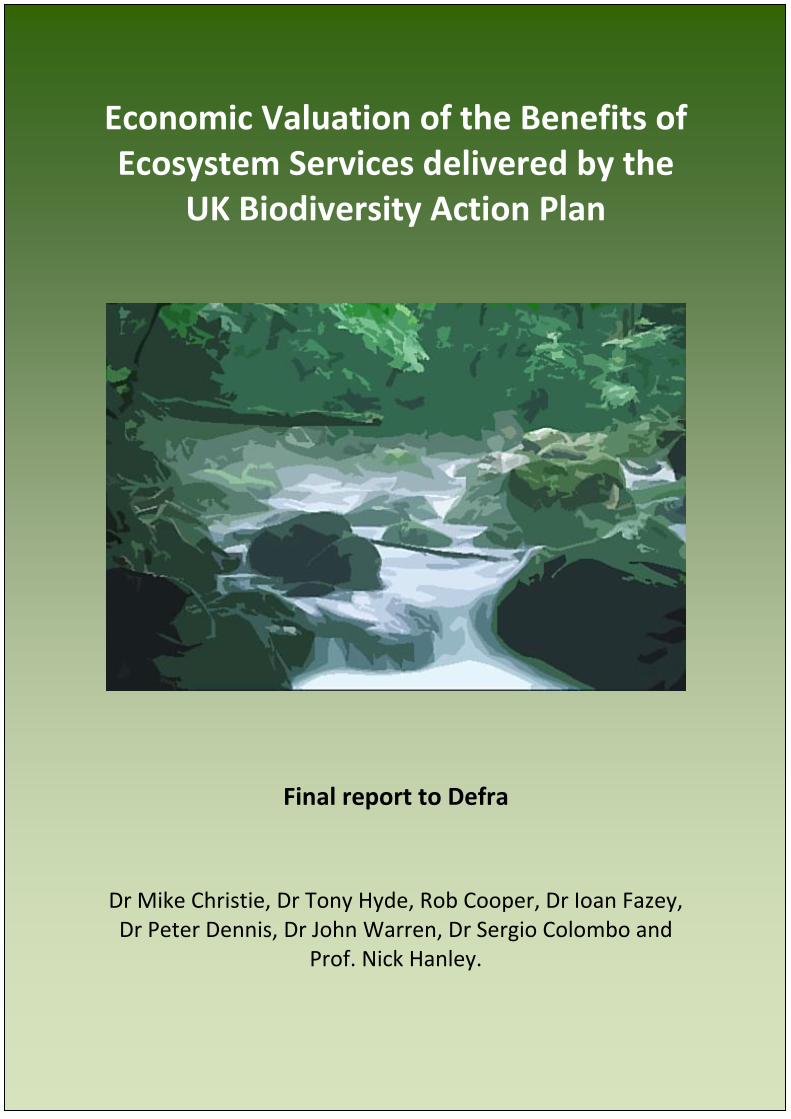
Economic Valuation of the Benefits of Ecosystem Services delivered by the
UK Biodiversity Action Plan
Final report to Defra
Dr Mike Christie, Dr Tony Hyde, Rob Cooper, Dr Ioan Fazey, Dr Peter Dennis, Dr John Warren, Dr Sergio Colombo and
Prof. Nick Hanley.
2
Economic Valuation of the Benefits of Ecosystem Services delivered by the UK Biodiversity Action Plan
(Defra Project: NE0112)
Final Report
Report to Defra
London
August 2011
By
Dr Mike Christie, Dr Tony Hyde, Rob Cooper, Dr Ioan Fazey, Dr Peter Dennis, Dr John Warren, Dr Sergio Colombo and Prof. Nick Hanley.
Contact details: Dr Mike Christie
Institute of Biological, Environmental and Rural Sciences, Aberystwyth University,
Aberystwyth, Ceredigion, Wales, SY23 3DA.
Tel: 01970 622217; Fax: 01970 622350; Email: [email protected]
3
Table of Contents Table of Contents ................................................................................................................................ 3
List of Tables ...................................................................................................................................... 5
The Economic Valuation of the Ecosystem Service Benefits delivered by the UK Biodiversity Action
Plan: Policy Makers Summary ............................................................................................................... 6 Executive summary ................................................................................................................................. 9 1. Introduction ................................................................................................................................... 22
1.1. Overview of research protocol .............................................................................................. 22
1.2. Structure of report ................................................................................................................. 25
Part A: Literature review ...................................................................................................................... 26 2. Literature ....................................................................................................................................... 27
2.1. Origin and development of the UK BAP .............................................................................. 27
2.2. Valuing ecosystems services ................................................................................................. 28
Part B: Methodology ............................................................................................................................. 32 3. UK BAP policy scenarios ............................................................................................................. 33
3.1. Scope of the UK BAP ........................................................................................................... 33
3.2. Factual and Counter-factual UK BAP scenarios. .................................................................. 34
4. Step 1: The Choice experiment: Economic valuation of ecosystem services ............................... 36 4.1. The design of the choice experiment study ........................................................................... 36
4.2. Selection of ecosystem service attributes. ............................................................................. 41
4.3. Description of ecosystem service attributes. ......................................................................... 43
4.4. Data derived from the choice experiment ............................................................................. 48
5. Step 2: The Weighting Matrix: Assigning ecosystem services to BAP habitats........................... 49 6. Step 3: Estimation of the value of ecosystem services directly attributable to the UK BAP. ....... 52 Results ................................................................................................................................................... 53 7. Step 1 Results: The choice experiment ......................................................................................... 54
7.1. Survey response .................................................................................................................... 54
7.2. Preliminary analysis of CE models. ...................................................................................... 55
7.3. Value of ecosystem services delivered by UK BAP habitats within own region ................. 58
7.4. Value of ecosystem services delivered by UK BAP habitats within the ‘rest of the UK’ .... 63
7.5. Value of ecosystem services delivered by UK BAP habitats in the UK: ‘within own region’
+ ‘rest of UK’. ................................................................................................................................... 69
8. Step 2 Results: Weighting Matrix ................................................................................................. 71 9. Step 3 Results: Value of ecosystem services direct attributable to the UK BAP. ......................... 78
9.1. Contribution of BAP habitats to the delivery of ecosystem services within each region. .... 78
9.2. Value of ecosystem services by BAP habitats. ..................................................................... 80
9.3. Value of ecosystem services by region. ................................................................................ 86
9.4. Cost benefit analysis ............................................................................................................. 88
Part D: Discussion and Conclusions ..................................................................................................... 93 10. Discussion ..................................................................................................................................... 94
10.1. Critique of choice experiment ........................................................................................... 94
10.2. Critique of weighting matrix ........................................................................................... 100
10.3. Critique of Step 3 ............................................................................................................ 106
10.4. Sensitivity analysis .......................................................................................................... 108
11. Conclusions ................................................................................................................................. 110
4
11.1. Headline results ............................................................................................................... 110
11.2. Caveats ............................................................................................................................ 112
12. References ................................................................................................................................... 114 Appendix ............................................................................................................................................. 117 13. Selection of the UK BAP factual and counter-factual scenarios. ............................................... 118 14. Choice experiment: ecosystem service attribute and levels. ....................................................... 122
14.1. Wild Food. ...................................................................................................................... 122
14.2. Non-food products. ......................................................................................................... 123
14.3. Climate regulation ........................................................................................................... 123
14.4. Water regulation .............................................................................................................. 127
14.5. Sense of place.................................................................................................................. 128
14.6. ‘Charismatic’ species. ..................................................................................................... 132
14.7. Non-charismatic species. ................................................................................................ 133
15. Choice experiment survey instrument. ........................................................................................ 135 16. Instructions for completing the ‘Weighting Matrix’ ................................................................... 155
5
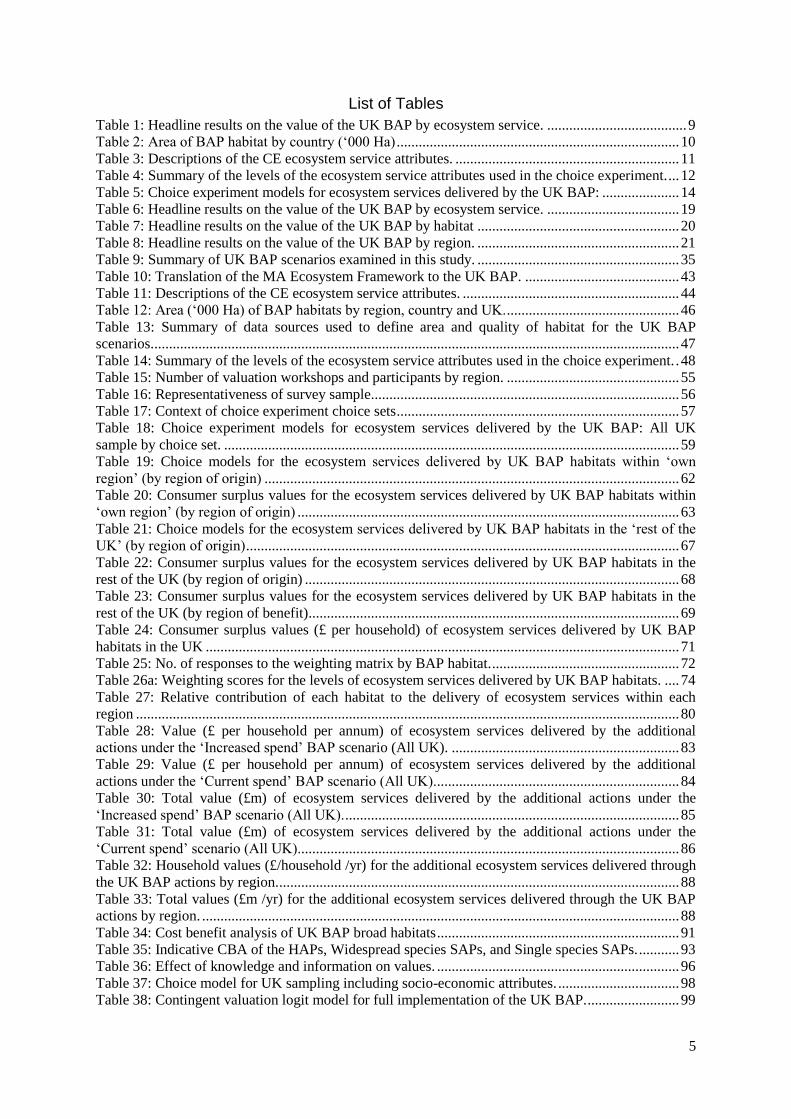
List of Tables
Table 1: Headline results on the value of the UK BAP by ecosystem service. ...................................... 9 Table 2: Area of BAP habitat by country (‘000 Ha) ............................................................................. 10 Table 3: Descriptions of the CE ecosystem service attributes. ............................................................. 11 Table 4: Summary of the levels of the ecosystem service attributes used in the choice experiment. ... 12 Table 5: Choice experiment models for ecosystem services delivered by the UK BAP: ..................... 14 Table 6: Headline results on the value of the UK BAP by ecosystem service. .................................... 19 Table 7: Headline results on the value of the UK BAP by habitat ....................................................... 20 Table 8: Headline results on the value of the UK BAP by region. ....................................................... 21 Table 9: Summary of UK BAP scenarios examined in this study. ....................................................... 35 Table 10: Translation of the MA Ecosystem Framework to the UK BAP. .......................................... 43 Table 11: Descriptions of the CE ecosystem service attributes. ........................................................... 44 Table 12: Area (‘000 Ha) of BAP habitats by region, country and UK. ............................................... 46 Table 13: Summary of data sources used to define area and quality of habitat for the UK BAP
scenarios. ............................................................................................................................................... 47 Table 14: Summary of the levels of the ecosystem service attributes used in the choice experiment. . 48 Table 15: Number of valuation workshops and participants by region. ............................................... 55 Table 16: Representativeness of survey sample.................................................................................... 56 Table 17: Context of choice experiment choice sets ............................................................................. 57 Table 18: Choice experiment models for ecosystem services delivered by the UK BAP: All UK
sample by choice set. ............................................................................................................................ 59 Table 19: Choice models for the ecosystem services delivered by UK BAP habitats within ‘own
region’ (by region of origin) ................................................................................................................. 62 Table 20: Consumer surplus values for the ecosystem services delivered by UK BAP habitats within
‘own region’ (by region of origin) ........................................................................................................ 63 Table 21: Choice models for the ecosystem services delivered by UK BAP habitats in the ‘rest of the
UK’ (by region of origin) ...................................................................................................................... 67 Table 22: Consumer surplus values for the ecosystem services delivered by UK BAP habitats in the
rest of the UK (by region of origin) ...................................................................................................... 68 Table 23: Consumer surplus values for the ecosystem services delivered by UK BAP habitats in the
rest of the UK (by region of benefit) ..................................................................................................... 69 Table 24: Consumer surplus values (£ per household) of ecosystem services delivered by UK BAP
habitats in the UK ................................................................................................................................. 71 Table 25: No. of responses to the weighting matrix by BAP habitat. ................................................... 72 Table 26a: Weighting scores for the levels of ecosystem services delivered by UK BAP habitats. .... 74 Table 27: Relative contribution of each habitat to the delivery of ecosystem services within each
region .................................................................................................................................................... 80 Table 28: Value (£ per household per annum) of ecosystem services delivered by the additional
actions under the ‘Increased spend’ BAP scenario (All UK). .............................................................. 83 Table 29: Value (£ per household per annum) of ecosystem services delivered by the additional
actions under the ‘Current spend’ BAP scenario (All UK). .................................................................. 84 Table 30: Total value (£m) of ecosystem services delivered by the additional actions under the
‘Increased spend’ BAP scenario (All UK). ........................................................................................... 85 Table 31: Total value (£m) of ecosystem services delivered by the additional actions under the
‘Current spend’ scenario (All UK)........................................................................................................ 86 Table 32: Household values (£/household /yr) for the additional ecosystem services delivered through
the UK BAP actions by region. ............................................................................................................. 88 Table 33: Total values (£m /yr) for the additional ecosystem services delivered through the UK BAP
actions by region. .................................................................................................................................. 88 Table 34: Cost benefit analysis of UK BAP broad habitats .................................................................. 91 Table 35: Indicative CBA of the HAPs, Widespread species SAPs, and Single species SAPs. ........... 93 Table 36: Effect of knowledge and information on values. .................................................................. 96 Table 37: Choice model for UK sampling including socio-economic attributes. ................................. 98 Table 38: Contingent valuation logit model for full implementation of the UK BAP. ......................... 99
6
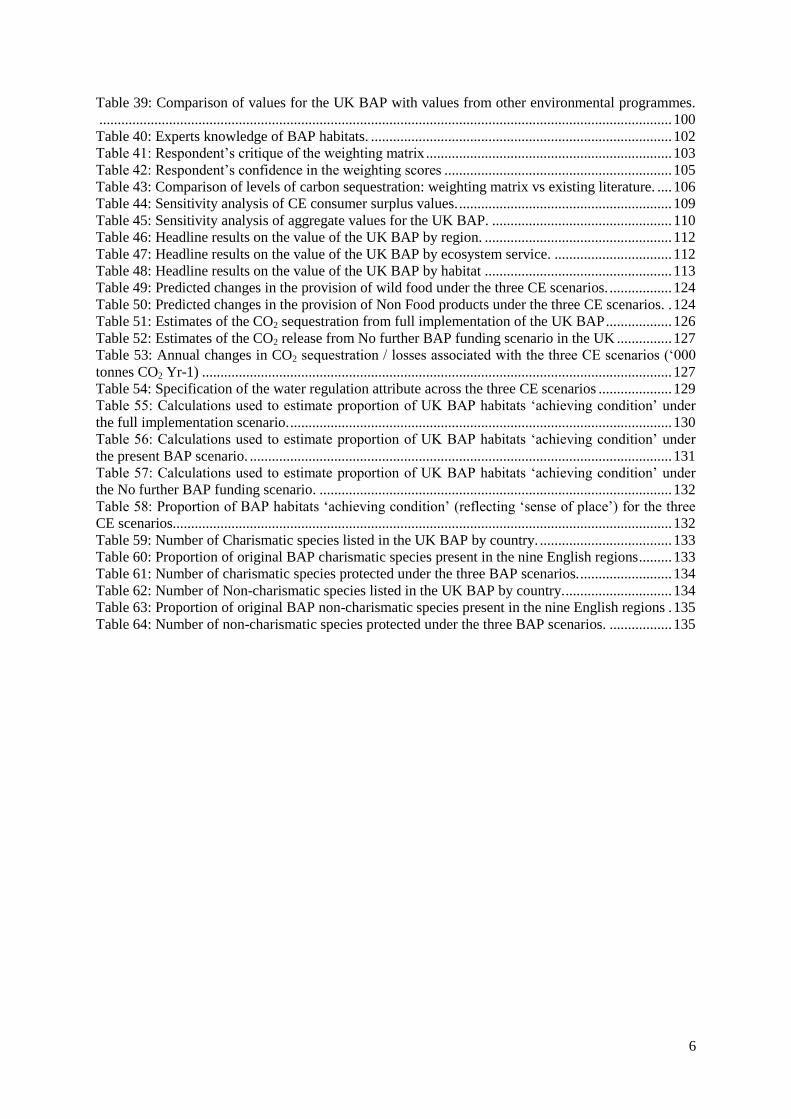
Table 39: Comparison of values for the UK BAP with values from other environmental programmes.
............................................................................................................................................................ 100 Table 40: Experts knowledge of BAP habitats. .................................................................................. 102 Table 41: Respondent’s critique of the weighting matrix ................................................................... 103 Table 42: Respondent’s confidence in the weighting scores .............................................................. 105 Table 43: Comparison of levels of carbon sequestration: weighting matrix vs existing literature. .... 106 Table 44: Sensitivity analysis of CE consumer surplus values. .......................................................... 109 Table 45: Sensitivity analysis of aggregate values for the UK BAP. ................................................. 110 Table 46: Headline results on the value of the UK BAP by region. ................................................... 112 Table 47: Headline results on the value of the UK BAP by ecosystem service. ................................ 112 Table 48: Headline results on the value of the UK BAP by habitat ................................................... 113 Table 49: Predicted changes in the provision of wild food under the three CE scenarios. ................. 124 Table 50: Predicted changes in the provision of Non Food products under the three CE scenarios. . 124 Table 51: Estimates of the CO2 sequestration from full implementation of the UK BAP .................. 126 Table 52: Estimates of the CO2 release from No further BAP funding scenario in the UK ............... 127 Table 53: Annual changes in CO2 sequestration / losses associated with the three CE scenarios (‘000
tonnes CO2 Yr-1) ................................................................................................................................ 127 Table 54: Specification of the water regulation attribute across the three CE scenarios .................... 129 Table 55: Calculations used to estimate proportion of UK BAP habitats ‘achieving condition’ under
the full implementation scenario. ........................................................................................................ 130 Table 56: Calculations used to estimate proportion of UK BAP habitats ‘achieving condition’ under
the present BAP scenario. ................................................................................................................... 131 Table 57: Calculations used to estimate proportion of UK BAP habitats ‘achieving condition’ under
the No further BAP funding scenario. ................................................................................................ 132 Table 58: Proportion of BAP habitats ‘achieving condition’ (reflecting ‘sense of place’) for the three
CE scenarios........................................................................................................................................ 132 Table 59: Number of Charismatic species listed in the UK BAP by country. .................................... 133 Table 60: Proportion of original BAP charismatic species present in the nine English regions ......... 133 Table 61: Number of charismatic species protected under the three BAP scenarios. ......................... 134 Table 62: Number of Non-charismatic species listed in the UK BAP by country. ............................. 134 Table 63: Proportion of original BAP non-charismatic species present in the nine English regions . 135 Table 64: Number of non-charismatic species protected under the three BAP scenarios. ................. 135
7
The Economic Valuation of the Ecosystem Service Benefits delivered by the
UK Biodiversity Action Plan: Policy Makers Summary
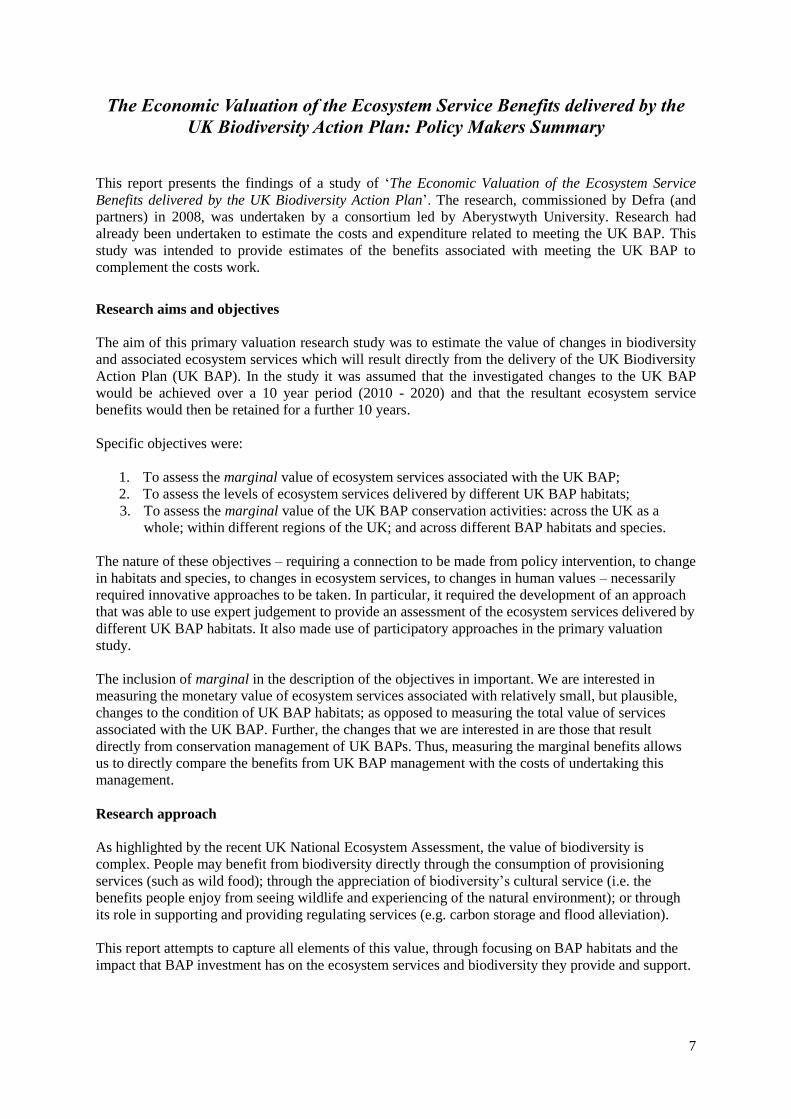
This report presents the findings of a study of ‘The Economic Valuation of the Ecosystem Service
Benefits delivered by the UK Biodiversity Action Plan’. The research, commissioned by Defra (and
partners) in 2008, was undertaken by a consortium led by Aberystwyth University. Research had
already been undertaken to estimate the costs and expenditure related to meeting the UK BAP. This
study was intended to provide estimates of the benefits associated with meeting the UK BAP to
complement the costs work.
Research aims and objectives
The aim of this primary valuation research study was to estimate the value of changes in biodiversity
and associated ecosystem services which will result directly from the delivery of the UK Biodiversity
Action Plan (UK BAP). In the study it was assumed that the investigated changes to the UK BAP
would be achieved over a 10 year period (2010 - 2020) and that the resultant ecosystem service
benefits would then be retained for a further 10 years.
Specific objectives were:
1. To assess the marginal value of ecosystem services associated with the UK BAP;
2. To assess the levels of ecosystem services delivered by different UK BAP habitats;
3. To assess the marginal value of the UK BAP conservation activities: across the UK as a
whole; within different regions of the UK; and across different BAP habitats and species.
The nature of these objectives – requiring a connection to be made from policy intervention, to change
in habitats and species, to changes in ecosystem services, to changes in human values – necessarily
required innovative approaches to be taken. In particular, it required the development of an approach
that was able to use expert judgement to provide an assessment of the ecosystem services delivered by
different UK BAP habitats. It also made use of participatory approaches in the primary valuation
study.
The inclusion of marginal in the description of the objectives in important. We are interested in
measuring the monetary value of ecosystem services associated with relatively small, but plausible,
changes to the condition of UK BAP habitats; as opposed to measuring the total value of services
associated with the UK BAP. Further, the changes that we are interested in are those that result
directly from conservation management of UK BAPs. Thus, measuring the marginal benefits allows
us to directly compare the benefits from UK BAP management with the costs of undertaking this
management.
Research approach
As highlighted by the recent UK National Ecosystem Assessment, the value of biodiversity is
complex. People may benefit from biodiversity directly through the consumption of provisioning
services (such as wild food); through the appreciation of biodiversity’s cultural service (i.e. the
benefits people enjoy from seeing wildlife and experiencing of the natural environment); or through
its role in supporting and providing regulating services (e.g. carbon storage and flood alleviation).
This report attempts to capture all elements of this value, through focusing on BAP habitats and the
impact that BAP investment has on the ecosystem services and biodiversity they provide and support.
8
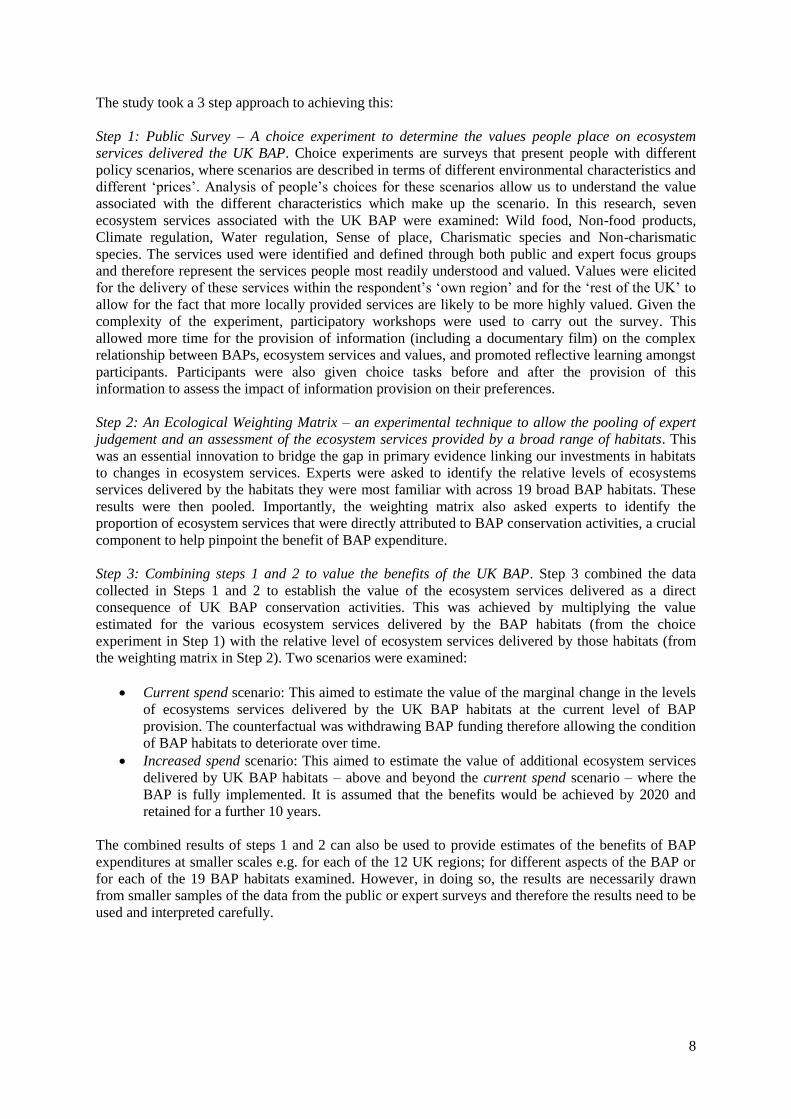
The study took a 3 step approach to achieving this:
Step 1: Public Survey – A choice experiment to determine the values people place on ecosystem
services delivered the UK BAP. Choice experiments are surveys that present people with different
policy scenarios, where scenarios are described in terms of different environmental characteristics and
different ‘prices’. Analysis of people’s choices for these scenarios allow us to understand the value
associated with the different characteristics which make up the scenario. In this research, seven
ecosystem services associated with the UK BAP were examined: Wild food, Non-food products,
Climate regulation, Water regulation, Sense of place, Charismatic species and Non-charismatic
species. The services used were identified and defined through both public and expert focus groups
and therefore represent the services people most readily understood and valued. Values were elicited
for the delivery of these services within the respondent’s ‘own region’ and for the ‘rest of the UK’ to
allow for the fact that more locally provided services are likely to be more highly valued. Given the
complexity of the experiment, participatory workshops were used to carry out the survey. This
allowed more time for the provision of information (including a documentary film) on the complex
relationship between BAPs, ecosystem services and values, and promoted reflective learning amongst
participants. Participants were also given choice tasks before and after the provision of this
information to assess the impact of information provision on their preferences.
Step 2: An Ecological Weighting Matrix – an experimental technique to allow the pooling of expert
judgement and an assessment of the ecosystem services provided by a broad range of habitats. This
was an essential innovation to bridge the gap in primary evidence linking our investments in habitats
to changes in ecosystem services. Experts were asked to identify the relative levels of ecosystems
services delivered by the habitats they were most familiar with across 19 broad BAP habitats. These
results were then pooled. Importantly, the weighting matrix also asked experts to identify the
proportion of ecosystem services that were directly attributed to BAP conservation activities, a crucial
component to help pinpoint the benefit of BAP expenditure.
Step 3: Combining steps 1 and 2 to value the benefits of the UK BAP. Step 3 combined the data
collected in Steps 1 and 2 to establish the value of the ecosystem services delivered as a direct
consequence of UK BAP conservation activities. This was achieved by multiplying the value
estimated for the various ecosystem services delivered by the BAP habitats (from the choice
experiment in Step 1) with the relative level of ecosystem services delivered by those habitats (from
the weighting matrix in Step 2). Two scenarios were examined:
Current spend scenario: This aimed to estimate the value of the marginal change in the levels
of ecosystems services delivered by the UK BAP habitats at the current level of BAP
provision. The counterfactual was withdrawing BAP funding therefore allowing the condition
of BAP habitats to deteriorate over time.
Increased spend scenario: This aimed to estimate the value of additional ecosystem services
delivered by UK BAP habitats – above and beyond the current spend scenario – where the
BAP is fully implemented. It is assumed that the benefits would be achieved by 2020 and
retained for a further 10 years.
The combined results of steps 1 and 2 can also be used to provide estimates of the benefits of BAP
expenditures at smaller scales e.g. for each of the 12 UK regions; for different aspects of the BAP or
for each of the 19 BAP habitats examined. However, in doing so, the results are necessarily drawn
from smaller samples of the data from the public or expert surveys and therefore the results need to be
used and interpreted carefully.
9
Headline results
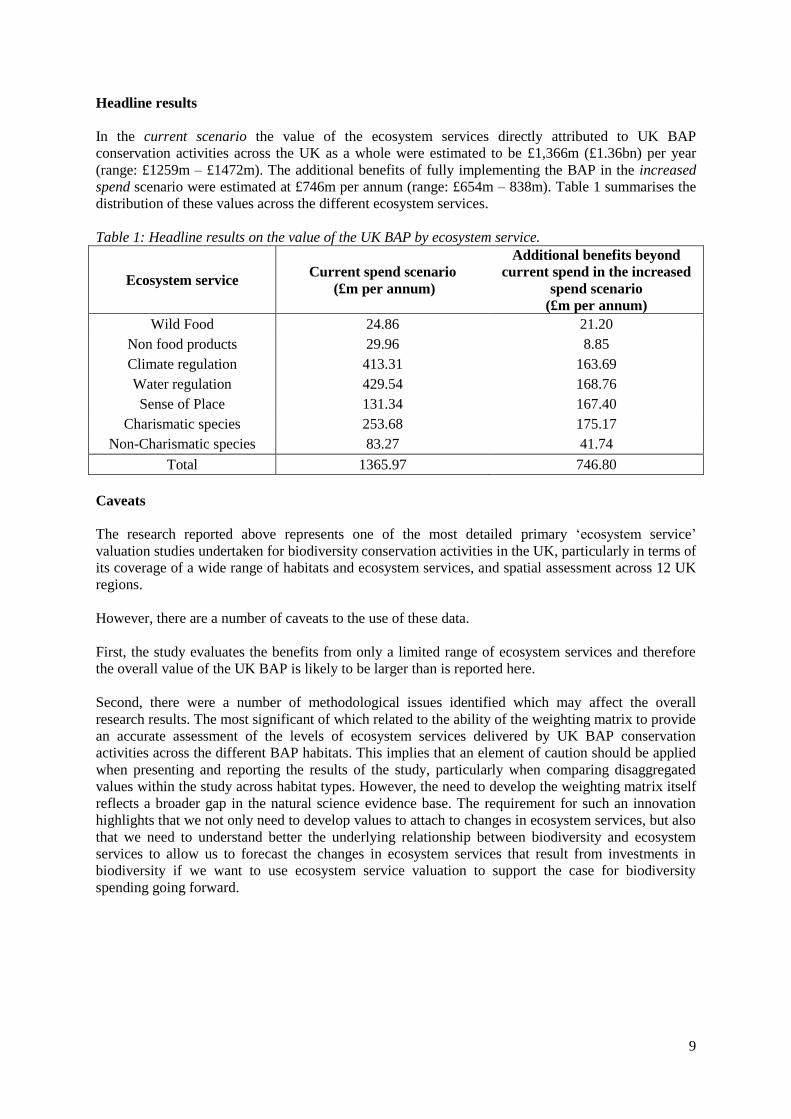
In the current scenario the value of the ecosystem services directly attributed to UK BAP
conservation activities across the UK as a whole were estimated to be £1,366m (£1.36bn) per year
(range: £1259m – £1472m). The additional benefits of fully implementing the BAP in the increased
spend scenario were estimated at £746m per annum (range: £654m – 838m). Table 1 summarises the
distribution of these values across the different ecosystem services.
Table 1: Headline results on the value of the UK BAP by ecosystem service.
Ecosystem service Current spend scenario
(£m per annum)
Additional benefits beyond
current spend in the increased
spend scenario
(£m per annum)
Wild Food 24.86 21.20
Non food products 29.96 8.85
Climate regulation 413.31 163.69
Water regulation 429.54 168.76
Sense of Place 131.34 167.40
Charismatic species 253.68 175.17
Non-Charismatic species 83.27 41.74
Total 1365.97 746.80
Caveats
The research reported above represents one of the most detailed primary ‘ecosystem service’
valuation studies undertaken for biodiversity conservation activities in the UK, particularly in terms of
its coverage of a wide range of habitats and ecosystem services, and spatial assessment across 12 UK
regions.
However, there are a number of caveats to the use of these data.
First, the study evaluates the benefits from only a limited range of ecosystem services and therefore
the overall value of the UK BAP is likely to be larger than is reported here.
Second, there were a number of methodological issues identified which may affect the overall
research results. The most significant of which related to the ability of the weighting matrix to provide
an accurate assessment of the levels of ecosystem services delivered by UK BAP conservation
activities across the different BAP habitats. This implies that an element of caution should be applied
when presenting and reporting the results of the study, particularly when comparing disaggregated
values within the study across habitat types. However, the need to develop the weighting matrix itself
reflects a broader gap in the natural science evidence base. The requirement for such an innovation
highlights that we not only need to develop values to attach to changes in ecosystem services, but also
that we need to understand better the underlying relationship between biodiversity and ecosystem
services to allow us to forecast the changes in ecosystem services that result from investments in
biodiversity if we want to use ecosystem service valuation to support the case for biodiversity
spending going forward.
10
Executive summary This report presents the findings of a study of ‘The Economic Valuation of the Ecosystem Service
Benefits delivered by the UK Biodiversity Action Plan’. The research, commissioned by Defra (and
partners) in 2008, was undertaken by a consortium led by Aberystwyth University.
Research aims and objectives
The aim of the research was to estimate the value of changes in biodiversity and associated ecosystem
services which will result directly from the delivery of the UK Biodiversity Action Plan (UK BAP).
Specific objectives were:
1. To assess the marginal value of ecosystem services associated with the UK BAP;
2. To assess the levels of ecosystem services delivered by different UK BAP habitats;
3. To assess the marginal value of the UK BAP conservation activities: across the UK as a
whole; within different regions of the UK; and across different BAP habitats and species.
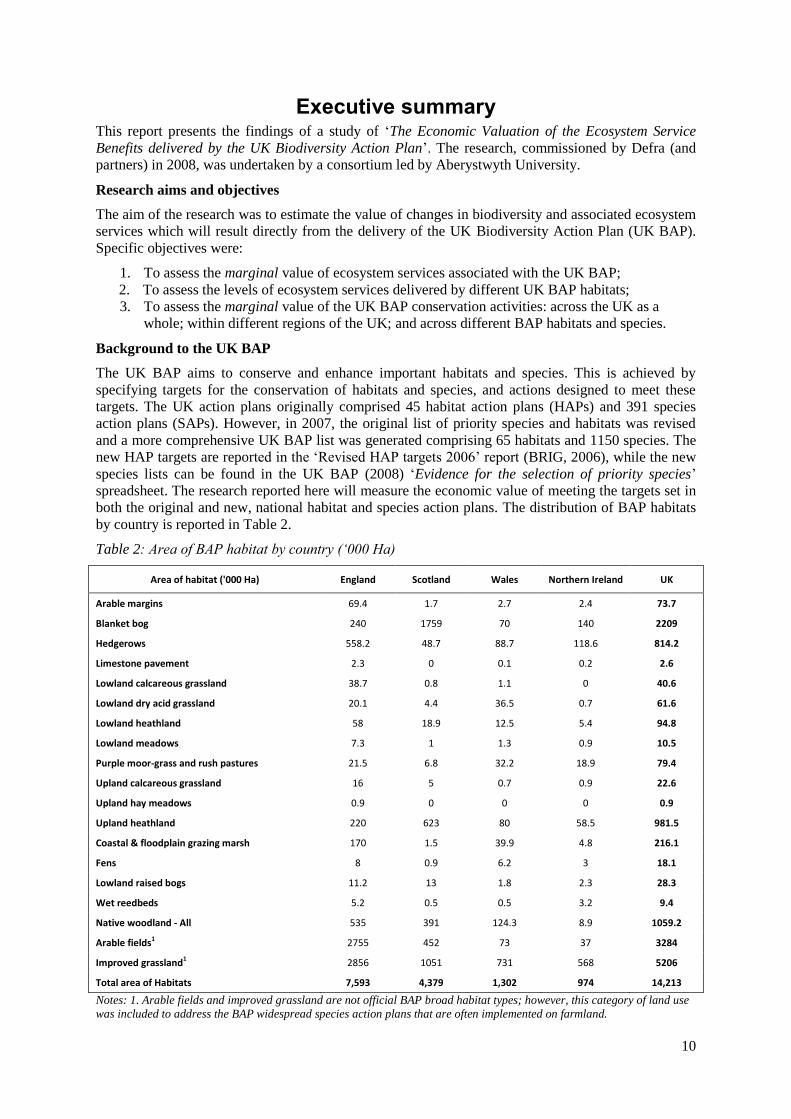
Background to the UK BAP
The UK BAP aims to conserve and enhance important habitats and species. This is achieved by
specifying targets for the conservation of habitats and species, and actions designed to meet these
targets. The UK action plans originally comprised 45 habitat action plans (HAPs) and 391 species
action plans (SAPs). However, in 2007, the original list of priority species and habitats was revised
and a more comprehensive UK BAP list was generated comprising 65 habitats and 1150 species. The
new HAP targets are reported in the ‘Revised HAP targets 2006’ report (BRIG, 2006), while the new
species lists can be found in the UK BAP (2008) ‘Evidence for the selection of priority species’
spreadsheet. The research reported here will measure the economic value of meeting the targets set in
both the original and new, national habitat and species action plans. The distribution of BAP habitats
by country is reported in Table 2.
Table 2: Area of BAP habitat by country (‘000 Ha)
Area of habitat ('000 Ha) England Scotland Wales Northern Ireland UK
Arable margins 69.4 1.7 2.7 2.4 73.7
Blanket bog 240 1759 70 140 2209
Hedgerows 558.2 48.7 88.7 118.6 814.2
Limestone pavement 2.3 0 0.1 0.2 2.6
Lowland calcareous grassland 38.7 0.8 1.1 0 40.6
Lowland dry acid grassland 20.1 4.4 36.5 0.7 61.6
Lowland heathland 58 18.9 12.5 5.4 94.8
Lowland meadows 7.3 1 1.3 0.9 10.5
Purple moor-grass and rush pastures 21.5 6.8 32.2 18.9 79.4
Upland calcareous grassland 16 5 0.7 0.9 22.6
Upland hay meadows 0.9 0 0 0 0.9
Upland heathland 220 623 80 58.5 981.5
Coastal & floodplain grazing marsh 170 1.5 39.9 4.8 216.1
Fens 8 0.9 6.2 3 18.1
Lowland raised bogs 11.2 13 1.8 2.3 28.3
Wet reedbeds 5.2 0.5 0.5 3.2 9.4
Native woodland - All 535 391 124.3 8.9 1059.2
Arable fields1 2755 452 73 37 3284
Improved grassland1 2856 1051 731 568 5206
Total area of Habitats 7,593 4,379 1,302 974 14,213
Notes: 1. Arable fields and improved grassland are not official BAP broad habitat types; however, this category of land use
was included to address the BAP widespread species action plans that are often implemented on farmland.
11
Research approach
The approach used to address these aims involved 3 Steps:
Step 1: The choice experiment.
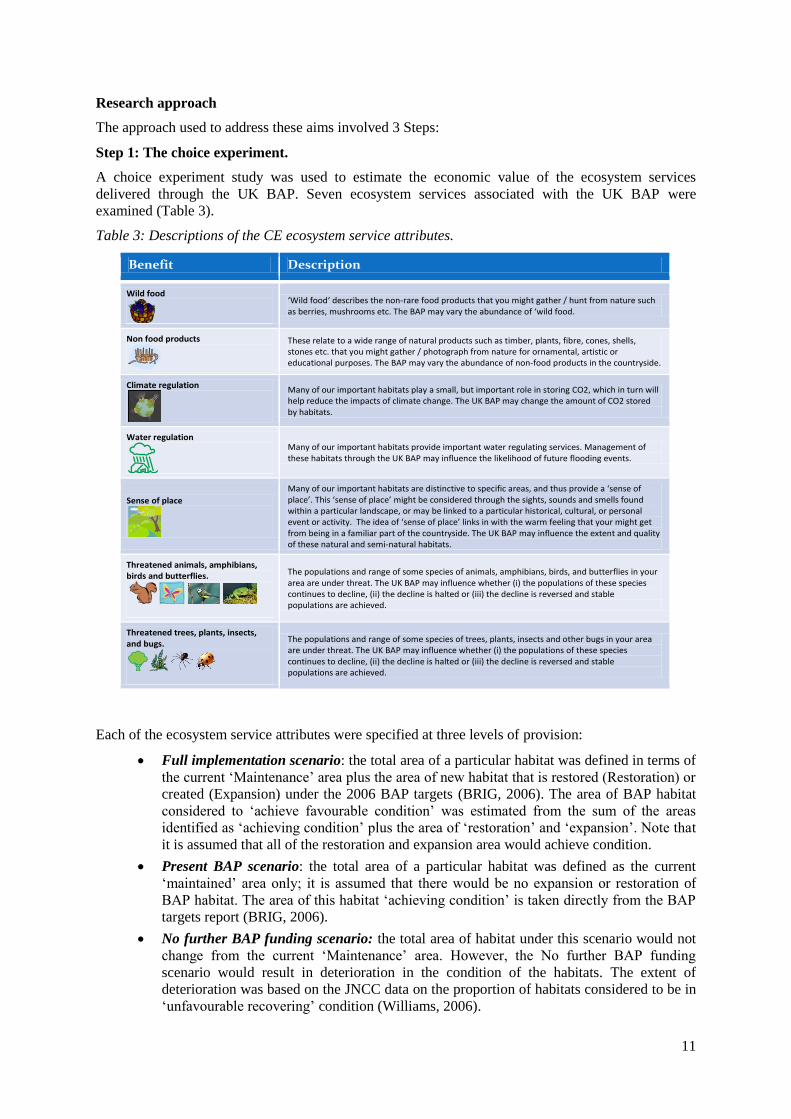
A choice experiment study was used to estimate the economic value of the ecosystem services
delivered through the UK BAP. Seven ecosystem services associated with the UK BAP were
examined (Table 3).
Table 3: Descriptions of the CE ecosystem service attributes.
Each of the ecosystem service attributes were specified at three levels of provision:
Full implementation scenario: the total area of a particular habitat was defined in terms of
the current ‘Maintenance’ area plus the area of new habitat that is restored (Restoration) or
created (Expansion) under the 2006 BAP targets (BRIG, 2006). The area of BAP habitat
considered to ‘achieve favourable condition’ was estimated from the sum of the areas
identified as ‘achieving condition’ plus the area of ‘restoration’ and ‘expansion’. Note that
it is assumed that all of the restoration and expansion area would achieve condition.
Present BAP scenario: the total area of a particular habitat was defined as the current
‘maintained’ area only; it is assumed that there would be no expansion or restoration of
BAP habitat. The area of this habitat ‘achieving condition’ is taken directly from the BAP
targets report (BRIG, 2006).
No further BAP funding scenario: the total area of habitat under this scenario would not
change from the current ‘Maintenance’ area. However, the No further BAP funding
scenario would result in deterioration in the condition of the habitats. The extent of
deterioration was based on the JNCC data on the proportion of habitats considered to be in
‘unfavourable recovering’ condition (Williams, 2006).
Benefit Description
Wild food
‘Wild food‘ describes the non-rare food products that you might gather / hunt from nature such as berries, mushrooms etc. The BAP may vary the abundance of ‘wild food.
Non food products
These relate to a wide range of natural products such as timber, plants, fibre, cones, shells, stones etc. that you might gather / photograph from nature for ornamental, artistic or educational purposes. The BAP may vary the abundance of non-food products in the countryside.
Climate regulation
Many of our important habitats play a small, but important role in storing CO2, which in turn will help reduce the impacts of climate change. The UK BAP may change the amount of CO2 stored by habitats.
Water regulation
Many of our important habitats provide important water regulating services. Management of these habitats through the UK BAP may influence the likelihood of future flooding events.
Sense of place
Many of our important habitats are distinctive to specific areas, and thus provide a ‘sense of place’. This ‘sense of place’ might be considered through the sights, sounds and smells found within a particular landscape, or may be linked to a particular historical, cultural, or personal event or activity. The idea of ‘sense of place’ links in with the warm feeling that your might get from being in a familiar part of the countryside. The UK BAP may influence the extent and quality of these natural and semi-natural habitats.
Threatened animals, amphibians, birds and butterflies.
The populations and range of some species of animals, amphibians, birds, and butterflies in your area are under threat. The UK BAP may influence whether (i) the populations of these species continues to decline, (ii) the decline is halted or (iii) the decline is reversed and stable populations are achieved.
Threatened trees, plants, insects, and bugs.
The populations and range of some species of trees, plants, insects and other bugs in your area are under threat. The UK BAP may influence whether (i) the populations of these species continues to decline, (ii) the decline is halted or (iii) the decline is reversed and stable populations are achieved.
12
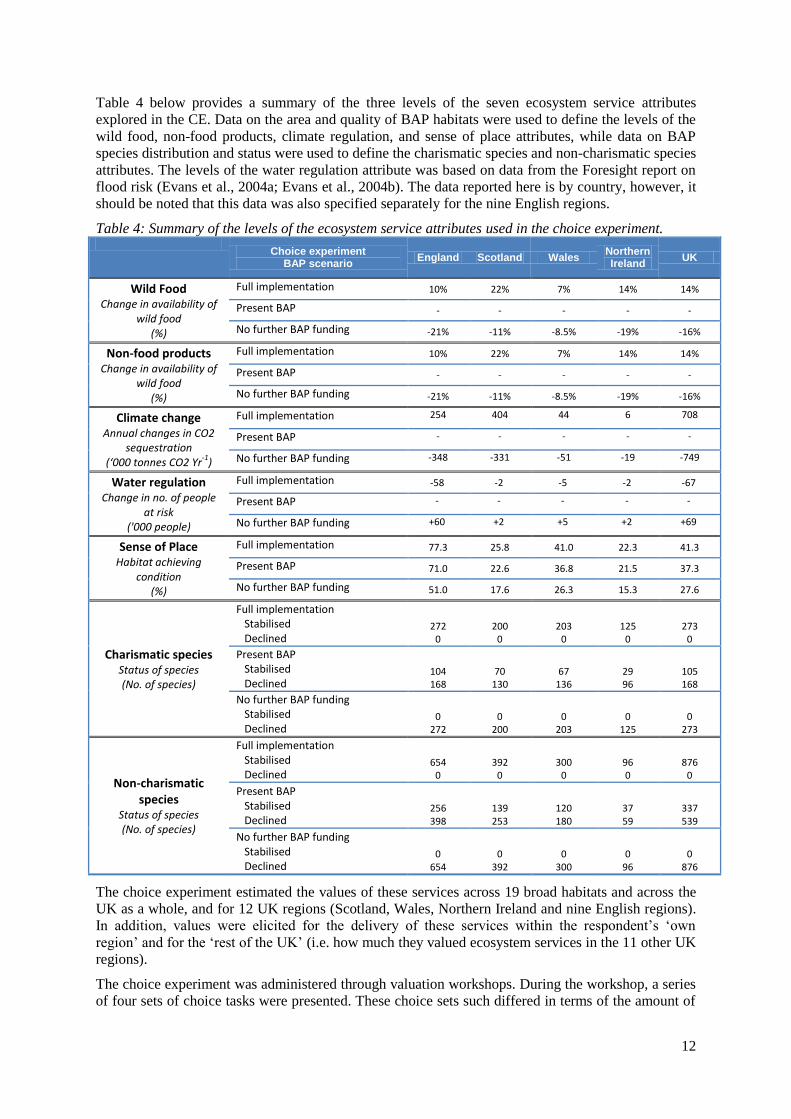
Table 4 below provides a summary of the three levels of the seven ecosystem service attributes
explored in the CE. Data on the area and quality of BAP habitats were used to define the levels of the
wild food, non-food products, climate regulation, and sense of place attributes, while data on BAP
species distribution and status were used to define the charismatic species and non-charismatic species
attributes. The levels of the water regulation attribute was based on data from the Foresight report on
flood risk (Evans et al., 2004a; Evans et al., 2004b). The data reported here is by country, however, it
should be noted that this data was also specified separately for the nine English regions.
Table 4: Summary of the levels of the ecosystem service attributes used in the choice experiment.
Choice experiment BAP scenario
England Scotland Wales Northern Ireland
UK
Wild Food Change in availability of
wild food (%)
Full implementation 10% 22% 7% 14% 14%
Present BAP - - - - -
No further BAP funding -21% -11% -8.5% -19% -16%
Non-food products Change in availability of
wild food (%)
Full implementation 10% 22% 7% 14% 14%
Present BAP - - - - -
No further BAP funding -21% -11% -8.5% -19% -16%
Climate change Annual changes in CO2
sequestration (‘000 tonnes CO2 Yr
-1)
Full implementation 254 404 44 6 708
Present BAP - - - - -
No further BAP funding -348 -331 -51 -19 -749
Water regulation Change in no. of people
at risk ('000 people)
Full implementation -58 -2 -5 -2 -67
Present BAP - - - - -
No further BAP funding +60 +2 +5 +2 +69
Sense of Place Habitat achieving
condition (%)
Full implementation 77.3 25.8 41.0 22.3 41.3
Present BAP 71.0 22.6 36.8 21.5 37.3
No further BAP funding 51.0 17.6 26.3 15.3 27.6
Charismatic species Status of species (No. of species)
Full implementation Stabilised Declined
272 0
200 0
203 0
125 0
273 0
Present BAP Stabilised Declined
104 168
70 130
67 136
29 96
105 168
No further BAP funding Stabilised Declined
0 272
0 200
0 203
0 125
0 273
Non-charismatic species
Status of species (No. of species)
Full implementation Stabilised Declined
654 0
392 0
300 0
96 0
876 0
Present BAP Stabilised Declined
256 398
139 253
120 180
37 59
337 539
No further BAP funding Stabilised Declined
0 654
0 392
0 300
0 96
0 876
The choice experiment estimated the values of these services across 19 broad habitats and across the
UK as a whole, and for 12 UK regions (Scotland, Wales, Northern Ireland and nine English regions).
In addition, values were elicited for the delivery of these services within the respondent’s ‘own
region’ and for the ‘rest of the UK’ (i.e. how much they valued ecosystem services in the 11 other UK
regions).
The choice experiment was administered through valuation workshops. During the workshop, a series
of four sets of choice tasks were presented. These choice sets such differed in terms of the amount of
13
information given to respondents and the amount of time they had to reflect on the information. The
format of the workshops was as follows.
Short questionnaire on participant’s understanding of BAPs / Ecosystem services;
‘Standard’ choice experiment task on value of ecosystem services delivered by the UK BAP
within respondent’s ‘own region’ (Choice set A);
Detailed presentation on and discussion of the UK BAP and associated ecosystem services
(including two films);
‘Informed’ choice experiment task on value of ecosystem services delivered by the UK
BAP within respondent’s ‘own region’ (Choice Task B);
‘Informed’ choice experiment task on value of ecosystem services delivered by the UK BAP
outside the respondent’s own region, i.e. ‘rest of UK’ (Choice Task C);
Questionnaire on socio-economic characteristics and learning;
Follow-up questionnaire. Respondents were asked to complete another ‘reflective’ choice
experiment on value of ecosystem services delivered by the UK BAP within respondent’s
‘own region’, administered at least one month after the workshop (Choice Task D).
Innovative aspects of the choice experiment include the use of participatory valuation workshops
which provided more time for the provision of information on the complex relationship between
BAPs, ecosystem services and values, and promoted reflective learning amongst participants. Other
innovative aspects include the use of a documentary film within the information pack.
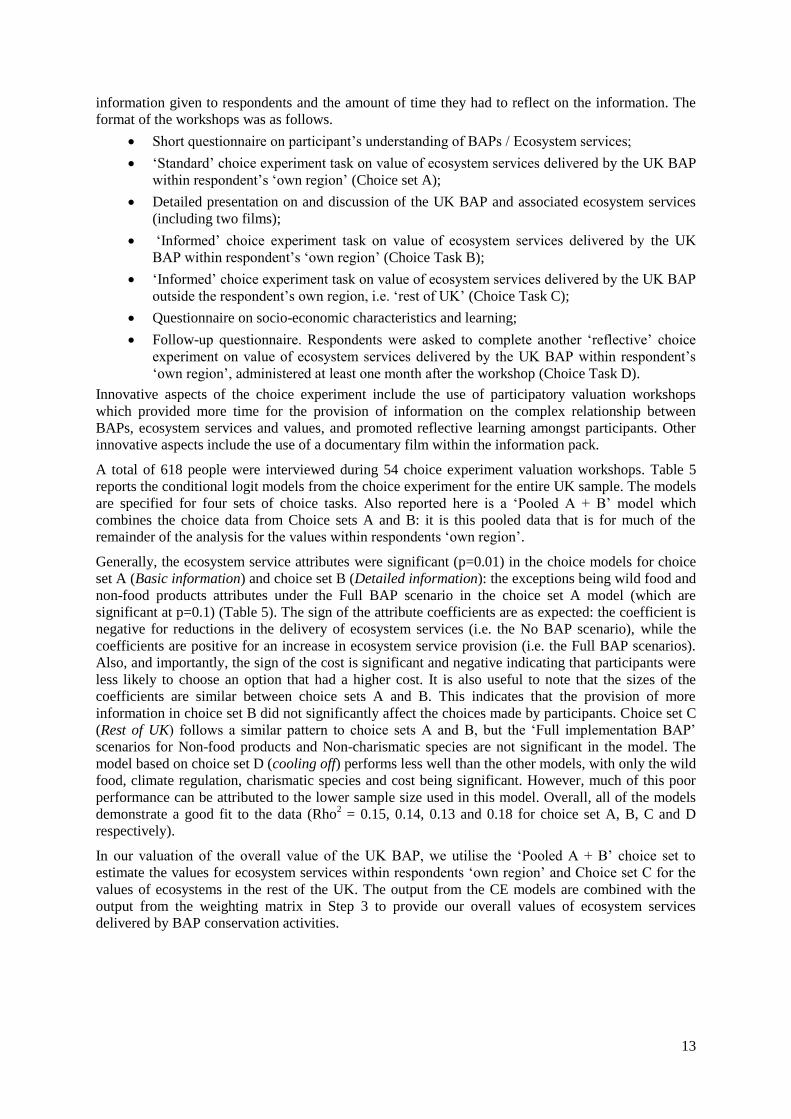
A total of 618 people were interviewed during 54 choice experiment valuation workshops. Table 5
reports the conditional logit models from the choice experiment for the entire UK sample. The models
are specified for four sets of choice tasks. Also reported here is a ‘Pooled A + B’ model which
combines the choice data from Choice sets A and B: it is this pooled data that is for much of the
remainder of the analysis for the values within respondents ‘own region’.
Generally, the ecosystem service attributes were significant (p=0.01) in the choice models for choice
set A (Basic information) and choice set B (Detailed information): the exceptions being wild food and
non-food products attributes under the Full BAP scenario in the choice set A model (which are
significant at p=0.1) (Table 5). The sign of the attribute coefficients are as expected: the coefficient is
negative for reductions in the delivery of ecosystem services (i.e. the No BAP scenario), while the
coefficients are positive for an increase in ecosystem service provision (i.e. the Full BAP scenarios).
Also, and importantly, the sign of the cost is significant and negative indicating that participants were
less likely to choose an option that had a higher cost. It is also useful to note that the sizes of the
coefficients are similar between choice sets A and B. This indicates that the provision of more
information in choice set B did not significantly affect the choices made by participants. Choice set C
(Rest of UK) follows a similar pattern to choice sets A and B, but the ‘Full implementation BAP’
scenarios for Non-food products and Non-charismatic species are not significant in the model. The
model based on choice set D (cooling off) performs less well than the other models, with only the wild
food, climate regulation, charismatic species and cost being significant. However, much of this poor
performance can be attributed to the lower sample size used in this model. Overall, all of the models
demonstrate a good fit to the data (Rho2 = 0.15, 0.14, 0.13 and 0.18 for choice set A, B, C and D
respectively).
In our valuation of the overall value of the UK BAP, we utilise the ‘Pooled A + B’ choice set to
estimate the values for ecosystem services within respondents ‘own region’ and Choice set C for the
values of ecosystems in the rest of the UK. The output from the CE models are combined with the
output from the weighting matrix in Step 3 to provide our overall values of ecosystem services
delivered by BAP conservation activities.
14
Table 5: Choice experiment models for ecosystem services delivered by the UK BAP:
Ch
oic
e s
et
A
(Ow
n r
egio
n,
bas
ic in
fo
Ch
oic
e s
et
B
(Ow
n r
egio
n,
full
info
)
Ch
oic
e s
et
C
(Res
t o
f U
K,
full
info
)
Ch
oic
e s
et
D
(Ow
n r
egio
n,
coo
ling
off
)
‘Po
ole
d’ A
+B
Wild food full bap 0.1055* 0.1716*** 0.1858*** 0.546** 0.138***
no bap -0.2094*** -0.2496*** -0.1481*** -0.466*** -0.230***
Non food full bap 0.1423** 0.1859*** 0.0453 -0.066 0.164***
no bap -0.1551*** -0.2176*** -0.2125*** 0.067 -0.190***
Climate regulation full bap 0.3734*** 0.4219*** 0.2523*** 0.352** 0.400***
no bap -0.5362*** -0.5568*** -0.5518*** -0.374** -0.544***
Water regulation full bap 0.3727*** 0.2861*** 0.2774*** 0.284 0.326***
no bap -0.4935*** -0.4512*** -0.5641*** -0.251* -0.470***
Sense of place full bap 0.3782*** 0.3507*** 0.236*** 0.338 0.362***
no bap -0.3283*** -0.3216*** -0.2091*** -0.387** -0.325***
Charismatic
species
full bap 0.5353*** 0.3554*** 0.2671*** 0.541** 0.442***
no bap -0.4978*** -0.4227*** -0.3836*** -0.499*** -0.457***
Non-charismatic
species
full bap 0.1848*** 0.178*** 0.0245 0.325* 0.181***
no bap -0.299*** -0.2452*** -0.089** -0.249 -0.272***
Cost
-0.0043*** -0.004*** -0.0027*** -0.006*** -0.004***
LL choice model
-1612.546 -1710.933 -1811.792 -162.96 -3330.90
LL constants only
-1902.5623 -1998.8489 -2074.5703 -199.21 -3901.46
Chi-square
580.03 575.83 525.56 72.51 1141.11
Rho-sqrd
0.15243 0.14404 0.12667 0.18198 0.146
Rho-sqrd (adj)
0.14954 0.14125 0.12382 0.15169 0.145
Obs
2205 2305 2305 210 4510
No. of participants
441 461 461 46 461
Notes: Asterisk denote level of significance: *** = 0.01; ** = 0.05; * = 0.1
Step 2: The weighting matrix.
Step 2 involved the quantification of the relative levels of ecosystem services delivered through
implementation of the UK BAP. This was undertaken using a ‘weighting matrix’ in which fifty eight
ecological ‘experts’ were asked to identify the levels of ecosystems services delivered by the broad
BAP habitats. The weighting matrix was essentially an MS Excel spreadsheet application that guides
‘experts’ through a series of ‘steps’ to help them to impart their knowledge on the levels of ecosystem
services delivered by different BAP habitats:
Step 1: The experts identified the three BAP habitats that they were most familiar with (from
a list of 19 habitats). These three habitats were then the focus for the remainder of their
exercise.
Steps 2 and 3: Experts were then asked to rate their habitats in terms of the habitat’s
contribution to ecosystem service delivery (a service perspective: Step 2). This was followed
by a second rating exercise which asked the experts to rate the provision of services within
each habitat (a habitats perspective: Step 3).
Step 4: The rating scores from Steps 2 and 3 were then averaged to generate a mean
weighting score for each BAP habitat : ecosystem service relationship. These weighting
scores could range from ‘0’ = no service provision to ‘1’ = full service provision. In Step 4,
15
these mean weighting scores were presented back to the experts for review, and if necessary
the experts were provided with an opportunity to modify any scores that they are unhappy
with.
Step 5: The experts were then asked to consider what impact removing BAP conservation
activities might have on the provision of ecosystem services. This was achieved by measuring
the percentage change in service provision from BAP being in ‘favourable’ condition to
‘unfavourable’ condition.
Step 6: The experts were asked to review their weighting scores from Step 5 and either
modify or confirm these scores.
Step 7: In the final step, the experts are asked to review the WM as a tool and express their
overall level of confidence in their weighting scores.
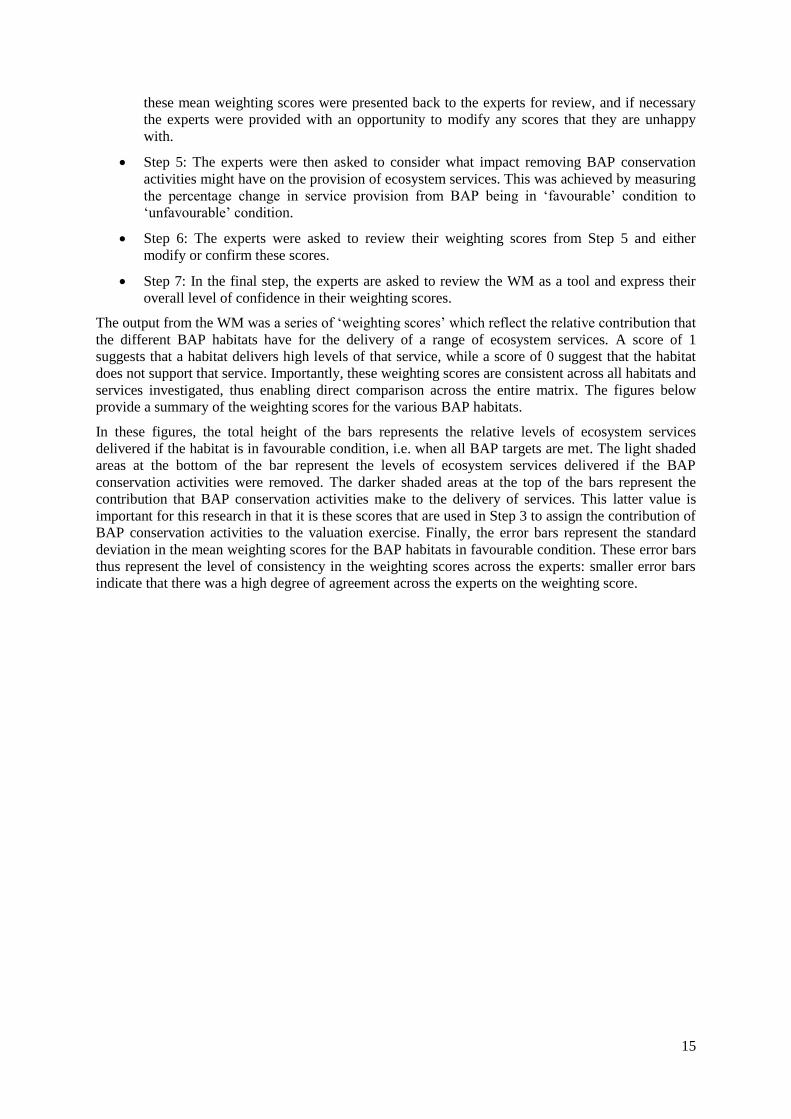
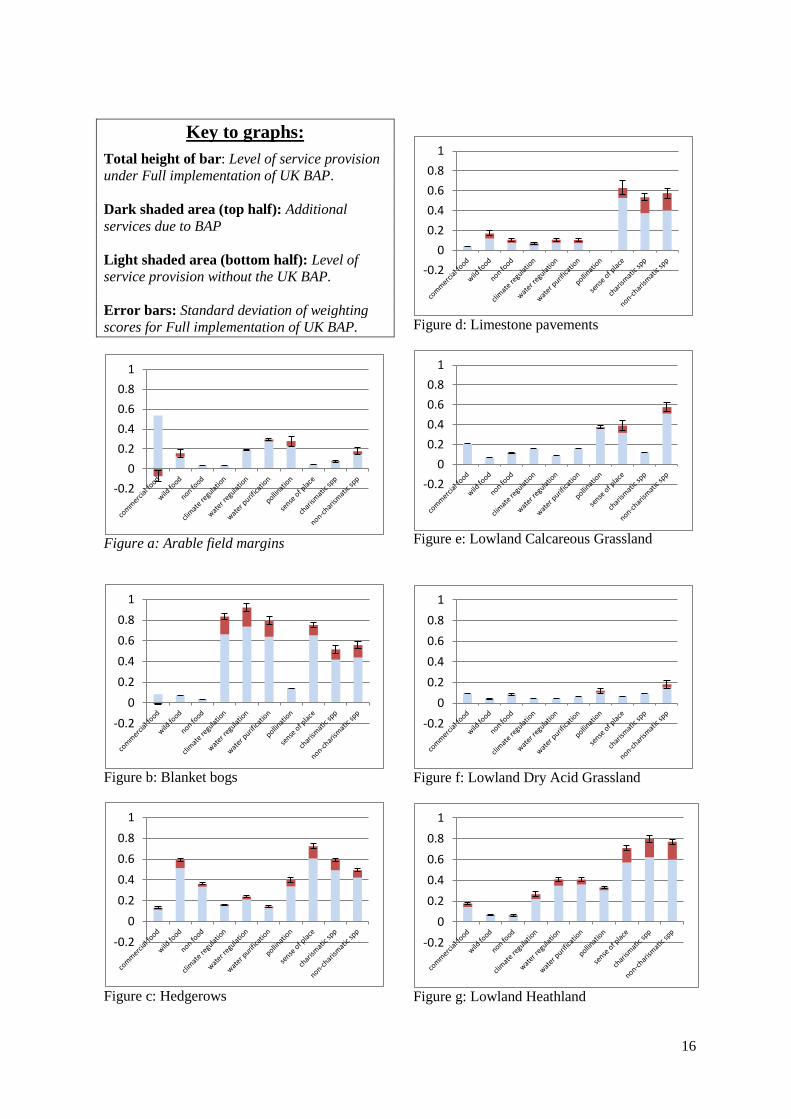
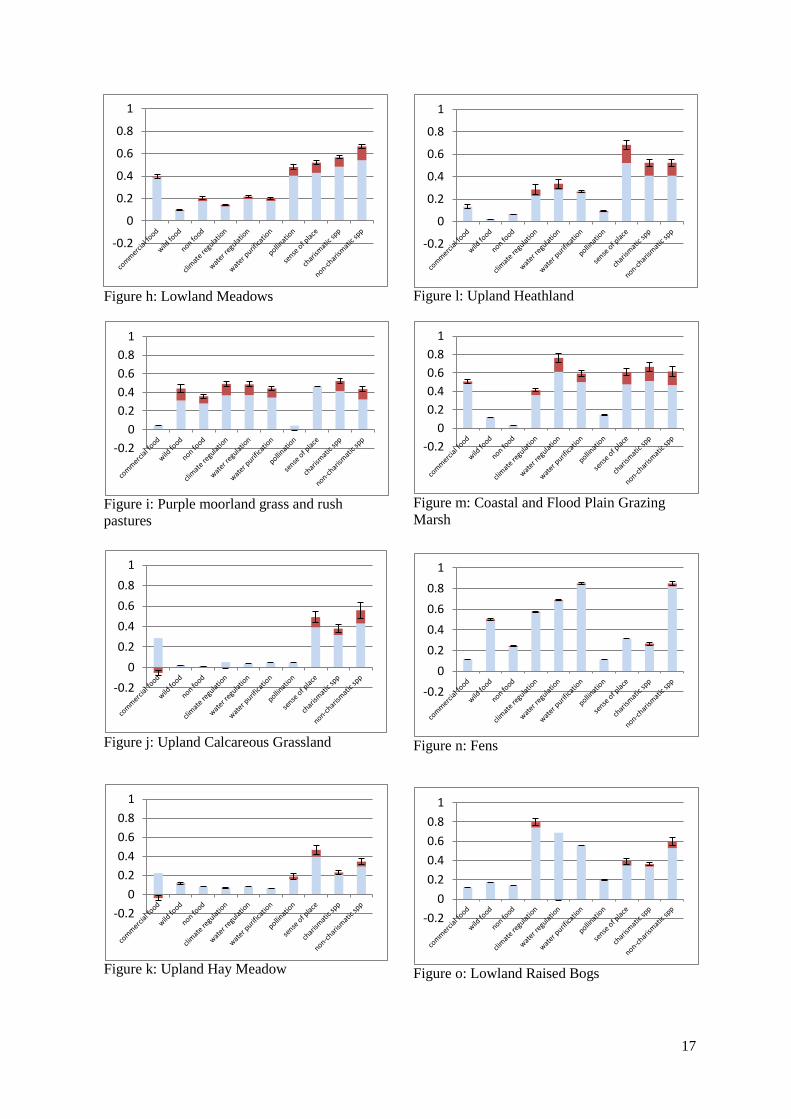
The output from the WM was a series of ‘weighting scores’ which reflect the relative contribution that
the different BAP habitats have for the delivery of a range of ecosystem services. A score of 1
suggests that a habitat delivers high levels of that service, while a score of 0 suggest that the habitat
does not support that service. Importantly, these weighting scores are consistent across all habitats and
services investigated, thus enabling direct comparison across the entire matrix. The figures below
provide a summary of the weighting scores for the various BAP habitats.
In these figures, the total height of the bars represents the relative levels of ecosystem services
delivered if the habitat is in favourable condition, i.e. when all BAP targets are met. The light shaded
areas at the bottom of the bar represent the levels of ecosystem services delivered if the BAP
conservation activities were removed. The darker shaded areas at the top of the bars represent the
contribution that BAP conservation activities make to the delivery of services. This latter value is
important for this research in that it is these scores that are used in Step 3 to assign the contribution of
BAP conservation activities to the valuation exercise. Finally, the error bars represent the standard
deviation in the mean weighting scores for the BAP habitats in favourable condition. These error bars
thus represent the level of consistency in the weighting scores across the experts: smaller error bars
indicate that there was a high degree of agreement across the experts on the weighting score.
16
Key to graphs:
Total height of bar: Level of service provision
under Full implementation of UK BAP.
Dark shaded area (top half): Additional
services due to BAP
Light shaded area (bottom half): Level of
service provision without the UK BAP.
Error bars: Standard deviation of weighting
scores for Full implementation of UK BAP.
Figure a: Arable field margins
Figure b: Blanket bogs
Figure c: Hedgerows
Figure d: Limestone pavements
Figure e: Lowland Calcareous Grassland
Figure f: Lowland Dry Acid Grassland
Figure g: Lowland Heathland
-0.2
0
0.2
0.4
0.6
0.8
1
-0.2
0
0.2
0.4
0.6
0.8
1
-0.2
0
0.2
0.4
0.6
0.8
1
-0.2
0
0.2
0.4
0.6
0.8
1
-0.2
0
0.2
0.4
0.6
0.8
1
-0.2
0
0.2
0.4
0.6
0.8
1
-0.2
0
0.2
0.4
0.6
0.8
1
17
Figure h: Lowland Meadows
Figure i: Purple moorland grass and rush
pastures
Figure j: Upland Calcareous Grassland
Figure k: Upland Hay Meadow
Figure l: Upland Heathland
Figure m: Coastal and Flood Plain Grazing
Marsh
Figure n: Fens
Figure o: Lowland Raised Bogs
-0.2
0
0.2
0.4
0.6
0.8
1
-0.2
0
0.2
0.4
0.6
0.8
1
-0.2
0
0.2
0.4
0.6
0.8
1
-0.2
0
0.2
0.4
0.6
0.8
1
-0.2
0
0.2
0.4
0.6
0.8
1
-0.2
0
0.2
0.4
0.6
0.8
1
-0.2
0
0.2
0.4
0.6
0.8
1
-0.2
0
0.2
0.4
0.6
0.8
1
18
Figure p: Reed Beds
Figure q: Native woodland (All)
Figure r: Arable Fields
Figure s: Improved Grassland
The weighting matrix was designed as a social survey tool for gathering information on the relative
levels of ecosystem services delivered by different UK BAP habitats. The key reasons for choosing
this approach, as opposed to a review of literature, was that: (i) there are currently many gaps and
uncertainty in the literature; and (ii) most of the available literature is unlikely to be specifically
targeted to the context of this research i.e. the UK BAP. Eliciting expert knowledge was also
considered to be a relative efficient approach to addressing these knowledge gaps. Given the above,
we argue that our matrix was appropriate and fit for purpose given the remit of this study.
There were, however, some concerns raised about the validity of the results from the weighting
matrix. To address these concerns, a follow-up meeting was organised in which a group of experts
were asked to review and comment on the weighting scores. Based on the evidence collected within
the matrix and during the expert workshop, we argue that: (i) the experts who completed the matrix
were sufficiently knowledgeable to competently complete the task (although some reviewers argued
that a wider range of experts could have been sampled); (ii) the resultant weighting scores were
generally consistent across the experts; (iii) the standard deviations in the scores generally captured
likely variations in service delivery by a particular habitat; and (iv) that the range of scores across the
different habitats and services generally met expectations.
However, there were more specific concerns regarding some of the weighting scores. In particular,
there was a lack of consistency in the weighting score for the ‘Additional services due to the BAP’.
This finding is of concern since it is these findings that are used in Step 3 to calculate the overall
value of UK BAP conservation activities. However, it was also clear from the discussions held during
the validation meeting that current knowledge on how BAP conservation activities affect the delivery
of ecosystem services is generally poor and that it would be difficult to provide clear evidence on this
without undertaking field experiments (which was out with the scope of this research). Thus, the lack
of consistency found in the weighting matrix for the ‘Additional services due to BAP’ may simply
reflect current gaps and uncertainty in knowledge rather than represent flaws in the methodology.
However, this does have a consequence for the interpretation of our research results.
-0.2
0
0.2
0.4
0.6
0.8
1
-0.2
0
0.2
0.4
0.6
0.8
1
-0.2
0
0.2
0.4
0.6
0.8
1
-0.2
0
0.2
0.4
0.6
0.8
1
19
There were also concerns relating to the weighting scores for the Lowland dry acid grassland, Arable
fields, Arable margins and Upland calcareous grassland habitats. In all cases, the scores for these
habitats were not consistent across experts: it is thought that these inconsistencies were the result of a
low sample size. Based on the above critique, we advise caution for the interpretation and wider use
the weighting scores.
Step 3: Estimation of the value of UK BAP
Step 3 combined the data collected in Steps 1 and 2 to establish the marginal ‘total economic value’ of
the ecosystem services delivery as a direct consequence of UK BAP conservation activities. This was
achieved by multiplying the value estimated for an ecosystem service delivered by BAP habitats
(from the choice experiment in Step 1) with the weighting scores for the relative level of ecosystem
services delivered by those habitats (from the weighting matrix in Step 2). Two policy relevant
scenarios were examined in this valuation:
Increased spend scenario: In this scenario, we were interested in estimating the value of the
marginal change in the levels of ecosystem services delivered by UK BAP habitats from the
current situation to the situation where the UK BAP is fully implemented. This scenario may
be used to justify (or not) increasing expenditures on the UK BAP;
Current spend scenario: In this scenario, we were interested in estimating the value of the
marginal change in the levels of ecosystems services delivered by the UK BAP habitats from
the current situation to the situation of no further funding of the UK BAP (i.e. the condition of
the BAP would deteriorate over time). This scenario may therefore be used to justify (or not)
the continuation of existing expenditures on the UK BAP.
In Step 3, we estimated the economic value of these two scenarios for: the UK BAP in its entirety; for
each of the 12 UK regions; for each of the 19 BAP habitats examined; and for the UK BAP Habitats
Action Plans (HAPs), the widespread Species Action Plans (wSAPs); and for the individual Species
Action Plans (sSAPs).
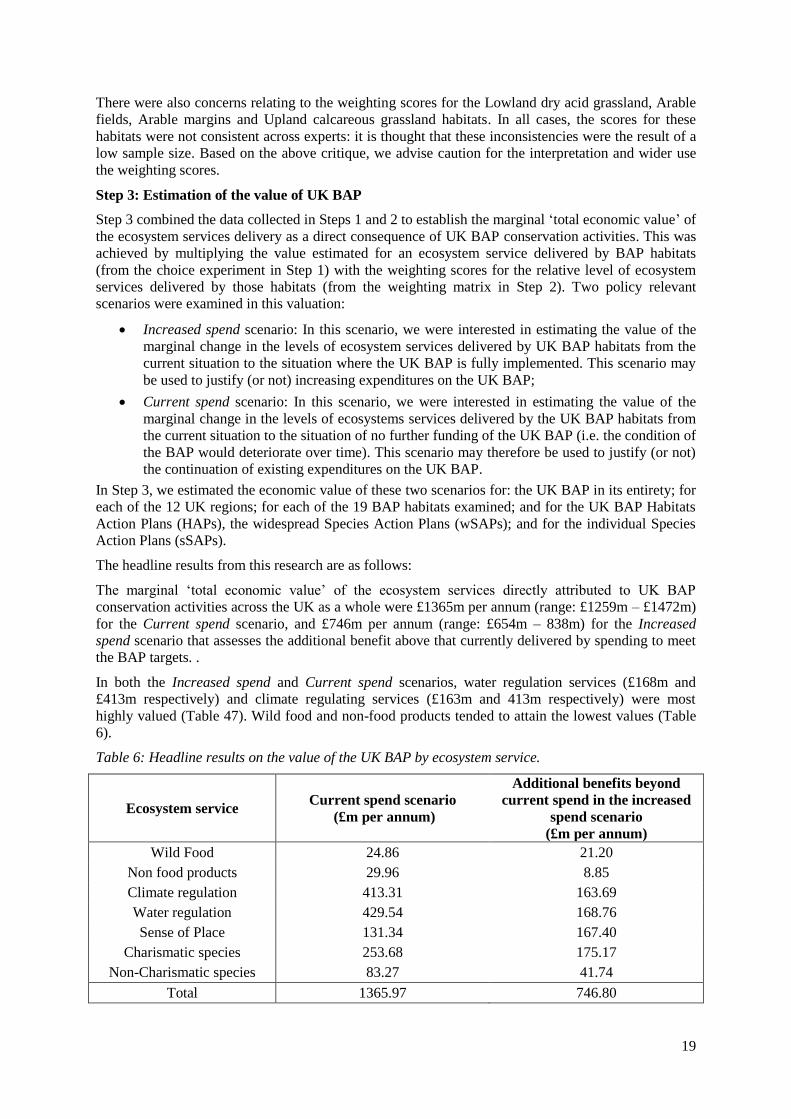
The headline results from this research are as follows:
The marginal ‘total economic value’ of the ecosystem services directly attributed to UK BAP
conservation activities across the UK as a whole were £1365m per annum (range: £1259m – £1472m)
for the Current spend scenario, and £746m per annum (range: £654m – 838m) for the Increased
spend scenario that assesses the additional benefit above that currently delivered by spending to meet
the BAP targets. .
In both the Increased spend and Current spend scenarios, water regulation services (£168m and
£413m respectively) and climate regulating services (£163m and 413m respectively) were most
highly valued (Table 47). Wild food and non-food products tended to attain the lowest values (Table
6).
Table 6: Headline results on the value of the UK BAP by ecosystem service.
Ecosystem service Current spend scenario
(£m per annum)
Additional benefits beyond
current spend in the increased
spend scenario
(£m per annum)
Wild Food 24.86 21.20
Non food products 29.96 8.85
Climate regulation 413.31 163.69
Water regulation 429.54 168.76
Sense of Place 131.34 167.40
Charismatic species 253.68 175.17
Non-Charismatic species 83.27 41.74
Total 1365.97 746.80
20
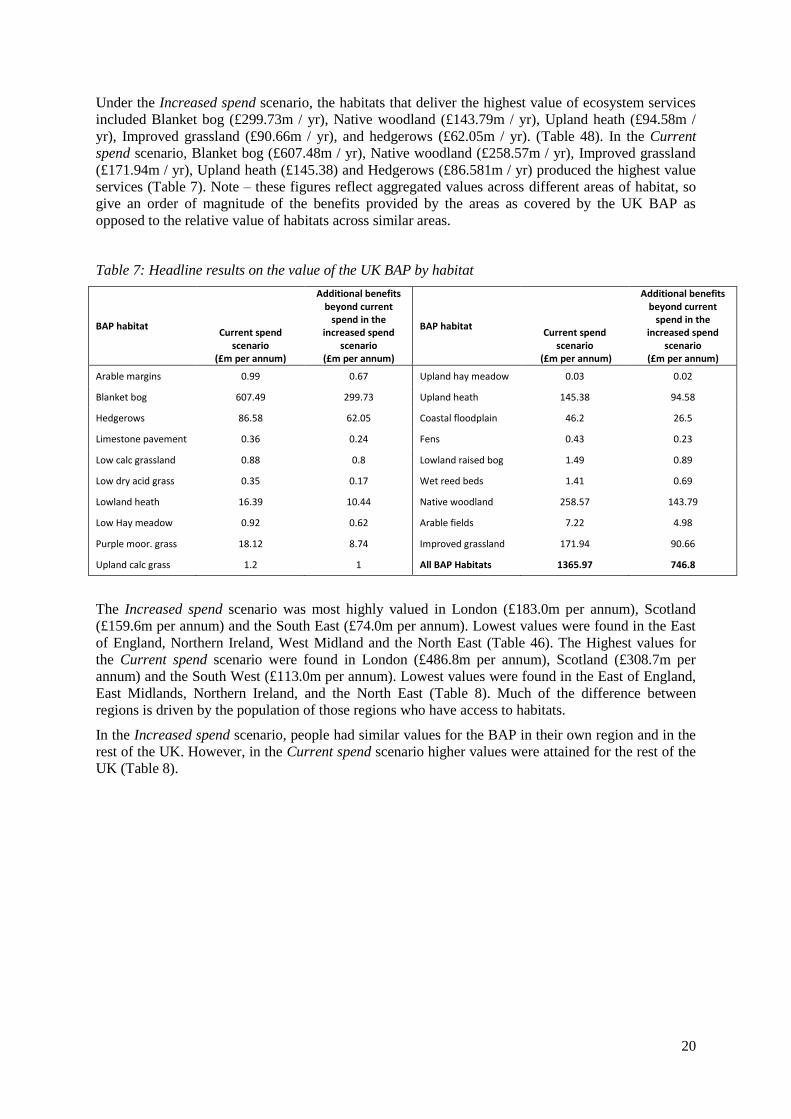
Under the Increased spend scenario, the habitats that deliver the highest value of ecosystem services
included Blanket bog (£299.73m / yr), Native woodland (£143.79m / yr), Upland heath (£94.58m /
yr), Improved grassland (£90.66m / yr), and hedgerows (£62.05m / yr). (Table 48). In the Current
spend scenario, Blanket bog (£607.48m / yr), Native woodland (£258.57m / yr), Improved grassland
(£171.94m / yr), Upland heath (£145.38) and Hedgerows (£86.581m / yr) produced the highest value
services (Table 7). Note – these figures reflect aggregated values across different areas of habitat, so
give an order of magnitude of the benefits provided by the areas as covered by the UK BAP as
opposed to the relative value of habitats across similar areas.
Table 7: Headline results on the value of the UK BAP by habitat
BAP habitat Current spend
scenario (£m per annum)
Additional benefits beyond current
spend in the increased spend
scenario (£m per annum)
BAP habitat Current spend
scenario (£m per annum)
Additional benefits beyond current
spend in the increased spend
scenario (£m per annum)
Arable margins 0.99 0.67 Upland hay meadow 0.03 0.02
Blanket bog 607.49 299.73 Upland heath 145.38 94.58
Hedgerows 86.58 62.05 Coastal floodplain 46.2 26.5
Limestone pavement 0.36 0.24 Fens 0.43 0.23
Low calc grassland 0.88 0.8 Lowland raised bog 1.49 0.89
Low dry acid grass 0.35 0.17 Wet reed beds 1.41 0.69
Lowland heath 16.39 10.44 Native woodland 258.57 143.79
Low Hay meadow 0.92 0.62 Arable fields 7.22 4.98
Purple moor. grass 18.12 8.74 Improved grassland 171.94 90.66
Upland calc grass 1.2 1 All BAP Habitats 1365.97 746.8
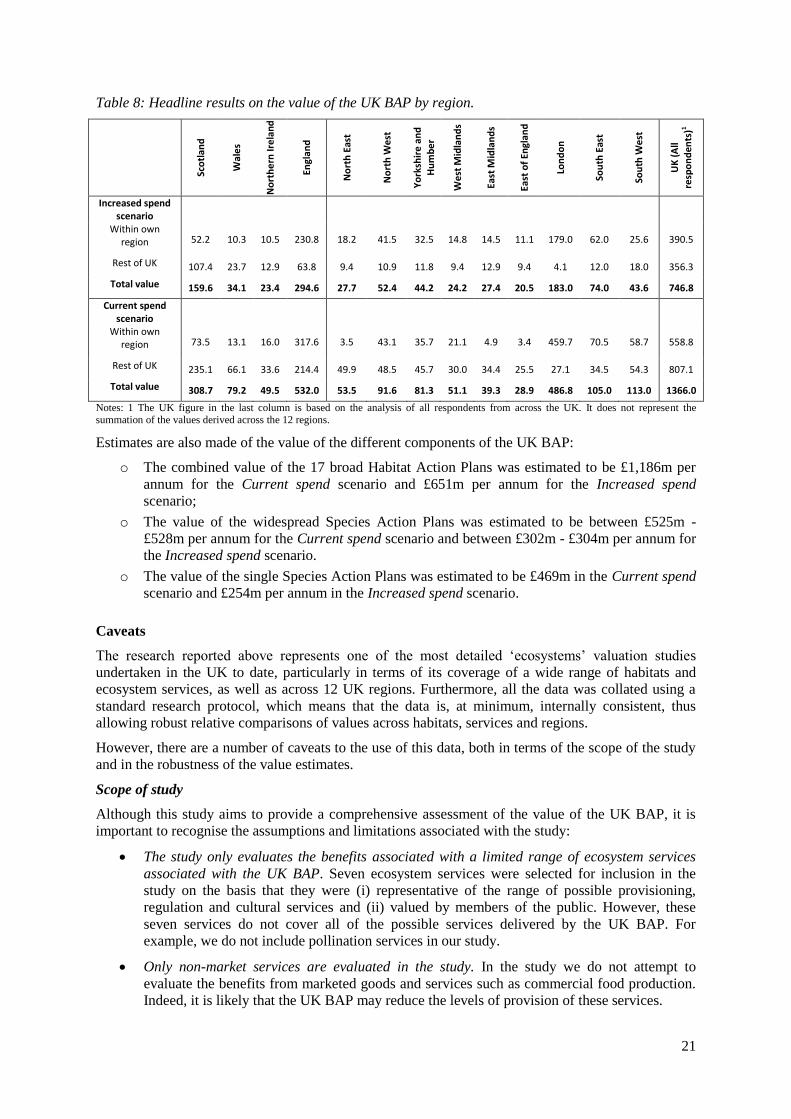
The Increased spend scenario was most highly valued in London (£183.0m per annum), Scotland
(£159.6m per annum) and the South East (£74.0m per annum). Lowest values were found in the East
of England, Northern Ireland, West Midland and the North East (Table 46). The Highest values for
the Current spend scenario were found in London (£486.8m per annum), Scotland (£308.7m per
annum) and the South West (£113.0m per annum). Lowest values were found in the East of England,
East Midlands, Northern Ireland, and the North East (Table 8). Much of the difference between
regions is driven by the population of those regions who have access to habitats.
In the Increased spend scenario, people had similar values for the BAP in their own region and in the
rest of the UK. However, in the Current spend scenario higher values were attained for the rest of the
UK (Table 8).
21
Table 8: Headline results on the value of the UK BAP by region.
Sco
tlan
d
Wal
es
No
rth
ern
Ire
lan
d
Engl
and
No
rth
Eas
t
No
rth
We
st
Yo
rksh
ire
an
d
Hu
mb
er
We
st M
idla
nd
s
East
Mid
lan
ds
East
of
Engl
and
Lon
do
n
Sou
th E
ast
Sou
th W
est
UK
(A
ll re
spo
nd
ents
)1
Increased spend scenario
Within own region 52.2 10.3 10.5 230.8 18.2 41.5 32.5 14.8 14.5 11.1 179.0 62.0 25.6 390.5
Rest of UK 107.4 23.7 12.9 63.8 9.4 10.9 11.8 9.4 12.9 9.4 4.1 12.0 18.0 356.3
Total value 159.6 34.1 23.4 294.6 27.7 52.4 44.2 24.2 27.4 20.5 183.0 74.0 43.6 746.8
Current spend scenario
Within own region 73.5 13.1 16.0 317.6 3.5 43.1 35.7 21.1 4.9 3.4 459.7 70.5 58.7 558.8
Rest of UK 235.1 66.1 33.6 214.4 49.9 48.5 45.7 30.0 34.4 25.5 27.1 34.5 54.3 807.1
Total value 308.7 79.2 49.5 532.0 53.5 91.6 81.3 51.1 39.3 28.9 486.8 105.0 113.0 1366.0
Notes: 1 The UK figure in the last column is based on the analysis of all respondents from across the UK. It does not represent the summation of the values derived across the 12 regions.
Estimates are also made of the value of the different components of the UK BAP:
o The combined value of the 17 broad Habitat Action Plans was estimated to be £1,186m per
annum for the Current spend scenario and £651m per annum for the Increased spend
scenario;
o The value of the widespread Species Action Plans was estimated to be between £525m -
£528m per annum for the Current spend scenario and between £302m - £304m per annum for
the Increased spend scenario.
o The value of the single Species Action Plans was estimated to be £469m in the Current spend
scenario and £254m per annum in the Increased spend scenario.
Caveats
The research reported above represents one of the most detailed ‘ecosystems’ valuation studies
undertaken in the UK to date, particularly in terms of its coverage of a wide range of habitats and
ecosystem services, as well as across 12 UK regions. Furthermore, all the data was collated using a
standard research protocol, which means that the data is, at minimum, internally consistent, thus
allowing robust relative comparisons of values across habitats, services and regions.
However, there are a number of caveats to the use of this data, both in terms of the scope of the study
and in the robustness of the value estimates.
Scope of study
Although this study aims to provide a comprehensive assessment of the value of the UK BAP, it is
important to recognise the assumptions and limitations associated with the study:
The study only evaluates the benefits associated with a limited range of ecosystem services
associated with the UK BAP. Seven ecosystem services were selected for inclusion in the
study on the basis that they were (i) representative of the range of possible provisioning,
regulation and cultural services and (ii) valued by members of the public. However, these
seven services do not cover all of the possible services delivered by the UK BAP. For
example, we do not include pollination services in our study.
Only non-market services are evaluated in the study. In the study we do not attempt to
evaluate the benefits from marketed goods and services such as commercial food production.
Indeed, it is likely that the UK BAP may reduce the levels of provision of these services.
22
Our study is based on public valuations of ecosystem services. In other words, our study is
solely based on the values derived from an empirical choice experiment that was administered
specifically for this study. We do not attempt to utilise value transfer to feed in value
estimates from other studies or utilise other market-based values for services, e.g. we do not
utilise the shadow price of carbon to evaluate climate regulation services.
Robustness of value estimates.
In this study we aimed to develop a research protocol that would generate robust value estimates.
Although we believed that we were largely successful in this, there are a number of outstanding issues
that affect the robustness of the results and therefore are highlighted again here.
In the choice experiment, valuation data was collected at the UK level and across 12 UK regions.
Generally, the data from the UK sample was found to be robust (the only ecosystem services that was
found to be insignificant in the CE models was the non-charismatic species attribute in the ‘rest of the
UK’ scenario). However, in the regional model (where the sample size was smaller), many of the
ecosystem service attributes were insignificant in the CE models. The consequence of which was that
we were unable to attain values for these services and therefore the regional values are likely to be
under-estimates of the true value of delivered services. We therefore advise the reader caution in the
interpretation of the regional models. Most of the results presented in this report are based on the UK
sample and therefore are generally robust.
In the weighting matrix, some concerns were raised in terms of the robustness of some of the habitat /
ecosystem services ‘weighting scores’. In particular, some of the grassland and arable habitats only
received a limited number of responses and therefore may be open to question. Also, it should be
stressed that the weighting scores represent a somewhat simplistic measure of the impact of the UK
BAP on the delivery of services, and therefore we advise caution in the use and interpretation of our
weighting scores. However, the weighting matrix was a response to a lack of primary data on the on
the ecosystem services delivered by different habitats, so whilst it was not perfect it did allow
estimates to be made of the benefit of the BAP using an ecosystem approach. As our knowledge of the
link between biodiversity and ecosystems services improves this issue will diminish, but it highlights
the need to consider not just the needs in terms of the end point of economic valuation, but also of the
biophysical changes that underpin this.
23
1. Introduction
In January 2008, a consortium led by Aberystwyth University successfully secured a Defra (and
partners) funded research project on ‘Economic Valuation of the Benefits of the UK Biodiversity
Action Plan’.
The overall aim of the research is to estimate the value of changes in biodiversity and associated
ecosystem services which will result from the delivery of the UK Biodiversity Action Plan (UK BAP)
by 2010. Specific objectives include:
1. To assess the marginal value of ecosystem services associated with the UK BAP;
2. To assess the levels of ecosystem services delivered by different UK BAP habitats;
3. To assess the marginal value of the UK BAP conservation activities:
a. across the UK as a whole;
b. within different regions of the UK;
c. across different BAP habitats and species.
This report presents the findings from this research.
1.1. Overview of research protocol
The UK Biodiversity Action Plan (UK BAP) was developed in 1994 to implement the government’s
commitment to the Convention on Biological Diversity signed at the Rio Earth Summit in 1992. The
key aim of the UK BAP is to conserve and enhance important habitats and species. The original UK
BAP comprised 45 habitat action plans (HAPs) and 391 species action plans (SAPs). However, this
list was revised in 2007 and the UK BAP now comprises 65 habitats and 1149 species: although it
should be noted that action plans have not yet been developed for the majority of new habitats and
species. This research will utilise an ‘ecosystem approach’ (Defra, 2007) to value the ecosystem
services delivered by the UK BAP. In particular, we will assess the value of ecosystem services
delivered by two policy-relevant funding scenarios:
i. Maintaining current spend on the UK BAP (Current spend scenario), i.e. the value of
ecosystem services associated with achieving the original BAP targets;
ii. Increasing spend to meet the revised BAP targets (Increased spend scenario), i.e. the value of
ecosystem service associated with achieving the revised BAP targets.
Any evaluation of the UK BAP will be challenging.
The UK BAP is complex: it comprises 65 priority habitats and 1150 species. Knowledge of
some of these habitats and species is limited, dispersed and in disparate forms. Action plans
for these habitats and species are implemented at both a national and local level. Further,
information on the extent to which the UK BAP is meeting its stated targets is often limited.
There is also limited knowledge with respect to how the UK BAP (and the individual HAPs
and SAPs) contribute to the delivery of ecosystem services. The Millennium Ecosystem
Assessment (2005) provides a useful framework to examine these linkages between habitat
and service delivery; however scientific knowledge of these linkages is often poor or missing.
A further complication that is relevant to this research relates to knowledge on the extent to
which the conservation activities associated with the UK BAP (or any other conservation
programme) directly impacts ecosystem service delivery. In other words, it will be important
to disentangle those ecosystem services that are delivered (i) as a direct result of the UK BAP
conservation activities, and (ii) those residual services that would be delivered by the habitat
in the absence of any UK BAP conservation activity.
Public knowledge of the UK BAP and its associated ecosystem services is generally poor and
therefore valuation protocols that aim to elicit public values of the benefits of the UK BAP
will need to adopt innovative approaches to data collection.
24
To address these (and other) challenges, we have developed an innovative and novel research protocol
to the valuation of the ecosystem services delivered by the UK BAP. The protocol (summarised
below) involves three basic steps.
Step 1. Valuation of the ecosystem services delivered by UK BAP habitats.
Step 1 addresses the first research objective. Here, a choice experiment (CE) was administered to
estimate the economic value of the ecosystem services delivered by UK BAP habitats. Seven
ecosystem services were examined in the CE: Wild food, Non-food products, Climate regulation,
Water regulation, Sense of place, Charismatic species and Non-charismatic species. These services
were broadly based on the ecosystem services identified in the Millennium Ecosystem Assessment
(2005). An additional CE attribute relating to annual increases in taxation was also included as the
monetary attribute. Each of the seven ecosystem service attributes were defined according to three
levels of provision based on three future management scenarios for the UK BAP:
a Full implementation scenario (where all UK BAP targets are achieved leading to an increase
in the provision of ecosystem services);
a Present BAP scenario (the status quo scenario where current levels of ecosystem services
are maintained); and
a No further funding scenario (where there is no further investment in the UK BAP, which
results in a decline in the delivery of ecosystem services).
These three CE scenarios are subsequently used to estimate the marginal economic benefits associated
with two policy-relevant funding options for the future of the UK BAP:
Current spend scenario. This funding scenario may be used to justify (or not) current
expenditures on the UK BAP. The marginal benefits from this funding scenario were
estimated by subtracting the No further funding CE scenario from the Present BAP CE
scenario;
Increased spend scenario. This funding scenario may be used to justify (or not) possible
future increased spend on the UK BAP to meet the revised BAP targets. The marginal
benefits from this funding scenario were estimated by subtracting the Present BAP CE
scenario from the Full implementation BAP CE scenario.
The choice experiment was designed to allow the valuation of the benefits of the UK BAP to be made
for the UK as a whole, for England, Scotland, Wales and Northern Ireland, and for the nine English
regions. In addition, we also explore values for the delivery of these services within the respondent’s
‘own region’ (i.e. the region where the respondent currently lives) and for the ‘rest of the UK’ (all
other regions of the UK excluding the one where the respondent lives). This breakdown of results was
undertaken to allow more accurate aggregation of the results for the UK as a whole and across the
different regions of the UK.
Innovative aspects of the CE include the use of participatory valuation workshops. The employment
of workshops (as opposed to more traditional face to face interviews) was considered important for
this study as they allow more time for the provision of information on the complex relationship
between BAPs, ecosystem services and values, as well as promoting reflective learning. Other
innovative aspects include the use of a documentary film within the information pack. The workshop
was also designed to allow the testing of information effects bias and the impact of constructed
preferences.
Finally, it is important to highlight here that the CE is used to estimate the ecosystem service benefits
delivered by the habitats listed under the UK BAP. Thus, the benefits estimated in the CE include the
additional services that are directly attributable to the UK BAP conservation activities (which are the
ultimate focus of this research) and the residual services that would still be delivered by the habitats in
the absence of any UK BAP conservation activities. The justification for focusing the CE on the
services delivered by BAP habitats is that currently there is too little evidence on the contribution of
conservation activities to the delivery of ecosystem services. We do, however, address this
25
information gap in Step 2 through the ‘weighting matrix’ in which ‘experts’ are asked to assess the
relative contribution of the UK BAP conservation activities to the delivery of ecosystem service. The
benefit estimates derived from the CE should therefore be interpreted as the value of BAP habitats
rather than the value of BAP conservation activities.
Step 2: Quantification of the levels of ecosystem services delivered by the UK BAP
The second step of the research involves the quantification of the relative levels of ecosystem services
delivered by the various BAP habitats. Step 2 thus directly addresses research objective 2. This
assessment was made using a ‘weighting matrix’ in which 58 biodiversity action plan co-ordinators
(‘experts’) were asked to identify the levels of ecosystems services delivered by the different UK BAP
habitats. The output from this exercise was a series of ‘weighting scores’ for each habitat:ecosystem
service combination. In addition, the weighting matrix was also used identify the proportion of
delivered ecosystem services that could be directly attributed to the conservation activities associated
with the UK BAP. In other words, the experts were asked to disaggregate the services that were
directly attributable to the BAP conservation activities from the residual services that would still be
delivered in the absence of the UK BAP. By extracting the knowledge of experts, the weighting
matrix overcomes a number of research challenges. First, it helps to overcome the current gaps in the
scientific literature on the levels of ecosystem services delivered by different habitats. Secondly, it
ensures that the information collated is relevant to the UK BAP context.
Step 3 Estimation of the marginal ‘total economic value’ of the ecosystem services attributable to
the UK BAP.
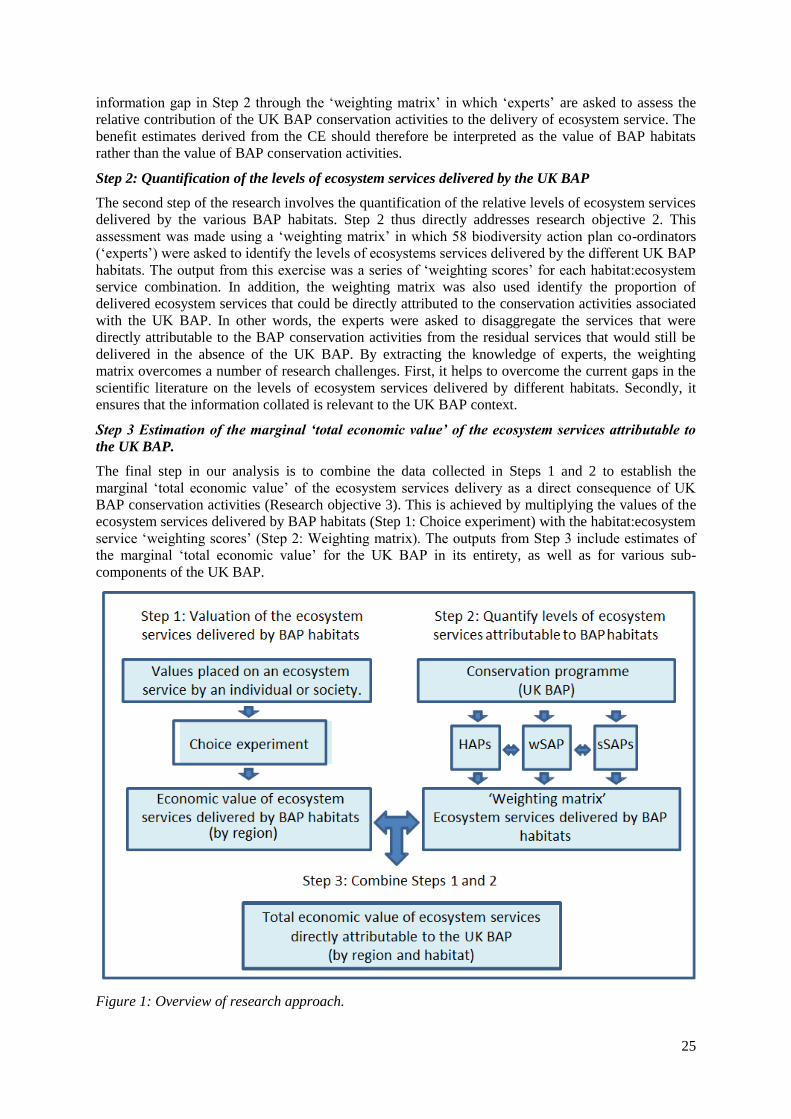
The final step in our analysis is to combine the data collected in Steps 1 and 2 to establish the
marginal ‘total economic value’ of the ecosystem services delivery as a direct consequence of UK
BAP conservation activities (Research objective 3). This is achieved by multiplying the values of the
ecosystem services delivered by BAP habitats (Step 1: Choice experiment) with the habitat:ecosystem
service ‘weighting scores’ (Step 2: Weighting matrix). The outputs from Step 3 include estimates of
the marginal ‘total economic value’ for the UK BAP in its entirety, as well as for various sub-
components of the UK BAP.
Figure 1: Overview of research approach.
26
Adoption of the above research protocol allows us to collect data on the marginal ‘total economic
value’ of the ecosystem services directly attributed to UK BAP spend for:
the UK BAP across the UK as a whole;
each of the 12 UK regions;
each of the 19 BAP habitats examined; and
the UK BAP Habitats Action Plans (HAPs), the widespread species Species Action Plans
(wSAPs); and for the individual Species Action Plans (sSAPs).
These values are estimated for two future UK BAP funding scenarios: (i) maintaining current levels
of spend on the UK BAP, and (ii) Increasing spend to meet the revised UK BAP targets. Finally, the
findings from the above are used to provide an ‘indicative’ cost benefit analysis of the ecosystem
services directly attributable to: Habitat Action Plans; Widespread Species Action Plans; and Single
Species Action Plans.
1.2. Structure of report
This report is structured into twelve sections. Following this introduction, Section 2 provides a brief
review of the literature on the ecosystems approach to valuation. Section 3 then introduces the UK
BAP and develops the BAP scenarios that will be evaluated in this research. Section 4 to 6 then
describes the three Step involved in the research protocol. Section 4 describes the choice experiment
protocol that was used to assess the economic value of the ecosystem services provided by habitats
included in the UK BAP. Section 5 then describes the weighting matrix that was used to (i) link the
UK BAP habitats to the delivery of ecosystem services and (ii) to identify the contribution that UK
BAP conservation activities have on the provision of ecosystem services. Finally, Section 6 describes
the approach used to combine the data from these two elements, to allow a comprehensive assessment
of the value of ecosystem services that are directly attributable to the UK BAP conservation activities.
The results of these three steps are respectively reported in Sections 7, 8 and 9. A critique of the report
approach and results is presented in Section 10, and we make some concluding comments in Section
11. Finally, in the appendix to the report, copies of the choice experiment questionnaire and weighting
matrix reproduced, along with some more detailed information on the methodology.

27
Part A: Literature review
Part A of this report provides an overview of the literature relevant to the economic valuation of the
UK BAP. First, we report detail on the origins and development of the UK BAP (Section 2.1). This is
followed in Section 2.2 by a review of the key theoretical issues that need to be considered for an
economic assessment of the value of biodiversity.
28
2. Literature
The review of literature first presents background information on the UK BAP (Section 2.1). This is
then followed by a review of the key academic literature relating to how best to assess the links
between the UK BAP and ecosystem services (Section 2.2.1) and the ‘ecosystems approach’ to
economic valuation (Section 2.2.2)
2.1. Origin and development of the UK BAP
The contribution of nations to conserving biodiversity was formally agreed by the international
political community in the UNCED Rio Summit (1992) enshrined in the Convention on Biodiversity
and Sustainable Development (CBD). The CBD recognises that all levels of biodiversity (from
genetic and species to ecosystems) contribute to maintenance of processes that provide a range of
fundamental goods and services (termed ‘ecosystem services’) which are essential in the support of
human existence for health, well-being, and the provision of livelihoods (Costanza et al., 1997; Daily,
1997; Millennium Ecosystem Assessment, 2005; TEEB, 2010).
As a result of the Convention, the UK and European Commission developed and published
biodiversity conservation strategies (in 1994 and 1998 respectively). In the UK, this included the
formation of the UK Biodiversity Action Plan (UK BAP) which had the key objective of conserving
and enhancing habitats and species.
Despite the broader sustainable development objectives of the Rio Convention, the UK BAP Steering
Group took an approach that emphasised the production of lists of habitat and species action plans in
the Biodiversity Strategy (Anonymous 1995). Implementation of the plans was assisted by broadening
responsibility for conservation across the public, NGO and business sectors through the Agenda 21
process and wildlife legislation brought in through the devolved Governments of the UK. There was a
general lack of resources available to implement the action plans published in the UK Biodiversity
Action Plan (1995). The National Biodiversity Network, established in 1998, aimed to complement
the BAP process by assisting the sharing of information through a widely accessible database of
species and habitats.
Local biodiversity partnerships (LBPs) were established within many local authorities (LAs) across
the UK from 1998 with the purpose of translating the general UK BAP to Local Biodiversity Action
Plans (LBAPs) for implementation and delivery of both national and locally agreed targets. Audits
were conducted of habitats and species that were or had until recently been represented in each LBAP
area to identify appropriate habitats and species to include in the local biodiversity species and habitat
action plans (LSAPs and LHAPs). Local Biodiversity Officers were appointed to coordinate local
efforts by regional staff of statutory conservation agencies, NGOs, LA Ranger Service staff,
academics and volunteer wildlife conservationists towards productions of costed LSAPs and LHAPs
stating agreed local priorities. Steady progress has been made on many LSAPs and LHAPs in LBAPs
covering a reasonable number of LA areas. There has been a recent trend for newer LBAPs to simply
refer to the national general action plans rather than provide local adapted versions that provide
figures on local habitat and species assets, their status and precise targets for conservation,
enhancement or increased public awareness at given dates.
To record progress towards the UK BAP targets the Biodiversity Action Reporting System (BARS)
was established (http://www.ukbap-reporting.org.uk/). In general, BARS is a web-based information
system that supports the planning, monitoring and reporting requirements of national and local
Biodiversity Action Plans (BAPs). It records information on the following:
Conservation and enhancement of habitats and species;
Activities to improve quality of habitats / size of populations;
Activities to increase area of habitats / range of species;
Activities to improve public understanding activities and participation in nature
conservation.
29
Species and habitats were originally selected on the basis of their recent rates of loss or their rare or
threatened status. Lack of quantitative data on the extent and rate of change in area of many habitats
under consideration or population data of some species led to biases in the selection process. A wide
ranging consultation and review involving over 500 people was therefore conducted and completed in
2007 which presented a new UK List of Priority Species and Habitats. This list, a result of the most
comprehensive biodiversity analysis ever undertaken in the UK, contains 1149 species and 65 habitats
that have been listed as priorities for conservation action under the UK Biodiversity Action Plan. A
list of all habitat and species action plans can be found on the UK BAP website
http://www.ukbap.org.uk/NewPriorityList.aspx.
In 2006 Defra undertook a series of costings studies of the UK BAP (Buisson and Rayment, 2006;
GHK Consulting Ltd., 2006). The aims of these studies were to establish current expenditure on the
UK BAP, as well as to estimate the spending gap relating to full implementation of the UK BAP
targets. In this study, we aim to directly link into the costings work to allow a cost benefit assessment
of the UK BAP to be undertaken. It was therefore essential that our valuation study is designed to be
consistent with the UK BAP costings work. Note, the since this study was undertaken, Defra have
updated its UK BAP costings research (GHK Consulting LTD., 2010)
2.2. Valuing ecosystems services
An assessment of the value of the UK BAP is likely to be a complex process because it raises a
number of questions about what is to be valued, from what perspective, and by whom. A useful
approach to thinking about valuing biodiversity is to adopt an ecosystem services focus because this
helps to define the operational unit to be valued. An ecosystem services approach to valuing
biodiversity also helps to frame discussions about what the multiple objectives of conserving
biodiversity might be (Haines-Young and Potschin 2007).
Approaches that ask people to value ecosystem services are therefore useful but have not been widely
applied (Hartje et al. 2003). Part of the reason for this is the need to understand the complex linkages
between biodiversity, ecosystem services and value. Unfortunately there are many gaps in current
knowledge and high degrees of uncertainty involved in estimating those gaps.
This theoretical review is primarily concerned with understanding these linkages. Section 2.2.1
provides a theoretical discussion of the linkages between the UK BAP and associated ecosystem
services (Step 2 in Figure 1), while Section 2.2.2 provides a review of approaches to valuing
ecosystems services (Step 1 in Figure 1). The research protocol to be utilised in this research draws on
this theoretical framework.
2.2.1. Understanding linkages between species, habitats and ecosystem services
Recent research effort relating to the valuation of biodiversity and ecosystem services include projects
funded through Defra’s Ecosystems Approach Action Plan (NR0103, NR0106 – NR0111), as well as
elsewhere (Barbier, 2007; Christie et al., 2006; Costanza et al., 1997; European Commission and
German Ministry for the Environment, 2008; IUCN, 2004; MEA, 2005). However, a number of major
challenges remain.
First, the whole approach to valuing ecosystem services assumes that the linkages between the
structure and functions of natural systems, the benefits (i.e., goods and services) derived by humanity,
and their subsequent values can be identified and quantified and, importantly, meaningfully described
to the public (Barbier, 2007; Heal et al., 2005). For example, some of the significant challenges
associated with understanding the relative contribution of different species and habitats to provision of
ecosystem services include:
1) Difficulties understanding the nature of the contribution of species to ecosystem services. The
majority of species do not contribute in an easily quantified way to ecosystem services. This is
because the services are an emergent property of many interacting factors. The more tangible
of these services include: pollination, flood defence, and water purification, but even these
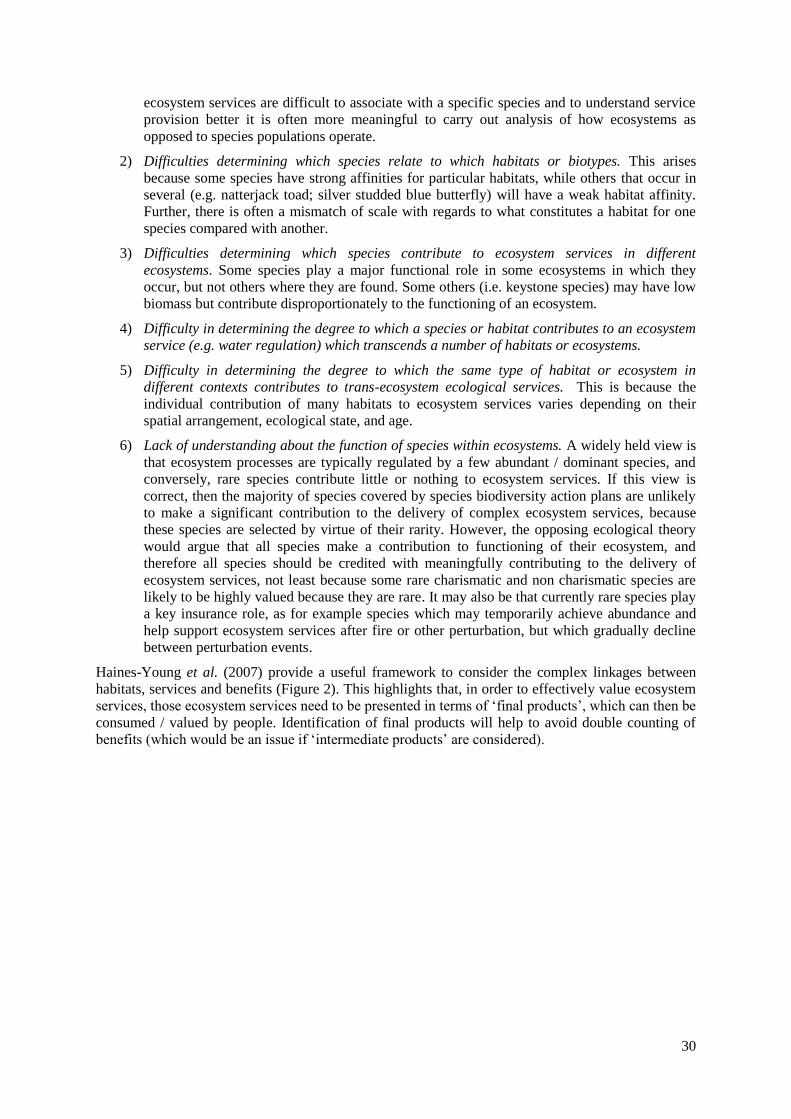
30
ecosystem services are difficult to associate with a specific species and to understand service
provision better it is often more meaningful to carry out analysis of how ecosystems as
opposed to species populations operate.
2) Difficulties determining which species relate to which habitats or biotypes. This arises
because some species have strong affinities for particular habitats, while others that occur in
several (e.g. natterjack toad; silver studded blue butterfly) will have a weak habitat affinity.
Further, there is often a mismatch of scale with regards to what constitutes a habitat for one
species compared with another.
3) Difficulties determining which species contribute to ecosystem services in different
ecosystems. Some species play a major functional role in some ecosystems in which they
occur, but not others where they are found. Some others (i.e. keystone species) may have low
biomass but contribute disproportionately to the functioning of an ecosystem.
4) Difficulty in determining the degree to which a species or habitat contributes to an ecosystem
service (e.g. water regulation) which transcends a number of habitats or ecosystems.
5) Difficulty in determining the degree to which the same type of habitat or ecosystem in
different contexts contributes to trans-ecosystem ecological services. This is because the
individual contribution of many habitats to ecosystem services varies depending on their
spatial arrangement, ecological state, and age.
6) Lack of understanding about the function of species within ecosystems. A widely held view is
that ecosystem processes are typically regulated by a few abundant / dominant species, and
conversely, rare species contribute little or nothing to ecosystem services. If this view is
correct, then the majority of species covered by species biodiversity action plans are unlikely
to make a significant contribution to the delivery of complex ecosystem services, because
these species are selected by virtue of their rarity. However, the opposing ecological theory
would argue that all species make a contribution to functioning of their ecosystem, and
therefore all species should be credited with meaningfully contributing to the delivery of
ecosystem services, not least because some rare charismatic and non charismatic species are
likely to be highly valued because they are rare. It may also be that currently rare species play
a key insurance role, as for example species which may temporarily achieve abundance and
help support ecosystem services after fire or other perturbation, but which gradually decline
between perturbation events.
Haines-Young et al. (2007) provide a useful framework to consider the complex linkages between
habitats, services and benefits (Figure 2). This highlights that, in order to effectively value ecosystem
services, those ecosystem services need to be presented in terms of ‘final products’, which can then be
consumed / valued by people. Identification of final products will help to avoid double counting of
benefits (which would be an issue if ‘intermediate products’ are considered).
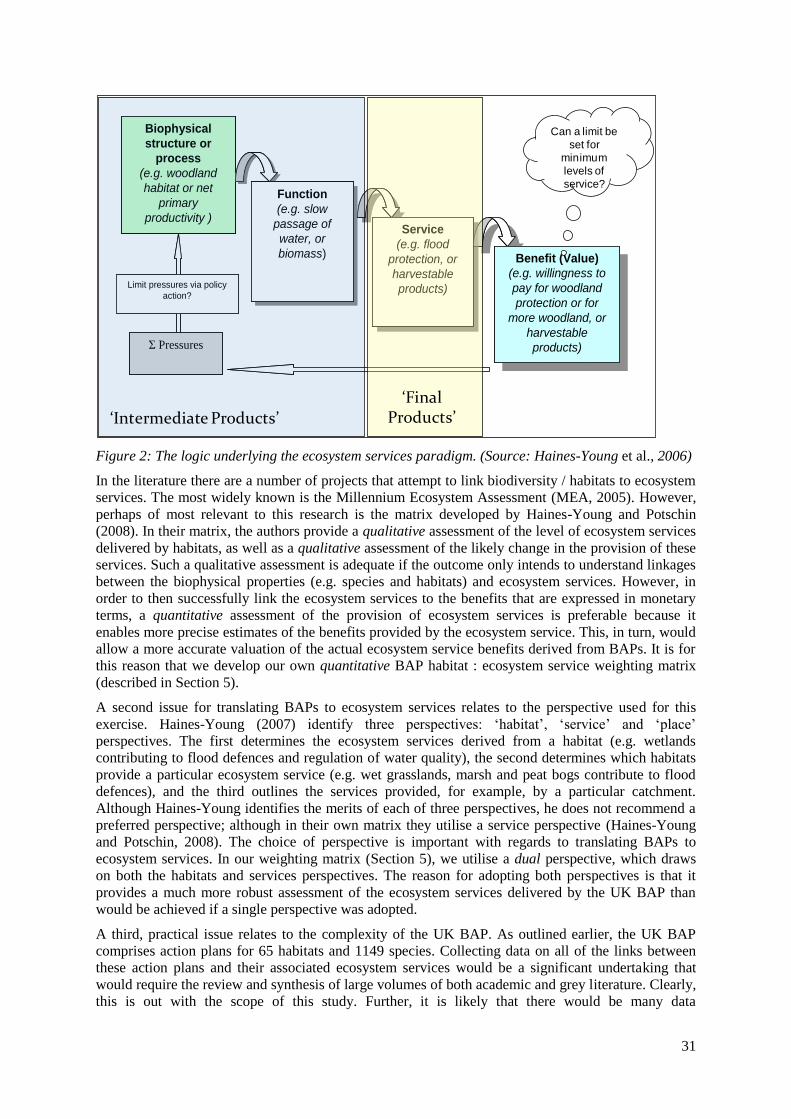
31
Figure 2: The logic underlying the ecosystem services paradigm. (Source: Haines-Young et al., 2006)
In the literature there are a number of projects that attempt to link biodiversity / habitats to ecosystem
services. The most widely known is the Millennium Ecosystem Assessment (MEA, 2005). However,
perhaps of most relevant to this research is the matrix developed by Haines-Young and Potschin
(2008). In their matrix, the authors provide a qualitative assessment of the level of ecosystem services
delivered by habitats, as well as a qualitative assessment of the likely change in the provision of these
services. Such a qualitative assessment is adequate if the outcome only intends to understand linkages
between the biophysical properties (e.g. species and habitats) and ecosystem services. However, in
order to then successfully link the ecosystem services to the benefits that are expressed in monetary
terms, a quantitative assessment of the provision of ecosystem services is preferable because it
enables more precise estimates of the benefits provided by the ecosystem service. This, in turn, would
allow a more accurate valuation of the actual ecosystem service benefits derived from BAPs. It is for
this reason that we develop our own quantitative BAP habitat : ecosystem service weighting matrix
(described in Section 5).
A second issue for translating BAPs to ecosystem services relates to the perspective used for this
exercise. Haines-Young (2007) identify three perspectives: ‘habitat’, ‘service’ and ‘place’
perspectives. The first determines the ecosystem services derived from a habitat (e.g. wetlands
contributing to flood defences and regulation of water quality), the second determines which habitats
provide a particular ecosystem service (e.g. wet grasslands, marsh and peat bogs contribute to flood
defences), and the third outlines the services provided, for example, by a particular catchment.
Although Haines-Young identifies the merits of each of three perspectives, he does not recommend a
preferred perspective; although in their own matrix they utilise a service perspective (Haines-Young
and Potschin, 2008). The choice of perspective is important with regards to translating BAPs to
ecosystem services. In our weighting matrix (Section 5), we utilise a dual perspective, which draws
on both the habitats and services perspectives. The reason for adopting both perspectives is that it
provides a much more robust assessment of the ecosystem services delivered by the UK BAP than
would be achieved if a single perspective was adopted.
A third, practical issue relates to the complexity of the UK BAP. As outlined earlier, the UK BAP
comprises action plans for 65 habitats and 1149 species. Collecting data on all of the links between
these action plans and their associated ecosystem services would be a significant undertaking that
would require the review and synthesis of large volumes of both academic and grey literature. Clearly,
this is out with the scope of this study. Further, it is likely that there would be many data
Biophysical
structure or
process
(e.g. woodland
habitat or net
primary
productivity )
Service
(e.g. flood
protection, or
harvestable
products)
Service
(e.g. flood
protection, or
harvestable
products)
Function
(e.g. slow
passage of
water, or
biomass)
Function
(e.g. slow
passage of
water, or
biomass)Benefit (Value)
(e.g. willingness to
pay for woodland
protection or for
more woodland, or
harvestable
products)
Benefit (Value)
(e.g. willingness to
pay for woodland
protection or for
more woodland, or
harvestable
products)Σ Pressures
Limit pressures via policy
action?
Biophysical
structure or
process
(e.g. woodland
habitat or net
primary
productivity )
Service
(e.g. flood
protection, or
harvestable
products)
Service
(e.g. flood
protection, or
harvestable
products)
Function
(e.g. slow
passage of
water, or
biomass)
Function
(e.g. slow
passage of
water, or
biomass)Benefit (Value)
(e.g. willingness to
pay for woodland
protection or for
more woodland, or
harvestable
products)
Benefit (Value)
(e.g. willingness to
pay for woodland
protection or for
more woodland, or
harvestable
products)
Biophysical
structure or
process
(e.g. woodland
habitat or net
primary
productivity )
Service
(e.g. flood
protection, or
harvestable
products)
Service
(e.g. flood
protection, or
harvestable
products)
Function
(e.g. slow
passage of
water, or
biomass)
Function
(e.g. slow
passage of
water, or
biomass)Benefit (Value)
(e.g. willingness to
pay for woodland
protection or for
more woodland, or
harvestable
products)
Benefit (Value)
(e.g. willingness to
pay for woodland
protection or for
more woodland, or
harvestable
products)Σ Pressures
Limit pressures via policy
action?
Can a limit be
set for
minimum
levels of
service?
‘Intermediate Products’
‘Final Products’
32
inconsistencies and gaps that would limit the comprehensiveness of such an exercise. Thus, rather
than attempt to examine the literature in detail, we adopt a more pragmatic approach that collates and
synthesises expert knowledge. Such an approach was utilised in the production of the Millennium
Ecosystem Assessment (MEA 2005). Here, expert opinion and value judgements from an impressive
collection of global ecologists were used to first define headline ecosystem services and then focus on
consequences of these for human well-being. This pragmatic approach to assessment is probably
fairly robust with respect to simple direct usage of ecosystem services. However, it is probably more
open to criticism in terms of identifying problems with more complex ecosystem services, where the
rates of change are slow compared to changes in their drivers, or where complex spatial ecology and
threshold effects are involved. Having said that, we argue that the elicitation of expert knowledge on
the links between the UK BAP and their associated services is currently the most practical solution to
assessing the ecosystem services impacts of the UK BAP. Other studies that have successful used a
similar approach include Hutchinson (2010) and Maynard (2010). In our study, we develop a
‘weighting matrix’ which collates information from 58 UK BAP co-ordinators on the ecosystem
services delivered by the UK BAP. Further detail of the weighting matrix is provided in Section 5.
2.2.2. Ecosystem service valuation
The economic valuation of the benefits associated with ecosystem services is challenging. These
challenges include identifying ways in which to meaningfully describe the often complex and
unfamiliar ecosystem service concepts to the public. Research undertaken by Christie et al. (2006)
highlight the issues of the public’s low level of understanding of ecosystem services, particularly in
the context of stated preference valuation methods; e.g. when people are trying to make their
underlying implicit preferences explicit or when they have little knowledge about the element being
valued (MacMillan et al., 2006). This challenge may be overcome by employing more participatory
approaches to valuation such as deliberative valuation (Lichtenstein and Slovic, 2006), valuation
during Citizen’s juries (Alvarez-Farizo and Hanley, 2006; Blamey et al., 2000), and mediated
modelling (Costanza and Ruth, 1998; Van den Belt et al., 1998). These approaches enable a more in-
depth analysis of peoples’ underlying beliefs, perceptions and values, and which allow participants to
learn about the goods being valued (Christie et al., 2008a).
A further challenge for this research is the fact that there is often incomplete knowledge of how
ecosystems work and in particular there are issues relating to how valuation can deal with uncertainty,
irreversibility and non-linearity in ecosystem functions. Although, the scope of the research does not
allow these issues to be directly addressed, the adoption of an inter-disciplinary approach to research
where economists and ecologists work together as a cohesive team helped to address these issues and
allow knowledge to be adapted to the research needs. Furthermore, the valuation framework was
designed so that respondents were explicitly made aware of any uncertainties in ecological
knowledge.
Finally, there are a number of issues relating to the aggregation of values, including how to avoid
double counting. To some extent, these issues can be accounted for during the design and
administration of the valuation protocol. In particular, a focus on ‘final products’ during the valuation
exercise (Haines-Young et al., 2007) can help avoid double counting.
33
Part B: Methodology
This section describes the methodology used to value of the ecosystem services delivered by the
conservation activities associated with the UK BAP. First, we provide clarification of the scope of the
valuation exercise by defining the UK BAP policy scenarios to be investigated (Section 3). Next, we
detail each of the three ‘Steps’ involved in the valuation exercise. In Step 1 a choice experiment is
used to estimate the economic value that people have for a range of ecosystem services associated
with the UK BAP (Section 4). Step 2 (Section 5) then reports the method used in the ‘weighting
matrix’ which aims to elicit expert knowledge on the levels of ecosystem services delivered by
different BAP habitats, as well as assess the contribution that UK BAP conservation activities have
for the delivery of ecosystem services. Finally, in Step 3 (Section 6), we report how the data from
Steps 1 and 2 are pooled to provide estimates of the value of ecosystem services delivered by UK
BAP conservation activities.
34
3. UK BAP policy scenarios
In this research, we aim to estimate the ‘total economic value’ (TEV) of marginal changes to
ecosystem services delivered by the UK BAP; as opposed to the total value of all services delivered
by the UK BAP. The focus on the marginal change is important, since this reflects where policy
decisions are made.
In valuation, the marginal change is often expressed in terms of a change from a counterfactual
‘policy-off’ scenario to a factual ‘policy-on’ scenario. Precise definition of the policy scenarios is
essential for valid valuation. However, identifying the most appropriate counterfactual and factual
scenarios is often not clear-cut, and may be influenced by: the needs of the decision-maker; the level
of knowledge on the likely impacts of different policy scenarios; and the extent to which the survey
respondents understand and can relate to the policy scenarios.
The chosen policy scenarios also need to link into the two-stage valuation protocol that is proposed
for this research. In particular, through the choice experiment we utilise the opportunity to evaluate
intermediate levels of policy provision, rather than simply a single factual and counterfactual policy
scenario.
Finally, it was considered desirable that the policy change scenarios evaluated here directly links with
the UK BAP costings work (GHK Consulting Ltd., 2006), which assessed the current level of
expenditure on the UK BAP, the predicted ‘total cost of delivery’ of the UK BAP, as well as
identifying the ‘funding gap’. Matching our benefit valuation with the costings work will allow direct
comparison between the costs and benefits of future options for the UK BAP. Note that a new set up
UK BAP costings have recently been published (GHK Consulting LTD., 2010); however this was not
available at the time of the analysis.
3.1. Scope of the UK BAP
The UK BAP aims to conserve and enhance important habitats and species. This is achieved by
specifying targets for the conservation of habitats and species, and actions designed to meet these
targets. The UK action plans originally comprised 45 habitat action plans (HAPs) and 391 species
action plans (SAPs). However, in 2007, the original list of priority species and habitats was revised
and a more comprehensive UK BAP list was generated comprising 65 habitats and 1149 species. The
new HAP targets are reported in the ‘Revised HAP targets 2006’ report (BRIG, 2006), while the new
species lists can be found in the UK BAP (2008) ‘Evidence for the selection of priority species’
spreadsheet. Since devolution, country biodiversity groups have implemented HAPs and SAPs at
national and / or local level, where organised biodiversity partnerships are in place. It is proposed
that the focus of this research will be to measure the economic value of meeting the targets set in
both the original and new, national habitat and species action plans.
In the UK, biodiversity conservation activities are funded through a wide range of policy initiatives
including the UK BAP, SSSIs legislation, EU Habitats Directive, and EU Water Framework
Directive. The boundary between these different initiatives is often ambiguous, and is it often difficult
to disentangle those activities that directly relate to the implementation of the UK BAP and those
which relate to other drivers e.g. the Habitats Directive. In this research, the focus of the valuation is
on conservation activities that directly contribute to meeting the UK BAP targets. These activities
have already been defined in the UK BAP costings research (GHK Consulting Ltd., 2006), and it is
proposed that we utilise the list of activities identified in the costings research. Thus, conservation
activities addressed in this research will include relevant expenditures on agri-environmental
schemes, as well as relevant conservation expenditures by devolved environmental departments,
Wildlife and Countryside Link organisations, statutory nature conservation agencies and the
Forestry Commission.
Clearly, there are a wide range of policies that contribute towards delivery of the UK BAP. This
complexity presents a significant challenge in terms of communicating the extent of biodiversity
conservation under consideration in the valuation exercise. In an attempt to simplify the information
on UK BAP, a series of discussions were held with ecologists and members of the public to identify
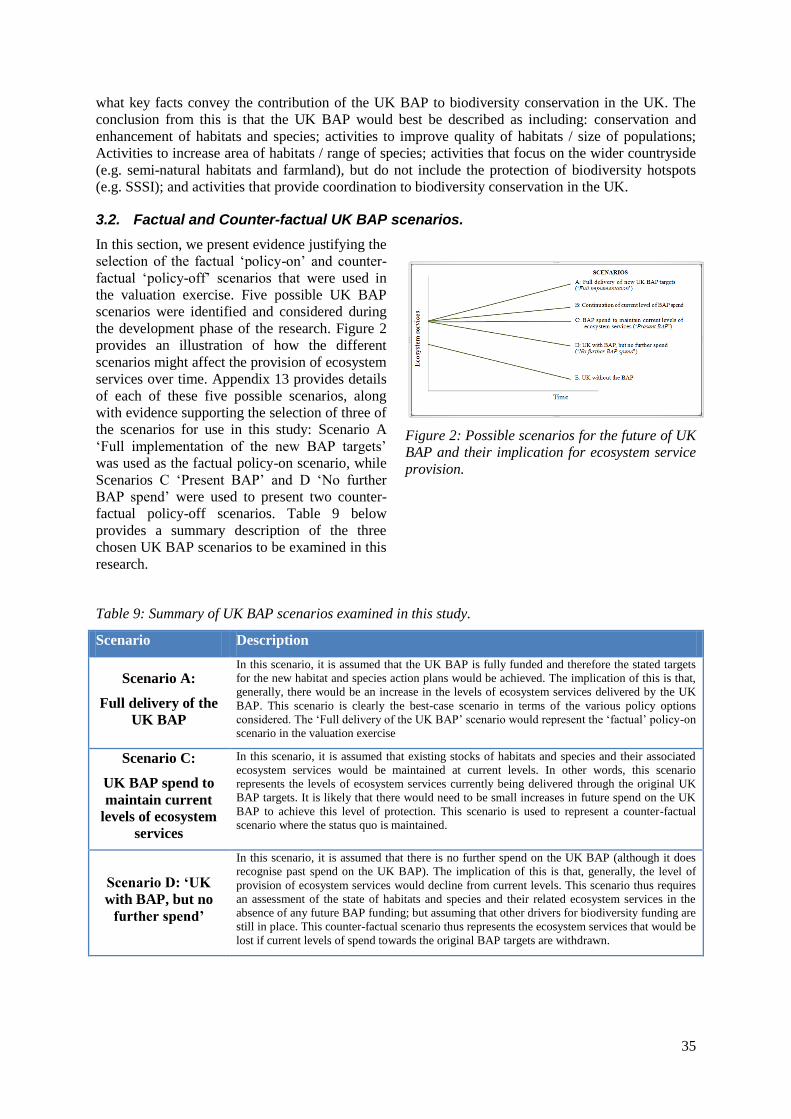
35
what key facts convey the contribution of the UK BAP to biodiversity conservation in the UK. The
conclusion from this is that the UK BAP would best be described as including: conservation and
enhancement of habitats and species; activities to improve quality of habitats / size of populations;
Activities to increase area of habitats / range of species; activities that focus on the wider countryside
(e.g. semi-natural habitats and farmland), but do not include the protection of biodiversity hotspots
(e.g. SSSI); and activities that provide coordination to biodiversity conservation in the UK.
3.2. Factual and Counter-factual UK BAP scenarios.
In this section, we present evidence justifying the
selection of the factual ‘policy-on’ and counter-
factual ‘policy-off’ scenarios that were used in
the valuation exercise. Five possible UK BAP
scenarios were identified and considered during
the development phase of the research. Figure 2
provides an illustration of how the different
scenarios might affect the provision of ecosystem
services over time. Appendix 13 provides details
of each of these five possible scenarios, along
with evidence supporting the selection of three of
the scenarios for use in this study: Scenario A
‘Full implementation of the new BAP targets’
was used as the factual policy-on scenario, while
Scenarios C ‘Present BAP’ and D ‘No further
BAP spend’ were used to present two counter-
factual policy-off scenarios. Table 9 below
provides a summary description of the three
chosen UK BAP scenarios to be examined in this
research.
Figure 2: Possible scenarios for the future of UK
BAP and their implication for ecosystem service
provision.
Table 9: Summary of UK BAP scenarios examined in this study.
Scenario Description
Scenario A:
Full delivery of the
UK BAP
In this scenario, it is assumed that the UK BAP is fully funded and therefore the stated targets
for the new habitat and species action plans would be achieved. The implication of this is that,
generally, there would be an increase in the levels of ecosystem services delivered by the UK
BAP. This scenario is clearly the best-case scenario in terms of the various policy options
considered. The ‘Full delivery of the UK BAP’ scenario would represent the ‘factual’ policy-on
scenario in the valuation exercise
Scenario C:
UK BAP spend to
maintain current
levels of ecosystem
services
In this scenario, it is assumed that existing stocks of habitats and species and their associated
ecosystem services would be maintained at current levels. In other words, this scenario
represents the levels of ecosystem services currently being delivered through the original UK
BAP targets. It is likely that there would need to be small increases in future spend on the UK
BAP to achieve this level of protection. This scenario is used to represent a counter-factual
scenario where the status quo is maintained.
Scenario D: ‘UK
with BAP, but no
further spend’
In this scenario, it is assumed that there is no further spend on the UK BAP (although it does
recognise past spend on the UK BAP). The implication of this is that, generally, the level of
provision of ecosystem services would decline from current levels. This scenario thus requires
an assessment of the state of habitats and species and their related ecosystem services in the
absence of any future BAP funding; but assuming that other drivers for biodiversity funding are
still in place. This counter-factual scenario thus represents the ecosystem services that would be
lost if current levels of spend towards the original BAP targets are withdrawn.
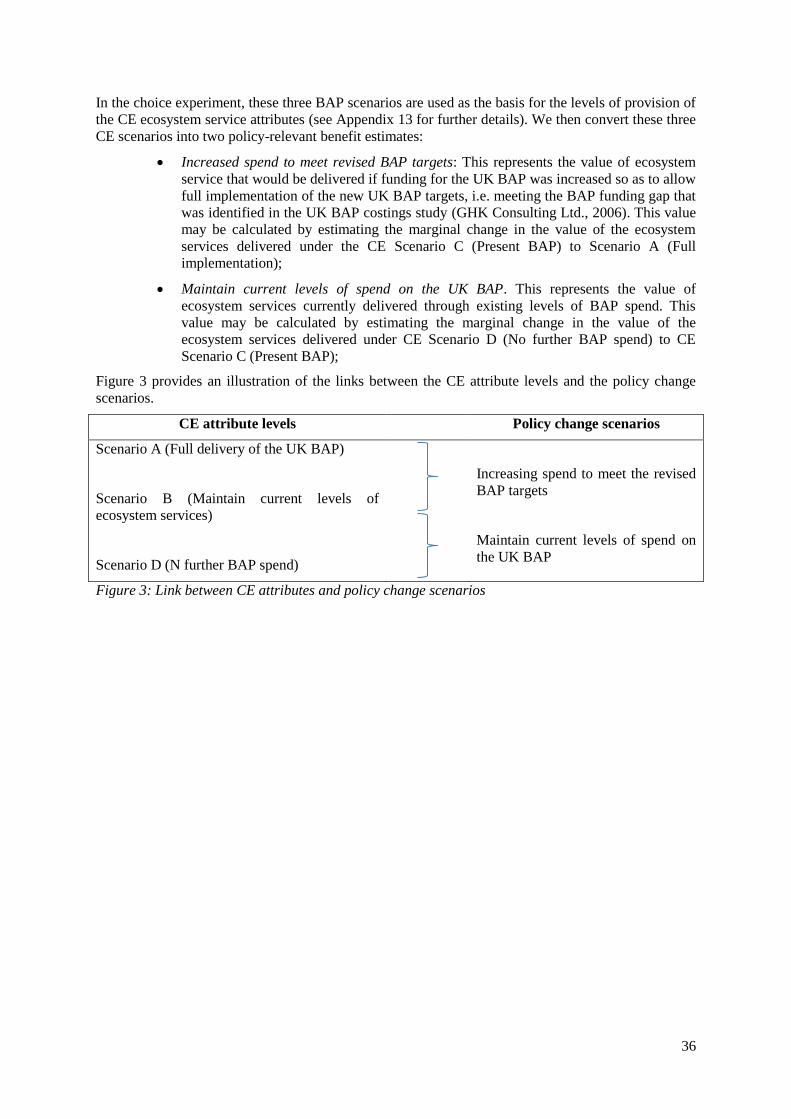
36
In the choice experiment, these three BAP scenarios are used as the basis for the levels of provision of
the CE ecosystem service attributes (see Appendix 13 for further details). We then convert these three
CE scenarios into two policy-relevant benefit estimates:
Increased spend to meet revised BAP targets: This represents the value of ecosystem
service that would be delivered if funding for the UK BAP was increased so as to allow
full implementation of the new UK BAP targets, i.e. meeting the BAP funding gap that
was identified in the UK BAP costings study (GHK Consulting Ltd., 2006). This value
may be calculated by estimating the marginal change in the value of the ecosystem
services delivered under the CE Scenario C (Present BAP) to Scenario A (Full
implementation);
Maintain current levels of spend on the UK BAP. This represents the value of
ecosystem services currently delivered through existing levels of BAP spend. This
value may be calculated by estimating the marginal change in the value of the
ecosystem services delivered under CE Scenario D (No further BAP spend) to CE
Scenario C (Present BAP);
Figure 3 provides an illustration of the links between the CE attribute levels and the policy change
scenarios.
CE attribute levels Policy change scenarios
Scenario A (Full delivery of the UK BAP)
Scenario B (Maintain current levels of
ecosystem services)
Scenario D (N further BAP spend)
Increasing spend to meet the revised
BAP targets
Maintain current levels of spend on
the UK BAP
Figure 3: Link between CE attributes and policy change scenarios
37
4. Step 1: The Choice experiment: Economic valuation of ecosystem services
The first step of the research protocol (see Step 1 in Figure 1, in Section 1.1) aims to evaluate the
marginal total economic value of the ecosystem services delivered by the UK BAP habitats. This was
achieved through the application of a choice experiment (CE), which was utilised to directly assess
the economic value of the ecosystem services that are delivered by the UK BAP habitats. However,
the UK BAP, biodiversity and ecosystem services are complex goods, which are often poorly
understood by people (Christie et al., 2008b; Christie et al., 2006). The consequence of this is that
innovative approaches were required to allow the CE to meaningfully elicit public values for the
ecosystem services delivered by the UK BAP habitats. In this study these challenges are met through
the use of participatory valuation workshops in which respondents were provided with sufficient
information and time to allow them to develop and refine their preferences. However, the provision of
large quantities of information potentially leads to ‘constructed preferences’ (i.e. the process where
the provision of information results in inflated values). It was therefore important to test for the
impact of information on respondent’s stated values. Thus, in the CE valuation workshops, a series of
three valuation choice tasks were undertaken by respondents: the first ‘standard’ task was undertaken
before respondents receive detailed information about the UK BAP; the second ‘informed’ task was
undertaken once respondents had received detailed information on the UK BAP and its associated
ecosystem services; the final ‘reflective’ task was undertaken at least one month after the workshop
following a reflective ‘cooling off’ period. Through this series of choice task, we are able to test the
effect of information on elicited values.
In this section we present details of the design of the CE valuation workshops. Section 4.1 presents
detail on the structure and design of the CE valuation workshop. In Section 4.2 we report the
procedure used to select the ecosystem services that were used as attributes in the CE. This is
followed in Section 4.3 by a detailed discussion of how the levels of each of the ecosystem services
attributes were mapped to the three UK BAP scenarios (‘Full implementation’, ‘Present BAP’ and
‘No further BAP funding’: see Section 3 for discussion of these scenarios).
4.1. The design of the choice experiment study
The choice experiment study was administered to over 600 individuals through a series of valuation
workshops and a subsequent follow-up questionnaire. The overall approach to administering the
choice experiments was as follows.
Welcome / introduction to workshop;
Short questionnaire on participant’s understanding of BAPs / Ecosystem services;
‘Standard’ choice experiment task on value of ecosystem services delivered by the UK BAP
within respondent’s ‘own region’;
Detailed presentation on and discussion of the UK BAP and associated ecosystem services
(including two films);
‘Informed’ choice experiment task on value of ecosystem services delivered by the UK
BAP within respondent’s ‘own region’;
‘Informed’ choice experiment task on value of ecosystem services delivered by the UK BAP
outside the respondent’s own region, i.e. ‘rest of UK’;
Questionnaire on demographics and learning;
Close of workshop;
Follow-up questionnaire. Respondents were asked to complete another ‘reflective’ choice
experiment on value of ecosystem services delivered by the UK BAP within respondent’s
‘own region’, administered at least one month after the workshop.
Below we describe these sections in detail, including an explanation underlying the rationale for
inclusion of particular information / questions. A copy of the interview script for the valuation
workshops can be found in the Section 15, found in the Appendix to this report.
38
Section A: Your views on public services in your area?
Following a short welcome and introduction to the workshop, respondents were asked (in Q1) to
indicate how important a range of local public services are to them. The list includes both services
relevant to this study, e.g. ‘Conserving nature’, ‘Dealing with climate change’ and ‘Flood defence’, as
well as other unrelated services, e.g. ‘Health’, ‘Education’ etc. It should be noted that, at this stage of
the workshop, the respondents were unaware that the workshop would be focusing on the UK BAP.
The purpose of this question is therefore to determine (unprompted) the extent to which respondents
consider environmental issues to be important to them. We use this same question later in the
workshop (Q17) and in the follow-up questionnaire (Q1) to test whether the information presented in
the workshop has influenced their views on environmental issues. This information was also used to
help explain potential changes to respondent’s values elicited at different stages during the workshop.
Section B: Your understanding of the term ‘Biodiversity’?
In Section B, respondents were told that the workshop would be focusing on the protection and
enhancement of the UK Biodiversity. They were then asked a series of four questions (Q2 – 5) that
assesses their current level of knowledge of biodiversity and biodiversity policies. This information
was used in the analysis of the CE to help explain and validate respondent’s values. Question 4 is also
repeated in the follow-up questionnaire to assess the extent to which the workshop changed
respondent’s knowledge of the impacts of biodiversity policy.
Section C: What does ‘biodiversity’ do for me?
Section C aims to explore participant’s current knowledge and understanding of biodiversity and
ecosystem services, and explores how they personally benefit from these. This was achieved using
various focus group methods including brain storming. It is important to note that the discussions held
during Section C primarily draws on participants own knowledge, with minimal external information
from the research team. The reason for this is that it helped to ensure that the responses to the
‘standard’ CE valuation questions in Section D were based on participant’s existing knowledge and
therefore not influenced by information provided by the research team.
Q6 provides a quantitative assessment of participant’s knowledge of the ecosystem services attributes
to be valued in the choice experiment, as well as an assessment of how important they consider these
services. This question is repeated in Q11 in Section E and again in the follow-up questionnaire (Q3)
to assess the impact of information provision and reflection on respondent’s knowledge and values.
Section D: Future policy options to protect biodiversity in your area
In Section D the first set of choice experiment choice tasks were administered. We refer to this first
set as the ‘standard’ choice experiment as all activities up to this stage (and in particular the
information provision) were designed to follow the procedures that would normally be adopted in a
standard choice experiment. It should also be noted that in this Section (and again in Section G and
then in the follow-up questionnaire), the choice experiment focuses on the ecosystem services benefits
of the UK BAP habitats found within the participant’s ‘own region’ (as opposed to the ‘rest of the
UK’: which is examined in Section H).
Thus in Section D, participants were presented with:
details of the hypothetical scenarios describing the future management options for the UK BAP;
instructions on how respondents should complete the CE choice tasks, including:
a list of standard issues (such as ‘cheap talk’) that they need to consider when making their
choices;
an example choice experiment choice task.
Participants were then asked to complete a series of five choice tasks, where each task required
respondents to select their preferred ‘action plan’ from a series of three plans: Action Plan A, Action
Plan B and a Baseline Plan (see Figure 4 for an example). Each Action Plan was described in terms of
seven ecosystem service attributes and a monetary attribute. The levels of ecosystem service delivery
in the Baseline plan relate to the ‘No further BAP funding’ scenario at no additional cost. The
ecosystem service attributes in Plans A and B took one of three levels of delivery based on the ‘Full
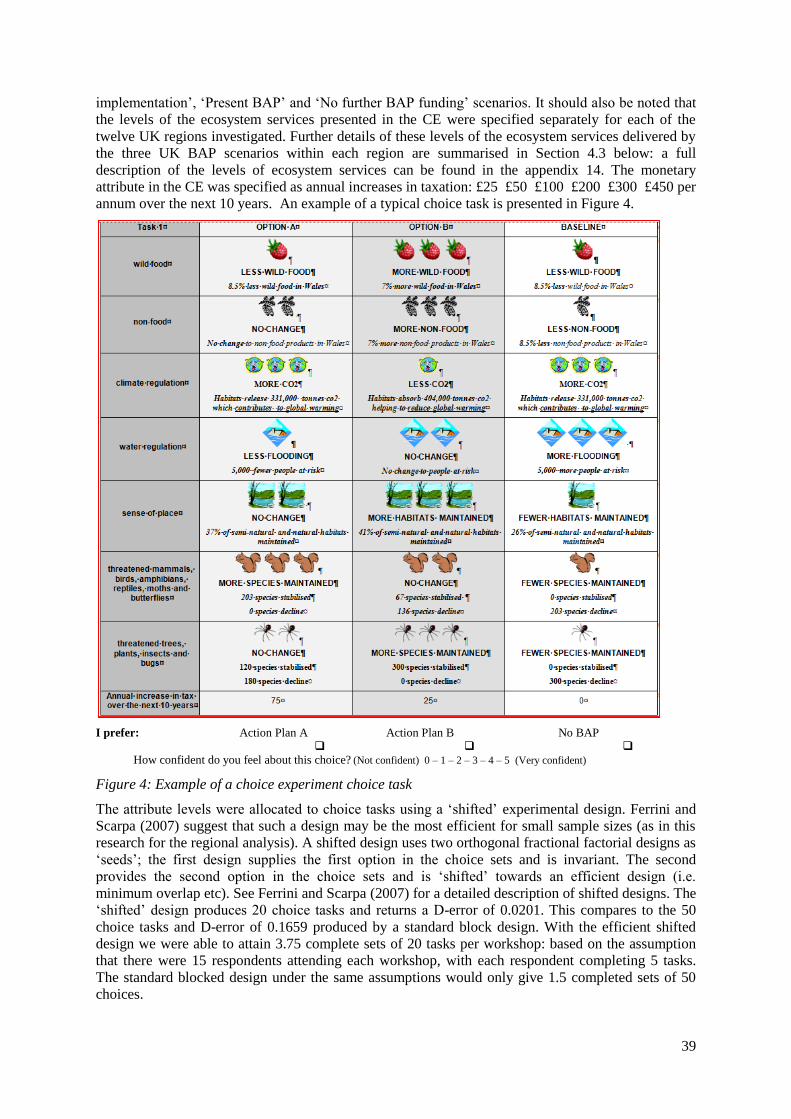
39
implementation’, ‘Present BAP’ and ‘No further BAP funding’ scenarios. It should also be noted that
the levels of the ecosystem services presented in the CE were specified separately for each of the
twelve UK regions investigated. Further details of these levels of the ecosystem services delivered by
the three UK BAP scenarios within each region are summarised in Section 4.3 below: a full
description of the levels of ecosystem services can be found in the appendix 14. The monetary
attribute in the CE was specified as annual increases in taxation: £25 £50 £100 £200 £300 £450 per
annum over the next 10 years. An example of a typical choice task is presented in Figure 4.
I prefer: Action Plan A Action Plan B No BAP How confident do you feel about this choice? (Not confident) 0 – 1 – 2 – 3 – 4 – 5 (Very confident)
Figure 4: Example of a choice experiment choice task
The attribute levels were allocated to choice tasks using a ‘shifted’ experimental design. Ferrini and
Scarpa (2007) suggest that such a design may be the most efficient for small sample sizes (as in this
research for the regional analysis). A shifted design uses two orthogonal fractional factorial designs as
‘seeds’; the first design supplies the first option in the choice sets and is invariant. The second
provides the second option in the choice sets and is ‘shifted’ towards an efficient design (i.e.
minimum overlap etc). See Ferrini and Scarpa (2007) for a detailed description of shifted designs. The
‘shifted’ design produces 20 choice tasks and returns a D-error of 0.0201. This compares to the 50
choice tasks and D-error of 0.1659 produced by a standard block design. With the efficient shifted
design we were able to attain 3.75 complete sets of 20 tasks per workshop: based on the assumption
that there were 15 respondents attending each workshop, with each respondent completing 5 tasks.
The standard blocked design under the same assumptions would only give 1.5 completed sets of 50
choices.
40
Following each choice task, respondents were asked to indicate their level of confidence in
completing the choice tasks. Respondents were also asked to indicate how they made their choices
(Q9). This information was used to assess the impact of confidence on WTP, as well as to identify
protest bidders (whom were excluded from the analysis).
Once participants had completed the choice tasks, they were allowed a short refreshment break.
Section E: More on Biodiversity in your region and how it benefits you
During the developmental focus groups it was clear that participants were often unfamiliar with the
UK BAP and associated ecosystem services. However, to allow meaningful valuation, respondents
ideally need to develop a detailed understanding of this, often complex, policy. Standard protocols for
information provision in CE (such as during in-person interviews) were deemed inadequate. Thus,
new, innovative approaches to information provision were developed for this study that would deliver
sufficient information for meaningful valuation, without invoking respondent fatigue.
Section E of the workshop was where these new approaches to information delivery were
implemented. Specifically, the activities were framed around two themes: (i) developing an
understanding of biodiversity and (ii) developing an understanding of how people might benefit from
biodiversity. Innovative aspects to information provision included:
The use of a range of media formats to present information, including films, PowerPoint
presentations and information sheets. The idea here is that people have different approaches
to learning and therefore the use of a range of media would help to enhance opportunities for
learning. Also, the use of a range of media formats was thought to help keep participants
interested and reduce the likelihood of respondent fatigue.
The presentation of material through two short films was considered to be particularly
innovative. The films respectively explored ‘Biodiversity’ and ‘How people might benefit
from biodiversity’. A key advantage of films over other types of media is that they have the
capacity to convey large volumes of information (including images) within a short period of
time. Further benefits include the fact that the films help to break up the workshop, thus
helping to avoid respondent fatigue. It should be noted that the objective of the films were
predominantly to provide background information that could subsequently be used to
stimulate discussions on how participants use and benefit from biodiversity.
Another important aspect to promote learning was the use of group discussions on the topics
raised in the films and presentations. These discussions provide participants with the time and
opportunity to reflect on the information presented, form value judgements on this
information, and to clarify any areas of uncertainty.
The activities described above not only enabled more information to be presented than would be the
case during a standard CE, but also allowed time for discussion and reflection on this information. It
is argued that only through this participatory approach can respondents develop sufficient
understanding of the UK BAP to allow them to make meaningful and robust valuations.
Another key feature of the information set presented in this section was that separate information
packs were developed for each of the twelve UK regions. Thus, respondents were presented with
detailed information on the impacts of the UK BAP in their local region. In addition, respondents
were also presented with information on the impacts on the UK as a whole as this helps to ensure that
respondents were aware of the contribution of their region to the UK BAP, as well as allowing us to
test for scope effects.
Section F: Review of your values (optional)
A potential issue with choice experiments is that respondents may be unclear as to how their choices
translate into actual values for the individual CE attributes. Consider a standard CE study: respondents
are asked to make a series of CE choices during an interview, which are then analysed at a later date.
The consequence of this is that respondents are never provided with an opportunity to reflect on and
review their valuations. In this research, we aim to address this issue by providing respondents with
an opportunity to review their valuations. Specifically, the responses to the ‘standard’ CE questions
posed in Section D were analysed during the workshop and presented back to participants in Section
41
F. Participants were then be asked to comment on whether they consider the estimated values to be
higher, lower or close to what they would expect. Later, in Section G, participants were asked to
consider another series of choice tasks (‘informed’ CE) during which they were able to reflect on the
values obtained from the first set of CE choice tasks. To test the impact of this exercise on subsequent
valuations, this review exercise was undertaken in 1/3 of the workshops; the remaining 2/3 were used
as a control.
Section G: Future policy options to protect biodiversity in your area: revisited.
In Section G, participants were asked to complete a second set of CE choice tasks on the local impact
of the UK BAP. This second set of choices can be considered as an ‘informed’ set of choices. In other
words, when making their choices, respondents would have received (in Section E) large amounts of
information on the UK BAP and how it might affect them, as well as time to discuss and reflect on
this information. Comparison of this ‘informed’ choice task with the ‘standard’ choice task
(undertaken in Section D above) allowed an assessment of the impact of information on values to be
made. Such a comparison is considered important particularly when the UK BAP is an unfamiliar and
complex good.
Following the ‘informed’ choice tasks, respondents were presented with a series of questions (Q14 –
17) which aim to uncover the reasons why respondents’ values may have changed between the
‘standard’ and ‘informed’ choice tasks. This information helped to identify which set of choices best
reflects respondents ‘true’ value of the UK BAP.
Section H: What about biodiversity outside of my region?
The CE choice tasks undertaken in Section D (‘standard’ CE), Section G (‘Informed’ CE) and later in
the follow-up questionnaire (‘reflective’ CE) all focused on the local impacts of the UK BAP at a
regional level. In Section H, respondents were asked to consider another set of choice tasks that
consider the impacts of the UK BAP to the rest of the UK (excluded their own region). Thus, this
choice task aimed to capture some of ‘non-use’ values1 of the UK BAP, as well as allow us to
consider ‘distance decay’ effects. Q20 was posed to collect data on whether the respondent would
prefer the ‘Protection of few species in my local area’ or ‘Protection of many species outside my local
area’. This data were used to help explain differences between the values for the local impacts of the
UK BAP compared to the impacts on the rest of the UK.
Section I: About you
The final section of the workshop was split into two activities. First, respondents were asked to
answer a series of questions relating to their demographic status (Q21 – 31). These questions are
incorporated into the analysis of the choice experiment, thus used to help explain WTP.
Q32 then asked respondents to complete a series of questions that aim to explore the way that they
think about and learn from new information. Analysis of the responses to these questions was used to
better understand how respondents used the information presented in the workshop and to explain
why they may have changed their values across CE choice task exercises.
At the end of the workshop, participants were given a payment in thanks of the time, and asked
whether they would be willing to participant in a short follow-up questionnaire.
Public Perception of the UK Biodiversity Action Plan: Follow-up questionnaire
At least one month after the workshop, participants were sent a short follow-up questionnaire. The
main aim of this questionnaire was to explore whether participant’s values of the UK BAP had
changed since the workshop. The hypothesis here is that during the workshop respondents would have
received a large amount of information on the UK BAP and that this information may have influenced
their value judgements, i.e. resulted in constructed preferences. With the follow-up question,
participants would have had time to reflect on and consider the UK BAP in the context of their normal
1 Strictly speaking, some of these values may be use values if the respondent regularly travels to other regions.
But for convenience, we will consider them as non-use values.
42
lives. Thus, the follow-up questionnaire provides an opportunity to explore the impacts of this
reflective period on values.
Q1 – 3 of the follow-up questionnaire were repeats of questions posed during the workshop. The aim
here was to explore whether and how respondent’s views of the UK BAP and associated ecosystem
services had changed since the workshop. Q4 then asked respondents to explicitly state the extent to
which they have considered how biodiversity affects them since the workshop.
Respondents were then asked to complete a final series of CE choice tasks; which we refer to as the
‘reflective’ choice task. This is considered as being reflective since the respondents would have had
several weeks to reflect on how biodiversity affects them. Following the choice tasks, respondents
were asked to reflect on factors that may have influenced their choices since the workshop (Q8 and 9).
Administration of the CE valuation workshop.
A series of 45 participatory valuation workshops were administered across the 12 UK political regions
(3 workshops in each of the nine English regions; and 6 workshops in each of Scotland, Wales and
Northern Ireland). In total, 618 people participated in the workshop allowing values to be estimated
for the UK as a whole, as well as at a regional scale.
4.2. Selection of ecosystem service attributes.
The choice experiment (CE) used in the valuation of the UK BAP comprised eight attributes: wild
food, non-food products, water regulation, climate regulation, sense of place, charismatic species,
non-charismatic species and annual increases in taxation. These attributes were largely based on the
ecosystem services listed in the Millennium Ecosystem Assessment (Millennium Ecosystem
Assessment, 2005) and modified following discussions with both experts and members of the public
to better reflect the BAP and the UK context. Key criteria for the selection of the ecosystem service
attributes for inclusion in the CE included:
Those services that provide non-market benefits. The focus of the choice experiment was
to explore the non-market ecosystem service benefits delivered by the UK BAP habitats.
Services that are delivered through economic markets (e.g. commercial food and water
purification) were not included in the CE since the value of these can be measured using
alternative market-based approaches.
Those services that were considered to be important to the UK public. A series of focus
groups were organised with members of the public to identify which of the MA
ecosystems services they considered to be important. Services considered not important
were not included in the CE.
Only those services that were relevant in a UK context. There is an acknowledgement that
the MA was largely produced with a developing country context in mind, and therefore
some of the services identified in the MA may not be directly relevant in a UK context.
The public focus groups were used to identify which services were relevant in a UK
context and therefore included in the CE.
In addition, the selected ecosystem service attributes were designed to be consistent with
those services examined in the weighting matrix.
Information collated during a developmental Delphi study and public focus groups also indicated that
although people considered that the UK BAP would provide cultural services, people found it difficult
to disaggregate between the different components of cultural services. Instead, it was concluded that a
better approach to capture cultural services would be to consider how different elements of the UK
BAP deliver cultural services. Thus, the species action plans were split between charismatic and non-
charismatic species, while habitats were considered in terms of their contribution to ‘sense of place’.
Table 10 provides a schematic diagram illustrating how the MA ecosystem services were modified for
the UK BAP. A brief outline of the ecosystem services to be used in the CE is provided in
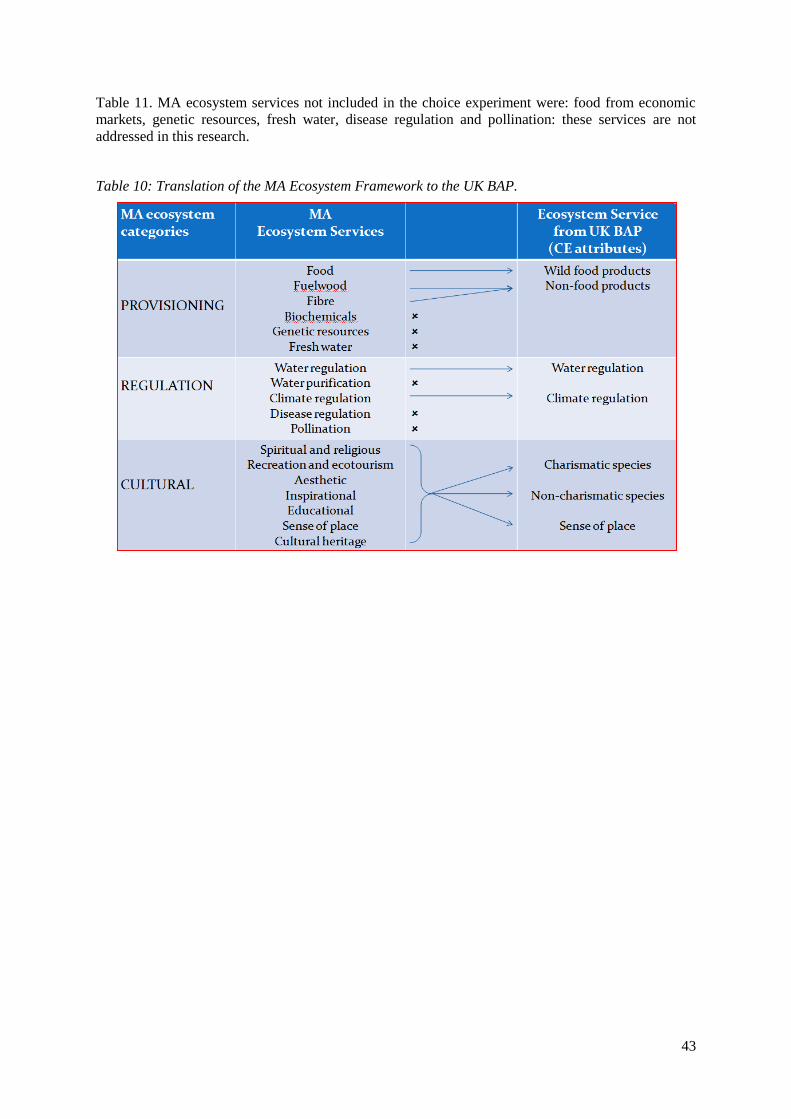
43
Table 11. MA ecosystem services not included in the choice experiment were: food from economic
markets, genetic resources, fresh water, disease regulation and pollination: these services are not
addressed in this research.
Table 10: Translation of the MA Ecosystem Framework to the UK BAP.
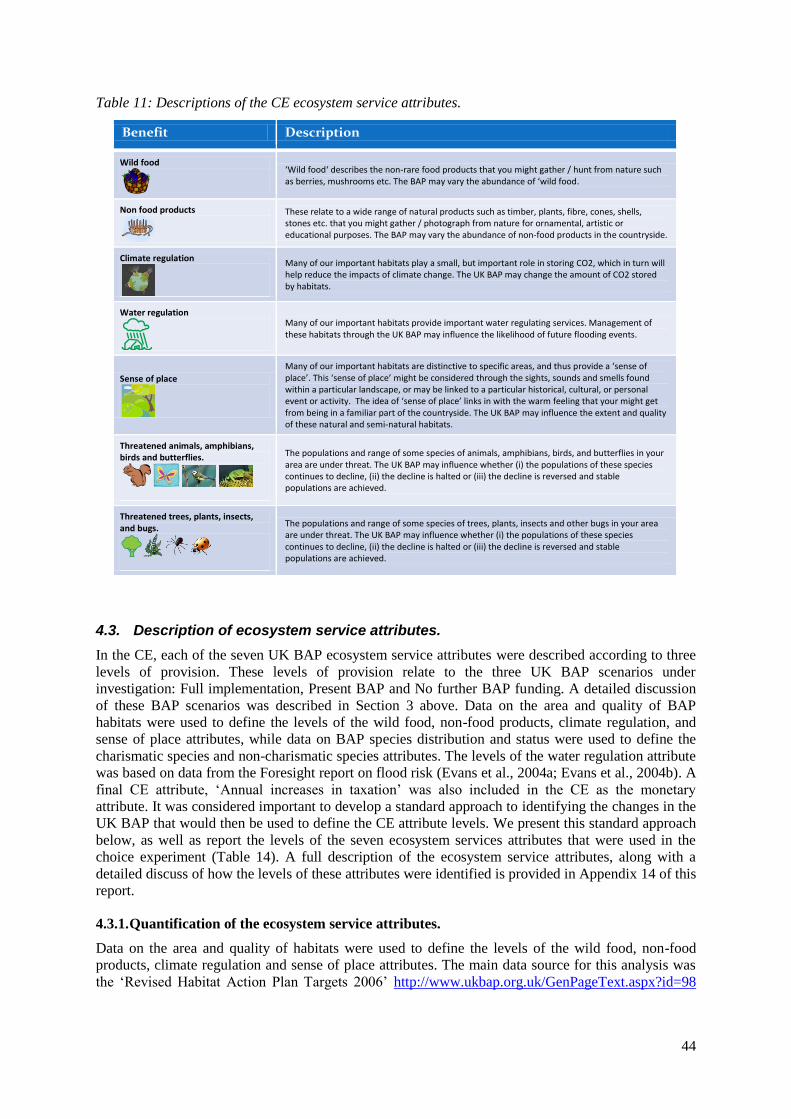
44
Table 11: Descriptions of the CE ecosystem service attributes.
4.3. Description of ecosystem service attributes.
In the CE, each of the seven UK BAP ecosystem service attributes were described according to three
levels of provision. These levels of provision relate to the three UK BAP scenarios under
investigation: Full implementation, Present BAP and No further BAP funding. A detailed discussion
of these BAP scenarios was described in Section 3 above. Data on the area and quality of BAP
habitats were used to define the levels of the wild food, non-food products, climate regulation, and
sense of place attributes, while data on BAP species distribution and status were used to define the
charismatic species and non-charismatic species attributes. The levels of the water regulation attribute
was based on data from the Foresight report on flood risk (Evans et al., 2004a; Evans et al., 2004b). A
final CE attribute, ‘Annual increases in taxation’ was also included in the CE as the monetary
attribute. It was considered important to develop a standard approach to identifying the changes in the
UK BAP that would then be used to define the CE attribute levels. We present this standard approach
below, as well as report the levels of the seven ecosystem services attributes that were used in the
choice experiment (Table 14). A full description of the ecosystem service attributes, along with a
detailed discuss of how the levels of these attributes were identified is provided in Appendix 14 of this
report.
4.3.1. Quantification of the ecosystem service attributes.
Data on the area and quality of habitats were used to define the levels of the wild food, non-food
products, climate regulation and sense of place attributes. The main data source for this analysis was
the ‘Revised Habitat Action Plan Targets 2006’ http://www.ukbap.org.uk/GenPageText.aspx?id=98
Benefit Description
Wild food
‘Wild food‘ describes the non-rare food products that you might gather / hunt from nature such as berries, mushrooms etc. The BAP may vary the abundance of ‘wild food.
Non food products
These relate to a wide range of natural products such as timber, plants, fibre, cones, shells, stones etc. that you might gather / photograph from nature for ornamental, artistic or educational purposes. The BAP may vary the abundance of non-food products in the countryside.
Climate regulation
Many of our important habitats play a small, but important role in storing CO2, which in turn will help reduce the impacts of climate change. The UK BAP may change the amount of CO2 stored by habitats.
Water regulation
Many of our important habitats provide important water regulating services. Management of these habitats through the UK BAP may influence the likelihood of future flooding events.
Sense of place
Many of our important habitats are distinctive to specific areas, and thus provide a ‘sense of place’. This ‘sense of place’ might be considered through the sights, sounds and smells found within a particular landscape, or may be linked to a particular historical, cultural, or personal event or activity. The idea of ‘sense of place’ links in with the warm feeling that your might get from being in a familiar part of the countryside. The UK BAP may influence the extent and quality of these natural and semi-natural habitats.
Threatened animals, amphibians, birds and butterflies.
The populations and range of some species of animals, amphibians, birds, and butterflies in your area are under threat. The UK BAP may influence whether (i) the populations of these species continues to decline, (ii) the decline is halted or (iii) the decline is reversed and stable populations are achieved.
Threatened trees, plants, insects, and bugs.
The populations and range of some species of trees, plants, insects and other bugs in your area are under threat. The UK BAP may influence whether (i) the populations of these species continues to decline, (ii) the decline is halted or (iii) the decline is reversed and stable populations are achieved.
45
(BRIG, 2006). For each BAP habitat within each country (England, Scotland, Wales and Northern
Ireland) and the UK as a whole, this data source provides target areas for:
Maintenance: the area of existing habitats to be conserved under BAP independent of
quality;
Condition: the area of habitat that is considered to be in ‘favourable’ condition as
defined by JNCC in their ‘Common Standards Monitoring Protocol for Designated
Sites’ report (Williams, 2006);
Restoration: the area of habitat where degraded examples of that habitat are returned to
“favourable” condition;
Expansion: the area of new habitat created in areas which lack the basic characteristics
of the habitat e.g. creating new grassland, woodland, etc. on arable land (we assume
that this new area would be in favourable condition).
The second data source used was the JNCC’s ‘Common Standards Monitoring Protocol for
Designated Sites’ report (Williams, 2006) which provides data on the condition of habitats. Of
particular relevance to this study is the data on the proportion of a habitat that was considered as
‘unfavourable recovering’ as this information provides an indication of the area of a habitat that is
currently benefiting from conservation activities2. This evidence was used to assess the area of
habitats that would be lost from favourable condition in the No further BAP funding scenario.
Unfortunately, neither of the above datasets provides information disaggregated to the English
regions. However, this level of disaggregation was considered desirable to allow more detailed
analysis. To address this issue, the following calculation was undertaken to estimate the areas of each
BAP habitat within each English region.
i. The ‘total’ area of each habitat type within each English region was estimated by
multiplying the proportion of each habitat type within that region (collated from
Countryside Survey 2000; Haines-Young et al., 2000) with the total area of that region
(from BARS data http://www.ukbap-reporting.org.uk/).
ii. Next the proportion of each habitat type covered by BAP in England was estimated by
dividing the area of each habitat under BAP in England (i.e. the English 'Maintenance'
area in the targets report: BRIG, 2006) with the total area of that habitat type across the
whole of England (from the BARS data).
iii. Finally, the area of each BAP habitat within each English region was estimated by
multiplying (i) and (ii) above.
Table 12 provides a summary of the calculated area of each BAP habitat by English region, country
and UK. The data for England, Scotland, Wales, Northern Ireland and the UK are robust. However, it
should be noted that the method used to estimate the area of BAP habitat within the nine English
regions produced a number of anomalies. For example, our method suggests that there is upland
heath, blanket bog, upland calcareous grassland and upland meadows in London, South East England
and East Anglia: clearly this is not the case. Therefore, we advise caution in the interpretation of the
English regional data.
2 It should be noted that the JNCC data relates to the condition of SSSIs and SACs which are not included
within BAP spend. It is likely that the condition of the BAP habitats would be worse than that of the protected
areas in the JNCC data. However, no comprehensive data exists on the condition of BAP habitats, and therefore
the condition of the SSSIs and SAC was used as an indicator of the likely condition of BAP habitats. Thus, for
each habitat type, the mean proportion of sites listed as ‘unfavourable recovering’ was used to indicate the
proportion of BAP habitat under this condition. Finally, it should also be noted that the JNCC habitats did not
always relate directly to the BAP habitats, so some interpretation was required to link the two datasets.
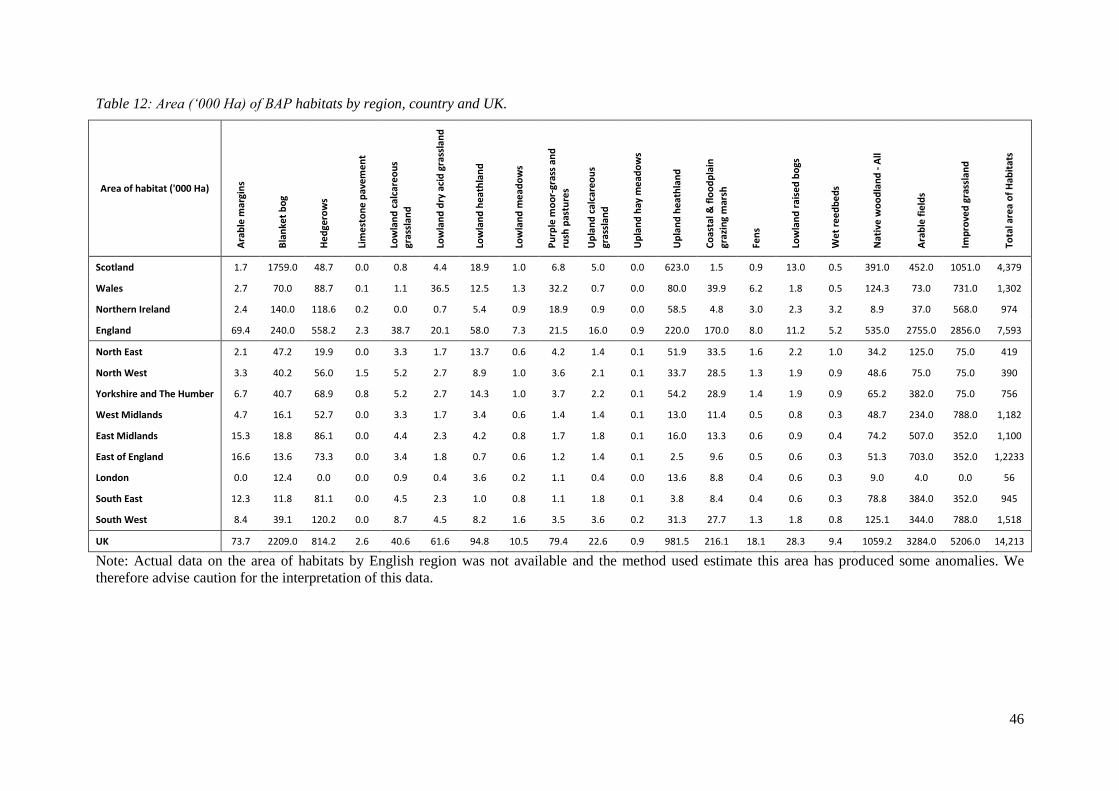
46
Table 12: Area (‘000 Ha) of BAP habitats by region, country and UK.
Area of habitat ('000 Ha)
Ara
ble
mar
gin
s
Bla
nke
t b
og
He
dge
row
s
Lim
est
on
e p
avem
en
t
Low
lan
d c
alca
reo
us
gras
slan
d
Low
lan
d d
ry a
cid
gra
ssla
nd
Low
lan
d h
eat
hla
nd
Low
lan
d m
ead
ow
s
Pu
rple
mo
or-
gras
s an
d
rush
pas
ture
s
Up
lan
d c
alca
reo
us
gras
slan
d
Up
lan
d h
ay m
ead
ow
s
Up
lan
d h
eath
lan
d
Co
asta
l & f
loo
dp
lain
graz
ing
mar
sh
Fen
s
Low
lan
d r
aise
d b
ogs
We
t re
ed
be
ds
Nat
ive
wo
od
lan
d -
All
Ara
ble
fie
lds
Imp
rove
d g
rass
lan
d
Tota
l are
a o
f H
abit
ats
Scotland 1.7 1759.0 48.7 0.0 0.8 4.4 18.9 1.0 6.8 5.0 0.0 623.0 1.5 0.9 13.0 0.5 391.0 452.0 1051.0 4,379
Wales 2.7 70.0 88.7 0.1 1.1 36.5 12.5 1.3 32.2 0.7 0.0 80.0 39.9 6.2 1.8 0.5 124.3 73.0 731.0 1,302
Northern Ireland 2.4 140.0 118.6 0.2 0.0 0.7 5.4 0.9 18.9 0.9 0.0 58.5 4.8 3.0 2.3 3.2 8.9 37.0 568.0 974
England 69.4 240.0 558.2 2.3 38.7 20.1 58.0 7.3 21.5 16.0 0.9 220.0 170.0 8.0 11.2 5.2 535.0 2755.0 2856.0 7,593
North East 2.1 47.2 19.9 0.0 3.3 1.7 13.7 0.6 4.2 1.4 0.1 51.9 33.5 1.6 2.2 1.0 34.2 125.0 75.0 419
North West 3.3 40.2 56.0 1.5 5.2 2.7 8.9 1.0 3.6 2.1 0.1 33.7 28.5 1.3 1.9 0.9 48.6 75.0 75.0 390
Yorkshire and The Humber 6.7 40.7 68.9 0.8 5.2 2.7 14.3 1.0 3.7 2.2 0.1 54.2 28.9 1.4 1.9 0.9 65.2 382.0 75.0 756
West Midlands 4.7 16.1 52.7 0.0 3.3 1.7 3.4 0.6 1.4 1.4 0.1 13.0 11.4 0.5 0.8 0.3 48.7 234.0 788.0 1,182
East Midlands 15.3 18.8 86.1 0.0 4.4 2.3 4.2 0.8 1.7 1.8 0.1 16.0 13.3 0.6 0.9 0.4 74.2 507.0 352.0 1,100
East of England 16.6 13.6 73.3 0.0 3.4 1.8 0.7 0.6 1.2 1.4 0.1 2.5 9.6 0.5 0.6 0.3 51.3 703.0 352.0 1,2233
London 0.0 12.4 0.0 0.0 0.9 0.4 3.6 0.2 1.1 0.4 0.0 13.6 8.8 0.4 0.6 0.3 9.0 4.0 0.0 56
South East 12.3 11.8 81.1 0.0 4.5 2.3 1.0 0.8 1.1 1.8 0.1 3.8 8.4 0.4 0.6 0.3 78.8 384.0 352.0 945
South West 8.4 39.1 120.2 0.0 8.7 4.5 8.2 1.6 3.5 3.6 0.2 31.3 27.7 1.3 1.8 0.8 125.1 344.0 788.0 1,518
UK 73.7 2209.0 814.2 2.6 40.6 61.6 94.8 10.5 79.4 22.6 0.9 981.5 216.1 18.1 28.3 9.4 1059.2 3284.0 5206.0 14,213
Note: Actual data on the area of habitats by English region was not available and the method used estimate this area has produced some anomalies. We
therefore advise caution for the interpretation of this data.
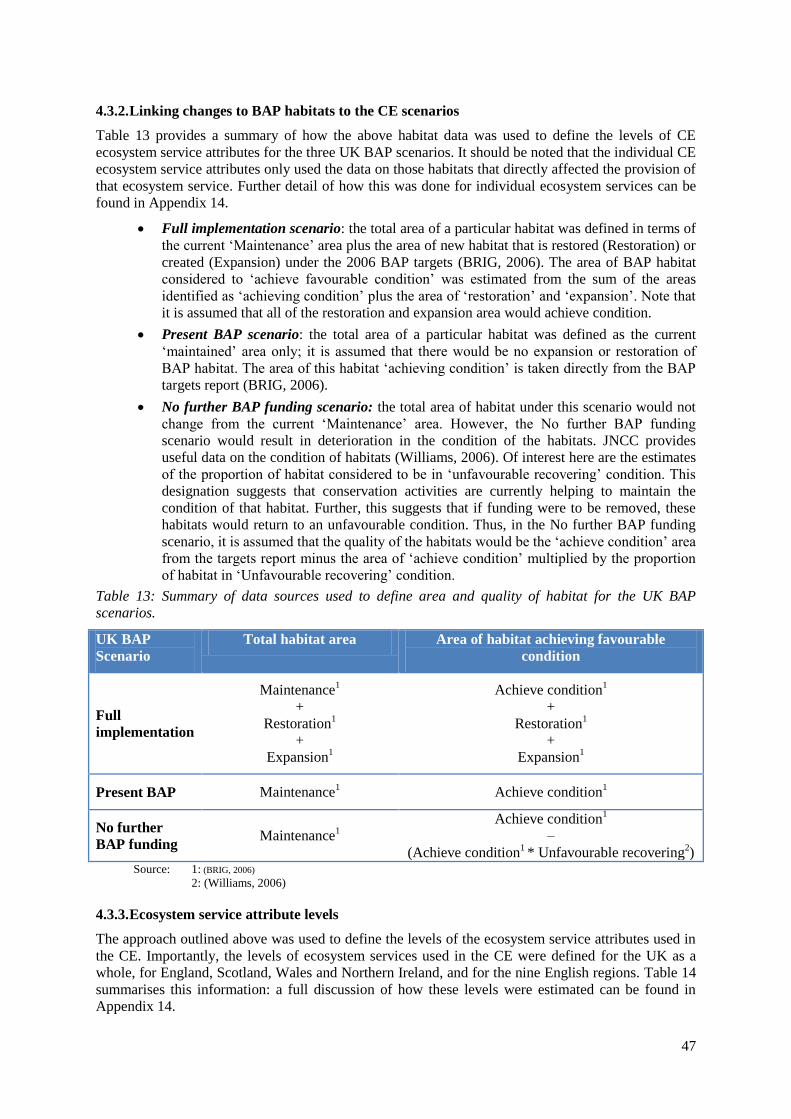
47
4.3.2. Linking changes to BAP habitats to the CE scenarios
Table 13 provides a summary of how the above habitat data was used to define the levels of CE
ecosystem service attributes for the three UK BAP scenarios. It should be noted that the individual CE
ecosystem service attributes only used the data on those habitats that directly affected the provision of
that ecosystem service. Further detail of how this was done for individual ecosystem services can be
found in Appendix 14.
Full implementation scenario: the total area of a particular habitat was defined in terms of
the current ‘Maintenance’ area plus the area of new habitat that is restored (Restoration) or
created (Expansion) under the 2006 BAP targets (BRIG, 2006). The area of BAP habitat
considered to ‘achieve favourable condition’ was estimated from the sum of the areas
identified as ‘achieving condition’ plus the area of ‘restoration’ and ‘expansion’. Note that
it is assumed that all of the restoration and expansion area would achieve condition.
Present BAP scenario: the total area of a particular habitat was defined as the current
‘maintained’ area only; it is assumed that there would be no expansion or restoration of
BAP habitat. The area of this habitat ‘achieving condition’ is taken directly from the BAP
targets report (BRIG, 2006).
No further BAP funding scenario: the total area of habitat under this scenario would not
change from the current ‘Maintenance’ area. However, the No further BAP funding
scenario would result in deterioration in the condition of the habitats. JNCC provides
useful data on the condition of habitats (Williams, 2006). Of interest here are the estimates
of the proportion of habitat considered to be in ‘unfavourable recovering’ condition. This
designation suggests that conservation activities are currently helping to maintain the
condition of that habitat. Further, this suggests that if funding were to be removed, these
habitats would return to an unfavourable condition. Thus, in the No further BAP funding
scenario, it is assumed that the quality of the habitats would be the ‘achieve condition’ area
from the targets report minus the area of ‘achieve condition’ multiplied by the proportion
of habitat in ‘Unfavourable recovering’ condition.
Table 13: Summary of data sources used to define area and quality of habitat for the UK BAP
scenarios.
UK BAP
Scenario
Total habitat area Area of habitat achieving favourable
condition
Full
implementation
Maintenance1
+
Restoration1
+
Expansion1
Achieve condition1
+
Restoration1
+
Expansion1
Present BAP Maintenance1
Achieve condition1
No further
BAP funding Maintenance
1
Achieve condition1
–
(Achieve condition1 * Unfavourable recovering
2)
Source: 1: (BRIG, 2006)
2: (Williams, 2006)
4.3.3. Ecosystem service attribute levels
The approach outlined above was used to define the levels of the ecosystem service attributes used in
the CE. Importantly, the levels of ecosystem services used in the CE were defined for the UK as a
whole, for England, Scotland, Wales and Northern Ireland, and for the nine English regions. Table 14
summarises this information: a full discussion of how these levels were estimated can be found in
Appendix 14.
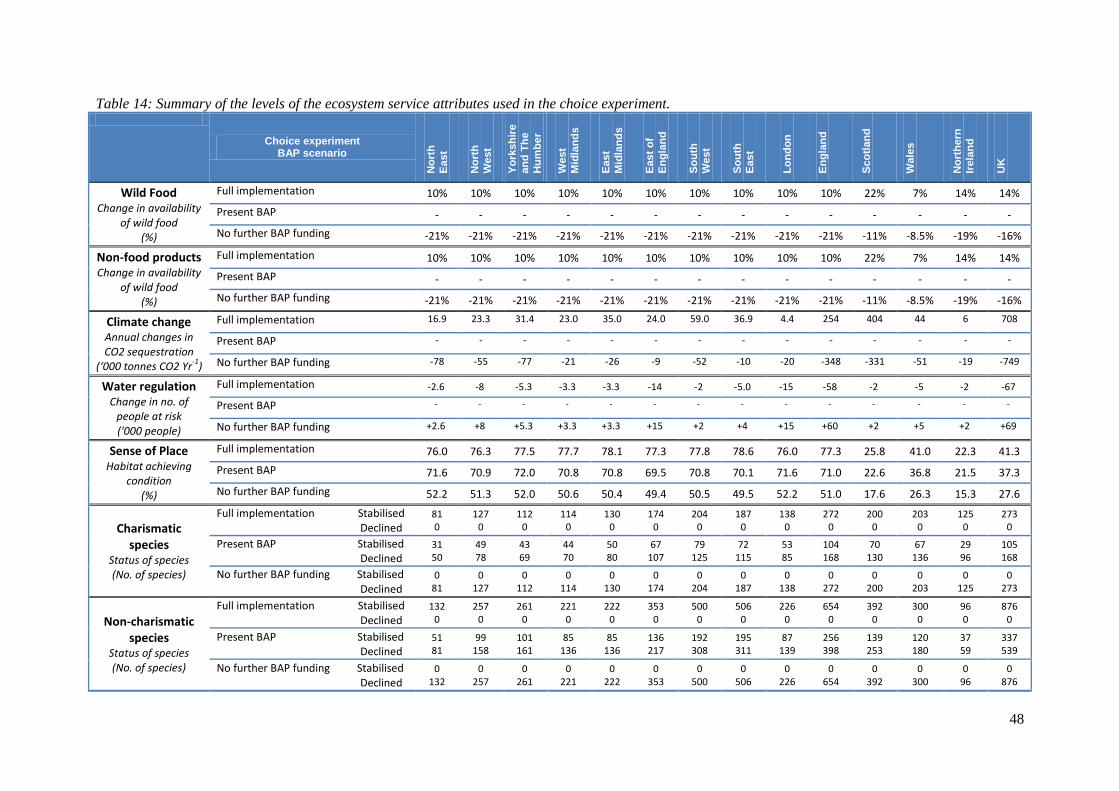
48
Table 14: Summary of the levels of the ecosystem service attributes used in the choice experiment.
Choice experiment BAP scenario
No
rth
E
ast
No
rth
West
Yo
rksh
ire
an
d T
he
Hu
mb
er
West
Mid
lan
ds
East
Mid
lan
ds
East
of
En
gla
nd
So
uth
W
est
So
uth
E
ast
Lo
nd
on
En
gla
nd
Sco
tlan
d
Wale
s
No
rth
ern
Irela
nd
UK
Wild Food Change in availability
of wild food (%)
Full implementation 10% 10% 10% 10% 10% 10% 10% 10% 10% 10% 22% 7% 14% 14%
Present BAP - - - - - - - - - - - - - -
No further BAP funding -21% -21% -21% -21% -21% -21% -21% -21% -21% -21% -11% -8.5% -19% -16%
Non-food products Change in availability
of wild food (%)
Full implementation 10% 10% 10% 10% 10% 10% 10% 10% 10% 10% 22% 7% 14% 14%
Present BAP - - - - - - - - - - - - - -
No further BAP funding -21% -21% -21% -21% -21% -21% -21% -21% -21% -21% -11% -8.5% -19% -16%
Climate change Annual changes in CO2 sequestration
(‘000 tonnes CO2 Yr-1
)
Full implementation 16.9 23.3 31.4 23.0 35.0 24.0 59.0 36.9 4.4 254 404 44 6 708
Present BAP - - - - - - - - - - - - - -
No further BAP funding -78 -55 -77 -21 -26 -9 -52 -10 -20 -348 -331 -51 -19 -749
Water regulation Change in no. of
people at risk ('000 people)
Full implementation -2.6 -8 -5.3 -3.3 -3.3 -14 -2 -5.0 -15 -58 -2 -5 -2 -67
Present BAP - - - - - - - - - - - - - -
No further BAP funding +2.6 +8 +5.3 +3.3 +3.3 +15 +2 +4 +15 +60 +2 +5 +2 +69
Sense of Place Habitat achieving
condition (%)
Full implementation 76.0 76.3 77.5 77.7 78.1 77.3 77.8 78.6 76.0 77.3 25.8 41.0 22.3 41.3
Present BAP 71.6 70.9 72.0 70.8 70.8 69.5 70.8 70.1 71.6 71.0 22.6 36.8 21.5 37.3
No further BAP funding 52.2 51.3 52.0 50.6 50.4 49.4 50.5 49.5 52.2 51.0 17.6 26.3 15.3 27.6
Charismatic species
Status of species (No. of species)
Full implementation Stabilised Declined
81 0
127 0
112 0
114 0
130 0
174 0
204 0
187 0
138 0
272 0
200 0
203 0
125 0
273 0
Present BAP Stabilised Declined
31 50
49 78
43 69
44 70
50 80
67 107
79 125
72 115
53 85
104 168
70 130
67 136
29 96
105 168
No further BAP funding Stabilised Declined
0 81
0 127
0 112
0 114
0 130
0 174
0 204
0 187
0 138
0 272
0 200
0 203
0 125
0 273
Non-charismatic species
Status of species (No. of species)
Full implementation Stabilised Declined
132 0
257 0
261 0
221 0
222 0
353 0
500 0
506 0
226 0
654 0
392 0
300 0
96 0
876 0
Present BAP Stabilised Declined
51 81
99 158
101 161
85 136
85 136
136 217
192 308
195 311
87 139
256 398
139 253
120 180
37 59
337 539
No further BAP funding Stabilised Declined
0 132
0 257
0 261
0 221
0 222
0 353
0 500
0 506
0 226
0 654
0 392
0 300
0 96
0 876
49
4.4. Data derived from the choice experiment
The choice experiment was used to estimate the economic value of the ecosystem services provided
by UK BAP habitats. Values were estimated for three BAP scenarios: Full implementation of the UK
BAP, Present BAP and No further BAP spend. We again stress that these values relate to the services
provided by the habitats included within the UK BAP, but do not necessarily reflect the value of
changes to the provision of ecosystem services that are directly attributable to expenditure on the UK
BAP. This assessment will be made in Step 3 when we combine the CE valuation data with the
weighting scores from the weighting matrix (more detail on this is provided in Section 6).
The choice experiment data was collected across 12 regions of the UK: Scotland, Wales, Northern
Ireland and 9 English regions. Thus, we are able to provide estimates of the value of ecosystem
services at the UK national level, at the country level (England, Scotland, Northern Ireland and
Wales), and by the 12 sub-regions. Note, however, that the approached used to derive the areas of the
different habitats within the nine English regions have produced a number of anomalies (see Section
4.3.1) and therefore we advise caution in interpreting the English results at a regional basis.
The CE also provides data on the value of ecosystem services within the respondent’s ‘own region’
and outside the respondent’s own region ‘rest of UK’). This analysis is reported in Sections 7.3 and
7.4 respectively. Splitting the valuation data in this way allows us to account for an element of
distance decay, which is important for the aggregation of the data. This aggregation is reported in
Section 7.5.
Finally, it is highlighted that the CE valuation data is based on the ecosystem services delivered by all
BAP habitats. Thus, the CE data does not directly provide evidence of the value of individual BAP
habitats. Such data is derived in Step 3 by allocating values to habitats through the weighting scores
from the weighting matrix.
50
5. Step 2: The Weighting Matrix: Assigning ecosystem services to BAP habitats
Step 2 of the research protocol (see Figure 1 in Section 1.1) aimed to provide a quantitative
assessment of the levels of ecosystem services delivered by different UK BAP habitats. There are,
however, a number of challenges to this task: how to best quantify the links between BAPs and
ecosystem services; how to best capture this complex and uncertain information from experts;
identification of an appropriate perspective to undertake this assessment; dealing with issues of scale;
and how to incorporate species BAP (see Section 2.2.1 for a discussion of these challenges). To
investigate possible approaches to addressing these challenges, a series of stakeholder workshops and
an iterative Delphi study were undertaken during an explorative phase of the research (see Christie et
al., 2008b for details). The ‘solution’ from this exercise was our ‘weighting matrix’.
Our weighting matrix (WM) is essentially an MS Excel spreadsheet application that guides ecological
‘experts’ through a series of ‘steps’ that allow them to provide an assessment of the levels of
ecosystem services delivered by different BAP habitats. The output from the WM is a series of
‘weighting scores’ which reflect the relative contribution that the different BAP habitats have for the
delivery of a range of ecosystem services. Importantly, the weighting scores are consistent across all
habitats and services investigated, thus enabling direct comparison across the entire matrix. in which
expert knowledge to assess the ecosystem services delivered by the UK BAP.
The WM comprises seven ‘steps’ that allow ecological experts to impart their knowledge on the levels
of ecosystem services delivered by different BAP habitats:
Step 1: In this first step, the experts identified the three BAP habitats that they were most
familiar with (from a list of 19 habitats). The experts then focused on only these three habitats
for the remainder of the exercise: this helps to ensure that the experts were reporting on
habitats that they are familiar with, as well as reducing potential issues of respondent fatigue.
Steps 2 and 3: The WM utilises a multi-perspective3 scoring procedure to estimate habitat :
ecosystem service ‘weighting scores’. First, experts were asked to rate the habitats they are
familiar with in terms of their contribution to ecosystem services (a service perspective: Step
2). This was followed by a second rating exercise which asked the experts to rate the
provision of services within each habitat (a habitats perspective: Step 3).
Step 4: The rating scores from Steps 2 and 3 were then averaged to generate a mean
weighting score for each BAP habitat : ecosystem service relationship. These weighting
scores could range from ‘0’ = no service provision to ‘1’ = full service provision. In Step 4,
these mean weighting scores were presented back to the experts for review, and if necessary
the experts were provided with an opportunity to modify any scores that they are unhappy
with. The experts were required to confirm that they were happy with the weighting scores
before they could proceed to Step 5.
Step 5: The experts were then asked to consider what impact removing BAP conservation
activities might have on the provision of ecosystem services. This was achieved by measuring
the percentage change in service provision from BAP being in ‘favourable’ condition to
‘unfavourable’ condition.
Step 6: The experts were asked to review their weighting scores from Step 5 and either
modify or confirm these scores.
Step 7: In the final step, the experts are asked to review the WM as a tool and express their
overall level of confidence in their weighting scores.
3 See Haines-Young and Potschin (2008) for a detailed discussion of the ‘habitats’, ‘service’ and ‘place’
perspectives for assigning ecosystem services to habitats.
51
To help validate the results from the WM, an expert workshop was organised to provide a peer-review
of the weighting scores. A copy of the ‘Instructions for completing the weighting matrix’ can be
found in Appendix 16.
The weighting matrix was developed to provide sufficiently detailed information on the ecosystem
services delivered by the UK BAP to allow a comprehensive valuation of the UK BAP. In particular:
The ecosystem services examined in the weighting matrix included all of the ecosystem
service attributes examined in the choice experiment (see Section 4); thus enabling direct
comparison between these two data source.
The habitats examined in the matrix were based on the 17 terrestrial broad habitats listed in
the new UK BAP (BRIG, 2006). Although it could be argued that the matrix should
examine all 65 priority habitats, it was considered that the ecosystem services delivery by
priority habitats listed within a particular broad habitat would be similar. Therefore, it was
considered that a focus on priority habitats would not add any real improvements to the
data. Further, a focus on priority habitats would add complexity and possible respondent
fatigue to the exercise.
In addition to the BAP broad habitats, two other habitats were also included in the
weighting matrix: Arable fields and Improved grassland. The reason for including these
habitats in the matrix was that many of the conservation activities that target the BAP
widespread species action plans take place on agricultural land, e.g. agri-environmental
schemes. It was thus considered desirable to assess the levels of ecosystem services
delivered by BAP activities within these two habitats.
Species action plans are dealt with in two ways.
o First, the widespread species will be represented by the ‘Arable margins’,
Hedgerows’ and ‘Native woodland’ BAP broad habitats and the Arable fields and
Improved grassland habitats. The reasoning for this assumption is that most of the
expenditure on widespread species relates to spend on agri-environment and
woodland schemes (GHK Consulting Ltd., 2006). There is also a case to include
the more ‘biodiversity-rich’ grassland habitats under the widespread species
actions; however, this may lead to double counting of benefits.
o Second, data collected in the stakeholder focus groups and the Delphi study
suggested that in many cases the individual species are rare and action plans were
unlikely to deliver easily detectable ecosystem services other than cultural services
(e.g. threatened BAP species). Given this, it was concluded that the individual
species action plans would not be considered in the weighting matrix; but that their
value would come directly from the cultural service attributes in the choice
experiment.
Another key feature of the weighting matrix is that it utilises a multi-perspective scoring procedure to
estimate ‘weighting scores’. First, experts are asked to rate the habitats they are familiar with in terms
of their contribution to ecosystem services (a service perspective: Step 2 in the matrix). This is
followed by a second rating exercise which asks the experts to rate the provision of services within
each habitat (a habitats perspective: Step 3 in the matrix). The two rating exercises are then averaged
to generate a weighting score for each BAP habitat – ecosystem service interactions. These average
scores are reviewed by the experts in Step 4 of the matrix. Feedback from the participants of the
Delphi study indicated that this two-stage approach was very helpful in thinking about the habitat –
ecosystem services links. Further, the adoption of the multi-perspective assessment procedure
overcomes some of the limitations associated with the adoption of a single perspective. Finally, it
should be noted that to ensure that we attain meaningful and valid results (and to reduce respondent
fatigue) the experts were only be asked to consider the three habitats that they are most familiar with.
The matrix also allows the quantification of ‘weighting scores’ that reflect the extent to which BAPs
deliver ecosystem services: existing matrices tend to be restricted to a qualitative assessment of this.
52
Quantification is important as it will allow more meaningful linkages to be made between the
ecosystems delivered through BAPs and the economic valuation of those ecosystem services. It
should be noted that the ecosystem services examined in the matrix link directly to those services
considered in the choice experiment (see Section 4); the exceptions to this is that the weighting matrix
included a ‘commercial food’ service (which was excluded in the choice experiment since this is a
market good) and a ‘pollination’ service (which was not included in the choice experiment as it was
considered too complex for the public to value).
Another important aspect of the weighting matrix is that it explicitly asks the experts to identify the
levels of ecosystem services that are directly attributable to the conservation activities associated with
the UK BAP (Step 5). Specifically, experts are asked to ‘indicate the percentage change in ecosystem
service provision that would result from a withdrawal of activities associated with BAPs’. This
question has been included to allow us to ‘convert’ the ecosystem services values from the choice
experiment (which aims to elicit the value of services from the UK BAP habitats) to the value of
services that are directly attributable to the UK BAP conservation activities.
Our weighting matrix also explicitly accounts for uncertainty both in terms of expert’s knowledge and
the level of consensus. Further, the matrix also incorporates feedback loops that encourage reflective
learning. Thus, within the matrix the experts are provided with an opportunity to review their
weighting coefficients and then modify their scores – see Step 4 and Steps 6(a – c). Also, Step 7
provides an opportunity for the experts to provide more general feedback on their confidence with
completing the matrix and the resultant weighting coefficients. This information was used to explore
whether levels of confidence affected average weighting coefficients and if necessary weighting
scores could be weighting to those experts with the highest levels of confidence. Such an approach is
useful to helps improve the level of confidence that we have in our results.
The habitat : ecosystem service weighting scores estimated in the weighting matrix were therefore
used to allocate the total value of ecosystem services from the UK BAP habitats across the 19 BAP
habitats investigated, as well as identify the proportion of services provided by these habitats that can
be directly attributable to the UK BAP conservation activities.
53
6. Step 3: Estimation of the value of ecosystem services directly attributable to the UK BAP.
The final step in our analysis was to combine the CE data on the value of the ecosystem services
provided by the BAP habitats with the ‘weighting scores’ from the weighting matrix. Key elements of
this analysis include the following.
First, we use the weighting scores from the weighting matrix to allocate the ecosystem service values
from the choice experiment across the 19 BAP habitats. This produced value estimates for each
habitat for two marginal changes in the BAP:
Increasing spend to meet the revised BAP targets: i.e. the CE ‘Present BAP’ scenario – the
CE ‘No Further BAP funding’ scenario;
Maintain current levels of spend on the UK BAP: the CE ‘Full BAP’ scenario – the CE
‘Present BAP scenario’.
This analysis is reported in Section 9.1
The data from the weighting matrix was also used to identify and quantify the value of ecosystem
services provided by BAP habitats that are directly attributable to the conservation activities
associated with the UK BAP expenditure. This step, reported in Section 9.2, is of fundamental
importance to this research since it allowed us to directly compare UK BAP expenditure with the
value of the services that are delivered as a direct consequence of that expenditure.
The data also allows us to estimate the value of each of the seven ecosystem services delivered by
each of the 19 habitat investigated within each of the 12 regions (see Section 9.3). Thus, we argue that
this research produces one of the most comprehensive, spatial assessments of the value of ecosystem
services delivered across a range of habitat types. Further, since this data is generated using a single
research protocol, we argue that the data is (at a minimum) internally consistent and therefore reliable.
The final step of the analysis was to undertake a series of indicative cost benefit analysis (CBA) that
compares the value of ecosystem services delivered by the UK BAP with current and future
expenditures on the UK BAP (Section 9.4). The CBA examines the UK BAP as a whole, as well as
separately for the Habitat Action Plans, the widespread Species Action Plans and the single Species
Action Plans. It should however be noted that a comprehensive CBA of the UK BAP is out with the
scope of this project and therefore the CBAs reported are largely for illustrative purposes rather than
being robust estimates for use in policy analysis.

54
Results
In this section, we report the finding from the three ‘Steps’ of the research protocol. The results from
the choice experiment (Step 1) are reported in Section 7, while those from the weighting matrix (Step
2) are reported in Section 8. Finally, the results from Step 3 (which includes our cost-benefit analysis)
is reported in Section 9.
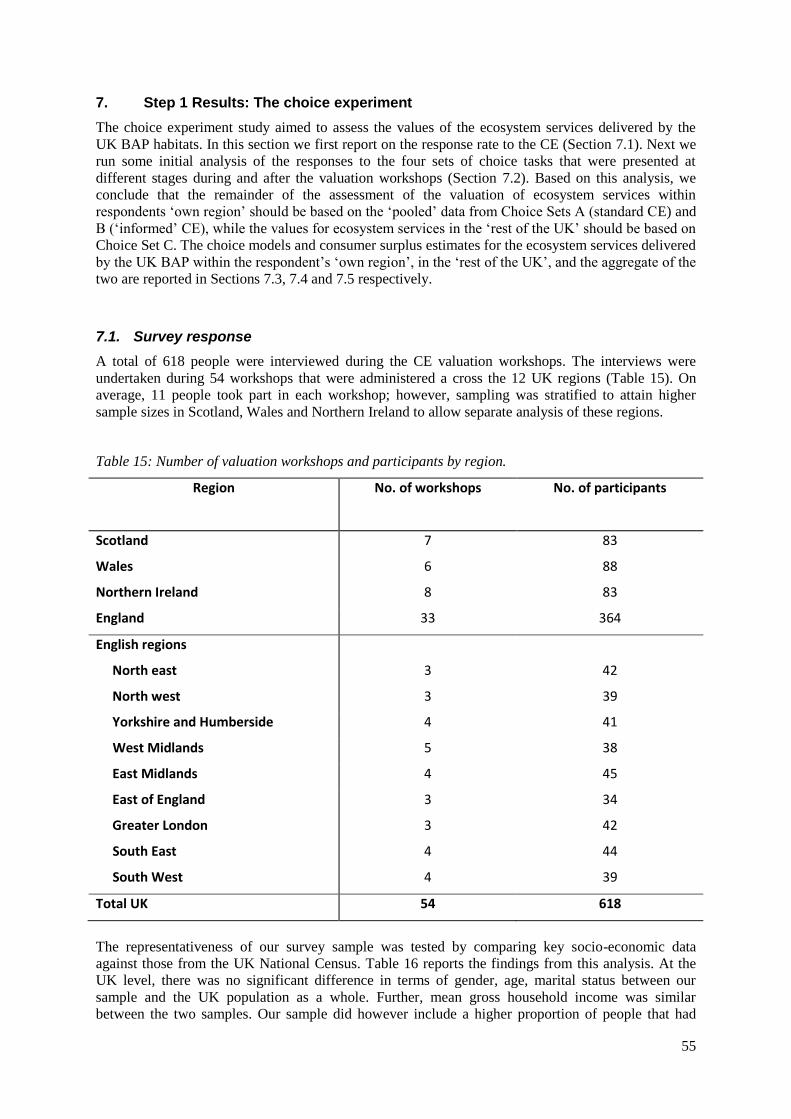
55
7. Step 1 Results: The choice experiment
The choice experiment study aimed to assess the values of the ecosystem services delivered by the
UK BAP habitats. In this section we first report on the response rate to the CE (Section 7.1). Next we
run some initial analysis of the responses to the four sets of choice tasks that were presented at
different stages during and after the valuation workshops (Section 7.2). Based on this analysis, we
conclude that the remainder of the assessment of the valuation of ecosystem services within
respondents ‘own region’ should be based on the ‘pooled’ data from Choice Sets A (standard CE) and
B (‘informed’ CE), while the values for ecosystem services in the ‘rest of the UK’ should be based on
Choice Set C. The choice models and consumer surplus estimates for the ecosystem services delivered
by the UK BAP within the respondent’s ‘own region’, in the ‘rest of the UK’, and the aggregate of the
two are reported in Sections 7.3, 7.4 and 7.5 respectively.
7.1. Survey response
A total of 618 people were interviewed during the CE valuation workshops. The interviews were
undertaken during 54 workshops that were administered a cross the 12 UK regions (Table 15). On
average, 11 people took part in each workshop; however, sampling was stratified to attain higher
sample sizes in Scotland, Wales and Northern Ireland to allow separate analysis of these regions.
Table 15: Number of valuation workshops and participants by region.
Region No. of workshops No. of participants
Scotland 7 83
Wales 6 88
Northern Ireland 8 83
England 33 364
English regions
North east 3 42
North west 3 39
Yorkshire and Humberside 4 41
West Midlands 5 38
East Midlands 4 45
East of England 3 34
Greater London 3 42
South East 4 44
South West 4 39
Total UK 54 618
The representativeness of our survey sample was tested by comparing key socio-economic data
against those from the UK National Census. Table 16 reports the findings from this analysis. At the
UK level, there was no significant difference in terms of gender, age, marital status between our
sample and the UK population as a whole. Further, mean gross household income was similar
between the two samples. Our sample did however include a higher proportion of people that had
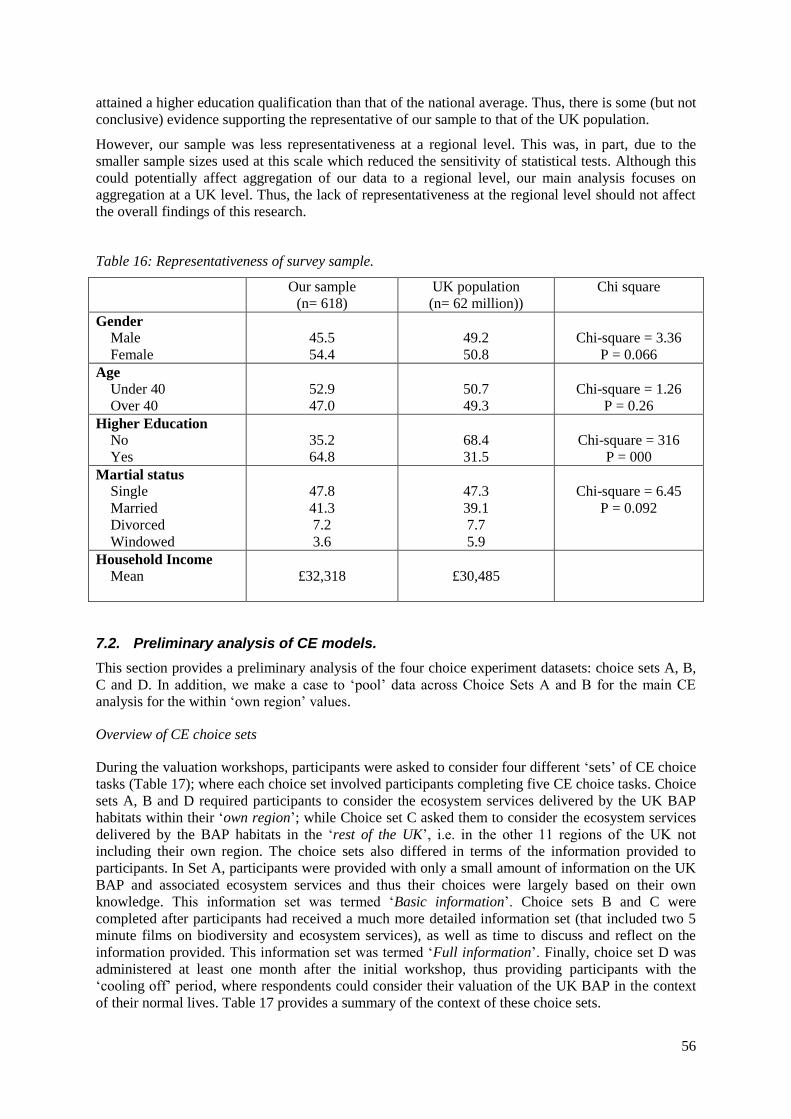
56
attained a higher education qualification than that of the national average. Thus, there is some (but not
conclusive) evidence supporting the representative of our sample to that of the UK population.
However, our sample was less representativeness at a regional level. This was, in part, due to the
smaller sample sizes used at this scale which reduced the sensitivity of statistical tests. Although this
could potentially affect aggregation of our data to a regional level, our main analysis focuses on
aggregation at a UK level. Thus, the lack of representativeness at the regional level should not affect
the overall findings of this research.
Table 16: Representativeness of survey sample.
Our sample
(n= 618)
UK population
(n= 62 million))
Chi square
Gender
Male
Female
45.5
54.4
49.2
50.8
Chi-square = 3.36
P = 0.066
Age
Under 40
Over 40
52.9
47.0
50.7
49.3
Chi-square = 1.26
P = 0.26
Higher Education
No
Yes
35.2
64.8
68.4
31.5
Chi-square = 316
P = 000
Martial status
Single
Married
Divorced
Windowed
47.8
41.3
7.2
3.6
47.3
39.1
7.7
5.9
Chi-square = 6.45
P = 0.092
Household Income
Mean
£32,318
£30,485
7.2. Preliminary analysis of CE models.
This section provides a preliminary analysis of the four choice experiment datasets: choice sets A, B,
C and D. In addition, we make a case to ‘pool’ data across Choice Sets A and B for the main CE
analysis for the within ‘own region’ values.
Overview of CE choice sets
During the valuation workshops, participants were asked to consider four different ‘sets’ of CE choice
tasks (Table 17); where each choice set involved participants completing five CE choice tasks. Choice
sets A, B and D required participants to consider the ecosystem services delivered by the UK BAP
habitats within their ‘own region’; while Choice set C asked them to consider the ecosystem services
delivered by the BAP habitats in the ‘rest of the UK’, i.e. in the other 11 regions of the UK not
including their own region. The choice sets also differed in terms of the information provided to
participants. In Set A, participants were provided with only a small amount of information on the UK
BAP and associated ecosystem services and thus their choices were largely based on their own
knowledge. This information set was termed ‘Basic information’. Choice sets B and C were
completed after participants had received a much more detailed information set (that included two 5
minute films on biodiversity and ecosystem services), as well as time to discuss and reflect on the
information provided. This information set was termed ‘Full information’. Finally, choice set D was
administered at least one month after the initial workshop, thus providing participants with the
‘cooling off’ period, where respondents could consider their valuation of the UK BAP in the context
of their normal lives. Table 17 provides a summary of the context of these choice sets.
57
Table 17: Context of choice experiment choice sets
Choice Set Location of biodiversity evaluated Information set
A Own region Basic information
B Own region Full information
C Rest of UK Full information
D Own region Cooling off
Data censoring
Before analysing the CE data, it is first important to filter the data to remove choice responses that are
considered as ‘protest bids’ or that do not demonstrate compensatory choice strategies. This was
achieved based on responses to Question 9 (for choice set A) and Question 14 (for Choice Set B and
C). Protest responses were identified as those respondents that indicated ‘I chose the baseline plan
because I don’t want to pay more tax’. Non-compensatory choices included those respondents that
indicated ‘I chose randomly’ or ‘I chose the plan that appeared to provide the greatest overall
benefits irrespective of costs’. Overall, 117 respondents (28.6%) were removed in Choice Set A, 157
respondents (25.4%) were removed from choice Sets B and C, and 11 respondents (19.3%) from
Choice Set D. Thus, choices from 441 respondents were included in the analysis of Choice Set A, 461
respondents were included in the analysis of Choice Sets B and C, and 46 respondents from Choice
Set D.
7.2.1. Analysis of Choice Sets, A, B, C and D
Table 18 reports the conditional logit choice models for the four censored choice sets (A, B C and D),
as well as a ‘pooled’ ‘A + B’ choice set. Choice set A includes 2205 genuine choice tasks from 441
participants across the entire UK sample, while sets B and C are based on 2305 choice tasks from 461
participants. The ‘pooled’ A + B choice set is most of the choice tasks included in Choice set A and
B; a small number of inconsistent choices were removed from sample. Finally, Choice Set D is based
on the 210 choice tasks from the 46 participants who responded to the follow-up questionnaire.
In the choice models, the dependant variable is the chosen CE scenario. The CE ecosystem service
attributes (wild food, non-food products, climate regulation, water regulation, sense of place,
charismatic species and non-charismatic species) were all specified at three levels of provisions: No
BAP, Present BAP and Full BAP (see Section 4.3 for details). In the choice model, these attributes
were included in the model using effects coding (Bech and Gyrd-Hansen, 2005). Table 18 reports the
coefficients for the ‘No BAP’ and ‘Full BAP’ scenarios: these are presented relative to the ‘Present
BAP’ baseline scenario. The ‘cost’ attribute was included in the model as a continuous variable.
Generally, the ecosystem service attributes are significant (p=0.01) in the choice models for choice set
A (Basic information) and choice set B (Detailed information): the exceptions being wild food and
non-food products attributes under the Full BAP scenario in the choice set A model (which are
significant at p=0.1) (Table 18). The sign of the attribute coefficients are as expected: the coefficient
is negative for reductions in the delivery of ecosystem services (i.e. the No BAP scenario), while the
coefficients are positive for an increase in ecosystem service provision (i.e. the Full BAP scenarios).
Also, and importantly, the sign of the cost is significant and negative indicating that participants were
less likely to choose an option that had a higher cost. It is also useful to note that the sizes of the
coefficients are similar between choice sets A and B. This indicates that the provision of more
58
information in choice set B did not significantly affect the choices made by participants4. Choice set C
(Rest of UK) follows a similar pattern to choice sets A and B, but the ‘Full implementation BAP’
scenarios for Non-food products and Non-charismatic species are not significant in the model. The
model based on choice set D (cooling off) performs less well than the other models, with only the wild
food, climate regulation, charismatic species and cost being significant. However, much of this poor
performance can be attributed to the low sample size used in this model. Overall, all of the models
demonstrate a good fit to the data (Rho2 = 0.15, 0.14, 0.13 and 0.18 for choice set A, B, C and D
respectively).
Making a case to pool Choice Sets A and B.
A potential issue for the analysis of the choice models, particularly for analysis at the regional level, is
the small sample sizes: regional sample sizes ranged from 88 participants in Wales down to 34 in the
East of England (see Table 15). To help overcome this potential problem, it was considered desirable
to ‘pool’ choice data across the different choice sets so as to increase the number of observed choices
per individual. In this context, it is proposed that choice sets A and B are pooled5.
A number of tests were conducted to examine whether the different information sets provided for
Choice Sets A and B affected respondent’s choices: see Section 10.1.1 for further detail. Generally,
consistent preferences were found between Choice Set A and B. Analysis, however, identified 20
respondents who did change their preferences between the choice sets. Thus, the ‘pooled’ A + B
dataset used in the main analysis included all choice tasks from Choice Sets A and B where consistent
choices were found, but only the data from Choice Set B where respondents were found to change
their preferences between choice sets. Thus the ‘pooled’ A + B dataset comprised 4510 choice tasks:
from 461 respondents (of which Choice Set A was removed for 20 respondents).
This censored ‘pooled’ A + B model is reported in Table 18. In the Pooled A+B models, all of the
choice experiment attributes are significant in the model and of the expected sign. The pooled model’s
Rho2 = 0.14, which suggests that the data is a reasonably good fit to the model. Given the larger
sample size in the pooled model, it is argued that for remainder of this report, the analysis of choices
within participant’s own region should be based on the censored pooled choice sets A + B. The
analysis of the choices in the ‘rest of the UK’ is based on Choice set C.
4 A more comprehensive analysis of the influence on information on values is reported in Section 10.1.1. This analysis
confirms the observation that information, generally, did not affect respondent’s choices. 5 Choice set C was not included in the pooled sample since it related to the UK BAP in the rest of the UK rather than within
the respondent’s own region. Further, Choice set D was not included as it comprised only a sub-set of all respondents.
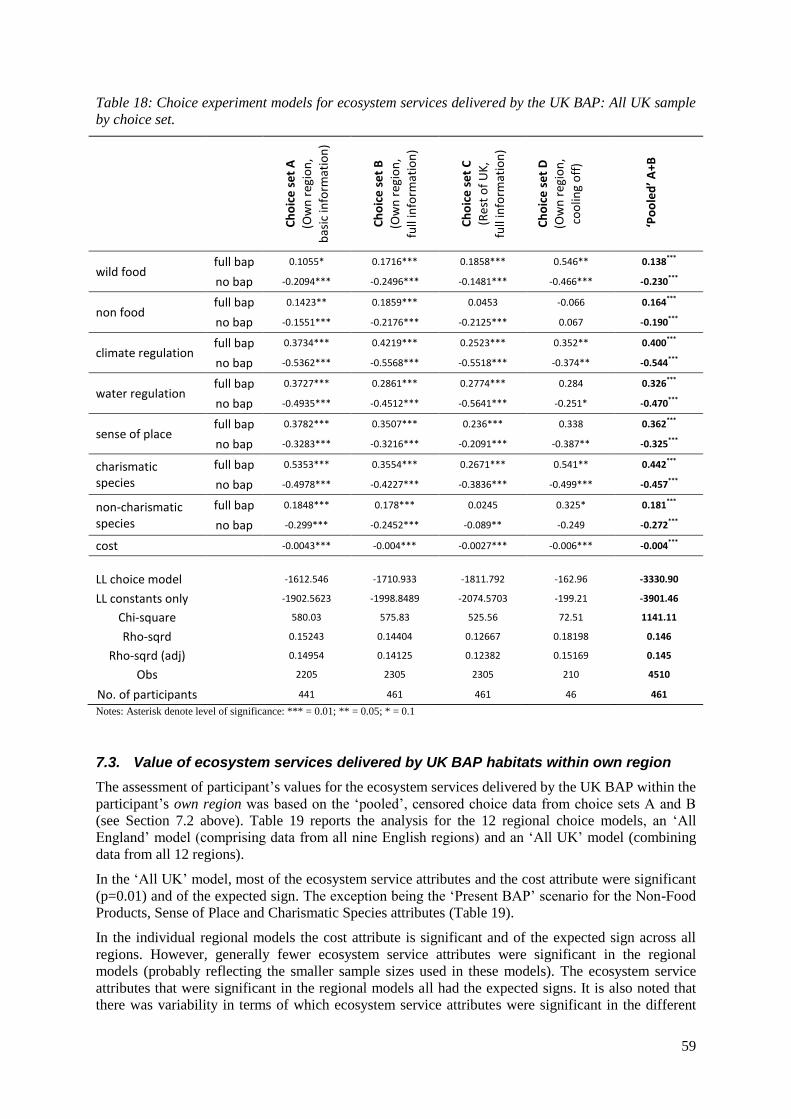
59
Table 18: Choice experiment models for ecosystem services delivered by the UK BAP: All UK sample
by choice set.
Ch
oic
e s
et
A
(Ow
n r
egio
n,
bas
ic in
form
atio
n)
Ch
oic
e s
et
B
(Ow
n r
egio
n,
full
info
rmat
ion
)
Ch
oic
e s
et
C
(Re
st o
f U
K,
full
info
rmat
ion
)
Ch
oic
e s
et
D
(Ow
n r
egio
n,
coo
ling
off
)
‘Po
ole
d’ A
+B
wild food full bap 0.1055* 0.1716*** 0.1858*** 0.546** 0.138***
no bap -0.2094*** -0.2496*** -0.1481*** -0.466*** -0.230***
non food full bap 0.1423** 0.1859*** 0.0453 -0.066 0.164***
no bap -0.1551*** -0.2176*** -0.2125*** 0.067 -0.190***
climate regulation full bap 0.3734*** 0.4219*** 0.2523*** 0.352** 0.400***
no bap -0.5362*** -0.5568*** -0.5518*** -0.374** -0.544***
water regulation full bap 0.3727*** 0.2861*** 0.2774*** 0.284 0.326***
no bap -0.4935*** -0.4512*** -0.5641*** -0.251* -0.470***
sense of place full bap 0.3782*** 0.3507*** 0.236*** 0.338 0.362***
no bap -0.3283*** -0.3216*** -0.2091*** -0.387** -0.325***
charismatic species
full bap 0.5353*** 0.3554*** 0.2671*** 0.541** 0.442***
no bap -0.4978*** -0.4227*** -0.3836*** -0.499*** -0.457***
non-charismatic species
full bap 0.1848*** 0.178*** 0.0245 0.325* 0.181***
no bap -0.299*** -0.2452*** -0.089** -0.249 -0.272***
cost
-0.0043*** -0.004*** -0.0027*** -0.006*** -0.004***
LL choice model
-1612.546 -1710.933 -1811.792 -162.96 -3330.90
LL constants only
-1902.5623 -1998.8489 -2074.5703 -199.21 -3901.46
Chi-square
580.03 575.83 525.56 72.51 1141.11
Rho-sqrd
0.15243 0.14404 0.12667 0.18198 0.146
Rho-sqrd (adj)
0.14954 0.14125 0.12382 0.15169 0.145
Obs
2205 2305 2305 210 4510
No. of participants
441 461 461 46 461
Notes: Asterisk denote level of significance: *** = 0.01; ** = 0.05; * = 0.1
7.3. Value of ecosystem services delivered by UK BAP habitats within own region
The assessment of participant’s values for the ecosystem services delivered by the UK BAP within the
participant’s own region was based on the ‘pooled’, censored choice data from choice sets A and B
(see Section 7.2 above). Table 19 reports the analysis for the 12 regional choice models, an ‘All
England’ model (comprising data from all nine English regions) and an ‘All UK’ model (combining
data from all 12 regions).
In the ‘All UK’ model, most of the ecosystem service attributes and the cost attribute were significant
(p=0.01) and of the expected sign. The exception being the ‘Present BAP’ scenario for the Non-Food
Products, Sense of Place and Charismatic Species attributes (Table 19).
In the individual regional models the cost attribute is significant and of the expected sign across all
regions. However, generally fewer ecosystem service attributes were significant in the regional
models (probably reflecting the smaller sample sizes used in these models). The ecosystem service
attributes that were significant in the regional models all had the expected signs. It is also noted that
there was variability in terms of which ecosystem service attributes were significant in the different
60
regions (Table 19). Generally, the climate regulation attribute was significant in at least two levels of
provision across all 12 regional models. This suggests that climate regulation is a service that people
appear to value across the whole of the UK; which may reflect the high profile that climate change is
currently having in the media. The water regulation and charismatic species attributes were significant
across most of the regions, while Wild food and Non-food products tended to be significant in the
minority of regions. It is also interesting to note that there are differences in terms of which ecosystem
service attributes are significant in the different regions. For example, water regulation is significant
(at all levels of provision) in Wales, Northern Ireland, the North East and London, while Charismatic
species is only significant (at all levels of provision) in the South West region (Table 19). This
suggests that people in the different regions value different ecosystems services: i.e. preferences for
ecosystem services are spatially heterogeneous. Finally, it is interesting to note that there was a much
higher level of significance in the ecosystem service attributes when they were specified at the ‘Full
implementation’ or ‘No BAP’ level compared to the ‘Present BAP’ level. The exact reason for this
observation is currently unclear, but may reflect the fact that respondents took more notice of an
attribute if there was a change in the level of service delivery compared to maintenance of the status
quo.
In terms of goodness of fit of the regional models, the Rho2 values range from 0.27 in Yorkshire and
Humber and the South West down to 0.06 in London. Interestingly, the regional Rho2 values are
higher than the Rho2 value of the All UK model (0.14) in 9 out of the 12 regional models. This
suggests that we are better able to predict choices at a regional level compared to a UK national level.
In other words, the regional models may better reflect participant’s preferences for ecosystem
services.
7.3.1. Consumer surplus for ecosystems services delivered by UK BAP habitats within own
region
The regional and UK choice models reported in Table 19 can be used to estimate the consumer
surplus (£ per household per year) for two UK BAP funding scenarios:
Increasing spend: The marginal change in the value of ecosystem services delivered by UK
BAP habitats from the current situation under the Present BAP to the situation under Full
implementation of the UK BAP (i.e. Full BAP CE scenarios – Present BAP CE scenario);
Current spend: The marginal change in the value of ecosystem services delivered by the UK
BAP habitats from the current situation under the Present BAP to the situation of no further
funding of the UK BAP (i.e. Present BAP CE scenario – No BAP CE scenario).
We stress that these consumer surplus values estimated from the choice experiment relate to the value
of ecosystem services delivered by the UK BAP habitats. They do not relate to the value of the
changes to ecosystem services directly attributable to the conservation actions funded through the UK
BAP. The contribution of the UK BAP actions to the delivery of ecosystem services is estimated in
the weighting matrix (see Section 8) and the consumer surplus value directly apportioned to the UK
BAP actions are reported in Section 9.
Table 20 provides a summary of the mean annual consumer surplus values per household for the
seven ecosystem services delivered under the two marginal change scenarios: Full BAP and Present
BAP. The consumer surpluses value were estimated by the difference in CE β coefficients for the
ecosystem services under the two relevant BAP scenarios, divided by the β coefficient for the cost
attribute: the CE β coefficients for the BAP scenarios are reported in Table 19. Note that we only
estimate consumer surplus values for a particular ecosystem service attribute when at least two of the
levels of that attribute are significant in the CE model at p = 0.1. Where two or more of the levels are
insignificant in the CE models, we can not be confident of the values of the β coefficients and
therefore estimation of consumer surplus values would be largely meaningless.
In the UK ‘Pooled’ model (Table 20) we are able to estimate consumer surplus values for all seven
ecosystem service attributes. The annual mean consumer surplus value per household for the
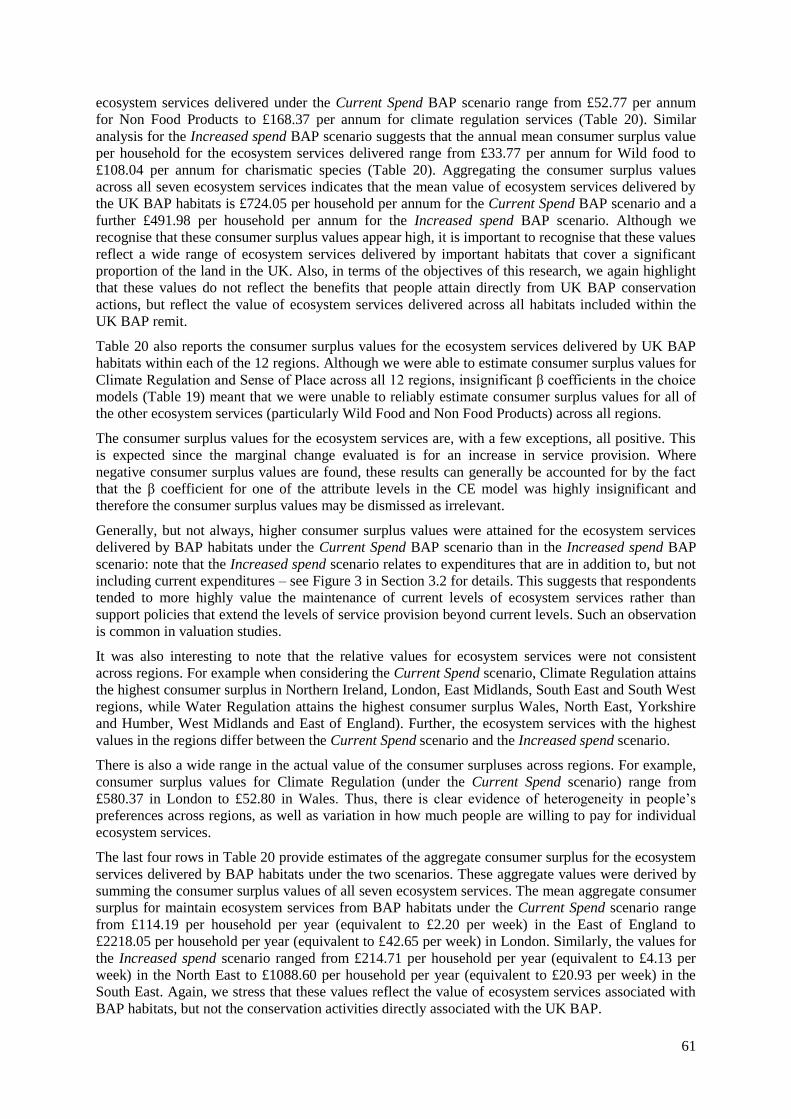
61
ecosystem services delivered under the Current Spend BAP scenario range from £52.77 per annum
for Non Food Products to £168.37 per annum for climate regulation services (Table 20). Similar
analysis for the Increased spend BAP scenario suggests that the annual mean consumer surplus value
per household for the ecosystem services delivered range from £33.77 per annum for Wild food to
£108.04 per annum for charismatic species (Table 20). Aggregating the consumer surplus values
across all seven ecosystem services indicates that the mean value of ecosystem services delivered by
the UK BAP habitats is £724.05 per household per annum for the Current Spend BAP scenario and a
further £491.98 per household per annum for the Increased spend BAP scenario. Although we
recognise that these consumer surplus values appear high, it is important to recognise that these values
reflect a wide range of ecosystem services delivered by important habitats that cover a significant
proportion of the land in the UK. Also, in terms of the objectives of this research, we again highlight
that these values do not reflect the benefits that people attain directly from UK BAP conservation
actions, but reflect the value of ecosystem services delivered across all habitats included within the
UK BAP remit.
Table 20 also reports the consumer surplus values for the ecosystem services delivered by UK BAP
habitats within each of the 12 regions. Although we were able to estimate consumer surplus values for
Climate Regulation and Sense of Place across all 12 regions, insignificant β coefficients in the choice
models (Table 19) meant that we were unable to reliably estimate consumer surplus values for all of
the other ecosystem services (particularly Wild Food and Non Food Products) across all regions.
The consumer surplus values for the ecosystem services are, with a few exceptions, all positive. This
is expected since the marginal change evaluated is for an increase in service provision. Where
negative consumer surplus values are found, these results can generally be accounted for by the fact
that the β coefficient for one of the attribute levels in the CE model was highly insignificant and
therefore the consumer surplus values may be dismissed as irrelevant.
Generally, but not always, higher consumer surplus values were attained for the ecosystem services
delivered by BAP habitats under the Current Spend BAP scenario than in the Increased spend BAP
scenario: note that the Increased spend scenario relates to expenditures that are in addition to, but not
including current expenditures – see Figure 3 in Section 3.2 for details. This suggests that respondents
tended to more highly value the maintenance of current levels of ecosystem services rather than
support policies that extend the levels of service provision beyond current levels. Such an observation
is common in valuation studies.
It was also interesting to note that the relative values for ecosystem services were not consistent
across regions. For example when considering the Current Spend scenario, Climate Regulation attains
the highest consumer surplus in Northern Ireland, London, East Midlands, South East and South West
regions, while Water Regulation attains the highest consumer surplus Wales, North East, Yorkshire
and Humber, West Midlands and East of England). Further, the ecosystem services with the highest
values in the regions differ between the Current Spend scenario and the Increased spend scenario.
There is also a wide range in the actual value of the consumer surpluses across regions. For example,
consumer surplus values for Climate Regulation (under the Current Spend scenario) range from
£580.37 in London to £52.80 in Wales. Thus, there is clear evidence of heterogeneity in people’s
preferences across regions, as well as variation in how much people are willing to pay for individual
ecosystem services.
The last four rows in Table 20 provide estimates of the aggregate consumer surplus for the ecosystem
services delivered by BAP habitats under the two scenarios. These aggregate values were derived by
summing the consumer surplus values of all seven ecosystem services. The mean aggregate consumer
surplus for maintain ecosystem services from BAP habitats under the Current Spend scenario range
from £114.19 per household per year (equivalent to £2.20 per week) in the East of England to
£2218.05 per household per year (equivalent to £42.65 per week) in London. Similarly, the values for
the Increased spend scenario ranged from £214.71 per household per year (equivalent to £4.13 per
week) in the North East to £1088.60 per household per year (equivalent to £20.93 per week) in the
South East. Again, we stress that these values reflect the value of ecosystem services associated with
BAP habitats, but not the conservation activities directly associated with the UK BAP.
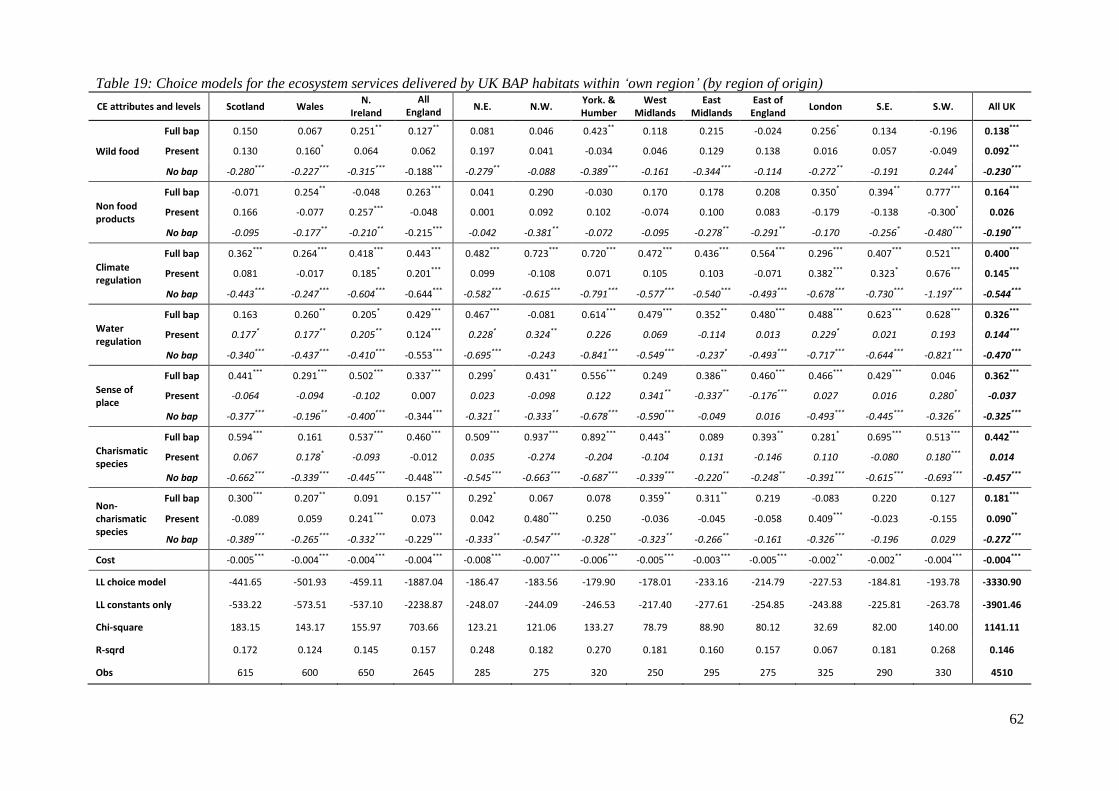
62
Table 19: Choice models for the ecosystem services delivered by UK BAP habitats within ‘own region’ (by region of origin)
CE attributes and levels Scotland Wales N.
Ireland
All England
N.E. N.W. York. & Humber
West Midlands
East Midlands
East of England
London S.E. S.W. All UK
Wild food
Full bap 0.150 0.067 0.251** 0.127** 0.081 0.046 0.423** 0.118 0.215 -0.024 0.256* 0.134 -0.196 0.138***
Present 0.130 0.160* 0.064 0.062 0.197 0.041 -0.034 0.046 0.129 0.138 0.016 0.057 -0.049 0.092***
No bap -0.280*** -0.227*** -0.315*** -0.188*** -0.279** -0.088 -0.389*** -0.161 -0.344*** -0.114 -0.272** -0.191 0.244* -0.230***
Non food products
Full bap -0.071 0.254** -0.048 0.263*** 0.041 0.290 -0.030 0.170 0.178 0.208 0.350* 0.394** 0.777*** 0.164***
Present 0.166 -0.077 0.257*** -0.048 0.001 0.092 0.102 -0.074 0.100 0.083 -0.179 -0.138 -0.300* 0.026
No bap -0.095 -0.177** -0.210** -0.215*** -0.042 -0.381** -0.072 -0.095 -0.278** -0.291** -0.170 -0.256* -0.480*** -0.190***
Climate regulation
Full bap 0.362*** 0.264*** 0.418*** 0.443*** 0.482*** 0.723*** 0.720*** 0.472*** 0.436*** 0.564*** 0.296*** 0.407*** 0.521*** 0.400***
Present 0.081 -0.017 0.185* 0.201*** 0.099 -0.108 0.071 0.105 0.103 -0.071 0.382*** 0.323* 0.676*** 0.145***
No bap -0.443*** -0.247*** -0.604*** -0.644*** -0.582*** -0.615*** -0.791*** -0.577*** -0.540*** -0.493*** -0.678*** -0.730*** -1.197*** -0.544***
Water regulation
Full bap 0.163 0.260** 0.205* 0.429*** 0.467*** -0.081 0.614*** 0.479*** 0.352** 0.480*** 0.488*** 0.623*** 0.628*** 0.326***
Present 0.177* 0.177** 0.205** 0.124*** 0.228* 0.324** 0.226 0.069 -0.114 0.013 0.229* 0.021 0.193 0.144***
No bap -0.340*** -0.437*** -0.410*** -0.553*** -0.695*** -0.243 -0.841*** -0.549*** -0.237* -0.493*** -0.717*** -0.644*** -0.821*** -0.470***
Sense of place
Full bap 0.441*** 0.291*** 0.502*** 0.337*** 0.299* 0.431** 0.556*** 0.249 0.386** 0.460*** 0.466*** 0.429*** 0.046 0.362***
Present -0.064 -0.094 -0.102 0.007 0.023 -0.098 0.122 0.341** -0.337** -0.176*** 0.027 0.016 0.280* -0.037
No bap -0.377*** -0.196** -0.400*** -0.344*** -0.321** -0.333** -0.678*** -0.590*** -0.049 0.016 -0.493*** -0.445*** -0.326** -0.325***
Charismatic species
Full bap 0.594*** 0.161 0.537*** 0.460*** 0.509*** 0.937*** 0.892*** 0.443** 0.089 0.393** 0.281* 0.695*** 0.513*** 0.442***
Present 0.067 0.178* -0.093 -0.012 0.035 -0.274 -0.204 -0.104 0.131 -0.146 0.110 -0.080 0.180*** 0.014
No bap -0.662*** -0.339*** -0.445*** -0.448*** -0.545*** -0.663*** -0.687*** -0.339*** -0.220** -0.248** -0.391*** -0.615*** -0.693*** -0.457***
Non-charismatic species
Full bap 0.300*** 0.207** 0.091 0.157*** 0.292* 0.067 0.078 0.359** 0.311** 0.219 -0.083 0.220 0.127 0.181***
Present -0.089 0.059 0.241*** 0.073 0.042 0.480*** 0.250 -0.036 -0.045 -0.058 0.409*** -0.023 -0.155 0.090**
No bap -0.389*** -0.265*** -0.332*** -0.229*** -0.333** -0.547*** -0.328** -0.323** -0.266** -0.161 -0.326*** -0.196 0.029 -0.272***
Cost
-0.005*** -0.004*** -0.004*** -0.004*** -0.008*** -0.007*** -0.006*** -0.005*** -0.003*** -0.005*** -0.002** -0.002** -0.004*** -0.004***
LL choice model -441.65 -501.93 -459.11 -1887.04 -186.47 -183.56 -179.90 -178.01 -233.16 -214.79 -227.53 -184.81 -193.78 -3330.90
LL constants only -533.22 -573.51 -537.10 -2238.87 -248.07 -244.09 -246.53 -217.40 -277.61 -254.85 -243.88 -225.81 -263.78 -3901.46
Chi-square 183.15 143.17 155.97 703.66 123.21 121.06 133.27 78.79 88.90 80.12 32.69 82.00 140.00 1141.11
R-sqrd 0.172 0.124 0.145 0.157 0.248 0.182 0.270 0.181 0.160 0.157 0.067 0.181 0.268 0.146
Obs 615 600 650 2645 285 275 320 250 295 275 325 290 330 4510
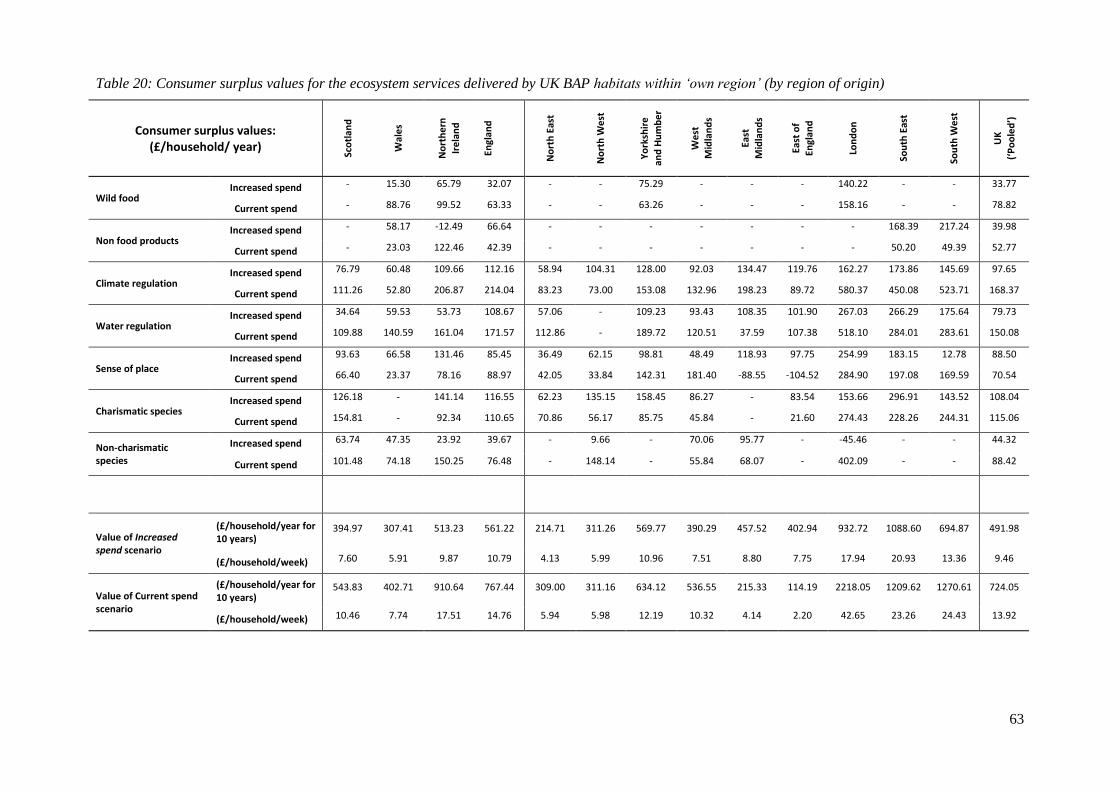
63
Table 20: Consumer surplus values for the ecosystem services delivered by UK BAP habitats within ‘own region’ (by region of origin)
Consumer surplus values: (£/household/ year)
Sco
tlan
d
Wal
es
No
rth
ern
Ire
lan
d
Engl
and
No
rth
Eas
t
No
rth
We
st
Yo
rksh
ire
and
Hu
mb
er
We
st
Mid
lan
ds
East
Mid
lan
ds
East
of
Engl
and
Lon
do
n
Sou
th E
ast
Sou
th W
est
UK
(‘P
oo
led
’)
Wild food Increased spend - 15.30 65.79 32.07 - - 75.29 - - - 140.22 - - 33.77
Current spend - 88.76 99.52 63.33 - - 63.26 - - - 158.16 - - 78.82
Non food products Increased spend - 58.17 -12.49 66.64 - - - - - - - 168.39 217.24 39.98
Current spend - 23.03 122.46 42.39 - - - - - - - 50.20 49.39 52.77
Climate regulation Increased spend 76.79 60.48 109.66 112.16 58.94 104.31 128.00 92.03 134.47 119.76 162.27 173.86 145.69 97.65
Current spend 111.26 52.80 206.87 214.04 83.23 73.00 153.08 132.96 198.23 89.72 580.37 450.08 523.71 168.37
Water regulation Increased spend 34.64 59.53 53.73 108.67 57.06 - 109.23 93.43 108.35 101.90 267.03 266.29 175.64 79.73
Current spend 109.88 140.59 161.04 171.57 112.86 - 189.72 120.51 37.59 107.38 518.10 284.01 283.61 150.08
Sense of place Increased spend 93.63 66.58 131.46 85.45 36.49 62.15 98.81 48.49 118.93 97.75 254.99 183.15 12.78 88.50
Current spend 66.40 23.37 78.16 88.97 42.05 33.84 142.31 181.40 -88.55 -104.52 284.90 197.08 169.59 70.54
Charismatic species Increased spend 126.18 - 141.14 116.55 62.23 135.15 158.45 86.27 - 83.54 153.66 296.91 143.52 108.04
Current spend 154.81 - 92.34 110.65 70.86 56.17 85.75 45.84 - 21.60 274.43 228.26 244.31 115.06
Non-charismatic species
Increased spend 63.74 47.35 23.92 39.67 - 9.66 - 70.06 95.77 - -45.46 - - 44.32
Current spend 101.48 74.18 150.25 76.48 - 148.14 - 55.84 68.07 - 402.09 - - 88.42
Value of Increased spend scenario
(£/household/year for 10 years)
394.97 307.41 513.23 561.22 214.71 311.26 569.77 390.29 457.52 402.94 932.72 1088.60 694.87 491.98
(£/household/week) 7.60 5.91 9.87 10.79 4.13 5.99 10.96 7.51 8.80 7.75 17.94 20.93 13.36 9.46
Value of Current spend scenario
(£/household/year for 10 years)
543.83 402.71 910.64 767.44 309.00 311.16 634.12 536.55 215.33 114.19 2218.05 1209.62 1270.61 724.05
(£/household/week) 10.46 7.74 17.51 14.76 5.94 5.98 12.19 10.32 4.14 2.20 42.65 23.26 24.43 13.92
64
7.4. Value of ecosystem services delivered by UK BAP habitats within the ‘rest of the UK’
In Section 7.3 above, we estimated the value of ecosystem services delivered by UK BAP habitats
located within respondents own region. In this section we report the findings from the assessment of the
value of ecosystem services delivered by UK BAP habitats in the ‘rest of the UK’. In other words,
respondents of the choice experiment were asked (in Choice Set C) to state their values for ecosystem
services in all other regions of the UK outside their own region of residence.
The assessment of participant’s values for the ecosystem services delivered by the UK BAP in ‘the rest of
the UK’ was based on the censored choice data from choice set C (see Section 7.2 above). Table 21
reports the analysis for the 12 regional choice models, an ‘All England’ model (comprising data from all
nine English regions) and an ‘All UK’ model (combining data from all 12 regions).
In the ‘All UK’ model, the majority of the ecosystem service attributes and the cost attribute were
significant (p=0.01) and of the expected sign: although it should be noted that the number of significance
of attributes was lower than in the ‘own region’ choice model (Table 18). In the ‘rest of the UK’ All UK
data model (last column, Table 21), all levels of the Climate Regulation, Water Regulation and
Charismatic Species attributes were significant. The other attributes had at least one level insignificant
(Table 21). The Rho2 value of the All UK model was 0.127, demonstrating a reasonably fit to the data.
In the individual regional models for the ‘rest of the UK’, the cost attribute is significant and of the
expected sign in 10 of the 12 regions: cost is insignificant in the East of England and London samples. In
terms of the ecosystem services attributes, all three levels of the Climate Regulation attribute were
significant in four regional models (Northern Ireland, Yorkshire and Humber, the East Midlands, and the
All England samples), while Water Regulation was significant at all three levels of provision in Wales,
Northern Ireland, Yorkshire and Humber and the All England models). However, none of the attributes
levels were significant for the Non-charismatic species attribute in 8 of the 12 regions, for the Wild food
attributes in 6 regions, for Sense of Place in 5 regions, for the Non-Food Products 3 regions or for
Charismatic species in 2 regions. Thus, it is clear that the ‘rest of the UK’ models performed less well
than the ‘own region’ models. Some of the reason for this is likely to be the result of the ‘rest of the UK’
models being based on only 5 choice tasks per respondent (while the ‘own region’ model was based on
10 choice tasks per respondent since choice sets A and B were pooled in the ‘own region’ models).
In terms of goodness of fit of the regional models, the Rho2 values range from 0.331 in Yorkshire and
Humber down to 0.085 in the East of England. Similar to the ‘own region’ models, the regional Rho2
values are higher than the Rho2 value of the All UK model (0.127) in 10 out of the 12 regional models.
This again suggests that we are better able to predict choices at a regional level compared to a UK
national level.
7.4.1. Consumer surplus for ecosystems services delivered by UK BAP habitats in the ‘rest of the
UK’
In this section, we first report the mean consumer surplus values that people in the different regions have
for the ecosystem services delivered by the UK BAP habitats in the ‘rest of the UK’. Next, we undertake
analysis to redistribute the benefits for the ‘rest of the UK’ to the actual regions where those benefits are
attained. Thus, for each region, we estimate the value of the ecosystem services delivered within that
region based on the valuations of people in all of the other regions of the UK.
Consumer surplus for ecosystem services delivered by BAP habitats in the ‘rest of the UK’ by
region of respondent.
The regional and UK choice models reported in Table 21 can be used to estimate the annual household
consumer surplus values of ecosystem services delivered by the UK BAP habitats for two UK BAP
scenarios: Increased spend and Current spend scenarios. Again, we stress that the CE models are valuing
65
all ecosystem services associated with BAP habitats, rather than the services delivered as a direct result of
actions associated with the UK BAP.
Table 22 provides a summary of the mean annual consumer surplus values per household for the seven
ecosystem services delivered under the two marginal change scenarios: Increased spend and Current
spend scenarios. Note again that we only estimate consumer surplus values for a particular ecosystem
service attribute when at least two of the levels of that attribute are significant (p = 0.1) in the CE model.
Where two or more of the levels are insignificant in the CE models, we cannot be confident of the values
of the β coefficients are therefore estimation of consumer surplus values would be largely meaningless.
Further, given that the cost coefficient was insignificant in the East of England and London models, we
are unable to estimate reliable consumer surplus values for these two regions.
In the UK ‘Pooled’ model (Table 22), we are able to estimate consumer surplus values for six of the
seven ecosystem service attributes: the Non charismatic species attribute was insignificant at two levels
of provision. The annual mean consumer surplus value per household for the ecosystem services
delivered by of Current spend scenario range from £40.30 per annum for Wildfood to £310 per annum
for Climate Regulation and Water Regulation services (Table 22). Similar analysis for the Increased
spend scenario suggests that the annual mean consumer surplus value per household for the ecosystem
services delivered range from £16.53 per annum for Non-Food Products to £101.26 per annum for Water
regulation (Table 22). Aggregating the consumer surplus values across the six significant ecosystem
services indicates that the mean value of ecosystem services delivered by the UK BAP habitats is
£1049.35 per household per annum for the Current spend scenario and £461.34 per household per annum
for the Increased spend scenario.
Table 22 also reports the consumer surplus values for the ecosystem services delivered by UK BAP
habitats within each of the 12 regions. Unfortunately, the low levels of significance of the ecosystem
service attributes in choice models (Table 21) meant that we were unable to assess the value of many
ecosystem services at a regional level. Generally, the consumer surplus values for the ecosystem services
are positive. Further, higher consumer surplus values were attained for the ecosystem services delivered
by BAP habitats under the Current spend scenario than in the Increased spend scenario; the general
exceptions to this were the Wild Food and Sense of Place services.
There were also differences in terms of the relative values for ecosystem services across regions. For
example, when considering the Current spend scenario, Climate Regulation attains the highest consumer
surplus in Northern Ireland, England, the North East, Yorkshire and Humber, and East Midlands, while
Water Regulation attains the highest consumer surplus Scotland, Wales, North West, and South East.
Further, the ecosystem services with the highest values in the regions differ between the Current spend
scenario and the Increased spend scenario.
There is also a wide range in the actual consumer surplus values across the regions. For example,
consumer surplus values for Climate Regulation (under the Current spend scenario) range from £1117.65
in Yorkshire and Humber to £187.96 in Scotland. Thus, there is again clear evidence of heterogeneity in
people’s preferences across regions, as well as variation in how much people are willing to pay for
individual ecosystem services.
The last four rows in Table 22 provide estimates of the aggregate consumer surplus for the ecosystem
services delivered by BAP habitats under the two scenarios. These aggregate values were derived by
summing the consumer surplus values of all seven ecosystem services. The mean aggregate consumer
surplus for maintain ecosystem services from BAP habitats under the Current spend scenario ranged
from £149.16 per household per year (equivalent to £2.87 per week) in Wales to £2222.12 per household
per year (equivalent to £42.73 per week) in Yorkshire and Humber. Similarly, the values for Increased
spend scenario ranged from £11.64 per household per year (equivalent to £0.22 per week) in the West
Midlands to £1278.82 per household per year (equivalent to £24.59 per week) in the South East.
Comparing these household consumer surplus values for the ‘rest of the UK’ (Table 22) with those for
‘within own region’ (Table 20) suggests that respondent’s values for ecosystem services were reasonably
similar across the two scenarios.
66
Consumer surplus for ecosystem services delivered by BAP habitats in the ‘rest of the UK’ by
region of benefit.
In this next stage, we allocate the values reported in Table 22 to the regions where the ecosystem service
benefits were delivered, thus providing an estimate of the values that people outside a particularly region
had for the delivery of ecosystem services within that region. The approach used to distribute the values
across the other regions was linked to the current areas of habitats with the different regions. So, for
example, to estimate the value that people in the rest of the UK had for Wild Food in Scotland, we first
estimated the proportion of relevant habitat found in Scotland compared to the total area that habitat
across the whole of the UK. In the case of Wild Food, the relevant habitat was native woodland. Other
ecosystem services, such as climate change were based on a range of habitats: see Section 4.3 for further
detail. Scotland currently has 36.9% of all native woodland habitats in the UK (Table 12). Thus, we
assume that 36.9% of the value of Wild Food services which people in another region, e.g. Wales, had for
Wild Food would be allocated to Scotland6. This procedure was repeated for all 11 regions, and thus the
value of Wild Food in Scotland was estimated by summing the allocation of values from all 11 regions.
Table 23 provides a summary of these values. Of the 12 regions, people from the ‘rest of the UK’ gave
the highest total value for ecosystem services delivered by BAP habitats in Scotland (£3,744 per
household per annum for the Current spend scenario and £1,904 for the Increased spend scenario). The
values of the ecosystem services delivered by BAP habitats in England, Wales and Northern Ireland to
the ‘rest of the UK’ were £4,730, £931 and £441 respectively for the Present BAP scenario, and £2,122,
£482 and £207 respectively for the Full BAP scenario. We, however, advise caution in the interpretation
of the values for the English regions as the approach used to determine the area of habitats within English
regions produced some anomalies (see Section 4.3.1).
6 Note that in practice this description is a somewhat simplified version of what actually happened. The proportion
of services allocated to a region was based on the area of that habitat in the region of delivery compared to the area
of habitat in the rest of the UK minus the area habitat in the region where the valuation was undertaken. This
allowed for a more precise allocation of services to regions.
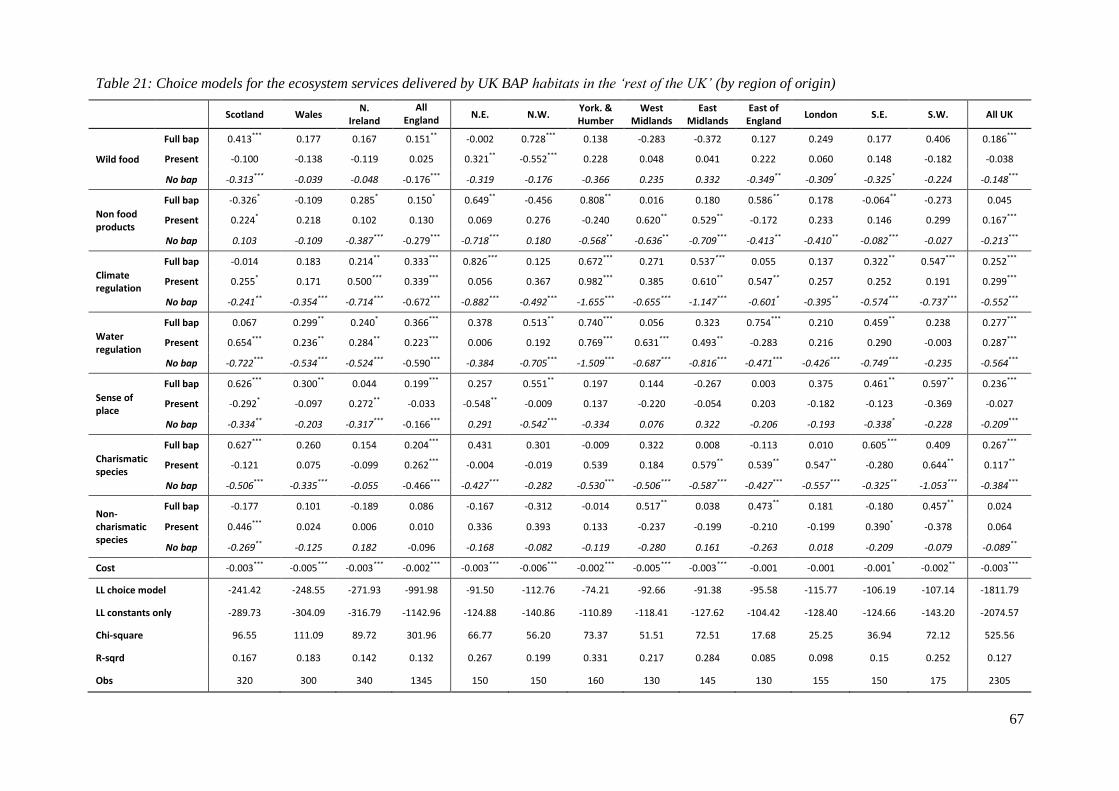
67
Table 21: Choice models for the ecosystem services delivered by UK BAP habitats in the ‘rest of the UK’ (by region of origin)
Scotland Wales
N. Ireland
All England
N.E. N.W. York. & Humber
West Midlands
East Midlands
East of England
London S.E. S.W. All UK
Wild food
Full bap 0.413*** 0.177 0.167 0.151** -0.002 0.728*** 0.138 -0.283 -0.372 0.127 0.249 0.177 0.406 0.186***
Present -0.100 -0.138 -0.119 0.025 0.321** -0.552*** 0.228 0.048 0.041 0.222 0.060 0.148 -0.182 -0.038
No bap -0.313*** -0.039 -0.048 -0.176*** -0.319 -0.176 -0.366 0.235 0.332 -0.349** -0.309* -0.325* -0.224 -0.148***
Non food products
Full bap -0.326* -0.109 0.285* 0.150* 0.649** -0.456 0.808** 0.016 0.180 0.586** 0.178 -0.064** -0.273 0.045
Present 0.224* 0.218 0.102 0.130 0.069 0.276 -0.240 0.620** 0.529** -0.172 0.233 0.146 0.299 0.167***
No bap 0.103 -0.109 -0.387*** -0.279*** -0.718*** 0.180 -0.568** -0.636** -0.709*** -0.413** -0.410** -0.082*** -0.027 -0.213***
Climate regulation
Full bap -0.014 0.183 0.214** 0.333*** 0.826*** 0.125 0.672*** 0.271 0.537*** 0.055 0.137 0.322** 0.547*** 0.252***
Present 0.255* 0.171 0.500*** 0.339*** 0.056 0.367 0.982*** 0.385 0.610** 0.547** 0.257 0.252 0.191 0.299***
No bap -0.241** -0.354*** -0.714*** -0.672*** -0.882*** -0.492*** -1.655*** -0.655*** -1.147*** -0.601* -0.395** -0.574*** -0.737*** -0.552***
Water regulation
Full bap 0.067 0.299** 0.240* 0.366*** 0.378 0.513** 0.740*** 0.056 0.323 0.754*** 0.210 0.459** 0.238 0.277***
Present 0.654*** 0.236** 0.284** 0.223*** 0.006 0.192 0.769*** 0.631*** 0.493** -0.283 0.216 0.290 -0.003 0.287***
No bap -0.722*** -0.534*** -0.524*** -0.590*** -0.384 -0.705*** -1.509*** -0.687*** -0.816*** -0.471*** -0.426*** -0.749*** -0.235 -0.564***
Sense of place
Full bap 0.626*** 0.300** 0.044 0.199*** 0.257 0.551** 0.197 0.144 -0.267 0.003 0.375 0.461** 0.597** 0.236***
Present -0.292* -0.097 0.272** -0.033 -0.548** -0.009 0.137 -0.220 -0.054 0.203 -0.182 -0.123 -0.369 -0.027
No bap -0.334** -0.203 -0.317*** -0.166*** 0.291 -0.542*** -0.334 0.076 0.322 -0.206 -0.193 -0.338* -0.228 -0.209***
Charismatic species
Full bap 0.627*** 0.260 0.154 0.204*** 0.431 0.301 -0.009 0.322 0.008 -0.113 0.010 0.605*** 0.409 0.267***
Present -0.121 0.075 -0.099 0.262*** -0.004 -0.019 0.539 0.184 0.579** 0.539** 0.547** -0.280 0.644** 0.117**
No bap -0.506*** -0.335*** -0.055 -0.466*** -0.427*** -0.282 -0.530*** -0.506*** -0.587*** -0.427*** -0.557*** -0.325** -1.053*** -0.384***
Non-charismatic species
Full bap -0.177 0.101 -0.189 0.086 -0.167 -0.312 -0.014 0.517** 0.038 0.473** 0.181 -0.180 0.457** 0.024
Present 0.446*** 0.024 0.006 0.010 0.336 0.393 0.133 -0.237 -0.199 -0.210 -0.199 0.390* -0.378 0.064
No bap -0.269** -0.125 0.182 -0.096 -0.168 -0.082 -0.119 -0.280 0.161 -0.263 0.018 -0.209 -0.079 -0.089**
Cost
-0.003*** -0.005*** -0.003*** -0.002*** -0.003*** -0.006*** -0.002*** -0.005*** -0.003*** -0.001 -0.001 -0.001* -0.002** -0.003***
LL choice model -241.42 -248.55 -271.93 -991.98 -91.50 -112.76 -74.21 -92.66 -91.38 -95.58 -115.77 -106.19 -107.14 -1811.79
LL constants only -289.73 -304.09 -316.79 -1142.96 -124.88 -140.86 -110.89 -118.41 -127.62 -104.42 -128.40 -124.66 -143.20 -2074.57
Chi-square 96.55 111.09 89.72 301.96 66.77 56.20 73.37 51.51 72.51 17.68 25.25 36.94 72.12 525.56
R-sqrd 0.167 0.183 0.142 0.132 0.267 0.199 0.331 0.217 0.284 0.085 0.098 0.15 0.252 0.127
Obs 320 300 340 1345 150 150 160 130 145 130 155 150 175 2305
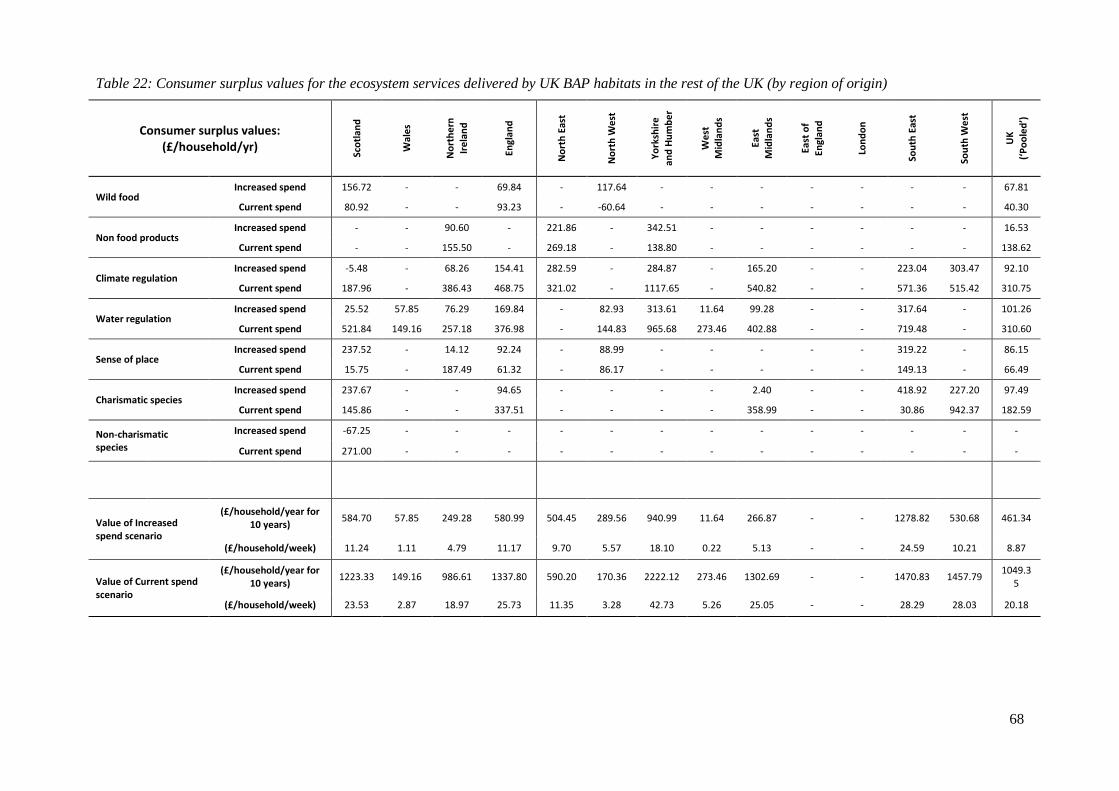
68
Table 22: Consumer surplus values for the ecosystem services delivered by UK BAP habitats in the rest of the UK (by region of origin)
Consumer surplus values: (£/household/yr)
Sco
tlan
d
Wal
es
No
rth
ern
Ire
lan
d
Engl
and
No
rth
Eas
t
No
rth
We
st
Yo
rksh
ire
and
Hu
mb
er
We
st
Mid
lan
ds
East
M
idla
nd
s
East
of
Engl
and
Lon
do
n
Sou
th E
ast
Sou
th W
est
UK
(‘P
oo
led
’)
Wild food Increased spend 156.72 - - 69.84 - 117.64 - - - - - - - 67.81
Current spend 80.92 - - 93.23 - -60.64 - - - - - - - 40.30
Non food products Increased spend - - 90.60 - 221.86 - 342.51 - - - - - - 16.53
Current spend - - 155.50 - 269.18 - 138.80 - - - - - - 138.62
Climate regulation Increased spend -5.48 - 68.26 154.41 282.59 - 284.87 - 165.20 - - 223.04 303.47 92.10
Current spend 187.96 - 386.43 468.75 321.02 - 1117.65 - 540.82 - - 571.36 515.42 310.75
Water regulation Increased spend 25.52 57.85 76.29 169.84 - 82.93 313.61 11.64 99.28 - - 317.64 - 101.26
Current spend 521.84 149.16 257.18 376.98 - 144.83 965.68 273.46 402.88 - - 719.48 - 310.60
Sense of place Increased spend 237.52 - 14.12 92.24 - 88.99 - - - - - 319.22 - 86.15
Current spend 15.75 - 187.49 61.32 - 86.17 - - - - - 149.13 - 66.49
Charismatic species Increased spend 237.67 - - 94.65 - - - - 2.40 - - 418.92 227.20 97.49
Current spend 145.86 - - 337.51 - - - - 358.99 - - 30.86 942.37 182.59
Non-charismatic species
Increased spend -67.25 - - - - - - - - - - - - -
Current spend 271.00 - - - - - - - - - - - - -
Value of Increased spend scenario
(£/household/year for 10 years)
584.70 57.85 249.28 580.99 504.45 289.56 940.99 11.64 266.87 - - 1278.82 530.68 461.34
(£/household/week) 11.24 1.11 4.79 11.17 9.70 5.57 18.10 0.22 5.13 - - 24.59 10.21 8.87
Value of Current spend scenario
(£/household/year for 10 years)
1223.33 149.16 986.61 1337.80 590.20 170.36 2222.12 273.46 1302.69 - - 1470.83 1457.79 1049.3
5
(£/household/week) 23.53 2.87 18.97 25.73 11.35 3.28 42.73 5.26 25.05 - - 28.29 28.03 20.18
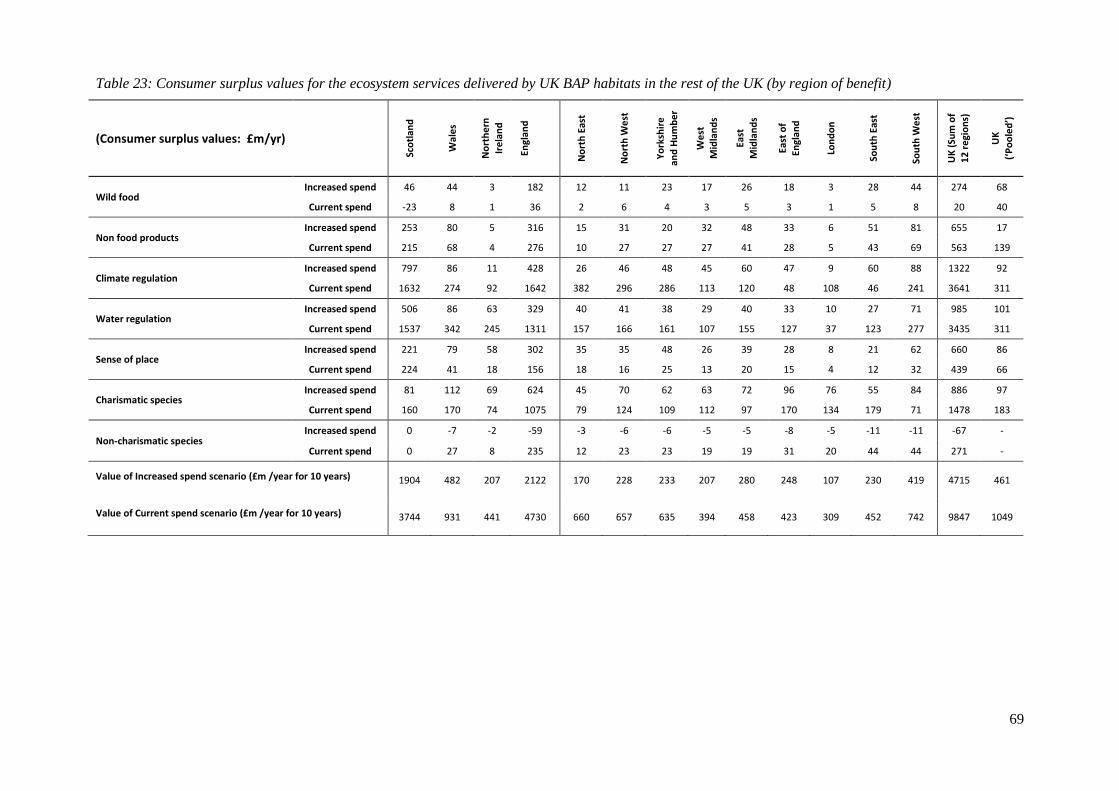
69
Table 23: Consumer surplus values for the ecosystem services delivered by UK BAP habitats in the rest of the UK (by region of benefit)
(Consumer surplus values: £m/yr)
Sco
tlan
d
Wal
es
No
rth
ern
Ire
lan
d
Engl
and
No
rth
Eas
t
No
rth
We
st
Yo
rksh
ire
and
Hu
mb
er
We
st
Mid
lan
ds
East
Mid
lan
ds
East
of
Engl
and
Lon
do
n
Sou
th E
ast
Sou
th W
est
UK
(Su
m o
f 1
2 r
egi
on
s)
UK
(‘P
oo
led
’)
Wild food Increased spend 46 44 3 182 12 11 23 17 26 18 3 28 44 274 68
Current spend -23 8 1 36 2 6 4 3 5 3 1 5 8 20 40
Non food products Increased spend 253 80 5 316 15 31 20 32 48 33 6 51 81 655 17
Current spend 215 68 4 276 10 27 27 27 41 28 5 43 69 563 139
Climate regulation Increased spend 797 86 11 428 26 46 48 45 60 47 9 60 88 1322 92
Current spend 1632 274 92 1642 382 296 286 113 120 48 108 46 241 3641 311
Water regulation Increased spend 506 86 63 329 40 41 38 29 40 33 10 27 71 985 101
Current spend 1537 342 245 1311 157 166 161 107 155 127 37 123 277 3435 311
Sense of place Increased spend 221 79 58 302 35 35 48 26 39 28 8 21 62 660 86
Current spend 224 41 18 156 18 16 25 13 20 15 4 12 32 439 66
Charismatic species Increased spend 81 112 69 624 45 70 62 63 72 96 76 55 84 886 97
Current spend 160 170 74 1075 79 124 109 112 97 170 134 179 71 1478 183
Non-charismatic species Increased spend 0 -7 -2 -59 -3 -6 -6 -5 -5 -8 -5 -11 -11 -67 -
Current spend 0 27 8 235 12 23 23 19 19 31 20 44 44 271 -
Value of Increased spend scenario (£m /year for 10 years) 1904 482 207 2122 170 228 233 207 280 248 107 230 419 4715 461
Value of Current spend scenario (£m /year for 10 years) 3744 931 441 4730 660 657 635 394 458 423 309 452 742 9847 1049
70
7.5. Value of ecosystem services delivered by UK BAP habitats in the UK: ‘within own region’ + ‘rest of UK’.
The final step in the assessment of the value of ecosystem services delivered by UK BAP habitats in
the UK is to aggregate the values that people have for ecosystem services within their ‘own region’
with the values that people have for ecosystem services delivered by UK BAP habitats in the ‘rest of
the UK’. This assessment is made for both the per household consumer surplus and the total consumer
surplus values.
7.5.1. Per household value of ecosystem services delivered by UK BAP habitats in the UK:
‘within own region’ + ‘rest of UK’.
The aggregate value of ecosystem services delivered by UK BAP habitats in the UK was estimated by
summing the per household values that people have for ecosystem services within their ‘own region’
(Table 20) with the per household values that people have for ecosystem services delivered by UK
BAP habitats in the ‘rest of the UK’ (Table 23). These aggregate values are reported in Table 24.
The mean consumer surplus values (£ per household per annum) for the ecosystem services delivered
by UK BAP habitats is estimated at £1,773 for the Current spend scenario, and a further £953 for the
Increased spend scenario based on the ‘Pooled’ UK data.
Generally, people most highly value Climate Regulating services (£479 per annum for the Current
spend scenario and £190 for the Increased spend scenario), and Water Regulation (£461 per annum
for the Current spend scenario and £181 for the Increased spend scenario). Charismatic species is also
highly valued (£298 per annum for the Current spend scenario and £205 for the Increased spend
scenario).
In terms of the distribution of values across regions, the highest values are found for habitats in
Scotland (£4,288 for the Current spend scenario and £2,299 for the Increased spend scenario),
London (£2,527 for the Current spend and £1,040 for the Increased spend). The lowest values were
found in the East of England (£537 for Current spend and £651 for Increased spend) and East
Midlands (£673 for Current spend and £738 for Increased spend). It is also noted that there is a high
degree of variation in the values of ecosystem services across the regions.
There are, however, a number of caveats which should be considered when interpreting the figures in
Table 24. First, the values reported in Table 24 relate to the total consumer surplus values of people
living in the UK for the ecosystem services delivered by BAP habitats within the UK. Importantly,
these values do not relate solely to the value of ecosystem services delivered by actions implemented
through the UK BAP. The weighting matrix (see Section 8 below) is used to identify the contribution
of the UK BAP actions to the delivery of ecosystem services.
Second, due to insignificant attribute coefficients in some of the choice models, we were not able to
provide reliable estimates of the value of ecosystem services within all regions. Thus, the values
reported above are likely to constitute a conservative estimate of the true values.
Finally, we advise caution in the interpretation of the English regional data since (i) the approach used
to allocate habitats to the nine English regions produced some anomalies (see Section 4.3.1) and (ii)
the sample used for the choice experiment was smallest in the English regions.
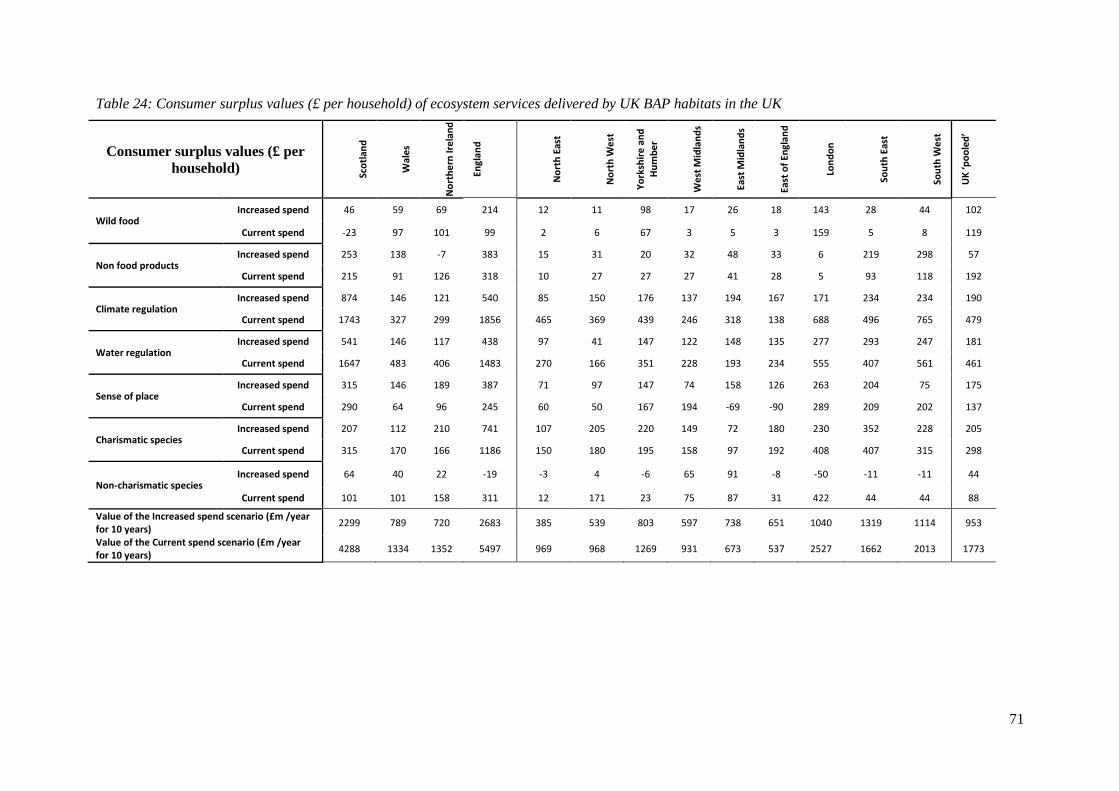
71
Table 24: Consumer surplus values (£ per household) of ecosystem services delivered by UK BAP habitats in the UK
Consumer surplus values (£ per
household)
Sco
tlan
d
Wal
es
No
rth
ern
Ire
lan
d
Engl
and
No
rth
Eas
t
No
rth
We
st
Yo
rksh
ire
an
d
Hu
mb
er
We
st M
idla
nd
s
East
Mid
lan
ds
East
of
Engl
and
Lon
do
n
Sou
th E
ast
Sou
th W
est
UK
‘po
ole
d’
Wild food Increased spend 46 59 69 214 12 11 98 17 26 18 143 28 44 102
Current spend -23 97 101 99 2 6 67 3 5 3 159 5 8 119
Non food products Increased spend 253 138 -7 383 15 31 20 32 48 33 6 219 298 57
Current spend 215 91 126 318 10 27 27 27 41 28 5 93 118 192
Climate regulation Increased spend 874 146 121 540 85 150 176 137 194 167 171 234 234 190
Current spend 1743 327 299 1856 465 369 439 246 318 138 688 496 765 479
Water regulation Increased spend 541 146 117 438 97 41 147 122 148 135 277 293 247 181
Current spend 1647 483 406 1483 270 166 351 228 193 234 555 407 561 461
Sense of place Increased spend 315 146 189 387 71 97 147 74 158 126 263 204 75 175
Current spend 290 64 96 245 60 50 167 194 -69 -90 289 209 202 137
Charismatic species Increased spend 207 112 210 741 107 205 220 149 72 180 230 352 228 205
Current spend 315 170 166 1186 150 180 195 158 97 192 408 407 315 298
Non-charismatic species Increased spend 64 40 22 -19 -3 4 -6 65 91 -8 -50 -11 -11 44
Current spend 101 101 158 311 12 171 23 75 87 31 422 44 44 88
Value of the Increased spend scenario (£m /year for 10 years)
2299 789 720 2683 385 539 803 597 738 651 1040 1319 1114 953
Value of the Current spend scenario (£m /year for 10 years)
4288 1334 1352 5497 969 968 1269 931 673 537 2527 1662 2013 1773
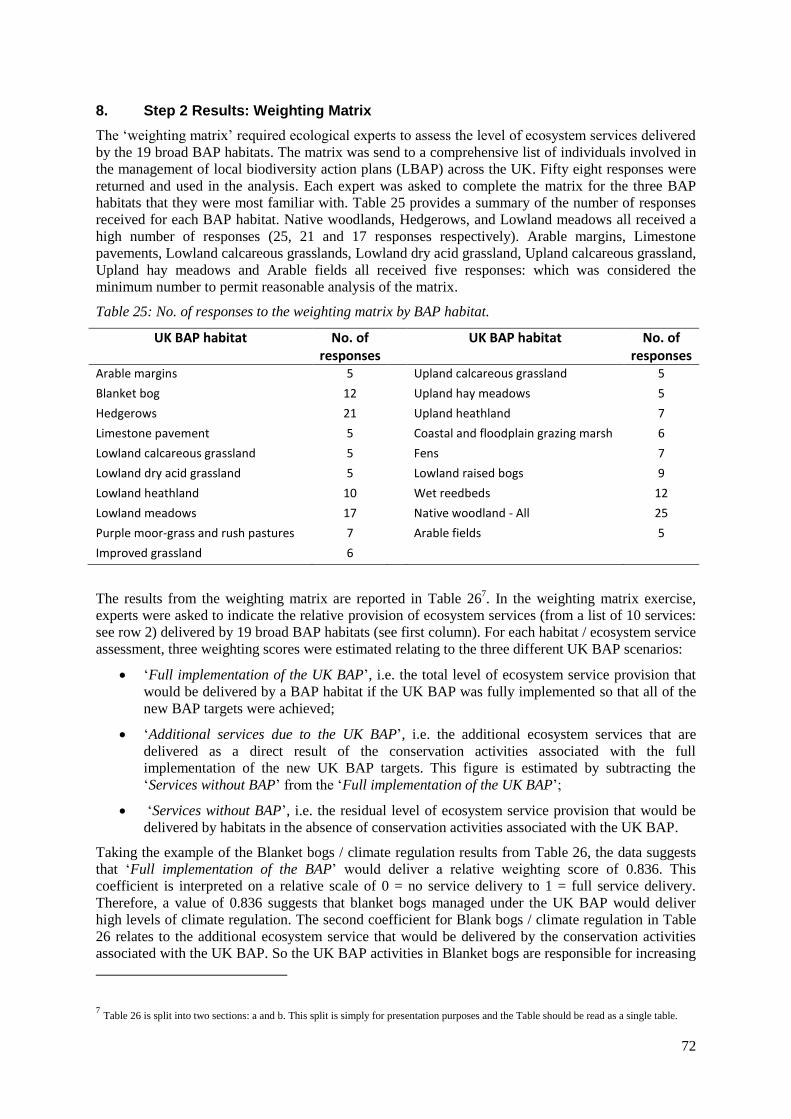
72
8. Step 2 Results: Weighting Matrix
The ‘weighting matrix’ required ecological experts to assess the level of ecosystem services delivered
by the 19 broad BAP habitats. The matrix was send to a comprehensive list of individuals involved in
the management of local biodiversity action plans (LBAP) across the UK. Fifty eight responses were
returned and used in the analysis. Each expert was asked to complete the matrix for the three BAP
habitats that they were most familiar with. Table 25 provides a summary of the number of responses
received for each BAP habitat. Native woodlands, Hedgerows, and Lowland meadows all received a
high number of responses (25, 21 and 17 responses respectively). Arable margins, Limestone
pavements, Lowland calcareous grasslands, Lowland dry acid grassland, Upland calcareous grassland,
Upland hay meadows and Arable fields all received five responses: which was considered the
minimum number to permit reasonable analysis of the matrix.
Table 25: No. of responses to the weighting matrix by BAP habitat.
UK BAP habitat No. of responses
UK BAP habitat No. of responses
Arable margins 5 Upland calcareous grassland 5
Blanket bog 12 Upland hay meadows 5
Hedgerows 21 Upland heathland 7
Limestone pavement 5 Coastal and floodplain grazing marsh 6
Lowland calcareous grassland 5 Fens 7
Lowland dry acid grassland 5 Lowland raised bogs 9
Lowland heathland 10 Wet reedbeds 12
Lowland meadows 17 Native woodland - All 25
Purple moor-grass and rush pastures 7 Arable fields 5
Improved grassland 6
The results from the weighting matrix are reported in Table 267. In the weighting matrix exercise,
experts were asked to indicate the relative provision of ecosystem services (from a list of 10 services:
see row 2) delivered by 19 broad BAP habitats (see first column). For each habitat / ecosystem service
assessment, three weighting scores were estimated relating to the three different UK BAP scenarios:
‘Full implementation of the UK BAP’, i.e. the total level of ecosystem service provision that
would be delivered by a BAP habitat if the UK BAP was fully implemented so that all of the
new BAP targets were achieved;
‘Additional services due to the UK BAP’, i.e. the additional ecosystem services that are
delivered as a direct result of the conservation activities associated with the full
implementation of the new UK BAP targets. This figure is estimated by subtracting the
‘Services without BAP’ from the ‘Full implementation of the UK BAP’;
‘Services without BAP’, i.e. the residual level of ecosystem service provision that would be
delivered by habitats in the absence of conservation activities associated with the UK BAP.
Taking the example of the Blanket bogs / climate regulation results from Table 26, the data suggests
that ‘Full implementation of the BAP’ would deliver a relative weighting score of 0.836. This
coefficient is interpreted on a relative scale of 0 = no service delivery to 1 = full service delivery.
Therefore, a value of 0.836 suggests that blanket bogs managed under the UK BAP would deliver
high levels of climate regulation. The second coefficient for Blank bogs / climate regulation in Table
26 relates to the additional ecosystem service that would be delivered by the conservation activities
associated with the UK BAP. So the UK BAP activities in Blanket bogs are responsible for increasing
7 Table 26 is split into two sections: a and b. This split is simply for presentation purposes and the Table should be read as a single table.
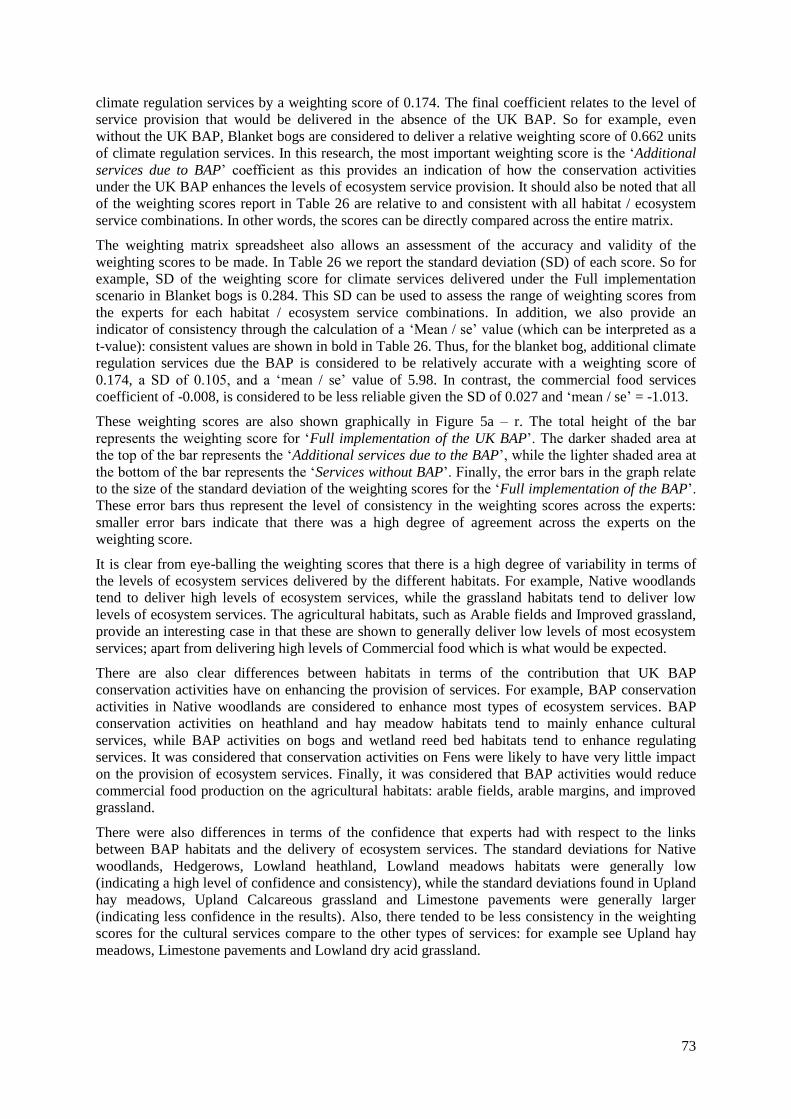
73
climate regulation services by a weighting score of 0.174. The final coefficient relates to the level of
service provision that would be delivered in the absence of the UK BAP. So for example, even
without the UK BAP, Blanket bogs are considered to deliver a relative weighting score of 0.662 units
of climate regulation services. In this research, the most important weighting score is the ‘Additional
services due to BAP’ coefficient as this provides an indication of how the conservation activities
under the UK BAP enhances the levels of ecosystem service provision. It should also be noted that all
of the weighting scores report in Table 26 are relative to and consistent with all habitat / ecosystem
service combinations. In other words, the scores can be directly compared across the entire matrix.
The weighting matrix spreadsheet also allows an assessment of the accuracy and validity of the
weighting scores to be made. In Table 26 we report the standard deviation (SD) of each score. So for
example, SD of the weighting score for climate services delivered under the Full implementation
scenario in Blanket bogs is 0.284. This SD can be used to assess the range of weighting scores from
the experts for each habitat / ecosystem service combinations. In addition, we also provide an
indicator of consistency through the calculation of a ‘Mean / se’ value (which can be interpreted as a
t-value): consistent values are shown in bold in Table 26. Thus, for the blanket bog, additional climate
regulation services due the BAP is considered to be relatively accurate with a weighting score of
0.174, a SD of 0.105, and a ‘mean / se’ value of 5.98. In contrast, the commercial food services
coefficient of -0.008, is considered to be less reliable given the SD of 0.027 and ‘mean / se’ = -1.013.
These weighting scores are also shown graphically in Figure 5a – r. The total height of the bar
represents the weighting score for ‘Full implementation of the UK BAP’. The darker shaded area at
the top of the bar represents the ‘Additional services due to the BAP’, while the lighter shaded area at
the bottom of the bar represents the ‘Services without BAP’. Finally, the error bars in the graph relate
to the size of the standard deviation of the weighting scores for the ‘Full implementation of the BAP’.
These error bars thus represent the level of consistency in the weighting scores across the experts:
smaller error bars indicate that there was a high degree of agreement across the experts on the
weighting score.
It is clear from eye-balling the weighting scores that there is a high degree of variability in terms of
the levels of ecosystem services delivered by the different habitats. For example, Native woodlands
tend to deliver high levels of ecosystem services, while the grassland habitats tend to deliver low
levels of ecosystem services. The agricultural habitats, such as Arable fields and Improved grassland,
provide an interesting case in that these are shown to generally deliver low levels of most ecosystem
services; apart from delivering high levels of Commercial food which is what would be expected.
There are also clear differences between habitats in terms of the contribution that UK BAP
conservation activities have on enhancing the provision of services. For example, BAP conservation
activities in Native woodlands are considered to enhance most types of ecosystem services. BAP
conservation activities on heathland and hay meadow habitats tend to mainly enhance cultural
services, while BAP activities on bogs and wetland reed bed habitats tend to enhance regulating
services. It was considered that conservation activities on Fens were likely to have very little impact
on the provision of ecosystem services. Finally, it was considered that BAP activities would reduce
commercial food production on the agricultural habitats: arable fields, arable margins, and improved
grassland.
There were also differences in terms of the confidence that experts had with respect to the links
between BAP habitats and the delivery of ecosystem services. The standard deviations for Native
woodlands, Hedgerows, Lowland heathland, Lowland meadows habitats were generally low
(indicating a high level of confidence and consistency), while the standard deviations found in Upland
hay meadows, Upland Calcareous grassland and Limestone pavements were generally larger
(indicating less confidence in the results). Also, there tended to be less consistency in the weighting
scores for the cultural services compare to the other types of services: for example see Upland hay
meadows, Limestone pavements and Lowland dry acid grassland.
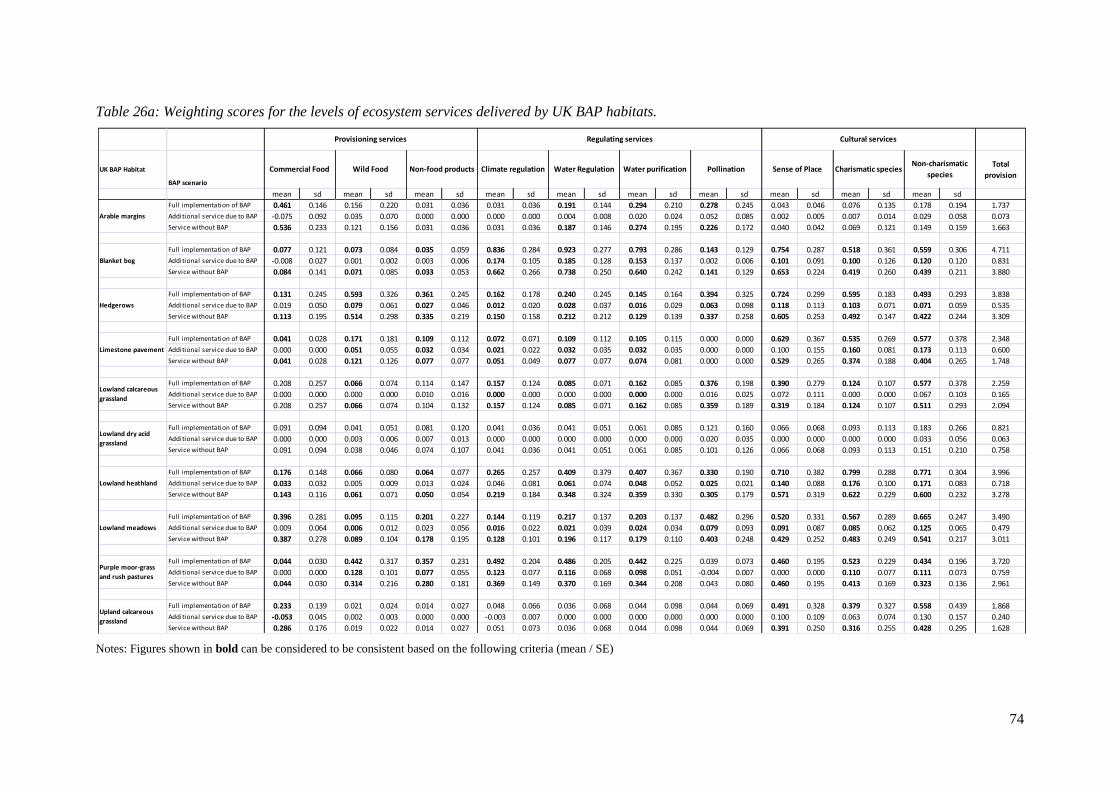
74
Table 26a: Weighting scores for the levels of ecosystem services delivered by UK BAP habitats.
Notes: Figures shown in bold can be considered to be consistent based on the following criteria (mean / SE)
UK BAP Habitat
BAP scenario
Total
provision
mean sd mean sd mean sd mean sd mean sd mean sd mean sd mean sd mean sd mean sd
Full implementation of BAP 0.461 0.146 0.156 0.220 0.031 0.036 0.031 0.036 0.191 0.144 0.294 0.210 0.278 0.245 0.043 0.046 0.076 0.135 0.178 0.194 1.737
Additional service due to BAP -0.075 0.092 0.035 0.070 0.000 0.000 0.000 0.000 0.004 0.008 0.020 0.024 0.052 0.085 0.002 0.005 0.007 0.014 0.029 0.058 0.073
Service without BAP 0.536 0.233 0.121 0.156 0.031 0.036 0.031 0.036 0.187 0.146 0.274 0.195 0.226 0.172 0.040 0.042 0.069 0.121 0.149 0.159 1.663
Full implementation of BAP 0.077 0.121 0.073 0.084 0.035 0.059 0.836 0.284 0.923 0.277 0.793 0.286 0.143 0.129 0.754 0.287 0.518 0.361 0.559 0.306 4.711
Additional service due to BAP -0.008 0.027 0.001 0.002 0.003 0.006 0.174 0.105 0.185 0.128 0.153 0.137 0.002 0.006 0.101 0.091 0.100 0.126 0.120 0.120 0.831
Service without BAP 0.084 0.141 0.071 0.085 0.033 0.053 0.662 0.266 0.738 0.250 0.640 0.242 0.141 0.129 0.653 0.224 0.419 0.260 0.439 0.211 3.880
Full implementation of BAP 0.131 0.245 0.593 0.326 0.361 0.245 0.162 0.178 0.240 0.245 0.145 0.164 0.394 0.325 0.724 0.299 0.595 0.183 0.493 0.293 3.838
Additional service due to BAP 0.019 0.050 0.079 0.061 0.027 0.046 0.012 0.020 0.028 0.037 0.016 0.029 0.063 0.098 0.118 0.113 0.103 0.071 0.071 0.059 0.535
Service without BAP 0.113 0.195 0.514 0.298 0.335 0.219 0.150 0.158 0.212 0.212 0.129 0.139 0.337 0.258 0.605 0.253 0.492 0.147 0.422 0.244 3.309
Full implementation of BAP 0.041 0.028 0.171 0.181 0.109 0.112 0.072 0.071 0.109 0.112 0.105 0.115 0.000 0.000 0.629 0.367 0.535 0.269 0.577 0.378 2.348
Additional service due to BAP 0.000 0.000 0.051 0.055 0.032 0.034 0.021 0.022 0.032 0.035 0.032 0.035 0.000 0.000 0.100 0.155 0.160 0.081 0.173 0.113 0.600
Service without BAP 0.041 0.028 0.121 0.126 0.077 0.077 0.051 0.049 0.077 0.077 0.074 0.081 0.000 0.000 0.529 0.265 0.374 0.188 0.404 0.265 1.748
Full implementation of BAP 0.208 0.257 0.066 0.074 0.114 0.147 0.157 0.124 0.085 0.071 0.162 0.085 0.376 0.198 0.390 0.279 0.124 0.107 0.577 0.378 2.259
Additional service due to BAP 0.000 0.000 0.000 0.000 0.010 0.016 0.000 0.000 0.000 0.000 0.000 0.000 0.016 0.025 0.072 0.111 0.000 0.000 0.067 0.103 0.165
Service without BAP 0.208 0.257 0.066 0.074 0.104 0.132 0.157 0.124 0.085 0.071 0.162 0.085 0.359 0.189 0.319 0.184 0.124 0.107 0.511 0.293 2.094
Full implementation of BAP 0.091 0.094 0.041 0.051 0.081 0.120 0.041 0.036 0.041 0.051 0.061 0.085 0.121 0.160 0.066 0.068 0.093 0.113 0.183 0.266 0.821
Additional service due to BAP 0.000 0.000 0.003 0.006 0.007 0.013 0.000 0.000 0.000 0.000 0.000 0.000 0.020 0.035 0.000 0.000 0.000 0.000 0.033 0.056 0.063
Service without BAP 0.091 0.094 0.038 0.046 0.074 0.107 0.041 0.036 0.041 0.051 0.061 0.085 0.101 0.126 0.066 0.068 0.093 0.113 0.151 0.210 0.758
Full implementation of BAP 0.176 0.148 0.066 0.080 0.064 0.077 0.265 0.257 0.409 0.379 0.407 0.367 0.330 0.190 0.710 0.382 0.799 0.288 0.771 0.304 3.996
Additional service due to BAP 0.033 0.032 0.005 0.009 0.013 0.024 0.046 0.081 0.061 0.074 0.048 0.052 0.025 0.021 0.140 0.088 0.176 0.100 0.171 0.083 0.718
Service without BAP 0.143 0.116 0.061 0.071 0.050 0.054 0.219 0.184 0.348 0.324 0.359 0.330 0.305 0.179 0.571 0.319 0.622 0.229 0.600 0.232 3.278
Full implementation of BAP 0.396 0.281 0.095 0.115 0.201 0.227 0.144 0.119 0.217 0.137 0.203 0.137 0.482 0.296 0.520 0.331 0.567 0.289 0.665 0.247 3.490
Additional service due to BAP 0.009 0.064 0.006 0.012 0.023 0.056 0.016 0.022 0.021 0.039 0.024 0.034 0.079 0.093 0.091 0.087 0.085 0.062 0.125 0.065 0.479
Service without BAP 0.387 0.278 0.089 0.104 0.178 0.195 0.128 0.101 0.196 0.117 0.179 0.110 0.403 0.248 0.429 0.252 0.483 0.249 0.541 0.217 3.011
Full implementation of BAP 0.044 0.030 0.442 0.317 0.357 0.231 0.492 0.204 0.486 0.205 0.442 0.225 0.039 0.073 0.460 0.195 0.523 0.229 0.434 0.196 3.720
Additional service due to BAP 0.000 0.000 0.128 0.101 0.077 0.055 0.123 0.077 0.116 0.068 0.098 0.051 -0.004 0.007 0.000 0.000 0.110 0.077 0.111 0.073 0.759
Service without BAP 0.044 0.030 0.314 0.216 0.280 0.181 0.369 0.149 0.370 0.169 0.344 0.208 0.043 0.080 0.460 0.195 0.413 0.169 0.323 0.136 2.961
Full implementation of BAP 0.233 0.139 0.021 0.024 0.014 0.027 0.048 0.066 0.036 0.068 0.044 0.098 0.044 0.069 0.491 0.328 0.379 0.327 0.558 0.439 1.868
Additional service due to BAP -0.053 0.045 0.002 0.003 0.000 0.000 -0.003 0.007 0.000 0.000 0.000 0.000 0.000 0.000 0.100 0.109 0.063 0.074 0.130 0.157 0.240
Service without BAP 0.286 0.176 0.019 0.022 0.014 0.027 0.051 0.073 0.036 0.068 0.044 0.098 0.044 0.069 0.391 0.250 0.316 0.255 0.428 0.295 1.628
Non-charismatic
species
Provisioning services Regulating services Cultural services
Water Regulation Water purification Pollination Sense of Place Charismatic speciesCommercial Food Wild Food Non-food products Climate regulation
Arable margins
Blanket bog
Hedgerows
Limestone pavement
Lowland calcareous
grassland
Lowland dry acid
grassland
Lowland heathland
Lowland meadows
Purple moor-grass
and rush pastures
Upland calcareous
grassland
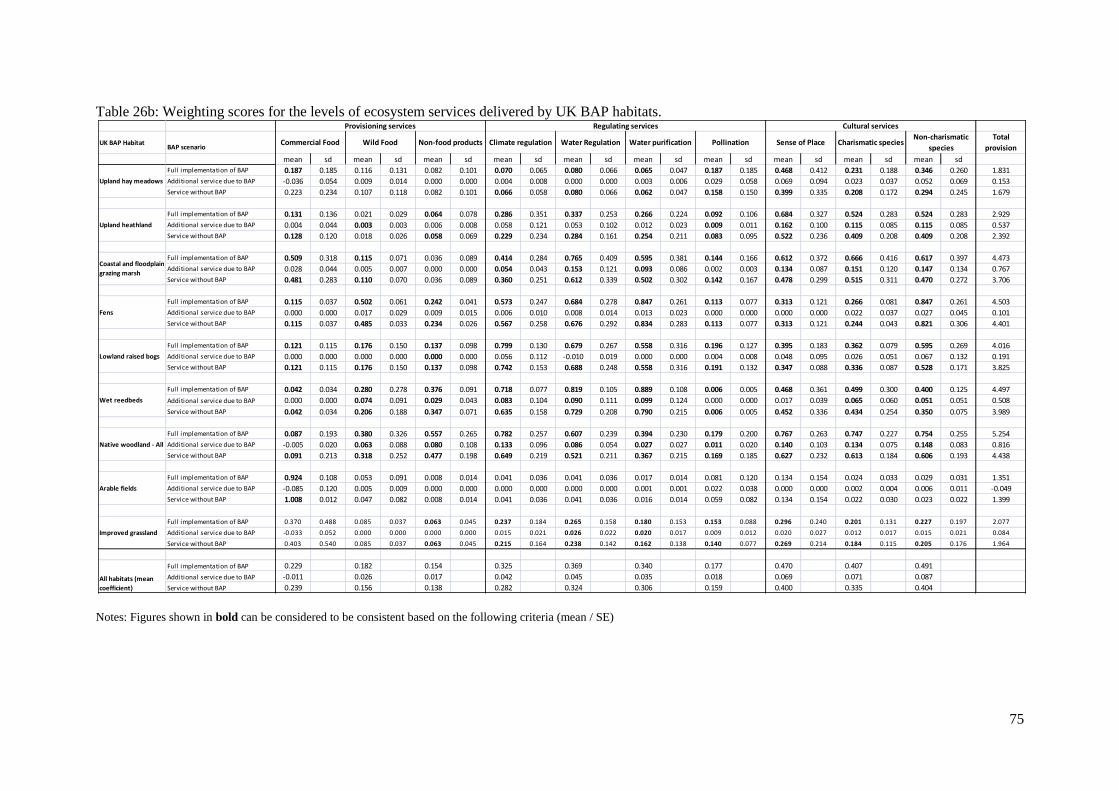
75
Table 26b: Weighting scores for the levels of ecosystem services delivered by UK BAP habitats.
Notes: Figures shown in bold can be considered to be consistent based on the following criteria (mean / SE)
UK BAP HabitatBAP scenario
Total
provision
mean sd mean sd mean sd mean sd mean sd mean sd mean sd mean sd mean sd mean sd
Full implementation of BAP 0.187 0.185 0.116 0.131 0.082 0.101 0.070 0.065 0.080 0.066 0.065 0.047 0.187 0.185 0.468 0.412 0.231 0.188 0.346 0.260 1.831
Additional service due to BAP -0.036 0.054 0.009 0.014 0.000 0.000 0.004 0.008 0.000 0.000 0.003 0.006 0.029 0.058 0.069 0.094 0.023 0.037 0.052 0.069 0.153
Service without BAP 0.223 0.234 0.107 0.118 0.082 0.101 0.066 0.058 0.080 0.066 0.062 0.047 0.158 0.150 0.399 0.335 0.208 0.172 0.294 0.245 1.679
Full implementation of BAP 0.131 0.136 0.021 0.029 0.064 0.078 0.286 0.351 0.337 0.253 0.266 0.224 0.092 0.106 0.684 0.327 0.524 0.283 0.524 0.283 2.929
Additional service due to BAP 0.004 0.044 0.003 0.003 0.006 0.008 0.058 0.121 0.053 0.102 0.012 0.023 0.009 0.011 0.162 0.100 0.115 0.085 0.115 0.085 0.537
Service without BAP 0.128 0.120 0.018 0.026 0.058 0.069 0.229 0.234 0.284 0.161 0.254 0.211 0.083 0.095 0.522 0.236 0.409 0.208 0.409 0.208 2.392
Full implementation of BAP 0.509 0.318 0.115 0.071 0.036 0.089 0.414 0.284 0.765 0.409 0.595 0.381 0.144 0.166 0.612 0.372 0.666 0.416 0.617 0.397 4.473
Additional service due to BAP 0.028 0.044 0.005 0.007 0.000 0.000 0.054 0.043 0.153 0.121 0.093 0.086 0.002 0.003 0.134 0.087 0.151 0.120 0.147 0.134 0.767
Service without BAP 0.481 0.283 0.110 0.070 0.036 0.089 0.360 0.251 0.612 0.339 0.502 0.302 0.142 0.167 0.478 0.299 0.515 0.311 0.470 0.272 3.706
Full implementation of BAP 0.115 0.037 0.502 0.061 0.242 0.041 0.573 0.247 0.684 0.278 0.847 0.261 0.113 0.077 0.313 0.121 0.266 0.081 0.847 0.261 4.503
Additional service due to BAP 0.000 0.000 0.017 0.029 0.009 0.015 0.006 0.010 0.008 0.014 0.013 0.023 0.000 0.000 0.000 0.000 0.022 0.037 0.027 0.045 0.101
Service without BAP 0.115 0.037 0.485 0.033 0.234 0.026 0.567 0.258 0.676 0.292 0.834 0.283 0.113 0.077 0.313 0.121 0.244 0.043 0.821 0.306 4.401
Full implementation of BAP 0.121 0.115 0.176 0.150 0.137 0.098 0.799 0.130 0.679 0.267 0.558 0.316 0.196 0.127 0.395 0.183 0.362 0.079 0.595 0.269 4.016
Additional service due to BAP 0.000 0.000 0.000 0.000 0.000 0.000 0.056 0.112 -0.010 0.019 0.000 0.000 0.004 0.008 0.048 0.095 0.026 0.051 0.067 0.132 0.191
Service without BAP 0.121 0.115 0.176 0.150 0.137 0.098 0.742 0.153 0.688 0.248 0.558 0.316 0.191 0.132 0.347 0.088 0.336 0.087 0.528 0.171 3.825
Full implementation of BAP 0.042 0.034 0.280 0.278 0.376 0.091 0.718 0.077 0.819 0.105 0.889 0.108 0.006 0.005 0.468 0.361 0.499 0.300 0.400 0.125 4.497
Additional service due to BAP 0.000 0.000 0.074 0.091 0.029 0.043 0.083 0.104 0.090 0.111 0.099 0.124 0.000 0.000 0.017 0.039 0.065 0.060 0.051 0.051 0.508
Service without BAP 0.042 0.034 0.206 0.188 0.347 0.071 0.635 0.158 0.729 0.208 0.790 0.215 0.006 0.005 0.452 0.336 0.434 0.254 0.350 0.075 3.989
Full implementation of BAP 0.087 0.193 0.380 0.326 0.557 0.265 0.782 0.257 0.607 0.239 0.394 0.230 0.179 0.200 0.767 0.263 0.747 0.227 0.754 0.255 5.254
Additional service due to BAP -0.005 0.020 0.063 0.088 0.080 0.108 0.133 0.096 0.086 0.054 0.027 0.027 0.011 0.020 0.140 0.103 0.134 0.075 0.148 0.083 0.816
Service without BAP 0.091 0.213 0.318 0.252 0.477 0.198 0.649 0.219 0.521 0.211 0.367 0.215 0.169 0.185 0.627 0.232 0.613 0.184 0.606 0.193 4.438
Full implementation of BAP 0.924 0.108 0.053 0.091 0.008 0.014 0.041 0.036 0.041 0.036 0.017 0.014 0.081 0.120 0.134 0.154 0.024 0.033 0.029 0.031 1.351
Additional service due to BAP -0.085 0.120 0.005 0.009 0.000 0.000 0.000 0.000 0.000 0.000 0.001 0.001 0.022 0.038 0.000 0.000 0.002 0.004 0.006 0.011 -0.049
Service without BAP 1.008 0.012 0.047 0.082 0.008 0.014 0.041 0.036 0.041 0.036 0.016 0.014 0.059 0.082 0.134 0.154 0.022 0.030 0.023 0.022 1.399
Full implementation of BAP 0.370 0.488 0.085 0.037 0.063 0.045 0.237 0.184 0.265 0.158 0.180 0.153 0.153 0.088 0.296 0.240 0.201 0.131 0.227 0.197 2.077
Additional service due to BAP -0.033 0.052 0.000 0.000 0.000 0.000 0.015 0.021 0.026 0.022 0.020 0.017 0.009 0.012 0.020 0.027 0.012 0.017 0.015 0.021 0.084
Service without BAP 0.403 0.540 0.085 0.037 0.063 0.045 0.215 0.164 0.238 0.142 0.162 0.138 0.140 0.077 0.269 0.214 0.184 0.115 0.205 0.176 1.964
Full implementation of BAP 0.229 0.182 0.154 0.325 0.369 0.340 0.177 0.470 0.407 0.491
Additional service due to BAP -0.011 0.026 0.017 0.042 0.045 0.035 0.018 0.069 0.071 0.087
Service without BAP 0.239 0.156 0.138 0.282 0.324 0.306 0.159 0.400 0.335 0.404All habitats (mean
coefficient)
Wet reedbeds
Native woodland - All
Arable fields
Improved grassland
Upland hay meadows
Upland heathland
Coastal and floodplain
grazing marsh
Fens
Lowland raised bogs
Provisioning services Regulating services Cultural services
Commercial Food Wild Food Non-food products Climate regulation Water Regulation Water purification Pollination Sense of Place Charismatic speciesNon-charismatic
species
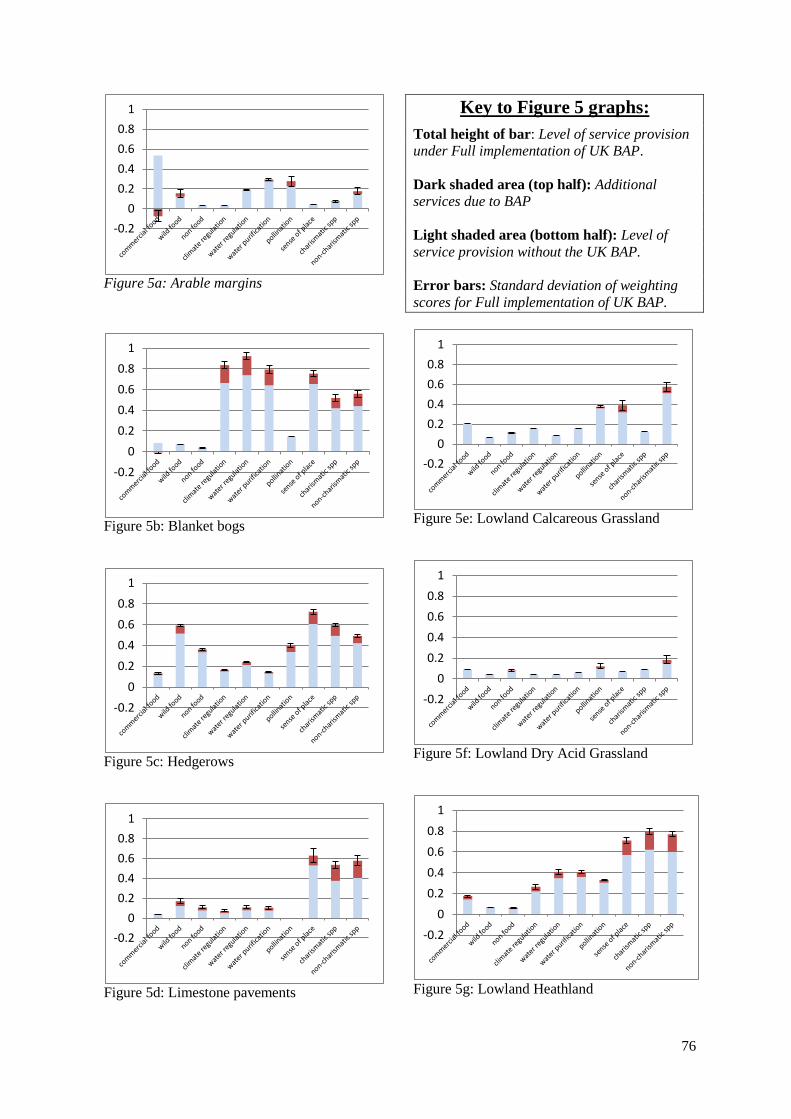
76
Figure 5a: Arable margins
Figure 5b: Blanket bogs
Figure 5c: Hedgerows
Figure 5d: Limestone pavements
Key to Figure 5 graphs:
Total height of bar: Level of service provision
under Full implementation of UK BAP.
Dark shaded area (top half): Additional
services due to BAP
Light shaded area (bottom half): Level of
service provision without the UK BAP.
Error bars: Standard deviation of weighting
scores for Full implementation of UK BAP.
Figure 5e: Lowland Calcareous Grassland
Figure 5f: Lowland Dry Acid Grassland
Figure 5g: Lowland Heathland
-0.2
0
0.2
0.4
0.6
0.8
1
-0.2
0
0.2
0.4
0.6
0.8
1
-0.2
0
0.2
0.4
0.6
0.8
1
-0.2
0
0.2
0.4
0.6
0.8
1
-0.2
0
0.2
0.4
0.6
0.8
1
-0.2
0
0.2
0.4
0.6
0.8
1
-0.2
0
0.2
0.4
0.6
0.8
1
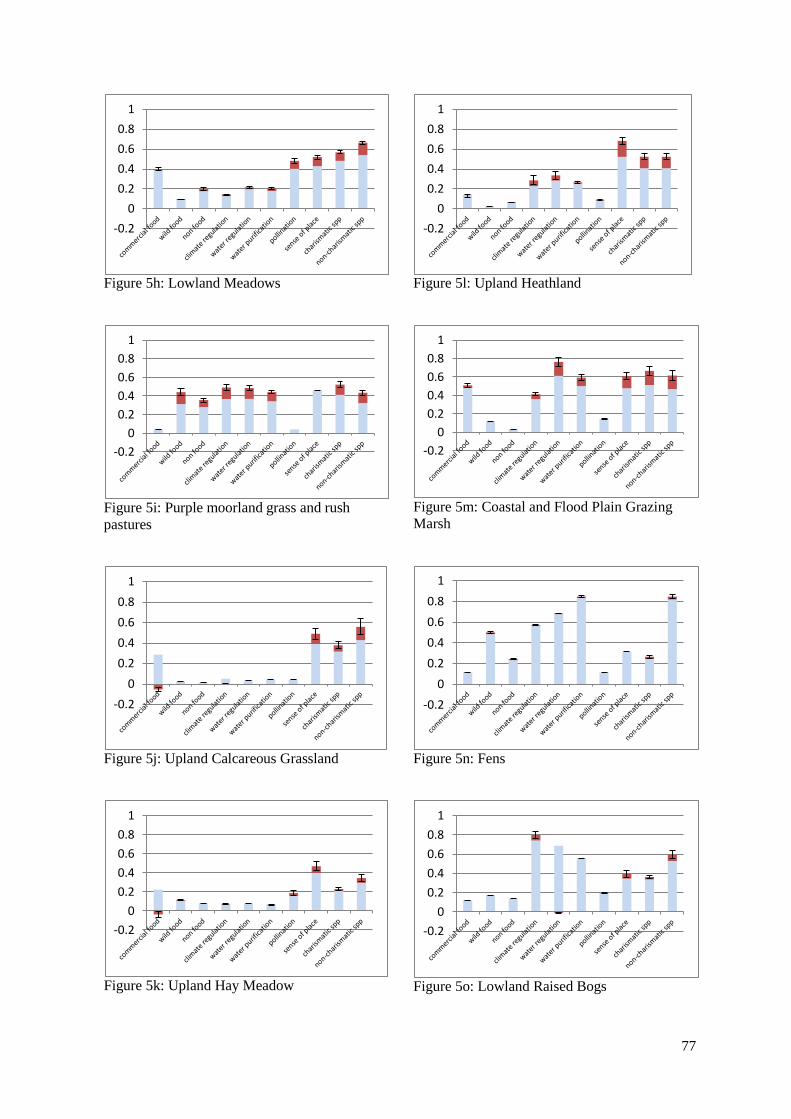
77
Figure 5h: Lowland Meadows
Figure 5i: Purple moorland grass and rush
pastures
Figure 5j: Upland Calcareous Grassland
Figure 5k: Upland Hay Meadow
Figure 5l: Upland Heathland
Figure 5m: Coastal and Flood Plain Grazing
Marsh
Figure 5n: Fens
Figure 5o: Lowland Raised Bogs
-0.2
0
0.2
0.4
0.6
0.8
1
-0.2
0
0.2
0.4
0.6
0.8
1
-0.2
0
0.2
0.4
0.6
0.8
1
-0.2
0
0.2
0.4
0.6
0.8
1
-0.2
0
0.2
0.4
0.6
0.8
1
-0.2
0
0.2
0.4
0.6
0.8
1
-0.2
0
0.2
0.4
0.6
0.8
1
-0.2
0
0.2
0.4
0.6
0.8
1
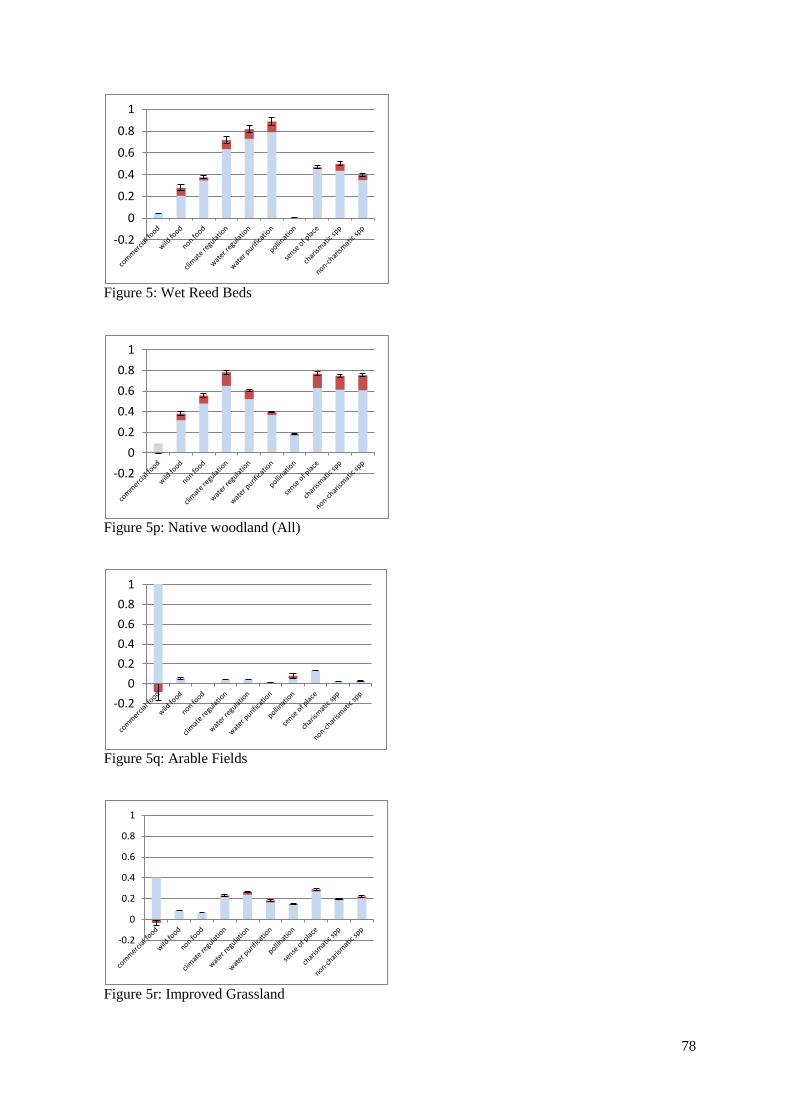
78
Figure 5: Wet Reed Beds
Figure 5p: Native woodland (All)
Figure 5q: Arable Fields
Figure 5r: Improved Grassland
-0.2
0
0.2
0.4
0.6
0.8
1
-0.2
0
0.2
0.4
0.6
0.8
1
-0.2
0
0.2
0.4
0.6
0.8
1
-0.2
0
0.2
0.4
0.6
0.8
1
79
9. Step 3 Results: Value of ecosystem services direct attributable to the UK BAP.
The final step of the analysis is to estimate the value of additional ecosystem services that are
directly attributable to the conservation activities funded through the UK BAP.
The analysis is split into three sections. First, we estimate the relative contribution of each BAP
habitat to the delivery of ecosystem services within each region (Section 9.1). This information is
then used (along with estimates of the value of ecosystem services associated with UK BAP habitats:
from Section 7.5.1) to estimate the value of ecosystem services provided by each BAP habitats
within each region (Section 9.2). Next, based on the assessment of the additional contribution that
conservation activities have for the delivery of ecosystem services (from the weighting matrix:
Section 8), we estimate the value of the ecosystem services directly attributable to the UK BAP
conservation activities (Section 9.3). It is this element of analysis that is of critical importance to the
aims of this research as this assessment provides a measure of the benefits associated with the
expenditure on the UK BAP.
9.1. Contribution of BAP habitats to the delivery of ecosystem services within each region.
A key step to assigning the ecosystem service values across the various BAP habitats is to estimate
the relative contribution of each habitat to the delivery of ecosystem services within each region.
This is achieved by dividing the area of a particular BAP habitat within a particular region with the
total area of all BAP habitats within that region. This figure was then adjusted by a factor of 0.7 to
account for the fact that the full implementation of the BAP targets aims to include 70% of the total
area of BAP habitat. To illustrate this calculation, we use the example of Blanket bogs in Scotland.
In Scotland, the total current area of BAP habitats is 4,379,000 Ha, of which the area of Blanket bog
accounts for 1759,000 Ha. Assuming that full implementation of the UK BAP will target 70% of
current habitat area, BAP targets for blanket bogs in Scotland will account for 28.1% of all land
within BAP habitats in Scotland, i.e. 1759,000 / 4379,000 * 0.70 = 0.281. Table 12 (Section 4.3.1)
summarises the current area of each of the 19 broad BAP habitats by region, while Table 27 reports
the estimated relative contribution of each habitat to the delivery of ecosystem services within each
region. These figures for relative contribution are used in the next stage to help allocate the total
value of ecosystem services delivered by BAP habitats within a region to individual habitats.
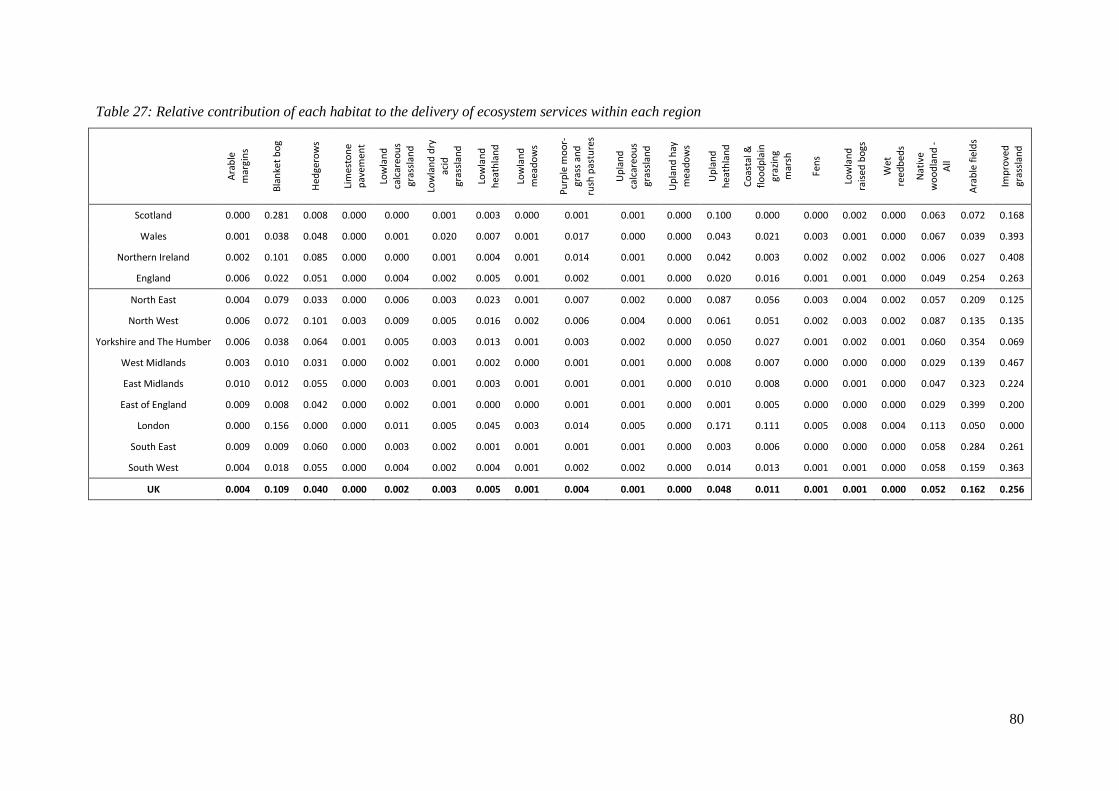
80
Table 27: Relative contribution of each habitat to the delivery of ecosystem services within each region
Ara
ble
m
argi
ns
Bla
nke
t b
og
Hed
gero
ws
Lim
esto
ne
pav
emen
t
Low
lan
d
calc
areo
us
gras
slan
d
Low
lan
d d
ry
acid
gr
assl
and
Low
lan
d
hea
thla
nd
Low
lan
d
mea
do
ws
Pu
rple
mo
or-
gras
s an
d
rush
pas
ture
s
Up
lan
d
calc
areo
us
gras
slan
d
Up
lan
d h
ay
mea
do
ws
Up
lan
d
hea
thla
nd
Co
asta
l &
flo
od
pla
in
graz
ing
mar
sh
Fen
s
Low
lan
d
rais
ed b
ogs
Wet
re
edb
eds
Nat
ive
wo
od
lan
d -
A
ll
Ara
ble
fie
lds
Imp
rove
d
gras
slan
d
Scotland 0.000 0.281 0.008 0.000 0.000 0.001 0.003 0.000 0.001 0.001 0.000 0.100 0.000 0.000 0.002 0.000 0.063 0.072 0.168
Wales 0.001 0.038 0.048 0.000 0.001 0.020 0.007 0.001 0.017 0.000 0.000 0.043 0.021 0.003 0.001 0.000 0.067 0.039 0.393
Northern Ireland 0.002 0.101 0.085 0.000 0.000 0.001 0.004 0.001 0.014 0.001 0.000 0.042 0.003 0.002 0.002 0.002 0.006 0.027 0.408
England 0.006 0.022 0.051 0.000 0.004 0.002 0.005 0.001 0.002 0.001 0.000 0.020 0.016 0.001 0.001 0.000 0.049 0.254 0.263
North East 0.004 0.079 0.033 0.000 0.006 0.003 0.023 0.001 0.007 0.002 0.000 0.087 0.056 0.003 0.004 0.002 0.057 0.209 0.125
North West 0.006 0.072 0.101 0.003 0.009 0.005 0.016 0.002 0.006 0.004 0.000 0.061 0.051 0.002 0.003 0.002 0.087 0.135 0.135
Yorkshire and The Humber 0.006 0.038 0.064 0.001 0.005 0.003 0.013 0.001 0.003 0.002 0.000 0.050 0.027 0.001 0.002 0.001 0.060 0.354 0.069
West Midlands 0.003 0.010 0.031 0.000 0.002 0.001 0.002 0.000 0.001 0.001 0.000 0.008 0.007 0.000 0.000 0.000 0.029 0.139 0.467
East Midlands 0.010 0.012 0.055 0.000 0.003 0.001 0.003 0.001 0.001 0.001 0.000 0.010 0.008 0.000 0.001 0.000 0.047 0.323 0.224
East of England 0.009 0.008 0.042 0.000 0.002 0.001 0.000 0.000 0.001 0.001 0.000 0.001 0.005 0.000 0.000 0.000 0.029 0.399 0.200
London 0.000 0.156 0.000 0.000 0.011 0.005 0.045 0.003 0.014 0.005 0.000 0.171 0.111 0.005 0.008 0.004 0.113 0.050 0.000
South East 0.009 0.009 0.060 0.000 0.003 0.002 0.001 0.001 0.001 0.001 0.000 0.003 0.006 0.000 0.000 0.000 0.058 0.284 0.261
South West 0.004 0.018 0.055 0.000 0.004 0.002 0.004 0.001 0.002 0.002 0.000 0.014 0.013 0.001 0.001 0.000 0.058 0.159 0.363
UK 0.004 0.109 0.040 0.000 0.002 0.003 0.005 0.001 0.004 0.001 0.000 0.048 0.011 0.001 0.001 0.000 0.052 0.162 0.256
81
9.2. Value of ecosystem services by BAP habitats.
Below, we estimate that value of the ecosystem services delivered by the conservation activities
under the Increased Spend of the UK BAP and for the Current spend scenarios for all 19 UK BAP
broad habitats. This analysis is achieved by multiplying the consumer surplus values for the
ecosystem service delivered by the UK BAP habitats (as derived from the ‘pooled’ UK choice
experiment data: see last column in Table 20, Table 23 and Table 24 for the household consumer
surplus values) X the % contribution of a habitat to the provision of services within a particular
region (Table 27) X the weighting score for the additional services delivered as a direct consequence
of the BAP conservation activities (derived from the weighting matrix: Table 26).
To illustrate, the marginal benefit of climate regulating services directly attributable to actions under
the Increased spend scenario of the ‘Blanket bog’ BAP habitat (compared to the Current spend
scenario) in the UK as a whole (£1.85 per household per year: see Table 28) was estimated by
multiplying the value of climate regulation services delivered by Blanket bog habitats (£97.65 per
household per annum: Table 20) X the contribution that the UK BAP brings to the delivery of
climate regulating services in blanket bogs (0.109: see Table 27) X the weighting score for the
additional climate regulation services delivered as a direct consequence of the conservation activities
under the Increased spend scenario (0.174: Table 26).
This analysis produced two sets of results:
Table 28: £ per household per annum for the Increased spend scenario
Table 29: £ per household per annum for the Current spend scenario
These household values were then multiplied by the number of households in the UK (25 million) to
provide aggregate values for the two BAP scenarios:
Table 30: Aggregate value (£m per annum) for the Increased spend scenario
Table 31: Aggregate value (£m per annum) for the Current spend scenario
Each of these four results tables are split into three sections. The first section relates to the marginal
benefits for ecosystem services delivered within the respondent’s ‘own region’, the second section is
for the marginal benefit that people in the ‘rest of the UK’ attain from the ecosystem services
delivered within the region of interest, and finally the last section relates to the total marginal
benefits of the ecosystem services delivered by the UK BAP (i.e. the summation of the ‘within own
region’ and ‘rest of UK’).
9.2.1. Household values of ecosystem services delivered by BAP conservation activities by BAP
habitats.
Table 28 and Table 29 respectively summarise the £ / household / yr values for the ecosystem
services delivered by BAP conservation activities under the Increased spend and Current spend
scenarios across the whole of the UK. In both cases, this analysis is based on the data from the UK
‘pooled’ sample of the choice experiment.
Turning first to Table 28 (Increased spend scenario), people had the highest values for the
ecosystem services delivered by BAP activities on Blanket bogs (£11.98 / household / yr), native
woodland (£5.75 / household / yr), improved grassland (£3.62 / household / yr), and hedgerows
(£2.48 / household / yr). UK BAP conservation activities on Upland hay meadows, Limestone
pavements, Lowland meadows, Lowland dry acid grassland, Fens and Arable margins were
considered to deliver ecosystem services that had virtually no value to respondents.
A similar situation was found for the Current spend scenario (Table 29), however the mean values
were generally higher than the Increased spend scenario. Thus, for the Increased spend scenario,
people again attained the highest values for the ecosystem services by BAP activities on Blanket bog
82
(£24.27 / household / yr), native woodland (£10.33 / household / yr), improved grassland (£6.87 /
household / yr), Upland heathland (£5.81 / household / yr), and hedgerows (£3.46 / household / yr).
Again, Limestone pavements, Lowland dry acid grassland, Upland hay meadows, Fens and Arable
margins attained very low values (>£0.04 / household / yr).
The underlying drivers for these values can be identified by going back through the various tables
used in the analysis. For example, the high value for Native woodland and Blanket bogs are largely
driven by the high weighting scores for additional services across most of the ecosystem service
categories (Table 26). The relatively high value for improved grassland can largely be traced back to
the large area of this habitat (Table 12). Arable land also covers a large area (Table 12); however, it
received very low weighting scores for the additional services provided by the BAP in the weighting
matrix (Table 26).
9.2.2. Total values of ecosystem services delivered by BAP conservation activities by BAP
habitats.
The analysis reported above was also aggregated to the UK population to provide estimates of the
total value of the ecosystem services delivered by the BAP conservation activities (Table 30 and
Table 31). Again, this analysis is based on the data from the UK ‘pooled’ sample of the choice
experiment.
In the Increased spend scenario (Table 30), people had the highest values for the ecosystem services
delivered by BAP activities on Blanket bog (£299.73m / yr), native woodland (£143.79m / yr),
Upland heath (£94.58m / yr), Improved grassland (£90.66m / yr), and hedgerows (£62.05m / yr).
Upland hay meadows, Lowland dry acid grassland, Limestone pavements, Lowland hay meadows,
Fens, Wet reed beds, Arable margins and Lowland raised bogs were associated with virtually no
value (>£1.0m per annum).
The total values for the Current spend scenario (Table 31) were again higher than those in the Full
implementation scenario. Here, the total values included: Blanket bog (£607.48m / yr), native
woodland (£258.57m / yr), Improved grassland (£171.94m / yr), Upland heath (£145.38) and
hedgerows (£86.581m / yr). The underlying drivers for these total values are the same as that
described above for the household values.
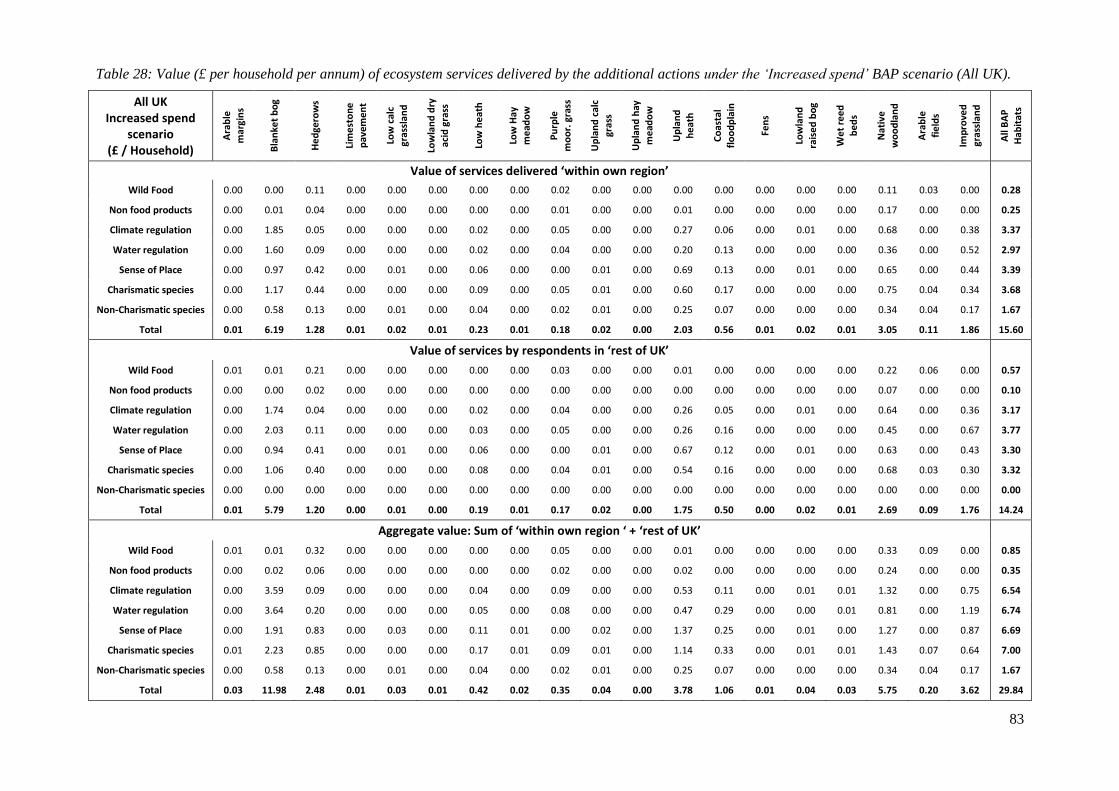
83
Table 28: Value (£ per household per annum) of ecosystem services delivered by the additional actions under the ‘Increased spend’ BAP scenario (All UK).
All UK Increased spend
scenario (£ / Household)
Ara
ble
mar
gin
s
Bla
nke
t b
og
He
dge
row
s
Lim
est
on
e
pav
emen
t
Low
cal
c gr
assl
and
Low
lan
d d
ry
acid
gra
ss
Low
he
ath
Low
Hay
m
ead
ow
Pu
rple
m
oo
r. g
rass
Up
lan
d c
alc
gras
s
Up
lan
d h
ay
me
ado
w
Up
lan
d
he
ath
Co
asta
l fl
oo
dp
lain
Fen
s
Low
lan
d
rais
ed
bo
g
We
t re
ed
b
ed
s
Nat
ive
w
oo
dla
nd
Ara
ble
fie
lds
Imp
rove
d
gras
slan
d
All
BA
P
Hab
itat
s
Value of services delivered ‘within own region’
Wild Food 0.00 0.00 0.11 0.00 0.00 0.00 0.00 0.00 0.02 0.00 0.00 0.00 0.00 0.00 0.00 0.00 0.11 0.03 0.00 0.28
Non food products 0.00 0.01 0.04 0.00 0.00 0.00 0.00 0.00 0.01 0.00 0.00 0.01 0.00 0.00 0.00 0.00 0.17 0.00 0.00 0.25
Climate regulation 0.00 1.85 0.05 0.00 0.00 0.00 0.02 0.00 0.05 0.00 0.00 0.27 0.06 0.00 0.01 0.00 0.68 0.00 0.38 3.37
Water regulation 0.00 1.60 0.09 0.00 0.00 0.00 0.02 0.00 0.04 0.00 0.00 0.20 0.13 0.00 0.00 0.00 0.36 0.00 0.52 2.97
Sense of Place 0.00 0.97 0.42 0.00 0.01 0.00 0.06 0.00 0.00 0.01 0.00 0.69 0.13 0.00 0.01 0.00 0.65 0.00 0.44 3.39
Charismatic species 0.00 1.17 0.44 0.00 0.00 0.00 0.09 0.00 0.05 0.01 0.00 0.60 0.17 0.00 0.00 0.00 0.75 0.04 0.34 3.68
Non-Charismatic species 0.00 0.58 0.13 0.00 0.01 0.00 0.04 0.00 0.02 0.01 0.00 0.25 0.07 0.00 0.00 0.00 0.34 0.04 0.17 1.67
Total 0.01 6.19 1.28 0.01 0.02 0.01 0.23 0.01 0.18 0.02 0.00 2.03 0.56 0.01 0.02 0.01 3.05 0.11 1.86 15.60
Value of services by respondents in ‘rest of UK’
Wild Food 0.01 0.01 0.21 0.00 0.00 0.00 0.00 0.00 0.03 0.00 0.00 0.01 0.00 0.00 0.00 0.00 0.22 0.06 0.00 0.57
Non food products 0.00 0.00 0.02 0.00 0.00 0.00 0.00 0.00 0.00 0.00 0.00 0.00 0.00 0.00 0.00 0.00 0.07 0.00 0.00 0.10
Climate regulation 0.00 1.74 0.04 0.00 0.00 0.00 0.02 0.00 0.04 0.00 0.00 0.26 0.05 0.00 0.01 0.00 0.64 0.00 0.36 3.17
Water regulation 0.00 2.03 0.11 0.00 0.00 0.00 0.03 0.00 0.05 0.00 0.00 0.26 0.16 0.00 0.00 0.00 0.45 0.00 0.67 3.77
Sense of Place 0.00 0.94 0.41 0.00 0.01 0.00 0.06 0.00 0.00 0.01 0.00 0.67 0.12 0.00 0.01 0.00 0.63 0.00 0.43 3.30
Charismatic species 0.00 1.06 0.40 0.00 0.00 0.00 0.08 0.00 0.04 0.01 0.00 0.54 0.16 0.00 0.00 0.00 0.68 0.03 0.30 3.32
Non-Charismatic species 0.00 0.00 0.00 0.00 0.00 0.00 0.00 0.00 0.00 0.00 0.00 0.00 0.00 0.00 0.00 0.00 0.00 0.00 0.00 0.00
Total 0.01 5.79 1.20 0.00 0.01 0.00 0.19 0.01 0.17 0.02 0.00 1.75 0.50 0.00 0.02 0.01 2.69 0.09 1.76 14.24
Aggregate value: Sum of ‘within own region ‘ + ‘rest of UK’
Wild Food 0.01 0.01 0.32 0.00 0.00 0.00 0.00 0.00 0.05 0.00 0.00 0.01 0.00 0.00 0.00 0.00 0.33 0.09 0.00 0.85
Non food products 0.00 0.02 0.06 0.00 0.00 0.00 0.00 0.00 0.02 0.00 0.00 0.02 0.00 0.00 0.00 0.00 0.24 0.00 0.00 0.35
Climate regulation 0.00 3.59 0.09 0.00 0.00 0.00 0.04 0.00 0.09 0.00 0.00 0.53 0.11 0.00 0.01 0.01 1.32 0.00 0.75 6.54
Water regulation 0.00 3.64 0.20 0.00 0.00 0.00 0.05 0.00 0.08 0.00 0.00 0.47 0.29 0.00 0.00 0.01 0.81 0.00 1.19 6.74
Sense of Place 0.00 1.91 0.83 0.00 0.03 0.00 0.11 0.01 0.00 0.02 0.00 1.37 0.25 0.00 0.01 0.00 1.27 0.00 0.87 6.69
Charismatic species 0.01 2.23 0.85 0.00 0.00 0.00 0.17 0.01 0.09 0.01 0.00 1.14 0.33 0.00 0.01 0.01 1.43 0.07 0.64 7.00
Non-Charismatic species 0.00 0.58 0.13 0.00 0.01 0.00 0.04 0.00 0.02 0.01 0.00 0.25 0.07 0.00 0.00 0.00 0.34 0.04 0.17 1.67
Total 0.03 11.98 2.48 0.01 0.03 0.01 0.42 0.02 0.35 0.04 0.00 3.78 1.06 0.01 0.04 0.03 5.75 0.20 3.62 29.84

84
Table 29: Value (£ per household per annum) of ecosystem services delivered by the additional actions under the ‘Current spend’ BAP scenario (All UK).
All UK Current spend
scenario (£ / Household)
Ara
ble
m
argi
ns
Bla
nke
t b
og
He
dge
row
s
Lim
est
on
e
pav
emen
t
Low
cal
c
gras
slan
d
Low
dry
acid
gra
ss
Low
lan
d
he
ath
Low
Hay
m
ead
ow
Pu
rple
m
oo
r. g
rass
Up
lan
d c
alc
gras
s
Up
lan
d h
ay
me
ado
w
Up
lan
d
he
ath
Co
asta
l fl
oo
dp
lain
Fen
s
Low
lan
d
rais
ed
bo
g
We
t re
ed
be
ds
Nat
ive
wo
od
lan
d
Ara
ble
fie
lds
Imp
rove
d
gras
slan
d
All
BA
P
hab
itat
s
Value of services delivered ‘within own region’
Wild Food 0.01 0.01 0.25 0.00 0.00 0.00 0.00 0.00 0.04 0.00 0.00 0.01 0.00 0.00 0.00 0.00 0.26 0.07 0.00 0.66
Non food products 0.00 0.02 0.06 0.00 0.00 0.00 0.00 0.00 0.02 0.00 0.00 0.02 0.00 0.00 0.00 0.00 0.22 0.00 0.00 0.33
Climate regulation 0.00 3.19 0.08 0.00 0.00 0.00 0.04 0.00 0.08 0.00 0.00 0.47 0.10 0.00 0.01 0.01 1.17 0.00 0.66 5.80
Water regulation 0.00 3.01 0.17 0.00 0.00 0.00 0.04 0.00 0.07 0.00 0.00 0.39 0.24 0.00 0.00 0.01 0.67 0.00 0.99 5.59
Sense of Place 0.00 0.77 0.34 0.00 0.01 0.00 0.05 0.00 0.00 0.01 0.00 0.55 0.10 0.00 0.00 0.00 0.51 0.00 0.35 2.70
Charismatic species 0.00 1.25 0.47 0.00 0.00 0.00 0.09 0.01 0.05 0.01 0.00 0.64 0.19 0.00 0.00 0.00 0.80 0.04 0.36 3.92
Non-Charismatic species 0.01 1.16 0.25 0.00 0.01 0.01 0.07 0.01 0.04 0.01 0.00 0.49 0.14 0.00 0.01 0.00 0.68 0.09 0.35 3.33
Total 0.02 9.40 1.62 0.01 0.02 0.01 0.30 0.02 0.29 0.03 0.00 2.56 0.77 0.01 0.03 0.02 4.32 0.19 2.71 22.33
Value of services by respondents in ‘rest of UK’
Wild Food 0.01 0.01 0.13 0.00 0.00 0.00 0.00 0.00 0.02 0.00 0.00 0.01 0.00 0.00 0.00 0.00 0.13 0.03 0.00 0.34
Non food products 0.00 0.04 0.15 0.00 0.00 0.00 0.01 0.00 0.04 0.00 0.00 0.04 0.00 0.00 0.00 0.00 0.58 0.00 0.00 0.87
Climate regulation 0.00 5.88 0.15 0.00 0.00 0.00 0.07 0.00 0.15 0.00 0.00 0.87 0.18 0.00 0.02 0.01 2.16 0.00 1.22 10.71
Water regulation 0.00 6.24 0.35 0.00 0.00 0.00 0.09 0.00 0.14 0.00 0.00 0.80 0.51 0.00 0.00 0.01 1.39 0.00 2.04 11.57
Sense of Place 0.00 0.73 0.32 0.00 0.01 0.00 0.04 0.00 0.00 0.01 0.00 0.52 0.09 0.00 0.00 0.00 0.49 0.00 0.33 2.55
Charismatic species 0.00 1.98 0.75 0.00 0.00 0.00 0.15 0.01 0.08 0.01 0.00 1.02 0.29 0.00 0.01 0.01 1.27 0.06 0.57 6.22
Non-Charismatic species 0.00 0.00 0.00 0.00 0.00 0.00 0.00 0.00 0.00 0.00 0.00 0.00 0.00 0.00 0.00 0.00 0.00 0.00 0.00 0.00
Total 0.01 14.87 1.84 0.01 0.01 0.00 0.36 0.02 0.43 0.02 0.00 3.25 1.08 0.01 0.03 0.03 6.02 0.10 4.16 32.25
Aggregate value: Sum of ‘within own region ‘ + ‘rest of UK’
Wild Food 0.02 0.02 0.38 0.00 0.00 0.00 0.00 0.00 0.06 0.00 0.00 0.02 0.01 0.00 0.00 0.00 0.39 0.10 0.00 0.99
Non food products 0.00 0.05 0.21 0.00 0.00 0.00 0.01 0.00 0.06 0.00 0.00 0.05 0.00 0.00 0.00 0.00 0.80 0.00 0.00 1.20
Climate regulation 0.00 9.07 0.23 0.00 0.00 0.00 0.10 0.00 0.23 0.00 0.00 1.33 0.28 0.00 0.04 0.02 3.32 0.00 1.89 16.52
Water regulation 0.01 9.25 0.52 0.00 0.00 0.00 0.13 0.01 0.21 0.00 0.00 1.18 0.75 0.00 -0.01 0.02 2.06 0.00 3.03 17.16
Sense of Place 0.00 1.50 0.65 0.00 0.02 0.00 0.09 0.01 0.00 0.02 0.00 1.07 0.20 0.00 0.01 0.00 1.00 0.00 0.69 5.25
Charismatic species 0.01 3.23 1.23 0.01 0.00 0.00 0.25 0.01 0.13 0.02 0.00 1.66 0.48 0.01 0.01 0.01 2.08 0.10 0.92 10.14
Non-Charismatic species 0.01 1.16 0.25 0.00 0.01 0.01 0.07 0.01 0.04 0.01 0.00 0.49 0.14 0.00 0.01 0.00 0.68 0.09 0.35 3.33
Total 0.04 24.27 3.46 0.01 0.04 0.01 0.65 0.04 0.72 0.05 0.00 5.81 1.85 0.02 0.06 0.06 10.33 0.29 6.87 54.58
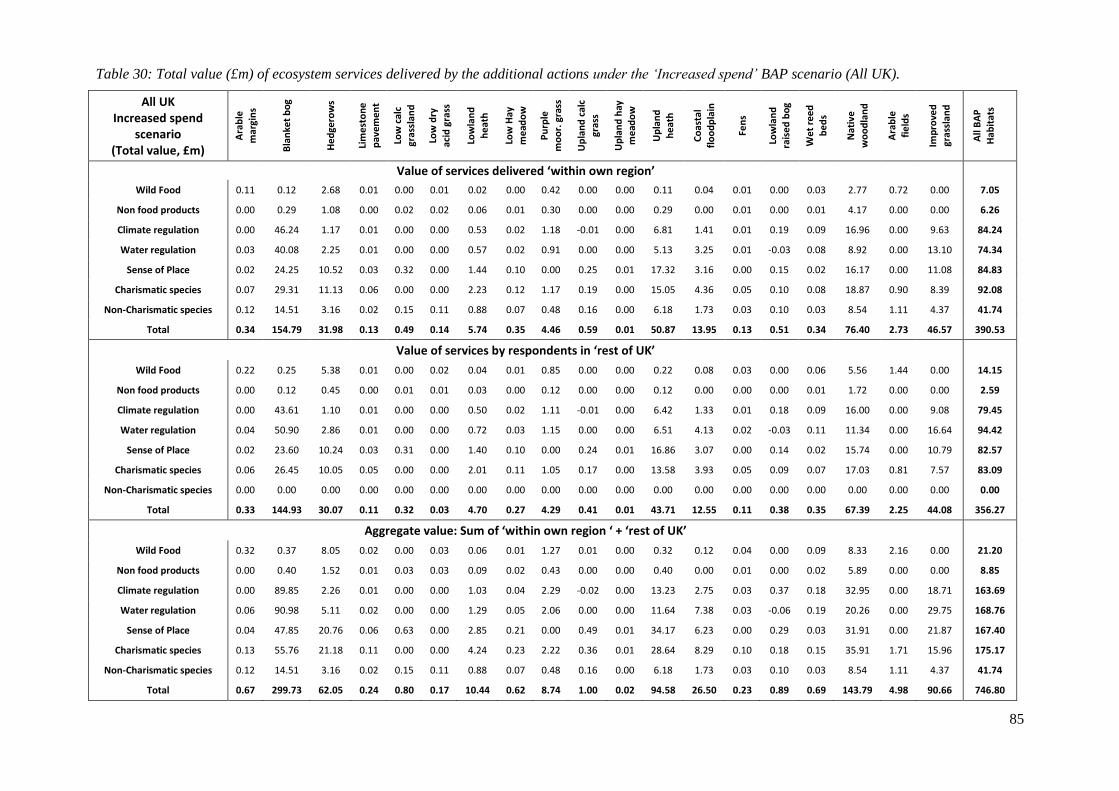
85
Table 30: Total value (£m) of ecosystem services delivered by the additional actions under the ‘Increased spend’ BAP scenario (All UK).
All UK Increased spend
scenario (Total value, £m)
Ara
ble
m
argi
ns
Bla
nke
t b
og
He
dge
row
s
Lim
est
on
e
pav
emen
t
Low
cal
c gr
assl
and
Low
dry
acid
gra
ss
Low
lan
d
he
ath
Low
Hay
me
ado
w
Pu
rple
mo
or.
gra
ss
Up
lan
d c
alc
gras
s
Up
lan
d h
ay
me
ado
w
Up
lan
d
he
ath
Co
asta
l fl
oo
dp
lain
Fen
s
Low
lan
d
rais
ed
bo
g
We
t re
ed
b
ed
s
Nat
ive
wo
od
lan
d
Ara
ble
fi
eld
s
Imp
rove
d
gras
slan
d
All
BA
P
Hab
itat
s
Value of services delivered ‘within own region’
Wild Food 0.11 0.12 2.68 0.01 0.00 0.01 0.02 0.00 0.42 0.00 0.00 0.11 0.04 0.01 0.00 0.03 2.77 0.72 0.00 7.05
Non food products 0.00 0.29 1.08 0.00 0.02 0.02 0.06 0.01 0.30 0.00 0.00 0.29 0.00 0.01 0.00 0.01 4.17 0.00 0.00 6.26
Climate regulation 0.00 46.24 1.17 0.01 0.00 0.00 0.53 0.02 1.18 -0.01 0.00 6.81 1.41 0.01 0.19 0.09 16.96 0.00 9.63 84.24
Water regulation 0.03 40.08 2.25 0.01 0.00 0.00 0.57 0.02 0.91 0.00 0.00 5.13 3.25 0.01 -0.03 0.08 8.92 0.00 13.10 74.34
Sense of Place 0.02 24.25 10.52 0.03 0.32 0.00 1.44 0.10 0.00 0.25 0.01 17.32 3.16 0.00 0.15 0.02 16.17 0.00 11.08 84.83
Charismatic species 0.07 29.31 11.13 0.06 0.00 0.00 2.23 0.12 1.17 0.19 0.00 15.05 4.36 0.05 0.10 0.08 18.87 0.90 8.39 92.08
Non-Charismatic species 0.12 14.51 3.16 0.02 0.15 0.11 0.88 0.07 0.48 0.16 0.00 6.18 1.73 0.03 0.10 0.03 8.54 1.11 4.37 41.74
Total 0.34 154.79 31.98 0.13 0.49 0.14 5.74 0.35 4.46 0.59 0.01 50.87 13.95 0.13 0.51 0.34 76.40 2.73 46.57 390.53
Value of services by respondents in ‘rest of UK’
Wild Food 0.22 0.25 5.38 0.01 0.00 0.02 0.04 0.01 0.85 0.00 0.00 0.22 0.08 0.03 0.00 0.06 5.56 1.44 0.00 14.15
Non food products 0.00 0.12 0.45 0.00 0.01 0.01 0.03 0.00 0.12 0.00 0.00 0.12 0.00 0.00 0.00 0.01 1.72 0.00 0.00 2.59
Climate regulation 0.00 43.61 1.10 0.01 0.00 0.00 0.50 0.02 1.11 -0.01 0.00 6.42 1.33 0.01 0.18 0.09 16.00 0.00 9.08 79.45
Water regulation 0.04 50.90 2.86 0.01 0.00 0.00 0.72 0.03 1.15 0.00 0.00 6.51 4.13 0.02 -0.03 0.11 11.34 0.00 16.64 94.42
Sense of Place 0.02 23.60 10.24 0.03 0.31 0.00 1.40 0.10 0.00 0.24 0.01 16.86 3.07 0.00 0.14 0.02 15.74 0.00 10.79 82.57
Charismatic species 0.06 26.45 10.05 0.05 0.00 0.00 2.01 0.11 1.05 0.17 0.00 13.58 3.93 0.05 0.09 0.07 17.03 0.81 7.57 83.09
Non-Charismatic species 0.00 0.00 0.00 0.00 0.00 0.00 0.00 0.00 0.00 0.00 0.00 0.00 0.00 0.00 0.00 0.00 0.00 0.00 0.00 0.00
Total 0.33 144.93 30.07 0.11 0.32 0.03 4.70 0.27 4.29 0.41 0.01 43.71 12.55 0.11 0.38 0.35 67.39 2.25 44.08 356.27
Aggregate value: Sum of ‘within own region ‘ + ‘rest of UK’
Wild Food 0.32 0.37 8.05 0.02 0.00 0.03 0.06 0.01 1.27 0.01 0.00 0.32 0.12 0.04 0.00 0.09 8.33 2.16 0.00 21.20
Non food products 0.00 0.40 1.52 0.01 0.03 0.03 0.09 0.02 0.43 0.00 0.00 0.40 0.00 0.01 0.00 0.02 5.89 0.00 0.00 8.85
Climate regulation 0.00 89.85 2.26 0.01 0.00 0.00 1.03 0.04 2.29 -0.02 0.00 13.23 2.75 0.03 0.37 0.18 32.95 0.00 18.71 163.69
Water regulation 0.06 90.98 5.11 0.02 0.00 0.00 1.29 0.05 2.06 0.00 0.00 11.64 7.38 0.03 -0.06 0.19 20.26 0.00 29.75 168.76
Sense of Place 0.04 47.85 20.76 0.06 0.63 0.00 2.85 0.21 0.00 0.49 0.01 34.17 6.23 0.00 0.29 0.03 31.91 0.00 21.87 167.40
Charismatic species 0.13 55.76 21.18 0.11 0.00 0.00 4.24 0.23 2.22 0.36 0.01 28.64 8.29 0.10 0.18 0.15 35.91 1.71 15.96 175.17
Non-Charismatic species 0.12 14.51 3.16 0.02 0.15 0.11 0.88 0.07 0.48 0.16 0.00 6.18 1.73 0.03 0.10 0.03 8.54 1.11 4.37 41.74
Total 0.67 299.73 62.05 0.24 0.80 0.17 10.44 0.62 8.74 1.00 0.02 94.58 26.50 0.23 0.89 0.69 143.79 4.98 90.66 746.80
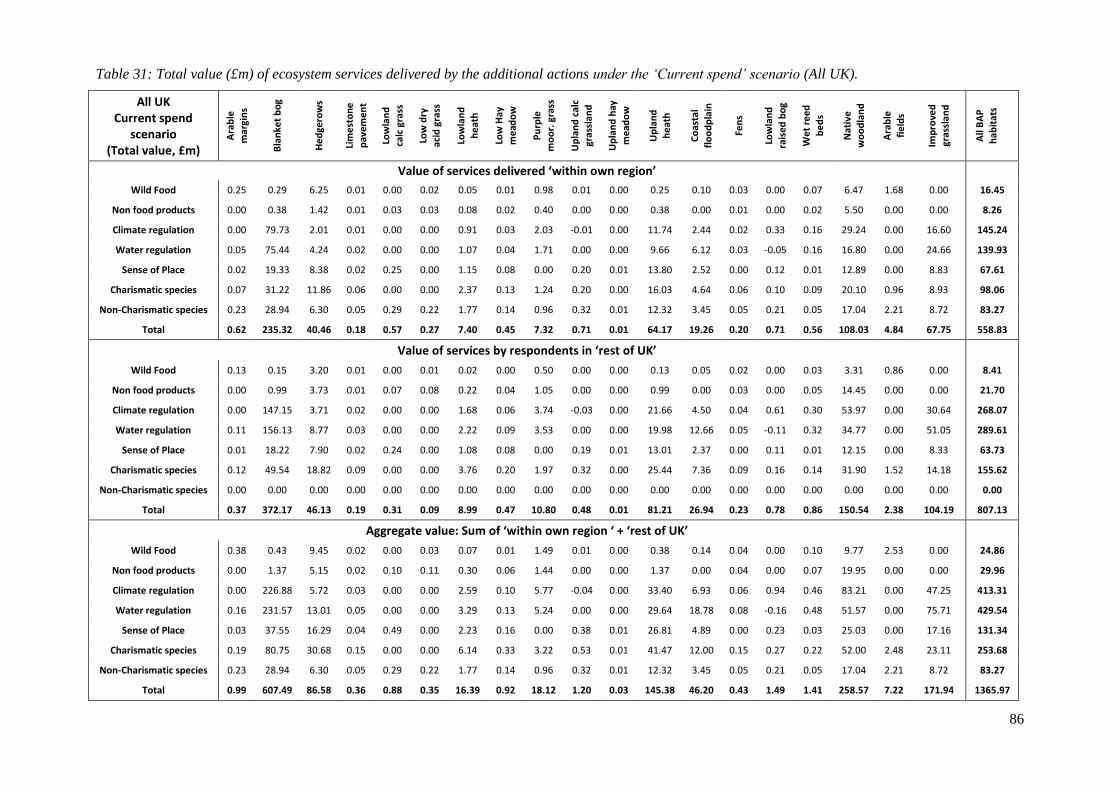
86
Table 31: Total value (£m) of ecosystem services delivered by the additional actions under the ‘Current spend’ scenario (All UK).
All UK Current spend
scenario (Total value, £m)
Ara
ble
m
argi
ns
Bla
nke
t b
og
He
dge
row
s
Lim
est
on
e
pav
emen
t
Low
lan
d
calc
gra
ss
Low
dry
ac
id g
rass
Low
lan
d
he
ath
Low
Hay
me
ado
w
Pu
rple
mo
or.
gra
ss
Up
lan
d c
alc
gras
slan
d
Up
lan
d h
ay
me
ado
w
Up
lan
d
he
ath
Co
asta
l
flo
od
pla
in
Fen
s
Low
lan
d
rais
ed
bo
g
We
t re
ed
be
ds
Nat
ive
w
oo
dla
nd
Ara
ble
fie
lds
Imp
rove
d
gras
slan
d
All
BA
P
hab
itat
s
Value of services delivered ‘within own region’
Wild Food 0.25 0.29 6.25 0.01 0.00 0.02 0.05 0.01 0.98 0.01 0.00 0.25 0.10 0.03 0.00 0.07 6.47 1.68 0.00 16.45
Non food products 0.00 0.38 1.42 0.01 0.03 0.03 0.08 0.02 0.40 0.00 0.00 0.38 0.00 0.01 0.00 0.02 5.50 0.00 0.00 8.26
Climate regulation 0.00 79.73 2.01 0.01 0.00 0.00 0.91 0.03 2.03 -0.01 0.00 11.74 2.44 0.02 0.33 0.16 29.24 0.00 16.60 145.24
Water regulation 0.05 75.44 4.24 0.02 0.00 0.00 1.07 0.04 1.71 0.00 0.00 9.66 6.12 0.03 -0.05 0.16 16.80 0.00 24.66 139.93
Sense of Place 0.02 19.33 8.38 0.02 0.25 0.00 1.15 0.08 0.00 0.20 0.01 13.80 2.52 0.00 0.12 0.01 12.89 0.00 8.83 67.61
Charismatic species 0.07 31.22 11.86 0.06 0.00 0.00 2.37 0.13 1.24 0.20 0.00 16.03 4.64 0.06 0.10 0.09 20.10 0.96 8.93 98.06
Non-Charismatic species 0.23 28.94 6.30 0.05 0.29 0.22 1.77 0.14 0.96 0.32 0.01 12.32 3.45 0.05 0.21 0.05 17.04 2.21 8.72 83.27
Total 0.62 235.32 40.46 0.18 0.57 0.27 7.40 0.45 7.32 0.71 0.01 64.17 19.26 0.20 0.71 0.56 108.03 4.84 67.75 558.83
Value of services by respondents in ‘rest of UK’
Wild Food 0.13 0.15 3.20 0.01 0.00 0.01 0.02 0.00 0.50 0.00 0.00 0.13 0.05 0.02 0.00 0.03 3.31 0.86 0.00 8.41
Non food products 0.00 0.99 3.73 0.01 0.07 0.08 0.22 0.04 1.05 0.00 0.00 0.99 0.00 0.03 0.00 0.05 14.45 0.00 0.00 21.70
Climate regulation 0.00 147.15 3.71 0.02 0.00 0.00 1.68 0.06 3.74 -0.03 0.00 21.66 4.50 0.04 0.61 0.30 53.97 0.00 30.64 268.07
Water regulation 0.11 156.13 8.77 0.03 0.00 0.00 2.22 0.09 3.53 0.00 0.00 19.98 12.66 0.05 -0.11 0.32 34.77 0.00 51.05 289.61
Sense of Place 0.01 18.22 7.90 0.02 0.24 0.00 1.08 0.08 0.00 0.19 0.01 13.01 2.37 0.00 0.11 0.01 12.15 0.00 8.33 63.73
Charismatic species 0.12 49.54 18.82 0.09 0.00 0.00 3.76 0.20 1.97 0.32 0.00 25.44 7.36 0.09 0.16 0.14 31.90 1.52 14.18 155.62
Non-Charismatic species 0.00 0.00 0.00 0.00 0.00 0.00 0.00 0.00 0.00 0.00 0.00 0.00 0.00 0.00 0.00 0.00 0.00 0.00 0.00 0.00
Total 0.37 372.17 46.13 0.19 0.31 0.09 8.99 0.47 10.80 0.48 0.01 81.21 26.94 0.23 0.78 0.86 150.54 2.38 104.19 807.13
Aggregate value: Sum of ‘within own region ‘ + ‘rest of UK’
Wild Food 0.38 0.43 9.45 0.02 0.00 0.03 0.07 0.01 1.49 0.01 0.00 0.38 0.14 0.04 0.00 0.10 9.77 2.53 0.00 24.86
Non food products 0.00 1.37 5.15 0.02 0.10 0.11 0.30 0.06 1.44 0.00 0.00 1.37 0.00 0.04 0.00 0.07 19.95 0.00 0.00 29.96
Climate regulation 0.00 226.88 5.72 0.03 0.00 0.00 2.59 0.10 5.77 -0.04 0.00 33.40 6.93 0.06 0.94 0.46 83.21 0.00 47.25 413.31
Water regulation 0.16 231.57 13.01 0.05 0.00 0.00 3.29 0.13 5.24 0.00 0.00 29.64 18.78 0.08 -0.16 0.48 51.57 0.00 75.71 429.54
Sense of Place 0.03 37.55 16.29 0.04 0.49 0.00 2.23 0.16 0.00 0.38 0.01 26.81 4.89 0.00 0.23 0.03 25.03 0.00 17.16 131.34
Charismatic species 0.19 80.75 30.68 0.15 0.00 0.00 6.14 0.33 3.22 0.53 0.01 41.47 12.00 0.15 0.27 0.22 52.00 2.48 23.11 253.68
Non-Charismatic species 0.23 28.94 6.30 0.05 0.29 0.22 1.77 0.14 0.96 0.32 0.01 12.32 3.45 0.05 0.21 0.05 17.04 2.21 8.72 83.27
Total 0.99 607.49 86.58 0.36 0.88 0.35 16.39 0.92 18.12 1.20 0.03 145.38 46.20 0.43 1.49 1.41 258.57 7.22 171.94 1365.97
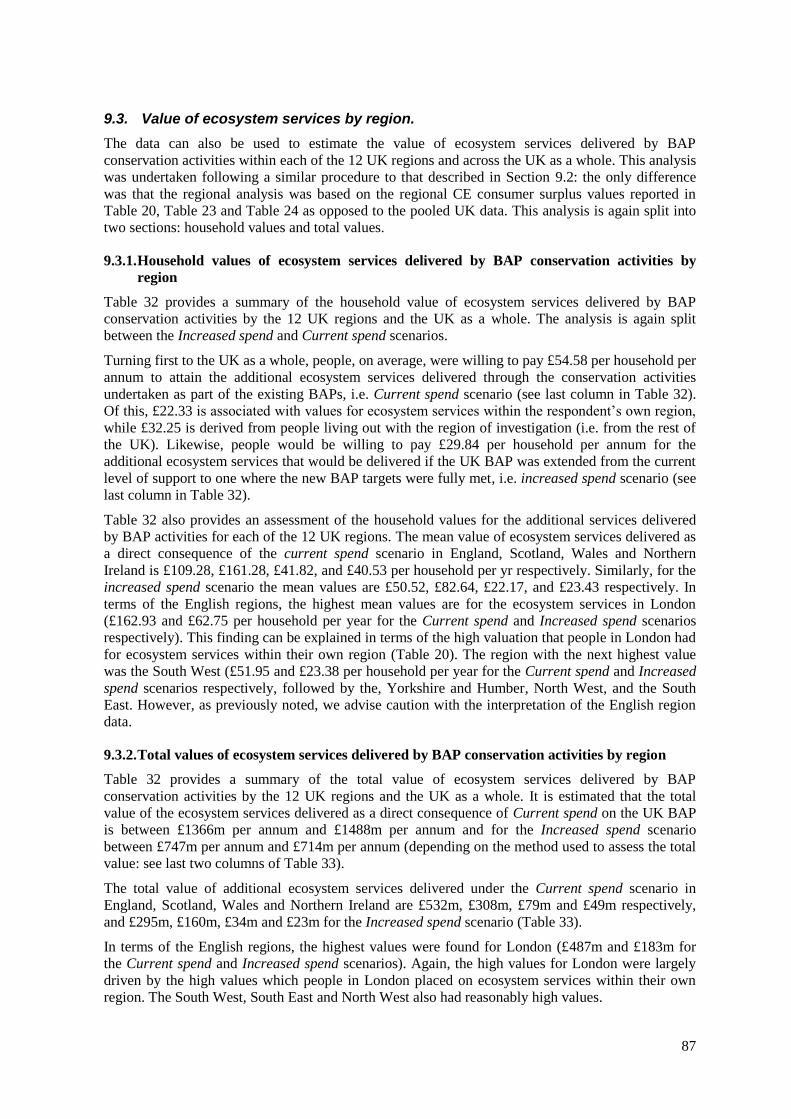
87
9.3. Value of ecosystem services by region.
The data can also be used to estimate the value of ecosystem services delivered by BAP
conservation activities within each of the 12 UK regions and across the UK as a whole. This analysis
was undertaken following a similar procedure to that described in Section 9.2: the only difference
was that the regional analysis was based on the regional CE consumer surplus values reported in
Table 20, Table 23 and Table 24 as opposed to the pooled UK data. This analysis is again split into
two sections: household values and total values.
9.3.1. Household values of ecosystem services delivered by BAP conservation activities by
region
Table 32 provides a summary of the household value of ecosystem services delivered by BAP
conservation activities by the 12 UK regions and the UK as a whole. The analysis is again split
between the Increased spend and Current spend scenarios.
Turning first to the UK as a whole, people, on average, were willing to pay £54.58 per household per
annum to attain the additional ecosystem services delivered through the conservation activities
undertaken as part of the existing BAPs, i.e. Current spend scenario (see last column in Table 32).
Of this, £22.33 is associated with values for ecosystem services within the respondent’s own region,
while £32.25 is derived from people living out with the region of investigation (i.e. from the rest of
the UK). Likewise, people would be willing to pay £29.84 per household per annum for the
additional ecosystem services that would be delivered if the UK BAP was extended from the current
level of support to one where the new BAP targets were fully met, i.e. increased spend scenario (see
last column in Table 32).
Table 32 also provides an assessment of the household values for the additional services delivered
by BAP activities for each of the 12 UK regions. The mean value of ecosystem services delivered as
a direct consequence of the current spend scenario in England, Scotland, Wales and Northern
Ireland is £109.28, £161.28, £41.82, and £40.53 per household per yr respectively. Similarly, for the
increased spend scenario the mean values are £50.52, £82.64, £22.17, and £23.43 respectively. In
terms of the English regions, the highest mean values are for the ecosystem services in London
(£162.93 and £62.75 per household per year for the Current spend and Increased spend scenarios
respectively). This finding can be explained in terms of the high valuation that people in London had
for ecosystem services within their own region (Table 20). The region with the next highest value
was the South West (£51.95 and £23.38 per household per year for the Current spend and Increased
spend scenarios respectively, followed by the, Yorkshire and Humber, North West, and the South
East. However, as previously noted, we advise caution with the interpretation of the English region
data.
9.3.2. Total values of ecosystem services delivered by BAP conservation activities by region
Table 32 provides a summary of the total value of ecosystem services delivered by BAP
conservation activities by the 12 UK regions and the UK as a whole. It is estimated that the total
value of the ecosystem services delivered as a direct consequence of Current spend on the UK BAP
is between £1366m per annum and £1488m per annum and for the Increased spend scenario
between £747m per annum and £714m per annum (depending on the method used to assess the total
value: see last two columns of Table 33).
The total value of additional ecosystem services delivered under the Current spend scenario in
England, Scotland, Wales and Northern Ireland are £532m, £308m, £79m and £49m respectively,
and £295m, £160m, £34m and £23m for the Increased spend scenario (Table 33).
In terms of the English regions, the highest values were found for London (£487m and £183m for
the Current spend and Increased spend scenarios). Again, the high values for London were largely
driven by the high values which people in London placed on ecosystem services within their own
region. The South West, South East and North West also had reasonably high values.
88
Table 32: Household values (£/household /yr) for the additional ecosystem services delivered through the UK BAP actions by region.
Sco
tlan
d
Wal
es
No
rth
ern
Ire
lan
d
Engl
and
No
rth
Eas
t
No
rth
We
st
Yo
rksh
ire
an
d
Hu
mb
er
We
st M
idla
nd
s
East
Mid
lan
ds
East
of
Engl
and
Lon
do
n
Sou
th E
ast
Sou
th W
est
UK
‘po
ole
d’
Increased spend scenario
Within own region 23.12 8.49 16.17 11.04 16.49 14.45 15.05 6.75 8.27 4.86 59.30 18.24 12.01 15.60
Rest of UK 59.52 13.67 7.26 39.48 5.36 6.88 7.12 5.93 7.82 7.28 3.45 5.23 11.37 14.24
Total value 82.64 22.17 23.43 50.52 21.86 21.33 22.18 12.68 16.09 12.14 62.75 23.48 23.38 29.84
Current spend scenario
Within own region 32.60 10.73 24.68 15.20 3.21 15.00 16.52 9.64 2.83 1.49 152.31 20.76 27.51 22.33
Rest of UK 128.68 31.09 15.85 94.08 22.92 22.29 21.61 13.12 15.04 14.14 10.62 12.91 24.43 32.25
Total value 161.28 41.82 40.53 109.28 26.13 37.30 38.14 22.75 17.86 15.63 162.93 33.67 51.95 54.58
Table 33: Total values (£m /yr) for the additional ecosystem services delivered through the UK BAP actions by region.
Sco
tlan
d
Wal
es
No
rth
ern
Ire
lan
d
Engl
and
No
rth
Eas
t
No
rth
We
st
Yo
rksh
ire
an
d
Hu
mb
er
We
st M
idla
nd
s
East
Mid
lan
ds
East
of
Engl
and
Lon
do
n
Sou
th E
ast
Sou
th W
est
UK
(Su
m o
f 1
2
regi
on
s)
UK
‘po
ole
d’
Increased spend scenario
Within own region 52.2 10.3 10.5 230.8 18.2 41.5 32.5 14.8 14.5 11.1 179.0 62.0 25.6 472.0 390.5
Rest of UK 107.4 23.7 12.9 63.8 9.4 10.9 11.8 9.4 12.9 9.4 4.1 12.0 18.0 242.0 356.3
Total value 159.6 34.1 23.4 294.6 27.7 52.4 44.2 24.2 27.4 20.5 183.0 74.0 43.6 714.0 746.8
Current spend scenario
Within own region 73.5 13.1 16.0 317.6 3.5 43.1 35.7 21.1 4.9 3.4 459.7 70.5 58.7 803.2 558.8
Rest of UK 235.1 66.1 33.6 214.4 49.9 48.5 45.7 30.0 34.4 25.5 27.1 34.5 54.3 684.7 807.1
Total value 308.7 79.2 49.5 532.0 53.5 91.6 81.3 51.1 39.3 28.9 486.8 105.0 113.0 1487.9 1366.0
89
9.4. Cost benefit analysis
A key aim of this research was to assess the ecosystem service benefits associated with the UK BAP
to subsequently feed into a cost benefit analysis (CBA) of the UK BAP. It should, however, be noted
that it is out with the scope of this study to provide a full CBA of the UK BAP; however, below we
do provide an indicative CBA based on our value estimates and a simple interpretation of the costs
of the UK BAP.
An important question for policy makers is the assessment of the likely value for money of
expenditures on three distinct elements of the UK BAP: habitat action plans (HAPs), widespread
species action plans (wSAPs), single species action plans (sSAPs). Details of current levels of spend
on these elements of the UK BAP can be found in Buisson and Rayment (2006) and Rayment
(2006)8. Our analysis allows us to estimate the economic benefit of the ecosystem services delivered
by each of these funding streams in terms of both the Current spend scenario and the Increased
spend scenario. The analysis of the benefits from HAPs and wSAPs are based on the aggregation of
the total values for relevant broad habitats, while that of the sSAPs is based on the values for the
values attained for ‘charismatic species’ and ‘Non-charismatic species’. However, disentangling
both the costs and benefits from the three elements of the UK BAP is not always simple. For
example, expenditures on a particular habitat might contribute towards both HAP and SAP targets.
Further, there is potential to ‘double count’ both the costs and benefits (Buisson and Rayment, 2006;
Rayment, 2006). In this assessment we do not attempt to completely disentangle the benefits
between the three BAP elements, but instead report the ‘potential’ benefits from each BAP element.
In other words, we do not attempt to remove the potential of ‘double counting’. We argue that this
needs to be undertaken as part of the full cost benefit analysis to ensure that a consistent approach is
used to disentangle both the costs and the benefits.
As an initial step to feed into the cost benefit analysis, it is possible and useful to first provide a
simple comparison of the costs and benefits associated with the different BAP habitats investigated
in this report (Table 34). The values of the BAP habitats are based on those reported in Table 31 (for
the Increased spend scenario) and Table 32 (for Current spend scenario). The costs mostly come
from Table 4.1 of the UK BAP costings report (Rayment, 2006). Here we assume that the costings
for the Current spend scenario are based on the estimated annual costs of HAPs (2005 to 2010),
while those for the Increased spend scenario are based on the estimated annual costs of HAPs (2015
to 2020). Also note that the costings report covers a wider set of habitats than examined in this
research: we do not estimate values for the marine and fresh water habitats. Finally, the costings
reported for the arable field and improved grassland management are based on Table 4.5 of the
widespread species costing report (Buisson and Rayment, 2006). Unfortunately, the widespread
species report only provides one set of predicted costs for these habitats (£107m / yr for arable land
and £79m / yr for improved grassland). Given the absence of other data, we assume that these costs
will be relevant for both the Current spend and the Increased spend scenarios; an assumption which
is clearly open to question.
Across all BAP habitats investigated in this research, the current £469m per annum spend on the UK
BAP habitats delivers £1,366m per annum in terms of benefits from ecosystem services (Table 34).
This gives an average benefit-cost ratio of 2.91 and a net benefit of £897m per annum (Table 34).
However, there is a high degree of variability between habitats. Of the 19 habitats investigated, only
9 habitats achieved higher benefits than costs. The highest benefit-cost ratios for the Current spend
scenario was for Blanket bogs (BCR = 16.07), Upland heath (BCR = 9.38), Native woodlands
(BCR= 2.80), Purple moorland grass (BCR = 2.52) and Improved grassland (BCR = 2.18). Benefit-
cost ratios of less than one were attained for Arable margins (BCR = 0.04), Lowland dry acid grass
(BCR = 0.06), Arable fields (BCR = 0.07), Lowland calcareous grassland (BCR = 0.09), Upland hay
8 Since we originally undertook this analysis, Defra have updated their assessments of the costs of the UK
BAP (GHK Consulting LTD, 2010)). However, in the above analysis, our CBA is based on the original
costings work on the UK BAP.
90
meadow (BCR = 0.12), Lowland meadow (BCR = 0.61), Limestone pavements (BCR = 0.64), Fens
(BCR = 0.76), Upland calcareous grass (BCR = 0.80), Lowland raised bogs (BCR = 0.90) and Wet
reedbeds (BCR = 0.99). In terms of net benefits, the highest net benefits were attained for Blanket
bogs (£570m per year), Native woodland (£166m per year), Upland heath (£130m per year),
Improved grassland (£93m per year), and hedgerows (£41m per year). Negative net benefits were
attain for Arable fields (-£100m per year), Arable margins (-£23m per year) and Lowland calcareous
grassland (-£9m per year).
The equivalent analysis for the Increased spend scenarios indicated that the benefit cost ratio across
all BAP habitats = 1.34, with the net benefits = £189m per annum (Table 34). However, under the
Increased spend scenario, only four habitats demonstrated benefits greater than costs. These habitats
included Blanket bogs (BCR = 5.00; net benefits = £240m per annum), Upland heath (BCR = 5.82;
net benefits = £78m per annum), Native woodland (BCR = 1.83; net benefits = £65m per annum),
and Improved grassland (BCR = 1.15; net benefits = £12m per annum). The lowest values were for
Arable fields (BCR = 0.05; net benefits = -£102m per annum), arable margins (BCR = 0.02; net
benefits = -£33m per annum) and Lowland calcareous grassland (BCR = 0.06; net benefits = -£12m
per annum).
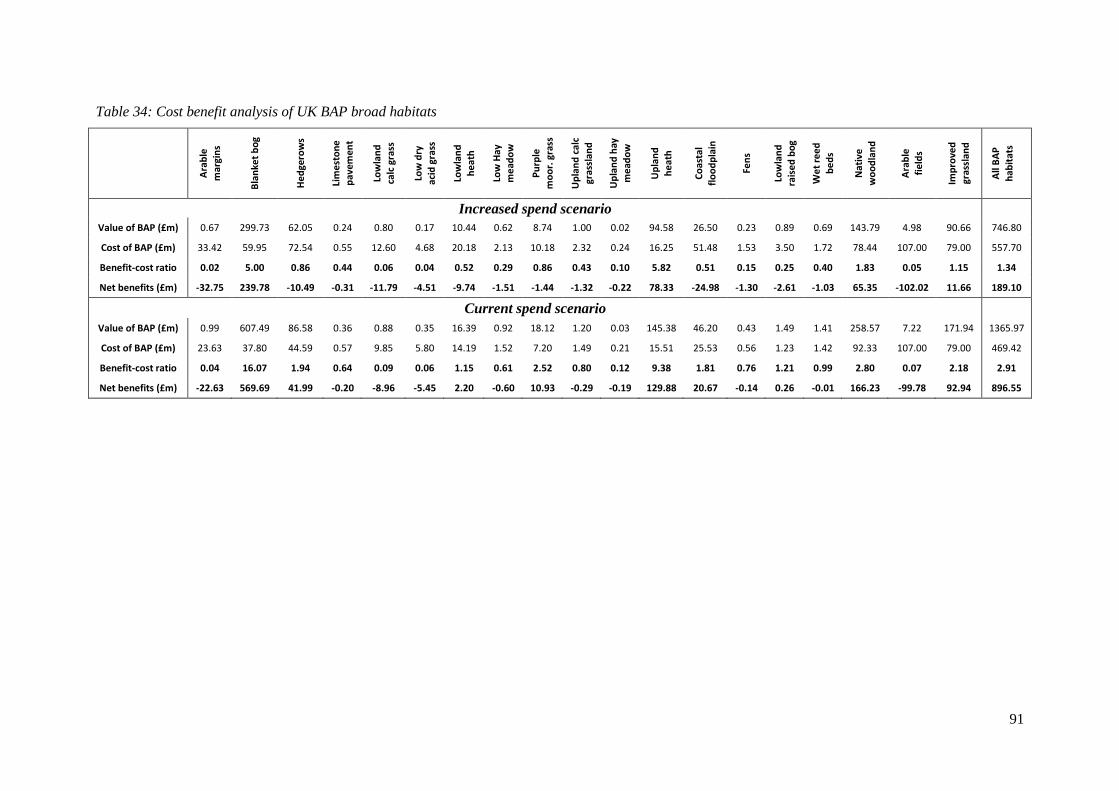
91
Table 34: Cost benefit analysis of UK BAP broad habitats
Ara
ble
m
argi
ns
Bla
nke
t b
og
He
dge
row
s
Lim
est
on
e
pav
emen
t
Low
lan
d
calc
gra
ss
Low
dry
ac
id g
rass
Low
lan
d
he
ath
Low
Hay
m
ead
ow
Pu
rple
m
oo
r. g
rass
Up
lan
d c
alc
gras
slan
d
Up
lan
d h
ay
me
ado
w
Up
lan
d
he
ath
Co
asta
l fl
oo
dp
lain
Fen
s
Low
lan
d
rais
ed
bo
g
We
t re
ed
be
ds
Nat
ive
w
oo
dla
nd
Ara
ble
fi
eld
s
Imp
rove
d
gras
slan
d
All
BA
P
hab
itat
s
Increased spend scenario
Value of BAP (£m) 0.67 299.73 62.05 0.24 0.80 0.17 10.44 0.62 8.74 1.00 0.02 94.58 26.50 0.23 0.89 0.69 143.79 4.98 90.66 746.80
Cost of BAP (£m) 33.42 59.95 72.54 0.55 12.60 4.68 20.18 2.13 10.18 2.32 0.24 16.25 51.48 1.53 3.50 1.72 78.44 107.00 79.00 557.70
Benefit-cost ratio 0.02 5.00 0.86 0.44 0.06 0.04 0.52 0.29 0.86 0.43 0.10 5.82 0.51 0.15 0.25 0.40 1.83 0.05 1.15 1.34
Net benefits (£m) -32.75 239.78 -10.49 -0.31 -11.79 -4.51 -9.74 -1.51 -1.44 -1.32 -0.22 78.33 -24.98 -1.30 -2.61 -1.03 65.35 -102.02 11.66 189.10
Current spend scenario
Value of BAP (£m) 0.99 607.49 86.58 0.36 0.88 0.35 16.39 0.92 18.12 1.20 0.03 145.38 46.20 0.43 1.49 1.41 258.57 7.22 171.94 1365.97
Cost of BAP (£m) 23.63 37.80 44.59 0.57 9.85 5.80 14.19 1.52 7.20 1.49 0.21 15.51 25.53 0.56 1.23 1.42 92.33 107.00 79.00 469.42
Benefit-cost ratio 0.04 16.07 1.94 0.64 0.09 0.06 1.15 0.61 2.52 0.80 0.12 9.38 1.81 0.76 1.21 0.99 2.80 0.07 2.18 2.91
Net benefits (£m) -22.63 569.69 41.99 -0.20 -8.96 -5.45 2.20 -0.60 10.93 -0.29 -0.19 129.88 20.67 -0.14 0.26 -0.01 166.23 -99.78 92.94 896.55
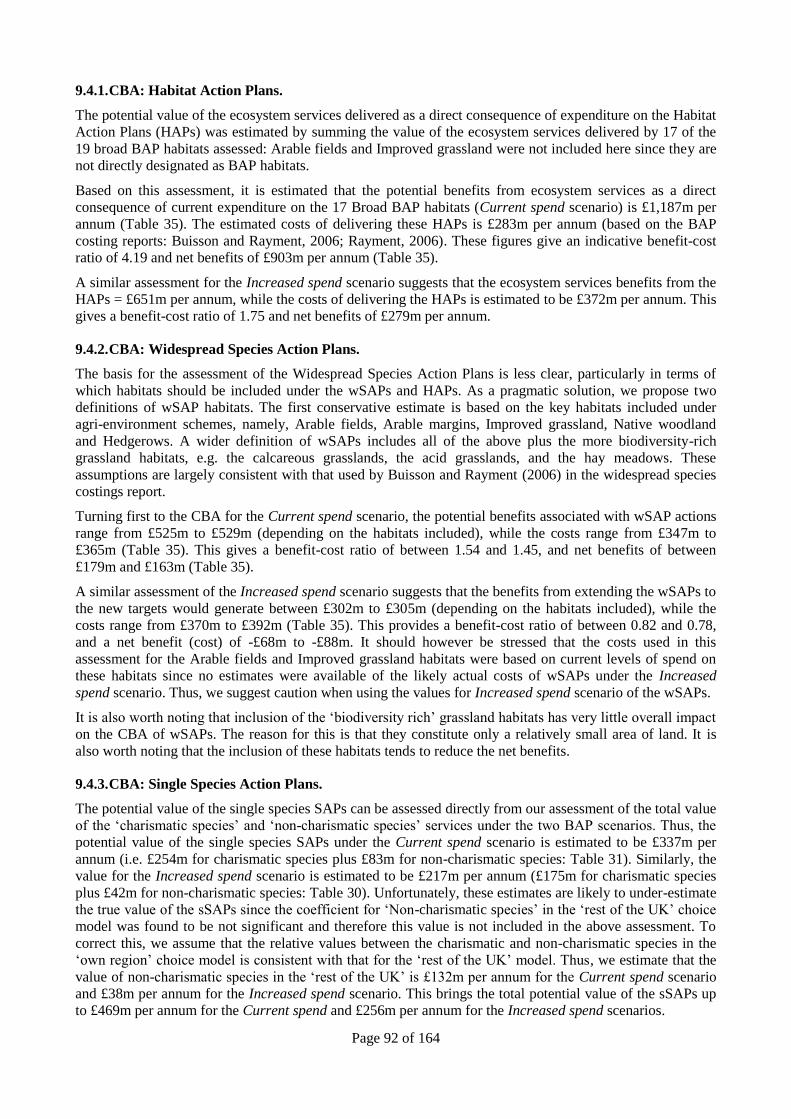
Page 92 of 164
9.4.1. CBA: Habitat Action Plans.
The potential value of the ecosystem services delivered as a direct consequence of expenditure on the Habitat
Action Plans (HAPs) was estimated by summing the value of the ecosystem services delivered by 17 of the
19 broad BAP habitats assessed: Arable fields and Improved grassland were not included here since they are
not directly designated as BAP habitats.
Based on this assessment, it is estimated that the potential benefits from ecosystem services as a direct
consequence of current expenditure on the 17 Broad BAP habitats (Current spend scenario) is £1,187m per
annum (Table 35). The estimated costs of delivering these HAPs is £283m per annum (based on the BAP
costing reports: Buisson and Rayment, 2006; Rayment, 2006). These figures give an indicative benefit-cost
ratio of 4.19 and net benefits of £903m per annum (Table 35).
A similar assessment for the Increased spend scenario suggests that the ecosystem services benefits from the
HAPs = £651m per annum, while the costs of delivering the HAPs is estimated to be £372m per annum. This
gives a benefit-cost ratio of 1.75 and net benefits of £279m per annum.
9.4.2. CBA: Widespread Species Action Plans.
The basis for the assessment of the Widespread Species Action Plans is less clear, particularly in terms of
which habitats should be included under the wSAPs and HAPs. As a pragmatic solution, we propose two
definitions of wSAP habitats. The first conservative estimate is based on the key habitats included under
agri-environment schemes, namely, Arable fields, Arable margins, Improved grassland, Native woodland
and Hedgerows. A wider definition of wSAPs includes all of the above plus the more biodiversity-rich
grassland habitats, e.g. the calcareous grasslands, the acid grasslands, and the hay meadows. These
assumptions are largely consistent with that used by Buisson and Rayment (2006) in the widespread species
costings report.
Turning first to the CBA for the Current spend scenario, the potential benefits associated with wSAP actions
range from £525m to £529m (depending on the habitats included), while the costs range from £347m to
£365m (Table 35). This gives a benefit-cost ratio of between 1.54 and 1.45, and net benefits of between
£179m and £163m (Table 35).
A similar assessment of the Increased spend scenario suggests that the benefits from extending the wSAPs to
the new targets would generate between £302m to £305m (depending on the habitats included), while the
costs range from £370m to £392m (Table 35). This provides a benefit-cost ratio of between 0.82 and 0.78,
and a net benefit (cost) of -£68m to -£88m. It should however be stressed that the costs used in this
assessment for the Arable fields and Improved grassland habitats were based on current levels of spend on
these habitats since no estimates were available of the likely actual costs of wSAPs under the Increased
spend scenario. Thus, we suggest caution when using the values for Increased spend scenario of the wSAPs.
It is also worth noting that inclusion of the ‘biodiversity rich’ grassland habitats has very little overall impact
on the CBA of wSAPs. The reason for this is that they constitute only a relatively small area of land. It is
also worth noting that the inclusion of these habitats tends to reduce the net benefits.
9.4.3. CBA: Single Species Action Plans.
The potential value of the single species SAPs can be assessed directly from our assessment of the total value
of the ‘charismatic species’ and ‘non-charismatic species’ services under the two BAP scenarios. Thus, the
potential value of the single species SAPs under the Current spend scenario is estimated to be £337m per
annum (i.e. £254m for charismatic species plus £83m for non-charismatic species: Table 31). Similarly, the
value for the Increased spend scenario is estimated to be £217m per annum (£175m for charismatic species
plus £42m for non-charismatic species: Table 30). Unfortunately, these estimates are likely to under-estimate
the true value of the sSAPs since the coefficient for ‘Non-charismatic species’ in the ‘rest of the UK’ choice
model was found to be not significant and therefore this value is not included in the above assessment. To
correct this, we assume that the relative values between the charismatic and non-charismatic species in the
‘own region’ choice model is consistent with that for the ‘rest of the UK’ model. Thus, we estimate that the
value of non-charismatic species in the ‘rest of the UK’ is £132m per annum for the Current spend scenario
and £38m per annum for the Increased spend scenario. This brings the total potential value of the sSAPs up
to £469m per annum for the Current spend and £256m per annum for the Increased spend scenarios.
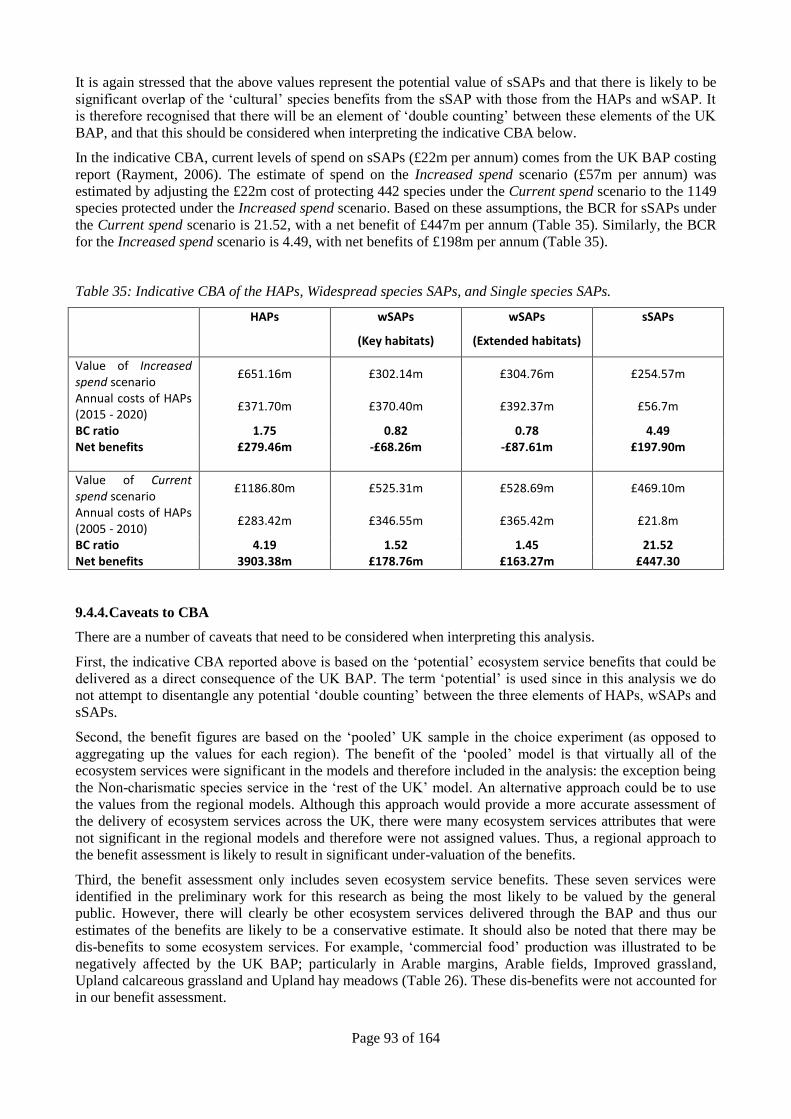
Page 93 of 164
It is again stressed that the above values represent the potential value of sSAPs and that there is likely to be
significant overlap of the ‘cultural’ species benefits from the sSAP with those from the HAPs and wSAP. It
is therefore recognised that there will be an element of ‘double counting’ between these elements of the UK
BAP, and that this should be considered when interpreting the indicative CBA below.
In the indicative CBA, current levels of spend on sSAPs (£22m per annum) comes from the UK BAP costing
report (Rayment, 2006). The estimate of spend on the Increased spend scenario (£57m per annum) was
estimated by adjusting the £22m cost of protecting 442 species under the Current spend scenario to the 1149
species protected under the Increased spend scenario. Based on these assumptions, the BCR for sSAPs under
the Current spend scenario is 21.52, with a net benefit of £447m per annum (Table 35). Similarly, the BCR
for the Increased spend scenario is 4.49, with net benefits of £198m per annum (Table 35).
Table 35: Indicative CBA of the HAPs, Widespread species SAPs, and Single species SAPs.
HAPs wSAPs
(Key habitats)
wSAPs
(Extended habitats)
sSAPs
Value of Increased spend scenario
£651.16m £302.14m £304.76m £254.57m
Annual costs of HAPs (2015 - 2020)
£371.70m £370.40m £392.37m £56.7m
BC ratio 1.75 0.82 0.78 4.49 Net benefits £279.46m -£68.26m -£87.61m £197.90m
Value of Current spend scenario
£1186.80m £525.31m £528.69m £469.10m
Annual costs of HAPs (2005 - 2010)
£283.42m £346.55m £365.42m £21.8m
BC ratio 4.19 1.52 1.45 21.52 Net benefits 3903.38m £178.76m £163.27m £447.30
9.4.4. Caveats to CBA
There are a number of caveats that need to be considered when interpreting this analysis.
First, the indicative CBA reported above is based on the ‘potential’ ecosystem service benefits that could be
delivered as a direct consequence of the UK BAP. The term ‘potential’ is used since in this analysis we do
not attempt to disentangle any potential ‘double counting’ between the three elements of HAPs, wSAPs and
sSAPs.
Second, the benefit figures are based on the ‘pooled’ UK sample in the choice experiment (as opposed to
aggregating up the values for each region). The benefit of the ‘pooled’ model is that virtually all of the
ecosystem services were significant in the models and therefore included in the analysis: the exception being
the Non-charismatic species service in the ‘rest of the UK’ model. An alternative approach could be to use
the values from the regional models. Although this approach would provide a more accurate assessment of
the delivery of ecosystem services across the UK, there were many ecosystem services attributes that were
not significant in the regional models and therefore were not assigned values. Thus, a regional approach to
the benefit assessment is likely to result in significant under-valuation of the benefits.
Third, the benefit assessment only includes seven ecosystem service benefits. These seven services were
identified in the preliminary work for this research as being the most likely to be valued by the general
public. However, there will clearly be other ecosystem services delivered through the BAP and thus our
estimates of the benefits are likely to be a conservative estimate. It should also be noted that there may be
dis-benefits to some ecosystem services. For example, ‘commercial food’ production was illustrated to be
negatively affected by the UK BAP; particularly in Arable margins, Arable fields, Improved grassland,
Upland calcareous grassland and Upland hay meadows (Table 26). These dis-benefits were not accounted for
in our benefit assessment.
Page 94 of 164
Part D: Discussion and Conclusions In this final section of the report, we provide a critique of the research methodology (Section 10). This is
followed by a summary of the headline findings from the research, along with some precautionary caveats to
the interpretation of the results (Section 11).
Page 95 of 164
10. Discussion
In the previous sections, we have provided estimates of the value of ecosystem services delivered by the UK
BAP. In this discussion we provide a critique of the three steps involved in the research protocol (the choice
experiment, the weighting matrix and the final aggregation in Step 3 - Sections 10.1, 10.2 and 10.3
respectively) and then undertake a sensitivity analysis of our key findings (Section 10.4)
10.1. Critique of choice experiment
In this section we explore whether the CE passes a range of validity tests: content, construct and convergent
validity tests (Mitchell and Carson, 1989b).
10.1.1. Content validity
Content validity is a measure to which the description of the hypothetical market and the environmental good
evaluated in the CE questionnaire reflects the true character of that good (Mitchell and Carson, 1989b).
Although it is difficult to attain a precise measure of content validity, it is possible to provide evidence to
support it. In this study we undertook a number of steps to reduce potential content validity problems.
First, the CE questionnaire was developed following consultation with both economic and ecological experts
through a series of developmental workshops, a Delphi study, and through consultation with the project
steering group: see Christie (2008b) for further details. In addition, the questionnaire was also extensively
piloted, which included opportunities for respondents to comment on their understanding of the description
of the UK BAP, ecosystem service scenarios and the CE choice task. Thus, every effort was made to ensure
that the content of the CE questionnaire was accurate, plausible and understandable.
Second, the way in which the CE study was administered (i.e. the valuation workshops) provided
opportunities to present significantly more information on the environmental good in question than would be
possible using standard face-to-face interviews. Further, the workshops provided respondents with time to
think about, absorb, reflect and discuss the information presented, which we argue helped to ensure that
respondents were fully informed before making their CE choices. In addition, we presented the information
on the BAP and ecosystem services through a range of media so as to account for different learning
strategies within our sample respondents. All of the above was undertaken to help ensure that respondents
were able to accumulate information and thus make informed choices.
However, it is also possible that the higher than normal levels of information presented during the workshops
could affect respondent’s valuations, and in particular lead to ‘constructed preferences’ (Payne et al., 1999).
To explore this, we ran a series of models based on the UK dataset to test for (i) the impacts of respondent’s
prior knowledge and awareness of the ecosystem services on values and (ii) the impacts of newly acquired
information on the values of the services. These tests involved interacting a range of dummy variables
relating to respondent’s knowledge / information with the ecosystem services attributes. These interaction
variables were then included in the CE regression model to test whether the variable had a significant impact
on respondent’s choices. A summary of the significant interaction variables is reported in Table 36. So, for
example, the first row of data in Table 36 suggests that prior knowledge of climate change resulted in these
respondents giving a significantly lower coefficient value (-0.233) for the ‘No BAP’ level of the climate
change attribute than those respondents with no prior knowledge of climate change. Note that all of the
ecosystem service attributes were tested against each of the knowledge and information variables; however,
we only show the significant results in Table 36.
Respondent’s prior knowledge of an ecosystem service and how important the service benefit was to
them was determined from responses to Q6. Respondents with prior knowledge of an ecosystem
service had significantly lower values for reductions in ecosystems services (No BAP scenarios) and
significantly higher values for increases in services provision (Full BAP scenarios) than respondents
that had no prior knowledge. A similar pattern was found if the respondents stated that they
considered a particular ecosystem service to be important to them. These results suggest that
respondent’s existing opinions on ecosystem services were important to their valuations.
If respondent’s knowledge of an ecosystem services changed (increased) during the workshop
(determined by comparing the results from Q6 and Q11), this resulted in lower values for No BAP
levels of Climate regulation and Charismatic species. Similarly, if the level of importance that a
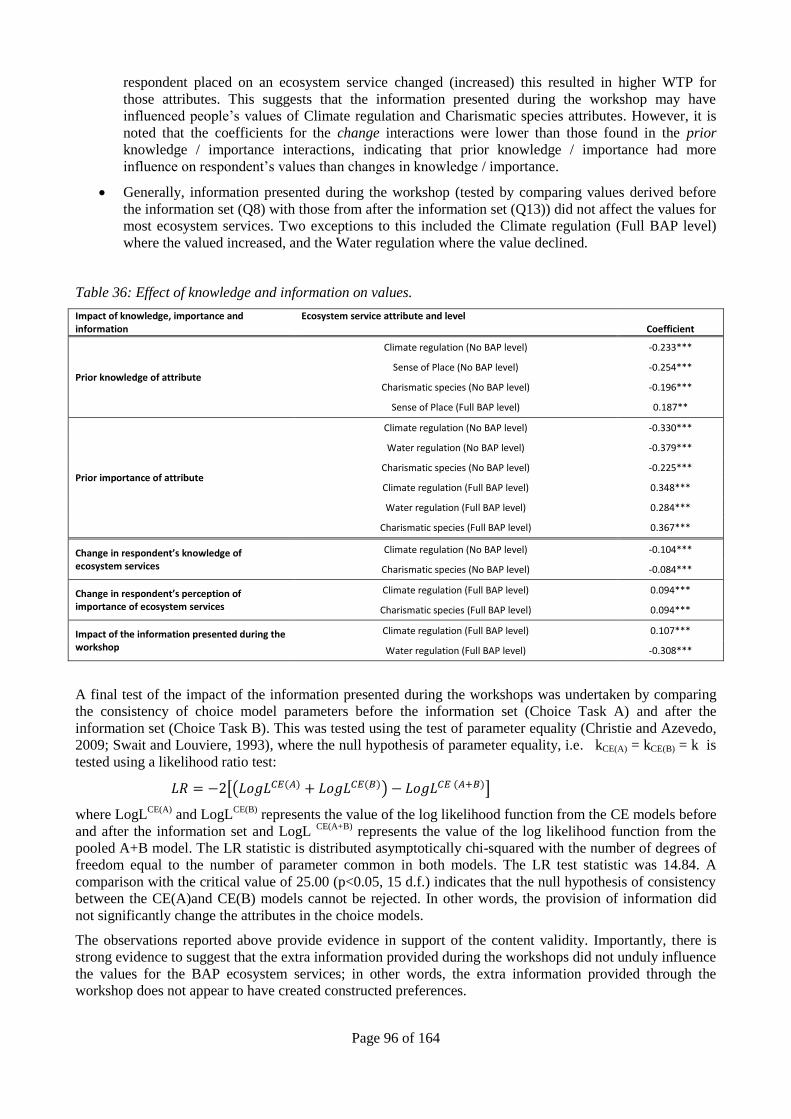
Page 96 of 164
respondent placed on an ecosystem service changed (increased) this resulted in higher WTP for
those attributes. This suggests that the information presented during the workshop may have
influenced people’s values of Climate regulation and Charismatic species attributes. However, it is
noted that the coefficients for the change interactions were lower than those found in the prior
knowledge / importance interactions, indicating that prior knowledge / importance had more
influence on respondent’s values than changes in knowledge / importance.
Generally, information presented during the workshop (tested by comparing values derived before
the information set (Q8) with those from after the information set (Q13)) did not affect the values for
most ecosystem services. Two exceptions to this included the Climate regulation (Full BAP level)
where the valued increased, and the Water regulation where the value declined.
Table 36: Effect of knowledge and information on values.
Impact of knowledge, importance and information
Ecosystem service attribute and level Coefficient
Prior knowledge of attribute
Climate regulation (No BAP level) -0.233***
Sense of Place (No BAP level) -0.254***
Charismatic species (No BAP level) -0.196***
Sense of Place (Full BAP level) 0.187**
Prior importance of attribute
Climate regulation (No BAP level) -0.330***
Water regulation (No BAP level) -0.379***
Charismatic species (No BAP level) -0.225***
Climate regulation (Full BAP level) 0.348***
Water regulation (Full BAP level) 0.284***
Charismatic species (Full BAP level) 0.367***
Change in respondent’s knowledge of ecosystem services
Climate regulation (No BAP level) -0.104***
Charismatic species (No BAP level) -0.084***
Change in respondent’s perception of importance of ecosystem services
Climate regulation (Full BAP level) 0.094***
Charismatic species (Full BAP level) 0.094***
Impact of the information presented during the workshop
Climate regulation (Full BAP level) 0.107***
Water regulation (Full BAP level) -0.308***
A final test of the impact of the information presented during the workshops was undertaken by comparing
the consistency of choice model parameters before the information set (Choice Task A) and after the
information set (Choice Task B). This was tested using the test of parameter equality (Christie and Azevedo,
2009; Swait and Louviere, 1993), where the null hypothesis of parameter equality, i.e. kCE(A) = kCE(B) = k is
tested using a likelihood ratio test:
[( ) ]
where LogLCE(A)
and LogLCE(B)
represents the value of the log likelihood function from the CE models before
and after the information set and LogL CE(A+B)
represents the value of the log likelihood function from the
pooled A+B model. The LR statistic is distributed asymptotically chi-squared with the number of degrees of
freedom equal to the number of parameter common in both models. The LR test statistic was 14.84. A
comparison with the critical value of 25.00 (p<0.05, 15 d.f.) indicates that the null hypothesis of consistency
between the CE(A)and CE(B) models cannot be rejected. In other words, the provision of information did
not significantly change the attributes in the choice models.
The observations reported above provide evidence in support of the content validity. Importantly, there is
strong evidence to suggest that the extra information provided during the workshops did not unduly influence
the values for the BAP ecosystem services; in other words, the extra information provided through the
workshop does not appear to have created constructed preferences.
Page 97 of 164
10.1.2. Construct validity
Construct validity involves assessing the degree to which the findings of a CE study are consistent with
theoretical expectations. This is usually tested by regressing respondent choice against the cost attribute, the
CE environmental attributes and a range of socio-economic and attitudinal information, and then assessing
whether these attributes behave as expected.
In our results section (Section 7), we reported a series of CE models that were based on the cost and
environmental attributes only. However, a further series of models that also included socio-economic and
attitudinal attributes were examined in the research: but not reported here. Generally, these models
demonstrated that there was a large degree of variability in terms of which socio-economic attributes were
significant in the different regional models. To retain consistency across our analysis (and thus allow direct
comparison between regions), our analysis was based on the attributes only models. However, to test for
construct validity, it is important to explore how socio-economic and attitudinal attributes affect respondent’s
choice. Thus, below, we explore construct validity in term of both the attributes only models and the
attributes plus socio-economic variables models.
Attributes only model.
A key test of construct validity is whether the coefficient on the cost attribute is significant and negative. In
the attributes only ‘own region’ CE models the cost attribute was significant (p < 0.01) and negative across
all 12 regions (Table 19), while in the ‘Rest of the UK’ models, cost was significant (p < 0.01) and negative
in only 8 out of the 12 regions: cost was not significant at p = 0.1 in the London or East of England models
(Table 21). This finding suggests that, generally, respondents considered the cost of options before making
their choices: as opposed to making random or arbitrary choices.
Most of the ecosystem service attributes were significant and of the expected sign in the UK models (Table
19 and Table 21 respectively for ‘own region’ and ‘rest of UK’). However, in the regional models (which
were based on a smaller sample) there was greater variability in terms of the levels of significance of the
ecosystem service attributes. Generally, the Climate regulation, Water regulation and Charismatic species
attributes were found to be significant and of the expected sign in most of the regional models, while Wild
food and Non-food products were only significant in a couple of regions (Table 19 and Table 21). An
interpretation of the lack of significance in some of the ecosystem service attributes is that the respondents
did not value these attributes and therefore largely ignored them in their choices.
Attributes and socio-economic variables model
We also tested a series of models that included a range of socio-economic and attitudinal variables, where
these variables were included through interactions with relevant ecosystem services attributes. To illustrate
the impact of socio-economic variables on choice, we report the UK ‘own region’ model in Table 37. As can
be seen below, most of the socio-economic interactions meet a priori expectations; which helps to support
construct validity:
First, it is noted that the basic ecosystems services and cost attributes (not shown in Table 37) were
similar to that found in the equivalent UK attributes only model (see above) and were all significant
and of the expected sign.
Income was generally not found to be a significant determinant of choice: income was only
significant when interacted with the cost and the Climate regulation attributes, but had very little
impact of values. It is not clear why income was not significant.
Respondents who lived in an urban area were more likely to be willing to pay for higher levels of
provision of Climate regulation, Water regulation and Wild food, while those that lived in a flood
risk area were more likely to choose options that delivered higher Water regulation.
Males, older people, and people with a higher level of education generally favoured higher levels of
ecosystem services attributes.
Being employed, married and living in an urban area meant that respondents were less likely to
choose an option with a high cost.
Finally, it should be noted that the UK model reported in Table 37 had more significant socio-economic
interaction variables than the regional models (not shown here). Further, there was no real consistency across
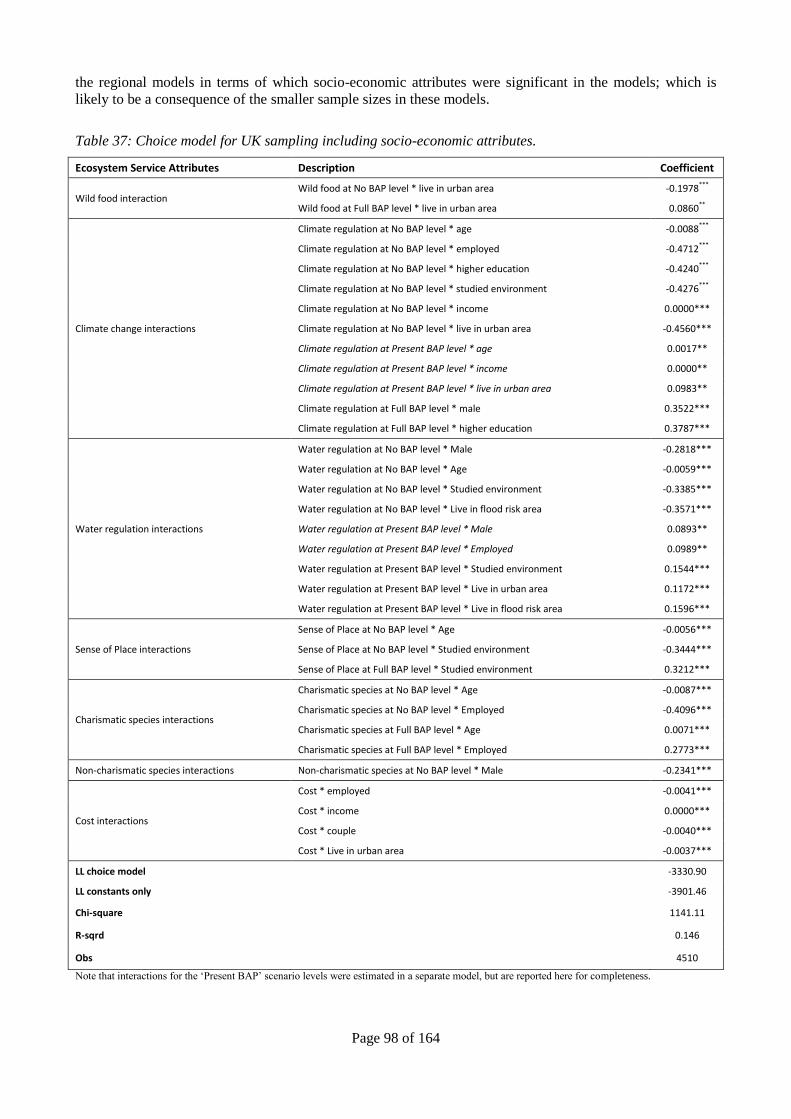
Page 98 of 164
the regional models in terms of which socio-economic attributes were significant in the models; which is
likely to be a consequence of the smaller sample sizes in these models.
Table 37: Choice model for UK sampling including socio-economic attributes.
Ecosystem Service Attributes Description Coefficient
Wild food interaction Wild food at No BAP level * live in urban area -0.1978***
Wild food at Full BAP level * live in urban area 0.0860**
Climate change interactions
Climate regulation at No BAP level * age -0.0088***
Climate regulation at No BAP level * employed -0.4712***
Climate regulation at No BAP level * higher education -0.4240***
Climate regulation at No BAP level * studied environment -0.4276***
Climate regulation at No BAP level * income 0.0000***
Climate regulation at No BAP level * live in urban area -0.4560***
Climate regulation at Present BAP level * age 0.0017**
Climate regulation at Present BAP level * income 0.0000**
Climate regulation at Present BAP level * live in urban area 0.0983**
Climate regulation at Full BAP level * male 0.3522***
Climate regulation at Full BAP level * higher education 0.3787***
Water regulation interactions
Water regulation at No BAP level * Male -0.2818***
Water regulation at No BAP level * Age -0.0059***
Water regulation at No BAP level * Studied environment -0.3385***
Water regulation at No BAP level * Live in flood risk area -0.3571***
Water regulation at Present BAP level * Male 0.0893**
Water regulation at Present BAP level * Employed 0.0989**
Water regulation at Present BAP level * Studied environment 0.1544***
Water regulation at Present BAP level * Live in urban area 0.1172***
Water regulation at Present BAP level * Live in flood risk area 0.1596***
Sense of Place interactions
Sense of Place at No BAP level * Age -0.0056***
Sense of Place at No BAP level * Studied environment -0.3444***
Sense of Place at Full BAP level * Studied environment 0.3212***
Charismatic species interactions
Charismatic species at No BAP level * Age -0.0087***
Charismatic species at No BAP level * Employed -0.4096***
Charismatic species at Full BAP level * Age 0.0071***
Charismatic species at Full BAP level * Employed 0.2773***
Non-charismatic species interactions Non-charismatic species at No BAP level * Male -0.2341***
Cost interactions
Cost * employed -0.0041***
Cost * income 0.0000***
Cost * couple -0.0040***
Cost * Live in urban area -0.0037***
LL choice model -3330.90
LL constants only -3901.46
Chi-square
1141.11
R-sqrd
0.146
Obs 4510
Note that interactions for the ‘Present BAP’ scenario levels were estimated in a separate model, but are reported here for completeness.
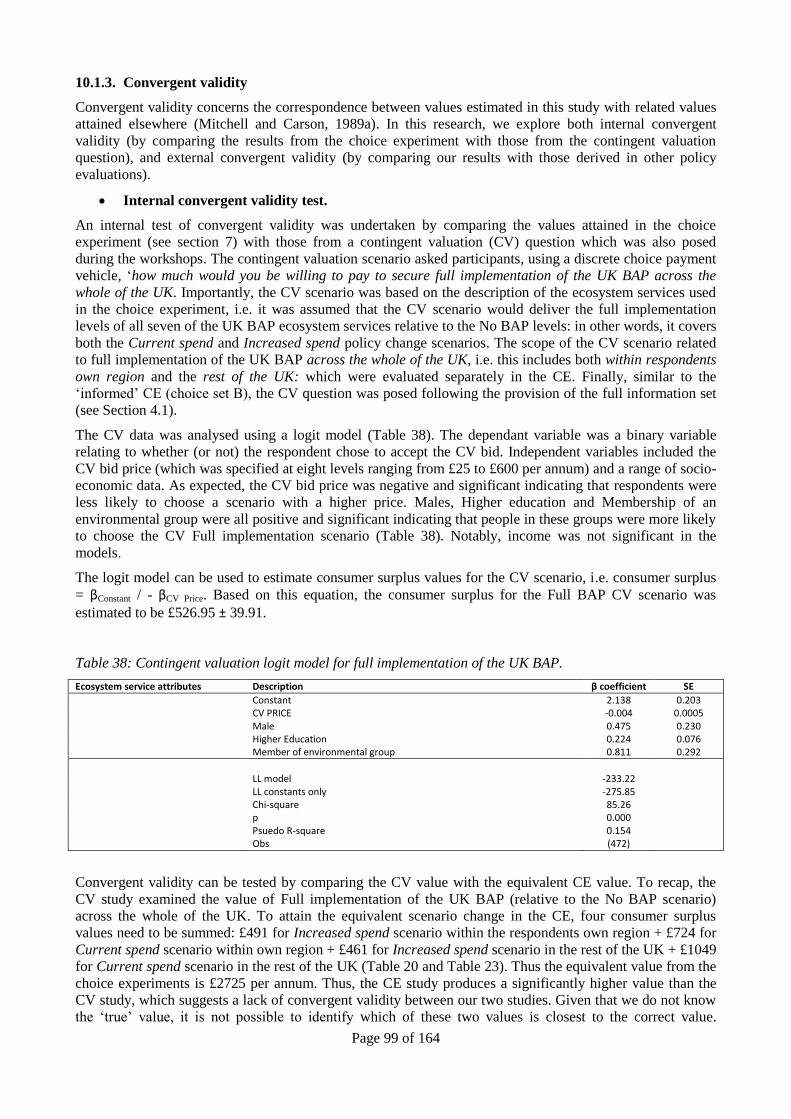
Page 99 of 164
10.1.3. Convergent validity
Convergent validity concerns the correspondence between values estimated in this study with related values
attained elsewhere (Mitchell and Carson, 1989a). In this research, we explore both internal convergent
validity (by comparing the results from the choice experiment with those from the contingent valuation
question), and external convergent validity (by comparing our results with those derived in other policy
evaluations).
Internal convergent validity test.
An internal test of convergent validity was undertaken by comparing the values attained in the choice
experiment (see section 7) with those from a contingent valuation (CV) question which was also posed
during the workshops. The contingent valuation scenario asked participants, using a discrete choice payment
vehicle, ‘how much would you be willing to pay to secure full implementation of the UK BAP across the
whole of the UK. Importantly, the CV scenario was based on the description of the ecosystem services used
in the choice experiment, i.e. it was assumed that the CV scenario would deliver the full implementation
levels of all seven of the UK BAP ecosystem services relative to the No BAP levels: in other words, it covers
both the Current spend and Increased spend policy change scenarios. The scope of the CV scenario related
to full implementation of the UK BAP across the whole of the UK, i.e. this includes both within respondents
own region and the rest of the UK: which were evaluated separately in the CE. Finally, similar to the
‘informed’ CE (choice set B), the CV question was posed following the provision of the full information set
(see Section 4.1).
The CV data was analysed using a logit model (Table 38). The dependant variable was a binary variable
relating to whether (or not) the respondent chose to accept the CV bid. Independent variables included the
CV bid price (which was specified at eight levels ranging from £25 to £600 per annum) and a range of socio-
economic data. As expected, the CV bid price was negative and significant indicating that respondents were
less likely to choose a scenario with a higher price. Males, Higher education and Membership of an
environmental group were all positive and significant indicating that people in these groups were more likely
to choose the CV Full implementation scenario (Table 38). Notably, income was not significant in the
models.
The logit model can be used to estimate consumer surplus values for the CV scenario, i.e. consumer surplus
= βConstant / - βCV Price. Based on this equation, the consumer surplus for the Full BAP CV scenario was
estimated to be £526.95 ± 39.91.
Table 38: Contingent valuation logit model for full implementation of the UK BAP.
Ecosystem service attributes Description β coefficient SE
Constant 2.138 0.203 CV PRICE -0.004 0.0005 Male 0.475 0.230 Higher Education 0.224 0.076 Member of environmental group 0.811 0.292
LL model -233.22 LL constants only -275.85 Chi-square 85.26 p 0.000 Psuedo R-square 0.154 Obs (472)
Convergent validity can be tested by comparing the CV value with the equivalent CE value. To recap, the
CV study examined the value of Full implementation of the UK BAP (relative to the No BAP scenario)
across the whole of the UK. To attain the equivalent scenario change in the CE, four consumer surplus
values need to be summed: £491 for Increased spend scenario within the respondents own region + £724 for
Current spend scenario within own region + £461 for Increased spend scenario in the rest of the UK + £1049
for Current spend scenario in the rest of the UK (Table 20 and Table 23). Thus the equivalent value from the
choice experiments is £2725 per annum. Thus, the CE study produces a significantly higher value than the
CV study, which suggests a lack of convergent validity between our two studies. Given that we do not know
the ‘true’ value, it is not possible to identify which of these two values is closest to the correct value.
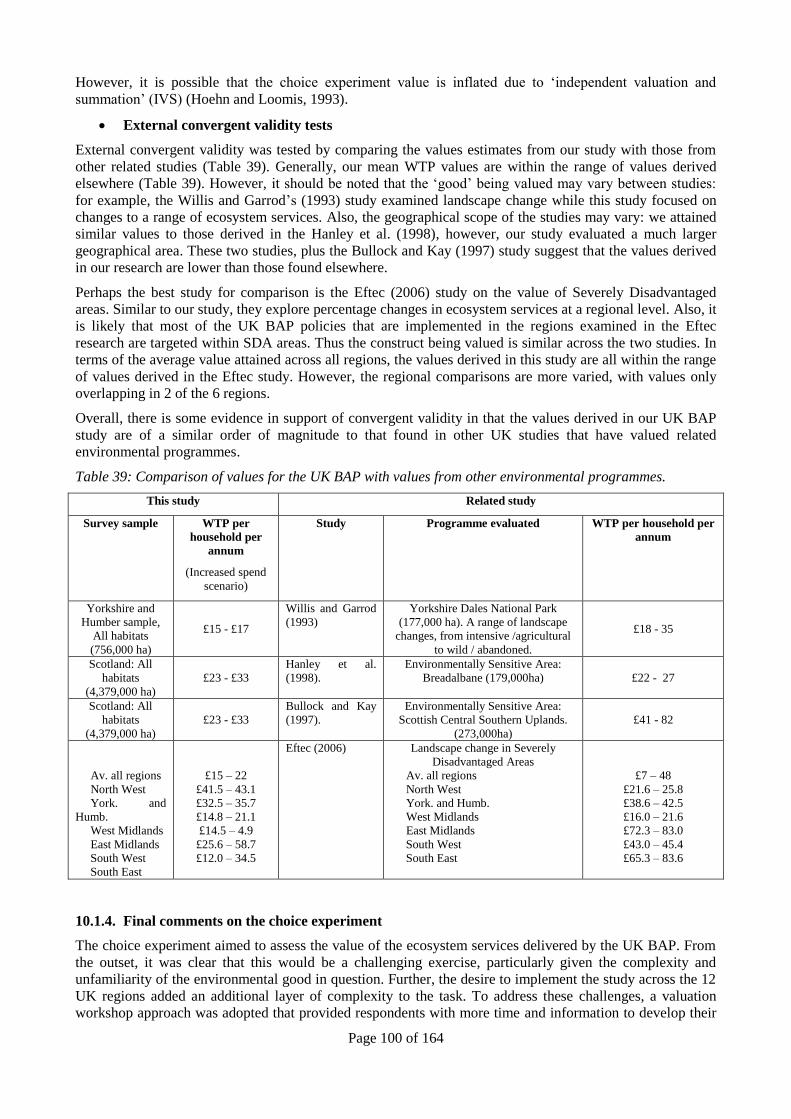
Page 100 of 164
However, it is possible that the choice experiment value is inflated due to ‘independent valuation and
summation’ (IVS) (Hoehn and Loomis, 1993).
External convergent validity tests
External convergent validity was tested by comparing the values estimates from our study with those from
other related studies (Table 39). Generally, our mean WTP values are within the range of values derived
elsewhere (Table 39). However, it should be noted that the ‘good’ being valued may vary between studies:
for example, the Willis and Garrod’s (1993) study examined landscape change while this study focused on
changes to a range of ecosystem services. Also, the geographical scope of the studies may vary: we attained
similar values to those derived in the Hanley et al. (1998), however, our study evaluated a much larger
geographical area. These two studies, plus the Bullock and Kay (1997) study suggest that the values derived
in our research are lower than those found elsewhere.
Perhaps the best study for comparison is the Eftec (2006) study on the value of Severely Disadvantaged
areas. Similar to our study, they explore percentage changes in ecosystem services at a regional level. Also, it
is likely that most of the UK BAP policies that are implemented in the regions examined in the Eftec
research are targeted within SDA areas. Thus the construct being valued is similar across the two studies. In
terms of the average value attained across all regions, the values derived in this study are all within the range
of values derived in the Eftec study. However, the regional comparisons are more varied, with values only
overlapping in 2 of the 6 regions.
Overall, there is some evidence in support of convergent validity in that the values derived in our UK BAP
study are of a similar order of magnitude to that found in other UK studies that have valued related
environmental programmes.
Table 39: Comparison of values for the UK BAP with values from other environmental programmes.
This study Related study
Survey sample WTP per
household per
annum
(Increased spend
scenario)
Study Programme evaluated WTP per household per
annum
Yorkshire and
Humber sample,
All habitats
(756,000 ha)
£15 - £17
Willis and Garrod
(1993)
Yorkshire Dales National Park
(177,000 ha). A range of landscape
changes, from intensive /agricultural
to wild / abandoned.
£18 - 35
Scotland: All
habitats
(4,379,000 ha)
£23 - £33
Hanley et al.
(1998).
Environmentally Sensitive Area:
Breadalbane (179,000ha) £22 - 27
Scotland: All
habitats
(4,379,000 ha)
£23 - £33
Bullock and Kay
(1997).
Environmentally Sensitive Area:
Scottish Central Southern Uplands.
(273,000ha)
£41 - 82
Av. all regions
North West
York. and
Humb.
West Midlands
East Midlands
South West
South East
£15 – 22
£41.5 – 43.1
£32.5 – 35.7
£14.8 – 21.1
£14.5 – 4.9
£25.6 – 58.7
£12.0 – 34.5
Eftec (2006) Landscape change in Severely
Disadvantaged Areas
Av. all regions
North West
York. and Humb.
West Midlands
East Midlands
South West
South East
£7 – 48
£21.6 – 25.8
£38.6 – 42.5
£16.0 – 21.6
£72.3 – 83.0
£43.0 – 45.4
£65.3 – 83.6
10.1.4. Final comments on the choice experiment
The choice experiment aimed to assess the value of the ecosystem services delivered by the UK BAP. From
the outset, it was clear that this would be a challenging exercise, particularly given the complexity and
unfamiliarity of the environmental good in question. Further, the desire to implement the study across the 12
UK regions added an additional layer of complexity to the task. To address these challenges, a valuation
workshop approach was adopted that provided respondents with more time and information to develop their
Page 101 of 164
understanding of the UK BAP and associated ecosystem services, and hopefully provide more informed
value assessments. The above critique of the CE study was undertaken to provide an assessment of the likely
success of this exercise.
Content validity was addressed in the developmental phases of the project by involving both ecological
experts and members of the general public in the design of the CE study. The valuation workshop approach
also helped to ensure that respondents had enough information and time to make informed choices in the CE.
A series of tests were undertaken to test the impact of the ‘extra’ information on choices concluded that the
additional information did not unduly affect choice. We therefore conclude that the CE study passes the
content validity tests.
Construct validity was tested by examining whether the attributes in the CE model met a priori theoretical
expectations. In the UK ‘pooled’ models, the cost, environmental and a range of socio-economic attributes
were significant and of the expected sign: thus providing evidence of construct validity. In the regional
models, where the samples were smaller, fewer attributes were significant and therefore the case supporting
construct validity was weaker. For this reason, only the results from the UK models were used in the final
assessment of the value of the UK BAP in Step 3.
Finally, convergent validity was tested by comparing the CE results with those from a contingent valuation
study and from other studies. The value estimated in the contingent valuation study was lower than those
found for the CE, which may suggest that values from the CE are inflated. However, compared to other
related studies, the CE value estimates are within the expected range.
Overall, there is good evidence to support the validity of the choice experiment.
10.2. Critique of weighting matrix
The weighting matrix was undertaken to provide a quantitative assessment of the levels of ecosystem
services delivered by different UK BAP habitats under different BAP scenarios. Table 26 summarises the
estimated habitat / ecosystem service weighting scores from this exercise. In this section, we provide an
assessment of the validity of these weighting scores through a critique of (i) the design of the matrix, (ii) the
competence of the experts completing the matrix, and (ii) review of the actual weighting scores.
10.2.1. Design of weighting matrix
A number of design features were incorporated into the weighting matrix to help ensure that the resultant
weighting scores were valid and robust. These included:
The use of multiple perspectives to the elicitation of weighting scores. Specifically, we utilised both
a ‘habitats’ and an ‘ecosystem service’ perspective (see Haines-Young and Potschin, 2008) to
allocate ecosystem services to the various BAP habitats. Not only did this help the experts to think
more clearly about the levels of service provision by different habitats, it also helped to ensure that
the elicited weighting scores were internally consistent across all habitats and all services.
The inclusion of a series of review stages to provide evidence to support (or otherwise) the validity
of the resultant weighting scores. These review stages included:
o A series of feedback loops that required the experts to review and confirm that they were
happy with their weighting scores and if not make any necessary adjustments;
o A series of questions that provided an assessment of the level of confidence that the experts
had in the matrix itself;
o A follow-up workshop in which a range of experts reviewed the entire range of weighting
scores, and if necessary suggest modifications to these scores.
It was considered that all of these design features were essential for eliciting and importantly validating the
weighting scores.
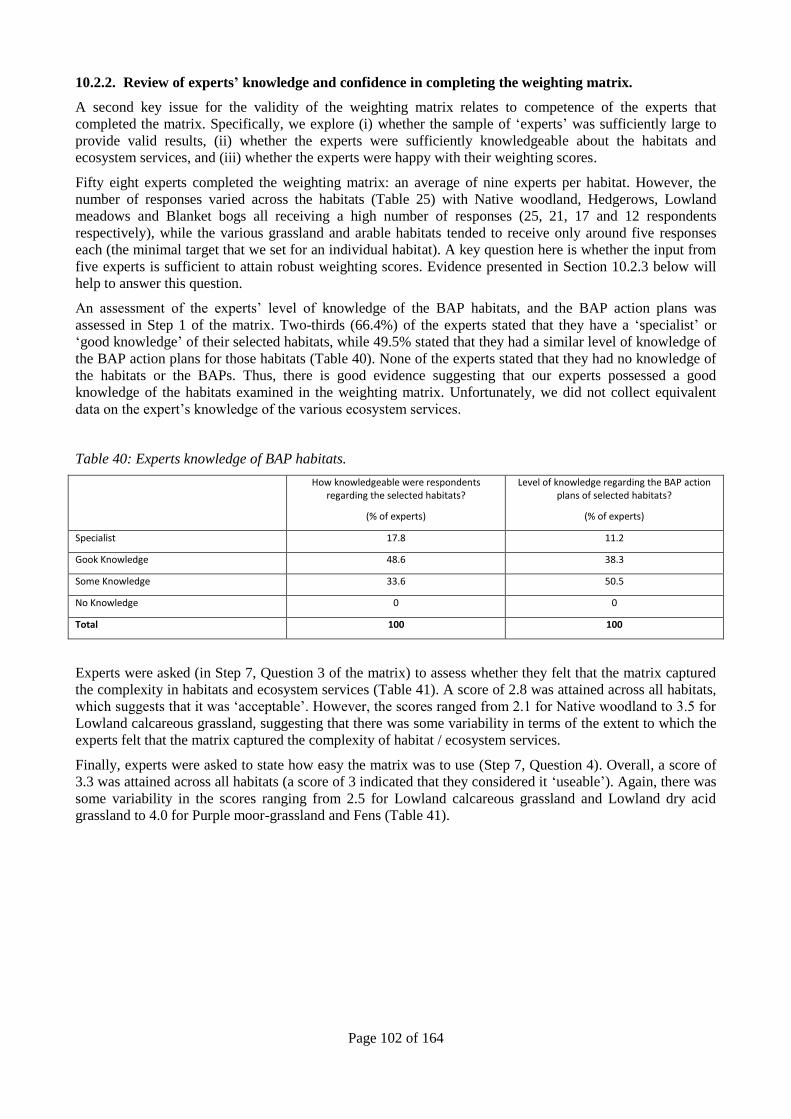
Page 102 of 164
10.2.2. Review of experts’ knowledge and confidence in completing the weighting matrix.
A second key issue for the validity of the weighting matrix relates to competence of the experts that
completed the matrix. Specifically, we explore (i) whether the sample of ‘experts’ was sufficiently large to
provide valid results, (ii) whether the experts were sufficiently knowledgeable about the habitats and
ecosystem services, and (iii) whether the experts were happy with their weighting scores.
Fifty eight experts completed the weighting matrix: an average of nine experts per habitat. However, the
number of responses varied across the habitats (Table 25) with Native woodland, Hedgerows, Lowland
meadows and Blanket bogs all receiving a high number of responses (25, 21, 17 and 12 respondents
respectively), while the various grassland and arable habitats tended to receive only around five responses
each (the minimal target that we set for an individual habitat). A key question here is whether the input from
five experts is sufficient to attain robust weighting scores. Evidence presented in Section 10.2.3 below will
help to answer this question.
An assessment of the experts’ level of knowledge of the BAP habitats, and the BAP action plans was
assessed in Step 1 of the matrix. Two-thirds (66.4%) of the experts stated that they have a ‘specialist’ or
‘good knowledge’ of their selected habitats, while 49.5% stated that they had a similar level of knowledge of
the BAP action plans for those habitats (Table 40). None of the experts stated that they had no knowledge of
the habitats or the BAPs. Thus, there is good evidence suggesting that our experts possessed a good
knowledge of the habitats examined in the weighting matrix. Unfortunately, we did not collect equivalent
data on the expert’s knowledge of the various ecosystem services.
Table 40: Experts knowledge of BAP habitats.
How knowledgeable were respondents regarding the selected habitats?
(% of experts)
Level of knowledge regarding the BAP action plans of selected habitats?
(% of experts)
Specialist 17.8 11.2
Gook Knowledge 48.6 38.3
Some Knowledge 33.6 50.5
No Knowledge 0 0
Total 100 100
Experts were asked (in Step 7, Question 3 of the matrix) to assess whether they felt that the matrix captured
the complexity in habitats and ecosystem services (Table 41). A score of 2.8 was attained across all habitats,
which suggests that it was ‘acceptable’. However, the scores ranged from 2.1 for Native woodland to 3.5 for
Lowland calcareous grassland, suggesting that there was some variability in terms of the extent to which the
experts felt that the matrix captured the complexity of habitat / ecosystem services.
Finally, experts were asked to state how easy the matrix was to use (Step 7, Question 4). Overall, a score of
3.3 was attained across all habitats (a score of 3 indicated that they considered it ‘useable’). Again, there was
some variability in the scores ranging from 2.5 for Lowland calcareous grassland and Lowland dry acid
grassland to 4.0 for Purple moor-grassland and Fens (Table 41).
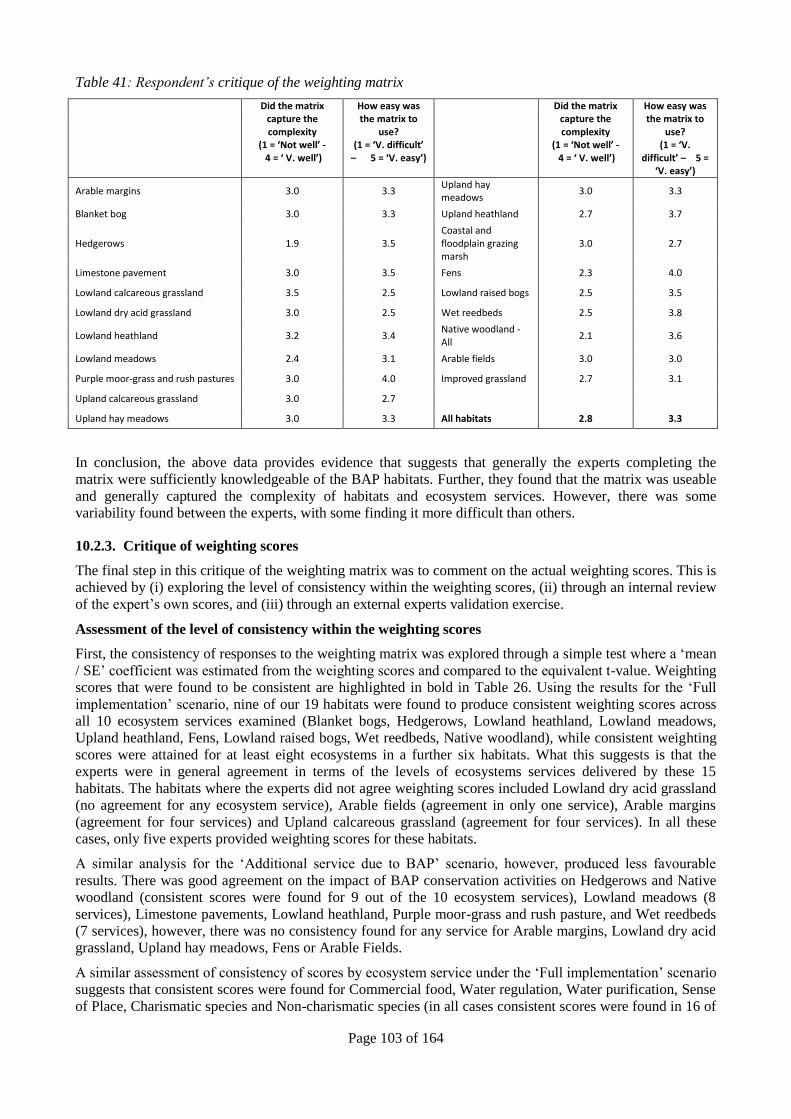
Page 103 of 164
Table 41: Respondent’s critique of the weighting matrix
Did the matrix capture the complexity
(1 = ‘Not well’ - 4 = ‘ V. well’)
How easy was the matrix to
use? (1 = ‘V. difficult’
– 5 = ‘V. easy’)
Did the matrix capture the complexity
(1 = ‘Not well’ - 4 = ‘ V. well’)
How easy was the matrix to
use? (1 = ‘V.
difficult’ – 5 = ‘V. easy’)
Arable margins 3.0 3.3 Upland hay meadows
3.0 3.3
Blanket bog 3.0 3.3 Upland heathland 2.7 3.7
Hedgerows 1.9 3.5 Coastal and floodplain grazing marsh
3.0 2.7
Limestone pavement 3.0 3.5 Fens 2.3 4.0
Lowland calcareous grassland 3.5 2.5 Lowland raised bogs 2.5 3.5
Lowland dry acid grassland 3.0 2.5 Wet reedbeds 2.5 3.8
Lowland heathland 3.2 3.4 Native woodland - All
2.1 3.6
Lowland meadows 2.4 3.1 Arable fields 3.0 3.0
Purple moor-grass and rush pastures 3.0 4.0 Improved grassland 2.7 3.1
Upland calcareous grassland 3.0 2.7
Upland hay meadows 3.0 3.3 All habitats 2.8 3.3
In conclusion, the above data provides evidence that suggests that generally the experts completing the
matrix were sufficiently knowledgeable of the BAP habitats. Further, they found that the matrix was useable
and generally captured the complexity of habitats and ecosystem services. However, there was some
variability found between the experts, with some finding it more difficult than others.
10.2.3. Critique of weighting scores
The final step in this critique of the weighting matrix was to comment on the actual weighting scores. This is
achieved by (i) exploring the level of consistency within the weighting scores, (ii) through an internal review
of the expert’s own scores, and (iii) through an external experts validation exercise.
Assessment of the level of consistency within the weighting scores
First, the consistency of responses to the weighting matrix was explored through a simple test where a ‘mean
/ SE’ coefficient was estimated from the weighting scores and compared to the equivalent t-value. Weighting
scores that were found to be consistent are highlighted in bold in Table 26. Using the results for the ‘Full
implementation’ scenario, nine of our 19 habitats were found to produce consistent weighting scores across
all 10 ecosystem services examined (Blanket bogs, Hedgerows, Lowland heathland, Lowland meadows,
Upland heathland, Fens, Lowland raised bogs, Wet reedbeds, Native woodland), while consistent weighting
scores were attained for at least eight ecosystems in a further six habitats. What this suggests is that the
experts were in general agreement in terms of the levels of ecosystems services delivered by these 15
habitats. The habitats where the experts did not agree weighting scores included Lowland dry acid grassland
(no agreement for any ecosystem service), Arable fields (agreement in only one service), Arable margins
(agreement for four services) and Upland calcareous grassland (agreement for four services). In all these
cases, only five experts provided weighting scores for these habitats.
A similar analysis for the ‘Additional service due to BAP’ scenario, however, produced less favourable
results. There was good agreement on the impact of BAP conservation activities on Hedgerows and Native
woodland (consistent scores were found for 9 out of the 10 ecosystem services), Lowland meadows (8
services), Limestone pavements, Lowland heathland, Purple moor-grass and rush pasture, and Wet reedbeds
(7 services), however, there was no consistency found for any service for Arable margins, Lowland dry acid
grassland, Upland hay meadows, Fens or Arable Fields.
A similar assessment of consistency of scores by ecosystem service under the ‘Full implementation’ scenario
suggests that consistent scores were found for Commercial food, Water regulation, Water purification, Sense
of Place, Charismatic species and Non-charismatic species (in all cases consistent scores were found in 16 of
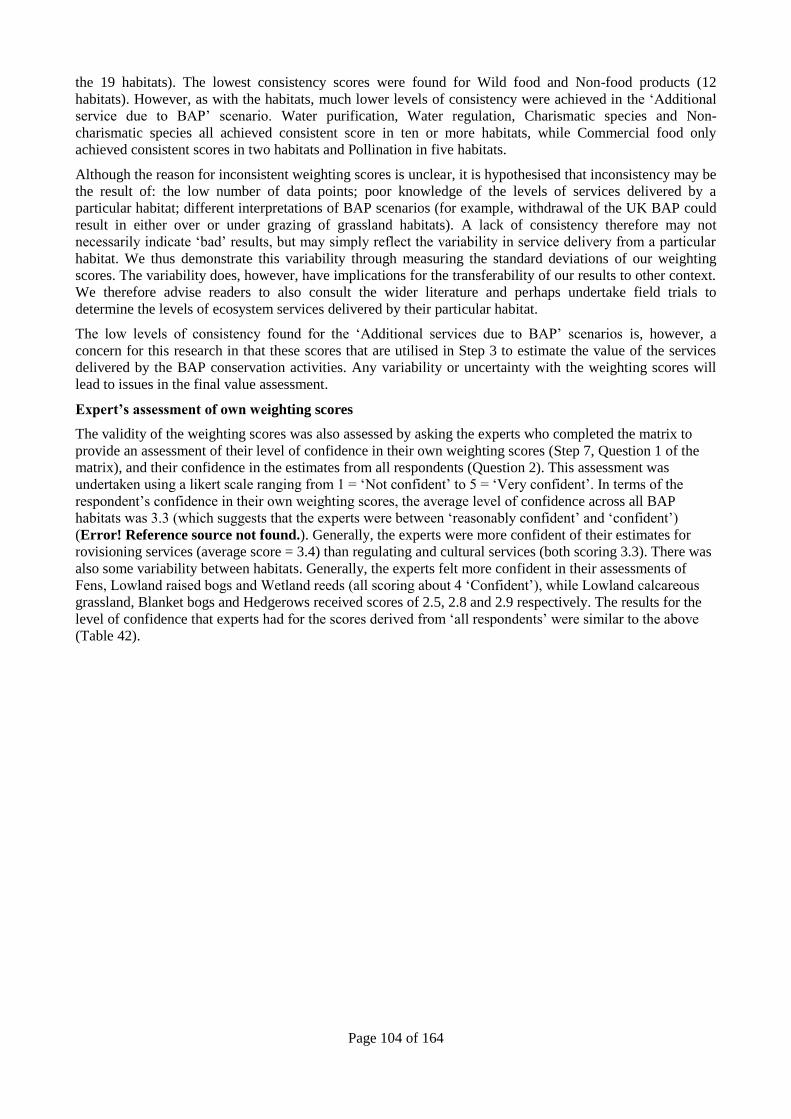
Page 104 of 164
the 19 habitats). The lowest consistency scores were found for Wild food and Non-food products (12
habitats). However, as with the habitats, much lower levels of consistency were achieved in the ‘Additional
service due to BAP’ scenario. Water purification, Water regulation, Charismatic species and Non-
charismatic species all achieved consistent score in ten or more habitats, while Commercial food only
achieved consistent scores in two habitats and Pollination in five habitats.
Although the reason for inconsistent weighting scores is unclear, it is hypothesised that inconsistency may be
the result of: the low number of data points; poor knowledge of the levels of services delivered by a
particular habitat; different interpretations of BAP scenarios (for example, withdrawal of the UK BAP could
result in either over or under grazing of grassland habitats). A lack of consistency therefore may not
necessarily indicate ‘bad’ results, but may simply reflect the variability in service delivery from a particular
habitat. We thus demonstrate this variability through measuring the standard deviations of our weighting
scores. The variability does, however, have implications for the transferability of our results to other context.
We therefore advise readers to also consult the wider literature and perhaps undertake field trials to
determine the levels of ecosystem services delivered by their particular habitat.
The low levels of consistency found for the ‘Additional services due to BAP’ scenarios is, however, a
concern for this research in that these scores that are utilised in Step 3 to estimate the value of the services
delivered by the BAP conservation activities. Any variability or uncertainty with the weighting scores will
lead to issues in the final value assessment.
Expert’s assessment of own weighting scores
The validity of the weighting scores was also assessed by asking the experts who completed the matrix to
provide an assessment of their level of confidence in their own weighting scores (Step 7, Question 1 of the
matrix), and their confidence in the estimates from all respondents (Question 2). This assessment was
undertaken using a likert scale ranging from 1 = ‘Not confident’ to 5 = ‘Very confident’. In terms of the
respondent’s confidence in their own weighting scores, the average level of confidence across all BAP
habitats was 3.3 (which suggests that the experts were between ‘reasonably confident’ and ‘confident’)
(Error! Reference source not found.). Generally, the experts were more confident of their estimates for
rovisioning services (average score = 3.4) than regulating and cultural services (both scoring 3.3). There was
also some variability between habitats. Generally, the experts felt more confident in their assessments of
Fens, Lowland raised bogs and Wetland reeds (all scoring about 4 ‘Confident’), while Lowland calcareous
grassland, Blanket bogs and Hedgerows received scores of 2.5, 2.8 and 2.9 respectively. The results for the
level of confidence that experts had for the scores derived from ‘all respondents’ were similar to the above
(Table 42).
Page 105 of 164
Table 42: Respondent’s confidence in the weighting scores
How confident are you that your estimates are a reasonable representation of the habitats /
ecosystem services weighting scores?
(1 = ‘Not confident’ – 5 = ‘Very confident’)
How confident are you that the average estimates from all respondents will be a reasonable
representation of the habitats / ecosystem services weighting scores?
(1 = ‘Not confident’ – 5 = ‘Very confident’)
Generally Provisioning
Services Regulation
Services Cultural Services
Generally Provisioning
Services Regulation
Services Cultural Services
Arable margins 3.3 4.0 2.7 2.7 2.7 3.0 1.5 2.7
Blanket bog 2.8 2.5 3.9 4.0 3.2 3.0 3.8 3.3
Hedgerows 2.9 2.8 2.9 3.7 2.7 2.7 2.9 2.8
Limestone pavement 3.0 3.0 2.7 3.3 3.0 3.0 2.3 3.0
Lowland calcareous grassland 2.5 2.5 2.5 2.5 3.0 3.0 3.0 2.5
Lowland dry acid grassland 3.5 3.0 3.5 3.0 3.0 3.0 3.0 2.0
Lowland heathland 3.6 3.4 4.0 4.6 4.4 4.4 4.4 4.6
Lowland meadows 3.3 3.3 2.9 3.7 3.4 3.4 3.4 3.4
Purple moor-grass and rush pastures 3.0 3.0 3.4 3.3 3.2 3.0 3.0 3.0
Upland calcareous grassland 3.3 4.0 2.7 3.0 3.0 3.3 2.7 2.7
Upland hay meadows 3.3 4.0 2.7 2.7 2.7 3.0 2.0 2.7
Upland heathland 3.0 3.0 3.0 3.5 3.3 3.3 3.3 3.3
Coastal and floodplain grazing marsh 3.7 3.3 4.3 3.0 3.7 3.7 3.8 3.3
Fens 4.4 4.4 4.4 4.4 3.7 3.7 3.7 3.7
Lowland raised bogs 4.1 4.3 4.8 4.1 3.8 3.8 4.0 3.8
Wet reedbeds 4.0 4.0 4.2 4.1 3.6 3.6 3.5 3.6
Native woodland - All 3.1 3.1 3.0 4.1 2.8 2.9 3.2 3.1
Arable fields 3.0 3.5 2.5 0.0 2.5 2.5 2.0 2.5
Improved grassland 3.3 3.5 3.0 2.9 3.2 3.3 3.0 3.0
All habitats 3.3 3.4 3.3 3.3 3.2 3.2 3.1 3.1
External assessment of weighting scores
Finally, a follow-up workshop comprising ecological experts was held to review and comment on weighting
scores. The following lists some of the key comments / issues raised during this review workshop:
The experts generally appreciated that there was a need to run an exercise that assessed the level of
ecosystem services delivered by different BAP habitats. They also recognized that the task was
likely to be challenging, particularly given current gaps and uncertainties in the scientific knowledge
on habitat / ecosystem service interactions. There was general agreement that the weighting matrix
was a useful and appropriate tool to eliciting this information and that the matrix was ‘fit for
purpose’ in terms of the needs of this study.
However, there was some concern expressed that the weighting matrix was too simplistic in terms of
identifying the range of potential impacts of the BAP on the delivery of ecosystem services. For
example, the withdrawal of the BAP could result in either under or over grazing of grassland habitats
which could have very different impacts on the delivery of ecosystem services. Given that the matrix
only allowed a single weighting score to be derived, concern was expressed that the finer detail of
the range of impacts would not always be captured by the matrix and therefore some of the
weighting scores could be misleading. As a result, some experts expressed concern regarding the
wider use of the weighting scores as a definitive assessment of the contribution of habitats to the
delivery of ecosystem services.
There was also some concern from the experts that they did not know enough about the habitats /
ecosystem services interactions to allow them to accurately contribute to the weighting matrix.
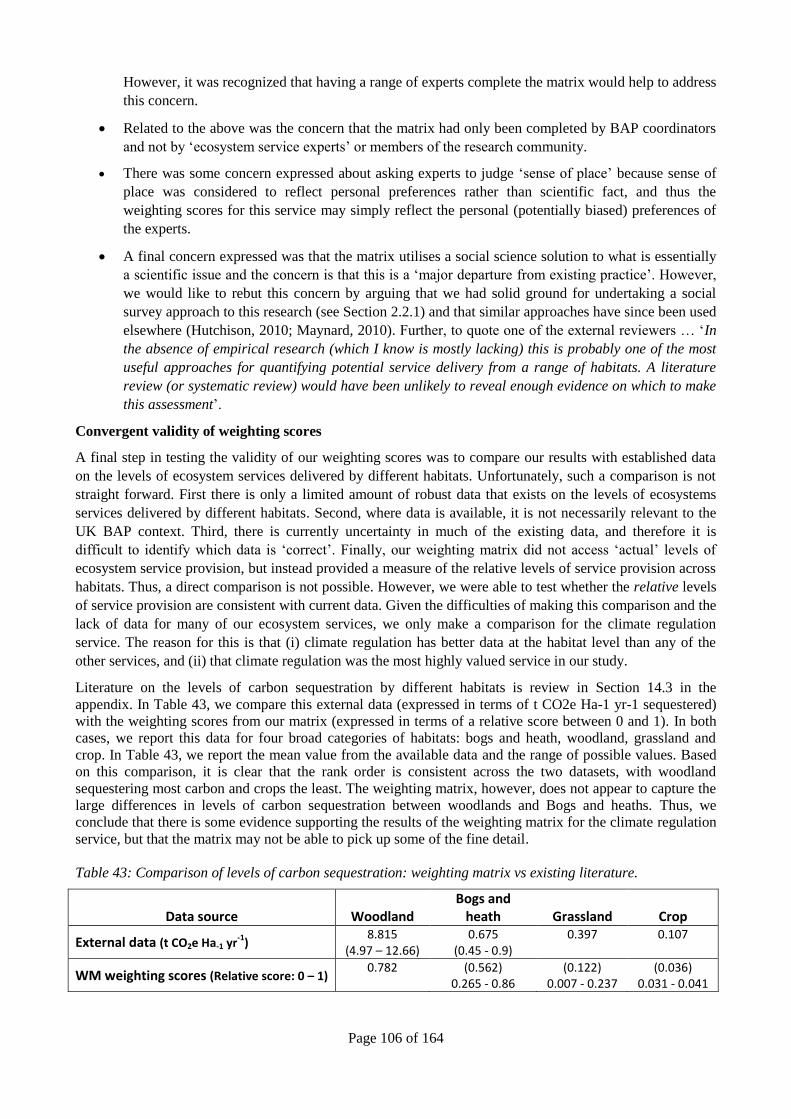
Page 106 of 164
However, it was recognized that having a range of experts complete the matrix would help to address
this concern.
Related to the above was the concern that the matrix had only been completed by BAP coordinators
and not by ‘ecosystem service experts’ or members of the research community.
There was some concern expressed about asking experts to judge ‘sense of place’ because sense of
place was considered to reflect personal preferences rather than scientific fact, and thus the
weighting scores for this service may simply reflect the personal (potentially biased) preferences of
the experts.
A final concern expressed was that the matrix utilises a social science solution to what is essentially
a scientific issue and the concern is that this is a ‘major departure from existing practice’. However,
we would like to rebut this concern by arguing that we had solid ground for undertaking a social
survey approach to this research (see Section 2.2.1) and that similar approaches have since been used
elsewhere (Hutchison, 2010; Maynard, 2010). Further, to quote one of the external reviewers … ‘In
the absence of empirical research (which I know is mostly lacking) this is probably one of the most
useful approaches for quantifying potential service delivery from a range of habitats. A literature
review (or systematic review) would have been unlikely to reveal enough evidence on which to make
this assessment’.
Convergent validity of weighting scores
A final step in testing the validity of our weighting scores was to compare our results with established data
on the levels of ecosystem services delivered by different habitats. Unfortunately, such a comparison is not
straight forward. First there is only a limited amount of robust data that exists on the levels of ecosystems
services delivered by different habitats. Second, where data is available, it is not necessarily relevant to the
UK BAP context. Third, there is currently uncertainty in much of the existing data, and therefore it is
difficult to identify which data is ‘correct’. Finally, our weighting matrix did not access ‘actual’ levels of
ecosystem service provision, but instead provided a measure of the relative levels of service provision across
habitats. Thus, a direct comparison is not possible. However, we were able to test whether the relative levels
of service provision are consistent with current data. Given the difficulties of making this comparison and the
lack of data for many of our ecosystem services, we only make a comparison for the climate regulation
service. The reason for this is that (i) climate regulation has better data at the habitat level than any of the
other services, and (ii) that climate regulation was the most highly valued service in our study.
Literature on the levels of carbon sequestration by different habitats is review in Section 14.3 in the
appendix. In Table 43, we compare this external data (expressed in terms of t CO2e Ha-1 yr-1 sequestered)
with the weighting scores from our matrix (expressed in terms of a relative score between 0 and 1). In both
cases, we report this data for four broad categories of habitats: bogs and heath, woodland, grassland and
crop. In Table 43, we report the mean value from the available data and the range of possible values. Based
on this comparison, it is clear that the rank order is consistent across the two datasets, with woodland
sequestering most carbon and crops the least. The weighting matrix, however, does not appear to capture the
large differences in levels of carbon sequestration between woodlands and Bogs and heaths. Thus, we
conclude that there is some evidence supporting the results of the weighting matrix for the climate regulation
service, but that the matrix may not be able to pick up some of the fine detail.
Table 43: Comparison of levels of carbon sequestration: weighting matrix vs existing literature.
Data source Woodland Bogs and
heath Grassland Crop
External data (t CO2e Ha-1 yr-1
) 8.815
(4.97 – 12.66) 0.675
(0.45 - 0.9) 0.397
0.107
WM weighting scores (Relative score: 0 – 1) 0.782
(0.562)
0.265 - 0.86 (0.122)
0.007 - 0.237 (0.036)
0.031 - 0.041

Page 107 of 164
10.2.4. Finally comments on the weighting matrix
The weighting matrix was designed as a social survey tool for gathering information on the relative levels of
ecosystem services delivered by different UK BAP habitats. The key reasons for choosing this approach, as
opposed to a review of literature, was that: (i) there are currently many gaps and uncertainty in the literature;
and (ii) most of the available literature is unlikely to be specifically targeted to the context of this research
i.e. the UK BAP. Eliciting expert knowledge was considered to be a relative efficient approach to addressing
these knowledge gaps. Given the above, we argue that our matrix was appropriate and fit for purpose given
the remit of this study. Feedback from our expert review group concur with this argument.
Based on the evidence presented above, we argue that: (i) the experts who completed the matrix were
sufficiently knowledgeable to competently complete the task (although some reviewers argued that a wider
range of experts could have been sampled); (ii) the resultant weighting scores were generally consistent
across the experts; (iii) the standard deviations in the scores generally captured likely variations in service
delivery by a particular habitat; and (iv) that the range of scores across the different habitats and services
generally met expectations.
However, there were concerns regarding some of the weighting scores. In particular, there was a lack of
consistency in the weighting score for the ‘Additional services due to the BAP’. This finding is of concern
since it is these findings that are used in Step 3 to calculate the overall value of UK BAP conservation
activities. However, it was also clear from the discussions held during the validation workshop that current
knowledge on how BAP conservation activities affect the delivery of ecosystem services is general poor and
that it would be difficult to provide clear evidence on this without undertaking field experiments (which was
out with the scope of this research). Thus, the lack of consistency found in the weighting matrix for the
‘Additional services due to BAP’ may simply reflect current gaps and uncertainty in knowledge rather than
represent flaws in the methodology. However, this does have consequence of the interpretation of our
research results.
The validation workshop also identified a number of cases where there may be issues with individual
weighting scores. These include inconsistent scores were attained for the Lowland dry acid grassland, Arable
fields, Arable margins and Upland calcareous grassland habitats: it is thought that these inconsistent scores
were the result of a low sample size.
To conclude, the weighting matrix administered for this research is arguable one of the most comprehensive
reviews of the relative levels of ecosystem service delivered across a range of habitats undertaken to date.
We argue that the matrix was generally (but not always) successful in achieving its objectives. However,
there are some concerns relating to the results for the ‘Additional services due to BAP’ which may have
implications for our final valuation assessment in Step 3. Also, our results might not be directly transferable
to other specific contexts. We therefore advise readers to also consult the wider literature and perhaps
undertake field trials to determine the levels of ecosystem services delivered by their particular habitat.
10.3. Critique of Step 3
In Step 3, data from the choice experiment and the weighting matrix were combined to provide an estimation
of the overall value of the ecosystem services delivered by the UK BAP. Clearly, these aggregate values will
only be valid if the data from which the aggregation is based is robust. In the critique of the choice
experiment and the weighting matrix (Sections 10.1 and 10.2 above), it was concluded that both these data
sources were, in general terms, robust. However, the critique also identified a number of areas where there
were issues with the data. Below, we explore how these issues might affect the aggregation undertaken in
Step 3.
10.3.1. Insignificant attribute coefficients in the choice experiment
Accurate estimates of the value of ecosystem service attributes can only be attained from the choice
experiment if both the ecosystem service attribute and the cost attribute are significant in the choice models.
However, this was not always the case with our data:
‘Non-charismatic species’ was not significant in the ‘pooled’ UK’ dataset for the ‘Rest of the UK
(Table 21);
Cost was not significant in the London or East of England ‘Rest of UK’ CE models (Table 21);
Page 108 of 164
29% of the ecosystem service attributes were not significant in the regional models for ‘Own region’
(Table 19), while 60% of the attributes were insignificant in the ‘Rest of the UK’ regional dataset
(Table 21)
In most of our analysis, we have assumed that insignificant ecosystem service attributes were not valued by
respondents and therefore not included in the aggregation of the results. This stance can, in part, be justified
if it is assumed that respondents ignored ecosystem services that they considered not to be important to them.
However, there may be other reasons why an attribute might be insignificant in the CE model including:
small sample sizes; and heterogeneity of values within the sample. Indeed, small sample size is likely to
contribute to the lack of significance of attributes in the regional models. Unfortunately, data was not
collated to identify the true reason for insignificant attributes. The consequence of not including insignificant
attributes is that our aggregated results are likely to under-estimate the true value of ecosystem services
delivered by the UK BAP. A number of steps were undertaken to address this issue.
First, to overcome the low level of significant attributes in the regional models, the analysis for the UK as a
whole was based on the UK pooled choice models (in which the majority of attributes were significant) as
opposed to aggregating the regional models (where many more attributes were insignificant). Thus, this
helped to ensure that the majority of ecosystem services were included in our aggregation. The exception
was the Non-charismatic species attribute in the rest of the UK model. Thus, the value of this service is not
included in the aggregation of the pooled UK data set (Table 30, Table 31, Table 33). However, for the cost
benefit analysis, an adjustment was made to account for this missing value (see section 9.4.3).
In terms of the regional models (Section 9.3) no adjustments have been made, and therefore these regional
values are likely to provide an under-estimate of the true value of services delivered by the UK BAP in
specific regions.
10.3.2. Uncertainty in the weighting matrix
Although there is good evidence in support of the weighting matrix (Section 10.2), a number of concerns
were raised about the validity of the some of the weighting scores. Perhaps of most concern was the lack of
consistency in the weighting scores for the ‘Additional services due to BAP’. The concern here was that it is
these scores that are used in Step 3 in the final value assessment. However, it should be noted that a lack of
consistency may not necessarily mean that the results are inherently wrong; but may simply reflect the
uncertainties surrounding the impacts of BAP conservation activities on service delivery. Indeed, feedback
from the validation workshop suggests that, generally, the results appear valid. Thus, although we recognise
that there are concerns about this data, it is likely that these weighting scores are a reasonable reflection of
current knowledge.
Second, a number of concerns were raised about the validity of some of the individual weighting scores.
These included the scores of a number of habitats that were based on a small number of respondents (i.e.
some of the grassland and arable habitats). We therefore suggest caution in the interpretation of the aggregate
values for these habitats.
10.3.3. Representativeness of the survey sample
A final issue for aggregation relates to whether the CE survey sample was representative of the wider UK
population to allow aggregation. Evidence reported in Section 7.1 indicates that our survey sample across the
UK was generally representative of the UK population; a notable exception was that our sample included a
higher proportion of more educated people. The analysis reported in Table 37 indicates that these people
tended to favour the higher levels of provision of Climate change and Water regulation services. Thus, our
reported valuation may slightly over-estimate of the value of these ecosystem services.
There was less evidence to support the representativeness of our regional samples. In part, this was due to the
smaller sample sizes. The consequence of this is that there are potential issues regarding our results at the
regional level. Further, we avoid any potential problems associated with aggregating the regional models to
represent the UK by only reporting UK values that are based on the UK CE models.
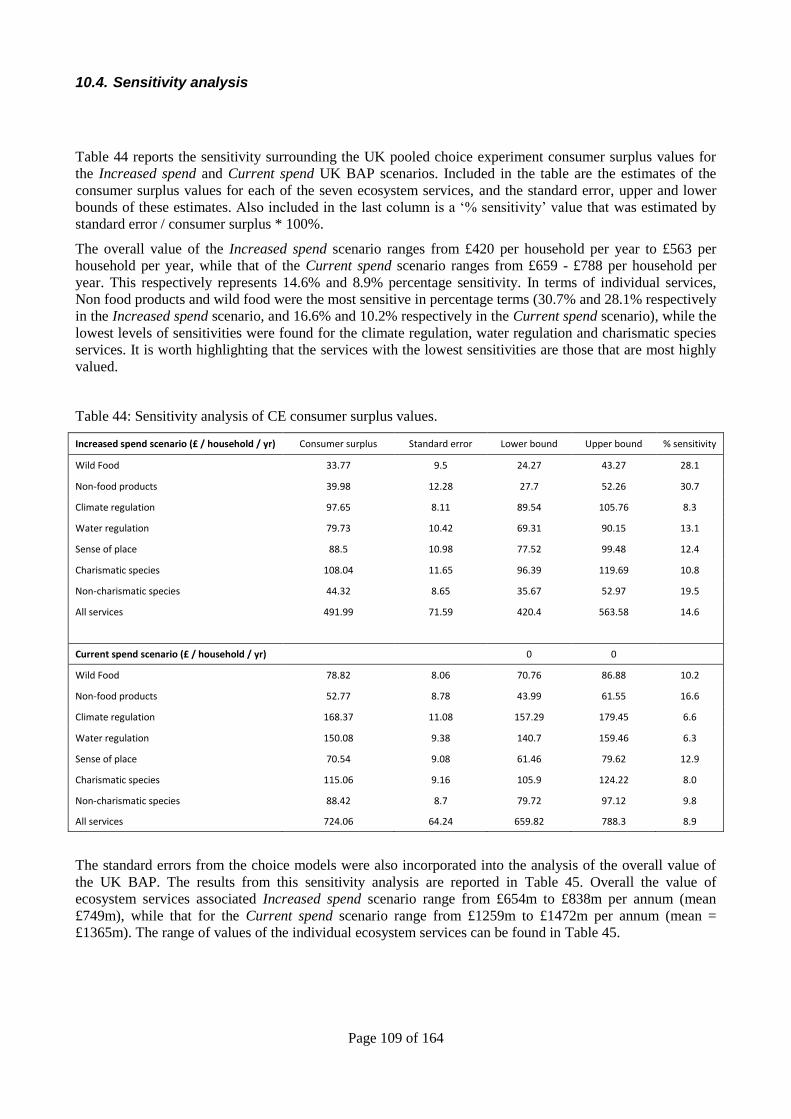
Page 109 of 164
10.4. Sensitivity analysis
Table 44 reports the sensitivity surrounding the UK pooled choice experiment consumer surplus values for
the Increased spend and Current spend UK BAP scenarios. Included in the table are the estimates of the
consumer surplus values for each of the seven ecosystem services, and the standard error, upper and lower
bounds of these estimates. Also included in the last column is a ‘% sensitivity’ value that was estimated by
standard error / consumer surplus * 100%.
The overall value of the Increased spend scenario ranges from £420 per household per year to £563 per
household per year, while that of the Current spend scenario ranges from £659 - £788 per household per
year. This respectively represents 14.6% and 8.9% percentage sensitivity. In terms of individual services,
Non food products and wild food were the most sensitive in percentage terms (30.7% and 28.1% respectively
in the Increased spend scenario, and 16.6% and 10.2% respectively in the Current spend scenario), while the
lowest levels of sensitivities were found for the climate regulation, water regulation and charismatic species
services. It is worth highlighting that the services with the lowest sensitivities are those that are most highly
valued.
Table 44: Sensitivity analysis of CE consumer surplus values.
Increased spend scenario (£ / household / yr) Consumer surplus Standard error Lower bound Upper bound % sensitivity
Wild Food 33.77 9.5 24.27 43.27 28.1
Non-food products 39.98 12.28 27.7 52.26 30.7
Climate regulation 97.65 8.11 89.54 105.76 8.3
Water regulation 79.73 10.42 69.31 90.15 13.1
Sense of place 88.5 10.98 77.52 99.48 12.4
Charismatic species 108.04 11.65 96.39 119.69 10.8
Non-charismatic species 44.32 8.65 35.67 52.97 19.5
All services 491.99 71.59 420.4 563.58 14.6
Current spend scenario (£ / household / yr)
0 0
Wild Food 78.82 8.06 70.76 86.88 10.2
Non-food products 52.77 8.78 43.99 61.55 16.6
Climate regulation 168.37 11.08 157.29 179.45 6.6
Water regulation 150.08 9.38 140.7 159.46 6.3
Sense of place 70.54 9.08 61.46 79.62 12.9
Charismatic species 115.06 9.16 105.9 124.22 8.0
Non-charismatic species 88.42 8.7 79.72 97.12 9.8
All services 724.06 64.24 659.82 788.3 8.9
The standard errors from the choice models were also incorporated into the analysis of the overall value of
the UK BAP. The results from this sensitivity analysis are reported in Table 45. Overall the value of
ecosystem services associated Increased spend scenario range from £654m to £838m per annum (mean
£749m), while that for the Current spend scenario range from £1259m to £1472m per annum (mean =
£1365m). The range of values of the individual ecosystem services can be found in Table 45.
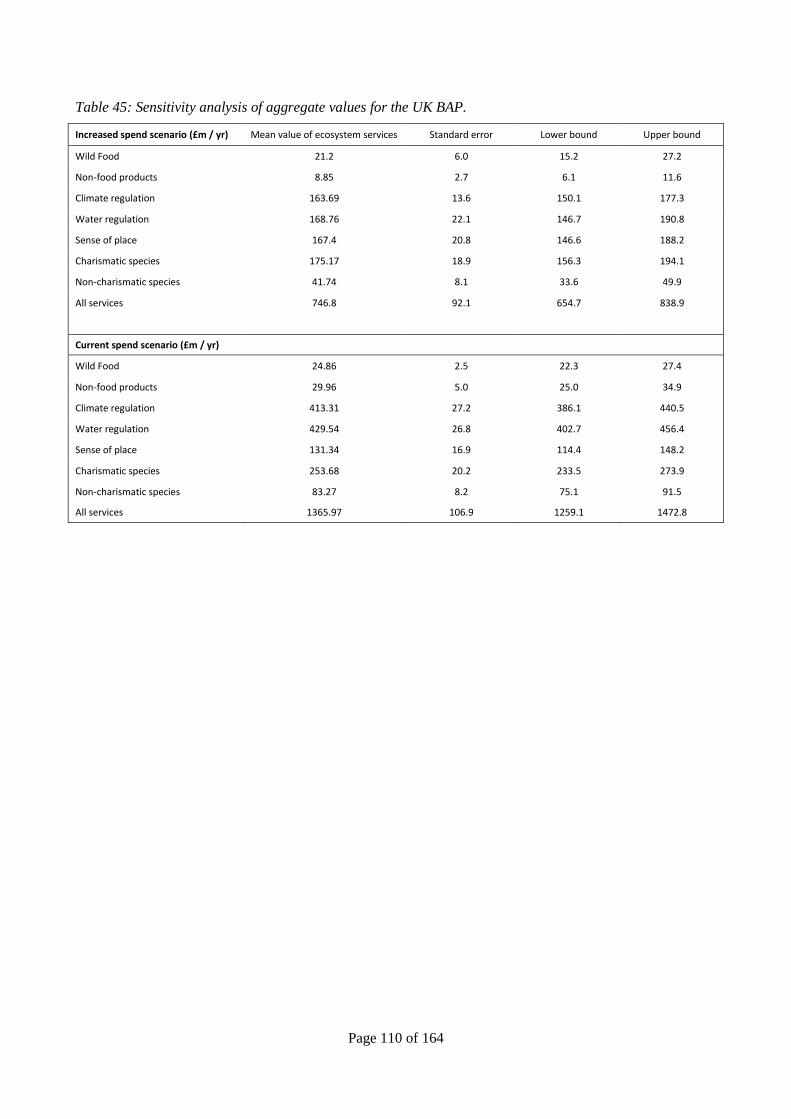
Page 110 of 164
Table 45: Sensitivity analysis of aggregate values for the UK BAP.
Increased spend scenario (£m / yr) Mean value of ecosystem services Standard error Lower bound Upper bound
Wild Food 21.2 6.0 15.2 27.2
Non-food products 8.85 2.7 6.1 11.6
Climate regulation 163.69 13.6 150.1 177.3
Water regulation 168.76 22.1 146.7 190.8
Sense of place 167.4 20.8 146.6 188.2
Charismatic species 175.17 18.9 156.3 194.1
Non-charismatic species 41.74 8.1 33.6 49.9
All services 746.8 92.1 654.7 838.9
Current spend scenario (£m / yr)
Wild Food 24.86 2.5 22.3 27.4
Non-food products 29.96 5.0 25.0 34.9
Climate regulation 413.31 27.2 386.1 440.5
Water regulation 429.54 26.8 402.7 456.4
Sense of place 131.34 16.9 114.4 148.2
Charismatic species 253.68 20.2 233.5 273.9
Non-charismatic species 83.27 8.2 75.1 91.5
All services 1365.97 106.9 1259.1 1472.8
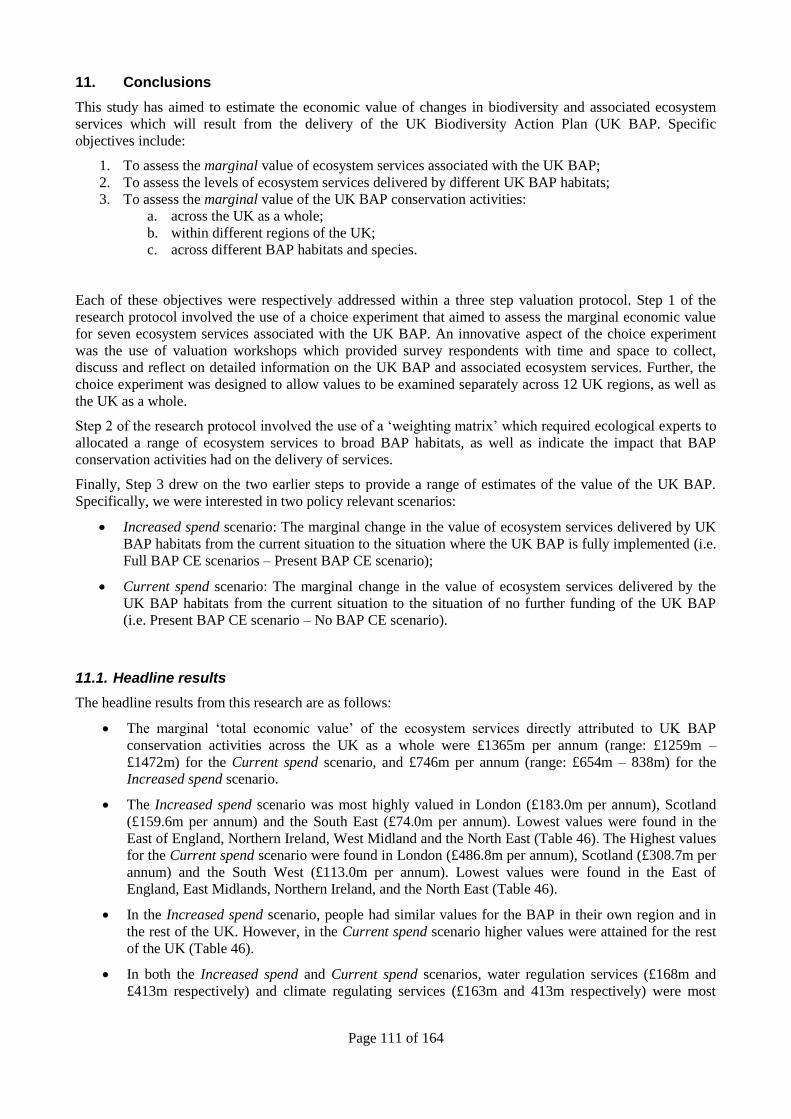
Page 111 of 164
11. Conclusions
This study has aimed to estimate the economic value of changes in biodiversity and associated ecosystem
services which will result from the delivery of the UK Biodiversity Action Plan (UK BAP. Specific
objectives include:
1. To assess the marginal value of ecosystem services associated with the UK BAP;
2. To assess the levels of ecosystem services delivered by different UK BAP habitats;
3. To assess the marginal value of the UK BAP conservation activities:
a. across the UK as a whole;
b. within different regions of the UK;
c. across different BAP habitats and species.
Each of these objectives were respectively addressed within a three step valuation protocol. Step 1 of the
research protocol involved the use of a choice experiment that aimed to assess the marginal economic value
for seven ecosystem services associated with the UK BAP. An innovative aspect of the choice experiment
was the use of valuation workshops which provided survey respondents with time and space to collect,
discuss and reflect on detailed information on the UK BAP and associated ecosystem services. Further, the
choice experiment was designed to allow values to be examined separately across 12 UK regions, as well as
the UK as a whole.
Step 2 of the research protocol involved the use of a ‘weighting matrix’ which required ecological experts to
allocated a range of ecosystem services to broad BAP habitats, as well as indicate the impact that BAP
conservation activities had on the delivery of services.
Finally, Step 3 drew on the two earlier steps to provide a range of estimates of the value of the UK BAP.
Specifically, we were interested in two policy relevant scenarios:
Increased spend scenario: The marginal change in the value of ecosystem services delivered by UK
BAP habitats from the current situation to the situation where the UK BAP is fully implemented (i.e.
Full BAP CE scenarios – Present BAP CE scenario);
Current spend scenario: The marginal change in the value of ecosystem services delivered by the
UK BAP habitats from the current situation to the situation of no further funding of the UK BAP
(i.e. Present BAP CE scenario – No BAP CE scenario).
11.1. Headline results
The headline results from this research are as follows:
The marginal ‘total economic value’ of the ecosystem services directly attributed to UK BAP
conservation activities across the UK as a whole were £1365m per annum (range: £1259m –
£1472m) for the Current spend scenario, and £746m per annum (range: £654m – 838m) for the
Increased spend scenario.
The Increased spend scenario was most highly valued in London (£183.0m per annum), Scotland
(£159.6m per annum) and the South East (£74.0m per annum). Lowest values were found in the
East of England, Northern Ireland, West Midland and the North East (Table 46). The Highest values
for the Current spend scenario were found in London (£486.8m per annum), Scotland (£308.7m per
annum) and the South West (£113.0m per annum). Lowest values were found in the East of
England, East Midlands, Northern Ireland, and the North East (Table 46).
In the Increased spend scenario, people had similar values for the BAP in their own region and in
the rest of the UK. However, in the Current spend scenario higher values were attained for the rest
of the UK (Table 46).
In both the Increased spend and Current spend scenarios, water regulation services (£168m and
£413m respectively) and climate regulating services (£163m and 413m respectively) were most
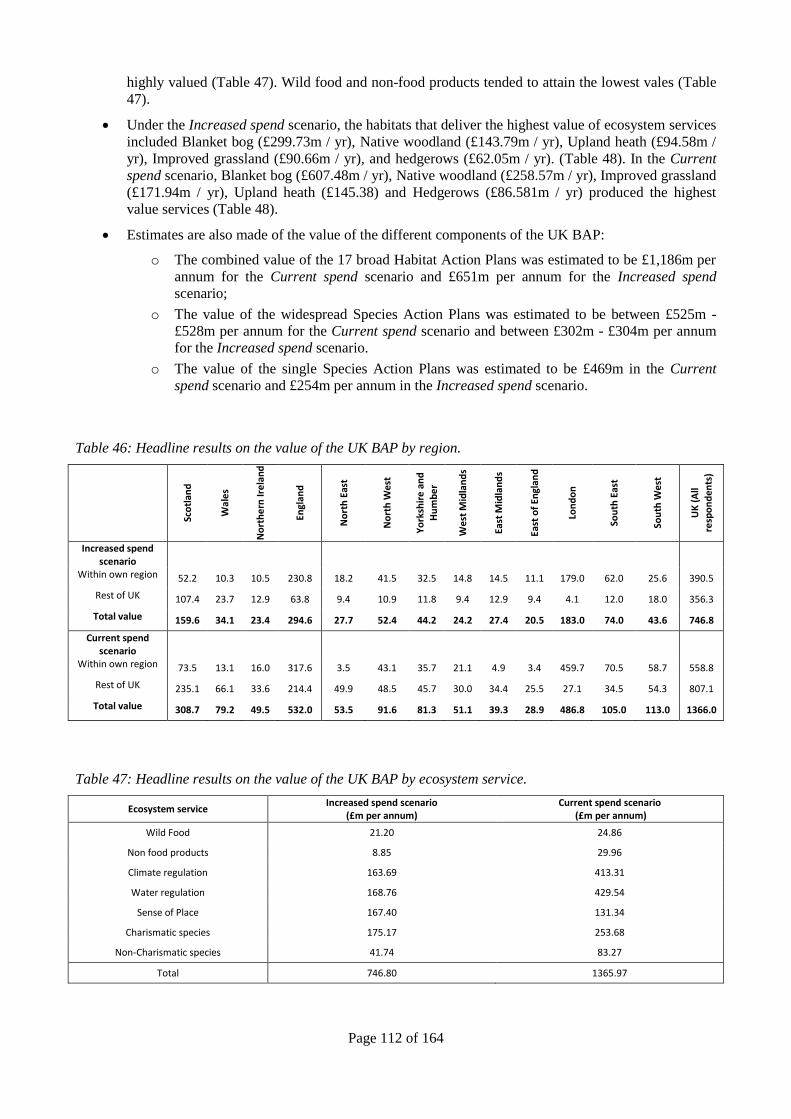
Page 112 of 164
highly valued (Table 47). Wild food and non-food products tended to attain the lowest vales (Table
47).
Under the Increased spend scenario, the habitats that deliver the highest value of ecosystem services
included Blanket bog (£299.73m / yr), Native woodland (£143.79m / yr), Upland heath (£94.58m /
yr), Improved grassland (£90.66m / yr), and hedgerows (£62.05m / yr). (Table 48). In the Current
spend scenario, Blanket bog (£607.48m / yr), Native woodland (£258.57m / yr), Improved grassland
(£171.94m / yr), Upland heath (£145.38) and Hedgerows (£86.581m / yr) produced the highest
value services (Table 48).
Estimates are also made of the value of the different components of the UK BAP:
o The combined value of the 17 broad Habitat Action Plans was estimated to be £1,186m per
annum for the Current spend scenario and £651m per annum for the Increased spend
scenario;
o The value of the widespread Species Action Plans was estimated to be between £525m -
£528m per annum for the Current spend scenario and between £302m - £304m per annum
for the Increased spend scenario.
o The value of the single Species Action Plans was estimated to be £469m in the Current
spend scenario and £254m per annum in the Increased spend scenario.
Table 46: Headline results on the value of the UK BAP by region.
Sco
tlan
d
Wal
es
No
rth
ern
Ire
lan
d
Engl
and
No
rth
Eas
t
No
rth
We
st
Yo
rksh
ire
an
d
Hu
mb
er
We
st M
idla
nd
s
East
Mid
lan
ds
East
of
Engl
and
Lon
do
n
Sou
th E
ast
Sou
th W
est
UK
(A
ll
resp
on
den
ts)
Increased spend scenario
Within own region 52.2 10.3 10.5 230.8 18.2 41.5 32.5 14.8 14.5 11.1 179.0 62.0 25.6 390.5
Rest of UK 107.4 23.7 12.9 63.8 9.4 10.9 11.8 9.4 12.9 9.4 4.1 12.0 18.0 356.3
Total value 159.6 34.1 23.4 294.6 27.7 52.4 44.2 24.2 27.4 20.5 183.0 74.0 43.6 746.8
Current spend scenario
Within own region 73.5 13.1 16.0 317.6 3.5 43.1 35.7 21.1 4.9 3.4 459.7 70.5 58.7 558.8
Rest of UK 235.1 66.1 33.6 214.4 49.9 48.5 45.7 30.0 34.4 25.5 27.1 34.5 54.3 807.1
Total value 308.7 79.2 49.5 532.0 53.5 91.6 81.3 51.1 39.3 28.9 486.8 105.0 113.0 1366.0
Table 47: Headline results on the value of the UK BAP by ecosystem service.
Ecosystem service Increased spend scenario
(£m per annum) Current spend scenario
(£m per annum)
Wild Food 21.20 24.86
Non food products 8.85 29.96
Climate regulation 163.69 413.31
Water regulation 168.76 429.54
Sense of Place 167.40 131.34
Charismatic species 175.17 253.68
Non-Charismatic species 41.74 83.27
Total 746.80 1365.97
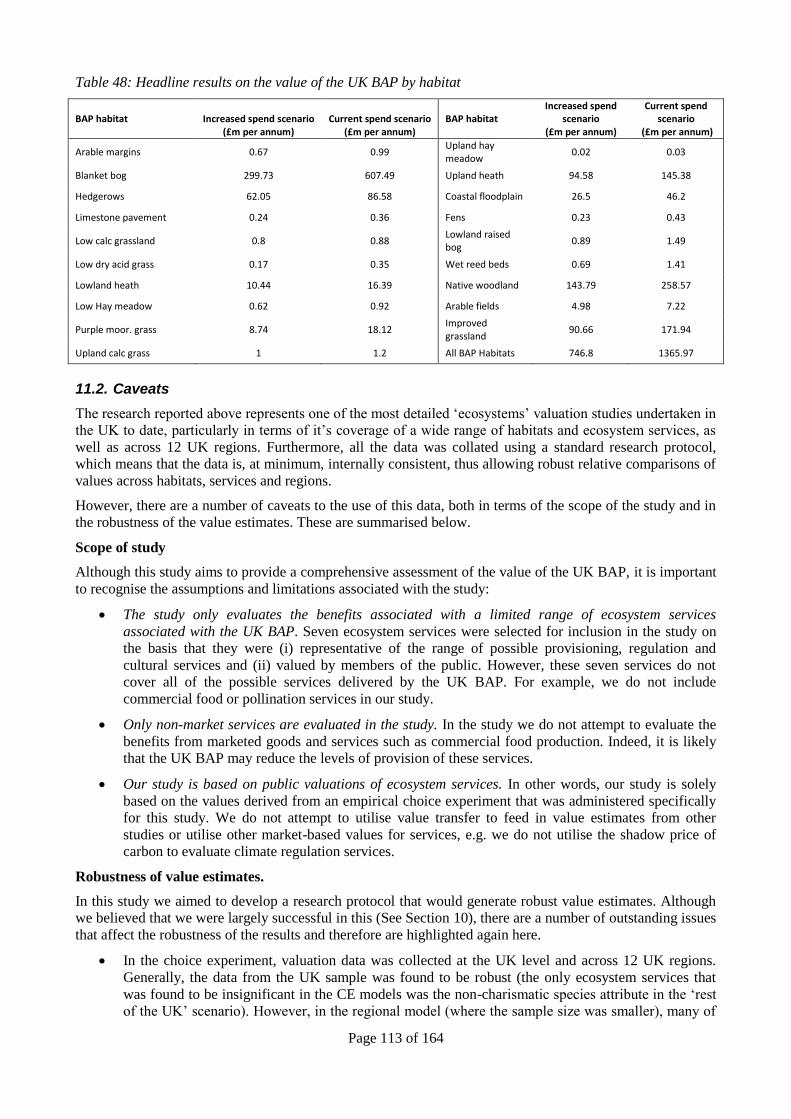
Page 113 of 164
Table 48: Headline results on the value of the UK BAP by habitat
BAP habitat Increased spend scenario (£m per annum)
Current spend scenario (£m per annum)
BAP habitat Increased spend
scenario (£m per annum)
Current spend scenario
(£m per annum)
Arable margins 0.67 0.99 Upland hay meadow
0.02 0.03
Blanket bog 299.73 607.49 Upland heath 94.58 145.38
Hedgerows 62.05 86.58 Coastal floodplain 26.5 46.2
Limestone pavement 0.24 0.36 Fens 0.23 0.43
Low calc grassland 0.8 0.88 Lowland raised bog
0.89 1.49
Low dry acid grass 0.17 0.35 Wet reed beds 0.69 1.41
Lowland heath 10.44 16.39 Native woodland 143.79 258.57
Low Hay meadow 0.62 0.92 Arable fields 4.98 7.22
Purple moor. grass 8.74 18.12 Improved grassland
90.66 171.94
Upland calc grass 1 1.2 All BAP Habitats 746.8 1365.97
11.2. Caveats
The research reported above represents one of the most detailed ‘ecosystems’ valuation studies undertaken in
the UK to date, particularly in terms of it’s coverage of a wide range of habitats and ecosystem services, as
well as across 12 UK regions. Furthermore, all the data was collated using a standard research protocol,
which means that the data is, at minimum, internally consistent, thus allowing robust relative comparisons of
values across habitats, services and regions.
However, there are a number of caveats to the use of this data, both in terms of the scope of the study and in
the robustness of the value estimates. These are summarised below.
Scope of study
Although this study aims to provide a comprehensive assessment of the value of the UK BAP, it is important
to recognise the assumptions and limitations associated with the study:
The study only evaluates the benefits associated with a limited range of ecosystem services
associated with the UK BAP. Seven ecosystem services were selected for inclusion in the study on
the basis that they were (i) representative of the range of possible provisioning, regulation and
cultural services and (ii) valued by members of the public. However, these seven services do not
cover all of the possible services delivered by the UK BAP. For example, we do not include
commercial food or pollination services in our study.
Only non-market services are evaluated in the study. In the study we do not attempt to evaluate the
benefits from marketed goods and services such as commercial food production. Indeed, it is likely
that the UK BAP may reduce the levels of provision of these services.
Our study is based on public valuations of ecosystem services. In other words, our study is solely
based on the values derived from an empirical choice experiment that was administered specifically
for this study. We do not attempt to utilise value transfer to feed in value estimates from other
studies or utilise other market-based values for services, e.g. we do not utilise the shadow price of
carbon to evaluate climate regulation services.
Robustness of value estimates.
In this study we aimed to develop a research protocol that would generate robust value estimates. Although
we believed that we were largely successful in this (See Section 10), there are a number of outstanding issues
that affect the robustness of the results and therefore are highlighted again here.
In the choice experiment, valuation data was collected at the UK level and across 12 UK regions.
Generally, the data from the UK sample was found to be robust (the only ecosystem services that
was found to be insignificant in the CE models was the non-charismatic species attribute in the ‘rest
of the UK’ scenario). However, in the regional model (where the sample size was smaller), many of
Page 114 of 164
the ecosystem service attributes were insignificant in the CE models. The consequence of which was
that we were unable to attain values for these services and therefore the regional values are likely to
be under-estimates of the true value of delivered services. We therefore advise the reader caution in
the interpretation of the regional models. Most of the results presented in this report are based on the
UK sample and therefore are generally robust.
In the weighting matrix, some concerns were raised in terms of the robustness of some of the habitat
/ ecosystem services ‘weighting scores’. In particular, there were concerns about the robustness of
weighting scores for the ‘Additional services due to BAP’, which are used to determine the final
aggregate values. Also, some of the grassland and arable habitats only received a limited number of
responses and therefore these scores may be open to question. Finally, it should be stressed that the
weighting scores represent a somewhat simplistic measure of the impact of the UK BAP on the
delivery of services, and therefore we advise caution in the use and interpretation of our weighting
scores.
Page 115 of 164
12. References
AEA Energy and Environment, 2006. UK Emissions of Carbon Dioxide, Methane and Nitrous Oxide by
National Communication Source Category. Defra, London.
Alvarez-Farizo, B., Hanley, N., 2006. Improving the process of valuing non-market benefits: Combining
citizens' juries with choice modelling. Land Economics 82, 465-478.
Barbier, E.B., 2007. Valuing ecosystems as productive inputs. Economic Policy, 179-229.
Bech, M., Gyrd-Hansen, D., 2005. Effects coding in discrete choice experiments. Health Economics 14,
1079-1083.
Blamey, R.K., James, R.F., Smith, R., Niemeyer, S., 2000. Citizens' Juries and Environmental Value
Assessment. Australian National University, Canberra.
Brainard, J., Bateman, I.J., Lovett, A.A., 2008. The social value of carbon sequestered in Great Britain's
woodlands. Ecological Economics In Press, Doi:10.1016/j.ecolecon.2008.08.021.
BRIG, 2006. Revised Habitat Action Plan Targets 2006, in: Group, U.B.R.I. (Ed.). Natural England (UK
Biodiversity Reporting Information Group), Peterborough.
Broadmeadow, M., Matthews, R., 2003. Forests, Carbon and Climate Change: the UK Contribution. Forestry
Commission,, Edinburgh.
Buisson, R., Rayment, M., 2006. UK Biodiversity Action Plan: Preparing Costings for Species and Habitat
Action Plans: Costing Habitat Action for Widespread Countryside Species. Defra, London.
Bullock, C., Kay, J., 1997. Preservation and change in the upland landscape: The public benefits of grazing
management. Journal of Environmental Planning and Management 40, 315-334.
Christie, M., Azevedo, C.D., 2009. Testing the Consistency Between Standard Contingent Valuation,
Repeated Contingent Valuation and Choice Experiments. Journal of Agricultural Economics 60, 154-170.
Christie, M., Fazey, I., Cooper, R., Hyde, T., Deri, A., Hughes, L., Bush, G., Brander, L., Nahman, A., de
Lange, W., Reyers, B., 2008a. An Evaluation of Economic and Non-economic Techniques for Assessing the
Importance of Biodiversity to People in Developing Countries. Defra, London.
Christie, M., Fazey, I., Hyde, T., 2008b. Economic Valuation of the Benefits of the UK Biodiversity Action
Plan: Phase 1 report. Defra, London.
Christie, M., Hanley, N., Warren, J., Murphy, K., Wright, R., Hyde, T., 2006. Valuing the diversity of
biodiversity. Ecological Economics 58, 304-317.
Costanza, R., d'Arge, R., de Groot, R., Farber, S., Grasso, M., Hannon, B., Limburg, K., Naeem, S., O'Neill,
R.V., Paruelo, J., Raskin, R.G., Sutton, P., van den Belt, M., 1997. The value of the world's ecosystem
services and natural capital. Nature 387, 253-260.
Costanza, R., Ruth, M., 1998. Using dynamic modelling to scope environmental problems and build
consensus. Environmental Management 22, 183-195.
Daily, g.C., 1997. Nature's Services. Societal Dependence on Natural Ecosystems. Island Press, Washington,
D.C., p. 392.
Defra, 2007. An introductory guide to valuing ecosystem services. Defra, London.
Eftec, 2006. Economic Valuation of Environmental Impacts in the Severely Disadvantaged Areas. Defra,
London.
European Commission, German Ministry for the Environment, 2008. TEEB - The Economics of Ecosystems
and Biodiversity: An interim report. European Communities, Brussels.
Evans, E., Ashley, R., Hall, J., Pening-Rowsell, E., Saul, A., Sayers, P., Thorne, C., Watkinson, A., 2004a.
Foresight. Future Flooding. Scientific summary: Volume I - Future risk and their drivers. Office of Science
and Technology., London.
Evans, E., Ashley, R., Hall, J., Penning-Rowsell, E.C., Saul, A., Sayers, P., Thorne, C., Watkinson, A.,
2004b. Foresight. Future Flooding. Scientific Summary: Volume II - Managing future risks. Office of
Science and Technology, London.
Ferrini, S., Scarpa, R., 2007. Designs with a priori information for nonmarket valuation with choice
experiments: A Monte Carlo study. Journal of Environmental Economics and Management 53, 342 - 363.
GHK Consulting Ltd., 2006. UK Biodiversity Action Plan: Preparing Costings for Species and Habitat
Action Plans. Defra, London.
GHK Consulting LTD., 2010. Costs of the UK Biodiversity Action Plan - Update. Defra, London.
Haines-Young, R., Potschin, M., 2008. England's Terrestrial Ecosystem Services and the Rationale for an
Ecosystem Approach: Full Technical Report. DEFRA, London.
Haines-Young, R., Potschin, M., Fish, R., Somper, C., 2007. The Ecosystem Concept and the Identification
of Ecosystem Goods and Services in the English Policy Context - A Review Paper. Defra, London.
Page 116 of 164
Haines-Young, R.H., Barr, C.J., Black, H.I.J., Briggs, D.J., Bunce, R.G.H., Clarke, R.T., Cooper, A.,
Dawson, F.H., Firbank, L.G., Fuller, R.M., Furse, M.T., Gillespie, M.K., Hill, R., Hornung, M., Howard,
D.C., McCann, T., Morecroft, M.D., Petit, S., Sier, A.R.J., Smart, S.M., Smith, G.M., Stott, A.P., Stuart,
R.C., Watkins, J.W., 2000. Accounting for nature: assessing habitats in the UK countryside. DETR, London.
Hanley, N., MacMillan, D., Wright, R.E., Bullock, C., Simpson, I., Parsisson, D., Crabtree, B., 1998.
Contingent valuation versus choice experiments: estimating the benefits of environmentally sensitive areas in
scotland. Journal of Agricultural Economics 49, 1-15.
Hargreaves, J.K., Milne, R., Cannell, M.G.R., 2003. Carbon balance of afforested peatland in Scotland.
Forestry 76, 299 - 317.
Heal, G.M., Barbier, E.B., Boyle, K.J., Covich, A.P., Gloss, S.P., Hershner, C.H., Hoehn, J.P., Pringle, C.M.,
Polasky, S., Segerson, K., Shrader-Frechette, K., 2005. Valuing Ecosystem Services:Toward Better
Environmental Decision Making. The National Academies Press, Washington DC.
Hoehn, J.P., Loomis, J.B., 1993. Substitution Effects in the Valuation of Multiple Environmental Programs.
Journal of Environmental Economics and Management 25, 56-75.
Hutchison, L., 2010. Prioritization of Habitat Management Areas Using Stakeholder Analysis of Ecosystem
Services within a GIS Framework, A Community on Ecosystem Services, Pheonix, Arizona.
IUCN, 2004. How Much is an Ecosystem Worth? World Bank
Lichtenstein, S., Slovic, P., 2006. The Construction of Preference. Cambridge University Press, New York.
MacMillan, D., Hanley, N., Lienhoop, N., 2006. Contingent valuation: Environmental polling or preference
engine? Ecological Economics 60, 299-307.
Maynard, S., 2010. Valuing Ecosystem Services through Participatory Processes for Policy and Planning in
Southeast Queensland, A Community on Ecosystem Services, Pheonix, Arizona.
MEA, 2005. Millennium Ecosystem Assessment. Ecosystems and Human Well-being. Island Press,
Washington D.C.
Millennium Ecosystem Assessment, 2005. Ecosystems and Human Well-being: Synthesis. A report of the
Millennium Ecosystem Assessment. Island Press, Washington, D.C. .
Mitchell, R.C., Carson, R.T., 1989a. Using Surveys to Value Public Goods: The Contingent Valuation
Method. Resources for the Future, Washington, D.C.
Mitchell, R.C., Carson, R.T., 1989b. Using surveys to value public goods: the contingent valuation method.
Resources for the Future, Washington D.C.
Moors for the Future Partnership, 2007. Peak District Moorland Carbon Flux: Research Note No. 12,
Research Note No. 12. Moors for the Future Partnership, Edale.
Payne, J.W., Bettman, J.R., Schkade, D.A., 1999. Measuring Constructed Preferences: Towards a Building
Code. Journal of Risk and Uncertainty 19, 243-270.
Rayment, M., 2006. UK Biodiversity Action Plan: Preparing Costings for Species and Habitat Action Plans.
Defra, London.
Sayers, P., Calvert, M., 2007. National Flood Risk Assessment for Northern Ireland: Flooding mapping
strategy. Rivers Agency, Belfast.
Sayers, P., Panzeri, M., Ohl, C., Segura-Dominguez, S., Benwell, D., Deakin, R., Bodilly, A., Bowley, S.,
Chatterton, J., 2003. Chapter 3: National Flood risk assessment for England and Wales, Foresight Flod and
Coastal Defence Project: Phase 2. Foresight, London.
Swait, J., Louviere, J., 1993. The role of the scale parameter in the estimation and comparison of
multinomial logit models. Journal of Marketing Research 30, 305-314.
TEEB, 2010. The Economics of Ecosystems and Biodiversity: Mainstreaming the Economics of Nature: A
synthesis of the approach, conclusions and recommendations of TEEB. Progress Press, Malta.
The Scottish Government, 2008. A framework document outlining sustainable flood risk management in
Scotland. The Scottish Government, Edinburgh.
UK BAP, 2008. Evidence for the selection of priority species., 20 Oct 2008 ed. UK BAP.
Van den Belt, M.J., Deutch, L., Jansson, A., 1998. A consensus-based simulation model for management in
the Patagonia coastal zone. Ecological Modeling 110, 79-103.
Watkinson, A., 2003. Assessment of environmental impacts of future flood risk., in: Evan, E. (Ed.),
Foresight Flood and Coastal Defence Project - Overview of Phase 2. Government Office for Science,
London.
Williams, J.M., 2006. Common Standards Monitoring for Designated Sites: First Six Year Report. JNCC,
Peterborough.
Page 117 of 164
Willis, K.G., Garrod, G.D., 1993. Valuing Landscape: a Contingent Valuation Approach. Journal of
Environmental Management 37, 1-22.
Worrall, F., Burt, T., Adamson, J., 2004. Can climate change explain increases in DOC flux from upland
peat catchments? Sci. Total Environ. 326, 95-112.

Page 118 of 164
Appendix
In this appendix we attach (i) the instructions for completing the weighting matrix and (ii) the interviewer script for the
valuation workshops. A copy of the actual weighting matrix and all of the other material for valuation workshop (including the
films, information sets etc) can be found on the project website: http://users.aber.ac.uk/ath/index.htm .
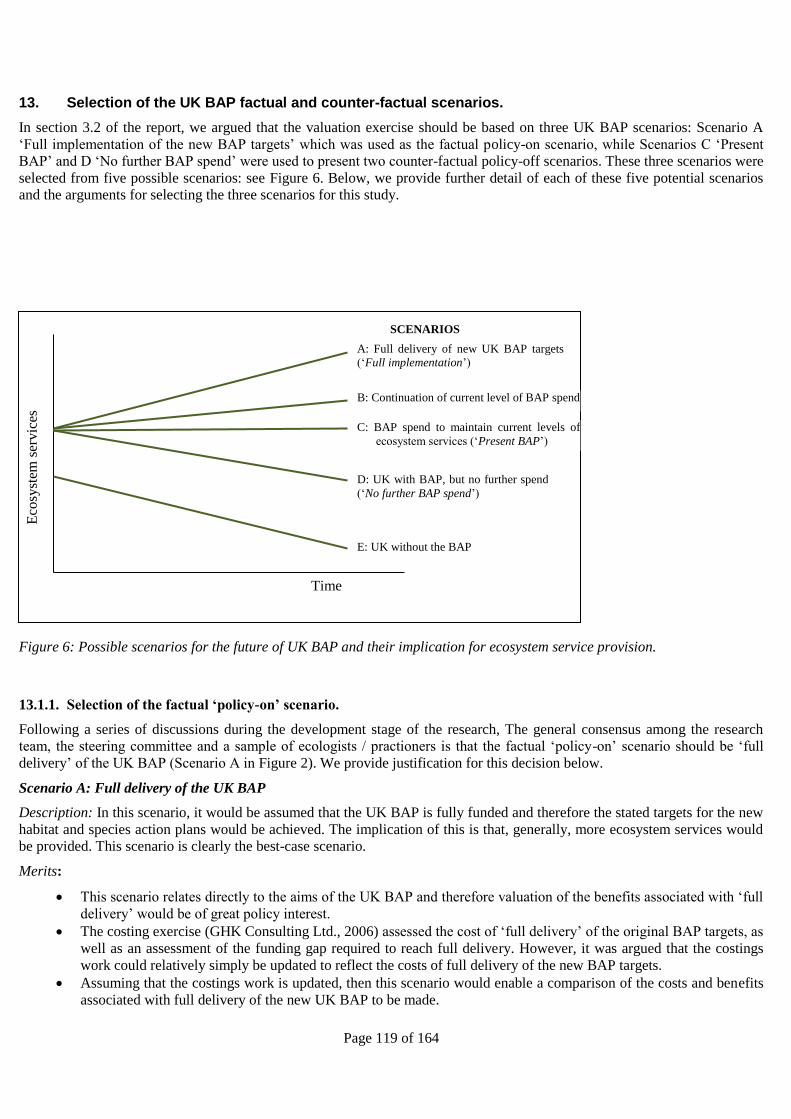
Page 119 of 164
13. Selection of the UK BAP factual and counter-factual scenarios.
In section 3.2 of the report, we argued that the valuation exercise should be based on three UK BAP scenarios: Scenario A
‘Full implementation of the new BAP targets’ which was used as the factual policy-on scenario, while Scenarios C ‘Present
BAP’ and D ‘No further BAP spend’ were used to present two counter-factual policy-off scenarios. These three scenarios were
selected from five possible scenarios: see Figure 6. Below, we provide further detail of each of these five potential scenarios
and the arguments for selecting the three scenarios for this study.
Figure 6: Possible scenarios for the future of UK BAP and their implication for ecosystem service provision.
13.1.1. Selection of the factual ‘policy-on’ scenario.
Following a series of discussions during the development stage of the research, The general consensus among the research
team, the steering committee and a sample of ecologists / practioners is that the factual ‘policy-on’ scenario should be ‘full
delivery’ of the UK BAP (Scenario A in Figure 2). We provide justification for this decision below.
Scenario A: Full delivery of the UK BAP
Description: In this scenario, it would be assumed that the UK BAP is fully funded and therefore the stated targets for the new
habitat and species action plans would be achieved. The implication of this is that, generally, more ecosystem services would
be provided. This scenario is clearly the best-case scenario.
Merits:
This scenario relates directly to the aims of the UK BAP and therefore valuation of the benefits associated with ‘full
delivery’ would be of great policy interest.
The costing exercise (GHK Consulting Ltd., 2006) assessed the cost of ‘full delivery’ of the original BAP targets, as
well as an assessment of the funding gap required to reach full delivery. However, it was argued that the costings
work could relatively simply be updated to reflect the costs of full delivery of the new BAP targets.
Assuming that the costings work is updated, then this scenario would enable a comparison of the costs and benefits
associated with full delivery of the new UK BAP to be made.
C: BAP spend to maintain current levels of
ecosystem services (‘Present BAP’)
E: UK without the BAP
D: UK with BAP, but no further spend
(‘No further BAP spend’)
A: Full delivery of new UK BAP targets
(‘Full implementation’)
B: Continuation of current level of BAP spend
Time
Eco
syst
em s
ervic
es
SCENARIOS
Page 120 of 164
Issues:
It may be difficult to predict the level of ecosystem services provided by ‘full delivery’ of the UK BAP.
It is considered unlikely that ‘full delivery’ would actually be achieved.
The costings research would need to be updated.
Clearly, a ‘full delivery’ of the new BAP targets scenario is of great relevance to policy and would link directly with an update
of the costings work. The concern that ‘full delivery’ is unlikely to be achievable is, to some extent, irrelevant since it would
be possible to extrapolate the data relating to full delivery to other partial-delivery scenarios. Other possible scenarios that
offer lower levels of delivery would be of less policy interest since they would not allow an assessment of the benefits
associated with the funding gap for BAP to be assessed. Given the above, it is proposed that the factual ‘policy-on’ scenario
should relate to ‘full delivery’ of the new UK BAP targets.
13.1.2. Selection of the counter-factual ‘policy-off’ scenario.
Although the case for the factual scenario is reasonably clear-cut, there is more ambiguity relating to the best scenario to
represent the counter-factual ‘policy-off’ scenario. Below, we present cases for four possible counter-factual scenarios as
represented as Scenarios B – E in Figure 2. It should be highlighted that, in the discussions below, the various options for the
preferred counter-factual scenarios are discussed in the context the preferred factual scenario (Scenario A).
Scenario B: Continuation of current level of BAP spend
Description: In this scenario, it is assumed that the level of funding for the UK BAP is continued at current levels as identified
in the expenditure component of the costings work (GHK Consulting Ltd., 2006). In this scenario there would be some
progress towards the original habitat and species action plan targets, however, the new BAP targets would not be achieved.
The implication of this is that, generally, the levels of provision of ecosystem services would continue to increase at current
rates.
A policy change from Counter-Factual Scenario B to the Factual Scenario A would represent the shortfall in BAP and
ecosystem service provision associated with the current levels of expenditure (i.e. the funding gap identified in the costings
research). Thus, a valuation of the benefits associated with a move from Scenario B to Scenario A would reflect the BAP and
ecosystem service benefits associated with closing the current funding gap between current spend and full delivery of the UK
BAP.
Merits:
Scenario B relates directly to the current situation with BAP funding in that it assumes that current levels of
expenditure (as identified in the costings work) are continued;
It would be relatively simply to extrapolate current trends in ecosystem service provision to predict the future levels
of ecosystem service provision under Scenario B.
An assessment of the benefits associated with a move from Scenario B to Scenario A would provide evidence on the
value of full implementation of the UK BAP from the current baseline, assuming current expenditure is maintained.
This benefit estimate would be directly comparable with the costs of closing the funding gap as identified in the
costings research.
Using Scenario B as the counter-factual would thus provide evidence to justify whether (or not) the funding gap
identified in the costings work should be closed.
Issues:
Scenario B would not enable an assessment to be made of the benefits associated with current levels of spend on the
UK BAP.
In terms of ecosystem service provision, the current level of expenditure on the UK BAP is arbitory.
Scenario C: BAP spend to maintain current levels of ecosystem services
Description: In this scenario, it would be assumed that the situation as is now, but that there would be some further spend on
the UK BAP to maintain existing stocks of habitats and species and their associated ecosystem services. This scenario would
require an assessment of what levels of future spend would be required to maintain the status quo.
The policy change from Counter-Factual Scenario C to the Factual Scenario A would represent the level of BAP and
ecosystem service provision delivered through full implementation of the UK BAP from the current stocks.
Page 121 of 164
Merits:
Scenario C assumes that BAP spend to date has been made, and therefore the current stock of habitats, species and
their related ecosystem services is known, and that these levels of stock would be maintained in the future. The
advantage of this is that it removes the requirement to predict the impact of alternative spending regimes.
The assumption of current levels of stocks are maintained would simplify the cognitive task in both the weighting
matrix and choice experiment.
An assessment of the benefits associated with a move from Scenario C to Scenario A would provide evidence on the
value of a fully funded UK BAP from current BAP stocks.
Issues:
The costings research did not include a cost scenario that would aim to retain the status quo in terms of current BAP
stocks.
An assessment of the benefits associated with a move from Scenario C to Scenario A would not relate to the costing
work.
Scenario D: UK with BAP, but no further spend
Description: In this scenario, it would be assumed that the situation as is now, but that there is no further spend on the UK
BAP. This scenario would require an assessment of the state of habitats and species and their related ecosystem services in the
absence of any future BAP funding; but assuming that other drivers for biodiversity funding are still in place. In this scenario,
it is likely that there would be some regression in the stocks of habitat and species. The implication of this is that, generally,
the level of provision of ecosystem services would also decline from current levels.
The policy change from Counter-Factual Scenario D to the Factual Scenario A would represent the level of BAP and
ecosystem service provision delivered through full implementation of the UK BAP from the current situation. In other words,
this scenario change would reflect the benefits associated with a fully funded BAP (as identified in the costings research).
Merits:
Scenario D assumes that BAP spend to date has been made, and therefore the current situation is known: although
the implications of the future withdrawal of BAP funding may be less clear.
An assessment of the benefits associated with a move from Scenario D to Scenario A would provide evidence on the
value of a fully funded UK BAP.
This benefit estimate would be directly comparable with the levels of funding necessary to deliver the UK BAP as
identified in the costings research.
Using Scenario D as the counter-factual would thus provide evidence to justify (or not) the levels of funding
necessary to deliver the UK BAP.
Issues:
Currently, biodiversity conservation in the UK is funded through the UK BAP as well as a number of other policy
drivers (see Section 3.1). Scenario D would thus require an unravelling of these two sources of funding, and an
assessment of the impact that a withdrawal of future BAP funding would have on the future stocks of habitats and
species and associated ecosystem services. Disentangling the impacts of BAP and other funding streams may be
challenging.
Scenario E: The UK without BAP
Description: In this scenario, it would be assumed that there had been No further BAP funding. This scenario would thus
require an assessment of the stock of habitats and species and their related ecosystem services in the absence of any past,
current or future BAP funding. This assessment is complicated by the fact that some existing BAPs are designated sites and
would have been delivered any way through these other drivers. In a No further BAP funding scenario, it is likely that the
current stocks of habitat and species would be lower than any of the other counter-factual scenarios and that the stocks would
continue to decline in the future. The implication of this is that, generally, the level of provision of ecosystem services would
be much lower than current levels.
The policy change from Counter-Factual Scenario E to the Factual Scenario A would represent the level of BAP and
ecosystem service provision delivered through all past, current and future spend on the UK BAP.
Page 122 of 164
Merits:
An assessment of the benefits associated with a move from Scenario E to Scenario A would provide evidence on the
full value of the UK BAP.
Issues:
Scenario E assumes no past, current or future spend on the BAP. Scenario E would thus require the prediction of
what the current and future stocks of habitats and species and their associated ecosystem services would be in the
absence of BAP expenditure. Such as assessment is likely to be difficult and is further complicated by the fact that
other drivers for biodiversity conservation, e.g. such as SSSIs, would have contributed to the delivery of some
elements of BAP.
The costings work looked at the annual costs of delivering the full UK BAP. HAPS cost are from 2006 till 2020
whilst SAPs are from 2006 until 2011. Counterfactual Scenario E would therefore not relate well to the costings
work. Neither would it relate well to the funding gap identified in the costings work.
Using Scenario E as the counter-factual would provide evidence to justify (or not) both past and future levels of
funding necessary to fully deliver the UK BAP. However, evidence justifying past expenditures is not that useful for
planning the future of BAP.
Selection of a preferred counter-factual scenario
Above, four possible counter-factual scenarios have been described. Below we provide a case for the selection of two of these
as counter-factual scenarios: Scenarios C and D.
First, Scenario E (the UK without BAP) was excluded since it was considered that this scenario was not relevant to future
policy decisions, i.e. scenario E could only be used to justify past BAP spend, but not allow comment of future spend
scenarios.
Scenarios B and Scenario C were both considered to represent the continuation of the status quo, where Scenario B represents
a continuation of current level of BAP spend (with some unknown increase in the level of ecosystem services) and Scenario C
represents activities to maintain current levels of ecosystem services (which would require an unknown level of expenditure).
Although scenario B was initially considered more appealing as it directly corresponds to the costings research, feedback from
the both the public pilot studies and the expert workshops indicated that it would be difficult to accurately gauge the level of
ecosystem service provision under this scenario. In Scenario C, the level of ecosystem service delivery was known and
therefore there was less uncertainty in this scenario. Based on this argument, it was concluded that Scenario C would be more
suitable to represent the current situation.
Finally, it was argued that Scenario D (UK with BAP, but no further spend) would also be of policy relevance since this
scenario can be used to justify (or not) the current BAP expenditure (if compared to Scenario C), as well as the costs to
achieve full implementation of the BAP (if compared to Scenario A).
Page 123 of 164
14. Choice experiment: ecosystem service attribute and levels.
The choice experiment aimed to assess the economic value of seven ecosystem services delivered by the UK BAP. A general
description of these attributes and attribute levels was presented in Section 4.3. In this appendix, we provide further detail of
the seven ecosystem service attributes, as well as outline the data used to define the three levels of provision of these
attributes.
14.1. Wild Food.
In the MA, all food products were included as an ecosystem service. However, it is important to acknowledge that the MA was
predominantly implemented in a developing country context where (i) people are often reliant on food gathered from nature,
and (ii) farming tends to be directly linked to the quality of the natural environment (there tends to be little use of external
inputs such as fertilisers etc). In contrast, people from the UK are not reliant on food gathered from nature and UK farming
tends to use external inputs (which blurs the interdependence of farming and nature). Further, a significant proportion of the
food purchased in the UK is imported from other countries and therefore would not be affected by changes in the UK BAP.
Thus, for the choice experiment, it is argue that food services delivered through the UK BAP should be restricted to ‘wild
food’; that is non-rare food products that people might gather / hunt from nature. The focus on wild food has a number of
appealing characteristics for this study. First, the availability of wild food is more closely linked to the UK BAP than food
produced on farms. Second, the collection and consumption of wild food may be considered as providing non-market benefits:
often people in the UK attain a sense of well-being from gathering wild food from nature. Thus, in the choice experiment, the
MA ‘Food’ ecosystem service is restricted to the valuation of ‘wild food’. Note, we will address the impact of the UK BAP on
commercial food production separately in the weighting matrix.
To our knowledge, there are no studies that link the UK BAP (or any other conservation programme) to the provision of wild
food. To assess the impact of the UK BAP on wild food, we make the assumption that the level of provision of wild food is
linked to changes in the quantity and quality of habitats where wild food is predominantly found: i.e. in woodlands. The
‘Revised habitat action plan targets 2006’ provides 2005 baseline data and 2015 BAP targets data for the ‘Native Woodland’
habitat (BRIG, 2006). Using these data, we argue that our three UK BAP scenarios would have the following impacts on the
provision of wild food for the UK as a whole:
Full implementation of the UK BAP: Under the full implementation of the UK BAP, it is predicted that over the
next ten years (2005 to 2015) the area of ‘native woodland’ in the UK would increase by 148,947 Ha (134,607 Ha
expansion + 14,340 Ha restoration) (BRIG, 2006). This increase represents a 14% increase in the area of Native
Woodland over the current ‘Maintenance’ area (BRIG, 2006). Assuming that there is a linear relationship between
the area of native woodland and the provision of wild food, it is estimated that there would be a 14% increase in the
availability of wild food under the Full Implementation scenario for the UK as a whole.
This approach was also used to estimate the predicted increase in wild food in England, Scotland, Wales and
Northern Ireland (Table 49). Unfortunately, no data were available on the level of expansion and restoration of
Native woodland in the English regions. Thus, the estimated % level of expansion in wild food for England was
used across all English regions and therefore it is assumed that the figures for England would be consistent across
all English regions.
Present BAP: Under the present BAP scenario, there would be no change in the area or quality of Native woodland
habitat and therefore it is assumed that there would be no change from the current situation to the availability of
wild food under the Present BAP scenario.
No further BAP funding: Given that there are legal controls to protect against the loss of native woodlands, it is
expected that the area of native woodland would not change under the No further BAP funding scenario. However,
it is predicted that there would be some loss in the quality of the woodland habitat. Using the JNCC data (Williams,
2006) on the area of woodland in an ‘unfavourable recovering’ condition (which was used to represent the likely
loss in the quality of the native woodland BAP habitat), it is predicted that there would be a 16% decline in the area
of native woodland that achieves condition. Assuming a linear relationship between the quality of native woodlands
and the provision of wild food, it is predicted that there would be a 16% reduction in the availability of wild food
throughout the UK under the No further BAP funding scenario.
The approach was also used to estimate the predicted decrease in wild food in England, Scotland, Wales and Northern Ireland
(Table 49). Again, the England figure was used across all English regions. Table 49 below provides a summary of the data
used to define the ‘wild food’ attribute under the three BAP scenarios for the different regions.
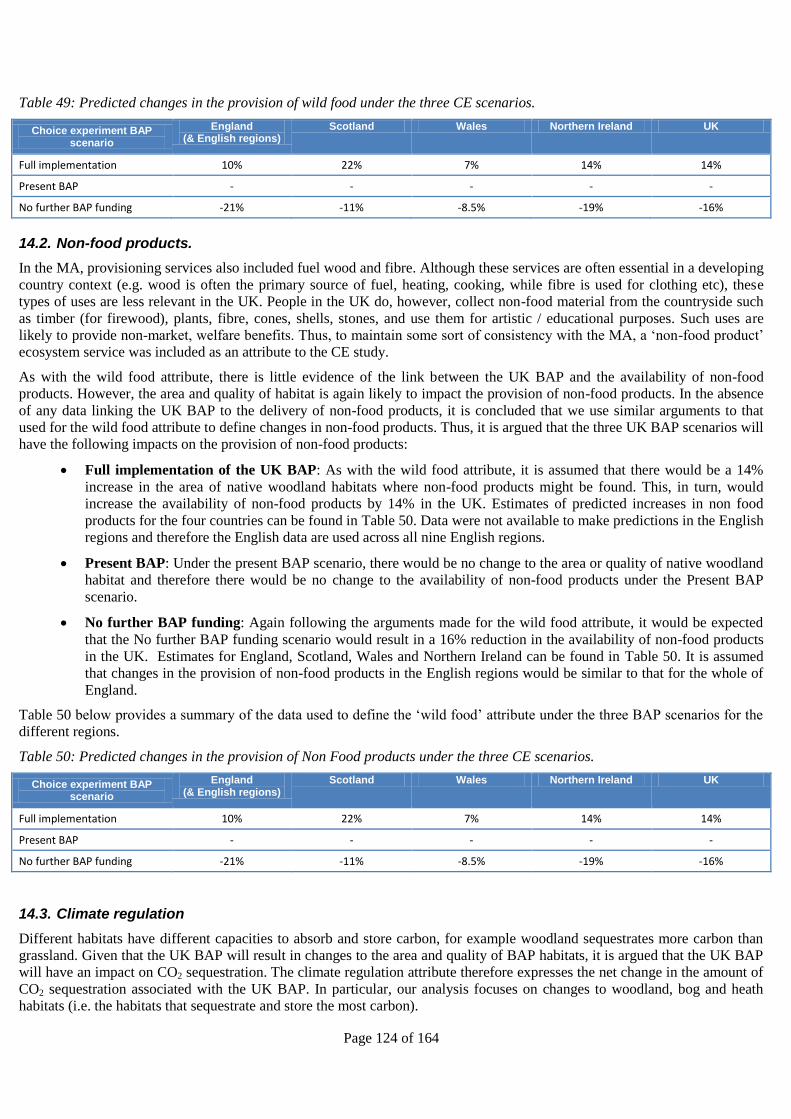
Page 124 of 164
Table 49: Predicted changes in the provision of wild food under the three CE scenarios.
Choice experiment BAP scenario
England (& English regions)
Scotland Wales Northern Ireland UK
Full implementation 10% 22% 7% 14% 14%
Present BAP - - - - -
No further BAP funding -21% -11% -8.5% -19% -16%
14.2. Non-food products.
In the MA, provisioning services also included fuel wood and fibre. Although these services are often essential in a developing
country context (e.g. wood is often the primary source of fuel, heating, cooking, while fibre is used for clothing etc), these
types of uses are less relevant in the UK. People in the UK do, however, collect non-food material from the countryside such
as timber (for firewood), plants, fibre, cones, shells, stones, and use them for artistic / educational purposes. Such uses are
likely to provide non-market, welfare benefits. Thus, to maintain some sort of consistency with the MA, a ‘non-food product’
ecosystem service was included as an attribute to the CE study.
As with the wild food attribute, there is little evidence of the link between the UK BAP and the availability of non-food
products. However, the area and quality of habitat is again likely to impact the provision of non-food products. In the absence
of any data linking the UK BAP to the delivery of non-food products, it is concluded that we use similar arguments to that
used for the wild food attribute to define changes in non-food products. Thus, it is argued that the three UK BAP scenarios will
have the following impacts on the provision of non-food products:
Full implementation of the UK BAP: As with the wild food attribute, it is assumed that there would be a 14%
increase in the area of native woodland habitats where non-food products might be found. This, in turn, would
increase the availability of non-food products by 14% in the UK. Estimates of predicted increases in non food
products for the four countries can be found in Table 50. Data were not available to make predictions in the English
regions and therefore the English data are used across all nine English regions.
Present BAP: Under the present BAP scenario, there would be no change to the area or quality of native woodland
habitat and therefore there would be no change to the availability of non-food products under the Present BAP
scenario.
No further BAP funding: Again following the arguments made for the wild food attribute, it would be expected
that the No further BAP funding scenario would result in a 16% reduction in the availability of non-food products
in the UK. Estimates for England, Scotland, Wales and Northern Ireland can be found in Table 50. It is assumed
that changes in the provision of non-food products in the English regions would be similar to that for the whole of
England.
Table 50 below provides a summary of the data used to define the ‘wild food’ attribute under the three BAP scenarios for the
different regions.
Table 50: Predicted changes in the provision of Non Food products under the three CE scenarios.
Choice experiment BAP scenario
England (& English regions)
Scotland Wales Northern Ireland UK
Full implementation 10% 22% 7% 14% 14%
Present BAP - - - - -
No further BAP funding -21% -11% -8.5% -19% -16%
14.3. Climate regulation
Different habitats have different capacities to absorb and store carbon, for example woodland sequestrates more carbon than
grassland. Given that the UK BAP will result in changes to the area and quality of BAP habitats, it is argued that the UK BAP
will have an impact on CO2 sequestration. The climate regulation attribute therefore expresses the net change in the amount of
CO2 sequestration associated with the UK BAP. In particular, our analysis focuses on changes to woodland, bog and heath
habitats (i.e. the habitats that sequestrate and store the most carbon).
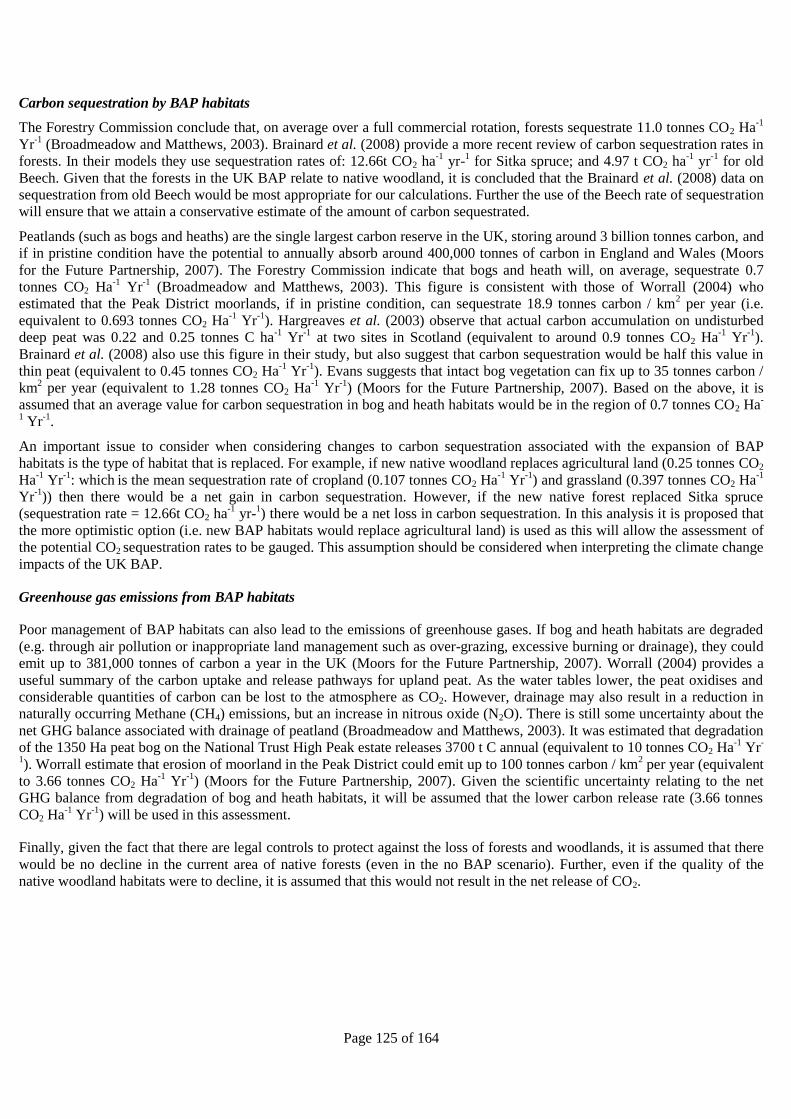
Page 125 of 164
Carbon sequestration by BAP habitats
The Forestry Commission conclude that, on average over a full commercial rotation, forests sequestrate 11.0 tonnes CO2 Ha-1
Yr-1
(Broadmeadow and Matthews, 2003). Brainard et al. (2008) provide a more recent review of carbon sequestration rates in
forests. In their models they use sequestration rates of: 12.66t CO2 ha-1
yr-1 for Sitka spruce; and 4.97 t CO2 ha
-1 yr
-1 for old
Beech. Given that the forests in the UK BAP relate to native woodland, it is concluded that the Brainard et al. (2008) data on
sequestration from old Beech would be most appropriate for our calculations. Further the use of the Beech rate of sequestration
will ensure that we attain a conservative estimate of the amount of carbon sequestrated.
Peatlands (such as bogs and heaths) are the single largest carbon reserve in the UK, storing around 3 billion tonnes carbon, and
if in pristine condition have the potential to annually absorb around 400,000 tonnes of carbon in England and Wales (Moors
for the Future Partnership, 2007). The Forestry Commission indicate that bogs and heath will, on average, sequestrate 0.7
tonnes CO2 Ha-1
Yr-1
(Broadmeadow and Matthews, 2003). This figure is consistent with those of Worrall (2004) who
estimated that the Peak District moorlands, if in pristine condition, can sequestrate 18.9 tonnes carbon / km2 per year (i.e.
equivalent to 0.693 tonnes CO2 Ha-1
Yr-1
). Hargreaves et al. (2003) observe that actual carbon accumulation on undisturbed
deep peat was 0.22 and 0.25 tonnes C ha-1
Yr-1
at two sites in Scotland (equivalent to around 0.9 tonnes CO2 Ha-1
Yr-1
).
Brainard et al. (2008) also use this figure in their study, but also suggest that carbon sequestration would be half this value in
thin peat (equivalent to 0.45 tonnes CO2 Ha-1
Yr-1
). Evans suggests that intact bog vegetation can fix up to 35 tonnes carbon /
km2 per year (equivalent to 1.28 tonnes CO2 Ha
-1 Yr
-1) (Moors for the Future Partnership, 2007). Based on the above, it is
assumed that an average value for carbon sequestration in bog and heath habitats would be in the region of 0.7 tonnes CO2 Ha-
1 Yr
-1.
An important issue to consider when considering changes to carbon sequestration associated with the expansion of BAP
habitats is the type of habitat that is replaced. For example, if new native woodland replaces agricultural land (0.25 tonnes CO2
Ha-1
Yr-1
: which is the mean sequestration rate of cropland (0.107 tonnes CO2 Ha
-1 Yr
-1) and grassland (0.397 tonnes CO2 Ha
-1
Yr-1
)) then there would be a net gain in carbon sequestration. However, if the new native forest replaced Sitka spruce
(sequestration rate = 12.66t CO2 ha-1
yr-1) there would be a net loss in carbon sequestration. In this analysis it is proposed that
the more optimistic option (i.e. new BAP habitats would replace agricultural land) is used as this will allow the assessment of
the potential CO2 sequestration rates to be gauged. This assumption should be considered when interpreting the climate change
impacts of the UK BAP.
Greenhouse gas emissions from BAP habitats
Poor management of BAP habitats can also lead to the emissions of greenhouse gases. If bog and heath habitats are degraded
(e.g. through air pollution or inappropriate land management such as over-grazing, excessive burning or drainage), they could
emit up to 381,000 tonnes of carbon a year in the UK (Moors for the Future Partnership, 2007). Worrall (2004) provides a
useful summary of the carbon uptake and release pathways for upland peat. As the water tables lower, the peat oxidises and
considerable quantities of carbon can be lost to the atmosphere as CO2. However, drainage may also result in a reduction in
naturally occurring Methane (CH4) emissions, but an increase in nitrous oxide (N2O). There is still some uncertainty about the
net GHG balance associated with drainage of peatland (Broadmeadow and Matthews, 2003). It was estimated that degradation
of the 1350 Ha peat bog on the National Trust High Peak estate releases 3700 t C annual (equivalent to 10 tonnes CO2 Ha-1
Yr-
1). Worrall estimate that erosion of moorland in the Peak District could emit up to 100 tonnes carbon / km
2 per year (equivalent
to 3.66 tonnes CO2 Ha-1
Yr-1
) (Moors for the Future Partnership, 2007). Given the scientific uncertainty relating to the net
GHG balance from degradation of bog and heath habitats, it will be assumed that the lower carbon release rate (3.66 tonnes
CO2 Ha-1
Yr-1
) will be used in this assessment.
Finally, given the fact that there are legal controls to protect against the loss of forests and woodlands, it is assumed that there
would be no decline in the current area of native forests (even in the no BAP scenario). Further, even if the quality of the
native woodland habitats were to decline, it is assumed that this would not result in the net release of CO2.
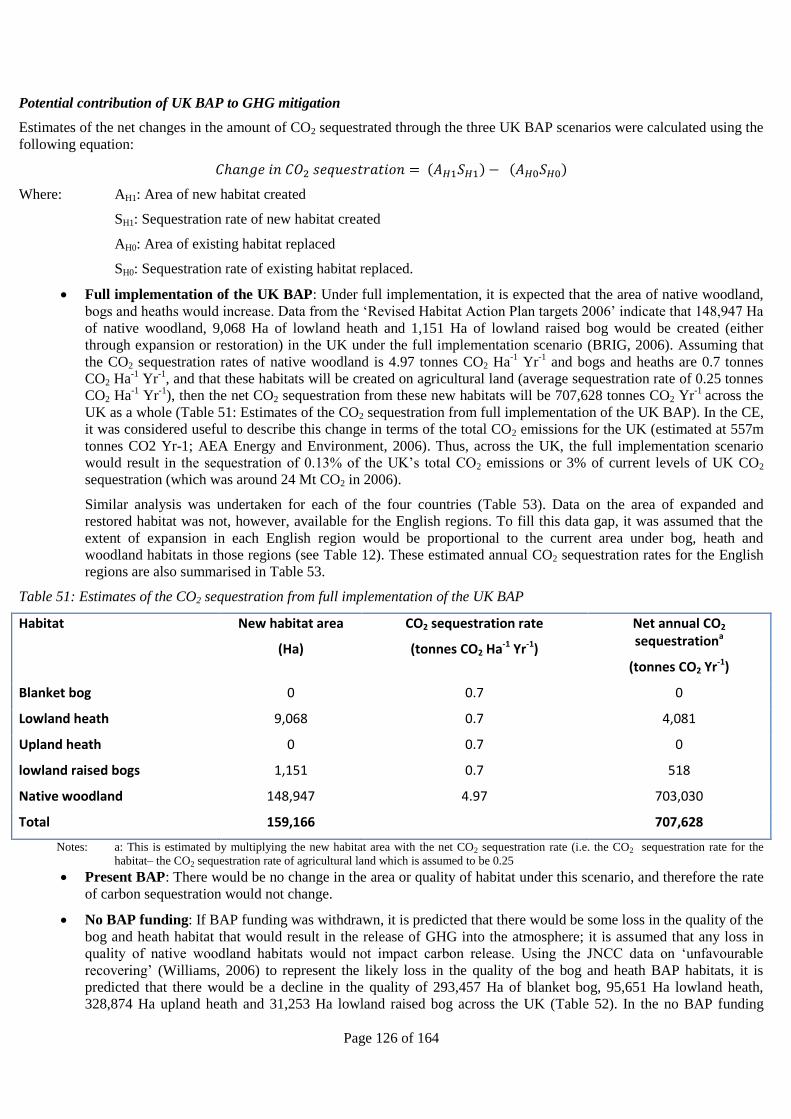
Page 126 of 164
Potential contribution of UK BAP to GHG mitigation
Estimates of the net changes in the amount of CO2 sequestrated through the three UK BAP scenarios were calculated using the
following equation:
Where: AH1: Area of new habitat created
SH1: Sequestration rate of new habitat created
AH0: Area of existing habitat replaced
SH0: Sequestration rate of existing habitat replaced.
Full implementation of the UK BAP: Under full implementation, it is expected that the area of native woodland,
bogs and heaths would increase. Data from the ‘Revised Habitat Action Plan targets 2006’ indicate that 148,947 Ha
of native woodland, 9,068 Ha of lowland heath and 1,151 Ha of lowland raised bog would be created (either
through expansion or restoration) in the UK under the full implementation scenario (BRIG, 2006). Assuming that
the CO2 sequestration rates of native woodland is 4.97 tonnes CO2 Ha-1
Yr-1
and bogs and heaths are 0.7 tonnes
CO2 Ha-1
Yr-1
, and that these habitats will be created on agricultural land (average sequestration rate of 0.25 tonnes
CO2 Ha-1
Yr-1
), then the net CO2 sequestration from these new habitats will be 707,628 tonnes CO2 Yr-1
across the
UK as a whole (Table 51: Estimates of the CO2 sequestration from full implementation of the UK BAP). In the CE,
it was considered useful to describe this change in terms of the total CO2 emissions for the UK (estimated at 557m
tonnes CO2 Yr-1; AEA Energy and Environment, 2006). Thus, across the UK, the full implementation scenario
would result in the sequestration of 0.13% of the UK’s total CO2 emissions or 3% of current levels of UK CO2
sequestration (which was around 24 Mt CO2 in 2006).
Similar analysis was undertaken for each of the four countries (Table 53). Data on the area of expanded and
restored habitat was not, however, available for the English regions. To fill this data gap, it was assumed that the
extent of expansion in each English region would be proportional to the current area under bog, heath and
woodland habitats in those regions (see Table 12). These estimated annual CO2 sequestration rates for the English
regions are also summarised in Table 53.
Table 51: Estimates of the CO2 sequestration from full implementation of the UK BAP
Habitat New habitat area
(Ha)
CO2 sequestration rate
(tonnes CO2 Ha-1 Yr-1)
Net annual CO2 sequestrationa
(tonnes CO2 Yr-1)
Blanket bog 0 0.7 0
Lowland heath 9,068 0.7 4,081
Upland heath 0 0.7 0
lowland raised bogs 1,151 0.7 518
Native woodland 148,947 4.97 703,030
Total 159,166 707,628
Notes: a: This is estimated by multiplying the new habitat area with the net CO2 sequestration rate (i.e. the CO2 sequestration rate for the
habitat– the CO2 sequestration rate of agricultural land which is assumed to be 0.25
Present BAP: There would be no change in the area or quality of habitat under this scenario, and therefore the rate
of carbon sequestration would not change.
No BAP funding: If BAP funding was withdrawn, it is predicted that there would be some loss in the quality of the
bog and heath habitat that would result in the release of GHG into the atmosphere; it is assumed that any loss in
quality of native woodland habitats would not impact carbon release. Using the JNCC data on ‘unfavourable
recovering’ (Williams, 2006) to represent the likely loss in the quality of the bog and heath BAP habitats, it is
predicted that there would be a decline in the quality of 293,457 Ha of blanket bog, 95,651 Ha lowland heath,
328,874 Ha upland heath and 31,253 Ha lowland raised bog across the UK (Table 52). In the no BAP funding
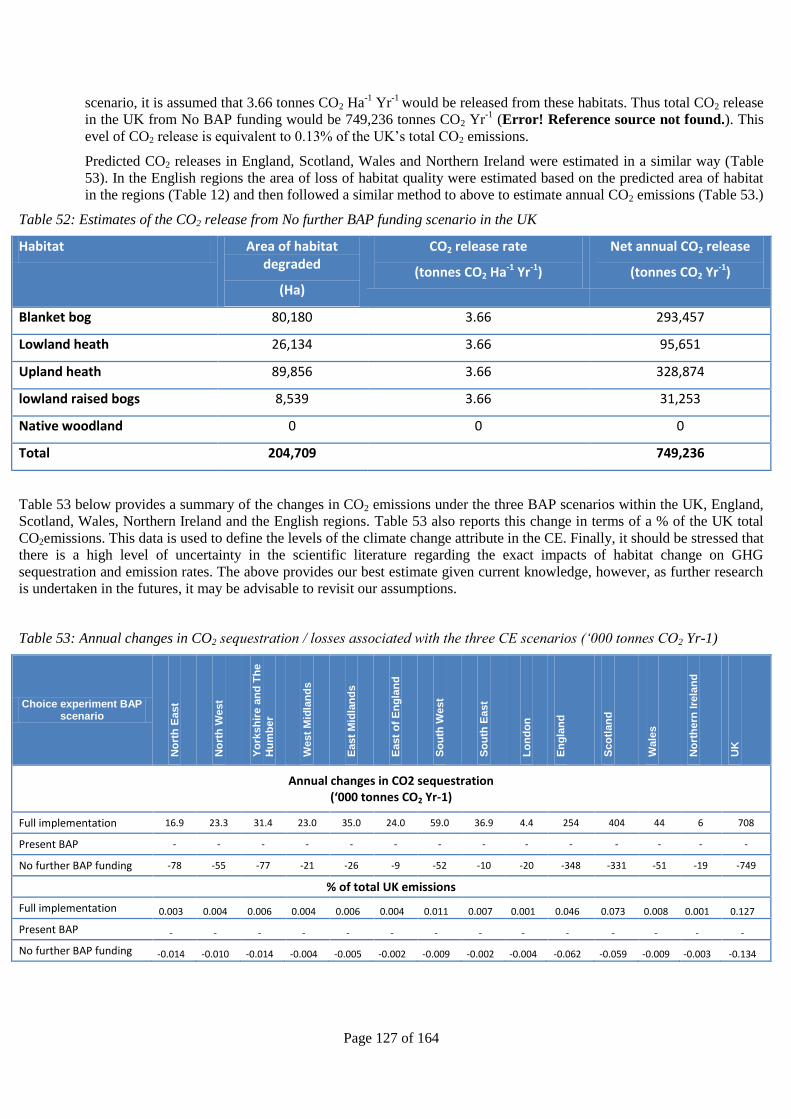
Page 127 of 164
scenario, it is assumed that 3.66 tonnes CO2 Ha-1
Yr-1
would be released from these habitats. Thus total CO2 release
in the UK from No BAP funding would be 749,236 tonnes CO2 Yr-1
(Error! Reference source not found.). This
evel of CO2 release is equivalent to 0.13% of the UK’s total CO2 emissions.
Predicted CO2 releases in England, Scotland, Wales and Northern Ireland were estimated in a similar way (Table
53). In the English regions the area of loss of habitat quality were estimated based on the predicted area of habitat
in the regions (Table 12) and then followed a similar method to above to estimate annual CO2 emissions (Table 53.)
Table 52: Estimates of the CO2 release from No further BAP funding scenario in the UK
Habitat Area of habitat degraded
(Ha)
CO2 release rate
(tonnes CO2 Ha-1 Yr-1)
Net annual CO2 release
(tonnes CO2 Yr-1)
Blanket bog 80,180 3.66 293,457
Lowland heath 26,134 3.66 95,651
Upland heath 89,856 3.66 328,874
lowland raised bogs 8,539 3.66 31,253
Native woodland 0 0 0
Total 204,709 749,236
Table 53 below provides a summary of the changes in CO2 emissions under the three BAP scenarios within the UK, England,
Scotland, Wales, Northern Ireland and the English regions. Table 53 also reports this change in terms of a % of the UK total
CO2emissions. This data is used to define the levels of the climate change attribute in the CE. Finally, it should be stressed that
there is a high level of uncertainty in the scientific literature regarding the exact impacts of habitat change on GHG
sequestration and emission rates. The above provides our best estimate given current knowledge, however, as further research
is undertaken in the futures, it may be advisable to revisit our assumptions.
Table 53: Annual changes in CO2 sequestration / losses associated with the three CE scenarios (‘000 tonnes CO2 Yr-1)
Choice experiment BAP scenario
No
rth
East
No
rth
West
Yo
rksh
ire a
nd
Th
e
Hu
mb
er
West
Mid
lan
ds
East
Mid
lan
ds
East
of
En
gla
nd
So
uth
West
So
uth
East
Lo
nd
on
En
gla
nd
Sco
tlan
d
Wale
s
No
rth
ern
Ire
lan
d
UK
Annual changes in CO2 sequestration (‘000 tonnes CO2 Yr-1)
Full implementation 16.9 23.3 31.4 23.0 35.0 24.0 59.0 36.9 4.4 254 404 44 6 708
Present BAP - - - - - - - - - - - - - -
No further BAP funding -78 -55 -77 -21 -26 -9 -52 -10 -20 -348 -331 -51 -19 -749
% of total UK emissions
Full implementation 0.003 0.004 0.006 0.004 0.006 0.004 0.011 0.007 0.001 0.046 0.073 0.008 0.001 0.127
Present BAP - - - - - - - - - - - - - -
No further BAP funding -0.014 -0.010 -0.014 -0.004 -0.005 -0.002 -0.009 -0.002 -0.004 -0.062 -0.059 -0.009 -0.003 -0.134
Page 128 of 164
14.4. Water regulation
Nearly 2 million properties in floodplains along rivers, estuaries and coasts in the UK are at risk of flooding. Further, it is
predicted that these risks are set to increase over the next hundred years due to changes in the climate and in society (Evans et
al., 2004a; Evans et al., 2004b).
Many of the UK BAP habitats have an important role to play in terms of reducing flood risk. For example, the water and
wetland habitats such as coastal and flood plain grazing marsh, fens, lowland raised bogs, and wet reedbeds, provide important
water regulating services including water retention and management of the water infiltration into the catchment (Watkinson,
2003). The ‘water regulation’ attribute aims to capture the potential contribution of BAP habitats to flood risk management.
The most comprehensive data on flood risks in the UK is the Foresight report (Evans et al., 2004a; Evans et al., 2004b; Sayers
et al., 2003). The Foresight data measures the risk and effect of flooding across the UK. In particular, the Foresight report
examines flood risk in terms of the Environment Agency’s Indicative Flood Plains (IFP), which are defined as coastal areas
that have at least a 1:200 year risk of flooding and fluvial areas with a 1:100 risk (ibid.). The Foresight report also provides
regional estimates of the number of people currently living within an IFP area (See Table 3.3 in Sayers et al., 2003)9. A
summary of this data, along with an estimate of the proportion of people from a region living within an IFP area are reported
in Table 54.
The Foresight report also provides data on the potential contribution that different management options have for alleviating
flood risk. Of interest to this research is the ‘Rural Land-use Management’ option, which is defined as ‘Pressures on
agricultural land and changes in farming practices will have implications on runoff. Changes to management policy may affect
the amount and distribution of flood plain storage areas.’ (Sayers et al., 2003). It is argued that the UK BAP would contribute
to these Rural Land-use Management activities. Sayers et al. predict that the implementation of these options could potentially
change the ‘state of protection’ from flooding by 6% in 2050 and 10% in 2080 (See Table 3.2e in Sayers et al., 2003). This
suggests that the average annual change in flood protection from ‘Rural Land-use management’ activities is in the region of
0.135% (estimated from the mean of 6% over 50 years and 10% over 80 years). Given that the UK BAP scenarios for this
research cover a 10 year period, then it is predicted that Rural Land-use Management under the UK BAP has the potential to
change this risk of flooding by 1.35%. Thus, in the Full implementation scenario it is assumed that the enhanced rural land-use
management activities undertaken through BAP would result in a 1.35% reduction in flood risk, while in the No further BAP
funding scenario, it is assumed that the removal of rural land-use management activities would result in a 1.35% increase in
the risk of flooding. In the Present BAP scenario, it is assumed that there would be no change in the risk of flooding.
Discussions with members of the public in focus groups indicated that they considered a % change in the risk of flooding
confusing to interpret. Following further enquiry, it was concluded that the water regulation attribute in the CE should be
represented by the following indices:
Respondents generally preferred the risk of flooding to be reported in terms of a flood risk ratio (1 : X) , i.e. a flood
event would occur, on average, once every X years in the IFP areas. Data on current flood risk was sourced from
Table 3.2 of the Foresight report (Sayers et al., 2003) and converted to a 1:X ratio. For example, the Foresight
report states that the North East England region has an expected annual probability of flooding of 0.02. This
converts to a 1: 50 ratio, i.e. it is predicted that there would be a flood every 50 years within IFP areas. Current
flood risk ratio data for all regions are reported in Table 54 below under the Present BAP scenario. The change in
flood risk associated with the Full implementation and No further BAP funding scenarios were estimated
respectively by subtracting or adding 1.35% to this risk ratio.
Focus group participants also indicated that they would find it useful if information was presented in terms of the
number and percentage of people within a region currently at risk from flooding. Regional data on current number
of people living within a IFP was sourced from the Foresight report (Sayers et al., 2003) for England and Wales,
the Scottish Government (2008) for Scotland and the Rivers Agency (Sayers and Calvert, 2007) in Northern Ireland
(Table 54). This data was then divided by the population of the region to estimate the percentage of people within
each region current at risk from flooding (Table 54).
9 Note that the regional areas used Sayers (2003) do not always directly respond to those used in this research. In particular their ‘North
East region’ includes both our North East and Yorkshire and the Humber regions. They also only have one region for the Midlands,
whereas we have West Midlands and East Midlands. Finally, we have assumed that their Thames region relates to our London region. We
have used census population data to adjust the data to our region.
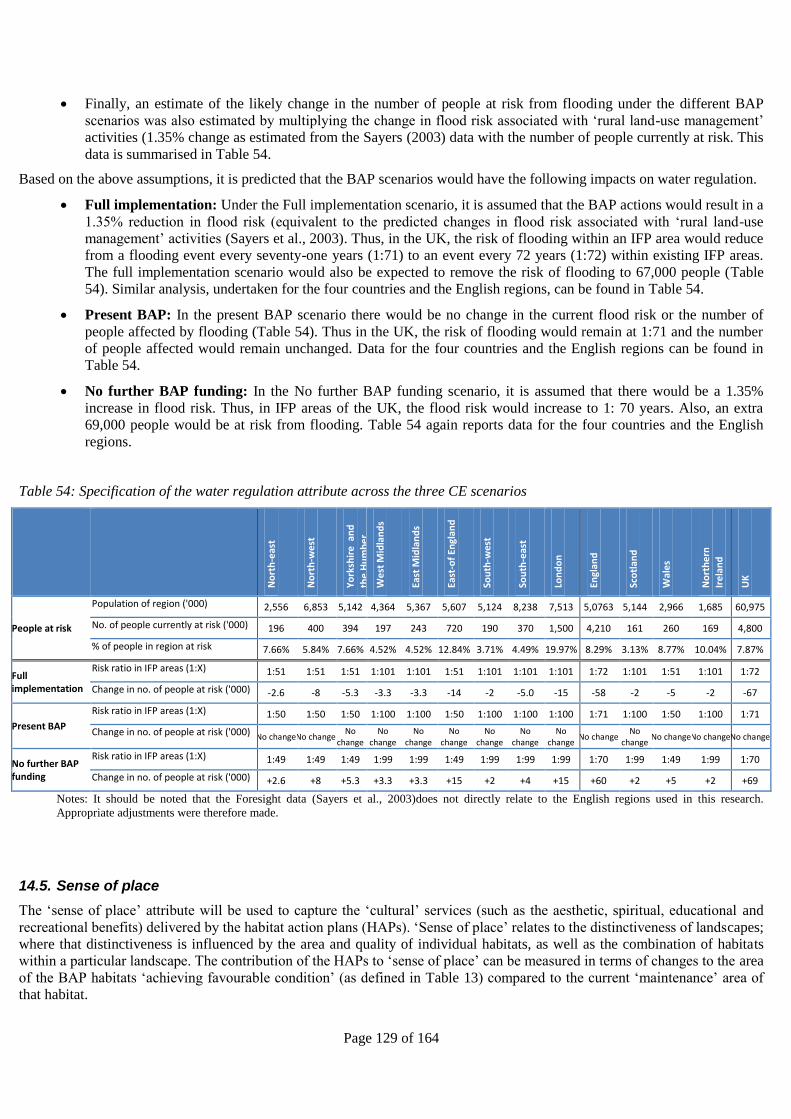
Page 129 of 164
Finally, an estimate of the likely change in the number of people at risk from flooding under the different BAP
scenarios was also estimated by multiplying the change in flood risk associated with ‘rural land-use management’
activities (1.35% change as estimated from the Sayers (2003) data with the number of people currently at risk. This
data is summarised in Table 54.
Based on the above assumptions, it is predicted that the BAP scenarios would have the following impacts on water regulation.
Full implementation: Under the Full implementation scenario, it is assumed that the BAP actions would result in a
1.35% reduction in flood risk (equivalent to the predicted changes in flood risk associated with ‘rural land-use
management’ activities (Sayers et al., 2003). Thus, in the UK, the risk of flooding within an IFP area would reduce
from a flooding event every seventy-one years (1:71) to an event every 72 years (1:72) within existing IFP areas.
The full implementation scenario would also be expected to remove the risk of flooding to 67,000 people (Table
54). Similar analysis, undertaken for the four countries and the English regions, can be found in Table 54.
Present BAP: In the present BAP scenario there would be no change in the current flood risk or the number of
people affected by flooding (Table 54). Thus in the UK, the risk of flooding would remain at 1:71 and the number
of people affected would remain unchanged. Data for the four countries and the English regions can be found in
Table 54.
No further BAP funding: In the No further BAP funding scenario, it is assumed that there would be a 1.35%
increase in flood risk. Thus, in IFP areas of the UK, the flood risk would increase to 1: 70 years. Also, an extra
69,000 people would be at risk from flooding. Table 54 again reports data for the four countries and the English
regions.
Table 54: Specification of the water regulation attribute across the three CE scenarios
No
rth
-eas
t
No
rth
-we
st
Yo
rksh
ire
an
d
the
Hu
mb
er
We
st M
idla
nd
s
East
Mid
lan
ds
East
-of
Engl
and
Sou
th-w
est
Sou
th-e
ast
Lon
do
n
Engl
and
Sco
tlan
d
Wal
es
No
rth
ern
Ire
lan
d
UK
People at risk
Population of region ('000) 2,556 6,853 5,142 4,364 5,367 5,607 5,124 8,238 7,513 5,0763 5,144 2,966 1,685 60,975
No. of people currently at risk ('000) 196 400 394 197 243 720 190 370 1,500 4,210 161 260 169 4,800
% of people in region at risk 7.66% 5.84% 7.66% 4.52% 4.52% 12.84% 3.71% 4.49% 19.97% 8.29% 3.13% 8.77% 10.04% 7.87%
Full implementation
Risk ratio in IFP areas (1:X) 1:51 1:51 1:51 1:101 1:101 1:51 1:101 1:101 1:101 1:72 1:101 1:51 1:101 1:72
Change in no. of people at risk ('000) -2.6 -8 -5.3 -3.3 -3.3 -14 -2 -5.0 -15 -58 -2 -5 -2 -67
Present BAP
Risk ratio in IFP areas (1:X) 1:50 1:50 1:50 1:100 1:100 1:50 1:100 1:100 1:100 1:71 1:100 1:50 1:100 1:71
Change in no. of people at risk ('000) No change No change No
change No
change No
change No
change No
change No
change No
change No change
No change
No change No change No change
No further BAP funding
Risk ratio in IFP areas (1:X) 1:49 1:49 1:49 1:99 1:99 1:49 1:99 1:99 1:99 1:70 1:99 1:49 1:99 1:70
Change in no. of people at risk ('000) +2.6 +8 +5.3 +3.3 +3.3 +15 +2 +4 +15 +60 +2 +5 +2 +69
Notes: It should be noted that the Foresight data (Sayers et al., 2003)does not directly relate to the English regions used in this research.
Appropriate adjustments were therefore made.
14.5. Sense of place
The ‘sense of place’ attribute will be used to capture the ‘cultural’ services (such as the aesthetic, spiritual, educational and
recreational benefits) delivered by the habitat action plans (HAPs). ‘Sense of place’ relates to the distinctiveness of landscapes;
where that distinctiveness is influenced by the area and quality of individual habitats, as well as the combination of habitats
within a particular landscape. The contribution of the HAPs to ‘sense of place’ can be measured in terms of changes to the area
of the BAP habitats ‘achieving favourable condition’ (as defined in Table 13) compared to the current ‘maintenance’ area of
that habitat.
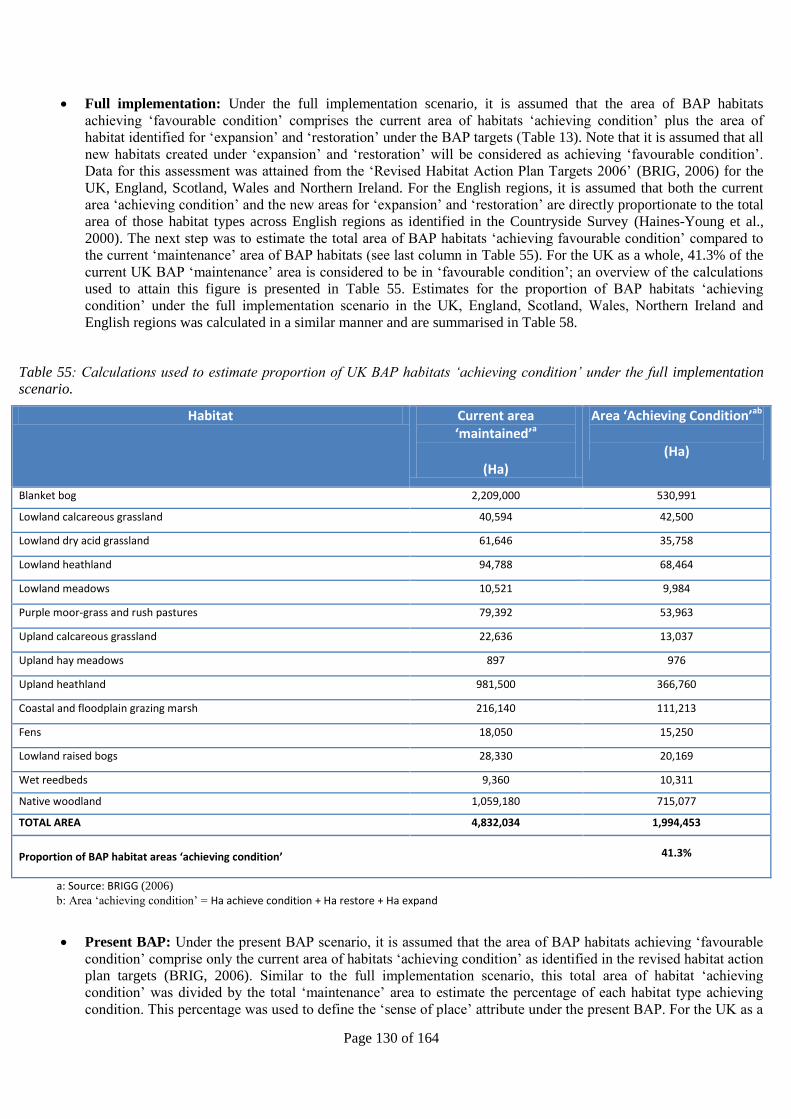
Page 130 of 164
Full implementation: Under the full implementation scenario, it is assumed that the area of BAP habitats
achieving ‘favourable condition’ comprises the current area of habitats ‘achieving condition’ plus the area of
habitat identified for ‘expansion’ and ‘restoration’ under the BAP targets (Table 13). Note that it is assumed that all
new habitats created under ‘expansion’ and ‘restoration’ will be considered as achieving ‘favourable condition’.
Data for this assessment was attained from the ‘Revised Habitat Action Plan Targets 2006’ (BRIG, 2006) for the
UK, England, Scotland, Wales and Northern Ireland. For the English regions, it is assumed that both the current
area ‘achieving condition’ and the new areas for ‘expansion’ and ‘restoration’ are directly proportionate to the total
area of those habitat types across English regions as identified in the Countryside Survey (Haines-Young et al.,
2000). The next step was to estimate the total area of BAP habitats ‘achieving favourable condition’ compared to
the current ‘maintenance’ area of BAP habitats (see last column in Table 55). For the UK as a whole, 41.3% of the
current UK BAP ‘maintenance’ area is considered to be in ‘favourable condition’; an overview of the calculations
used to attain this figure is presented in Table 55. Estimates for the proportion of BAP habitats ‘achieving
condition’ under the full implementation scenario in the UK, England, Scotland, Wales, Northern Ireland and
English regions was calculated in a similar manner and are summarised in Table 58.
Table 55: Calculations used to estimate proportion of UK BAP habitats ‘achieving condition’ under the full implementation
scenario.
Habitat Current area ‘maintained’a
(Ha)
Area ‘Achieving Condition’ab
(Ha)
Blanket bog 2,209,000 530,991
Lowland calcareous grassland 40,594 42,500
Lowland dry acid grassland 61,646 35,758
Lowland heathland 94,788 68,464
Lowland meadows 10,521 9,984
Purple moor-grass and rush pastures 79,392 53,963
Upland calcareous grassland 22,636 13,037
Upland hay meadows 897 976
Upland heathland 981,500 366,760
Coastal and floodplain grazing marsh 216,140 111,213
Fens 18,050 15,250
Lowland raised bogs 28,330 20,169
Wet reedbeds 9,360 10,311
Native woodland 1,059,180 715,077
TOTAL AREA 4,832,034 1,994,453
Proportion of BAP habitat areas ‘achieving condition’
41.3%
a: Source: BRIGG (2006)
b: Area ‘achieving condition’ = Ha achieve condition + Ha restore + Ha expand
Present BAP: Under the present BAP scenario, it is assumed that the area of BAP habitats achieving ‘favourable
condition’ comprise only the current area of habitats ‘achieving condition’ as identified in the revised habitat action
plan targets (BRIG, 2006). Similar to the full implementation scenario, this total area of habitat ‘achieving
condition’ was divided by the total ‘maintenance’ area to estimate the percentage of each habitat type achieving
condition. This percentage was used to define the ‘sense of place’ attribute under the present BAP. For the UK as a
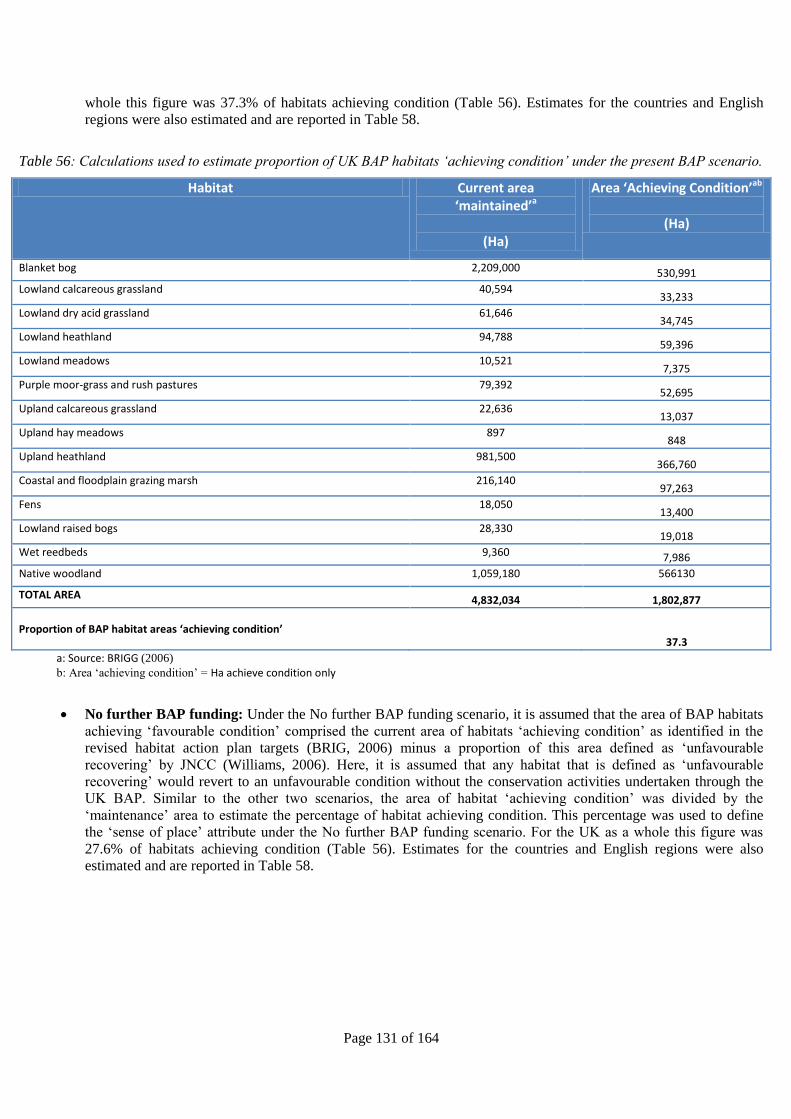
Page 131 of 164
whole this figure was 37.3% of habitats achieving condition (Table 56). Estimates for the countries and English
regions were also estimated and are reported in Table 58.
Table 56: Calculations used to estimate proportion of UK BAP habitats ‘achieving condition’ under the present BAP scenario.
Habitat Current area ‘maintained’a
(Ha)
Area ‘Achieving Condition’ab
(Ha)
Blanket bog 2,209,000 530,991
Lowland calcareous grassland 40,594 33,233
Lowland dry acid grassland 61,646 34,745
Lowland heathland 94,788 59,396
Lowland meadows 10,521 7,375
Purple moor-grass and rush pastures 79,392 52,695
Upland calcareous grassland 22,636 13,037
Upland hay meadows 897 848
Upland heathland 981,500 366,760
Coastal and floodplain grazing marsh 216,140 97,263
Fens 18,050 13,400
Lowland raised bogs 28,330 19,018
Wet reedbeds 9,360 7,986
Native woodland 1,059,180 566130
TOTAL AREA 4,832,034 1,802,877
Proportion of BAP habitat areas ‘achieving condition’
37.3
a: Source: BRIGG (2006)
b: Area ‘achieving condition’ = Ha achieve condition only
No further BAP funding: Under the No further BAP funding scenario, it is assumed that the area of BAP habitats
achieving ‘favourable condition’ comprised the current area of habitats ‘achieving condition’ as identified in the
revised habitat action plan targets (BRIG, 2006) minus a proportion of this area defined as ‘unfavourable
recovering’ by JNCC (Williams, 2006). Here, it is assumed that any habitat that is defined as ‘unfavourable
recovering’ would revert to an unfavourable condition without the conservation activities undertaken through the
UK BAP. Similar to the other two scenarios, the area of habitat ‘achieving condition’ was divided by the
‘maintenance’ area to estimate the percentage of habitat achieving condition. This percentage was used to define
the ‘sense of place’ attribute under the No further BAP funding scenario. For the UK as a whole this figure was
27.6% of habitats achieving condition (Table 56). Estimates for the countries and English regions were also
estimated and are reported in Table 58.
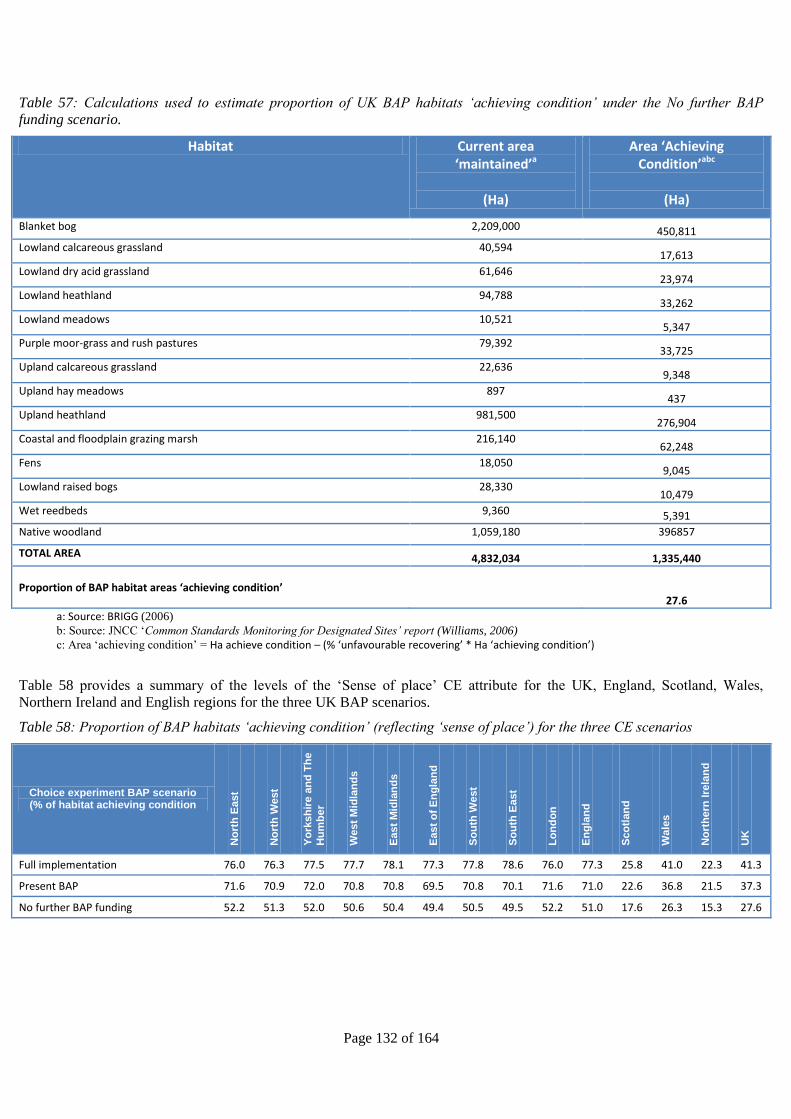
Page 132 of 164
Table 57: Calculations used to estimate proportion of UK BAP habitats ‘achieving condition’ under the No further BAP
funding scenario.
Habitat Current area ‘maintained’a
(Ha)
Area ‘Achieving Condition’abc
(Ha)
Blanket bog 2,209,000 450,811
Lowland calcareous grassland 40,594 17,613
Lowland dry acid grassland 61,646 23,974
Lowland heathland 94,788 33,262
Lowland meadows 10,521 5,347
Purple moor-grass and rush pastures 79,392 33,725
Upland calcareous grassland 22,636 9,348
Upland hay meadows 897 437
Upland heathland 981,500 276,904
Coastal and floodplain grazing marsh 216,140 62,248
Fens 18,050 9,045
Lowland raised bogs 28,330 10,479
Wet reedbeds 9,360 5,391
Native woodland 1,059,180 396857
TOTAL AREA 4,832,034 1,335,440
Proportion of BAP habitat areas ‘achieving condition’ 27.6
a: Source: BRIGG (2006)
b: Source: JNCC ‘Common Standards Monitoring for Designated Sites’ report (Williams, 2006)
c: Area ‘achieving condition’ = Ha achieve condition – (% ‘unfavourable recovering’ * Ha ‘achieving condition’)
Table 58 provides a summary of the levels of the ‘Sense of place’ CE attribute for the UK, England, Scotland, Wales,
Northern Ireland and English regions for the three UK BAP scenarios.
Table 58: Proportion of BAP habitats ‘achieving condition’ (reflecting ‘sense of place’) for the three CE scenarios
Choice experiment BAP scenario (% of habitat achieving condition
No
rth
East
No
rth
West
Yo
rksh
ire a
nd
Th
e
Hu
mb
er
West
Mid
lan
ds
East
Mid
lan
ds
East
of
En
gla
nd
So
uth
West
So
uth
East
Lo
nd
on
En
gla
nd
Sco
tlan
d
Wale
s
No
rth
ern
Ire
lan
d
UK
Full implementation 76.0 76.3 77.5 77.7 78.1 77.3 77.8 78.6 76.0 77.3 25.8 41.0 22.3 41.3
Present BAP 71.6 70.9 72.0 70.8 70.8 69.5 70.8 70.1 71.6 71.0 22.6 36.8 21.5 37.3
No further BAP funding 52.2 51.3 52.0 50.6 50.4 49.4 50.5 49.5 52.2 51.0 17.6 26.3 15.3 27.6
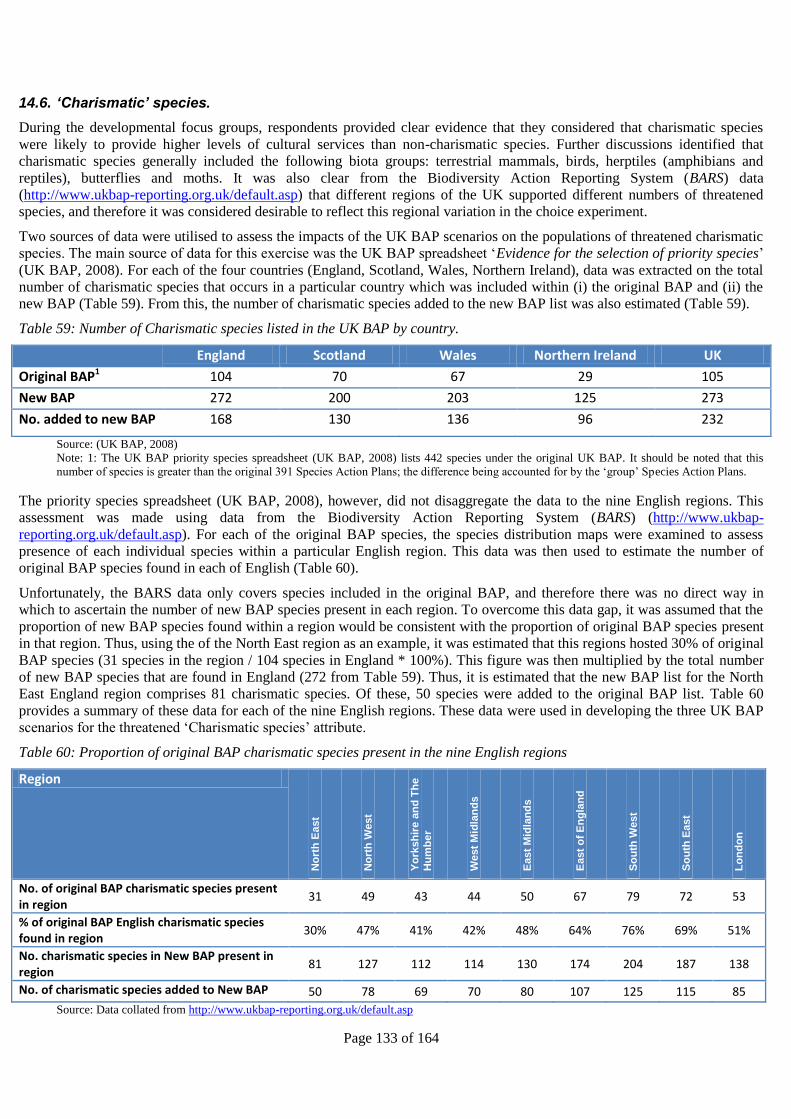
Page 133 of 164
14.6. ‘Charismatic’ species.
During the developmental focus groups, respondents provided clear evidence that they considered that charismatic species
were likely to provide higher levels of cultural services than non-charismatic species. Further discussions identified that
charismatic species generally included the following biota groups: terrestrial mammals, birds, herptiles (amphibians and
reptiles), butterflies and moths. It was also clear from the Biodiversity Action Reporting System (BARS) data
(http://www.ukbap-reporting.org.uk/default.asp) that different regions of the UK supported different numbers of threatened
species, and therefore it was considered desirable to reflect this regional variation in the choice experiment.
Two sources of data were utilised to assess the impacts of the UK BAP scenarios on the populations of threatened charismatic
species. The main source of data for this exercise was the UK BAP spreadsheet ‘Evidence for the selection of priority species’
(UK BAP, 2008). For each of the four countries (England, Scotland, Wales, Northern Ireland), data was extracted on the total
number of charismatic species that occurs in a particular country which was included within (i) the original BAP and (ii) the
new BAP (Table 59). From this, the number of charismatic species added to the new BAP list was also estimated (Table 59).
Table 59: Number of Charismatic species listed in the UK BAP by country.
England Scotland Wales Northern Ireland UK
Original BAP1 104 70 67 29 105
New BAP 272 200 203 125 273
No. added to new BAP 168 130 136 96 232
Source: (UK BAP, 2008)
Note: 1: The UK BAP priority species spreadsheet (UK BAP, 2008) lists 442 species under the original UK BAP. It should be noted that this
number of species is greater than the original 391 Species Action Plans; the difference being accounted for by the ‘group’ Species Action Plans.
The priority species spreadsheet (UK BAP, 2008), however, did not disaggregate the data to the nine English regions. This
assessment was made using data from the Biodiversity Action Reporting System (BARS) (http://www.ukbap-
reporting.org.uk/default.asp). For each of the original BAP species, the species distribution maps were examined to assess
presence of each individual species within a particular English region. This data was then used to estimate the number of
original BAP species found in each of English (Table 60).
Unfortunately, the BARS data only covers species included in the original BAP, and therefore there was no direct way in
which to ascertain the number of new BAP species present in each region. To overcome this data gap, it was assumed that the
proportion of new BAP species found within a region would be consistent with the proportion of original BAP species present
in that region. Thus, using the of the North East region as an example, it was estimated that this regions hosted 30% of original
BAP species (31 species in the region / 104 species in England * 100%). This figure was then multiplied by the total number
of new BAP species that are found in England (272 from Table 59). Thus, it is estimated that the new BAP list for the North
East England region comprises 81 charismatic species. Of these, 50 species were added to the original BAP list. Table 60
provides a summary of these data for each of the nine English regions. These data were used in developing the three UK BAP
scenarios for the threatened ‘Charismatic species’ attribute.
Table 60: Proportion of original BAP charismatic species present in the nine English regions
Region
No
rth
East
No
rth
West
Yo
rksh
ire a
nd
Th
e
Hu
mb
er
West
Mid
lan
ds
East
Mid
lan
ds
East
of
En
gla
nd
So
uth
West
So
uth
East
Lo
nd
on
No. of original BAP charismatic species present in region
31 49 43 44 50 67 79 72 53
% of original BAP English charismatic species found in region
30% 47% 41% 42% 48% 64% 76% 69% 51%
No. charismatic species in New BAP present in region
81 127 112 114 130 174 204 187 138
No. of charismatic species added to New BAP 50 78 69 70 80 107 125 115 85
Source: Data collated from http://www.ukbap-reporting.org.uk/default.asp
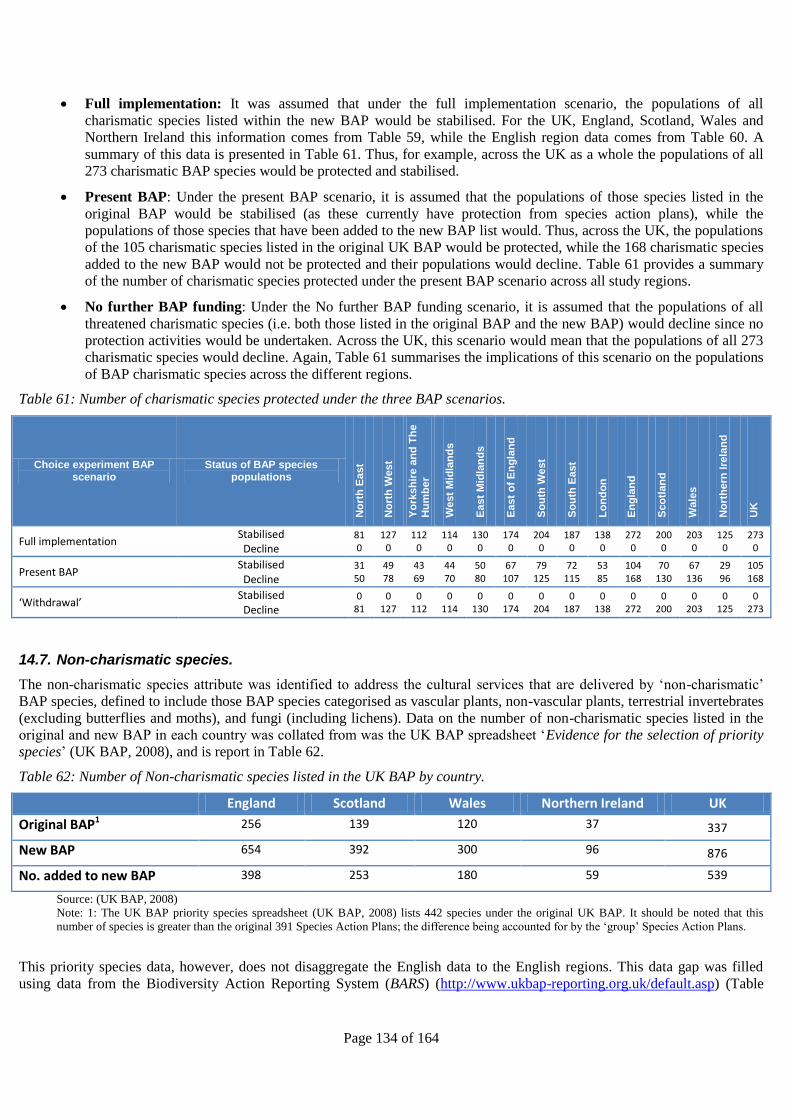
Page 134 of 164
Full implementation: It was assumed that under the full implementation scenario, the populations of all
charismatic species listed within the new BAP would be stabilised. For the UK, England, Scotland, Wales and
Northern Ireland this information comes from Table 59, while the English region data comes from Table 60. A
summary of this data is presented in Table 61. Thus, for example, across the UK as a whole the populations of all
273 charismatic BAP species would be protected and stabilised.
Present BAP: Under the present BAP scenario, it is assumed that the populations of those species listed in the
original BAP would be stabilised (as these currently have protection from species action plans), while the
populations of those species that have been added to the new BAP list would. Thus, across the UK, the populations
of the 105 charismatic species listed in the original UK BAP would be protected, while the 168 charismatic species
added to the new BAP would not be protected and their populations would decline. Table 61 provides a summary
of the number of charismatic species protected under the present BAP scenario across all study regions.
No further BAP funding: Under the No further BAP funding scenario, it is assumed that the populations of all
threatened charismatic species (i.e. both those listed in the original BAP and the new BAP) would decline since no
protection activities would be undertaken. Across the UK, this scenario would mean that the populations of all 273
charismatic species would decline. Again, Table 61 summarises the implications of this scenario on the populations
of BAP charismatic species across the different regions.
Table 61: Number of charismatic species protected under the three BAP scenarios.
Choice experiment BAP scenario
Status of BAP species populations
No
rth
East
No
rth
West
Yo
rksh
ire a
nd
Th
e
Hu
mb
er
West
Mid
lan
ds
East
Mid
lan
ds
East
of
En
gla
nd
So
uth
West
So
uth
East
Lo
nd
on
En
gla
nd
Sco
tlan
d
Wale
s
No
rth
ern
Ire
lan
d
UK
Full implementation Stabilised
Decline 81 0
127 0
112 0
114 0
130 0
174 0
204 0
187 0
138 0
272 0
200 0
203 0
125 0
273 0
Present BAP Stabilised
Decline 31 50
49 78
43 69
44 70
50 80
67 107
79 125
72 115
53 85
104 168
70 130
67 136
29 96
105 168
‘Withdrawal’ Stabilised
Decline 0
81 0
127 0
112 0
114 0
130 0
174 0
204 0
187 0
138 0
272 0
200 0
203 0
125 0
273
14.7. Non-charismatic species.
The non-charismatic species attribute was identified to address the cultural services that are delivered by ‘non-charismatic’
BAP species, defined to include those BAP species categorised as vascular plants, non-vascular plants, terrestrial invertebrates
(excluding butterflies and moths), and fungi (including lichens). Data on the number of non-charismatic species listed in the
original and new BAP in each country was collated from was the UK BAP spreadsheet ‘Evidence for the selection of priority
species’ (UK BAP, 2008), and is report in Table 62.
Table 62: Number of Non-charismatic species listed in the UK BAP by country.
England Scotland Wales Northern Ireland UK
Original BAP1 256 139 120 37 337
New BAP 654 392 300 96 876
No. added to new BAP 398 253 180 59 539
Source: (UK BAP, 2008)
Note: 1: The UK BAP priority species spreadsheet (UK BAP, 2008) lists 442 species under the original UK BAP. It should be noted that this
number of species is greater than the original 391 Species Action Plans; the difference being accounted for by the ‘group’ Species Action Plans.
This priority species data, however, does not disaggregate the English data to the English regions. This data gap was filled
using data from the Biodiversity Action Reporting System (BARS) (http://www.ukbap-reporting.org.uk/default.asp) (Table
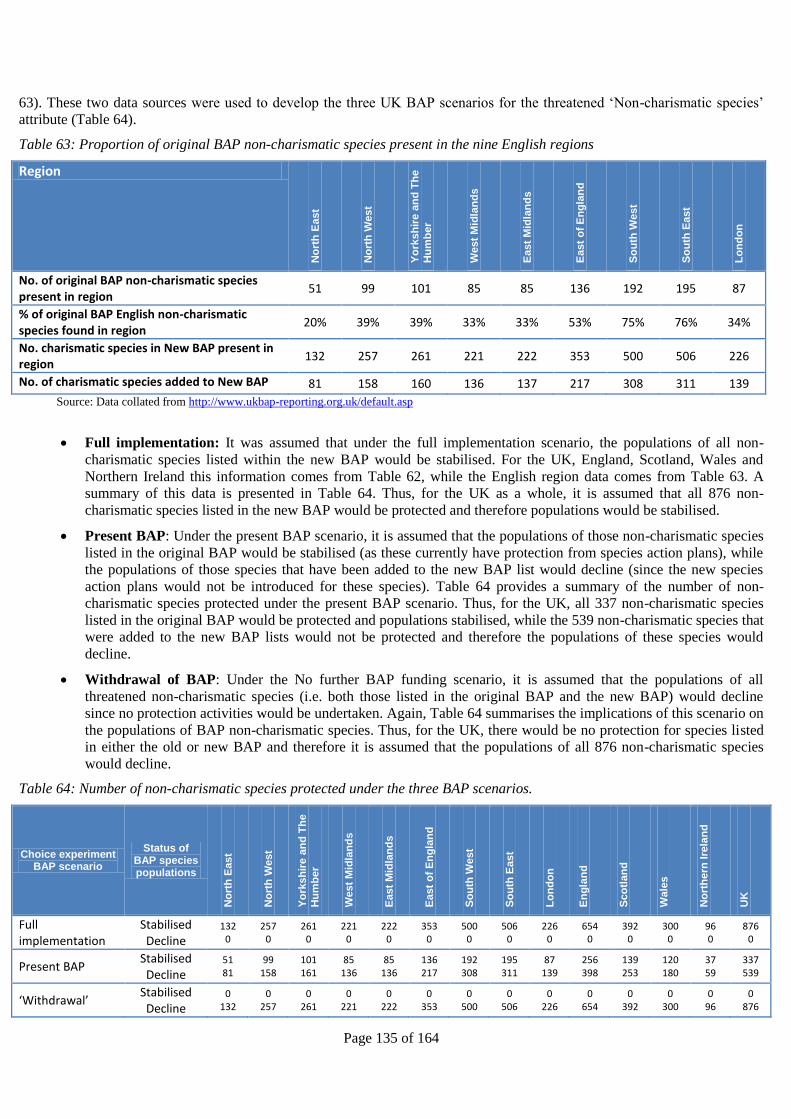
Page 135 of 164
63). These two data sources were used to develop the three UK BAP scenarios for the threatened ‘Non-charismatic species’
attribute (Table 64).
Table 63: Proportion of original BAP non-charismatic species present in the nine English regions
Region
No
rth
East
No
rth
West
Yo
rksh
ire a
nd
Th
e
Hu
mb
er
West
Mid
lan
ds
East
Mid
lan
ds
East
of
En
gla
nd
So
uth
West
So
uth
East
Lo
nd
on
No. of original BAP non-charismatic species present in region
51 99 101 85 85 136 192 195 87
% of original BAP English non-charismatic species found in region
20% 39% 39% 33% 33% 53% 75% 76% 34%
No. charismatic species in New BAP present in region
132 257 261 221 222 353 500 506 226
No. of charismatic species added to New BAP 81 158 160 136 137 217 308 311 139
Source: Data collated from http://www.ukbap-reporting.org.uk/default.asp
Full implementation: It was assumed that under the full implementation scenario, the populations of all non-
charismatic species listed within the new BAP would be stabilised. For the UK, England, Scotland, Wales and
Northern Ireland this information comes from Table 62, while the English region data comes from Table 63. A
summary of this data is presented in Table 64. Thus, for the UK as a whole, it is assumed that all 876 non-
charismatic species listed in the new BAP would be protected and therefore populations would be stabilised.
Present BAP: Under the present BAP scenario, it is assumed that the populations of those non-charismatic species
listed in the original BAP would be stabilised (as these currently have protection from species action plans), while
the populations of those species that have been added to the new BAP list would decline (since the new species
action plans would not be introduced for these species). Table 64 provides a summary of the number of non-
charismatic species protected under the present BAP scenario. Thus, for the UK, all 337 non-charismatic species
listed in the original BAP would be protected and populations stabilised, while the 539 non-charismatic species that
were added to the new BAP lists would not be protected and therefore the populations of these species would
decline.
Withdrawal of BAP: Under the No further BAP funding scenario, it is assumed that the populations of all
threatened non-charismatic species (i.e. both those listed in the original BAP and the new BAP) would decline
since no protection activities would be undertaken. Again, Table 64 summarises the implications of this scenario on
the populations of BAP non-charismatic species. Thus, for the UK, there would be no protection for species listed
in either the old or new BAP and therefore it is assumed that the populations of all 876 non-charismatic species
would decline.
Table 64: Number of non-charismatic species protected under the three BAP scenarios.
Choice experiment BAP scenario
Status of BAP species populations
No
rth
East
No
rth
West
Yo
rksh
ire a
nd
Th
e
Hu
mb
er
West
Mid
lan
ds
East
Mid
lan
ds
East
of
En
gla
nd
So
uth
West
So
uth
East
Lo
nd
on
En
gla
nd
Sco
tlan
d
Wale
s
No
rth
ern
Ire
lan
d
UK
Full implementation
Stabilised Decline
132 0
257 0
261 0
221 0
222 0
353 0
500 0
506 0
226 0
654 0
392 0
300 0
96 0
876 0
Present BAP Stabilised Decline
51 81
99 158
101 161
85 136
85 136
136 217
192 308
195 311
87 139
256 398
139 253
120 180
37 59
337 539
‘Withdrawal’ Stabilised Decline
0 132
0 257
0 261
0 221
0 222
0 353
0 500
0 506
0 226
0 654
0 392
0 300
0 96
0 876
Page 136 of 164
15. Choice experiment survey instrument.
In this interviewer script, we use the following colour coding system:
Black: This information and questions are what is included in the respondents’ questionnaire.
Red: This is the script to be read out by the interviewer during the workshops.
GREEN: THESE ARE THE INSTRUCTIONS FOR THE INTERVIEWER TO FOLLOWING

Page 137 of 164
[SLIDE 1]
Good morning / afternoon / evening. Welcome to this workshop.
My name is Tony Hyde and this is Rob Cooper. We are both researchers from Aberystwyth University.
The reason that you have been invited here today is to help us with a government-funded research project, in which we will aim to investigate people’s opinions of issues affecting [REGION NAME]. The findings from this workshop, along with 45 others to be held at locations throughout the UK, will be used by government officials to help them make important decisions about targeting local policies in the future. It is therefore important that you think carefully about the questions that we ask you and provide honest and considered responses.
Before we begin, however, I would wish to run through some house-keeping issues and then provide you with an overview of how this workshop will run.
First, house-keeping. In the unlikely event of a fire or other emergency, the fire exists are here [point / explain]. Toilets can be found here [explain]. The workshop will last for approximately 2 hours [so we will be finished by TIME]. Half way through the workshop, we will stop for a short refreshment break. At the end of the workshop, you will be given the £15 gratuity, which we provide in thanks for your time and effort during the workshop.
In terms of how the workshop will run, you will be asked to consider and discuss your views on a range of local issues and how these might affect you. In particular, you will be asked to consider a series of choice tasks that require you to make trade-offs between different policy options that are currently being consider for this area in the future. You will be asked to answer questions in a written questionnaire, as well as contribute to group discussions. We also have two short films for you to watch and discuss. All of this will become much clearer as we proceed. We ask that you don’t browse through the questionnaire, but wait for instructions as to when to turn over the pages.
Please be assured that any information you give today will be used only for this research. All information collected will be securely stored and will be used anonymously. Finally, if you have any questions relating to anything of today’s activities, don’t be afraid to ask.
We hope you will find the next 2 hours informative, thought provoking and enjoyable.
Any questions?
Before we get started, could we go round the room and everybody can introduce themselves.
So, let’s get started.
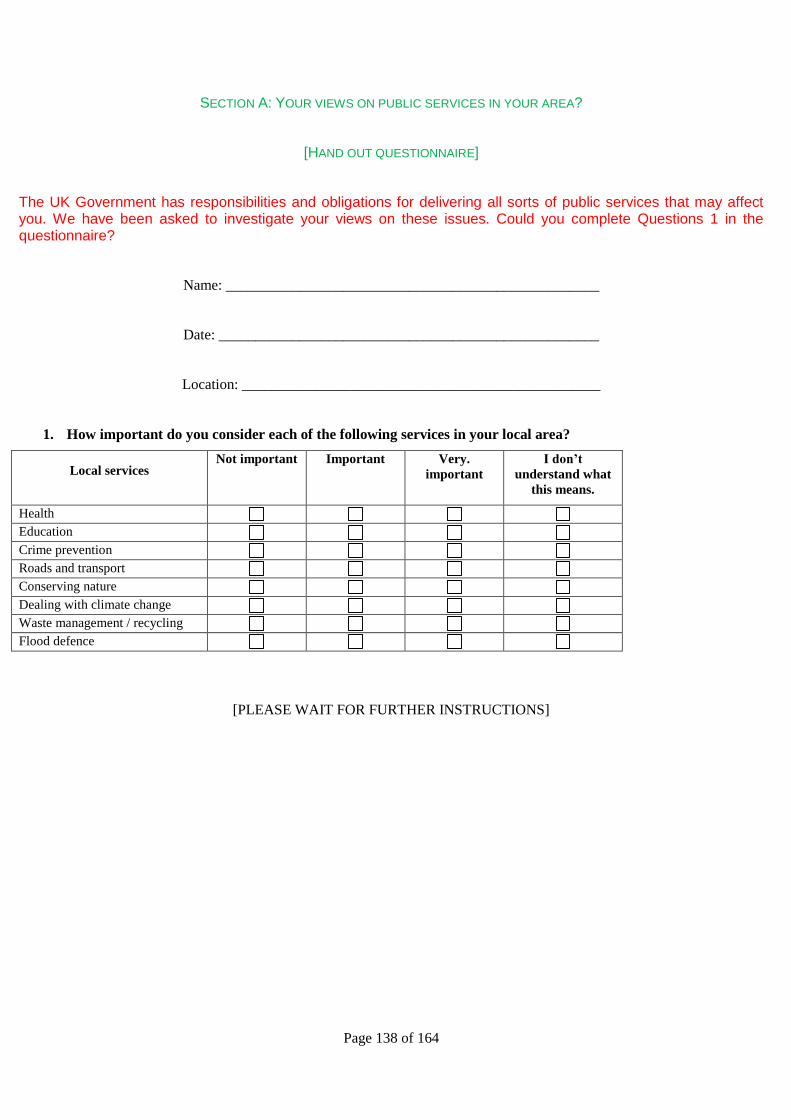
Page 138 of 164
SECTION A: YOUR VIEWS ON PUBLIC SERVICES IN YOUR AREA?
[HAND OUT QUESTIONNAIRE]
The UK Government has responsibilities and obligations for delivering all sorts of public services that may affect you. We have been asked to investigate your views on these issues. Could you complete Questions 1 in the questionnaire?
Name: ___________________________________________________
Date: ____________________________________________________
Location: _________________________________________________
1. How important do you consider each of the following services in your local area?
Local services Not important Important Very.
important
I don’t
understand what
this means.
Health
Education
Crime prevention
Roads and transport
Conserving nature
Dealing with climate change
Waste management / recycling
Flood defence
[PLEASE WAIT FOR FURTHER INSTRUCTIONS]
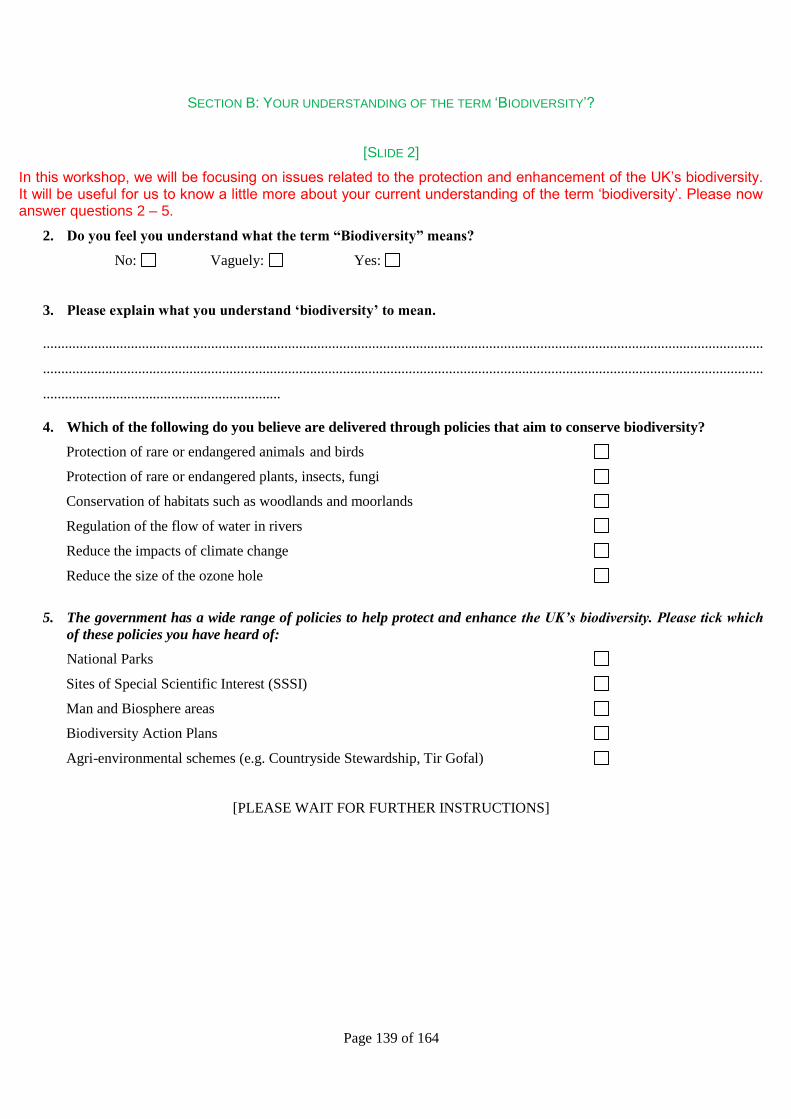
Page 139 of 164
SECTION B: YOUR UNDERSTANDING OF THE TERM ‘BIODIVERSITY’?
[SLIDE 2]
In this workshop, we will be focusing on issues related to the protection and enhancement of the UK’s biodiversity. It will be useful for us to know a little more about your current understanding of the term ‘biodiversity’. Please now answer questions 2 – 5.
2. Do you feel you understand what the term “Biodiversity” means?
No: Vaguely: Yes:
3. Please explain what you understand ‘biodiversity’ to mean.
.....................................................................................................................................................................................................
.....................................................................................................................................................................................................
.................................................................
4. Which of the following do you believe are delivered through policies that aim to conserve biodiversity?
Protection of rare or endangered animals and birds
Protection of rare or endangered plants, insects, fungi
Conservation of habitats such as woodlands and moorlands
Regulation of the flow of water in rivers
Reduce the impacts of climate change
Reduce the size of the ozone hole
5. The government has a wide range of policies to help protect and enhance the UK’s biodiversity. Please tick which
of these policies you have heard of:
National Parks
Sites of Special Scientific Interest (SSSI)
Man and Biosphere areas
Biodiversity Action Plans
Agri-environmental schemes (e.g. Countryside Stewardship, Tir Gofal)
[PLEASE WAIT FOR FURTHER INSTRUCTIONS]
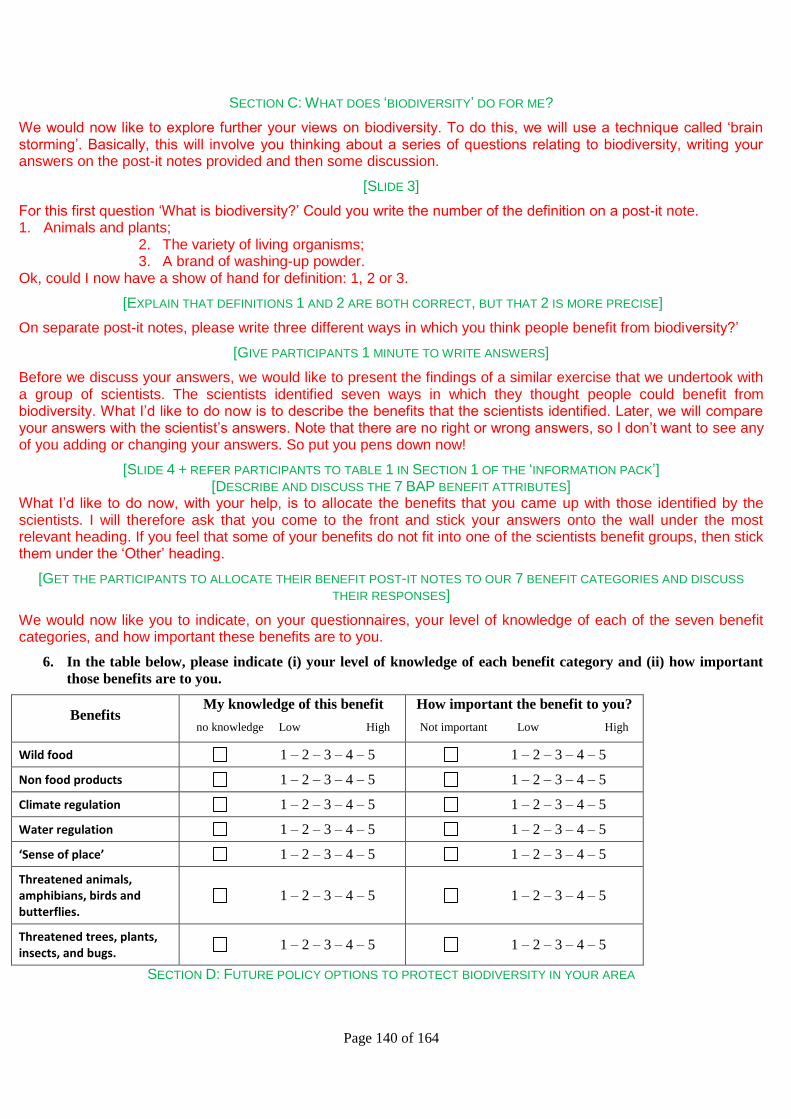
Page 140 of 164
SECTION C: WHAT DOES ‘BIODIVERSITY’ DO FOR ME?
We would now like to explore further your views on biodiversity. To do this, we will use a technique called ‘brain storming’. Basically, this will involve you thinking about a series of questions relating to biodiversity, writing your answers on the post-it notes provided and then some discussion.
[SLIDE 3]
For this first question ‘What is biodiversity?’ Could you write the number of the definition on a post-it note. 1. Animals and plants;
2. The variety of living organisms; 3. A brand of washing-up powder.
Ok, could I now have a show of hand for definition: 1, 2 or 3.
[EXPLAIN THAT DEFINITIONS 1 AND 2 ARE BOTH CORRECT, BUT THAT 2 IS MORE PRECISE]
On separate post-it notes, please write three different ways in which you think people benefit from biodiversity?’
[GIVE PARTICIPANTS 1 MINUTE TO WRITE ANSWERS]
Before we discuss your answers, we would like to present the findings of a similar exercise that we undertook with a group of scientists. The scientists identified seven ways in which they thought people could benefit from biodiversity. What I’d like to do now is to describe the benefits that the scientists identified. Later, we will compare your answers with the scientist’s answers. Note that there are no right or wrong answers, so I don’t want to see any of you adding or changing your answers. So put you pens down now!
[SLIDE 4 + REFER PARTICIPANTS TO TABLE 1 IN SECTION 1 OF THE ‘INFORMATION PACK’] [DESCRIBE AND DISCUSS THE 7 BAP BENEFIT ATTRIBUTES]
What I’d like to do now, with your help, is to allocate the benefits that you came up with those identified by the scientists. I will therefore ask that you come to the front and stick your answers onto the wall under the most relevant heading. If you feel that some of your benefits do not fit into one of the scientists benefit groups, then stick them under the ‘Other’ heading.
[GET THE PARTICIPANTS TO ALLOCATE THEIR BENEFIT POST-IT NOTES TO OUR 7 BENEFIT CATEGORIES AND DISCUSS
THEIR RESPONSES]
We would now like you to indicate, on your questionnaires, your level of knowledge of each of the seven benefit categories, and how important these benefits are to you.
6. In the table below, please indicate (i) your level of knowledge of each benefit category and (ii) how important
those benefits are to you.
Benefits My knowledge of this benefit
no knowledge Low High
How important the benefit to you?
Not important Low High
Wild food 1 – 2 – 3 – 4 – 5 1 – 2 – 3 – 4 – 5
Non food products 1 – 2 – 3 – 4 – 5 1 – 2 – 3 – 4 – 5
Climate regulation 1 – 2 – 3 – 4 – 5 1 – 2 – 3 – 4 – 5
Water regulation 1 – 2 – 3 – 4 – 5 1 – 2 – 3 – 4 – 5
‘Sense of place’ 1 – 2 – 3 – 4 – 5 1 – 2 – 3 – 4 – 5
Threatened animals, amphibians, birds and butterflies.
1 – 2 – 3 – 4 – 5 1 – 2 – 3 – 4 – 5
Threatened trees, plants, insects, and bugs.
1 – 2 – 3 – 4 – 5 1 – 2 – 3 – 4 – 5
SECTION D: FUTURE POLICY OPTIONS TO PROTECT BIODIVERSITY IN YOUR AREA
Page 141 of 164
Now that we have some idea about biodiversity and the benefits it may provide you, we would now like you to make some choices about future policies to protect and enhance biodiversity in your region.
[SLIDE 5 – HIGHLIGHT THE BOUNDARIES OF THE LOCAL REGION]
The government is currently reviewing one of its policies for protecting the biodiversity in the UK. This policy is called the UK Biodiversity Action Plan; or UK BAP for short.
[SLIDE 6]
Although the UK BAP is only one of a handful of biodiversity policies in the UK, it is strategically important since it aims to protect the UK’s most important habitats and most threatened species
[SLIDE 7]
The government is currently considering three options for the future funding of the UK BAP:
(i) Withdrawing all funding for UK BAP
(ii) Retain current levels of spend on the UK BAP
(iii) Increase funding to allow full implementation of the UK BAP
However, the government’s spending options are not quite this straight forward. Depending on how the government spends its money, it can target delivery of different types of benefit through the implementation of the UK BAP; where the types of benefits may relate to the 7 groups of benefits that we have already discussed. So for example, the government might target spending on activities that help to reduce climate change, while at the same time reduce spending on the protection of threatened trees, plants and insects. Thus, there is a great amount of flexibility in terms of how much money the government allocates to the UK BAP and what it spends this money on.
[SLIDE 8]
So where do YOU fit in?
As already indicated, the government is still undecided about how it will fund the UK BAP in the future. However, the government also has a duty to spend its money in the best interests of the public. It has therefore asked us to help them assess this ‘value for money’ through this research. We will therefore be attempting to find out how much YOU (as representatives of the public) benefit from biodiversity protection in [YOUR REGION].
How will we do this?
To do this, we will present you with a series of ‘choice tasks’, in which we ask you to indicate your preferred policy option for the future of the UK BAP in [YOUR REGION]. An example of a typical choice task is presented in this slide.
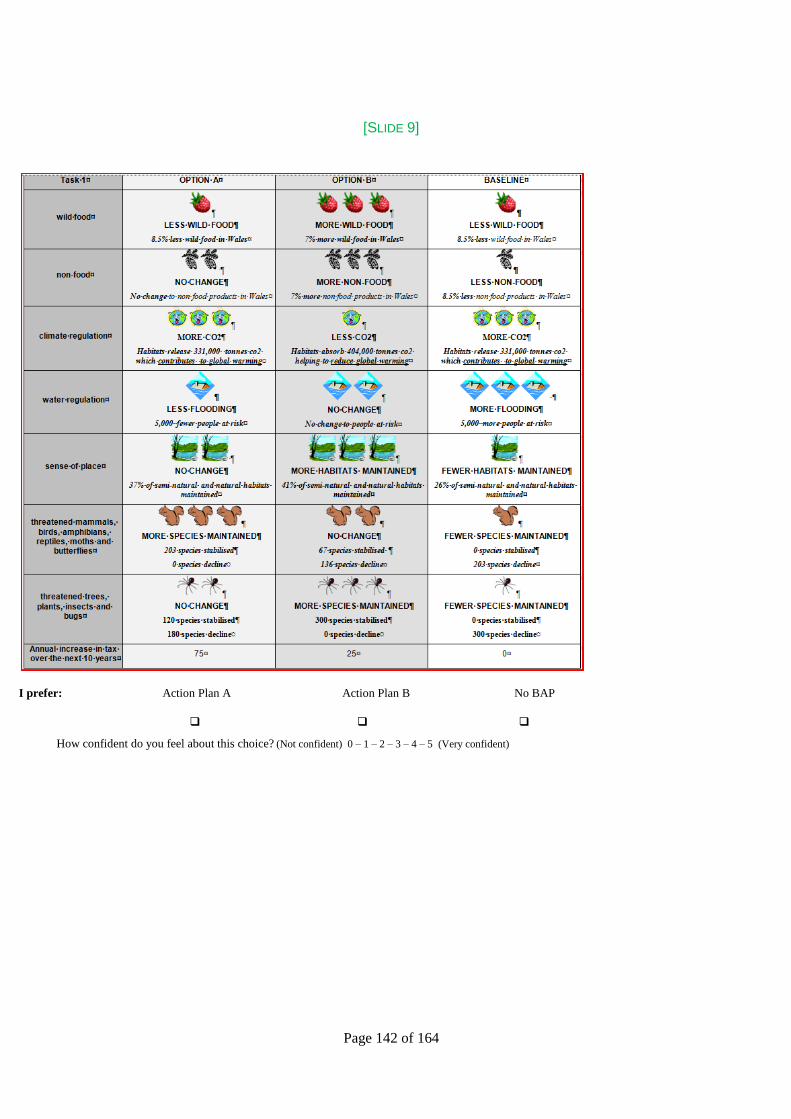
Page 142 of 164
[SLIDE 9]
I prefer: Action Plan A Action Plan B No BAP
How confident do you feel about this choice? (Not confident) 0 – 1 – 2 – 3 – 4 – 5 (Very confident)
Page 143 of 164
You will notice that the ‘choice task’ is displayed as a table with four columns. The first column indicates the type of benefit that we would like you to consider of each policy option. These benefit categories are those categories that we discussed earlier.
The next three columns related to different policy options for the future of the UK BAP. These are labelled ‘Action Plan A’, ‘Action Plan B’ and a ‘Baseline: withdrawal of BAP funding’. You will be asked to choose your preferred policy from these 3 options.
For all of the choice tasks that you consider, the baseline option (i.e. the fourth column) will remain constant: this allows us to directly compare your choices across different choice tasks. So, for this project, we will assume that this baseline corresponds to a withdrawal of funding for the ‘UK Biodiversity Action Plan’.
[SLIDE 10]
A withdrawal of funding for the UK Biodiversity Action Plan (BAP) would mean less funds for:
The protection of important habitats,
The protection of species in the wider countryside (e.g. on farmland),
The protection of individual species.
It should, however, be noted that other biodiversity policies, such as those directly focusing on biodiversity hotspots (such as SSSIs), would continue to be funded.
The implication of withdrawing funding for the UK BAP would be a reduction in the extent and quality of the important habitats in your area and also it would lead to a decline in the numbers of threatened species in your area.
This, in turn, would affect you in terms of a reduction in the range of benefits provided by biodiversity as described in the fourth column. You can find a description of this baseline scenario in Table 2 in Section 1 of your information pack.
[SLIDE 11]
The middle two columns, ‘Action Plan A’ and ‘Action Plan B’ describe two alternative options for future spending on the UK BAP. In these two options, we assume that the government will target spending to different elements of benefit delivered by the UK BAP. So in the example provided, Action Plan B has a strong focus on ‘wild food’, ‘water regulation’ and ‘sense of place’, while Action Plan A targets ‘threatened trees, plants, insects and bugs’. The descriptions of the benefits that we provide in the choice tasks are short summaries. You can find descriptions of the different levels of provision of benefits in Table 2 in Section 1 of your information pack.
[EXPLAIN THAT TABLE 2 PRESENT 3 DIFFERENT LEVELS OF PROVISION OF EACH BENEFIT CATEGORY]
Any future policies to protect biodiversity through the UK BAP will be funded through increases in taxation. In addition to the benefits from the three BAP policy options, you also need to consider how much each of these policy options will cost you in terms of an increase in your annual tax bill. You will find this information in the last row of each choice task. So, in the example provided, Action Plan A will cost you an extra £150 per annum, while Action Plan B will cost you £300 per annum. These costs will vary in each choice task. The baseline option (last column) will not cost you anything since it relates to a withdrawal of funding for the UK BAP. When we ask you to decide which policy option you prefer, you will need to consider the benefits that will be delivered by each plan and weigh this up against the costs to you. If the costs of Action Plan A or B are higher than your household would be willing and able to pay, you must choose the baseline option; even if this means that in that particular choice task you choose an option that does not provide any protection of biodiversity. Your support for biodiversity protection will be picked up in other choice tasks.
[GET THE PARTICIPANTS TO COMPLETE THIS EXAMPLE CHOICE TASK]
Do you have any questions / issues about completing this sort of choice task?
Page 144 of 164
Ok, in Section 2 of your information pack, you will find a series of five choice tasks, labelled ‘Choice Set A’. Also, in Section D of your questionnaire, you will find a section entitled ‘Choice Set A Answers’; this is where you should record your preferred choices of each choice task.
[SLIDE 12]
Before considering these choice tasks, could I first ask that you copy the ‘Choice set group’ number from your information pack into Question 7 of your questionnaire answer sheet.
Ok, I will now give you around 10 minutes to examine and complete the 5 choice tasks. Before you do, however, there are a few other things that you should remember when making your choices:
Remember the scope of the Biodiversity Action Plans.
o The BAP only aims to protect and enhance the most threatened species and important habitats in your area.
o The BAP does not cover all of the countryside.
o Other biodiversity policies will continue to operate in the absence of BAP.
o The descriptions of the benefits in the choice tasks provide only a summary of the benefits. You should refer to the more detailed descriptions that can be found in Table 2 in Section 1 of your information pack.
We want you to think only about biodiversity in your region; we will ask you to think about the rest of the UK later.
“Talk is cheap”. The experience from other surveys similar to this is that people have a tendency to respond in one way but in reality would act differently. For example, it is common that people choose an option with a higher cost than what they would actually be willing to pay. We believe this is due to the fact that they do not really consider how big an impact the extra costs would actually have on the family budget. It is easy to be generous in surveys such as this one and choose expensive options that deliver high benefits. However, we do not want you to think in this way when answering our questions as this will affect the validity of our results.
o You need to consider the cost seriously!
o Are the stated benefits worth the costs to you?
o Would you really be able and willing to pay the stated amount in your chosen option?
o What other things would you give up to allow you to spend your money on the biodiversity policy?
o If both prices in Action Plans A and B are higher than what you think you are willing and able to pay, then you should choose the Baseline option.
Finally it will be useful to us if you show how confident you feel about the choices that you made. You can record this information in your questionnaire. Also, after you have completed all 5 choice tasks, you should indicate the thought process you went through when making your choices.
You should now complete the 5 choice tasks.
If you need any help, please let Rob or I know and we will help you.
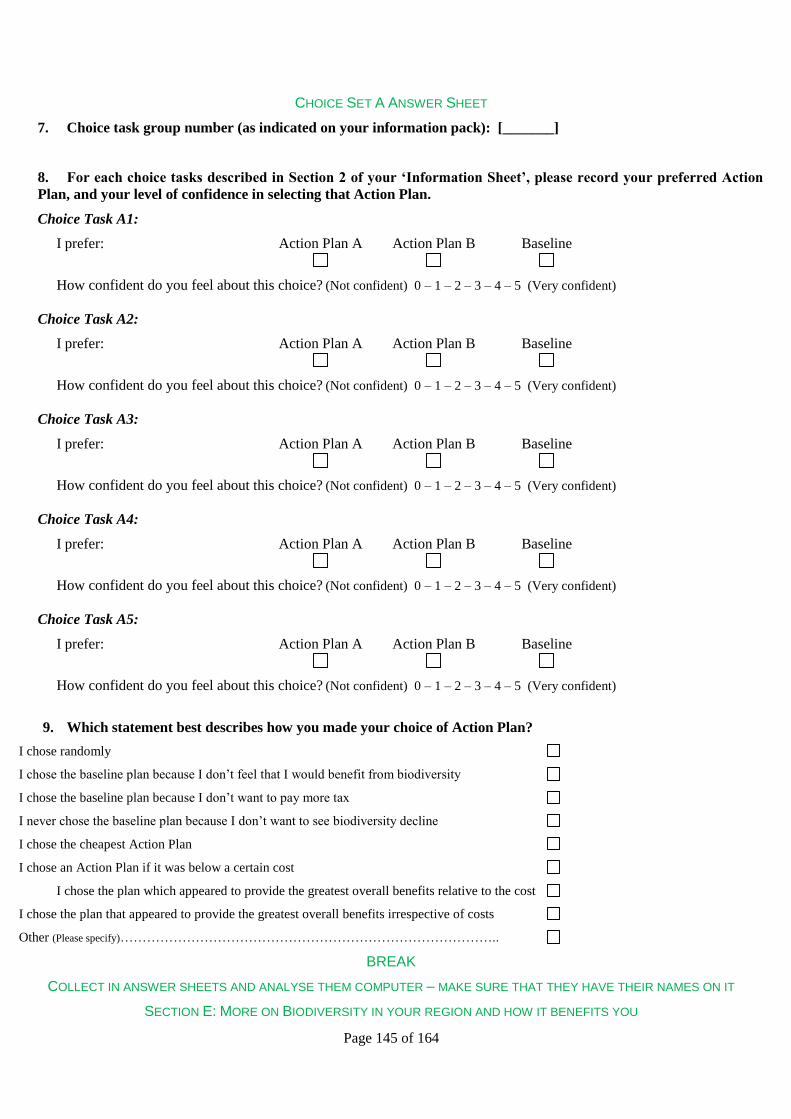
Page 145 of 164
CHOICE SET A ANSWER SHEET
7. Choice task group number (as indicated on your information pack): [_______]
8. For each choice tasks described in Section 2 of your ‘Information Sheet’, please record your preferred Action
Plan, and your level of confidence in selecting that Action Plan.
Choice Task A1:
I prefer: Action Plan A Action Plan B Baseline
How confident do you feel about this choice? (Not confident) 0 – 1 – 2 – 3 – 4 – 5 (Very confident)
Choice Task A2:
I prefer: Action Plan A Action Plan B Baseline
How confident do you feel about this choice? (Not confident) 0 – 1 – 2 – 3 – 4 – 5 (Very confident)
Choice Task A3:
I prefer: Action Plan A Action Plan B Baseline
How confident do you feel about this choice? (Not confident) 0 – 1 – 2 – 3 – 4 – 5 (Very confident)
Choice Task A4:
I prefer: Action Plan A Action Plan B Baseline
How confident do you feel about this choice? (Not confident) 0 – 1 – 2 – 3 – 4 – 5 (Very confident)
Choice Task A5:
I prefer: Action Plan A Action Plan B Baseline
How confident do you feel about this choice? (Not confident) 0 – 1 – 2 – 3 – 4 – 5 (Very confident)
9. Which statement best describes how you made your choice of Action Plan?
I chose randomly
I chose the baseline plan because I don’t feel that I would benefit from biodiversity
I chose the baseline plan because I don’t want to pay more tax
I never chose the baseline plan because I don’t want to see biodiversity decline
I chose the cheapest Action Plan
I chose an Action Plan if it was below a certain cost
I chose the plan which appeared to provide the greatest overall benefits relative to the cost
I chose the plan that appeared to provide the greatest overall benefits irrespective of costs
Other (Please specify)…………………………………………………………………………..
BREAK
COLLECT IN ANSWER SHEETS AND ANALYSE THEM COMPUTER – MAKE SURE THAT THEY HAVE THEIR NAMES ON IT
SECTION E: MORE ON BIODIVERSITY IN YOUR REGION AND HOW IT BENEFITS YOU
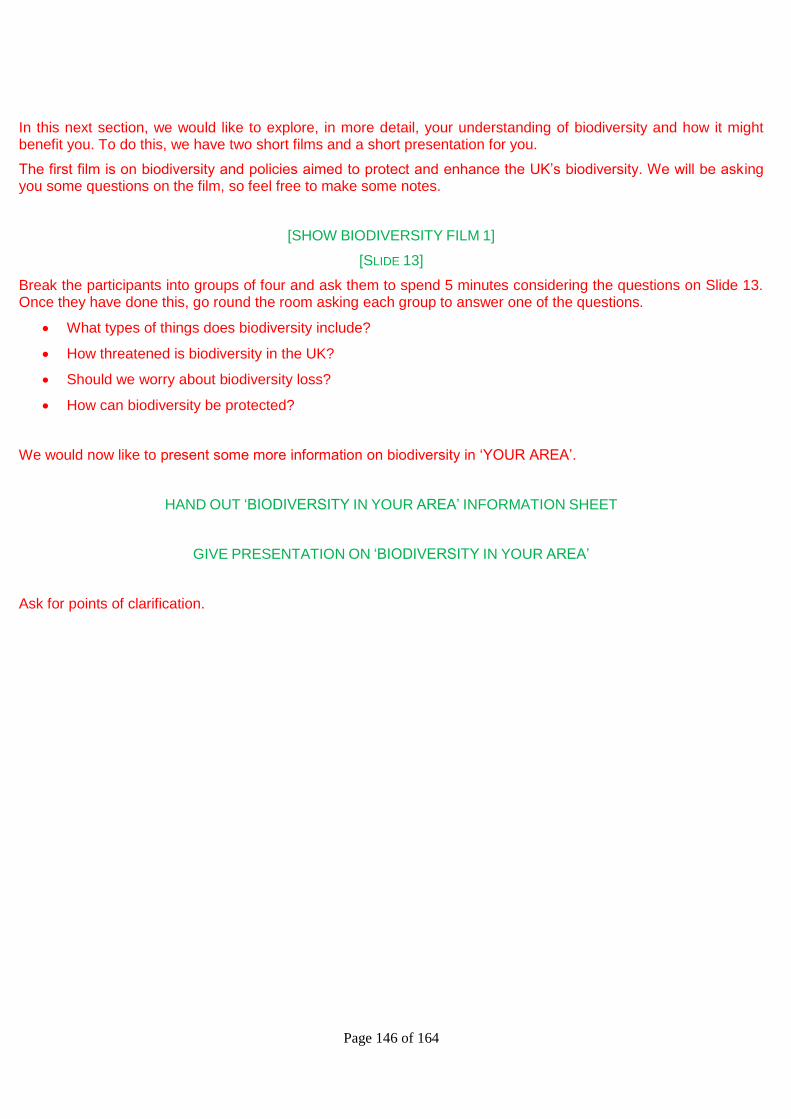
Page 146 of 164
In this next section, we would like to explore, in more detail, your understanding of biodiversity and how it might benefit you. To do this, we have two short films and a short presentation for you.
The first film is on biodiversity and policies aimed to protect and enhance the UK’s biodiversity. We will be asking you some questions on the film, so feel free to make some notes.
[SHOW BIODIVERSITY FILM 1]
[SLIDE 13]
Break the participants into groups of four and ask them to spend 5 minutes considering the questions on Slide 13. Once they have done this, go round the room asking each group to answer one of the questions.
What types of things does biodiversity include?
How threatened is biodiversity in the UK?
Should we worry about biodiversity loss?
How can biodiversity be protected?
We would now like to present some more information on biodiversity in ‘YOUR AREA’.
HAND OUT ‘BIODIVERSITY IN YOUR AREA’ INFORMATION SHEET
GIVE PRESENTATION ON ‘BIODIVERSITY IN YOUR AREA’
Ask for points of clarification.
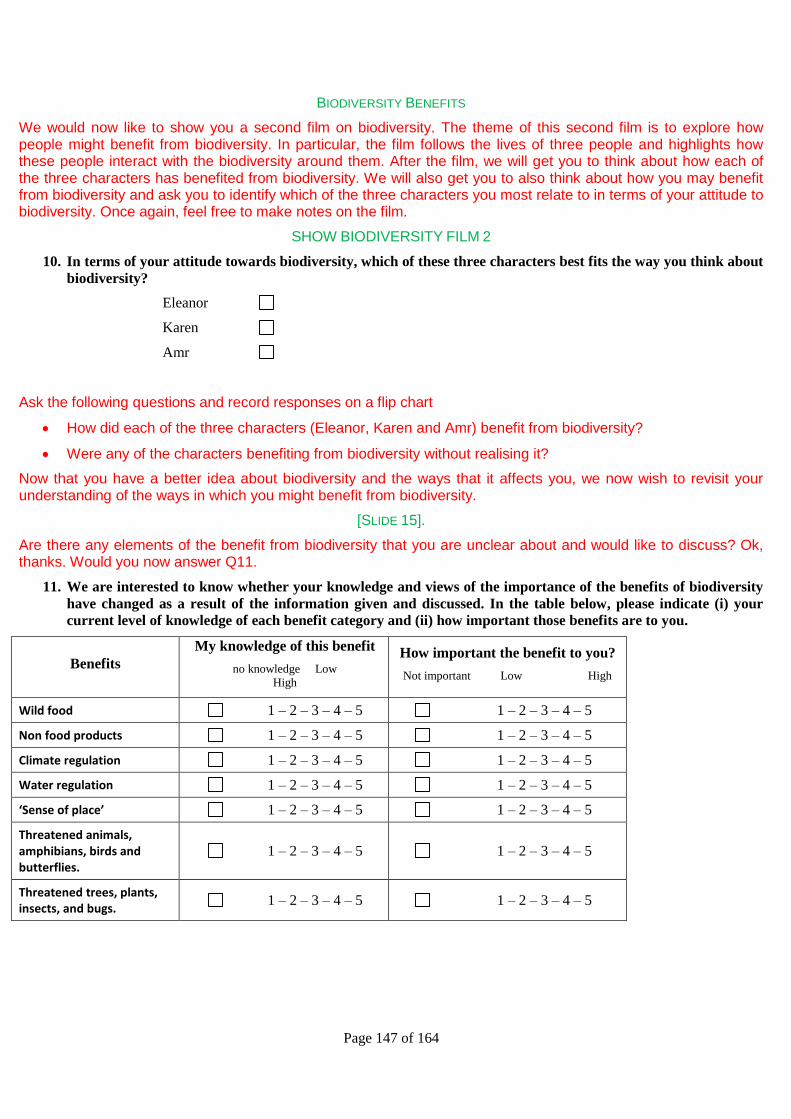
Page 147 of 164
BIODIVERSITY BENEFITS
We would now like to show you a second film on biodiversity. The theme of this second film is to explore how people might benefit from biodiversity. In particular, the film follows the lives of three people and highlights how these people interact with the biodiversity around them. After the film, we will get you to think about how each of the three characters has benefited from biodiversity. We will also get you to also think about how you may benefit from biodiversity and ask you to identify which of the three characters you most relate to in terms of your attitude to biodiversity. Once again, feel free to make notes on the film.
SHOW BIODIVERSITY FILM 2
10. In terms of your attitude towards biodiversity, which of these three characters best fits the way you think about
biodiversity?
Eleanor
Karen
Amr
Ask the following questions and record responses on a flip chart
How did each of the three characters (Eleanor, Karen and Amr) benefit from biodiversity?
Were any of the characters benefiting from biodiversity without realising it?
Now that you have a better idea about biodiversity and the ways that it affects you, we now wish to revisit your understanding of the ways in which you might benefit from biodiversity.
[SLIDE 15].
Are there any elements of the benefit from biodiversity that you are unclear about and would like to discuss? Ok, thanks. Would you now answer Q11.
11. We are interested to know whether your knowledge and views of the importance of the benefits of biodiversity
have changed as a result of the information given and discussed. In the table below, please indicate (i) your
current level of knowledge of each benefit category and (ii) how important those benefits are to you.
Benefits
My knowledge of this benefit
no knowledge Low
High
How important the benefit to you?
Not important Low High
Wild food 1 – 2 – 3 – 4 – 5 1 – 2 – 3 – 4 – 5
Non food products 1 – 2 – 3 – 4 – 5 1 – 2 – 3 – 4 – 5
Climate regulation 1 – 2 – 3 – 4 – 5 1 – 2 – 3 – 4 – 5
Water regulation 1 – 2 – 3 – 4 – 5 1 – 2 – 3 – 4 – 5
‘Sense of place’ 1 – 2 – 3 – 4 – 5 1 – 2 – 3 – 4 – 5
Threatened animals, amphibians, birds and butterflies.
1 – 2 – 3 – 4 – 5 1 – 2 – 3 – 4 – 5
Threatened trees, plants, insects, and bugs.
1 – 2 – 3 – 4 – 5 1 – 2 – 3 – 4 – 5
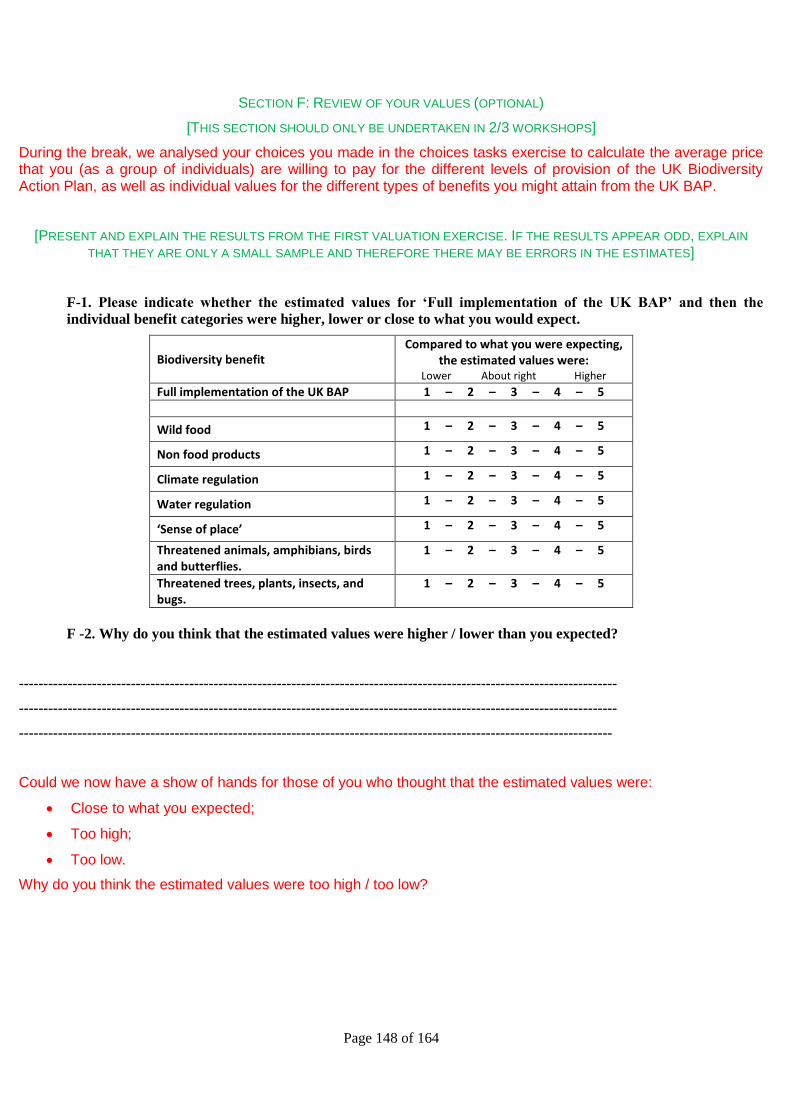
Page 148 of 164
SECTION F: REVIEW OF YOUR VALUES (OPTIONAL)
[THIS SECTION SHOULD ONLY BE UNDERTAKEN IN 2/3 WORKSHOPS]
During the break, we analysed your choices you made in the choices tasks exercise to calculate the average price that you (as a group of individuals) are willing to pay for the different levels of provision of the UK Biodiversity Action Plan, as well as individual values for the different types of benefits you might attain from the UK BAP.
[PRESENT AND EXPLAIN THE RESULTS FROM THE FIRST VALUATION EXERCISE. IF THE RESULTS APPEAR ODD, EXPLAIN
THAT THEY ARE ONLY A SMALL SAMPLE AND THEREFORE THERE MAY BE ERRORS IN THE ESTIMATES]
F-1. Please indicate whether the estimated values for ‘Full implementation of the UK BAP’ and then the
individual benefit categories were higher, lower or close to what you would expect.
Biodiversity benefit Compared to what you were expecting,
the estimated values were: Lower About right Higher
Full implementation of the UK BAP 1 – 2 – 3 – 4 – 5
Wild food 1 – 2 – 3 – 4 – 5
Non food products 1 – 2 – 3 – 4 – 5
Climate regulation 1 – 2 – 3 – 4 – 5
Water regulation 1 – 2 – 3 – 4 – 5
‘Sense of place’ 1 – 2 – 3 – 4 – 5
Threatened animals, amphibians, birds and butterflies.
1 – 2 – 3 – 4 – 5
Threatened trees, plants, insects, and bugs.
1 – 2 – 3 – 4 – 5
F -2. Why do you think that the estimated values were higher / lower than you expected?
---------------------------------------------------------------------------------------------------------------------------
---------------------------------------------------------------------------------------------------------------------------
--------------------------------------------------------------------------------------------------------------------------
Could we now have a show of hands for those of you who thought that the estimated values were:
Close to what you expected;
Too high;
Too low.
Why do you think the estimated values were too high / too low?
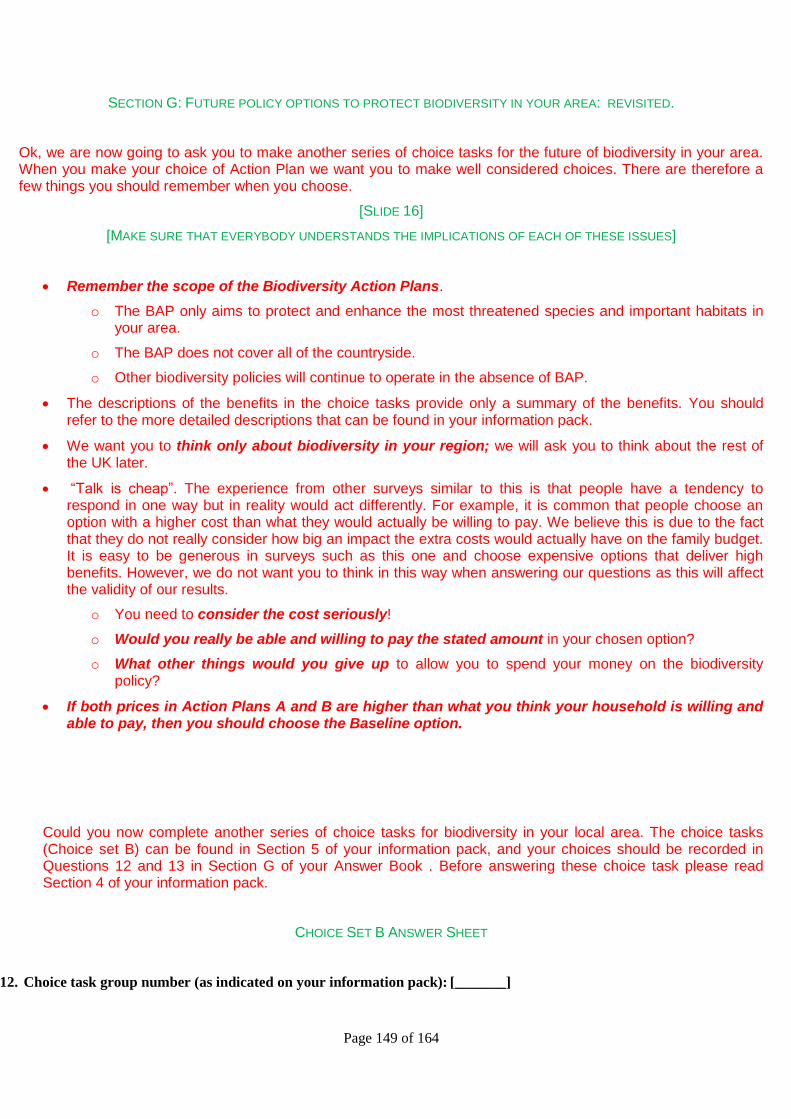
Page 149 of 164
SECTION G: FUTURE POLICY OPTIONS TO PROTECT BIODIVERSITY IN YOUR AREA: REVISITED.
Ok, we are now going to ask you to make another series of choice tasks for the future of biodiversity in your area. When you make your choice of Action Plan we want you to make well considered choices. There are therefore a few things you should remember when you choose.
[SLIDE 16]
[MAKE SURE THAT EVERYBODY UNDERSTANDS THE IMPLICATIONS OF EACH OF THESE ISSUES]
Remember the scope of the Biodiversity Action Plans.
o The BAP only aims to protect and enhance the most threatened species and important habitats in your area.
o The BAP does not cover all of the countryside.
o Other biodiversity policies will continue to operate in the absence of BAP.
The descriptions of the benefits in the choice tasks provide only a summary of the benefits. You should refer to the more detailed descriptions that can be found in your information pack.
We want you to think only about biodiversity in your region; we will ask you to think about the rest of the UK later.
“Talk is cheap”. The experience from other surveys similar to this is that people have a tendency to respond in one way but in reality would act differently. For example, it is common that people choose an option with a higher cost than what they would actually be willing to pay. We believe this is due to the fact that they do not really consider how big an impact the extra costs would actually have on the family budget. It is easy to be generous in surveys such as this one and choose expensive options that deliver high benefits. However, we do not want you to think in this way when answering our questions as this will affect the validity of our results.
o You need to consider the cost seriously!
o Would you really be able and willing to pay the stated amount in your chosen option?
o What other things would you give up to allow you to spend your money on the biodiversity policy?
If both prices in Action Plans A and B are higher than what you think your household is willing and able to pay, then you should choose the Baseline option.
Could you now complete another series of choice tasks for biodiversity in your local area. The choice tasks (Choice set B) can be found in Section 5 of your information pack, and your choices should be recorded in Questions 12 and 13 in Section G of your Answer Book . Before answering these choice task please read Section 4 of your information pack.
CHOICE SET B ANSWER SHEET
12. Choice task group number (as indicated on your information pack): [_______]
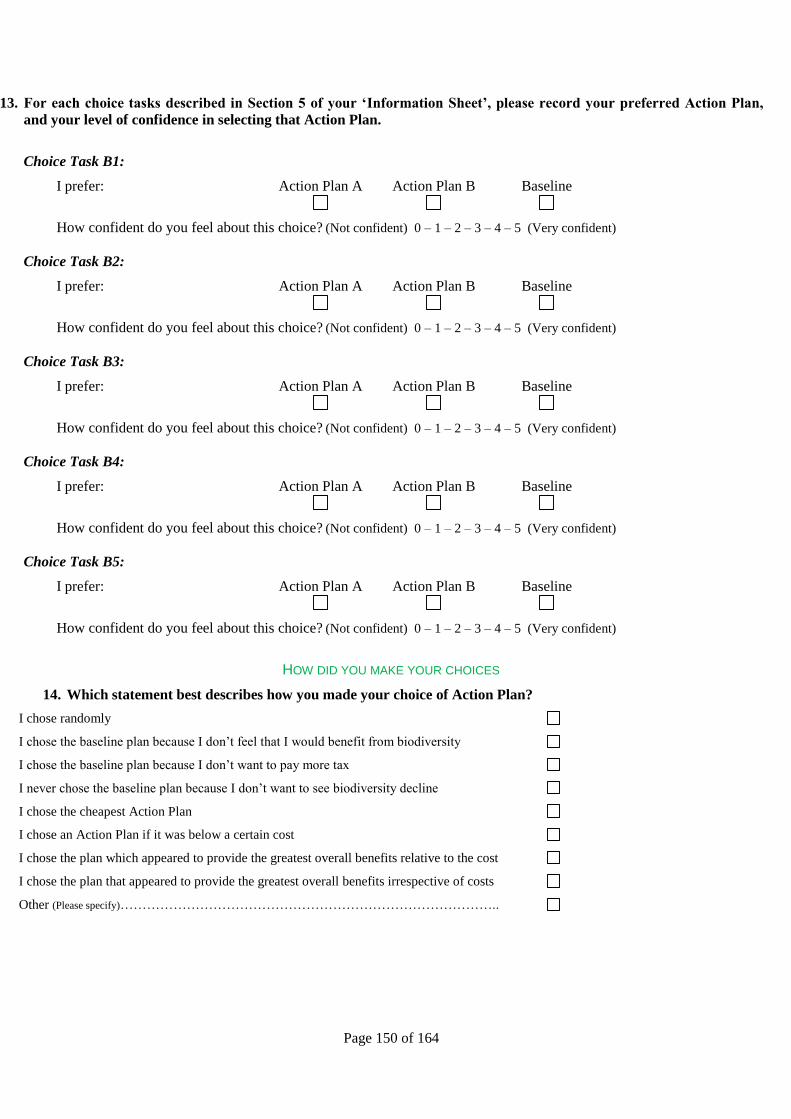
Page 150 of 164
13. For each choice tasks described in Section 5 of your ‘Information Sheet’, please record your preferred Action Plan,
and your level of confidence in selecting that Action Plan.
Choice Task B1:
I prefer: Action Plan A Action Plan B Baseline
How confident do you feel about this choice? (Not confident) 0 – 1 – 2 – 3 – 4 – 5 (Very confident)
Choice Task B2:
I prefer: Action Plan A Action Plan B Baseline
How confident do you feel about this choice? (Not confident) 0 – 1 – 2 – 3 – 4 – 5 (Very confident)
Choice Task B3:
I prefer: Action Plan A Action Plan B Baseline
How confident do you feel about this choice? (Not confident) 0 – 1 – 2 – 3 – 4 – 5 (Very confident)
Choice Task B4:
I prefer: Action Plan A Action Plan B Baseline
How confident do you feel about this choice? (Not confident) 0 – 1 – 2 – 3 – 4 – 5 (Very confident)
Choice Task B5:
I prefer: Action Plan A Action Plan B Baseline
How confident do you feel about this choice? (Not confident) 0 – 1 – 2 – 3 – 4 – 5 (Very confident)
HOW DID YOU MAKE YOUR CHOICES
14. Which statement best describes how you made your choice of Action Plan?
I chose randomly
I chose the baseline plan because I don’t feel that I would benefit from biodiversity
I chose the baseline plan because I don’t want to pay more tax
I never chose the baseline plan because I don’t want to see biodiversity decline
I chose the cheapest Action Plan
I chose an Action Plan if it was below a certain cost
I chose the plan which appeared to provide the greatest overall benefits relative to the cost
I chose the plan that appeared to provide the greatest overall benefits irrespective of costs
Other (Please specify)…………………………………………………………………………..
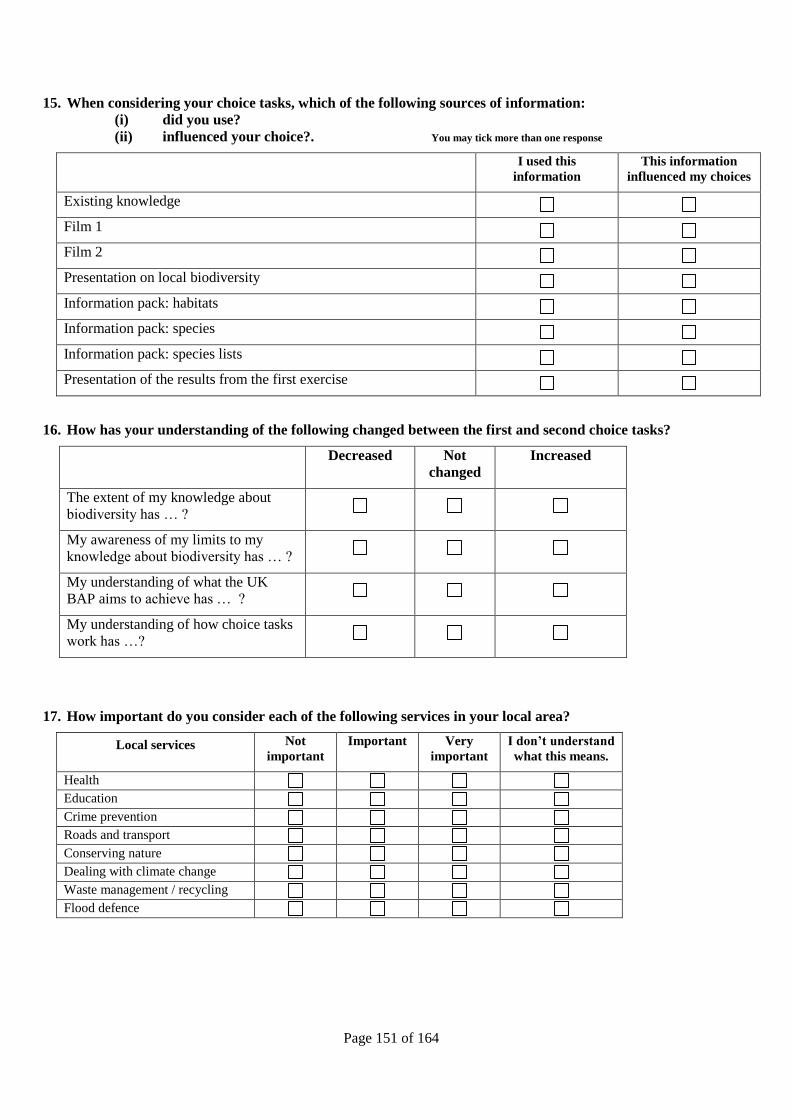
Page 151 of 164
15. When considering your choice tasks, which of the following sources of information:
(i) did you use?
(ii) influenced your choice?. You may tick more than one response
I used this
information
This information
influenced my choices
Existing knowledge
Film 1
Film 2
Presentation on local biodiversity
Information pack: habitats
Information pack: species
Information pack: species lists
Presentation of the results from the first exercise
16. How has your understanding of the following changed between the first and second choice tasks?
Decreased Not
changed
Increased
The extent of my knowledge about
biodiversity has … ?
My awareness of my limits to my
knowledge about biodiversity has … ?
My understanding of what the UK
BAP aims to achieve has … ?
My understanding of how choice tasks
work has …?
17. How important do you consider each of the following services in your local area?
Local services Not
important
Important Very
important
I don’t understand
what this means.
Health
Education
Crime prevention
Roads and transport
Conserving nature
Dealing with climate change
Waste management / recycling
Flood defence
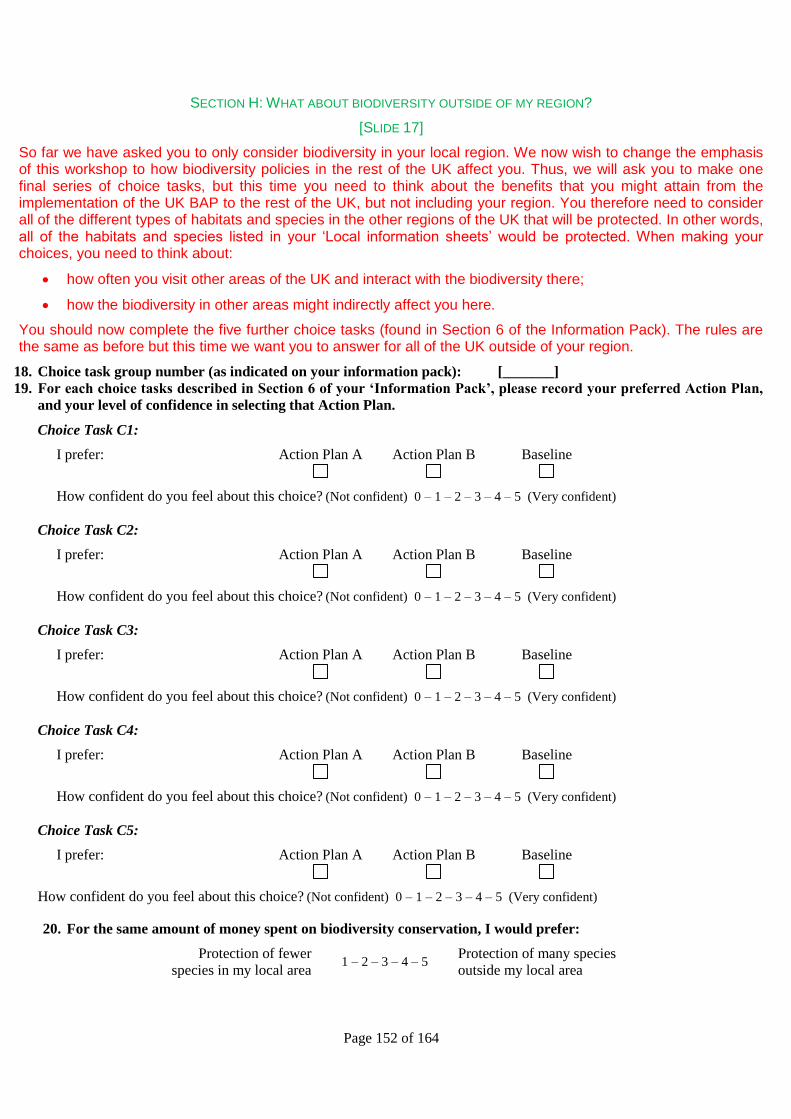
Page 152 of 164
SECTION H: WHAT ABOUT BIODIVERSITY OUTSIDE OF MY REGION?
[SLIDE 17]
So far we have asked you to only consider biodiversity in your local region. We now wish to change the emphasis of this workshop to how biodiversity policies in the rest of the UK affect you. Thus, we will ask you to make one final series of choice tasks, but this time you need to think about the benefits that you might attain from the implementation of the UK BAP to the rest of the UK, but not including your region. You therefore need to consider all of the different types of habitats and species in the other regions of the UK that will be protected. In other words, all of the habitats and species listed in your ‘Local information sheets’ would be protected. When making your choices, you need to think about:
how often you visit other areas of the UK and interact with the biodiversity there;
how the biodiversity in other areas might indirectly affect you here.
You should now complete the five further choice tasks (found in Section 6 of the Information Pack). The rules are the same as before but this time we want you to answer for all of the UK outside of your region.
18. Choice task group number (as indicated on your information pack): [_______]
19. For each choice tasks described in Section 6 of your ‘Information Pack’, please record your preferred Action Plan,
and your level of confidence in selecting that Action Plan.
Choice Task C1:
I prefer: Action Plan A Action Plan B Baseline
How confident do you feel about this choice? (Not confident) 0 – 1 – 2 – 3 – 4 – 5 (Very confident)
Choice Task C2:
I prefer: Action Plan A Action Plan B Baseline
How confident do you feel about this choice? (Not confident) 0 – 1 – 2 – 3 – 4 – 5 (Very confident)
Choice Task C3:
I prefer: Action Plan A Action Plan B Baseline
How confident do you feel about this choice? (Not confident) 0 – 1 – 2 – 3 – 4 – 5 (Very confident)
Choice Task C4:
I prefer: Action Plan A Action Plan B Baseline
How confident do you feel about this choice? (Not confident) 0 – 1 – 2 – 3 – 4 – 5 (Very confident)
Choice Task C5:
I prefer: Action Plan A Action Plan B Baseline
How confident do you feel about this choice? (Not confident) 0 – 1 – 2 – 3 – 4 – 5 (Very confident)
20. For the same amount of money spent on biodiversity conservation, I would prefer:
Protection of fewer
species in my local area 1 – 2 – 3 – 4 – 5
Protection of many species
outside my local area
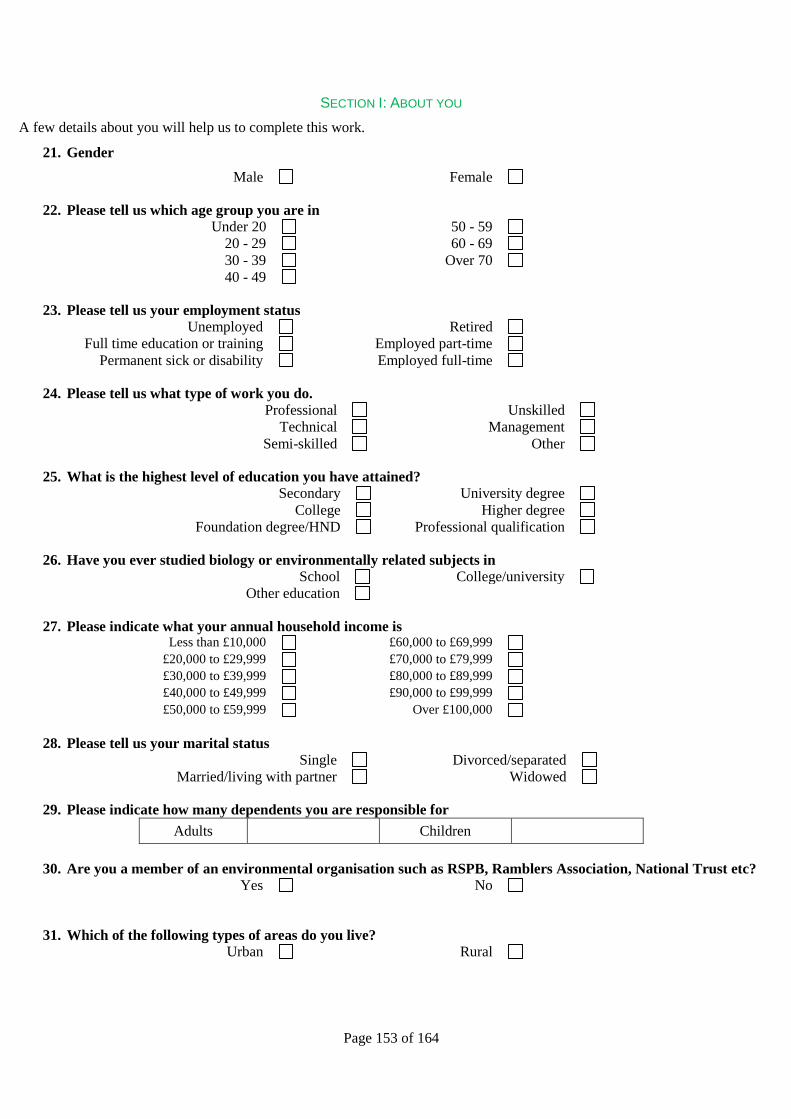
Page 153 of 164
SECTION I: ABOUT YOU
A few details about you will help us to complete this work.
21. Gender
Male Female
22. Please tell us which age group you are in
Under 20 50 - 59
20 - 29 60 - 69
30 - 39 Over 70
40 - 49
23. Please tell us your employment status
Unemployed Retired
Full time education or training Employed part-time
Permanent sick or disability Employed full-time
24. Please tell us what type of work you do.
Professional Unskilled
Technical Management
Semi-skilled Other
25. What is the highest level of education you have attained?
Secondary University degree
College Higher degree
Foundation degree/HND Professional qualification
26. Have you ever studied biology or environmentally related subjects in
School College/university
Other education
27. Please indicate what your annual household income is Less than £10,000 £60,000 to £69,999
£20,000 to £29,999 £70,000 to £79,999 £30,000 to £39,999 £80,000 to £89,999 £40,000 to £49,999 £90,000 to £99,999 £50,000 to £59,999 Over £100,000
28. Please tell us your marital status
Single Divorced/separated
Married/living with partner Widowed
29. Please indicate how many dependents you are responsible for
Adults Children
30. Are you a member of an environmental organisation such as RSPB, Ramblers Association, National Trust etc?
Yes No
31. Which of the following types of areas do you live?
Urban Rural
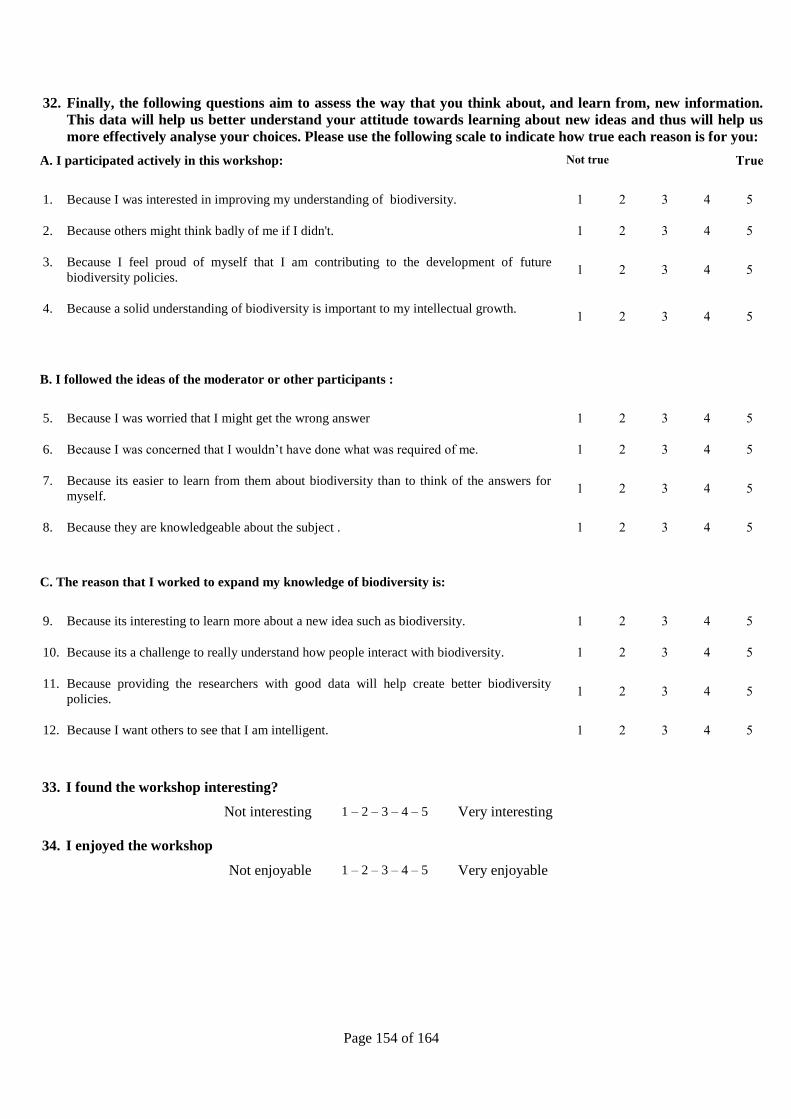
Page 154 of 164
32. Finally, the following questions aim to assess the way that you think about, and learn from, new information.
This data will help us better understand your attitude towards learning about new ideas and thus will help us
more effectively analyse your choices. Please use the following scale to indicate how true each reason is for you:
A. A. I participated actively in this workshop: Not true True
1. Because I was interested in improving my understanding of biodiversity. 1 2 3 4 5
2. Because others might think badly of me if I didn't. 1 2 3 4 5
3. Because I feel proud of myself that I am contributing to the development of future
biodiversity policies. 1 2 3 4 5
4. Because a solid understanding of biodiversity is important to my intellectual growth. 1 2 3 4 5
B. B. I followed the ideas of the moderator or other participants :
5. Because I was worried that I might get the wrong answer 1 2 3 4 5
6. Because I was concerned that I wouldn’t have done what was required of me. 1 2 3 4 5
7. Because its easier to learn from them about biodiversity than to think of the answers for
myself. 1 2 3 4 5
8. Because they are knowledgeable about the subject . 1 2 3 4 5
. C. The reason that I worked to expand my knowledge of biodiversity is:
9. Because its interesting to learn more about a new idea such as biodiversity. 1 2 3 4 5
10. Because its a challenge to really understand how people interact with biodiversity. 1 2 3 4 5
11. Because providing the researchers with good data will help create better biodiversity
policies. 1 2 3 4 5
12. Because I want others to see that I am intelligent. 1 2 3 4 5
33. I found the workshop interesting?
Not interesting 1 – 2 – 3 – 4 – 5 Very interesting
34. I enjoyed the workshop
Not enjoyable 1 – 2 – 3 – 4 – 5 Very enjoyable
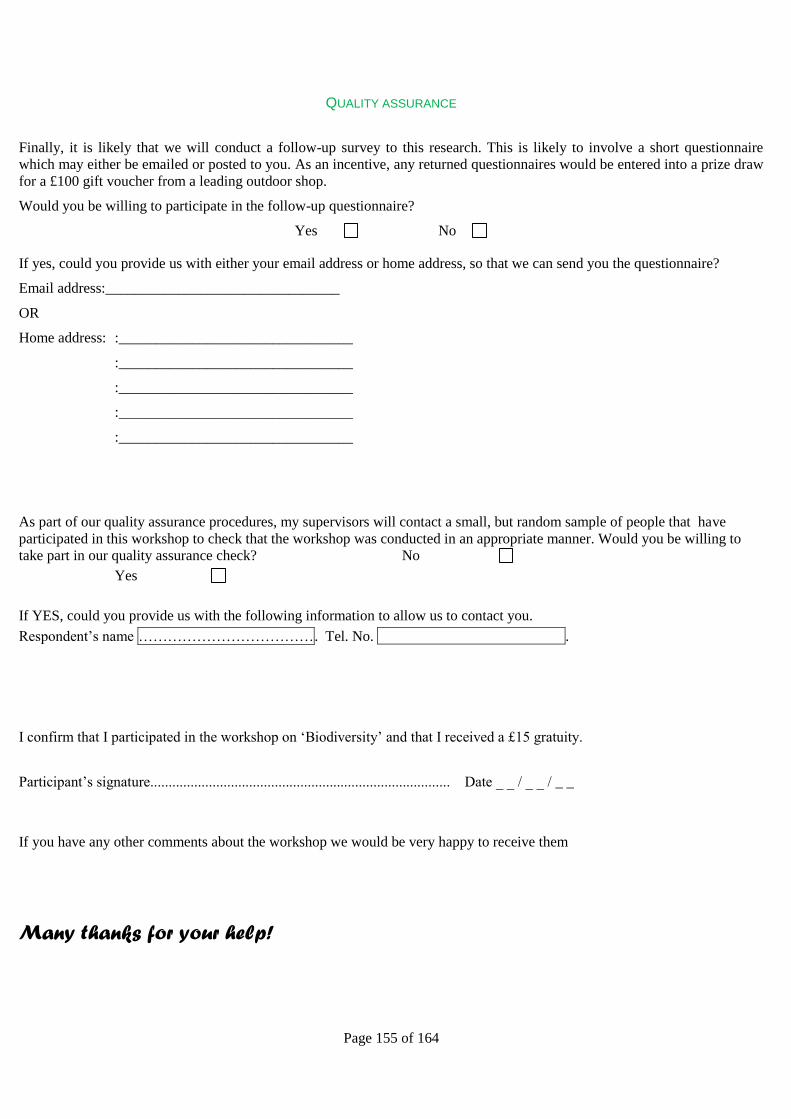
Page 155 of 164
QUALITY ASSURANCE
Finally, it is likely that we will conduct a follow-up survey to this research. This is likely to involve a short questionnaire
which may either be emailed or posted to you. As an incentive, any returned questionnaires would be entered into a prize draw
for a £100 gift voucher from a leading outdoor shop.
Would you be willing to participate in the follow-up questionnaire?
Yes No
If yes, could you provide us with either your email address or home address, so that we can send you the questionnaire?
Email address:________________________________
OR
Home address: :________________________________
:________________________________
:________________________________
:________________________________
:________________________________
As part of our quality assurance procedures, my supervisors will contact a small, but random sample of people that have
participated in this workshop to check that the workshop was conducted in an appropriate manner. Would you be willing to
take part in our quality assurance check? No
Yes
If YES, could you provide us with the following information to allow us to contact you.
Respondent’s name ………………………………. Tel. No. .
I confirm that I participated in the workshop on ‘Biodiversity’ and that I received a £15 gratuity.
Participant’s signature.................................................................................. Date _ _ / _ _ / _ _
If you have any other comments about the workshop we would be very happy to receive them
Many thanks for your help!
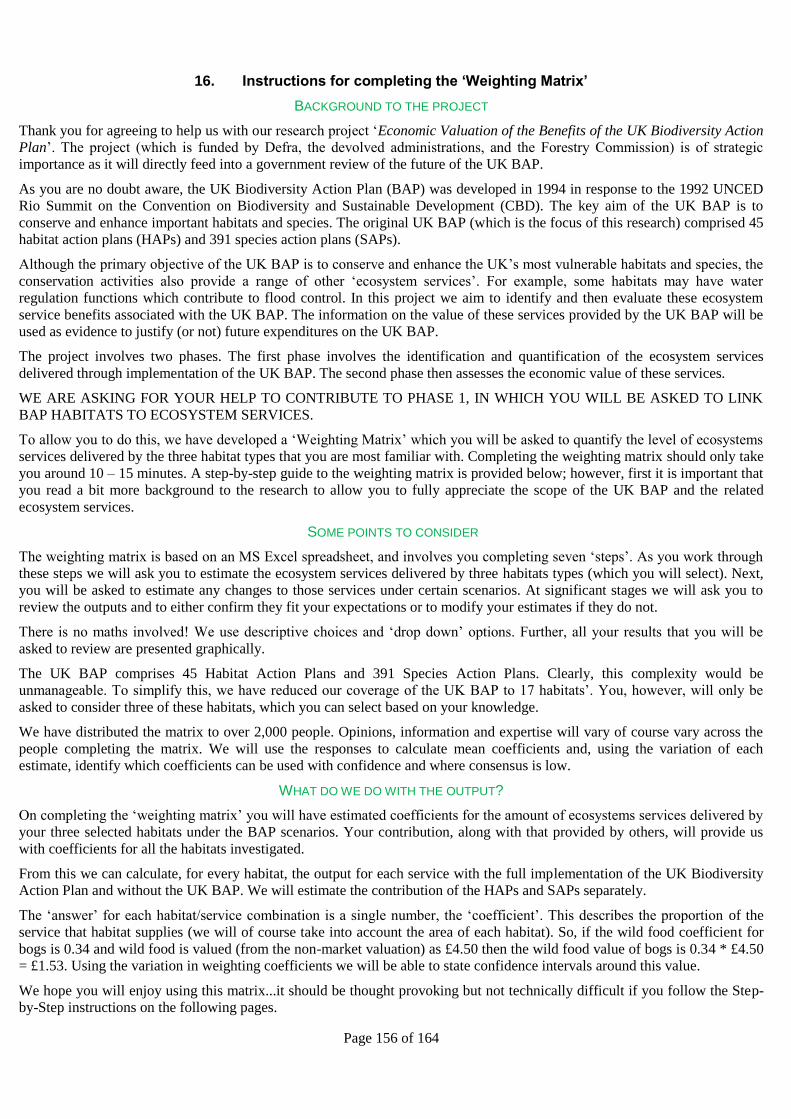
Page 156 of 164
16. Instructions for completing the ‘Weighting Matrix’
BACKGROUND TO THE PROJECT
Thank you for agreeing to help us with our research project ‘Economic Valuation of the Benefits of the UK Biodiversity Action
Plan’. The project (which is funded by Defra, the devolved administrations, and the Forestry Commission) is of strategic
importance as it will directly feed into a government review of the future of the UK BAP.
As you are no doubt aware, the UK Biodiversity Action Plan (BAP) was developed in 1994 in response to the 1992 UNCED
Rio Summit on the Convention on Biodiversity and Sustainable Development (CBD). The key aim of the UK BAP is to
conserve and enhance important habitats and species. The original UK BAP (which is the focus of this research) comprised 45
habitat action plans (HAPs) and 391 species action plans (SAPs).
Although the primary objective of the UK BAP is to conserve and enhance the UK’s most vulnerable habitats and species, the
conservation activities also provide a range of other ‘ecosystem services’. For example, some habitats may have water
regulation functions which contribute to flood control. In this project we aim to identify and then evaluate these ecosystem
service benefits associated with the UK BAP. The information on the value of these services provided by the UK BAP will be
used as evidence to justify (or not) future expenditures on the UK BAP.
The project involves two phases. The first phase involves the identification and quantification of the ecosystem services
delivered through implementation of the UK BAP. The second phase then assesses the economic value of these services.
WE ARE ASKING FOR YOUR HELP TO CONTRIBUTE TO PHASE 1, IN WHICH YOU WILL BE ASKED TO LINK
BAP HABITATS TO ECOSYSTEM SERVICES.
To allow you to do this, we have developed a ‘Weighting Matrix’ which you will be asked to quantify the level of ecosystems
services delivered by the three habitat types that you are most familiar with. Completing the weighting matrix should only take
you around 10 – 15 minutes. A step-by-step guide to the weighting matrix is provided below; however, first it is important that
you read a bit more background to the research to allow you to fully appreciate the scope of the UK BAP and the related
ecosystem services.
SOME POINTS TO CONSIDER
The weighting matrix is based on an MS Excel spreadsheet, and involves you completing seven ‘steps’. As you work through
these steps we will ask you to estimate the ecosystem services delivered by three habitats types (which you will select). Next,
you will be asked to estimate any changes to those services under certain scenarios. At significant stages we will ask you to
review the outputs and to either confirm they fit your expectations or to modify your estimates if they do not.
There is no maths involved! We use descriptive choices and ‘drop down’ options. Further, all your results that you will be
asked to review are presented graphically.
The UK BAP comprises 45 Habitat Action Plans and 391 Species Action Plans. Clearly, this complexity would be
unmanageable. To simplify this, we have reduced our coverage of the UK BAP to 17 habitats’. You, however, will only be
asked to consider three of these habitats, which you can select based on your knowledge.
We have distributed the matrix to over 2,000 people. Opinions, information and expertise will vary of course vary across the
people completing the matrix. We will use the responses to calculate mean coefficients and, using the variation of each
estimate, identify which coefficients can be used with confidence and where consensus is low.
WHAT DO WE DO WITH THE OUTPUT?
On completing the ‘weighting matrix’ you will have estimated coefficients for the amount of ecosystems services delivered by
your three selected habitats under the BAP scenarios. Your contribution, along with that provided by others, will provide us
with coefficients for all the habitats investigated.
From this we can calculate, for every habitat, the output for each service with the full implementation of the UK Biodiversity
Action Plan and without the UK BAP. We will estimate the contribution of the HAPs and SAPs separately.
The ‘answer’ for each habitat/service combination is a single number, the ‘coefficient’. This describes the proportion of the
service that habitat supplies (we will of course take into account the area of each habitat). So, if the wild food coefficient for
bogs is 0.34 and wild food is valued (from the non-market valuation) as £4.50 then the wild food value of bogs is 0.34 * £4.50
= £1.53. Using the variation in weighting coefficients we will be able to state confidence intervals around this value.
We hope you will enjoy using this matrix...it should be thought provoking but not technically difficult if you follow the Step-
by-Step instructions on the following pages.
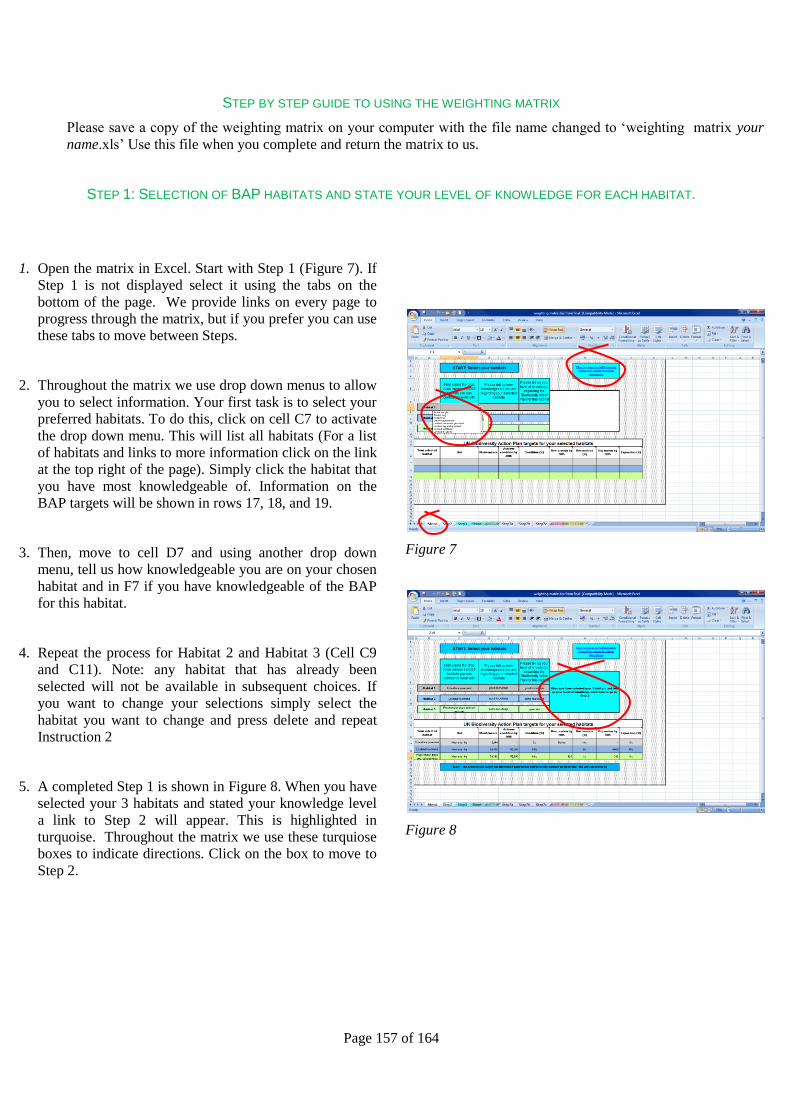
Page 157 of 164
STEP BY STEP GUIDE TO USING THE WEIGHTING MATRIX
Please save a copy of the weighting matrix on your computer with the file name changed to ‘weighting matrix your
name.xls’ Use this file when you complete and return the matrix to us.
STEP 1: SELECTION OF BAP HABITATS AND STATE YOUR LEVEL OF KNOWLEDGE FOR EACH HABITAT.
1. Open the matrix in Excel. Start with Step 1 (Figure 7). If
Step 1 is not displayed select it using the tabs on the
bottom of the page. We provide links on every page to
progress through the matrix, but if you prefer you can use
these tabs to move between Steps.
2. Throughout the matrix we use drop down menus to allow
you to select information. Your first task is to select your
preferred habitats. To do this, click on cell C7 to activate
the drop down menu. This will list all habitats (For a list
of habitats and links to more information click on the link
at the top right of the page). Simply click the habitat that
you have most knowledgeable of. Information on the
BAP targets will be shown in rows 17, 18, and 19.
3. Then, move to cell D7 and using another drop down
menu, tell us how knowledgeable you are on your chosen
habitat and in F7 if you have knowledgeable of the BAP
for this habitat.
4. Repeat the process for Habitat 2 and Habitat 3 (Cell C9
and C11). Note: any habitat that has already been
selected will not be available in subsequent choices. If
you want to change your selections simply select the
habitat you want to change and press delete and repeat
Instruction 2
5. A completed Step 1 is shown in Figure 8. When you have
selected your 3 habitats and stated your knowledge level
a link to Step 2 will appear. This is highlighted in
turquoise. Throughout the matrix we use these turquiose
boxes to indicate directions. Click on the box to move to
Step 2.
Figure 7
Figure 8
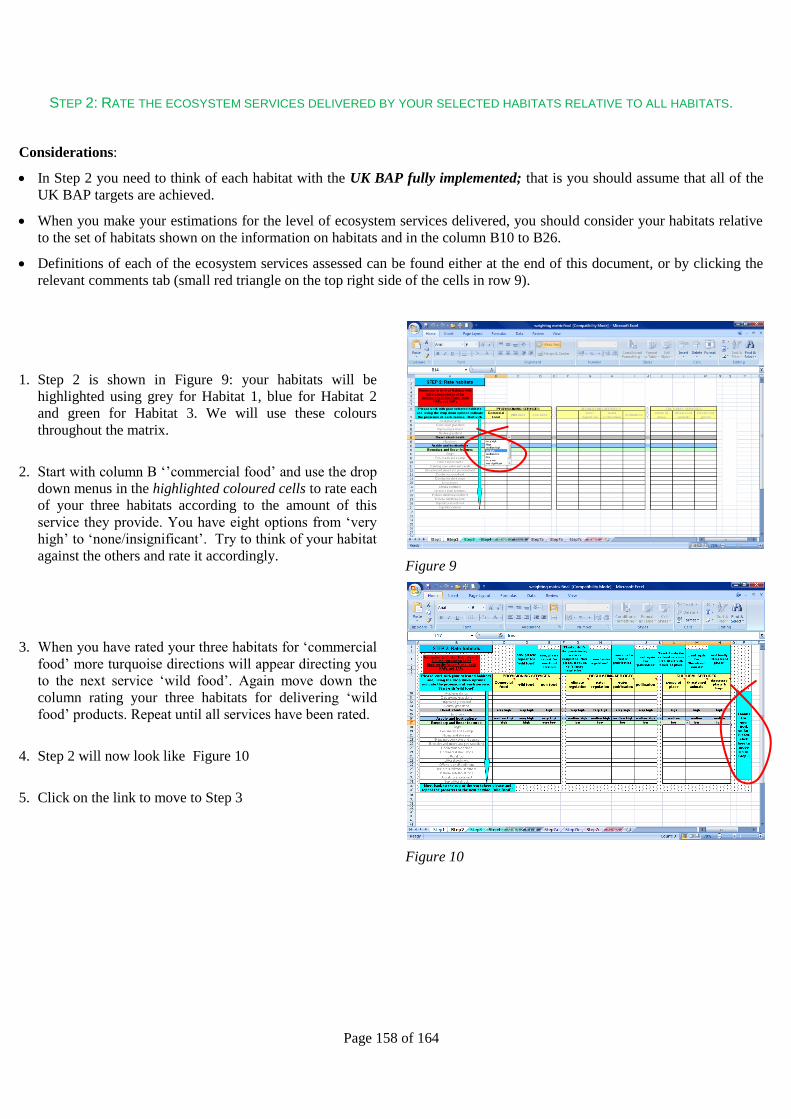
Page 158 of 164
STEP 2: RATE THE ECOSYSTEM SERVICES DELIVERED BY YOUR SELECTED HABITATS RELATIVE TO ALL HABITATS.
Considerations:
In Step 2 you need to think of each habitat with the UK BAP fully implemented; that is you should assume that all of the
UK BAP targets are achieved.
When you make your estimations for the level of ecosystem services delivered, you should consider your habitats relative
to the set of habitats shown on the information on habitats and in the column B10 to B26.
Definitions of each of the ecosystem services assessed can be found either at the end of this document, or by clicking the
relevant comments tab (small red triangle on the top right side of the cells in row 9).
1. Step 2 is shown in Figure 9: your habitats will be
highlighted using grey for Habitat 1, blue for Habitat 2
and green for Habitat 3. We will use these colours
throughout the matrix.
2. Start with column B ‘’commercial food’ and use the drop
down menus in the highlighted coloured cells to rate each
of your three habitats according to the amount of this
service they provide. You have eight options from ‘very
high’ to ‘none/insignificant’. Try to think of your habitat
against the others and rate it accordingly.
3. When you have rated your three habitats for ‘commercial
food’ more turquoise directions will appear directing you
to the next service ‘wild food’. Again move down the
column rating your three habitats for delivering ‘wild
food’ products. Repeat until all services have been rated.
4. Step 2 will now look like Figure 10
5. Click on the link to move to Step 3
Figure 9
Figure 10
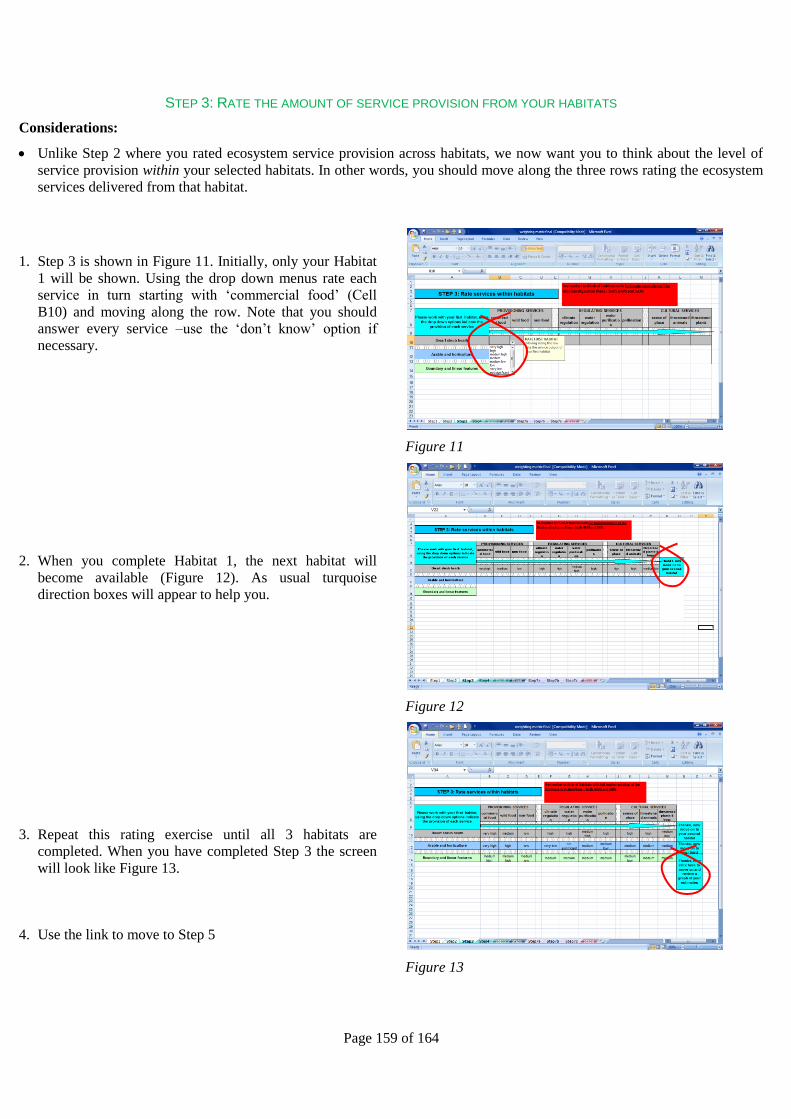
Page 159 of 164
STEP 3: RATE THE AMOUNT OF SERVICE PROVISION FROM YOUR HABITATS
Considerations:
Unlike Step 2 where you rated ecosystem service provision across habitats, we now want you to think about the level of
service provision within your selected habitats. In other words, you should move along the three rows rating the ecosystem
services delivered from that habitat.
1. Step 3 is shown in Figure 11. Initially, only your Habitat
1 will be shown. Using the drop down menus rate each
service in turn starting with ‘commercial food’ (Cell
B10) and moving along the row. Note that you should
answer every service –use the ‘don’t know’ option if
necessary.
2. When you complete Habitat 1, the next habitat will
become available (Figure 12). As usual turquoise
direction boxes will appear to help you.
3. Repeat this rating exercise until all 3 habitats are
completed. When you have completed Step 3 the screen
will look like Figure 13.
4. Use the link to move to Step 5
Figure 11
Figure 12
Figure 13
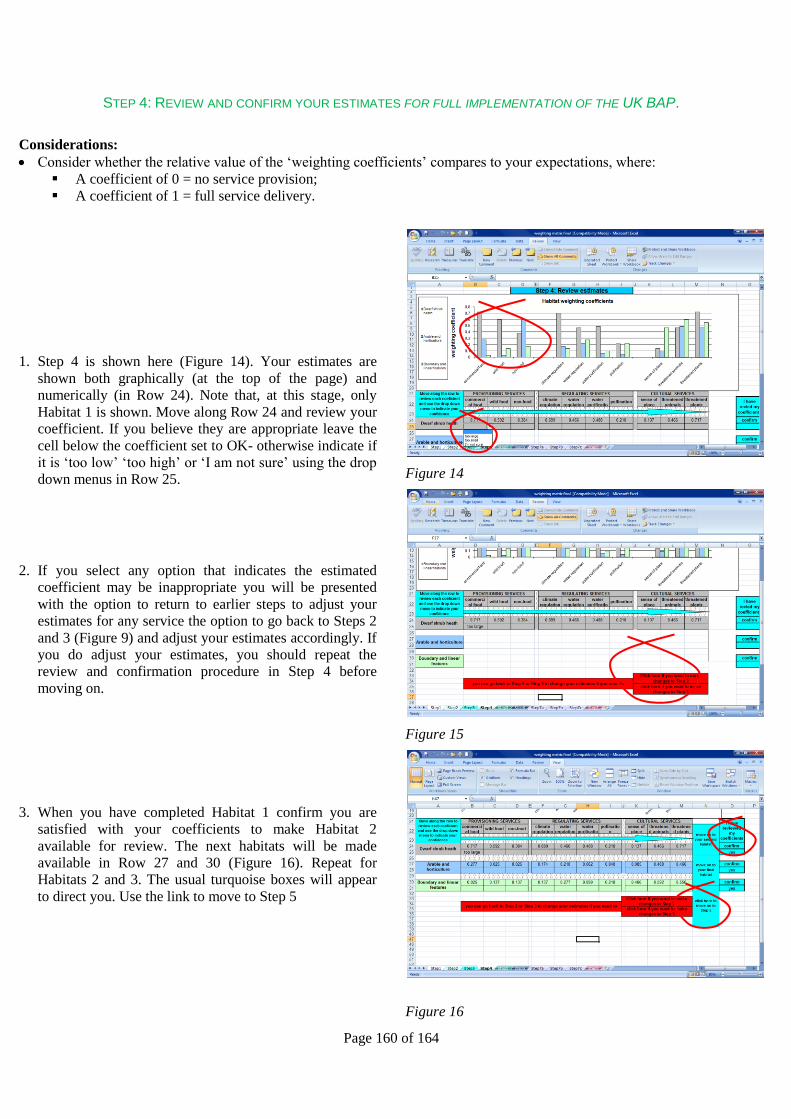
Page 160 of 164
STEP 4: REVIEW AND CONFIRM YOUR ESTIMATES FOR FULL IMPLEMENTATION OF THE UK BAP.
Considerations:
Consider whether the relative value of the ‘weighting coefficients’ compares to your expectations, where:
A coefficient of 0 = no service provision;
A coefficient of 1 = full service delivery.
1. Step 4 is shown here (Figure 14). Your estimates are
shown both graphically (at the top of the page) and
numerically (in Row 24). Note that, at this stage, only
Habitat 1 is shown. Move along Row 24 and review your
coefficient. If you believe they are appropriate leave the
cell below the coefficient set to OK- otherwise indicate if
it is ‘too low’ ‘too high’ or ‘I am not sure’ using the drop
down menus in Row 25.
2. If you select any option that indicates the estimated
coefficient may be inappropriate you will be presented
with the option to return to earlier steps to adjust your
estimates for any service the option to go back to Steps 2
and 3 (Figure 9) and adjust your estimates accordingly. If
you do adjust your estimates, you should repeat the
review and confirmation procedure in Step 4 before
moving on.
3. When you have completed Habitat 1 confirm you are
satisfied with your coefficients to make Habitat 2
available for review. The next habitats will be made
available in Row 27 and 30 (Figure 16). Repeat for
Habitats 2 and 3. The usual turquoise boxes will appear
to direct you. Use the link to move to Step 5
Figure 14
Figure 15
Figure 16
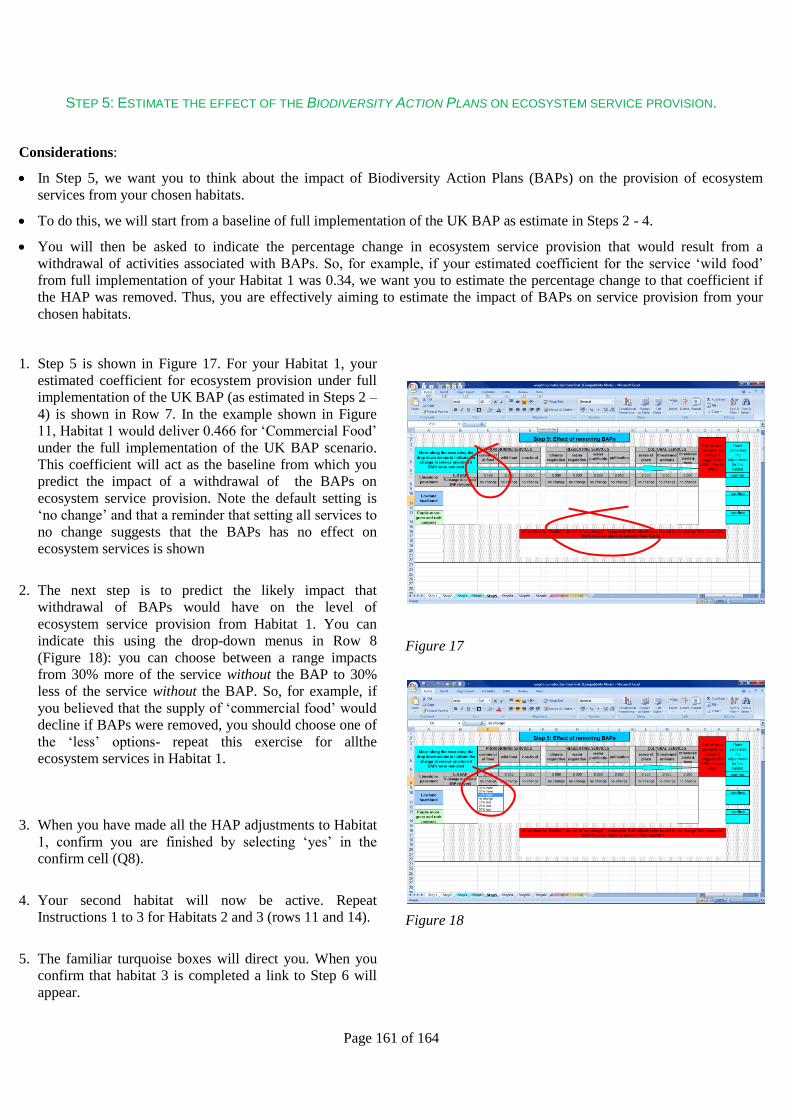
Page 161 of 164
STEP 5: ESTIMATE THE EFFECT OF THE BIODIVERSITY ACTION PLANS ON ECOSYSTEM SERVICE PROVISION.
Considerations:
In Step 5, we want you to think about the impact of Biodiversity Action Plans (BAPs) on the provision of ecosystem
services from your chosen habitats.
To do this, we will start from a baseline of full implementation of the UK BAP as estimate in Steps 2 - 4.
You will then be asked to indicate the percentage change in ecosystem service provision that would result from a
withdrawal of activities associated with BAPs. So, for example, if your estimated coefficient for the service ‘wild food’
from full implementation of your Habitat 1 was 0.34, we want you to estimate the percentage change to that coefficient if
the HAP was removed. Thus, you are effectively aiming to estimate the impact of BAPs on service provision from your
chosen habitats.
1. Step 5 is shown in Figure 17. For your Habitat 1, your
estimated coefficient for ecosystem provision under full
implementation of the UK BAP (as estimated in Steps 2 –
4) is shown in Row 7. In the example shown in Figure
11, Habitat 1 would deliver 0.466 for ‘Commercial Food’
under the full implementation of the UK BAP scenario.
This coefficient will act as the baseline from which you
predict the impact of a withdrawal of the BAPs on
ecosystem service provision. Note the default setting is
‘no change’ and that a reminder that setting all services to
no change suggests that the BAPs has no effect on
ecosystem services is shown
2. The next step is to predict the likely impact that
withdrawal of BAPs would have on the level of
ecosystem service provision from Habitat 1. You can
indicate this using the drop-down menus in Row 8
(Figure 18): you can choose between a range impacts
from 30% more of the service without the BAP to 30%
less of the service without the BAP. So, for example, if
you believed that the supply of ‘commercial food’ would
decline if BAPs were removed, you should choose one of
the ‘less’ options- repeat this exercise for allthe
ecosystem services in Habitat 1.
3. When you have made all the HAP adjustments to Habitat
1, confirm you are finished by selecting ‘yes’ in the
confirm cell (Q8).
4. Your second habitat will now be active. Repeat
Instructions 1 to 3 for Habitats 2 and 3 (rows 11 and 14).
5. The familiar turquoise boxes will direct you. When you
confirm that habitat 3 is completed a link to Step 6 will
appear.
Figure 17
Figure 18
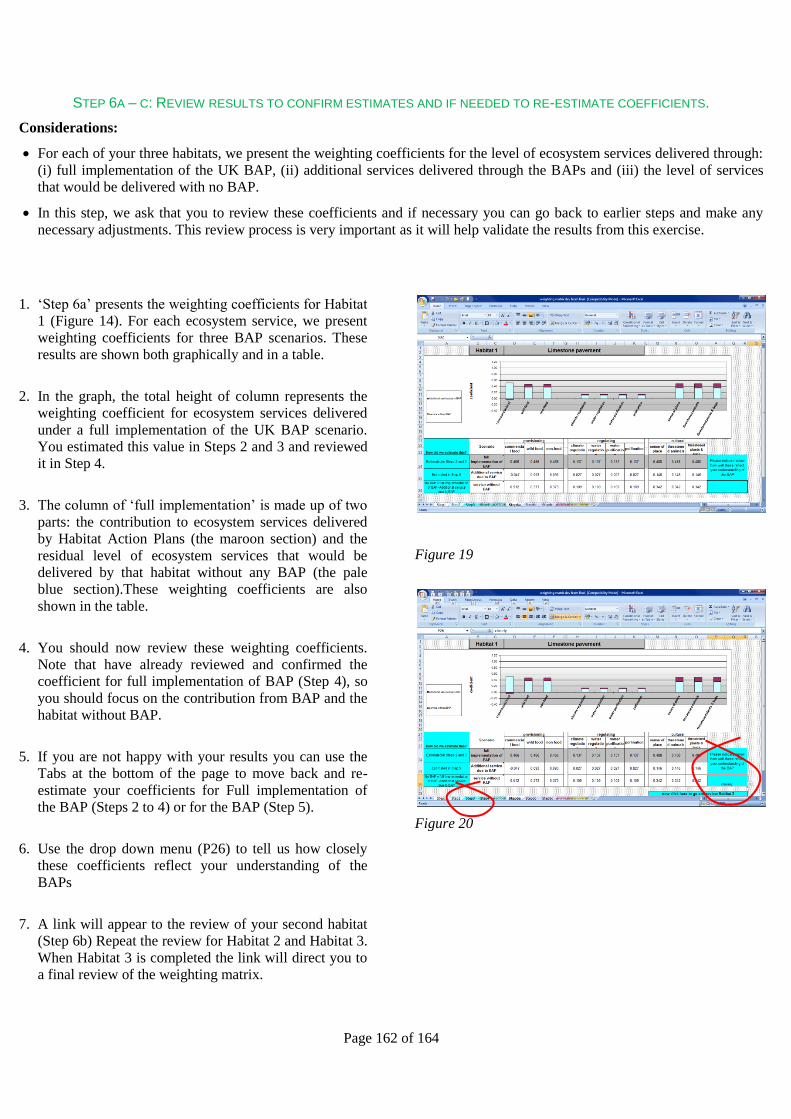
Page 162 of 164
STEP 6A – C: REVIEW RESULTS TO CONFIRM ESTIMATES AND IF NEEDED TO RE-ESTIMATE COEFFICIENTS.
Considerations:
For each of your three habitats, we present the weighting coefficients for the level of ecosystem services delivered through:
(i) full implementation of the UK BAP, (ii) additional services delivered through the BAPs and (iii) the level of services
that would be delivered with no BAP.
In this step, we ask that you to review these coefficients and if necessary you can go back to earlier steps and make any
necessary adjustments. This review process is very important as it will help validate the results from this exercise.
1. ‘Step 6a’ presents the weighting coefficients for Habitat
1 (Figure 14). For each ecosystem service, we present
weighting coefficients for three BAP scenarios. These
results are shown both graphically and in a table.
2. In the graph, the total height of column represents the
weighting coefficient for ecosystem services delivered
under a full implementation of the UK BAP scenario.
You estimated this value in Steps 2 and 3 and reviewed
it in Step 4.
3. The column of ‘full implementation’ is made up of two
parts: the contribution to ecosystem services delivered
by Habitat Action Plans (the maroon section) and the
residual level of ecosystem services that would be
delivered by that habitat without any BAP (the pale
blue section).These weighting coefficients are also
shown in the table.
4. You should now review these weighting coefficients.
Note that have already reviewed and confirmed the
coefficient for full implementation of BAP (Step 4), so
you should focus on the contribution from BAP and the
habitat without BAP.
5. If you are not happy with your results you can use the
Tabs at the bottom of the page to move back and re-
estimate your coefficients for Full implementation of
the BAP (Steps 2 to 4) or for the BAP (Step 5).
6. Use the drop down menu (P26) to tell us how closely
these coefficients reflect your understanding of the
BAPs
7. A link will appear to the review of your second habitat
(Step 6b) Repeat the review for Habitat 2 and Habitat 3.
When Habitat 3 is completed the link will direct you to
a final review of the weighting matrix.
Figure 19
Figure 20
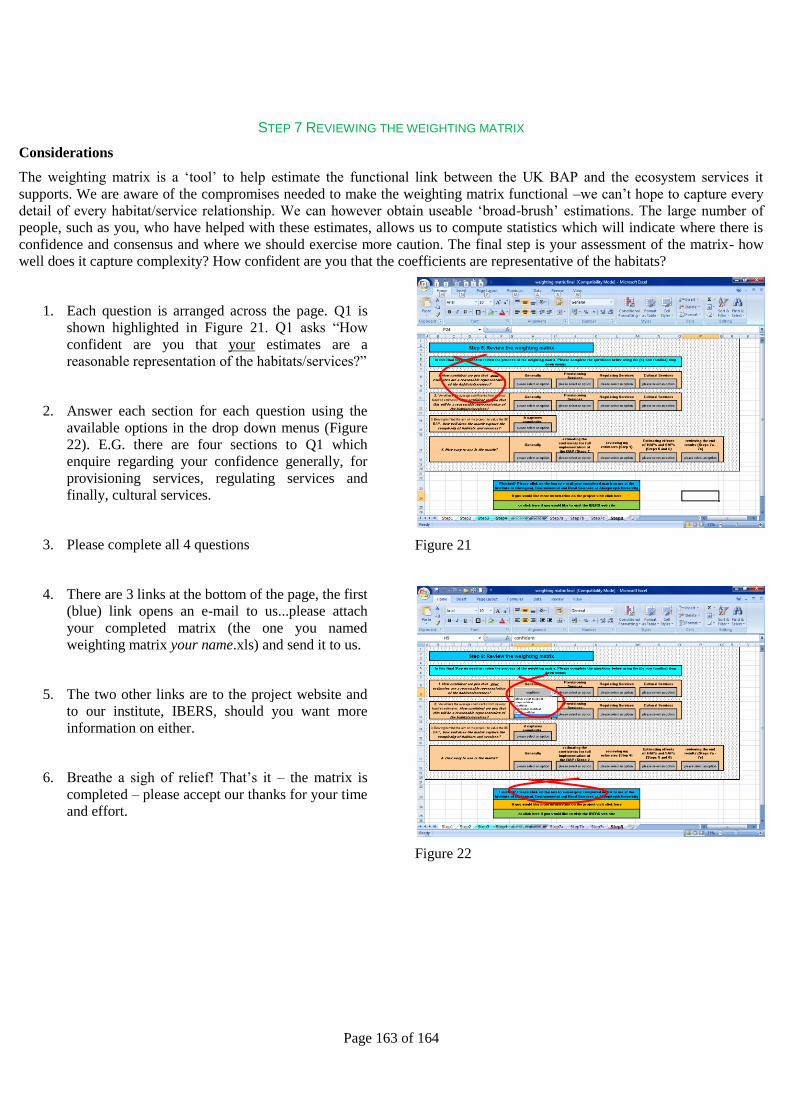
Page 163 of 164
STEP 7 REVIEWING THE WEIGHTING MATRIX
Considerations
The weighting matrix is a ‘tool’ to help estimate the functional link between the UK BAP and the ecosystem services it
supports. We are aware of the compromises needed to make the weighting matrix functional –we can’t hope to capture every
detail of every habitat/service relationship. We can however obtain useable ‘broad-brush’ estimations. The large number of
people, such as you, who have helped with these estimates, allows us to compute statistics which will indicate where there is
confidence and consensus and where we should exercise more caution. The final step is your assessment of the matrix- how
well does it capture complexity? How confident are you that the coefficients are representative of the habitats?
1. Each question is arranged across the page. Q1 is
shown highlighted in Figure 21. Q1 asks “How
confident are you that your estimates are a
reasonable representation of the habitats/services?”
2. Answer each section for each question using the
available options in the drop down menus (Figure
22). E.G. there are four sections to Q1 which
enquire regarding your confidence generally, for
provisioning services, regulating services and
finally, cultural services.
3. Please complete all 4 questions
4. There are 3 links at the bottom of the page, the first
(blue) link opens an e-mail to us...please attach
your completed matrix (the one you named
weighting matrix your name.xls) and send it to us.
5. The two other links are to the project website and
to our institute, IBERS, should you want more
information on either.
6. Breathe a sigh of relief! That’s it – the matrix is
completed – please accept our thanks for your time
and effort.
Figure 21
Figure 22

Page 164 of 164