Embed Size (px)
Citation preview

Marianne VestergaardDark Cosmology Centre, Copenhagen
First Galaxies, Quasars, and GRBs, June 8 2010First Galaxies, Quasars, and GRBs, June 8 2010
Determining Black Hole Masses in Distant Quasars
Collaborators: M. Bentz, S. Collin, K. Denney, X. Fan, C. Grier, L. Jiang, T. Kawaguchi, B. Kelly, P.S. Osmer, B.M. Peterson, G. Richards, C.T. Tremonti
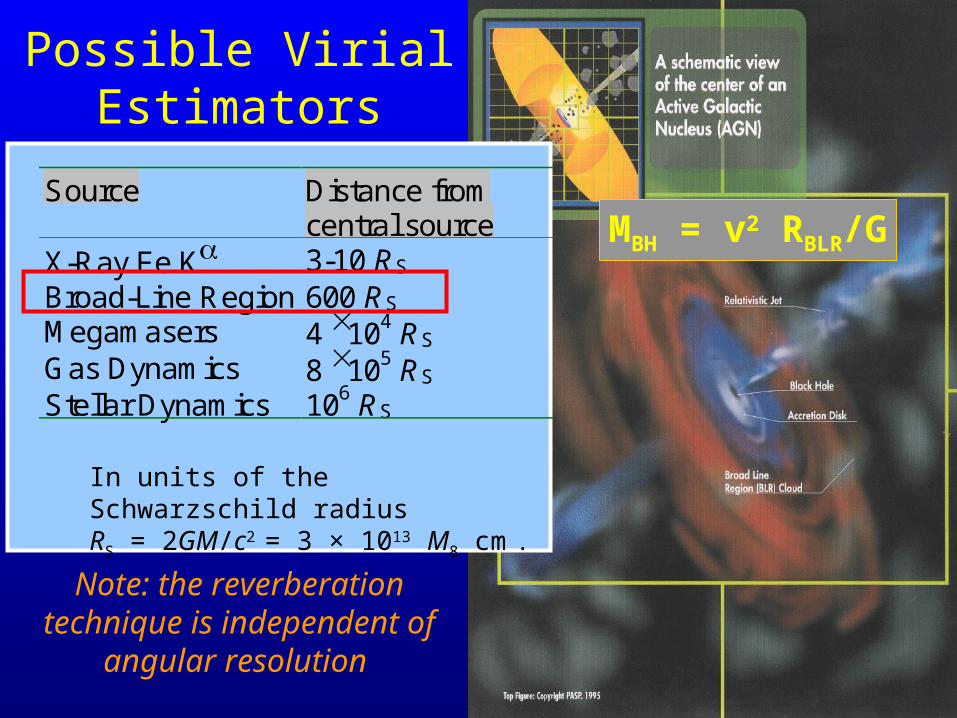
Possible Virial Estimators
Source Distance from central source
X-Ray Fe K 3-10 RS
Broad-Line Region 600 RS Megamasers 4 104 RS Gas Dynamics 8 105 RS Stellar Dynamics 106 RS
In units of the Schwarzschild radius RS = 2GM/c2 = 3 × 10¹³ M8 cm .
Note: the reverberation technique is independent of
angular resolution
MBH = v2 RBLR/G
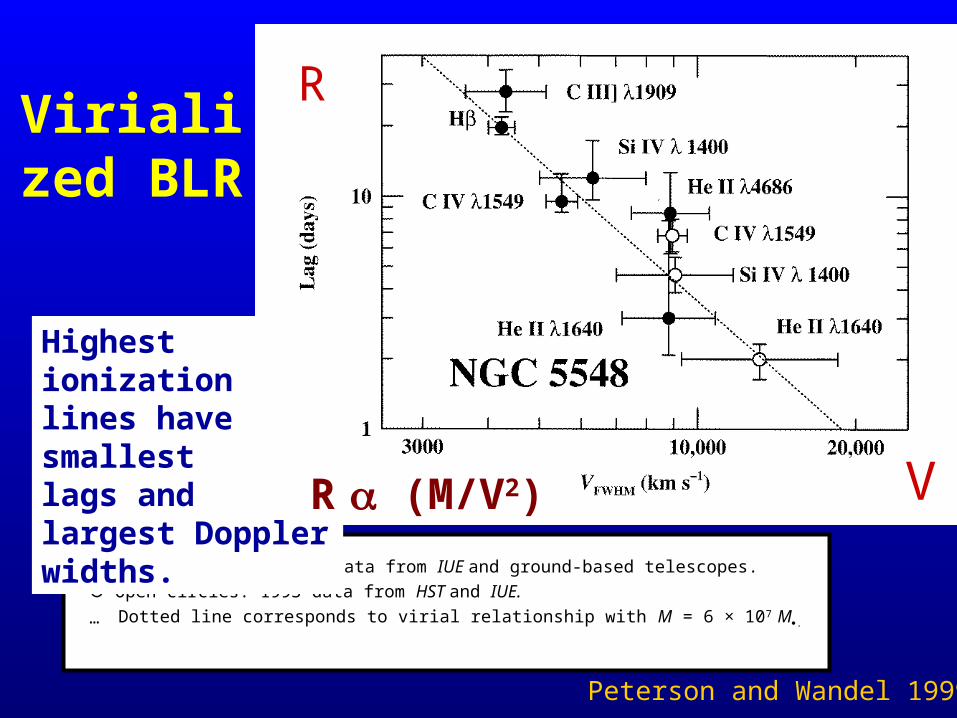
Virialized BLR
Filled circles: 1989 data from IUE and ground-based telescopes. Open circles: 1993 data from HST and IUE.
… Dotted line corresponds to virial relationship with M = 6 × 10⁷ M.
Highest ionizationlines have smallestlags and largest Doppler widths.
Peterson and Wandel 1999
R (M/V2)
R
V
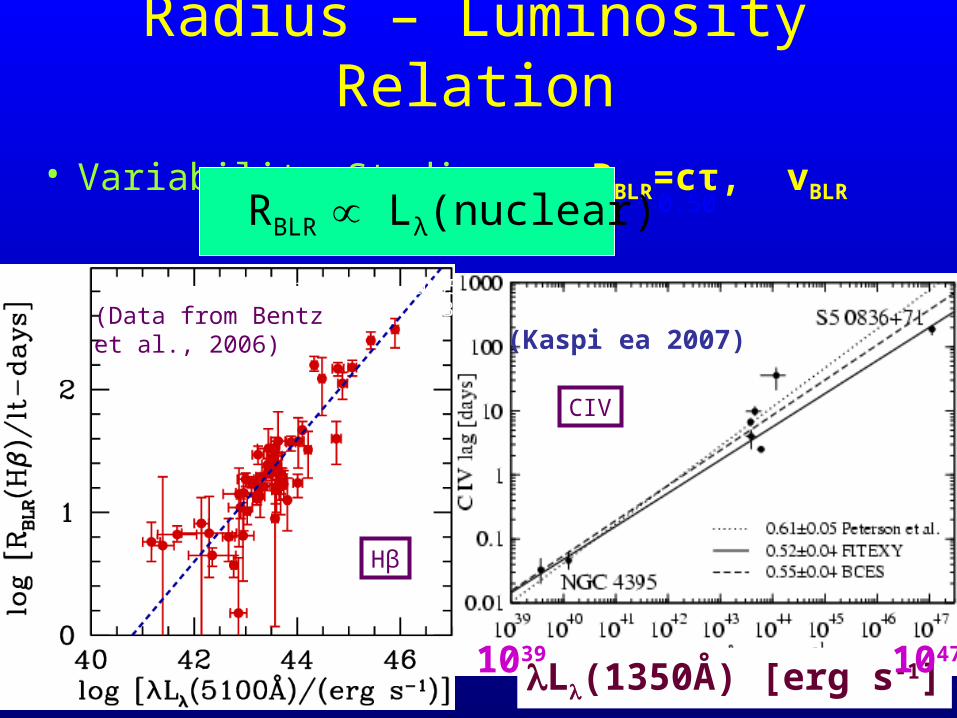
Radius – Luminosity Relation
• Variability Studies: RBLR=cτ, vBLR
(Kaspi et al.
2005; Bentz et al. 2006, 2009)
RBLR Lλ(nuclear)0.50
(Data from Bentz et al., 2006)
L(1350Å) [erg s-1]
(Kaspi ea 2007)
1039 1047
Hβ
CIV
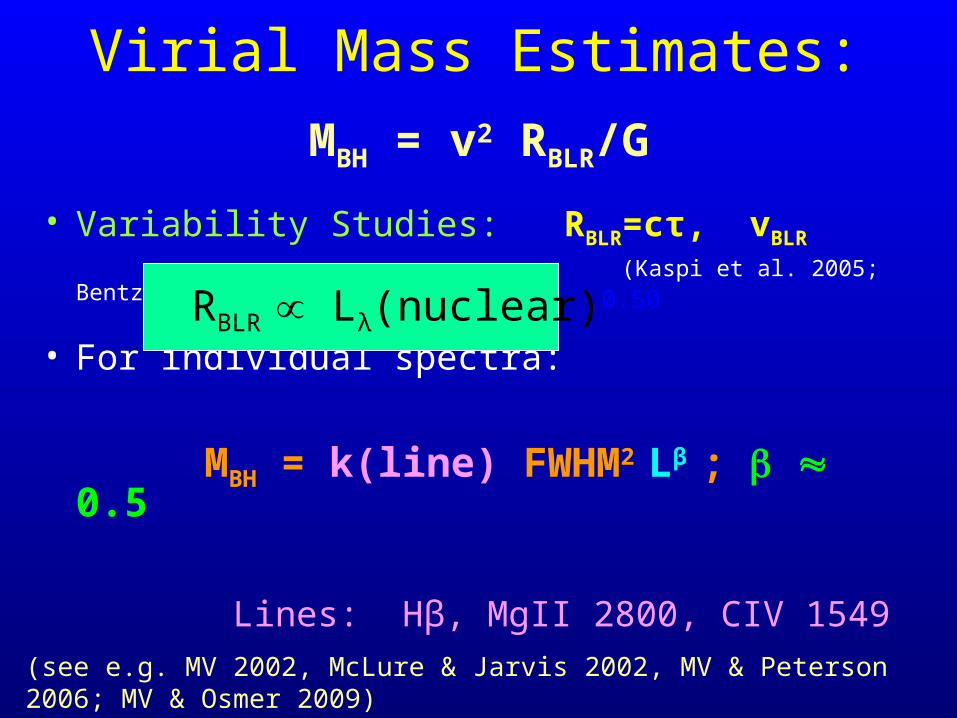
Virial Mass Estimates:
MBH = v2 RBLR/G
• Variability Studies: RBLR=cτ, vBLR
(Kaspi et al.
2005; Bentz et al. 2006, 2009)
• For individual spectra:
MBH = k(line) FWHM2 Lβ ; 0.5
Lines: Hβ, MgII 2800, CIV 1549
RBLR Lλ(nuclear)0.50
(see e.g. MV 2002, McLure & Jarvis 2002, MV & Peterson 2006; MV & Osmer 2009)
Mergs/s10
)2100(λL
km/s10
FWHM(MgII)106.2M
0.50
44λ
2
36
BH
M ergs/s10
)5100(λL
km/s10
β) FWHM(H108.3M
0.50
44λ
2
36
BH
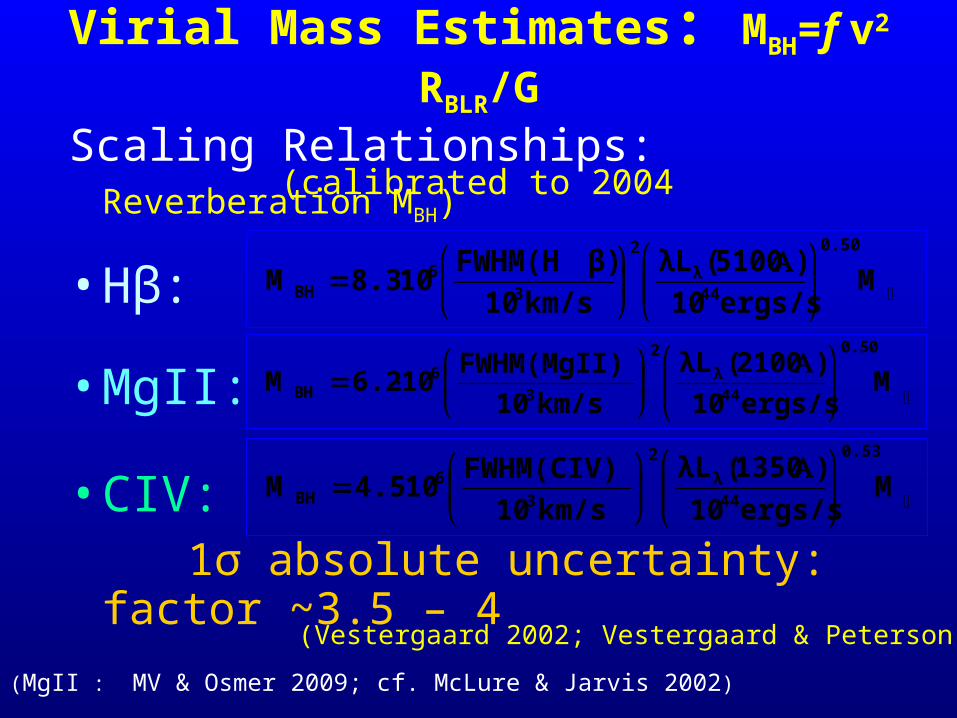
Scaling Relationships: (calibrated to 2004 Reverberation MBH)
• Hβ:
• MgII:
• CIV: 1σ absolute uncertainty: factor ~3.5 – 4
Virial Mass Estimates: MBH=f v2 RBLR/G
Mergs/s10
)1350(λL
km/s10
FWHM(CIV)104.5M
0.53
44λ
2
36
BH
(MgII : MV & Osmer 2009; cf. McLure & Jarvis 2002)
(Vestergaard 2002; Vestergaard & Peterson 2006)
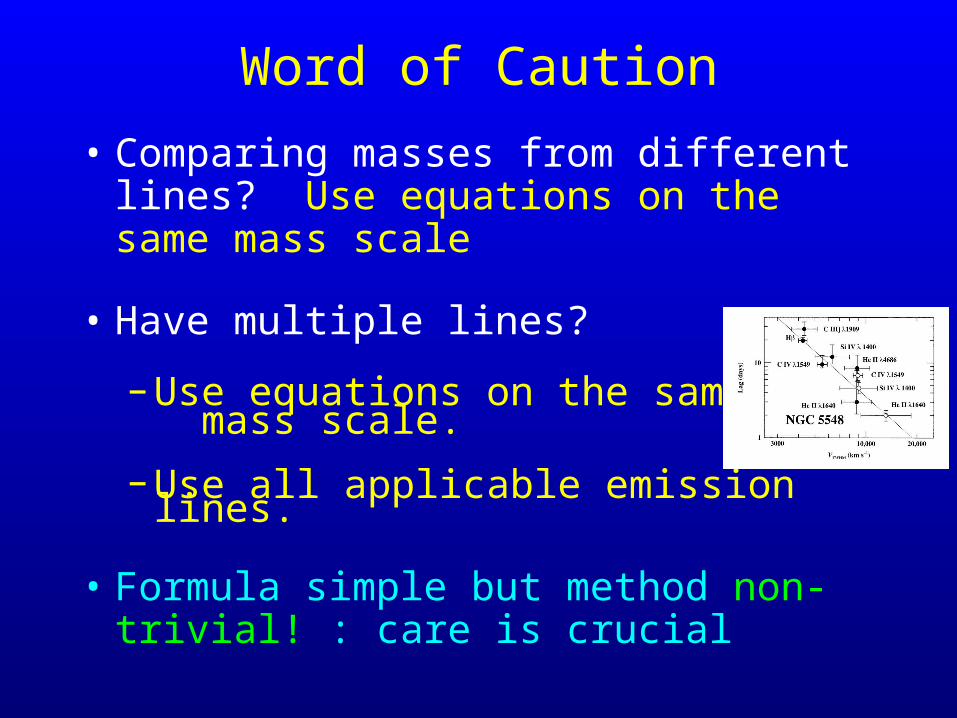
Word of Caution
• Comparing masses from different lines? Use equations on the same mass scale
• Have multiple lines?
– Use equations on the same mass scale.
– Use all applicable emission lines.
• Formula simple but method non-trivial! : care is crucial
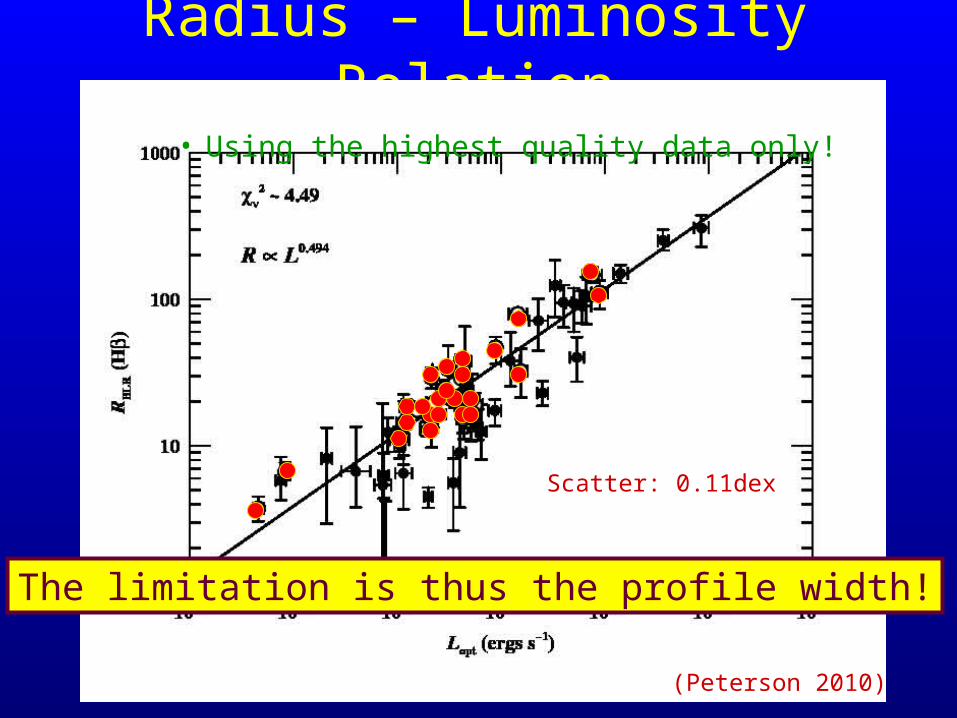
Radius – Luminosity Relation
RBLR Lλ(nuclear)0.50
• Using the highest quality data only!
Scatter: 0.11dex
(Peterson 2010)
The limitation is thus the profile width!

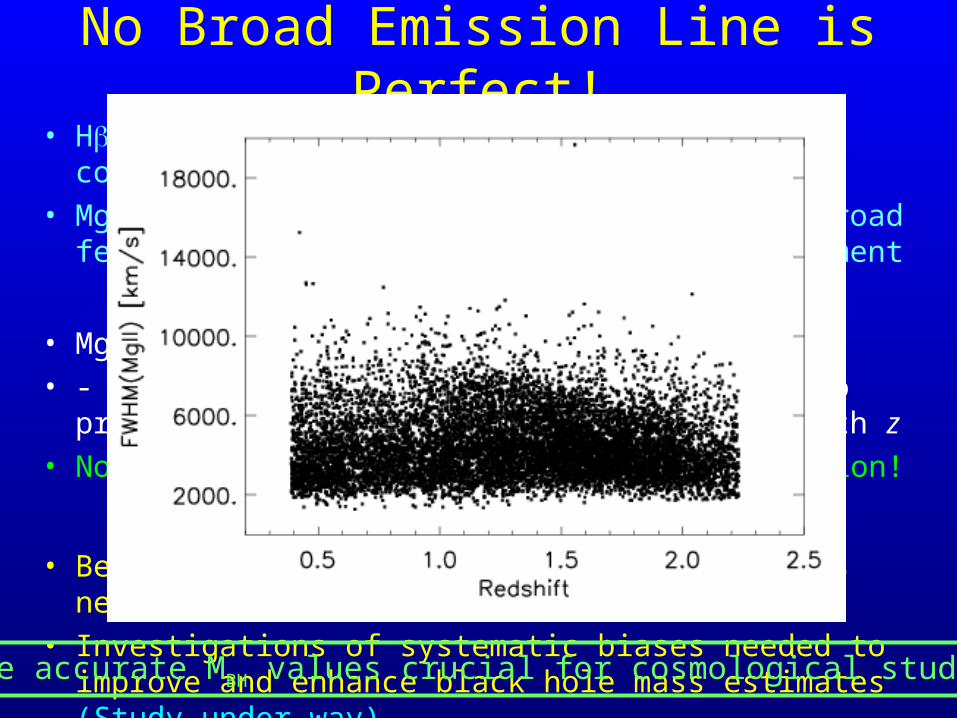
No Broad Emission Line is Perfect!• H and MgII FWHM are not always the same –
contrary to common claims
SDSS DR3

No Broad Emission Line is Perfect!• H and MgII FWHM are not always the same –
contrary to common claims• MgII is strongly contaminated by strong, broad
features of FeII, complicating its measurement
(Vestergaard & Wilkes 2001)
Half the MgII line flux is submerged in FeII emission
No Broad Emission Line is Perfect!• H and MgII FWHM are not always the same –
contrary to common claims• MgII is strongly contaminated by strong, broad
features of FeII, complicating its measurement
• MgII and CIV FWHM often deviate• - but cause is unclear: MgII is likely also
problematic due to systematic narrowing with z• Note: CIV is prone to strong broad absorption!
• Better understanding of profile differences needed• Investigations of systematic biases needed to
improve and enhance black hole mass estimates (Study under way)
More accurate MBH values crucial for cosmological studies!
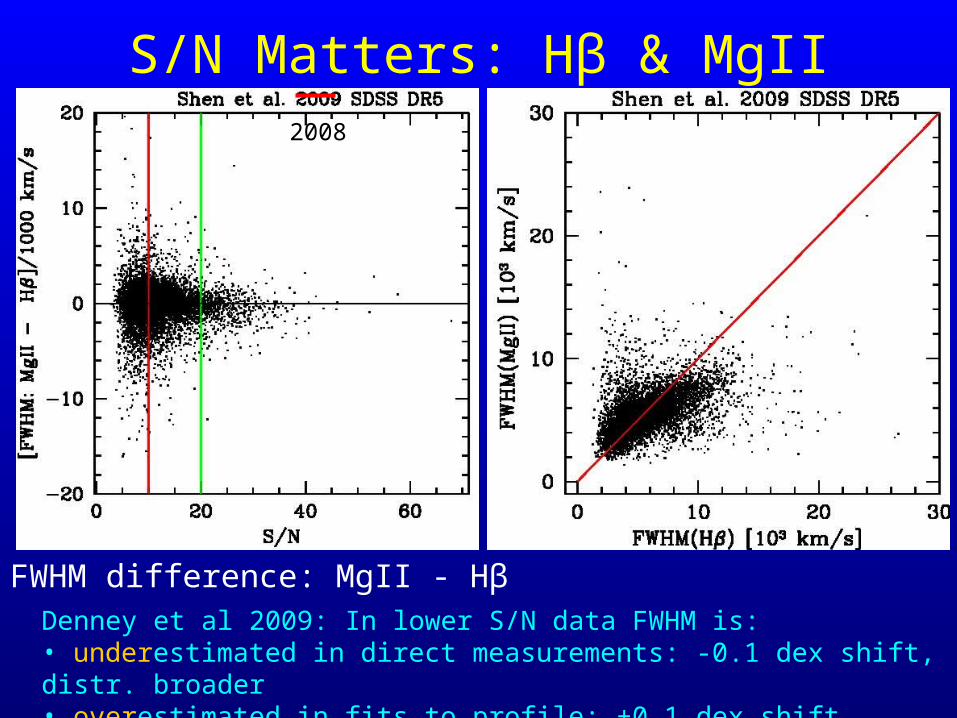
S/N Matters: Hβ & MgII
FWHM difference: MgII - HβDenney et al 2009: In lower S/N data FWHM is:• underestimated in direct measurements: -0.1 dex shift, distr. broader• overestimated in fits to profile: +0.1 dex shift, distribution broadens
2008
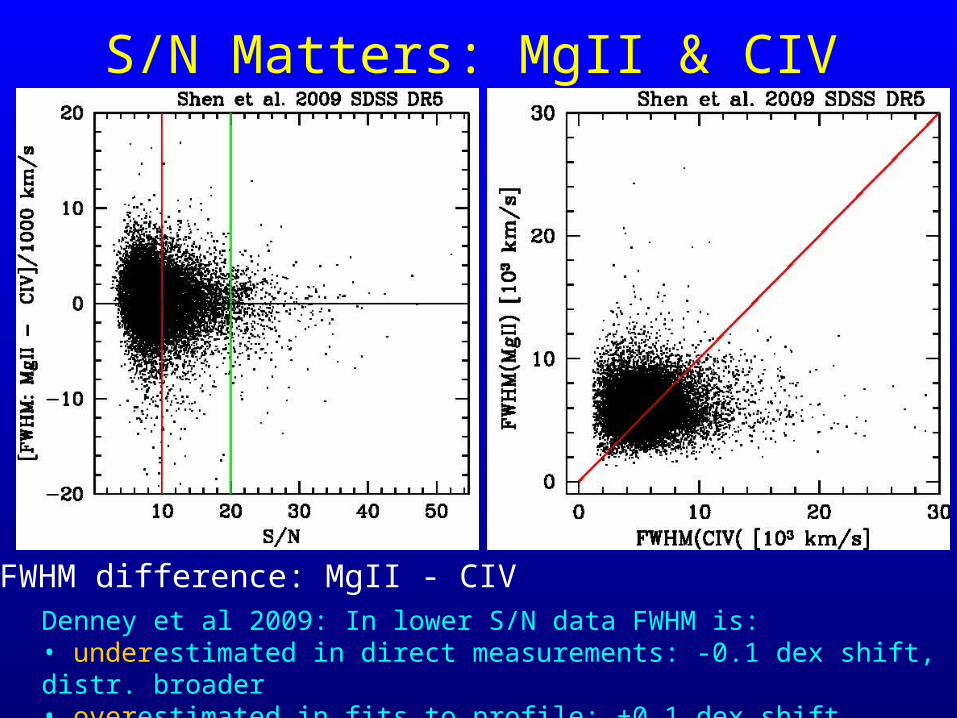
S/N Matters: MgII & CIV
FWHM difference: MgII - CIVDenney et al 2009: In lower S/N data FWHM is:• underestimated in direct measurements: -0.1 dex shift, distr. broader• overestimated in fits to profile: +0.1 dex shift, distribution broadens
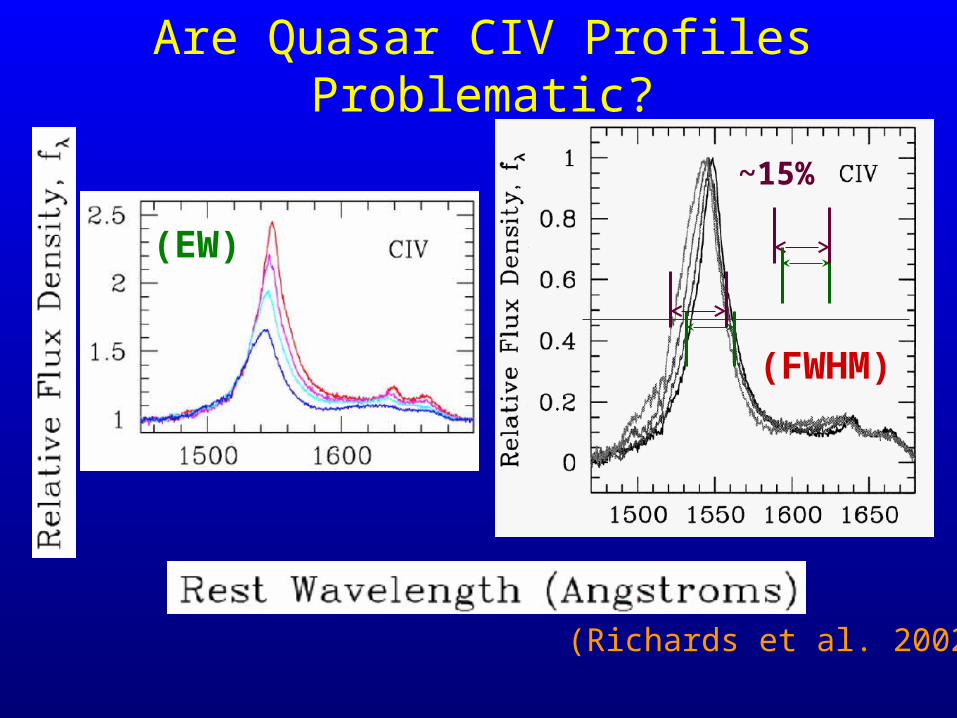
Are Quasar CIV Profiles Problematic?
(EW)
(FWHM)
(Richards et al. 2002)
~15%
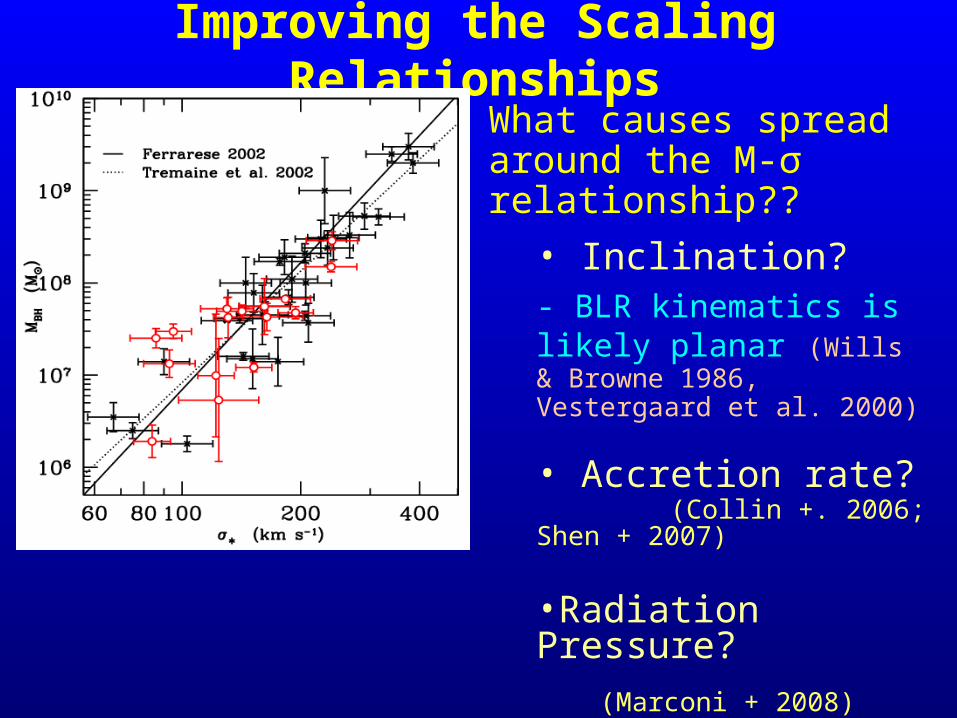
Improving the Scaling Relationships
What causes spread around the M-σ relationship??
• Inclination?- BLR kinematics is likely planar (Wills & Browne 1986, Vestergaard et al. 2000)
• Accretion rate? (Collin +. 2006; Shen + 2007)
•Radiation Pressure? (Marconi + 2008)

Masses of Distant Quasars
• Ceilings at MBH ≈ 1010 M LBOL < 1048
ergs/s
• MBH ≈ 109 M - even beyond space density drop at z ≈ 3
(DR3 Qcat: Schneider et al. 2005)(DR3 Qcat: Schneider et al. 2005) (MV et al. in prep)
Hβ
MgII
CIV
SDSS DR3: ~41,000 QSOs
Kurk et al. 2007; Jiang et al. 2007, 2010
z~6
• BQS: 10 700 sq. deg; B16.16mag
• LBQS: 454 sq. deg; 16.0BJ18.85mag
• SDSS: 182 sq. deg; i* 20mag
• DR3: 1622 sq. deg.; i* >15, 19.1, 20.2
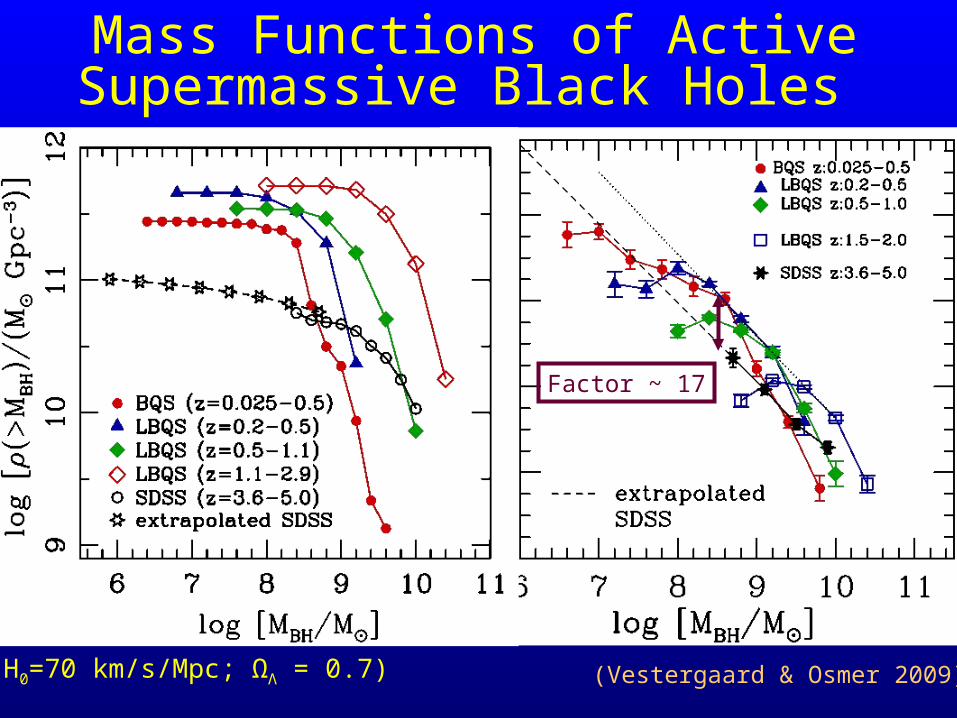
(H0=70 km/s/Mpc; ΩΛ = 0.7)
Mass Functions of Active Supermassive Black Holes
Factor ~ 17
(Vestergaard & Osmer 2009)
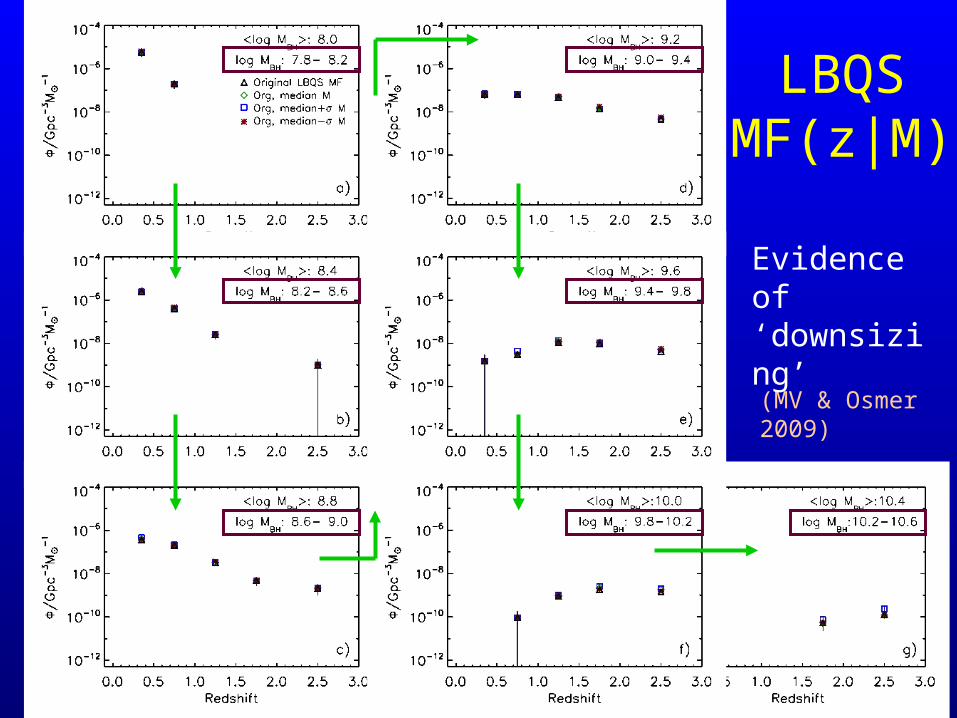
LBQS MF(z|M)
(MV & Osmer 2009)
Evidence of ‘downsizing’
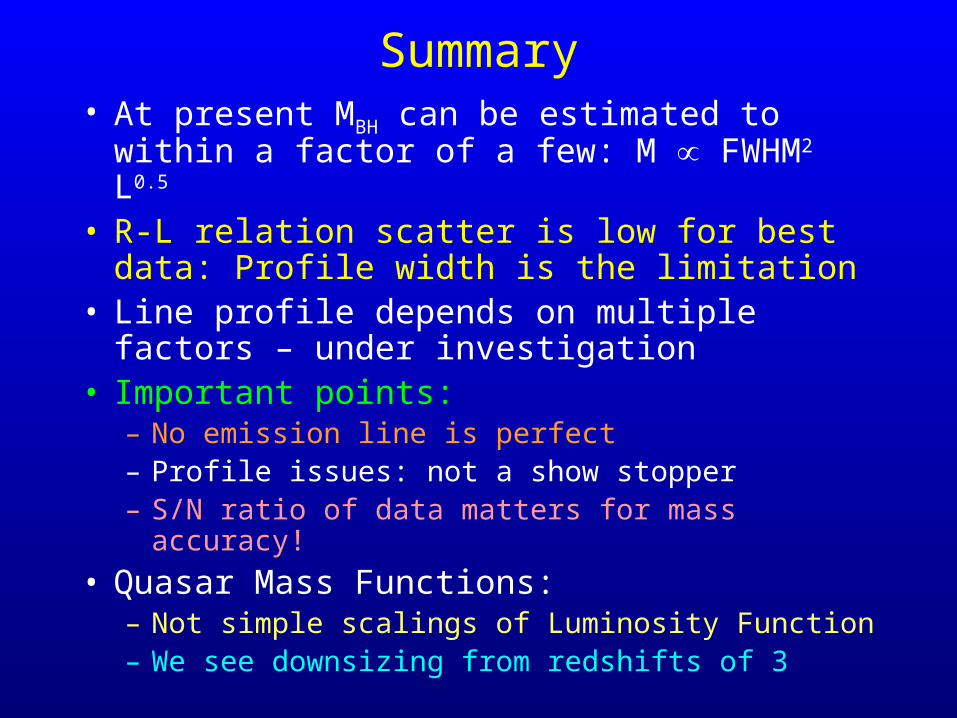
Summary• At present MBH can be estimated to
within a factor of a few: M FWHM2 L0.5
• R-L relation scatter is low for best data: Profile width is the limitation
• Line profile depends on multiple factors – under investigation
• Important points:– No emission line is perfect– Profile issues: not a show stopper– S/N ratio of data matters for mass accuracy!
• Quasar Mass Functions:– Not simple scalings of Luminosity Function– We see downsizing from redshifts of 3

Luminosity Functions of Active Supermassive Black Holes
DR3: 1622 sq. deg.; i* >15, 19.1, 20.2 (Richards et al. 2006)
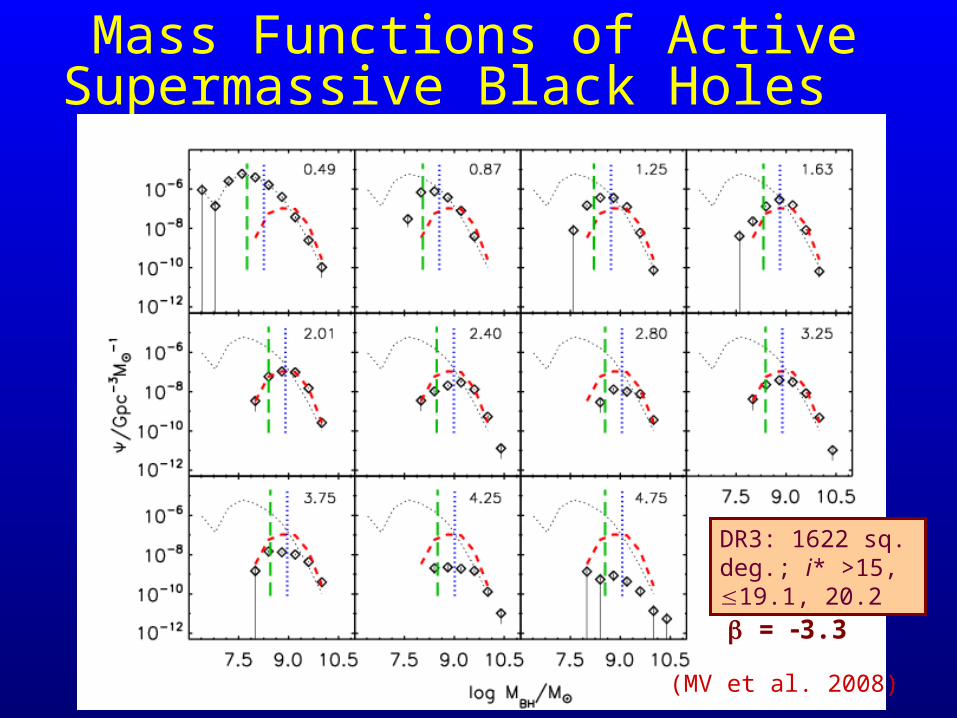
Mass Functions of Active Supermassive Black Holes
DR3: 1622 sq. deg.; i* >15, 19.1, 20.2
(MV et al. 2008)
= 3.3

Summary• At present MBH can be estimated to
within a factor of a few: M FWHM2 L0.5
• R-L relation scatter is low for best data: Profile width is the limitation
• Line profile depends on multiple factors – under investigation
• Important points:– No emission line is perfect– Profile issues: not a show stopper– S/N ratio of data matters for mass accuracy!
• Quasar Mass Functions:– Not simple scalings of Luminosity Function– We see downsizing from redshifts of 3
Extra Slides

Virial Relationships
(Peterson & Wandel 1999, 2000; Onken & Peterson 2002)
Emission lines:SiIV1400, CIV1549, HeII1640, CIII]1909, H4861, HeII4686
•All 4 testable AGNs comply:– NGC 7469: 1.2 107 M
– NGC 3783: 3.0 107 M
– NGC 5548: 6.7 107 M
– 3C 390.3: 2.9 108 M
• R-L relation extends to high-z and high luminosity quasars:– spectra similar (Dietrich
ea 2002)
– luminosities are not extreme
(Dietrich et al 2002)
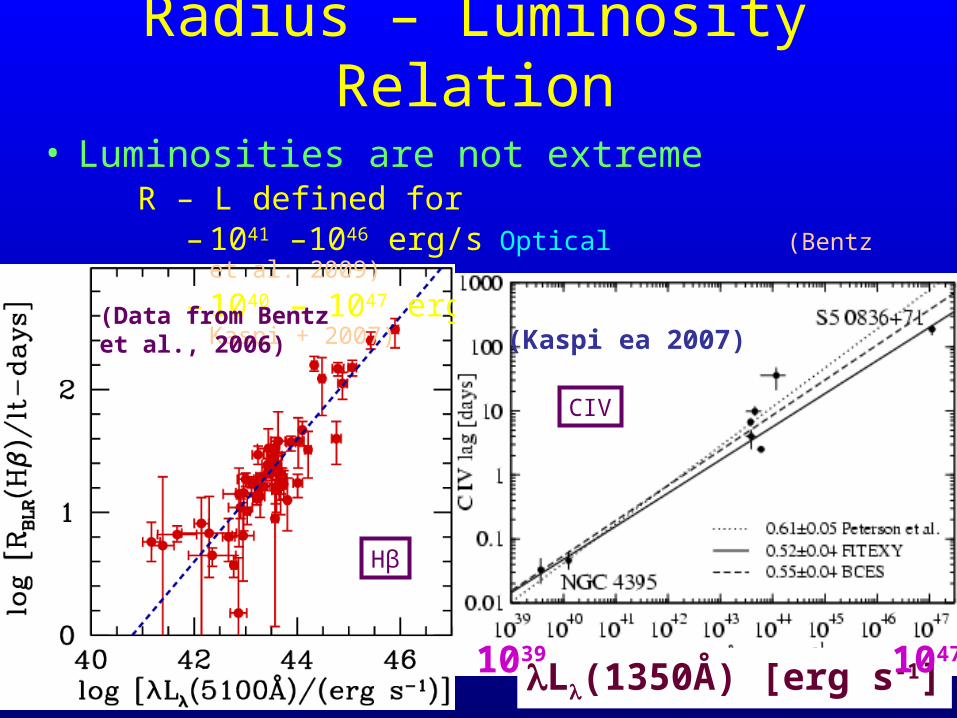
Radius – Luminosity Relation
• Luminosities are not extremeR – L defined for
– 1041 –1046 erg/s Optical (Bentz et al. 2009)
– 1040 – 1047 erg/s UV (Peterson + 2005; Kaspi + 2007)
– (Data from Bentz et al., 2006)
L(1350Å) [erg s-1]
(Kaspi ea 2007)
1039 1047
Hβ
CIV
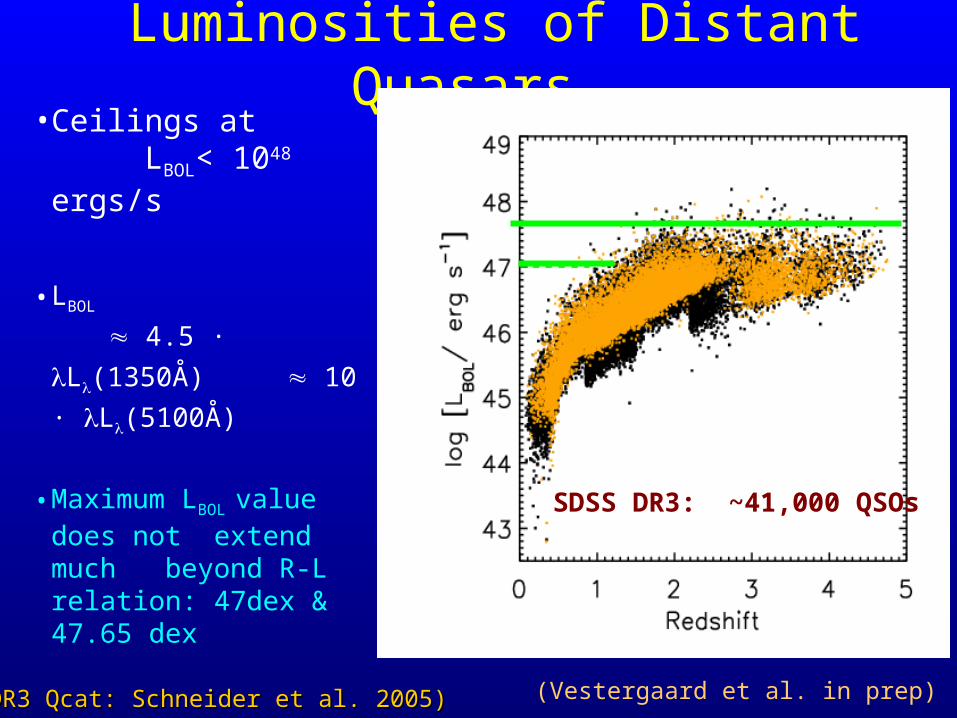
Luminosities of Distant Quasars
• Ceilings at LBOL< 1048 ergs/s
• LBOL
4.5 · L(1350Å)
10 · L(5100Å)
• Maximum LBOL value does not extend much beyond R-L relation: 47dex & 47.65 dex
(DR3 Qcat: Schneider et al. 2005)(DR3 Qcat: Schneider et al. 2005) (Vestergaard et al. in prep)
Hβ
MgII
CIV
SDSS DR3: ~41,000 QSOs
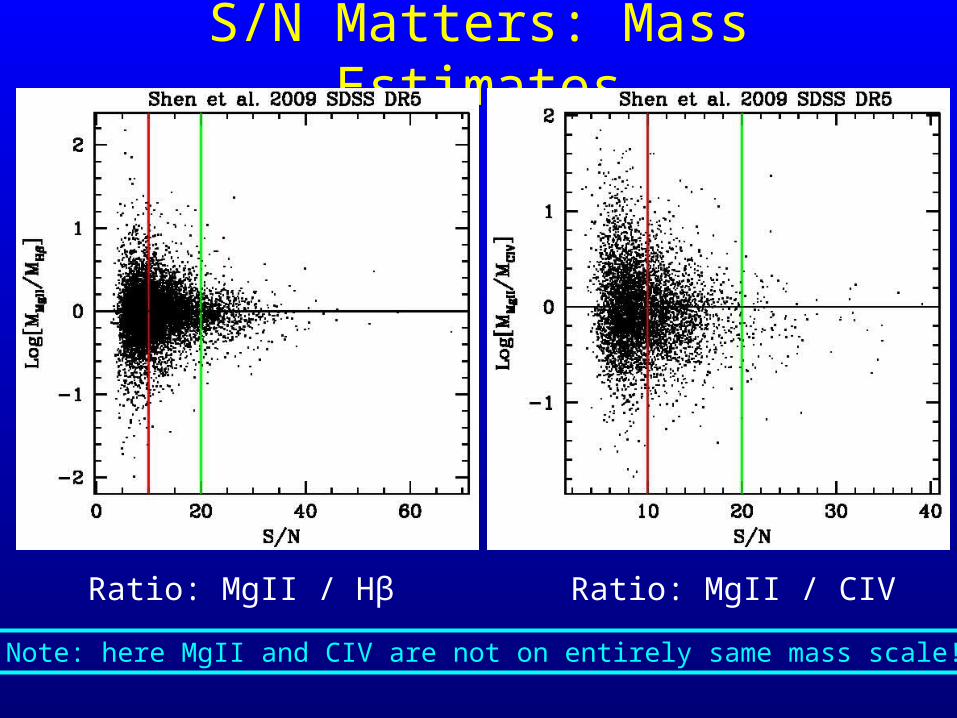
S/N Matters: Mass Estimates
Ratio: MgII / CIVRatio: MgII / Hβ
Note: here MgII and CIV are not on entirely same mass scale!
(Data from Vestergaard & Peterson 2006, Marconi et al. 2008)
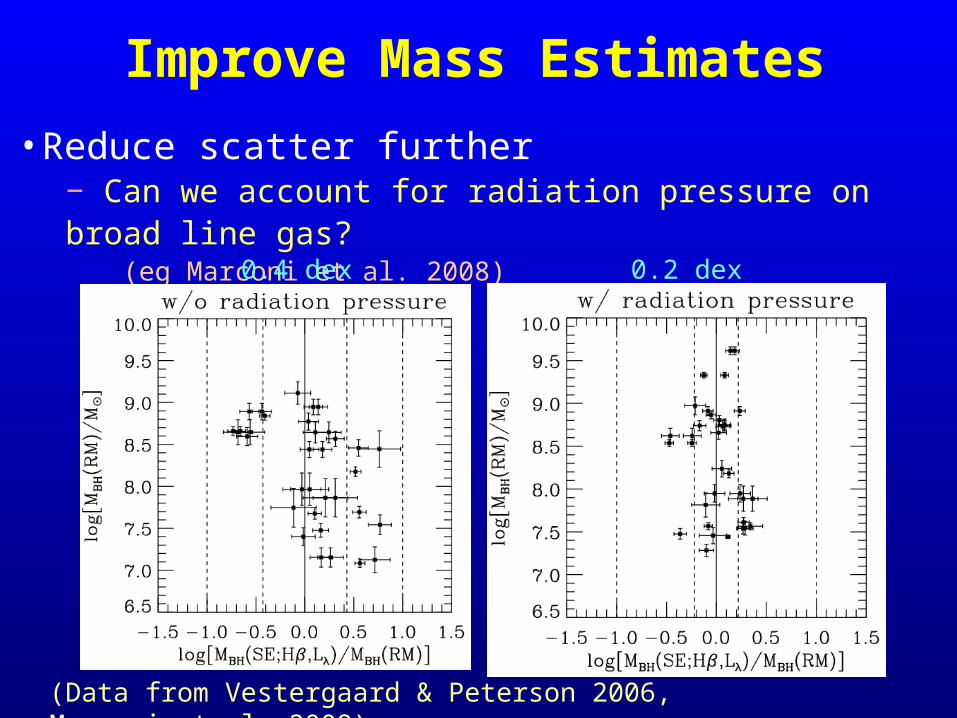
Improve Mass Estimates
• Reduce scatter further− Can we account for radiation pressure on broad line gas? (eg Marconi et al. 2008)
0.4 dex 0.2 dex
Reverberation Mapping Masses
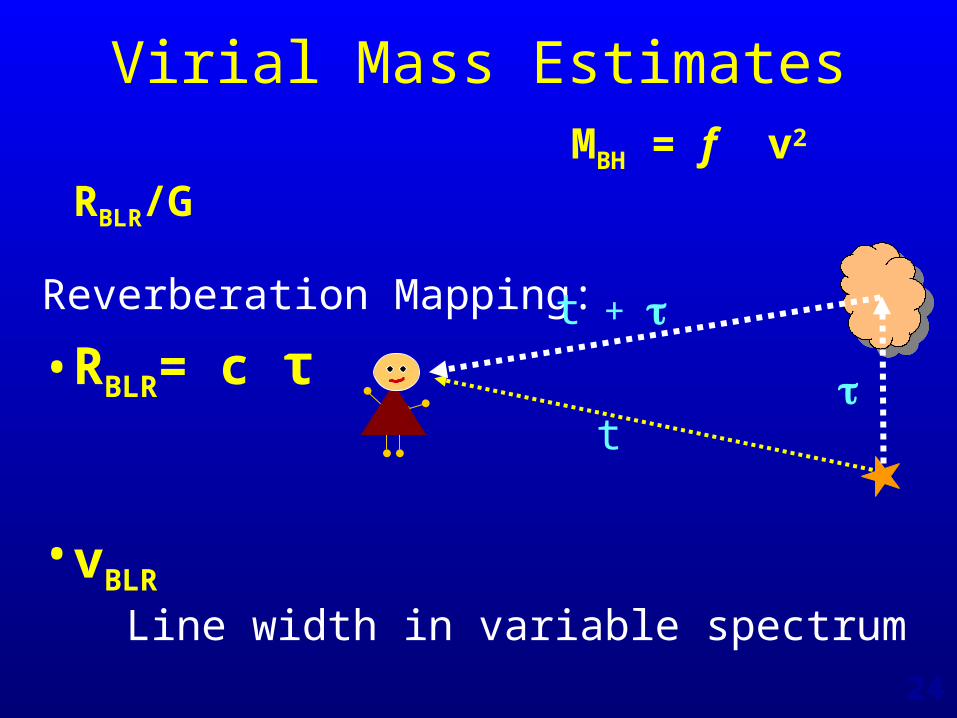
MBH = f v2 RBLR/G
Reverberation Mapping:
•RBLR= c τ
•vBLR
Line width in variable spectrum
Virial Mass Estimates
t
t +
24
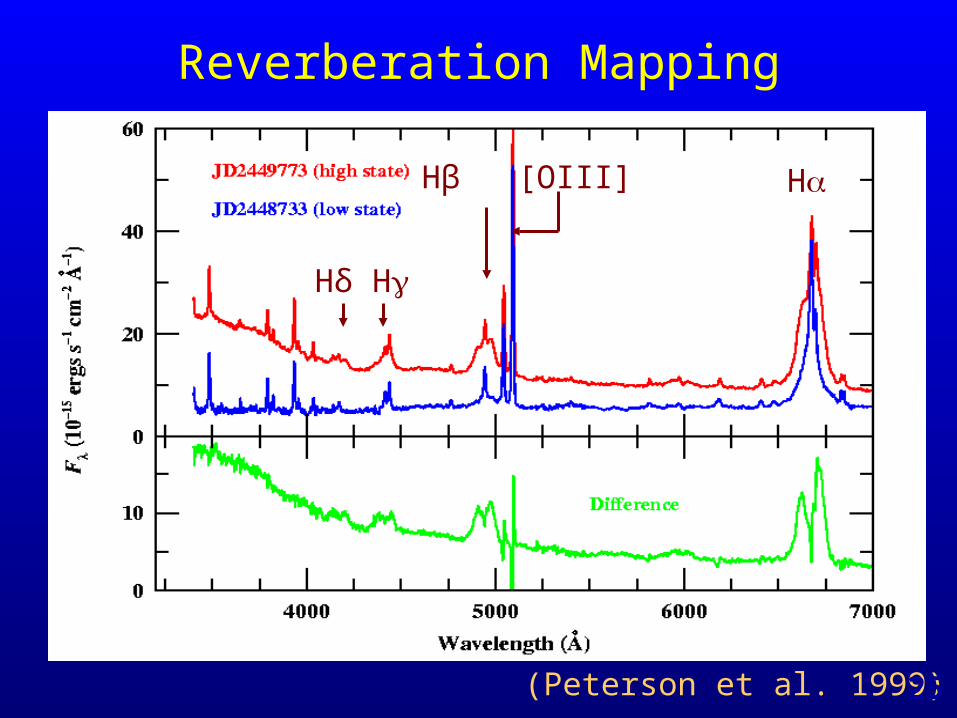
Reverberation Mapping
NGC 5548, the most closely monitored active galaxy
(Peterson et al. 1999)
HHβ [OIII]
Hδ H
25
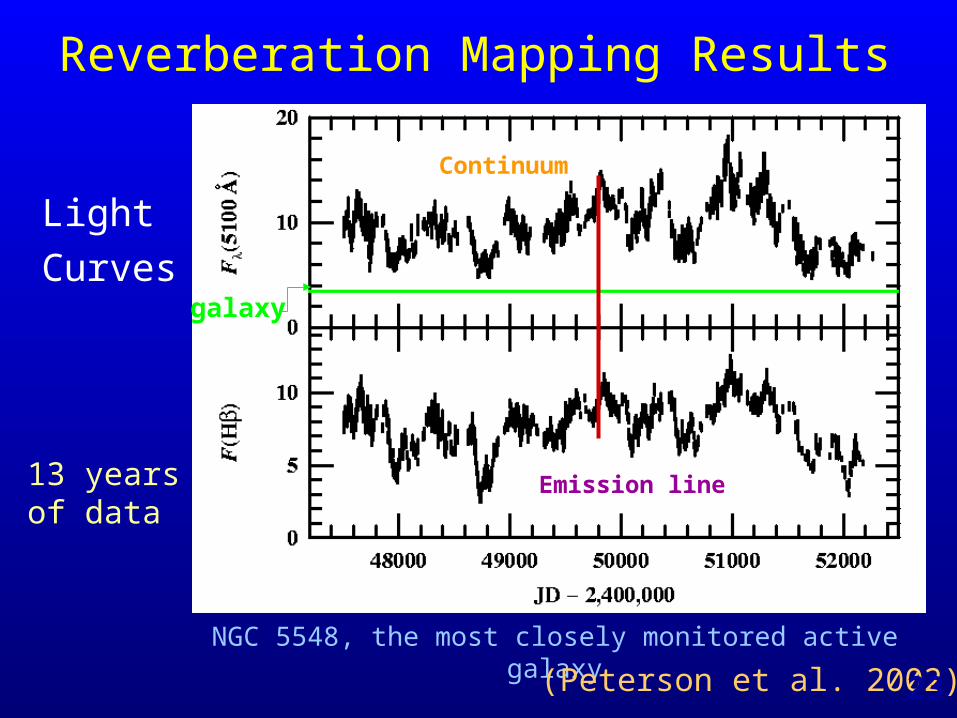
Reverberation Mapping Results
NGC 5548, the most closely monitored active galaxy
Continuum
Emission line
Light Curves
(Peterson et al. 2002)
13 yearsof data
galaxy
23
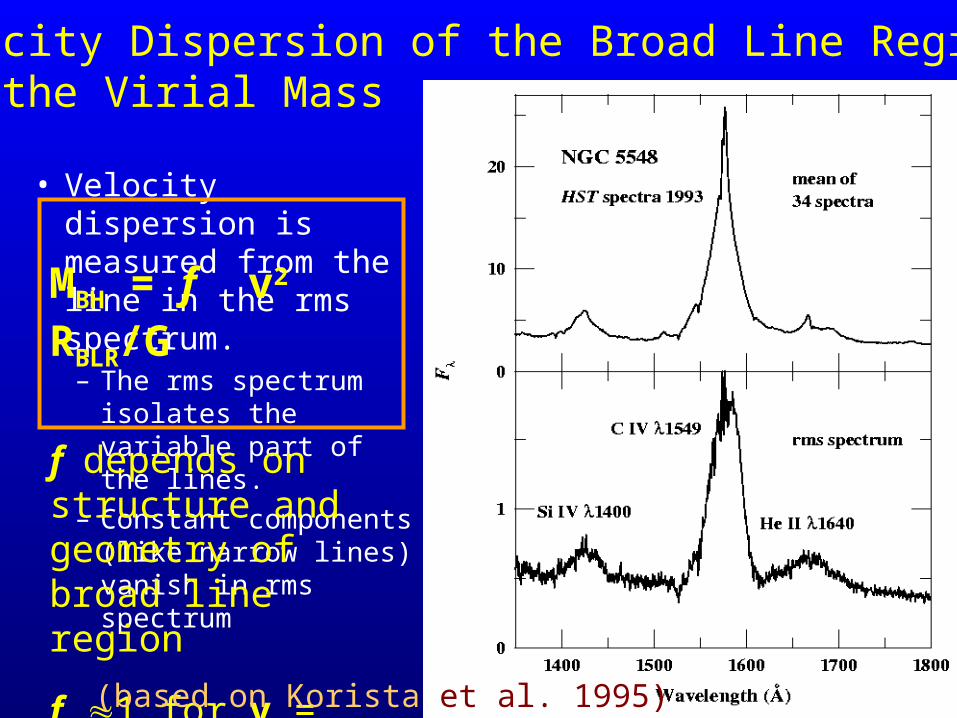
• Velocity dispersion is measured from the line in the rms spectrum.– The rms spectrum
isolates the variable part of the lines.
– Constant components (like narrow lines) vanish in rms spectrum
Velocity Dispersion of the Broad Line Region and the Virial Mass
MBH = f v2 RBLR/G
f depends on structure and geometry of broad line region
f 1 for v = FWHM
(based on Korista et al. 1995)
Are black hole masses overestimated, eg by factor of 10?
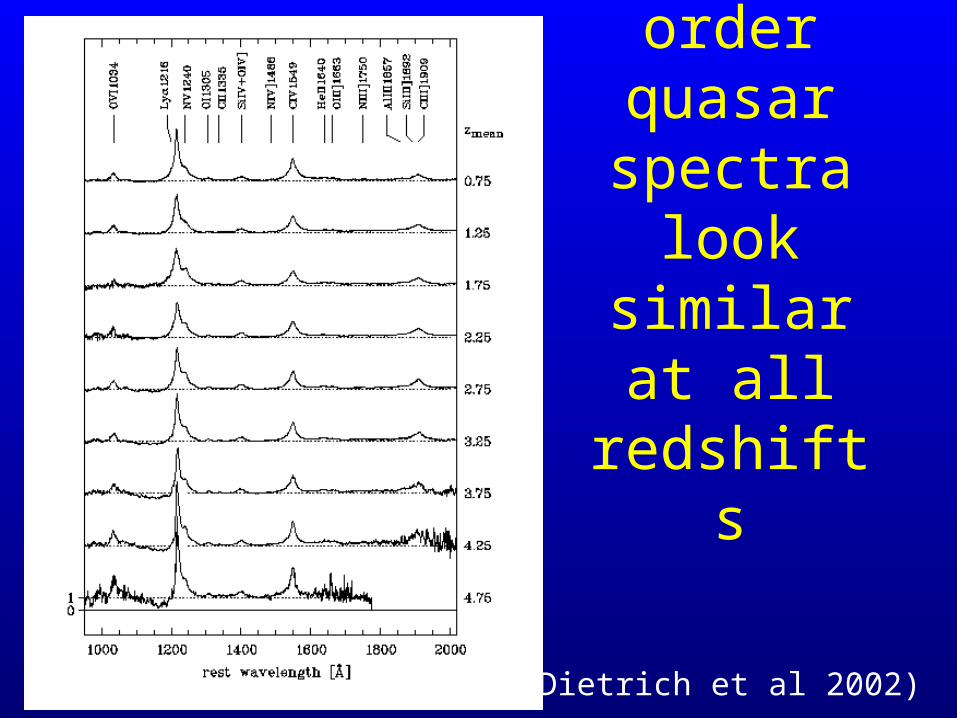
To first order quasar spectra look
similar at all redshifts
(Dietrich et al 2002)
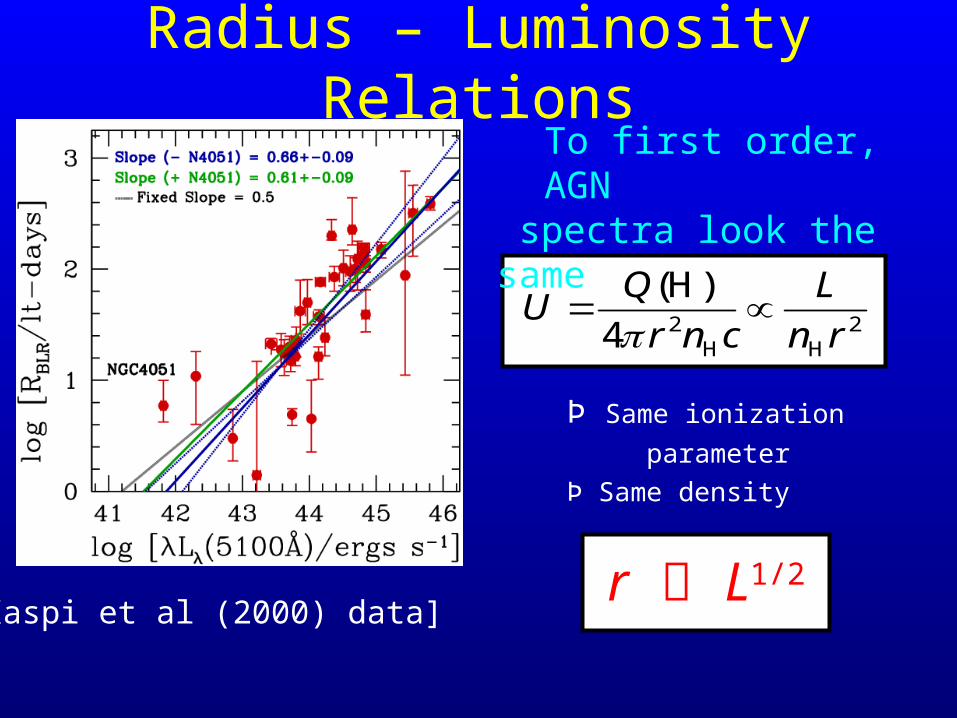
Radius – Luminosity Relations
2HH
24
)H(
rn
L
cnr
QU
r L1/2
To first order, AGN spectra look the same
Þ Same ionization
parameterÞ Same density
[Kaspi et al (2000) data]
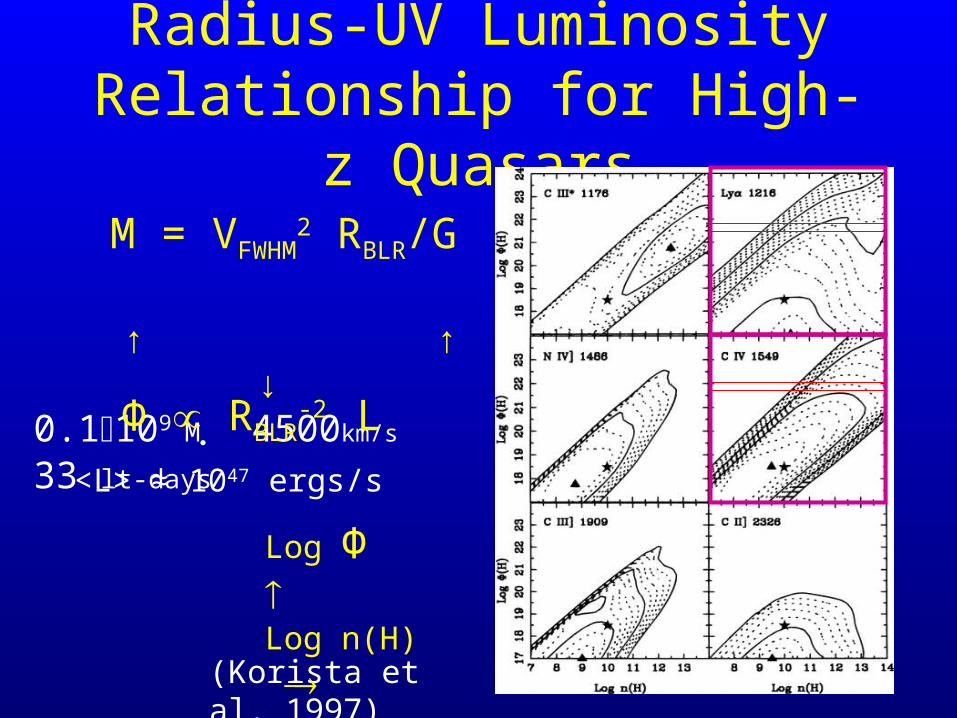
Radius-UV Luminosity Relationship for High-z Quasars
(Korista et al. 1997)
M = VFWHM2 RBLR/G
↑ ↑ ↓0.1109 M 4500km/s 33 lt-days
Ф RBLR-2 L
Log Ф Log n(H)
<L> ≈ 1047 ergs/s

Radius-UV Luminosity Relationship for High-z Quasars
(Dietrich et al. 2002)
M = VFWHM2 RBLR/G
Ф RBLR-2