Embed Size (px)
Citation preview

Maria S. Merian Cruise 2 leg 1 First weekly report: 22. - 28. 05. 2006
Figure 1: Ovide section planned in 2006. Red dots indicate the hydrological stations performed from May 24 to 28. The yellow dot is the station where we added a VMP profile, and the green dot, the station where we also deployed a profiling float as soon as we realized that we were in the core of a meddy.

Monday 22 May, Lisbon On Monday morning, while scientists are settling down in their 6-week home, our six containers are loaded aboard. Then 36 hours are dedicated to connect the different waters, the electricity and network between the ship and the 3 containers that are used as laboratories, and to initialize the experiments. A few of us immediately concentrate our efforts on the configuration of the ship ADCP, helped by Catherine Kermabon from Ifremer. In the deck lab, Thierry Terre (Ifremer) and Breck Owens (WHOI) are also finishing the preparation of the 2 SPRAY gliders, teaching us the last steps before deployment that should occur mid June near Greenland. A group of 4 people, Stephen Dye, Neil Needham (both from CEFAS, UK), Ulrich Drübbisch and Andreas Welsch (from IfM Geomar), come aboard to prepare their 2 pipe moorings that we plan to deploy at 63°N east of Greenland. Tuesday 23 May, 22:00: “off we go” It’s always an exciting moment. Objective: the deep test station at 38° 26’ N 10° 42’W. The long Atlantic swell welcomes us as soon as we exit from the Tage. Wednesday 24 May: “Achtung…stop!” 6 a.m.: here we are, ready for the tests of our 2 CTDs. Usual adjustments, training or simply reminders for the 9 people on watch, first chemical analysis, many details to take care of… the day is fully booked until 9 p.m.. Then, a short debriefing is necessary to clarify the procedure and formalize the communication between the container where we collect the data, the winch control room and the bridge. We discover the Posidonia system, that allows us to localize the CTD at depth. It will be very useful for the processing of the current data collected by our Lowered ADCP. We decide to use it for stations deeper than 1000 meters. Using the ship sounders for detecting actual depth is not trivial. The objective is naturally to avoid hitting the CTD at the bottom of the downcast. It turns out that most of them work around 12kHz. So we must check the possible interferences between the EM120 (we only need the vertical beam of this multi-beam), the EA600, our own pinger mounted on the CTD, and the Posidonia system. We finally choose to use the EA600 as a receiver of our pinger, so that we can monitor the distance between our rosette and the sea-floor. The EM120 is used to evaluate the depth at the beginning of the station and during the upcast, but we have to switch it off during the downcast because it blurs the signal of our pinger. Then, we observe that Posidonia has no effect on all this. A backup system consists in a 15-meter chain attached at one end under the rosette, the “contacter”, that rings in the container whenever the apparent weight of the chain decreases.

Thursday 25 May: “VMP in sight…” Serious things begin. We are back on the shelf, at 150m depth. This is the first station of the Ovide section (fig. 1). Apart from a little surprise on the depth shallower than expected, everything turns out to be good. The upward looking 300kHz ADCP refusing to communicate, we have to install a spare for the following stations. Fortunately, our old downward looking BB150kHz is faithfully fulfilling our expectations. First chemical analyses give satisfactory results. The team from the Université de Bretagne Occidentale measure CFCs and nutrients, while the team from CSIC Vigo gather information to better understand the carbon cycle.
The 4th station is placed on the upper continental slope at 800m depth. Therefore, the favorable meteorological conditions give us an excellent opportunity to test our new Vertical Microstructure Profiler. Deployed at 14:35 local time, it pops up half an hour later, and is easily localized by both VHF and captain’s eyes. After a very smooth approach, the VMP is recovered with the starboard crane without difficulty. 3 hydrological stations close this very active day. Figure 2: deployment of the Vertical Microstructure Profiler on May 25.
Friday 26 May: “a restless night at the bridge” Night station work begins, and we are now more than 3000m deep. In the middle of the night, a failure occurs in the steering gear of a pumpjet, preventing any dynamical positioning. After a discussion with the scientists, the captain decides to come back to land to be delivered a spare part the following day. Meanwhile, we keep on working, until midnight, achieving five hydrological stations held manually at the bridge. Saturday 27 May: “land, land” Figuera da Foz looks nice from the sea, but we will not have a chance to visit it: the spare part is delivered by the pilot at 12:00, and we “immediately” return to the last station. By the time we reach it, the pumpjet is repaired. After measuring this profile again to check its variability, we resume our course a little before midnight. This day is also special. Franck Riedel finally discovered why the 75 kHz ship ADCP signal showed interferences: the DoLog is pinging at 78… and cannot be legally switched off.

A short test in station confirms the diagnosis, and shows the remarkable potential of this ADCP. Even with the DoLog pinging, we can get some information on the currents, but the calculated errors are big. Sunday 28 May: “a Meddy for Mother’s Day” The influence of Mediterranean Water decreases slowly as we are steaming westward; but at station 15, a relative maximum of salinity at 1000 meters surprises us. Immediately warned by Nathalie, I make a careful comparison with the last 2 profiles and decide to launch a profiling float that is programmed to drift at 1000m depth. Following stations tend to confirm that we were dealing with a Meddy. Let’s hope we will be able to follow its path with the float in the following months.
Figure 3: salinity section showing the Meddy at station 15 and the Mediterranean vein flowing northward along the Portuguese west coast, centered around 1000 meter depth. All the scientists of this mission are most grateful to Captain von Staa and to all the crew aboard the Maria S. Merian. Bien sincèrement, Pascale Lherminier und alle Fahrtteilnehmer

Maria S. Merian Cruise 2 leg 1
Second weekly report: 29.05 - 04. 06. 2006
We are progressing north-westward. The first half of the week was characterized by a
windy weather and a long Atlantic swell, that affected both the equipment and the
crew. From Thursday on, it progressively calmed down to finish with a beautiful
week-end, just when we began to encounter the eddies and meanders of the North
Atlantic Current. Work performed: 26 CTD stations, 1 VMP profile, 2 free-fall CTD
profiles, 4 Provor deployments.
Figure 1: Ovide section planned in 2006. Red dots indicate the hydrological stations performed from May 24 to June 4. The blue stars are the stations where we added a VMP profile, and the green star, the stations where we also deployed a profiling float.

Monday 29 May: “Free-fall CTD and VMP trials”
everal
h.
CTD measurements show a noisy signal, usually attributed to a
default in the CTD-wire connection. However, a more serious
issue stops our progression: the steering gear of the yellow
winch breaks, while the CTD is hanging 4000 meters under
our feet. After the replacement of the broken piece, we can
slowly come back to the surface and recover all the equipment.
The time for repairing is used for instrument trials: the VMP is
sent down to 5300m depth, while a new type of free-fall CTD
(SBE 19, on the left) is tried twice on 500m deep profiles. All
the instruments behave as expected, and the 3 recoveries are
perfectly performed.
Meanwhile, the CTD is connected to the violet winch that we
will use now on.
Tuesday 30 May: “CTD routine settles down”
Five stations and one Provor deployment.
Despite the increasing swell and wind, we
keep on working hard, and the winch and
cable too. Due to the important rolling of
the ship, the cable endures several chocks
at deployment and recovery of the CTD.
We must also interrupt the up-cast s
times to correct the spooling on the winc
But data are collected, saved, calibrated,
compared.

Wednesday 31 May: “Hold on!”
Rolling speaking, the worse day of the week, consequence of 5m waves and force 7 to
8 winds. We occasionally oscillate on more than 20° on each side. Sometimes, despite
our efforts to fix it, the 1-ton rosette jumps on the deck. Meal times are not especially
relaxing. The scientists working in the containers located on the outside deck take the
closest indoor corridor to avoid the salty shower. But it is quite sunny though …
At station 25, the end of the CTD upcast is missing: 2 bulbs show the damage of the
bad weather on the last 20 meters of the wire. The cable is cut, and the connection
rebuilt. Next station is fine. Alles klar.
Figure 2: up: Roll as measured by Seapath 200 and decimated every second on May 31. Down: time-frequency diagram of the rolling amplitude. Strongest rolling(light color) appears during stations, mainly around an uncomfortable period of 9.5s. Transit time is much more quiet.

Figure 3: same as figure 2 for pitch. Although the behavior change in station, it does not show any specific peaks and as a matter of fact, we hardly notice it.
We all clearly observe that the Merian rolling behaves as if she was resonating at a
period of about 10s. When she begins to roll at this rhythm, the movement slowly
builds up for several periods before decaying suddenly. This phenomenon is
illustrated with a time-frequency analysis (called continuous wavelet transformation)
of the roll (fig. 2) and pitch (fig. 3): while the roll shows repeated peaks at a period of
9.5s, the pitch shows no specific behavior.
Only 3 CTD stations today … fortunately, the weather forecasts bring hope of better
days.
Thursday 1 June: “One of these good days”
5 CTD stations and a Provor deployment. A sane routine finally settles down despite
the 3 meter swell. Chemical analysis are performed in real time, with no major failure
or delay.

Friday 2 June: “Thanks God It’s Friday”
Yes, TGIF, not so much because of the week-end that follows than because of better
meteorological conditions. 4 CTD stations and a Provor deployment today. We pass
46°N and 19°W.
Saturday 3 June: “Wake up, old fellow”
In the afternoon of this beautiful day, our old fellow, the BB150kHz LADCP, refuses
to wake up for station 38. To make a long story short: we will have to rely on a
smaller, but less efficient, 300kHz LADCP for stations 38 and 39, while the old fellow
is repaired in the night, after blowing up 3 fuses… 4 CTD casts were performed today.
Sunday 4 June: “After the winch, the pod… busy Sunday”
No time to get bored on the Merian. Early morning, the chain of the violet winch
breaks during the down-cast, at 3200m. One and a half hour later, the winch is
repaired and the cast resumed. After some work on the data, we should be able to
recover a correct profile of temperature, salinity and oxygen. Later in the evening,
alarming messages oblige the crew to stop one of the two pods. Transit speed between
stations is reduced from 12 to 9 knots, while engineers and electricians are working
hard on the problem. We still gather 4 more profiles of 28 bottles each, and as usual,
a Provor is deployed. At the end of the day, we pass north of Brest latitude: 49°N.
Figures 4 and 5 below illustrate part of the work that has been done so far. The ADCP
data are excellent despite the weather, and we rely heavily on them for decision
making and for future scientific results.
All the scientists of this mission are most grateful to Captain von Staa and to all the
crew aboard the Maria S. Merian.
Bien sincèrement,
Pascale Lherminier und alle Fahrtteilnehmer

Figure 4: potential temperature section as measured on June 5, 2006.
Figure 5: salinity section as measured on June 5, 2006.

Maria S. Merian Cruise 2 leg 1
Third weekly report: 05.06 - 11. 06. 2006
We have now covered 3 fourths of the section and we are entering the Irminger Sea.
Work performed includes 30 CTD stations, 1 VMP profile and 7 Provor deployments.
Meteorological conditions were very good the whole week.
62
Figure 1: Ovide section planned in 2006. Red dots indicate the hydrological stations performed from May 24 to June 11. The blue squares are the stations where we added a VMP profile, and the green triangles, the stations where we also deployed a profiling float.
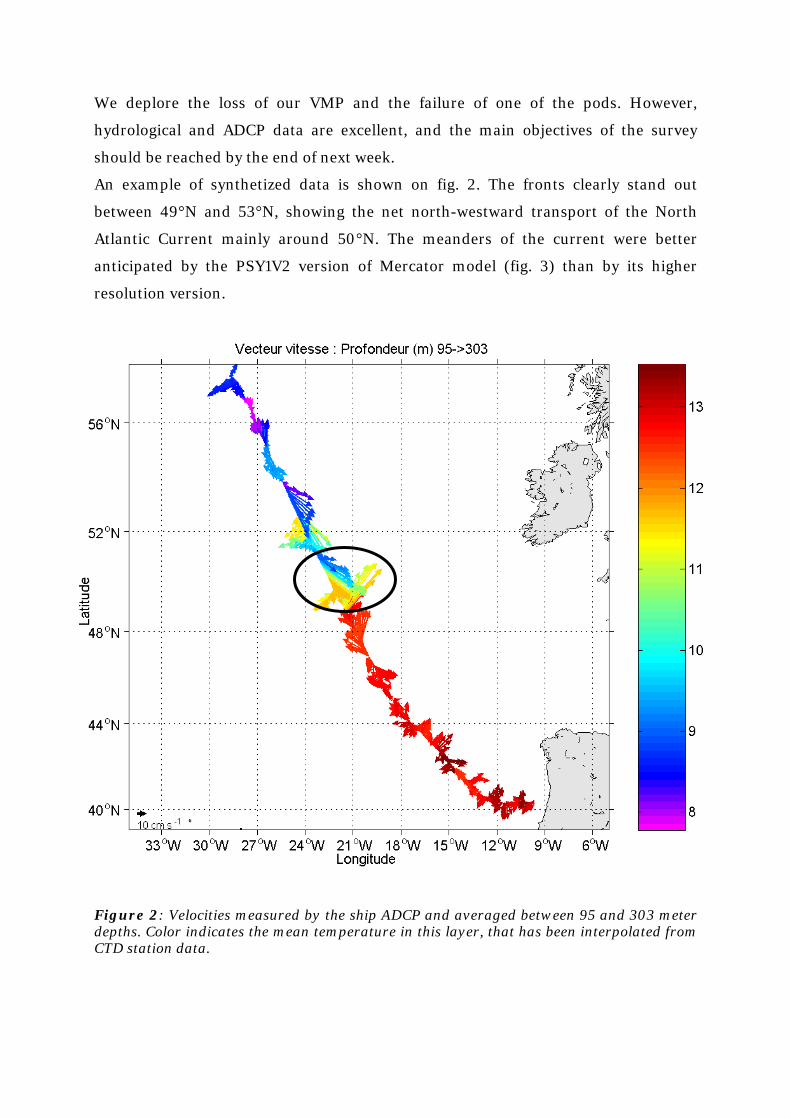
We deplore the loss of our VMP and the failure of one of the pods. However,
hydrological and ADCP data are excellent, and the main objectives of the survey
should be reached by the end of next week.
An example of synthetized data is shown on fig. 2. The fronts clearly stand out
between 49°N and 53°N, showing the net north-westward transport of the North
Atlantic Current mainly around 50°N. The meanders of the current were better
anticipated by the PSY1V2 version of Mercator model (fig. 3) than by its higher
resolution version.
Figure 2: Velocities measured by the ship ADCP and averaged between 95 and 303 meter depths. Color indicates the mean temperature in this layer, that has been interpolated from CTD station data.

Figure 3: Sea surface height best estimate of the PSY1V2 version of Mercator model. As for an atmospheric pressure chart, surface currents follow the isolines and strong velocities are expected where isolines get closer. Red (purple) areas indicate anticyclonic (cyclonic) circulation. The LADCP data give us information on the deeper currents. For example, station 62,
north of Maury Channel (fig. 1), shows a large south-westward flow at depth,
although the first 500 meters flow in the opposite direction. There, the Iceland-

Scotland Overflow Water at the bottom (relative maximum of salinity fig. 6), along
with Labrador Sea Water between 1000 and 2000m (minimum of salinity and
maximum of oxygen on fig. 6 and 7), are transported around the Reykjanes Ridge.
After circulating cyclonically around the Irminger Sea, they merge with the Deep
Western Boundary Current at the bottom of the East Greenland Slope.
Figure 4: Horizontal velocity profile of station 62 measured by the 150kHz Lowered ADCP and analyzed with Martin Visbeck’s software. Zonal velocity in dashed green, meridional in red. Ship ADCP is used to improve the first 500 meters of the profile. The processing include the estimation of the CTD horizontal trajectory, plotted at the bottom-right.

Figure 5: potential temperature section as measured on June 11, 2006.
Figure 6: salinity section as measured on June 11, 2006.

Figure 7: oxygen section as measured on June 11, 2006.
The measurements of next week will bring crucial information in our estimate of the
Meridional Overturning Cell, since we will be crossing the Deep Western Boundary
Current bringing back dense water that was transformed in the Subpolar Seas.
All the scientists of this mission are most grateful to Captain von Staa and to all the
crew aboard the Maria S. Merian.
Bien sincèrement,
Pascale Lherminier et toute l’équipe scientifique à bord du M.S. Merian.

Maria S. Merian Cruise 2 leg 1
Fourth weekly report: 12.06 - 18. 06. 2006
Irminger Sea section was the central work of this week. It was unfortunately interrupted by an unusual extension of the sea-ice coverage East of Greenland, associated to persistent westerly winds. Work performed includes 28 CTD stations, 1 Provor and 1 glider deployment, and the recovery of mooring A. Meteorological conditions were contrasted, and the work was interrupted Wednesday night and Sunday because of high winds (force 9-10).
Figure 1: Sections planned for Ovide 2006. Red dots indicate the hydrological stations performed from May 24 to June 18. The blue squares indicate VMP profiles; the green dots: profiling float deployments; the white dot: a glider deployment; and the orange dot: a mooring recovery.
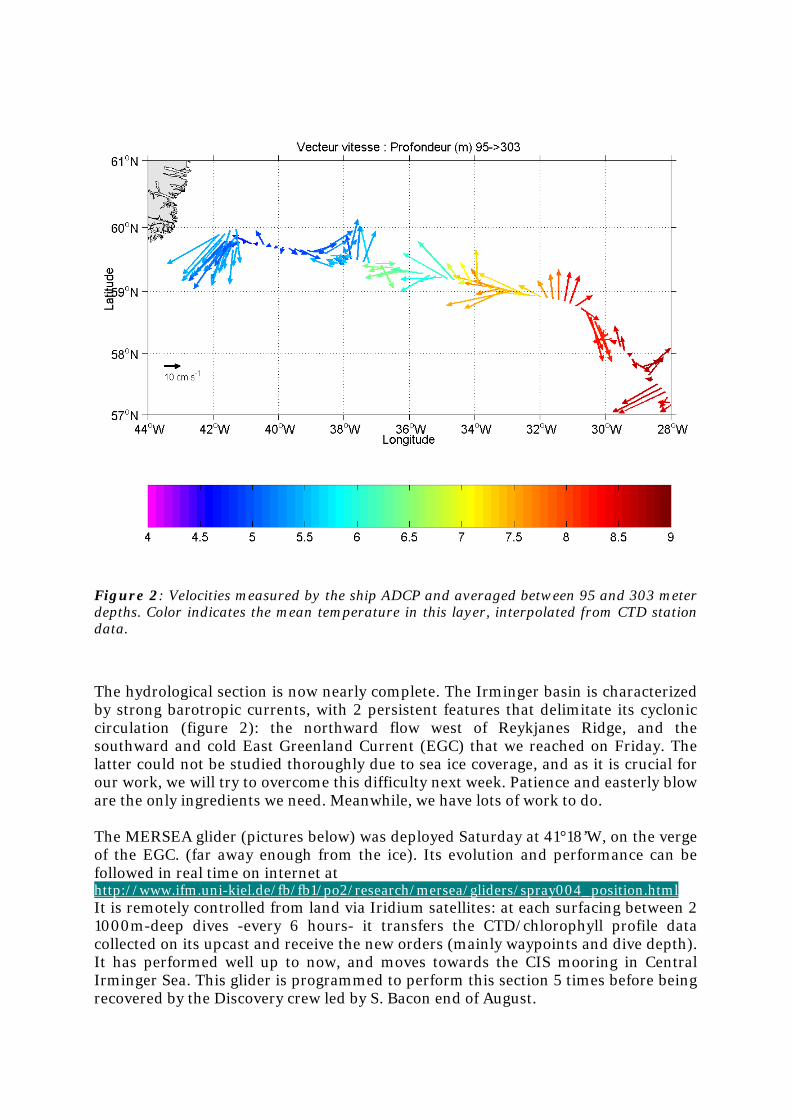
Figure 2: Velocities measured by the ship ADCP and averaged between 95 and 303 meter depths. Color indicates the mean temperature in this layer, interpolated from CTD station data.
The hydrological section is now nearly complete. The Irminger basin is characterized by strong barotropic currents, with 2 persistent features that delimitate its cyclonic circulation (figure 2): the northward flow west of Reykjanes Ridge, and the southward and cold East Greenland Current (EGC) that we reached on Friday. The latter could not be studied thoroughly due to sea ice coverage, and as it is crucial for our work, we will try to overcome this difficulty next week. Patience and easterly blow are the only ingredients we need. Meanwhile, we have lots of work to do. The MERSEA glider (pictures below) was deployed Saturday at 41°18’W, on the verge of the EGC. (far away enough from the ice). Its evolution and performance can be followed in real time on internet at http://www.ifm.uni-kiel.de/fb/fb1/po2/research/mersea/gliders/spray004_position.htmlIt is remotely controlled from land via Iridium satellites: at each surfacing between 2 1000m-deep dives -every 6 hours- it transfers the CTD/chlorophyll profile data collected on its upcast and receive the new orders (mainly waypoints and dive depth). It has performed well up to now, and moves towards the CIS mooring in Central Irminger Sea. This glider is programmed to perform this section 5 times before being recovered by the Discovery crew led by S. Bacon end of August.

Spray 004 deployment: last verifications and mission launching (up left), crane lifting (up right), smooth immersion behind the ship (bottom left), and last “au revoir” (bottom right). After this successful deployment, we come back to mooring A that was under ice early morning. As it is now relatively free of ice, we decide to recover it. Unfortunately, the mooring drifts very fast with the current after being released acoustically, and although we receive the Argos beacon, we have difficulties to locate it. After 45 minutes, we finally see it ... compacted near a growler (in our hunt, we came closer to the ice edge). Once hooked, the mooring can be brought back aboard; it comes out with huge knots in the cable, probably due to its long drift amongst sea ice. Some pictures below illustrate the story. The first results show that the five currentmeters and the Seacat (for T,S,P) have worked perfectly for 2 years, and that the knots only appeared after release of the .mooring.

Mooring A recovery: the mooring A is finally seen, embedded in a big growler (up left). The first currentmeter to come is the deepest one (up center), quickly followed by a mass of cables (right) and a huge ball of steel cable (up right). It was a busy Saturday, followed by a quiet Sunday: force 9-10 winds are blowing again, constraining us to stop the work like Wednesday night: a station cannot be hold properly with one pod by such wind. In the evening, we try again to reach mooring B: the strong westerly winds blew the ice some 60 nm offshore, much further than the day before. Since the 63°N shelf is also locked, it is decided to perform another section of the Deep Western Boundary Current (DWBC) and of the EGC, south to the Ovide section and along the mooring line (see Figure 1). We definitely need to have this piece in once. The strategy is to begin this short section offshore, so that we may take advantage of the easterly winds forecast for Tuesday and go further inshore this time, recovering the moorings that cannot stay longer there. This section is along the line of 11 moorings deployed by S. Bacon in 2005 and ourselves in 2004, and it can be very useful to support the on-going study of the DWBC variability at this latitude. Off we go...
More than ever, all the scientists of this mission are most grateful to Captain von Staa and to all the crew aboard the Maria S. Merian.
Bien sincèrement,
Pascale Lherminier et toute l’équipe scientifique à bord du M.S. Merian.