Embed Size (px)
Citation preview
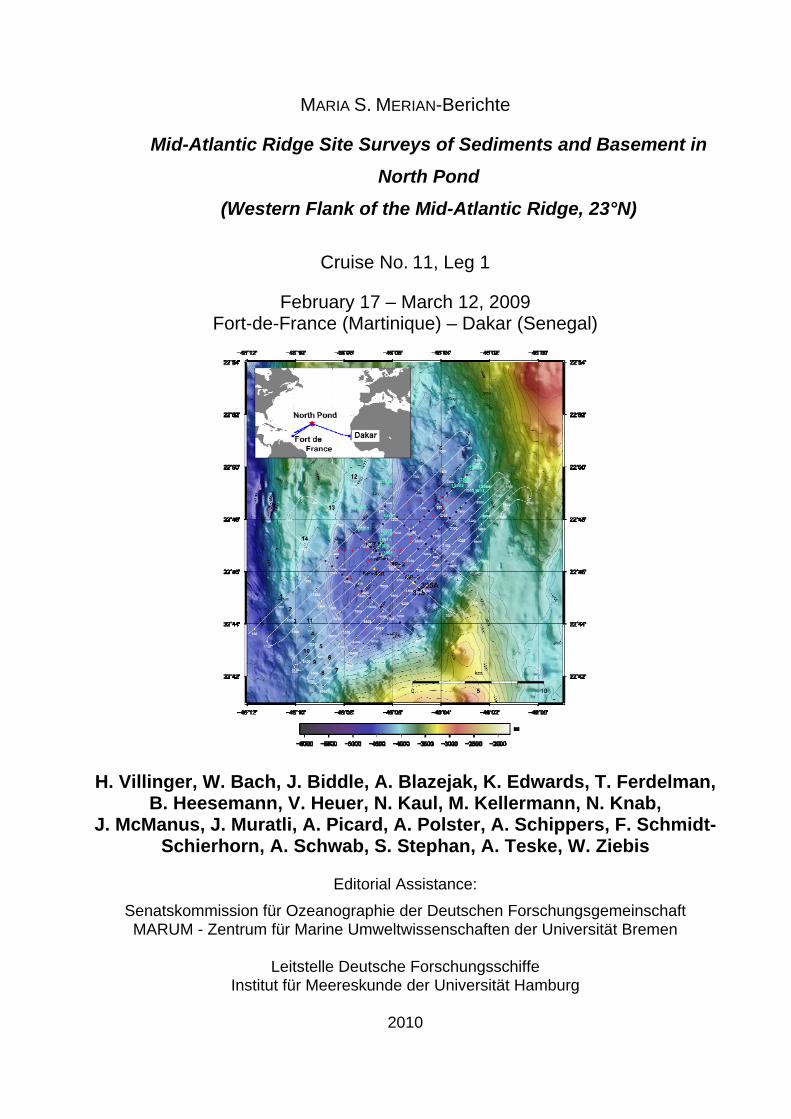
MARIA S. MERIAN-Berichte
Mid-Atlantic Ridge Site Surveys of Sediments and Basement in
North Pond
(Western Flank of the Mid-Atlantic Ridge, 23°N)
Cruise No. 11, Leg 1
February 17 – March 12, 2009
Fort-de-France (Martinique) – Dakar (Senegal)
H. Villinger, W. Bach, J. Biddle, A. Blazejak, K. Edwards, T. Ferdelman,
B. Heesemann, V. Heuer, N. Kaul, M. Kellermann, N. Knab, J. McManus, J. Muratli, A. Picard, A. Polster, A. Schippers, F. Schmidt-
Schierhorn, A. Schwab, S. Stephan, A. Teske, W. Ziebis
Editorial Assistance:
Senatskommission für Ozeanographie der Deutschen Forschungsgemeinschaft MARUM - Zentrum für Marine Umweltwissenschaften der Universität Bremen
Leitstelle Deutsche Forschungsschiffe
Institut für Meereskunde der Universität Hamburg
2010
Table of Contents Page
1. Summary / Zusammenfassung 1 2 Participants 3 3. Research Program 4 4. Narrative of the Cruise 4 5. Preliminary Results 5
5.1 Geophysics5 5.1.1 Bathymetry Survey 5 5.1.2 Sediment Echosounding 7
5.1.2.1 Parasound System 7 5.1.2.2 Processing of Data 7 5.1.2.3 Preliminary Results 7
5.1.3 Seismic Survey 8 5.1.3.1 Instrumentation 8
5.1.3.1.1 Seismic Source 8 5.1.3.1.2 Streamer and Data Acquisition 9
5.1.3.2 Processing of Data 10 5.1.3.3 Results 10
5.1.4 Heat flow survey 12 5.1.4.1 Bremen Heat Probe 12 5.1.4.2 Processing of Data 13 5.1.4.3 Preliminary Results 14
5.1.5 Physical Property Measurements on Cores 15 5.1.5.1 Thermal Conductivity Measurements 15 5.1.5.2 Measurement of Electrical Resistivity 17 5.1.5.3 Porosity 17
5.1.6 Seafloor penetration monitoring 17 5.2 Sediment Description 19 5.3 Biogeochemistry 21
5.3.1 Core Flow and Pore Water Sampling 21 5.3.2 Inorganic Pore Water Chemistry 21 5.3.3 Hydrogen and Organic Geochemistry 22 5.3.4 Experimental Biogeochemistry 23 5.3.5 Preliminary Results 24
5.4 Microbiology 25 6. Ship’s Meteorological Station 27 7. Station List MSM 11/1 28 8. Data and sample storage and availability 35 9. Acknowledgements 35 10. References 35
MARIA S. MERIAN-Berichte, Cruise 11 , Leg 1, Fort-de-France – Dakar, Feb 17 – March12, 2009 1
1. Summary / Zusammenfassung
North Pond is an isolated small sediment pond (6 km by 15 km) located on the western flank of the Mid-Atlantic Ridge (23°N) which offers the opportunity to study microbial communities and their activities in deeply-buried sediments and the underlying basement. North Pond has been previously studied by a series of DSDP and ODP drill holes and seafloor observatories. However the existing site survey data are not sufficient for the approved North Pond IODP drilling expedition, scheduled to take place in FY 2011. Therefore a site survey cruise on the German RV Maria S. Merian (MSM 11/1) took place from February 17 – March 12, 2009 (Fort-de-France, Martinique to Dakar, Senegal) with the goal to map in detail the sediment-basement interface and increase the heat flow measurement coverage. Due to an accident on board the scheduled working days on site were reduced from 14 to 6 days. Therefore a number of detailed investigations especially in the southern part of the basin had to be abandoned.
A set of geophysical survey data was obtained comprising 14 lines (about 240 km) of multibeam data in combination with single channel seismics and sediment echosounding, 61 successful heat flow measurements, and recovery of 68 m of core. The survey confirms the existing results based on two seismic profiles from 1989 but the new data show the sediment-basement interface in much more more detail. New heat flow measurements complement the existing heat flow coverage of Langseth et al. (1992) and confirm the hydrothermal circulation pattern with inflow of cold seawater at the southern rim of the basin and upflow of warm water at the north/north-western boundary. The new detailed geophysical data set will allow to position the proposed drillholes and constrain hydrogeological modelling of the circulation in the upper crust.
North Pond ist ein isoliertes kleines Sedimentbecken (6 km x 15 km) an der westlichen Flanke des Mittelatlantischen Rückens (23°N), wo sich die Möglichkeit bietet, mikrobielle Gemeinschaften und ihre Aktivität in den Sedimenten und der darunterliegenden Kruste zu untersuchen. North Pond wurde in der Vergangenheit schon durch eine Reihe von DSDP, ODP Bohrungen und Observatorien am Meeresboden untersucht. Die existierenden Daten reichten allerdings nicht aus, um die für 2011 bewilligten IODP-Bohrungen zu platzieren. Daher wurden mit RV Maria S. Merian eine Forschungsreise (MSM11/1, Fort-de-France, Martinique – Dakar, Senegal, 17. Februar – 12 März 2009) zu North Pond unternommen die zum Ziel hatte, die Grenze zwischen Sediment und Kruste zu kartieren und die Abdeckung mit Wärmestromdichtemessungen zu erhöhen. Auf Grund eines Unfalles an Bord verkürzte sich die Arbeitszeit von geplanten 14 Tagen auf 6 Tage. Daher konnten eine Reihe von Detailuntersuchungen am Südrand des Beckens nicht durchgeführt werden.
Die geophysikalischen Vermessungen umfassten 14 Profile (ca. 240 km) mit Fächerlotver-messung, Einkanal-Seismik und Parasound sowie 61 erfolgreiche Wärmestromdichtemessungen und 68 m Sedimentkerne. Die Untersuchungen bestätigen die bislang vorliegenden Ergebnisse, die auf zwei seismischen Linien von 1989 basierten. Allerdings zeigen die neuen seismischen Daten die Grenze Sediment-Kruste in viel größerem Detail. Die neuen Wärmestromdichtemessungen ergänzen die Messungen von Langseth et al. (1992) und bestätigen das hydrothermale Zirkulationssystem mit Versickern von kaltem Meerwasser am

2 MARIA S. MERIAN-Berichte, Cruise 11 , Leg 1, Fort-de-France – Dakar, Feb 17 – March 12, 2009
Südrand und Ausstrom von erwärmtem Wasser an der nordwestlichen Begrenzung des Beckens. Die neuen geophysikalischen Daten werden es erlauben, die geplanten Bohrungen zu platzieren und liefern wichtige Randbedingungen für das hydrogeologische Modell der Zirkulation in der oberen Kruste.
MARIA S. MERIAN-Berichte, Cruise 11 , Leg 1, Fort-de-France – Dakar, Feb 17 – March12, 2009 3
2. Participants
Name Title Expertise Affiliation Villinger, Heinrich Prof. Dr. Chief Scientist UHB Bach, Wolfgang Prof. Dr. Petrology UHB Biddle, Jennifer Dr. geomicrobiology UNC Blazejak, Anna Dr. geomicrobiology BGR Edwards, Katrina Prof. Dr. geomicrobiology USC Ferdelman, Timothy Dr. biogeochemistry MPI Heesemann, Bernd Dipl. Ing. Electronics UHB Heuer, Verena Dr. biogeochemistry MARUM Kaul, Norbert Dr. Geophysics UHB Kellermann, Matthias Dipl. Geowiss. biogeochemistry MARUM Klein, Frieder Dipl. Geowiss. Petrology UHB Knab, Nina Dr. biogeochemistry USC McManus, James Prof. Dr. geochemistry OSU Muratli, Jesse Student geochemistry OSU Picard, Aude Dr. biogeochemistry MPI Polster, André Dipl. Geophys. Geophysics UHB Schippers, Axel PD Dr. geomicrobiology BGR Schmidt-Schierhorn, F. Student Geophysics UHB Schwab, Arne Student Geophysics UHB Stephan, Sebastian Student Geophysics UHB Teske, Andreas Prof. Dr. geomicrobiology UNC Ziebis, Wiebke Prof. Dr. biogeochemistry USC
UHB Department of Geosciences University of Bremen P.O.Box 330 440 D-28334 Bremen
MPI Max-Planck-Institute for Marine Microbiology Celsiusstr. 1 D-28359 Bremen
BGR Bundesanstalt für Geowissenschaften und Rohstoffe, Stilleweg 2, D-30655 Hannover
USC University of Southern California 3616 Trousdale Parkway, AHF107 Los Angeles, CA 90089 USA
MARUM Zentrum für Marine Umweltwissenschaften
OSU Oregon State University 104 Ocean Admin. Building Corvallis, OR 97331-5503 USA
UNC University of North Carolina Dept. of Marine Science 340 Chapman Hall, CB3300 Chapel Hill, NC 27599 USA
4 MARIA S. MERIAN-Berichte, Cruise 11 , Leg 1, Fort-de-France – Dakar, Feb 17 – March 12, 2009
3. Research Program North Pond, an isolated sediment pond located on the Western flank of the mid-Atlantic Ridge, offered the opportunity to study microbial communities and their activities in deeply-buried sediments and the underlying basement. One important argument for choosing North Pond was that the geochemistry, hydrology, and geologic setting of North Pond had been previously stud-ied by a series of DSDP and ODP drill holes and seafloor observatories. However the existing site survey data were not sufficient for the approved North Pond IODP drilling expedition, scheduled to take place in FY 2011. The goal of the proposed investigations on MSM 11/1 is therefore to map North Pond in a detailed way in order to be able to position planned IODP holes precisely. These surveys compromise a detailed seismic mapping of the sediment-basement interface of North Pond, additional heat flow data and geochemical and microbial sampling of the sediments. In addition dredging of the upper crust, surrounding North Pond, will help to better define the petrological setting of North Pond. The proposed MERIAN cruise together with the planned IODP drilling project will provide a unique comprehensive geophysical, (bio)geo-chemical and microbial data set for the study of deep biosphere.
4. Narrative of the Cruise
On Tuesday, February 17, 2009, at 11 a.m., the R/V M.S. MERIAN left the harbor of Fort-de- France and headed for the working area at North Pond on the mid-Atlantic Ridge at 22° N/46° S. Our departure was delayed for over a day due to a general strike in Martinique that prevented getting the necessary fuel for the trip. Thanks to the negotiation skills of Captain Bergmann and our agent in Fort de France we were able to obtain fuel and finally cast off.
During the four-day transit, the various research groups had time to set-up laboratories and test all their equipment. Over the course of two scientific meetings, the research groups informed one another of their various research programs, and they discussed optimal sampling strategies and time plans for the upcoming days on-site. We reached North Pond around 3 p.m. on February 21. We began immediately with a gravity core deployment which was successful and the recovered core was 8.44 m long.
Directly afterwards we started a seismic survey along closely spaced lines with a scheduled duration of approximately 40 hours, in order to map the topography of the sediment basin in detail. In addition bathymetric mapping with SIMRAD and sedimentecho-sounding took place. Unfortunately, during our seismic survey, one of the crew members was seriously injured so that Captain Bergmann immediately had to break off all research operations, in order to transport the patient as quickly as possible to Martinique or Guadeloupe. We reached the location outside Guadeloupe where the helicopter could pick up the patient in the morning of February 25. The pickup went very well and the patient was in the hospital on Guadeloupe one hour later. After-wards we left immediately for our working area again where we arrived in the late morning of February 28. As we had lost about 7 days due to the accident, we asked the Senatskommission für Ozeanographie for a prolongation of the cruise which was granted as the chief scientist of MSM 11/2 gave us two days of his working days. The planned arrival in Dakar was therefore March 12 at 8 a.m. This left us 6.3 working days out of the planned 13 days.
After the arrival we completed the interrupted seismic survey. The following days were filled with a succession of gravity coring during the day and heat flow surveys during night. Our attempt to take a multi-corer failed for yet unknown reasons. Due to the dramatically reduced
MARIA S. MERIAN-Berichte, Cruise 11 , Leg 1, Fort-de-France – Dakar, Feb 17 – March12, 2009 5
working days, we decided not to try again. In order to sample bottom water, we deployed the CTD/rosette in the middle of North Pond. Our work ended with a short bathymetric survey around North Pond to close gaps in the existing coverage. We started our 6½ day long journey to Dakar on March 6 at 7 p.m.
Due to the loss of the 7 working days, we did not achieve all our cruise objectives. Especially the geophysical survey of the southern part of North Pond is missing where we could not in-crease the heat flow coverage as planned before. Also additional seismic lines with a different source and different orientation of the profiles are missing. The sediment sampling of the northern rim of the pond is sufficient but we could have done much more detailed sampling with more shiptime. However we have a sufficiently dense coverage with geophysical data to position the planned drillholes within the pond and the collected cores allow to assess basic (bio)geochemical and microbial processes within the sediments.
5. Preliminary Results
5.1 Geophysics
5.1.1 Bathymetry Survey
(S. Stephan, F. Schmidt-Schierhorn, N. Kaul)
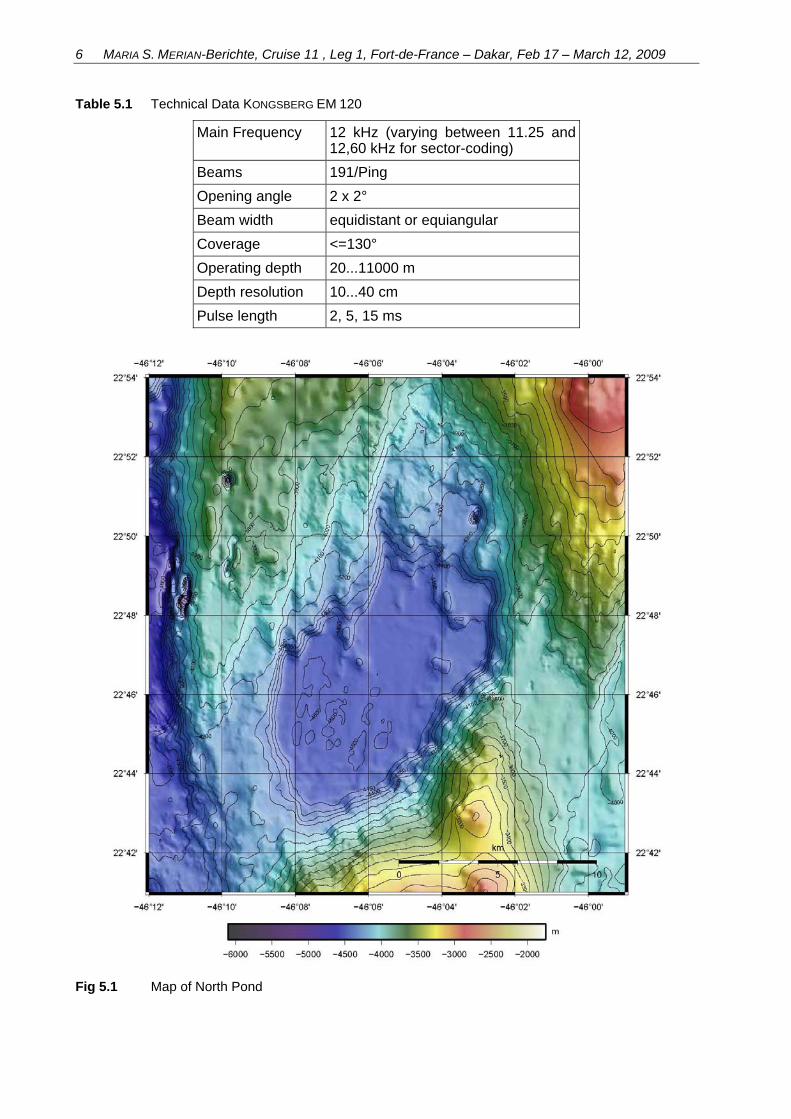
On board MARIA S. MERIAN the multi-beam echosounding system (MBES) KONGSBERG EM 120 is used for deep-sea bathymetric surveys. It is mounted on the hull of the research vessel and provides 191 beams with spacings that can be set up equidistant or equiangular. The emission beam can be adjusted to opening angles up to 130° across-track while the opening angle along-track is fixed to 2°. Resulting footprints are dependent on water-depth (2° along-track and 2° across-track). The echo received from the seafloor consists of 191 reflected beams from fre-quency coded (11.25 to 12.6 kHz) acoustic signals. For further details see Tab. 1.3.
The absolute water depth can be estimated by using a sound velocity profile (SVP) describing ray-bending in the water column and by knowing the two-way travel time for each beam. Measurement accuracy is achieved by using a combination of phase for the central beams and amplitude for the lateral beams.
Raw depth data obtained by the MBES and recorded by Kongsbergs SIS-Software contain along-track distance, across-track distance and depth information. This raw data is already cor-rected for sound-velocity changes in the water-column by a SVP and for heave/pitch/roll move-ment by data from the motion reference unit (MRU).
Processing of the MBES-Data is performed by using “Replay” and “Neptune” Software of Kongsberg which are available on the vessel. The raw navigation data has been processed (smoothing, cutting into profiles) and merged with the sounding data for an exact positioning of each beam. In the next step, a grid of 150 by 150 m was set up which was then smoothed with a standard deviation filtering criterion. The grid can be exported as a xyz-ASCII file for further use in mapping software.
The xyz-grid was converted to a grid-file and blended on an existing bathymetry using Generic Mapping Tools (GMT, Wessel and Smith, 1998). The final map is shown in Fig. 5.1.
6 MARIA S. MERIAN-Berichte, Cruise 11 , Leg 1, Fort-de-France – Dakar, Feb 17 – March 12, 2009
Table 5.1 Technical Data KONGSBERG EM 120
Main Frequency 12 kHz (varying between 11.25 and 12,60 kHz for sector-coding)
Beams 191/Ping
Opening angle 2 x 2°
Beam width equidistant or equiangular
Coverage <=130°
Operating depth 20...11000 m
Depth resolution 10...40 cm
Pulse length 2, 5, 15 ms
Fig 5.1 Map of North Pond
MARIA S. MERIAN-Berichte, Cruise 11 , Leg 1, Fort-de-France – Dakar, Feb 17 – March12, 2009 7
5.1.2 Sediment Echosounding
(A. Polster, N. Kaul, A. Schwab)
5.1.2.1 Parasound System
On MARIA S. MERIAN, an Atlas PARASOUND P70 System is installed permanently for sediment echo sounding. The main goal of using the PARASOUND System was the selection of suitable sites for sediment sampling and deployments of the heat flow lance. The PARASOUND System is a low-frequency sediment echosounder in combination with a high-frequency narrow beam sounder for water depth. It utilizes the parametric effect that means that two acoustic signals of almost similar frequencies (in our case 18.8 kHz und 19.3 kHz) are emitted simultaneously which produces through nonlinear acoustic interactions a primary signal with 3.5 kHz. This pulse travels within the emission cone of the original high frequency waves, which are limited to an angle of 4.5°. Therefore, the footprint size of 7 % of the water depth is much smaller than for conventional 3.5 kHz systems. Vertical and lateral resolution is significantly improved.
Since the two-way travel time in the deep sea is long compared to the length of the reception window of up to 266 ms, the PARASOUND System sends out (in deep sea mode) a burst of pulses (0.500 ms length) at 400 ms intervals before the first echo returns. The coverage of this discon-tinuous mode depends on the water depth and produces non-equidistant shot distances between bursts. On average, one echogram is recorded every second providing a nominal spatial reso-lution on the order of a 2 to 3 m on seismic profiles at 5 knots.
The PARASOUND System is equipped with the digital data acquisition system PARADIGMA, which was developed at the University of Bremen (Spieß, 1993). The sample frequency of the echogram is 40 kHz with a recording length of approx. 500 ms for a depth window of 400 m. Real part and phase of the envelope from the returned echo signals are saved in the ASD format. Because of the limited penetration of the echosounder signal into the sediment, only a small depth window close to the seafloor is recorded and saved either in SEGY or PS3 format which can be used for post-processing. The PC allows buffering, transfer, and storage of the digital seismograms at very high repetition rates. From the emitted series of pulses, usually the pulse could be digitized and stored, resulting in recording intervals of 800 ms within a pulse sequence.
5.1.2.2 Processing of Data
For post-processing the seismic data processing package VISTA SEISMIC PROCESSING 7.00 is used. To improve the signal-to-noise ratio, the echogram sections were filtered with a wide band pass filter .. In addition data were normalised to a constant value much smaller than the maximum average amplitude, to amplify in particular deeper and weaker reflections.
5.1.2.3 Preliminary Results
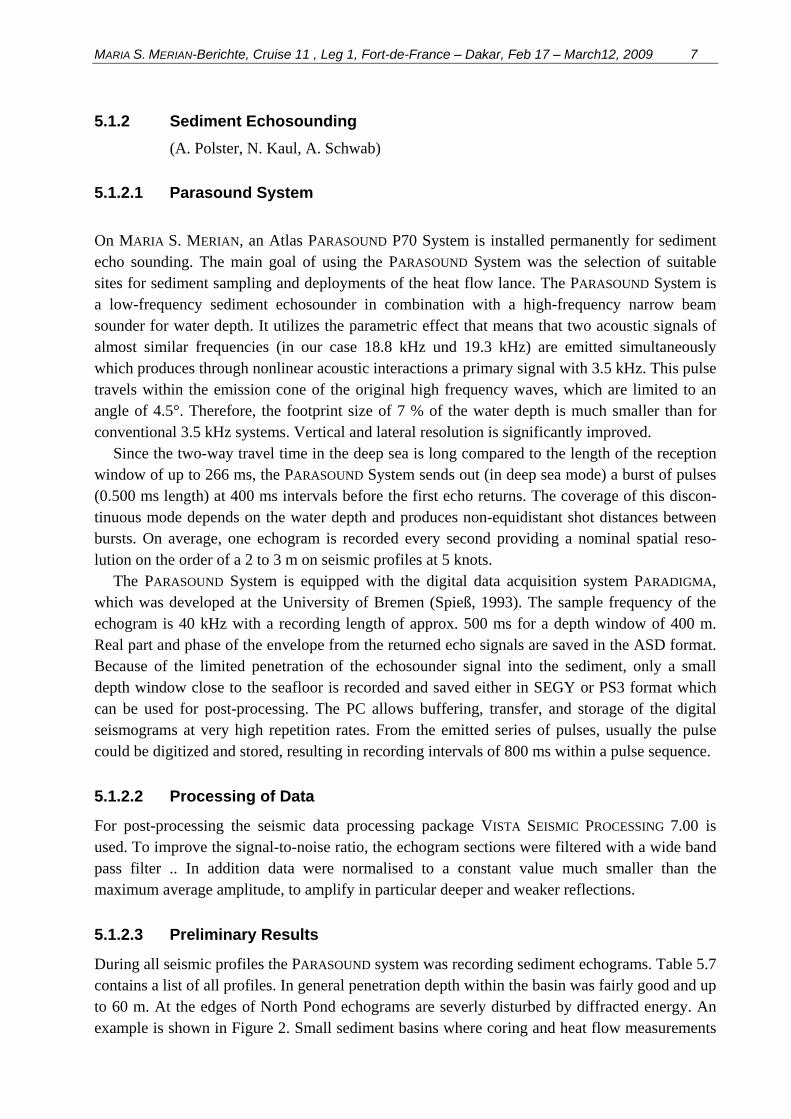
During all seismic profiles the PARASOUND system was recording sediment echograms. Table 5.7 contains a list of all profiles. In general penetration depth within the basin was fairly good and up to 60 m. At the edges of North Pond echograms are severly disturbed by diffracted energy. An example is shown in Figure 2. Small sediment basins where coring and heat flow measurements
8 MARIA S. MERIAN-Berichte, Cruise 11 , Leg 1, Fort-de-France – Dakar, Feb 17 – March 12, 2009
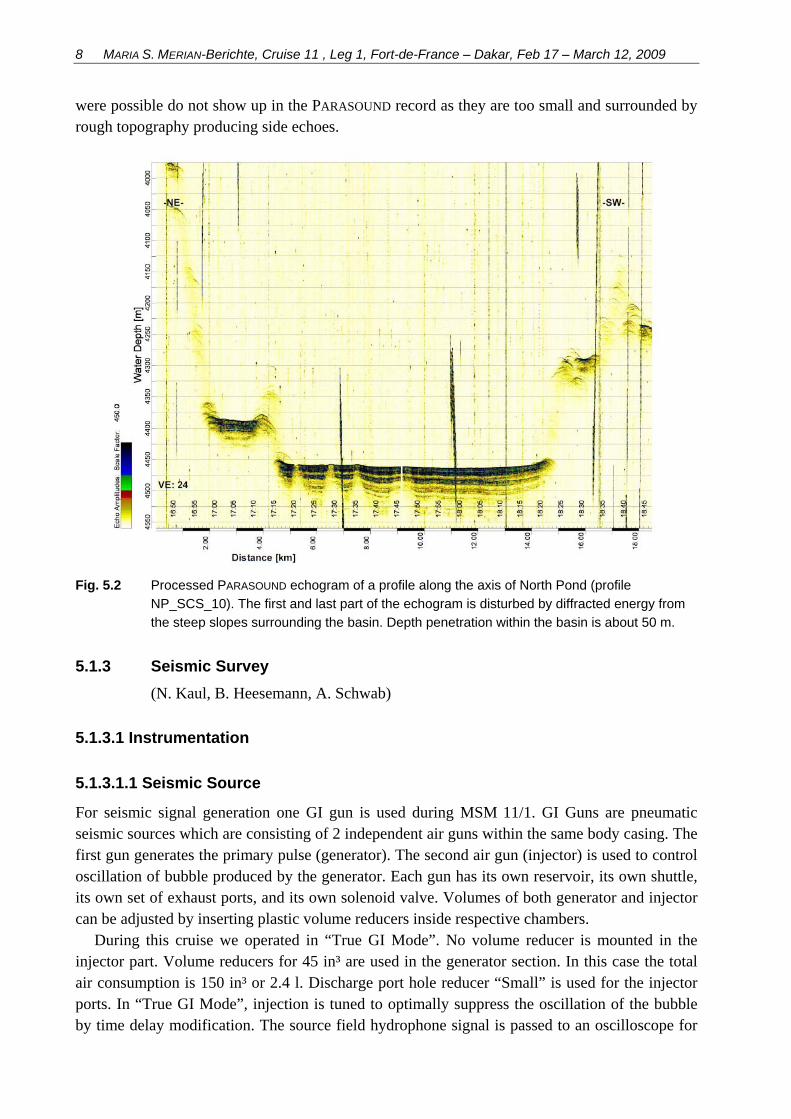
were possible do not show up in the PARASOUND record as they are too small and surrounded by rough topography producing side echoes.
Fig. 5.2 Processed PARASOUND echogram of a profile along the axis of North Pond (profile
NP_SCS_10). The first and last part of the echogram is disturbed by diffracted energy from
the steep slopes surrounding the basin. Depth penetration within the basin is about 50 m.
5.1.3 Seismic Survey
(N. Kaul, B. Heesemann, A. Schwab)
5.1.3.1 Instrumentation
5.1.3.1.1 Seismic Source
For seismic signal generation one GI gun is used during MSM 11/1. GI Guns are pneumatic seismic sources which are consisting of 2 independent air guns within the same body casing. The first gun generates the primary pulse (generator). The second air gun (injector) is used to control oscillation of bubble produced by the generator. Each gun has its own reservoir, its own shuttle, its own set of exhaust ports, and its own solenoid valve. Volumes of both generator and injector can be adjusted by inserting plastic volume reducers inside respective chambers.
During this cruise we operated in “True GI Mode”. No volume reducer is mounted in the injector part. Volume reducers for 45 in³ are used in the generator section. In this case the total air consumption is 150 in³ or 2.4 l. Discharge port hole reducer “Small” is used for the injector ports. In “True GI Mode”, injection is tuned to optimally suppress the oscillation of the bubble by time delay modification. The source field hydrophone signal is passed to an oscilloscope for
MARIA S. MERIAN-Berichte, Cruise 11 , Leg 1, Fort-de-France – Dakar, Feb 17 – March12, 2009 9
source signal control. Best results for a source depth of 5 - 6 m could be achieved using a delay time of 35 ms.
Compressed air is provided by a mobile LMF compressor at maximum nominal pressure of 210 bar, actual pressure at gun port is 200 bar (3000 psi)
The trigger signal is supplied from a dedicated triggerbox (TriBo, home-made) system with a high precision quartz timing base. This system provides trigger pulses for generator and injector valves and for the recording system.
During this cruise on MSM 11-1, the seismic source is operated from the port side of the aft deck. The mechanical set up is as follows: one buoy is fixed to the rear eye of the gun hanger with app. 5 m of rope. The seismic source is mounted horizontally 1 m below the gun hanger. The 12 mm steel wire from the air gun rail on port side is used as tow wire. It was fixed near to the front end of the gun hanger. The towing wire of the umbilical is fixed to the front eye of the hanger. In this configuration, towing force is provided through the steel wire. Position of air gun is 10 - 15 m behind the vessel.
5.1.3.1.2 Streamer and data acquisition
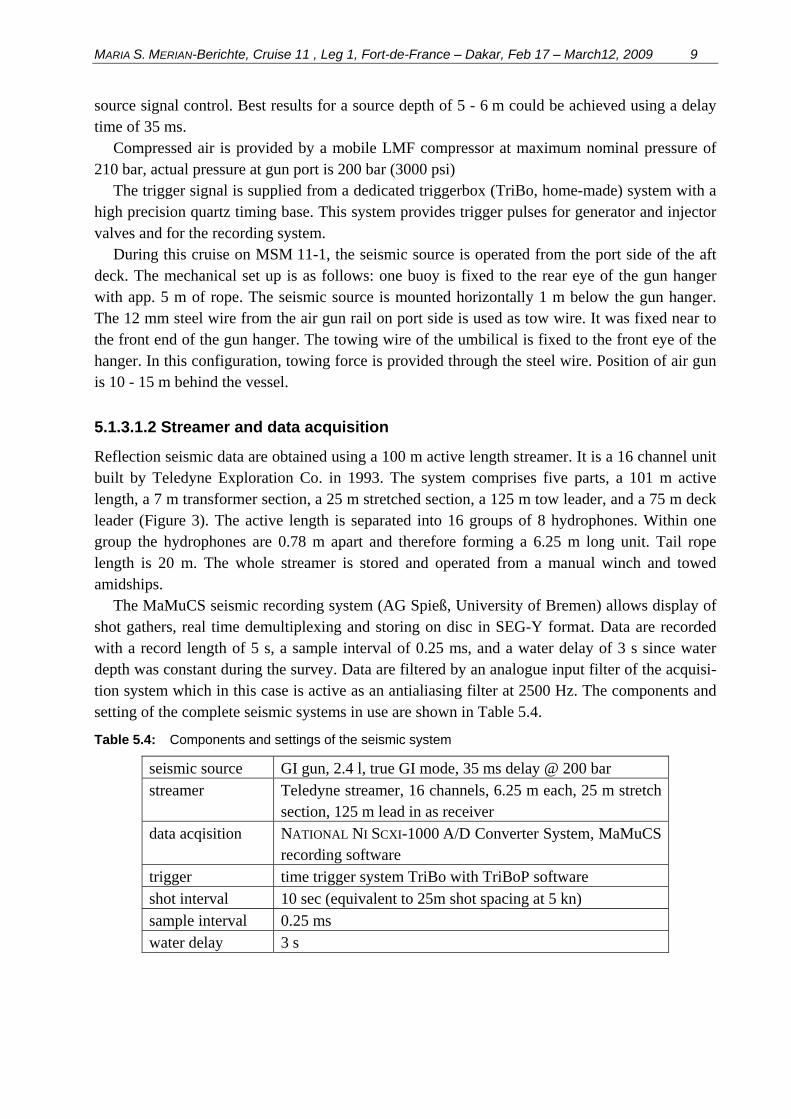
Reflection seismic data are obtained using a 100 m active length streamer. It is a 16 channel unit built by Teledyne Exploration Co. in 1993. The system comprises five parts, a 101 m active length, a 7 m transformer section, a 25 m stretched section, a 125 m tow leader, and a 75 m deck leader (Figure 3). The active length is separated into 16 groups of 8 hydrophones. Within one group the hydrophones are 0.78 m apart and therefore forming a 6.25 m long unit. Tail rope length is 20 m. The whole streamer is stored and operated from a manual winch and towed amidships.
The MaMuCS seismic recording system (AG Spieß, University of Bremen) allows display of shot gathers, real time demultiplexing and storing on disc in SEG-Y format. Data are recorded with a record length of 5 s, a sample interval of 0.25 ms, and a water delay of 3 s since water depth was constant during the survey. Data are filtered by an analogue input filter of the acquisi-tion system which in this case is active as an antialiasing filter at 2500 Hz. The components and setting of the complete seismic systems in use are shown in Table 5.4.
Table 5.4: Components and settings of the seismic system
seismic source GI gun, 2.4 l, true GI mode, 35 ms delay @ 200 bar streamer Teledyne streamer, 16 channels, 6.25 m each, 25 m stretch
section, 125 m lead in as receiver data acqisition NATIONAL NI SCXI-1000 A/D Converter System, MaMuCS
recording software trigger time trigger system TriBo with TriBoP software shot interval 10 sec (equivalent to 25m shot spacing at 5 kn) sample interval 0.25 ms water delay 3 s
10 MARIA S. MERIAN-Berichte, Cruise 11 , Leg 1, Fort-de-France – Dakar, Feb 17 – March 12, 2009
Fig. 5.3 Schematic sketch of the seismic acquisition configuration
5.1.3.2 Processing of Data
The recorded seismic data was processed with “VISTA VW PROCESSING 3D” (Version 7.029) by GEDCO. All 16 channels were vertically stacked for a first and fast visualization. A bandwidth-filter was applied to remove noise caused by the streamer and the ship (Ormsby 20/25 – 200/220). GPS navigational datafiles in NMEA-format were additionally stored with the recording software MaMuCS (AG Spieß, Univ. Bremen).
In order to get a “shotpoint – position” list, the header data (recording time, shotpoint num-ber) was exported into a text file. This text file was then processed with the software WinGeoapp (Version: 0.8.5, by Hanno Keil, AG Spieß, Univ. Bremen) which is also able to incorporate the geometry of streamer gun – GPS-antenna and calculate the exact location of the common mid point of the shot gather.
For a better traceability of the basement, the amplitude scale was set to 3 dB. Moreover, an exponential gain (Gain Constant: 1.5) and an AGC scaling (window length: 500 ms) were used. Data recorded by the SAU II had to be reversed in polarity. Subsequently, the sediment surface and the basement were picked using the pick-function of VISTA.
Sediment thickness values connected with every shotpoint were obtained by interpolation with Matlab.
5.1.3.3 Results
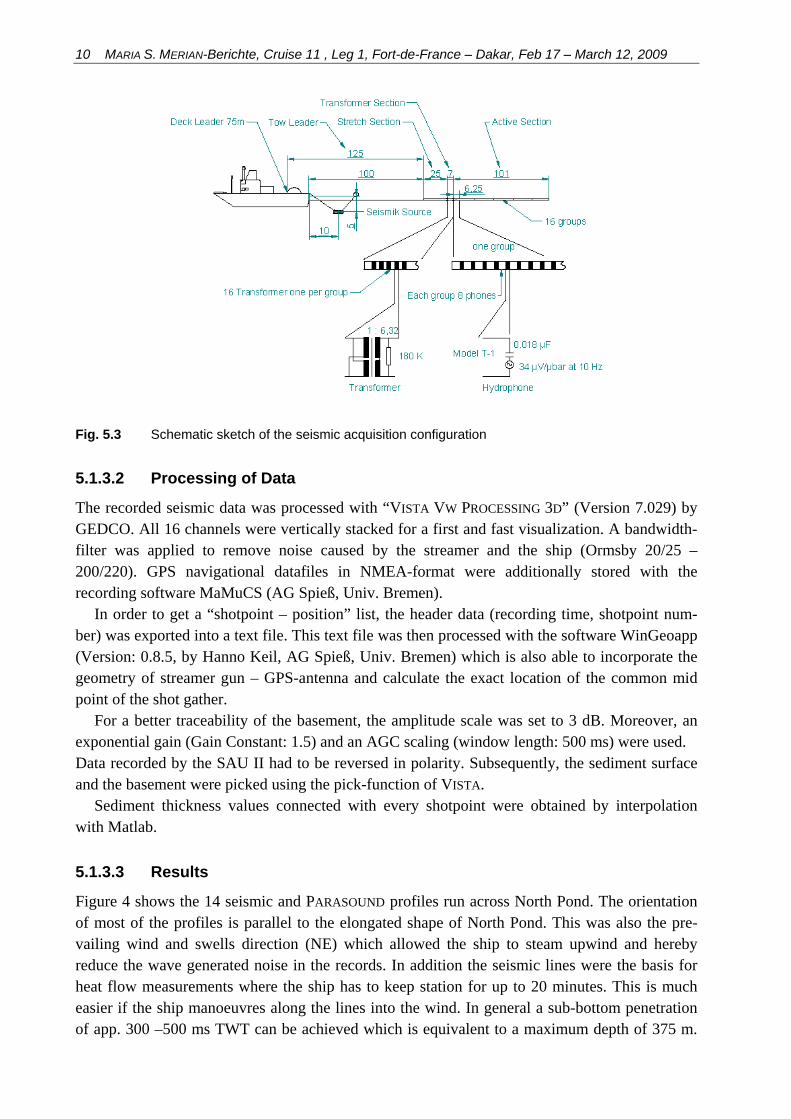
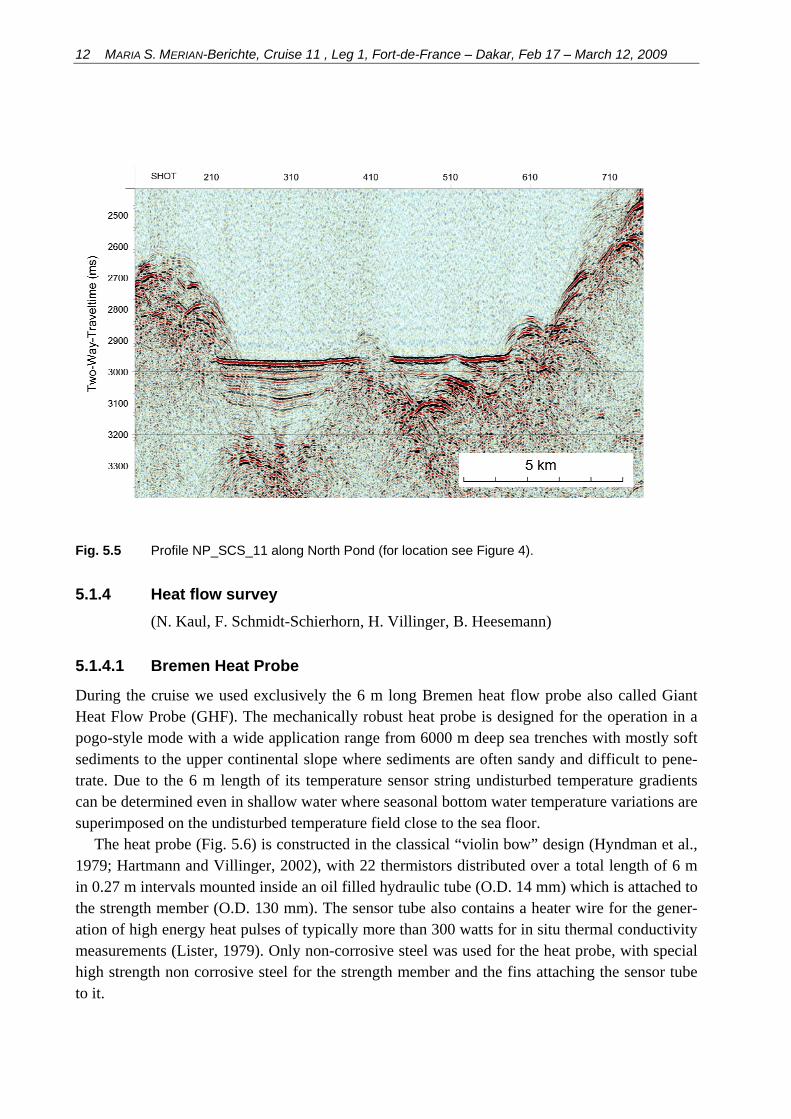
Figure 4 shows the 14 seismic and PARASOUND profiles run across North Pond. The orientation of most of the profiles is parallel to the elongated shape of North Pond. This was also the pre-vailing wind and swells direction (NE) which allowed the ship to steam upwind and hereby reduce the wave generated noise in the records. In addition the seismic lines were the basis for heat flow measurements where the ship has to keep station for up to 20 minutes. This is much easier if the ship manoeuvres along the lines into the wind. In general a sub-bottom penetration of app. 300 –500 ms TWT can be achieved which is equivalent to a maximum depth of 375 m.
MARIA S. MERIAN-Berichte, Cruise 11 , Leg 1, Fort-de-France – Dakar, Feb 17 – March12, 2009 11
The seafloor within the pond is characterized by a high impedance contrast. At the boundaries of North Pond severe side echoes due to the step slopes of the bounding outcropping basement deteriorate the record. Picking of the basement-sediment interface is in part quite difficult as its rough topography does not produce a clear reflection pattern. Migrating the records may improve the picture. Both ODP drill holes (395A and 1074A) will provide ties for validating basement picks.
Fig. 5.4 Bathymetry and location of all seismic profiles, heat flow measurements and gravity cores.
Existing heat flow measurements (Langseth et al., 1984, Langseth et al., 1992): filled red cir-
cles; new heat flow measurements: dark blue filled squares; gravity cores: light blue cicles.
12 MARIA S. MERIAN-Berichte, Cruise 11 , Leg 1, Fort-de-France – Dakar, Feb 17 – March 12, 2009
Fig. 5.5 Profile NP_SCS_11 along North Pond (for location see Figure 4).
5.1.4 Heat flow survey
(N. Kaul, F. Schmidt-Schierhorn, H. Villinger, B. Heesemann)
5.1.4.1 Bremen Heat Probe
During the cruise we used exclusively the 6 m long Bremen heat flow probe also called Giant Heat Flow Probe (GHF). The mechanically robust heat probe is designed for the operation in a pogo-style mode with a wide application range from 6000 m deep sea trenches with mostly soft sediments to the upper continental slope where sediments are often sandy and difficult to pene-trate. Due to the 6 m length of its temperature sensor string undisturbed temperature gradients can be determined even in shallow water where seasonal bottom water temperature variations are superimposed on the undisturbed temperature field close to the sea floor.
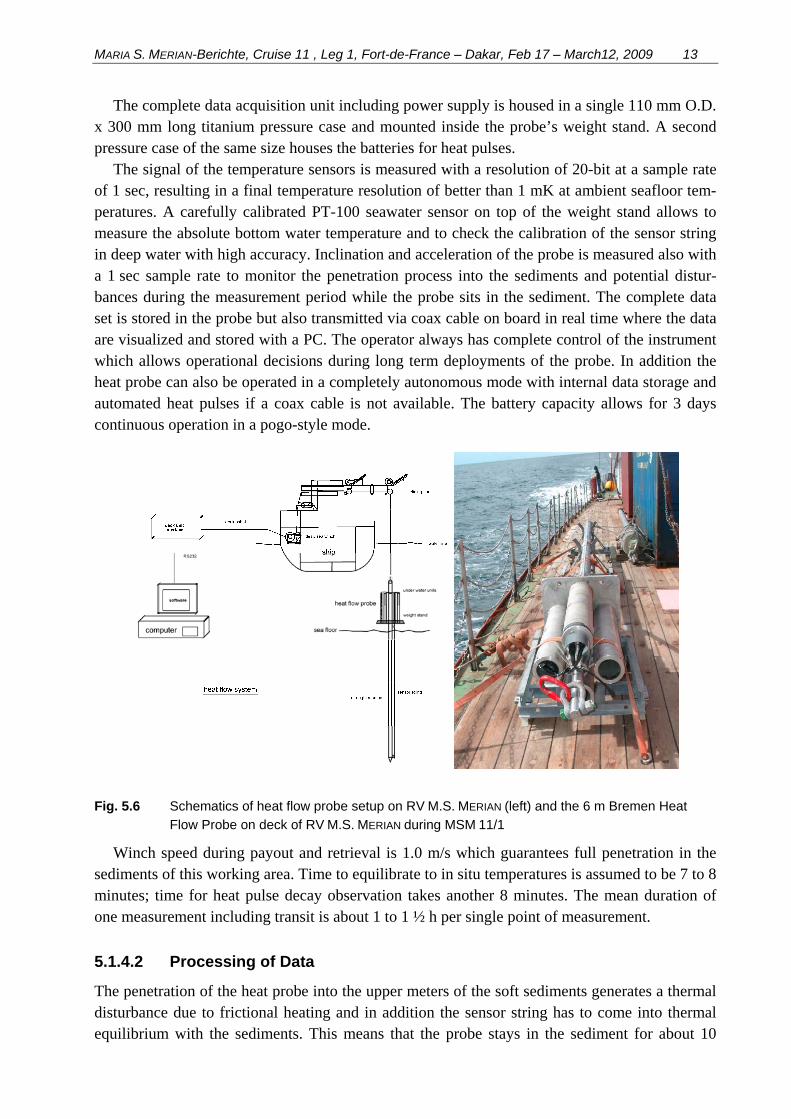
The heat probe (Fig. 5.6) is constructed in the classical “violin bow” design (Hyndman et al., 1979; Hartmann and Villinger, 2002), with 22 thermistors distributed over a total length of 6 m in 0.27 m intervals mounted inside an oil filled hydraulic tube (O.D. 14 mm) which is attached to the strength member (O.D. 130 mm). The sensor tube also contains a heater wire for the gener-ation of high energy heat pulses of typically more than 300 watts for in situ thermal conductivity measurements (Lister, 1979). Only non-corrosive steel was used for the heat probe, with special high strength non corrosive steel for the strength member and the fins attaching the sensor tube to it.
MARIA S. MERIAN-Berichte, Cruise 11 , Leg 1, Fort-de-France – Dakar, Feb 17 – March12, 2009 13
The complete data acquisition unit including power supply is housed in a single 110 mm O.D. x 300 mm long titanium pressure case and mounted inside the probe’s weight stand. A second pressure case of the same size houses the batteries for heat pulses.
The signal of the temperature sensors is measured with a resolution of 20-bit at a sample rate of 1 sec, resulting in a final temperature resolution of better than 1 mK at ambient seafloor tem-peratures. A carefully calibrated PT-100 seawater sensor on top of the weight stand allows to measure the absolute bottom water temperature and to check the calibration of the sensor string in deep water with high accuracy. Inclination and acceleration of the probe is measured also with a 1 sec sample rate to monitor the penetration process into the sediments and potential distur-bances during the measurement period while the probe sits in the sediment. The complete data set is stored in the probe but also transmitted via coax cable on board in real time where the data are visualized and stored with a PC. The operator always has complete control of the instrument which allows operational decisions during long term deployments of the probe. In addition the heat probe can also be operated in a completely autonomous mode with internal data storage and automated heat pulses if a coax cable is not available. The battery capacity allows for 3 days continuous operation in a pogo-style mode.
Fig. 5.6 Schematics of heat flow probe setup on RV M.S. MERIAN (left) and the 6 m Bremen Heat
Flow Probe on deck of RV M.S. MERIAN during MSM 11/1
Winch speed during payout and retrieval is 1.0 m/s which guarantees full penetration in the sediments of this working area. Time to equilibrate to in situ temperatures is assumed to be 7 to 8 minutes; time for heat pulse decay observation takes another 8 minutes. The mean duration of one measurement including transit is about 1 to 1 ½ h per single point of measurement.
5.1.4.2 Processing of Data
The penetration of the heat probe into the upper meters of the soft sediments generates a thermal disturbance due to frictional heating and in addition the sensor string has to come into thermal equilibrium with the sediments. This means that the probe stays in the sediment for about 10
14 MARIA S. MERIAN-Berichte, Cruise 11 , Leg 1, Fort-de-France – Dakar, Feb 17 – March 12, 2009
minutes, however it will not have equilibrated at the end of this time. Therefore the temperature decay has to be fitted to a theoretical decay model. In situ thermal conductivity is measured with the heat pulse method (Lister, 1979) where the sensor string is heated up for typically 20 to 30 s and the thermal conductivity is derived from the temperature decay. Both decays, frictional and heat pulse decay, can be described by the same mathematical model.
The basic processing steps of heat flow measurements is outlined in Hyndman et al. (1979) which was then a manual procedure based on the work of Lister (1970) and Lister (1979):
1. determine undisturbed sediment temperatures from frictional decay 2. correct heat pulse decay for the remaining effect of the frictional decay 3. calculate in situ thermal conductivities from heat pulse decay.
The theoretical background for the analysis of heat flow measurements is discussed in Bullard
(1954), Lister (1970), Hyndman et al. (1979), Villinger & Davis (1987) and Hartmann & Villinger (2002). To overcome deficiencies of the processing routine described in Villinger & Davis (1987) and to incorporate platform independent plotting routines, a mathematically sound inversion scheme of observed temperature decays was implemented in a program called T2C (Hartmann & Villinger, 2002), using Matlab®. In addition inversion theory allows the calcula-tion of realistic errors in a well-defined and mathematically rigorous way based on the sample rate and temperature resolution used.
5.1.4.3 Preliminary Results
Heat flow profiles comprise measurements with a spacing of about 1 km. Multi penetration mode (pogo style) is the most effective way of advancing along a profile while the probe is lifted above sea floor some hundred meters. With few exceptions all measurements are located on a seismic line in order to facilitate interpretation of the data and estimation of temperature at the sediment-basement interface.
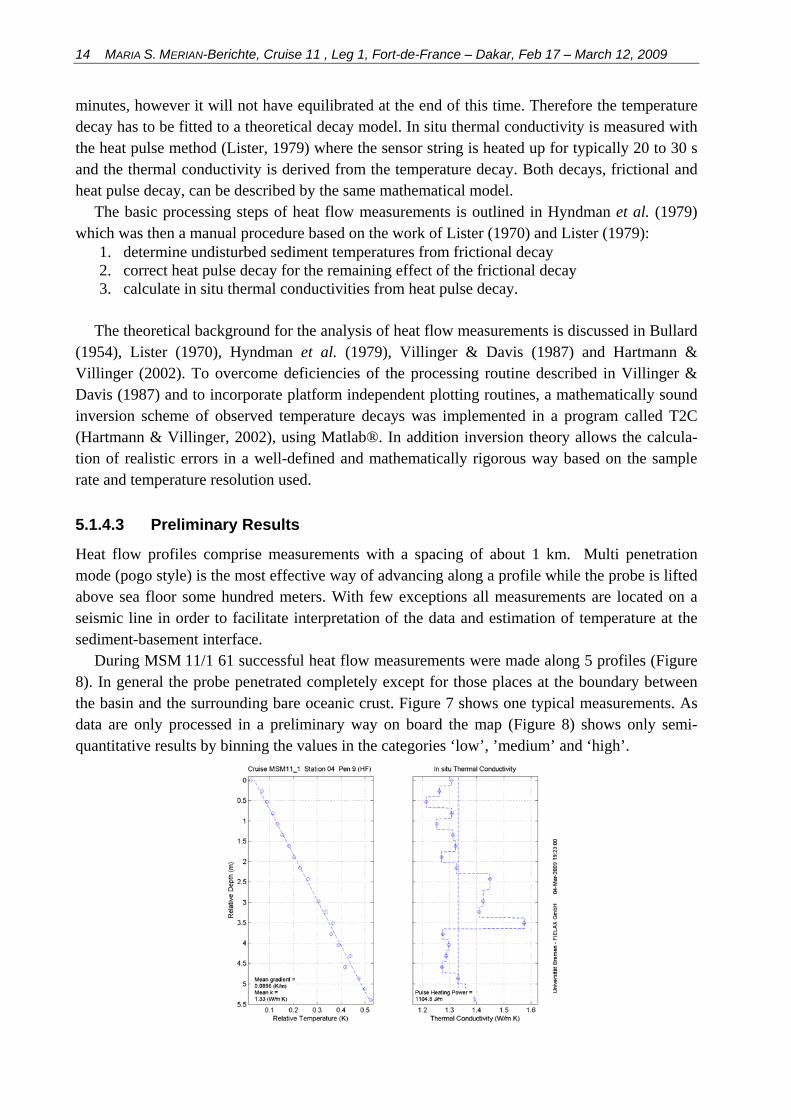
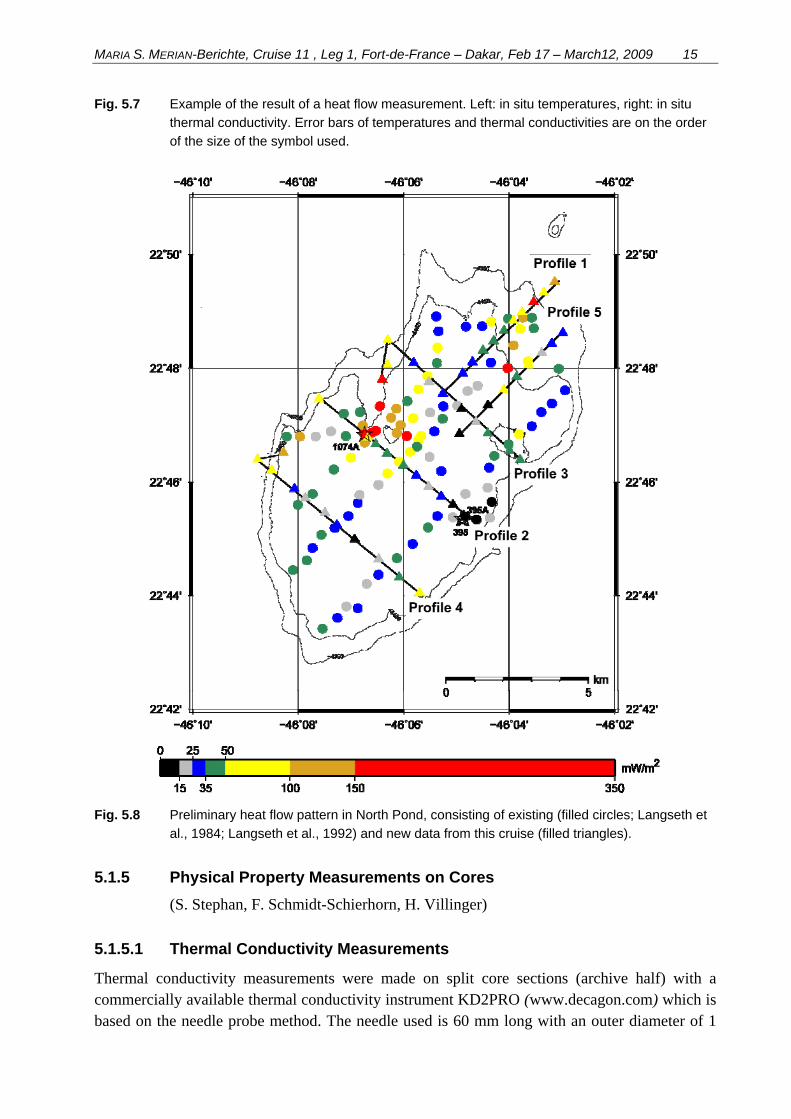
During MSM 11/1 61 successful heat flow measurements were made along 5 profiles (Figure 8). In general the probe penetrated completely except for those places at the boundary between the basin and the surrounding bare oceanic crust. Figure 7 shows one typical measurements. As data are only processed in a preliminary way on board the map (Figure 8) shows only semi-quantitative results by binning the values in the categories ‘low’, ’medium’ and ‘high’.
MARIA S. MERIAN-Berichte, Cruise 11 , Leg 1, Fort-de-France – Dakar, Feb 17 – March12, 2009 15
Fig. 5.7 Example of the result of a heat flow measurement. Left: in situ temperatures, right: in situ
thermal conductivity. Error bars of temperatures and thermal conductivities are on the order
of the size of the symbol used.
Fig. 5.8 Preliminary heat flow pattern in North Pond, consisting of existing (filled circles; Langseth et
al., 1984; Langseth et al., 1992) and new data from this cruise (filled triangles).
5.1.5 Physical Property Measurements on Cores
(S. Stephan, F. Schmidt-Schierhorn, H. Villinger)
5.1.5.1 Thermal Conductivity Measurements
Thermal conductivity measurements were made on split core sections (archive half) with a commercially available thermal conductivity instrument KD2PRO (www.decagon.com) which is based on the needle probe method. The needle used is 60 mm long with an outer diameter of 1
16 MARIA S. MERIAN-Berichte, Cruise 11 , Leg 1, Fort-de-France – Dakar, Feb 17 – March 12, 2009
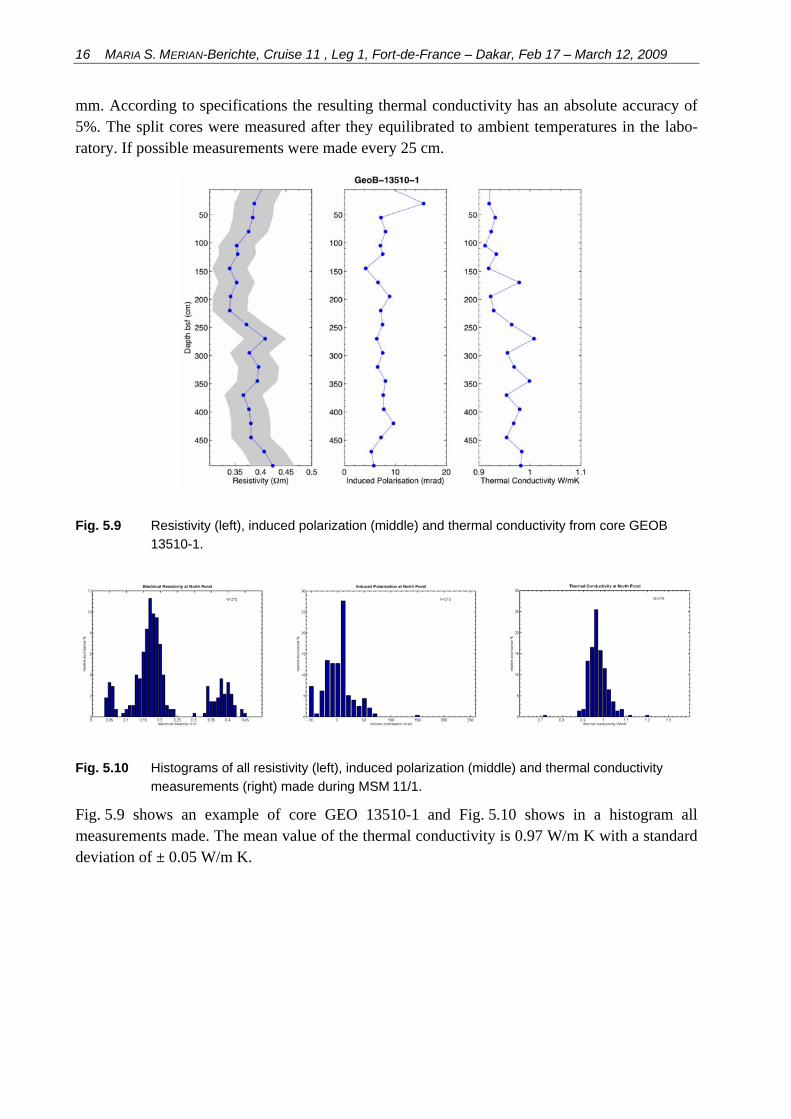
mm. According to specifications the resulting thermal conductivity has an absolute accuracy of 5%. The split cores were measured after they equilibrated to ambient temperatures in the labo-ratory. If possible measurements were made every 25 cm.
Fig. 5.9 Resistivity (left), induced polarization (middle) and thermal conductivity from core GEOB
13510-1.
Fig. 5.10 Histograms of all resistivity (left), induced polarization (middle) and thermal conductivity
measurements (right) made during MSM 11/1.
Fig. 5.9 shows an example of core GEO 13510-1 and Fig. 5.10 shows in a histogram all measurements made. The mean value of the thermal conductivity is 0.97 W/m K with a standard deviation of ± 0.05 W/m K.
MARIA S. MERIAN-Berichte, Cruise 11 , Leg 1, Fort-de-France – Dakar, Feb 17 – March12, 2009 17
5.1.5.2 Measurement of Electrical Resistivity
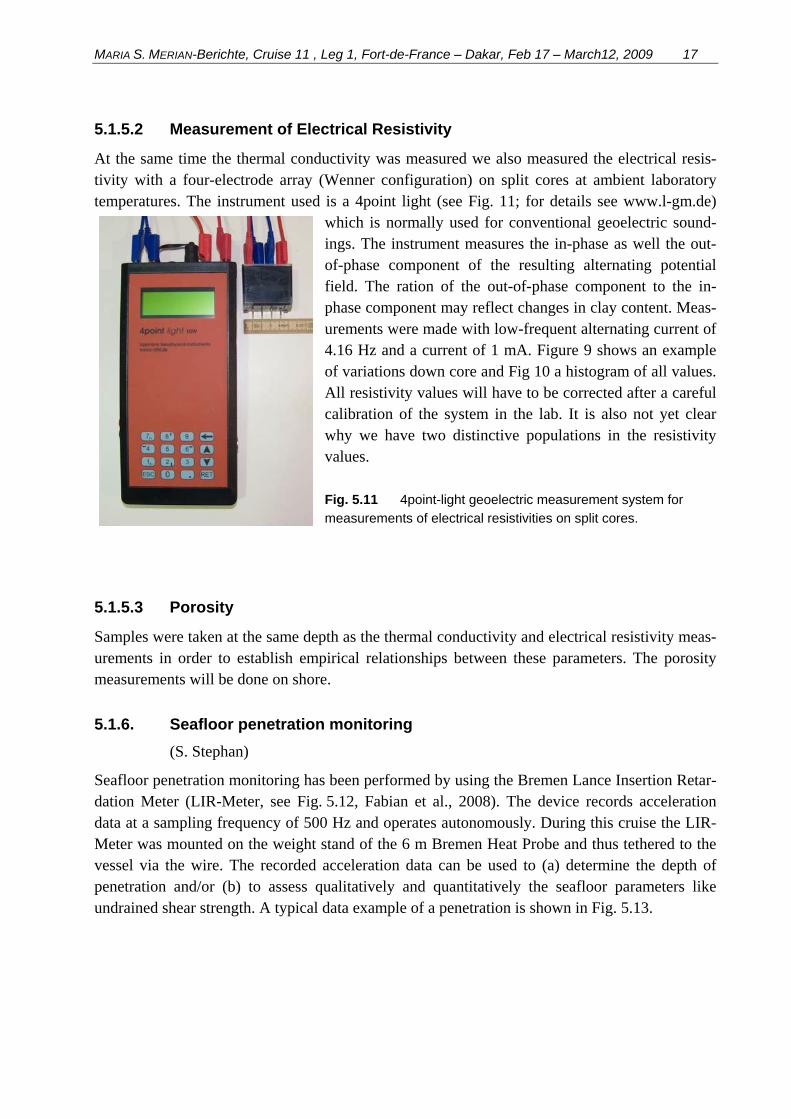
At the same time the thermal conductivity was measured we also measured the electrical resis-tivity with a four-electrode array (Wenner configuration) on split cores at ambient laboratory temperatures. The instrument used is a 4point light (see Fig. 11; for details see www.l-gm.de)
which is normally used for conventional geoelectric sound-ings. The instrument measures the in-phase as well the out-of-phase component of the resulting alternating potential field. The ration of the out-of-phase component to the in-phase component may reflect changes in clay content. Meas-urements were made with low-frequent alternating current of 4.16 Hz and a current of 1 mA. Figure 9 shows an example of variations down core and Fig 10 a histogram of all values. All resistivity values will have to be corrected after a careful calibration of the system in the lab. It is also not yet clear why we have two distinctive populations in the resistivity values.
Fig. 5.11 4point-light geoelectric measurement system for
measurements of electrical resistivities on split cores.
5.1.5.3 Porosity
Samples were taken at the same depth as the thermal conductivity and electrical resistivity meas-urements in order to establish empirical relationships between these parameters. The porosity measurements will be done on shore.
5.1.6. Seafloor penetration monitoring
(S. Stephan)
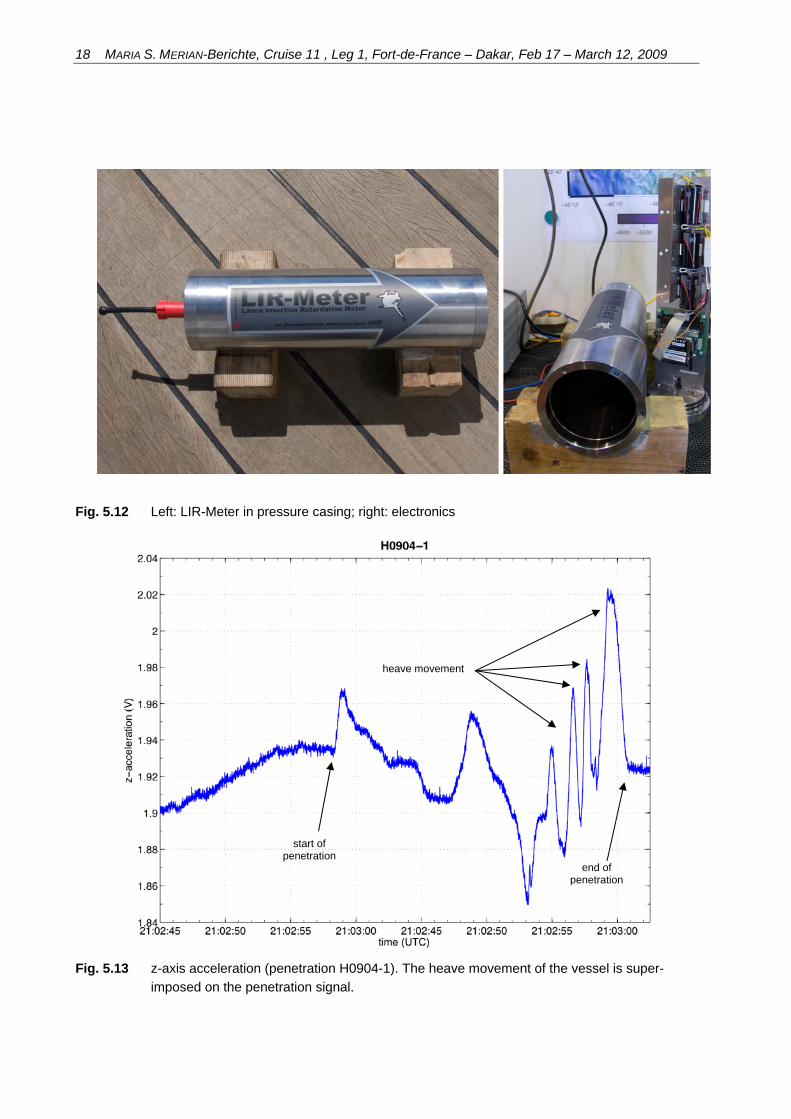
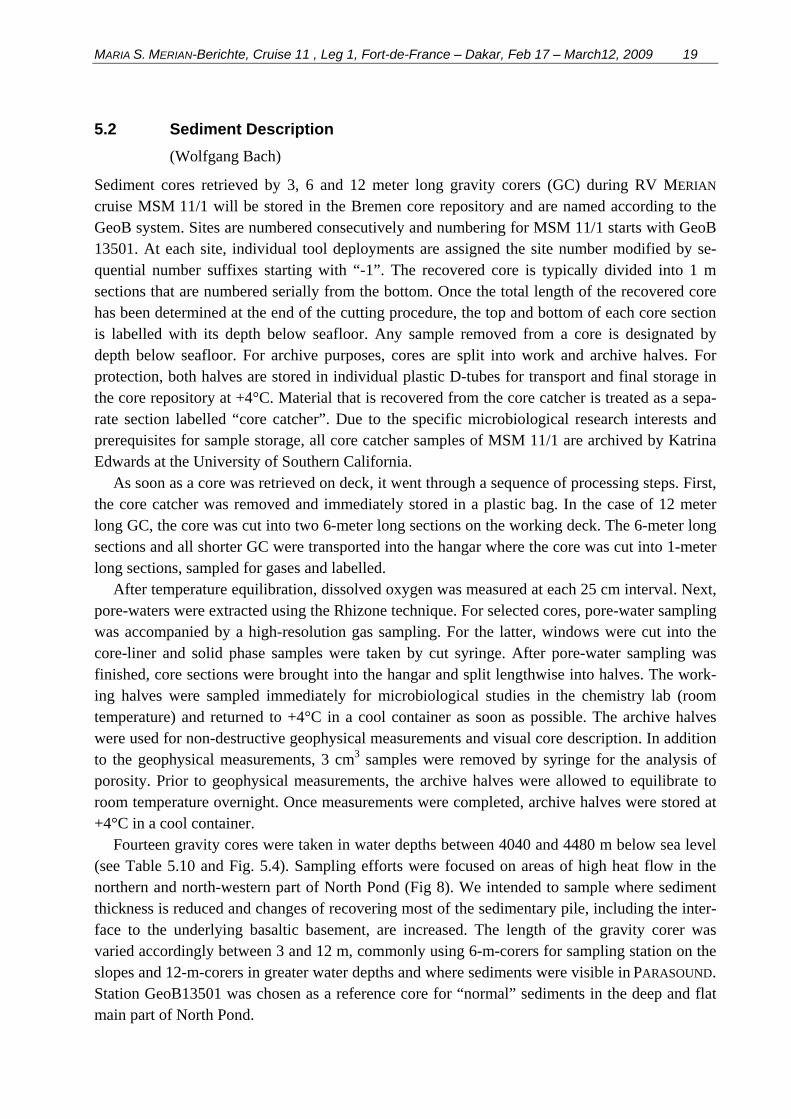
Seafloor penetration monitoring has been performed by using the Bremen Lance Insertion Retar-dation Meter (LIR-Meter, see Fig. 5.12, Fabian et al., 2008). The device records acceleration data at a sampling frequency of 500 Hz and operates autonomously. During this cruise the LIR-Meter was mounted on the weight stand of the 6 m Bremen Heat Probe and thus tethered to the vessel via the wire. The recorded acceleration data can be used to (a) determine the depth of penetration and/or (b) to assess qualitatively and quantitatively the seafloor parameters like undrained shear strength. A typical data example of a penetration is shown in Fig. 5.13.
18 MARIA S. MERIAN-Berichte, Cruise 11 , Leg 1, Fort-de-France – Dakar, Feb 17 – March 12, 2009
Fig. 5.12 Left: LIR-Meter in pressure casing; right: electronics
Fig. 5.13 z-axis acceleration (penetration H0904-1). The heave movement of the vessel is super-
imposed on the penetration signal.
end of penetration
heave movement
start of penetration
MARIA S. MERIAN-Berichte, Cruise 11 , Leg 1, Fort-de-France – Dakar, Feb 17 – March12, 2009 19
5.2 Sediment Description
(Wolfgang Bach)
Sediment cores retrieved by 3, 6 and 12 meter long gravity corers (GC) during RV MERIAN cruise MSM 11/1 will be stored in the Bremen core repository and are named according to the GeoB system. Sites are numbered consecutively and numbering for MSM 11/1 starts with GeoB 13501. At each site, individual tool deployments are assigned the site number modified by se-quential number suffixes starting with “-1”. The recovered core is typically divided into 1 m sections that are numbered serially from the bottom. Once the total length of the recovered core has been determined at the end of the cutting procedure, the top and bottom of each core section is labelled with its depth below seafloor. Any sample removed from a core is designated by depth below seafloor. For archive purposes, cores are split into work and archive halves. For protection, both halves are stored in individual plastic D-tubes for transport and final storage in the core repository at +4°C. Material that is recovered from the core catcher is treated as a sepa-rate section labelled “core catcher”. Due to the specific microbiological research interests and prerequisites for sample storage, all core catcher samples of MSM 11/1 are archived by Katrina Edwards at the University of Southern California.
As soon as a core was retrieved on deck, it went through a sequence of processing steps. First, the core catcher was removed and immediately stored in a plastic bag. In the case of 12 meter long GC, the core was cut into two 6-meter long sections on the working deck. The 6-meter long sections and all shorter GC were transported into the hangar where the core was cut into 1-meter long sections, sampled for gases and labelled.
After temperature equilibration, dissolved oxygen was measured at each 25 cm interval. Next, pore-waters were extracted using the Rhizone technique. For selected cores, pore-water sampling was accompanied by a high-resolution gas sampling. For the latter, windows were cut into the core-liner and solid phase samples were taken by cut syringe. After pore-water sampling was finished, core sections were brought into the hangar and split lengthwise into halves. The work-ing halves were sampled immediately for microbiological studies in the chemistry lab (room temperature) and returned to +4°C in a cool container as soon as possible. The archive halves were used for non-destructive geophysical measurements and visual core description. In addition to the geophysical measurements, 3 cm3 samples were removed by syringe for the analysis of porosity. Prior to geophysical measurements, the archive halves were allowed to equilibrate to room temperature overnight. Once measurements were completed, archive halves were stored at +4°C in a cool container.
Fourteen gravity cores were taken in water depths between 4040 and 4480 m below sea level (see Table 5.10 and Fig. 5.4). Sampling efforts were focused on areas of high heat flow in the northern and north-western part of North Pond (Fig 8). We intended to sample where sediment thickness is reduced and changes of recovering most of the sedimentary pile, including the inter-face to the underlying basaltic basement, are increased. The length of the gravity corer was varied accordingly between 3 and 12 m, commonly using 6-m-corers for sampling station on the slopes and 12-m-corers in greater water depths and where sediments were visible in PARASOUND. Station GeoB13501 was chosen as a reference core for “normal” sediments in the deep and flat main part of North Pond.
20 MARIA S. MERIAN-Berichte, Cruise 11 , Leg 1, Fort-de-France – Dakar, Feb 17 – March 12, 2009
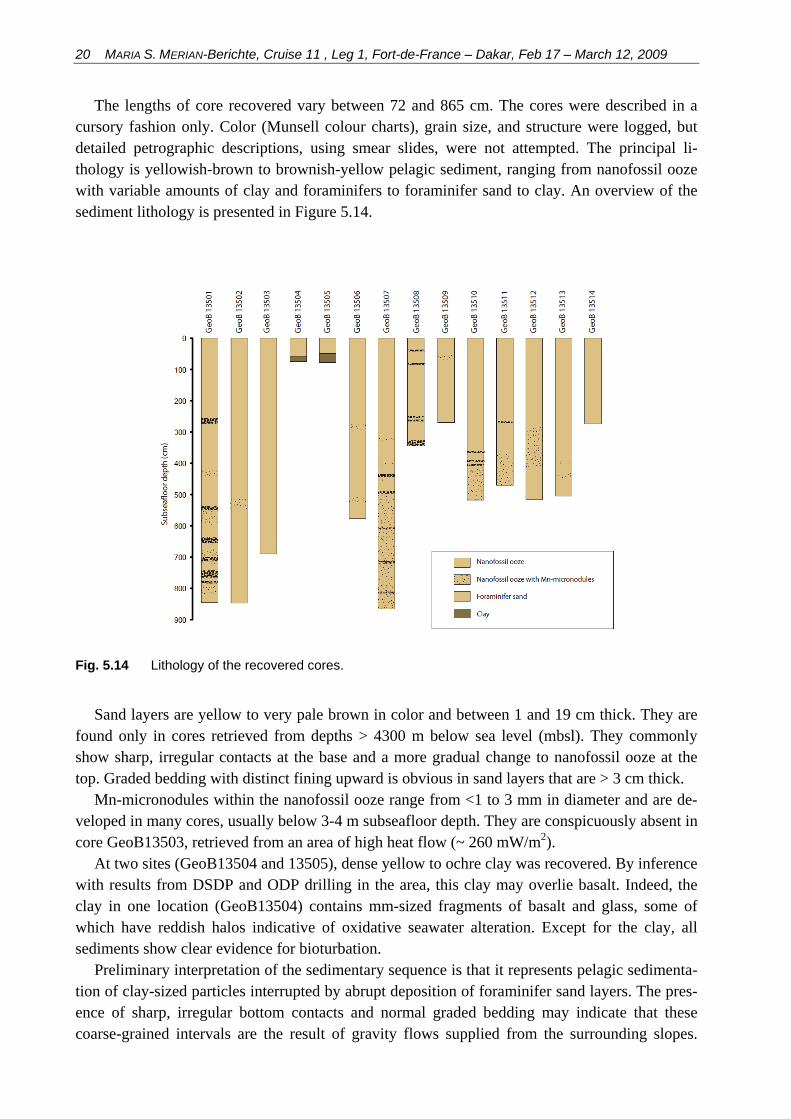
The lengths of core recovered vary between 72 and 865 cm. The cores were described in a cursory fashion only. Color (Munsell colour charts), grain size, and structure were logged, but detailed petrographic descriptions, using smear slides, were not attempted. The principal li-thology is yellowish-brown to brownish-yellow pelagic sediment, ranging from nanofossil ooze with variable amounts of clay and foraminifers to foraminifer sand to clay. An overview of the sediment lithology is presented in Figure 5.14.
Fig. 5.14 Lithology of the recovered cores.
Sand layers are yellow to very pale brown in color and between 1 and 19 cm thick. They are
found only in cores retrieved from depths > 4300 m below sea level (mbsl). They commonly show sharp, irregular contacts at the base and a more gradual change to nanofossil ooze at the top. Graded bedding with distinct fining upward is obvious in sand layers that are > 3 cm thick.
Mn-micronodules within the nanofossil ooze range from <1 to 3 mm in diameter and are de-veloped in many cores, usually below 3-4 m subseafloor depth. They are conspicuously absent in core GeoB13503, retrieved from an area of high heat flow (~ 260 mW/m2).
At two sites (GeoB13504 and 13505), dense yellow to ochre clay was recovered. By inference with results from DSDP and ODP drilling in the area, this clay may overlie basalt. Indeed, the clay in one location (GeoB13504) contains mm-sized fragments of basalt and glass, some of which have reddish halos indicative of oxidative seawater alteration. Except for the clay, all sediments show clear evidence for bioturbation.
Preliminary interpretation of the sedimentary sequence is that it represents pelagic sedimenta-tion of clay-sized particles interrupted by abrupt deposition of foraminifer sand layers. The pres-ence of sharp, irregular bottom contacts and normal graded bedding may indicate that these coarse-grained intervals are the result of gravity flows supplied from the surrounding slopes.
MARIA S. MERIAN-Berichte, Cruise 11 , Leg 1, Fort-de-France – Dakar, Feb 17 – March12, 2009 21
Consistent with this interpretation, the sand layers are commonly found at sites of water depth >4300 mbsl and are missing entirely in cores retrieved from the less sedimented slopes.
5.3 Biogeochemistry
(T. Ferdelman, V. Heuer, M. Kellermann, J. McManus, J. Muratli, A. Picard, W. Ziebis)
5.3.1 Core Flow and Pore Water Sampling
Temperature plays an important role in many geochemical and microbiological reactions. There-fore, core processing was organized to minimize departures in core sediment temperature from in situ temperatures. Gravity core sections were cut and numbered as quickly as possible on deck and immediately brought into the +4°C cooled laboratory. Core sections were then properly la-beled according to the University of Bremen “GeoB” system. Holes (18 mm) were drilled at 25 cm intervals on the work-half. Temperature was measured and if necessary the cores were placed at -20° C for a few minutes to bring the core temperature back down to +4°C.
5.3.2 Inorganic Pore Water Chemistry
Holes (18 mm) were drilled at 25 cm intervals on the work-half. Temperature was measured and if necessary the cores were placed at -20° C for a few minutes to bring the core temperature back down to +4°C. After temperature equilibration dissolved oxygen was measured at each 25 cm interval along the gravity core using amperometric (Clark-style) micro-electrodes. The micro-electrodes (Unisense) were specially encased in steel needles for increased robustness and pene-trated 6 cm into the core (the centre). At most sites dual measurements using two independent electrodes were performed. Temperature was constantly monitored.
Immediately subsequent to the dissolved oxygen measurements pore waters were extracted using the Rhizone technique (ca 0.2 µm pore diameter). Typical yields were 15 mL of pore wa-ter. Samples were split for dissolved inorganic carbon and total alkalinity (DIC/TA), metals, cations, and nutrients. Table 5.5 shows the shipboard and planned measurements. A total of 262 samples were taken.
22 MARIA S. MERIAN-Berichte, Cruise 11 , Leg 1, Fort-de-France – Dakar, Feb 17 – March 12, 2009
Table 5.5 Overview on shipboard and planned measurements
Analyte Volume (mL) Laboratory DIC/ Total Alkalinity 2 Shipboard Sulfate/Chloride 2 MPI Bremen Mg/Ca 2 OSU Nutrients (N,P, Si) 4 OSU Mn/Fe 1 OSU Nitrate (selected samples) 1 Shipboard
Dissolved Inorganic Carbon (DIC) was measured onboard using a flow-through injection method (Hall et al. 19xx). Total alkalinity was measured immediately afterwards by Gran titration (IODP Technical Note 15) on 1 mL aliquots diluted up to 5 mL in 0.7 mole L-1 KCl solution. HCl titrant was standardized against borate and checked against IAPSO standard seawater.
Nitrate was measured on selected samples using the spongy cadmium reduction method (Jones, 1994) and colorimetric determination of nitrite. Further samples for pore water virus counting (USC) and sulfate sulfur and oxygen isotope composition (MPI) were taken from the remaining pore water solutions.
5.3.3 Hydrogen and Organic Geochemistry
As organic geochemists, we aim to study microbial life and processes in the deep subsurface by deciphering the information encoded in structural and isotopic properties of sedimentary organic molecules. These molecules encompass (a) intact membrane lipids (IPLs) indicative of biomass from active subsurface prokaryotes and (b) low-molecular-weight organic compounds that act as central intermediates in many metabolic processes. Route (a) leads to general taxonomic infor-mation on the active sedimentary community, estimates on the population density, and to con-straints on the carbon fixation pathways and carbon sources utilized by prokaryotes in situ (Biddle et al., 2006, Lipp et al., 2008). Route (b) derives information on the dominant metabolic processes from the distribution, abundance, and isotopic composition of central intermediates such as acetate (Heuer et al., 2006; 2009). To complement information on metabolic processes, we also monitor the abundance of another key metabolite, hydrogen, which is (a) both produced and consumed by a wide variety of microorganisms during the decomposition of organic matter and (b) formed during hydrothermal alteration of oceanic crust. To better understand the organic carbon sources that are available in the deep subseafloor biosphere and the alteration of organic matter during burial, we aim to explore the molecular structure of marine dissolved organic matter by ultrahigh-resolution mass spectrometry via the Fourier transform-ion cyclotron reso-nance technique (FT-ICR-MS).
During MSM 11/1, samples for hydrogen analysis were taken from the bottom of freshly cut sections when gravity cores were cut and labelled in the hangar. For a few selected cores, we took temperature controlled samples for hydrogen analysis in a higher depth-resolution by cutting windows into the core-liners after cores had equilibrated to +4°C in the cold room. Hydrogen analyses were conducted on-board with a reduced gas analyzer (Trace Analytical) immediately after sampling following the approach of Novelli et al. (1987). For shore-based qualitative, quantitative and carbon isotopic analysis of organic low-molecular-weight com-
MARIA S. MERIAN-Berichte, Cruise 11 , Leg 1, Fort-de-France – Dakar, Feb 17 – March12, 2009 23
pounds by isotope-ratio monitoring liquid chromatography/mass spectrometry (irm-LC/MS), for carbon isotopic analysis of dissolved inorganic carbon (DIC), and for structural analysis of dis-solved organic matter by FT-ICR-MS pore-water samples were taken by rhizoming the intact gravity core through holes that were drilled into the core-liner. In general, the depth resolution was one sample per meter. Pore-water sampling was conducted in the cool-room as soon as oxy-gen analyses were completed, in general within six hours after core-retrieval. For contamination control, blanks were taken from each individual rhizome. Solid phase samples for shore-based analysis of IPLs were taken in close cooperation with the microbiologists from the work halves of the split cores. For more information on the solid phase sampling see section 4.3. In total, we took 135 solid phase samples for analysis of IPLs and sampled 87 and 39 depths for pore-water and gas analyses, respectively. Pore-water and solid phase samples are stored at -20°C.
5.3.4 Experimental Biogeochemistry
The microbial uptake of carbon, nitrogen and phosphorus in North Pond sediments was investi-gated by the application of radio-labelled uptake experiments to selected sediment samples – principally at Site GeoB 13501. Shipboard experiments using 3H-thymidine, 14C-leucine, 14C-glucose, 14C-bicarbonate, 35S-sulfate and 33P-phosphate were performed on selected cores. Processing of these samples will take place in Bremen (MPI). Further experiments for N2 fixa-tion will be performed in shore-based labs (USC).
Experiments to investigate microbial activity in deep sediment pore waters were also initiated. Pore waters from Sites GeoB 13507, 13513, and 13504 were extracted by pressing through 8 µm filters using a Reeburgh-type pore water press. Aliquots were preserved for cell counts as well as labelling with 33P and 14C-bicarbonate.
The effects of pressure on microbial activities in sediments are not clear. A few studies have shown that metabolic activities in sediments are potentially higher when measured under in situ pressure. Measuring activities only at atmospheric pressure can lead to an underestimation of the potential activity rates. We thus brought on board five pressure vessels and a pressure pump in order to compare atmospheric-pressure and in situ-pressure activities, and also to store samples under in situ pressure for further analyses in the laboratory (MPI, Bremen).
The pressure at the bottom of North Pond is about 45 MPa at 4500 m depth ; the hydrostatic pressure is thus an important parameter for the microbial communities in North Pond sediments and bottom water. By maintaining the cores and the samples at 4°C as long as possible, we could limit the effects of decompression.
The first core (GeoB13501-1) was processed on board. We tested the ability for the North Pond sediment communities to synthesize DNA, to synthesize proteins and to incorporate/respire glucose by using the following radio-labeled compounds, respectively: 3H-thymidine (2.22-3.33 TBq/mmol), 14C-leucine (7.4-11.1 Gbq/mmol) and 14C-glucose (9.76 Gbq/mmol).
Samples from the upper section (1.05 mbsf) , middle section (4.02 mbsf) and bottom section (8.02 mbsf) of core GeoB13501-1 were selected. 1:1 slurries were prepared with artificial sea-water medium. For each section, the incorporation of the three radio-labelled compounds was tested independently in 2 ml aliquotes at 4°C, at atmospheric (0.1 MPa) and in situ pressure (~ 45 MPa). Negative controls were prepared by treating the slurry with 37% formaldehyde before injecting the radio-labelled compounds.
24 MARIA S. MERIAN-Berichte, Cruise 11 , Leg 1, Fort-de-France – Dakar, Feb 17 – March 12, 2009
The first samples were taken after 36 hours and processed on board. Activity has neither been detected at 0.1 MPa nor at 45 MPa, i.e. any compound has been incorporated in the microbial cells present in the sediments. The second samples were taken after 12 days and all activity was stopped with 37% formaldehyde. These samples will be processed at MPI, Bremen. A third set of samples is still incubating at 4°C, at 0.1 MPa and 45 MPa and will be brought back and ana-lyzed in Bremen.
Fifty 50 cc of sediments have been taken with a 1-m resolution in each core. Additional sam-ples were taken when different lithological horizons were present. All samples are kept at 4°C. Some selected samples have been pressurized back at in situ pressure. All samples will be ana-lyzed at MPI, Bremen.
5.3.5 Preliminary Results
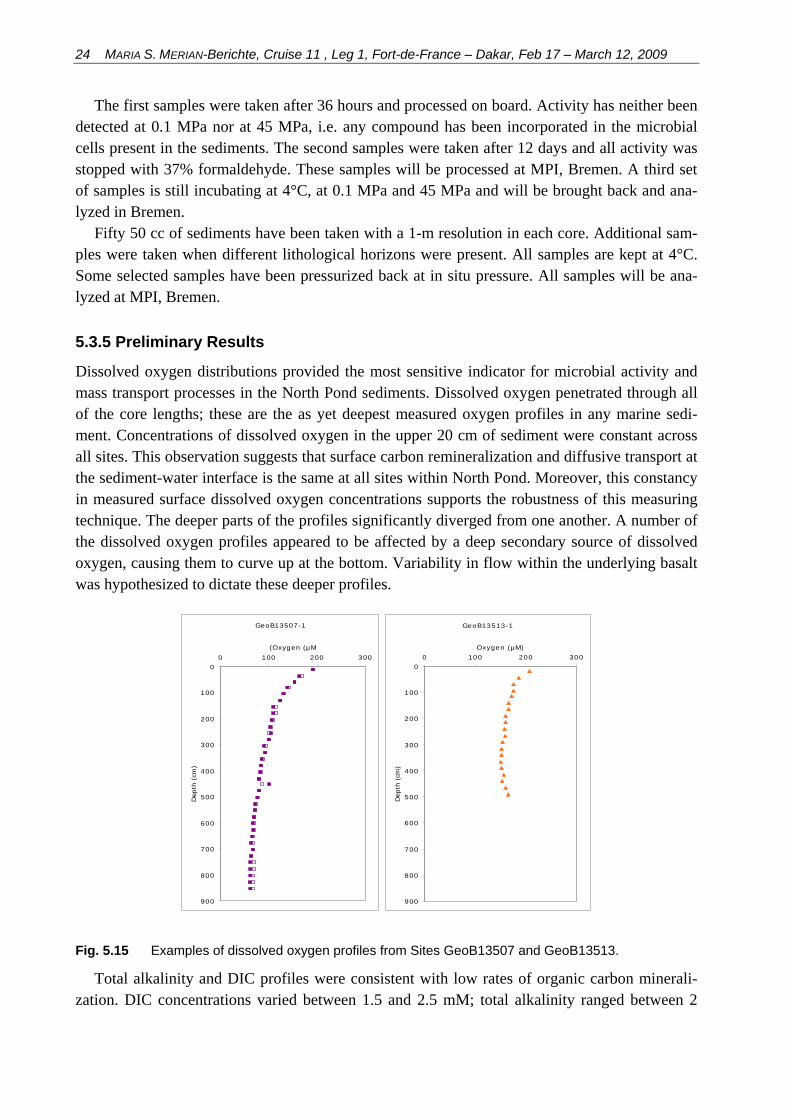
Dissolved oxygen distributions provided the most sensitive indicator for microbial activity and mass transport processes in the North Pond sediments. Dissolved oxygen penetrated through all of the core lengths; these are the as yet deepest measured oxygen profiles in any marine sedi-ment. Concentrations of dissolved oxygen in the upper 20 cm of sediment were constant across all sites. This observation suggests that surface carbon remineralization and diffusive transport at the sediment-water interface is the same at all sites within North Pond. Moreover, this constancy in measured surface dissolved oxygen concentrations supports the robustness of this measuring technique. The deeper parts of the profiles significantly diverged from one another. A number of the dissolved oxygen profiles appeared to be affected by a deep secondary source of dissolved oxygen, causing them to curve up at the bottom. Variability in flow within the underlying basalt was hypothesized to dictate these deeper profiles.
GeoB13507-1
0
100
200
300
400
500
600
700
800
900
0 100 200 300(Oxygen (µM
Dep
th (cm
)
GeoB13513-1
0
100
200
300
400
500
600
700
800
900
0 100 200 300Oxygen (µM)
Dep
th (cm
)
Fig. 5.15 Examples of dissolved oxygen profiles from Sites GeoB13507 and GeoB13513.
Total alkalinity and DIC profiles were consistent with low rates of organic carbon minerali-zation. DIC concentrations varied between 1.5 and 2.5 mM; total alkalinity ranged between 2
MARIA S. MERIAN-Berichte, Cruise 11 , Leg 1, Fort-de-France – Dakar, Feb 17 – March12, 2009 25
and 3 mM. DIC profiles indicated a very slight upward flux of dissolved inorganic carbon at a number of sites.
5.4 Microbiology
(J. Biddle, A. Blazejak, K. Edwards, N. Knab, A. Picard, A. Schippers, A. Teske)
Viable, diverse, and distinct microbiological communities occur in deeply buried marine sedi-ments. Where they derive from is unknown. For example, microorganisms from overlying deep seawater are a steady source of inoculum that seeds microorganisms (particle-attached and free-living) to sediments. Hence, all sediment layers can in principle harbour a population that derives from this initial deep-water inoculum. Alternatively, microbial inoculum may be provided by direct or indirect transport. For example, by vertical advective transport from the ocean crust basement (passive transport) or by lateral active transport (swimming) from adjacent, older sediments following redox gradients. To address these possibilities, sediment was sampled at different locations of the North Pond for microbiological analysis. Microbiological sampling on MSM 11/1 focussed on the seawater - sediment interface, the upper sediment layers (possibility 1) and the sediment - basement interface (possibility 2) by gravity coring in order to address first order questions about where microbes come from – above, or below? The planned IODP North Pond expedition will focus on the deeper sediment and the ocean crust itself.
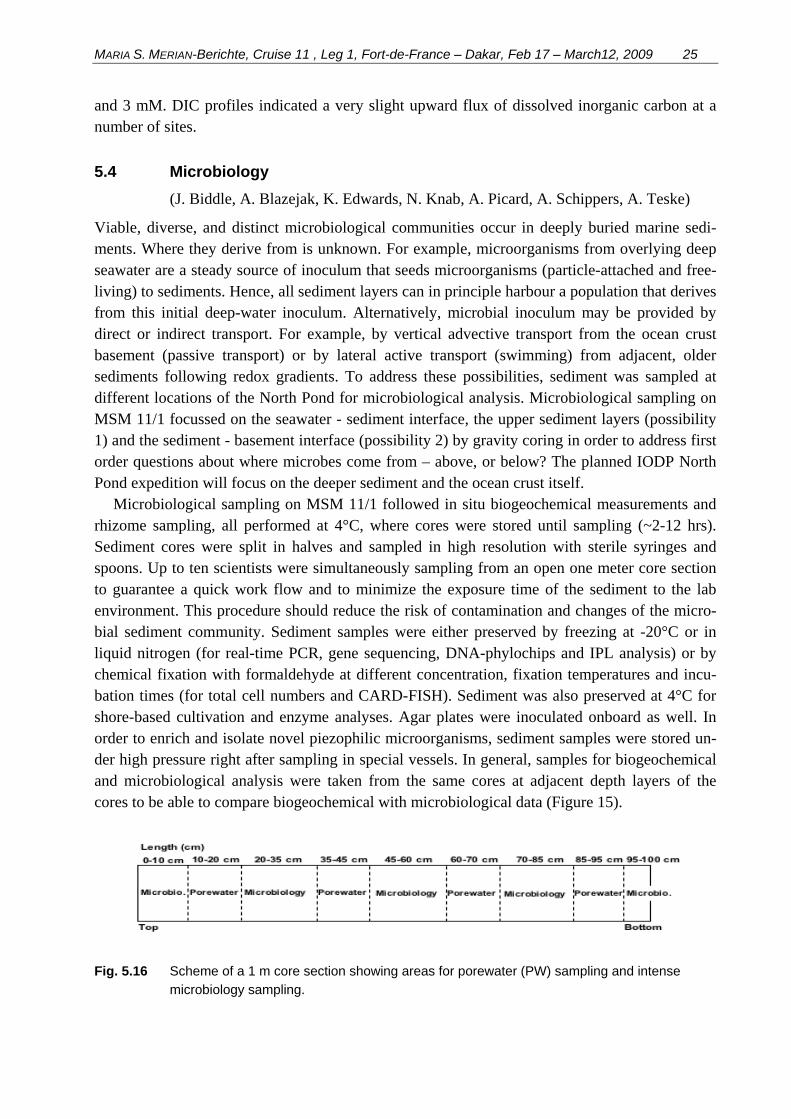
Microbiological sampling on MSM 11/1 followed in situ biogeochemical measurements and rhizome sampling, all performed at 4°C, where cores were stored until sampling (~2-12 hrs). Sediment cores were split in halves and sampled in high resolution with sterile syringes and spoons. Up to ten scientists were simultaneously sampling from an open one meter core section to guarantee a quick work flow and to minimize the exposure time of the sediment to the lab environment. This procedure should reduce the risk of contamination and changes of the micro-bial sediment community. Sediment samples were either preserved by freezing at -20°C or in liquid nitrogen (for real-time PCR, gene sequencing, DNA-phylochips and IPL analysis) or by chemical fixation with formaldehyde at different concentration, fixation temperatures and incu-bation times (for total cell numbers and CARD-FISH). Sediment was also preserved at 4°C for shore-based cultivation and enzyme analyses. Agar plates were inoculated onboard as well. In order to enrich and isolate novel piezophilic microorganisms, sediment samples were stored un-der high pressure right after sampling in special vessels. In general, samples for biogeochemical and microbiological analysis were taken from the same cores at adjacent depth layers of the cores to be able to compare biogeochemical with microbiological data (Figure 15).
Fig. 5.16 Scheme of a 1 m core section showing areas for porewater (PW) sampling and intense
microbiology sampling.
26 MARIA S. MERIAN-Berichte, Cruise 11 , Leg 1, Fort-de-France – Dakar, Feb 17 – March 12, 2009
Table 6 shows the frequency and horizons of microbiological sampling by the microbiologists and biogeochemists of cruise MSM 11/1: Katrina Edwards, Nina Knap and Wiebke Ziebis (USC), Axel Schippers and Anna Blazejak (BGR), Andreas Teske and Jennifer Biddle (UNC Chapel Hill), Tim Ferdelman and Aude Picard (MPI Bremen), and Verena Heuer and Matthias Kellermann (MARUM Bremen). Here we refer to each discreet section interval sampled per team as one “horizon”. The intervals selected per team, per section, and sample sizes taken varied considerably. Critical interfaces, for example the surficial layers of sediments, and basalt-associated weathering horizons such as those recovered at Station 13504 in the corecatcher, were sampled in 5 to 10 centimeter resolution by the UNC, USC and BGR teams, to allow an optimal correlation of microbial community structure with rapidly changing chemical gradients and re-dox interfaces.
The total vertical sediment recovery from 14 gravity coring stations is 61.66 m, and 999 dif-ferent sediment horizons were sampled (mean 71; median 66, std dev. 28). On average, we have a microbiological sample horizon every 6.2 cm. Despite variance between different sampling teams and cores, this scheme is orders of magnitude more finely resolved than on typical JOIDES Resolution cruises. On ODP Leg 201, microbiology sampling was typically limited to two 1.5 m core segments from every 9.5 m core, resulting in clusters of samples that are spaced approx. 3-4 meters apart. Thus, the North Pond sample sets offer the opportunity to perform a high-resolution survey of these oligotrophic sediments with different microbiological techniques.
Table 5.5. Microbiological sampling
Core Sediment recovery No of sampling horizons
GeoB 13501-1 844 cm 101 GeoB 13502-1 847 cm 104 GeoB 13503-1 496 cm 61 GeoB 13504-1 72 cm 46 GeoB 13504-1 19 cm (core catcher) 17 GeoB 13505-1 76 cm 24 GeoB 13506-1 574 cm 87 GeoB 13507-1 865 cm 121 GeoB 13508-1 344 cm 60 GeoB 13509-1 261 cm 46 GeoB 13510-1 515 cm 68 GeoB 13511-1 468 cm 61 GeoB 13512-1 516 cm 68 GeoB 13513-1 503 cm 101 GeoB 13514-1 234 cm 34
Detailed information on the microbiology sampling program is available in an appendix, with
a photo of every core segment, and a table of the sampling horizons and sample types taken for every core segment.
MARIA S. MERIAN-Berichte, Cruise 11 , Leg 1, Fort-de-France – Dakar, Feb 17 – March12, 2009 27
In addition to sediment samples, several liters of bottom water from 4400 m water depth (CTD station 13501-3) were filtered through 0.22 µm pore size filters to concentrate cells on the filter for postcruise DNA-based analyses and total cell counting.
The postcruise microbiological analyses of the sediment and water samples will include: Total cell numbers in bulk sediment and pore water (Acridine Orange Direct Counts (AODC), SYBR Green Direct Counts), number and diversity of Bacteria, Archaea, and Eukarya (Catalyzed Re-porter Deposition - Fluorescence In Situ Hybridisation (CARD-FISH), real-time PCR, intact polar lipids (IPL), DNA-phylochips, 16S and 18S rDNA sequencing, number and diversity of functional genes e.g. dsr, mcr, cbbl, amo (real-time PCR, gene sequencing), culturing (liquid medium under high pressure and R2A/seawater-agar plates for oligoheterotrophs), and identifi-cation of spores.
6. Ship’s Meteorological Station
There was no meteorologist on board during the cruise.
28 MARIA S. MERIAN-Berichte, Cruise 11 , Leg 1, Fort-de-France – Dakar, Feb 17 – March 12, 2009
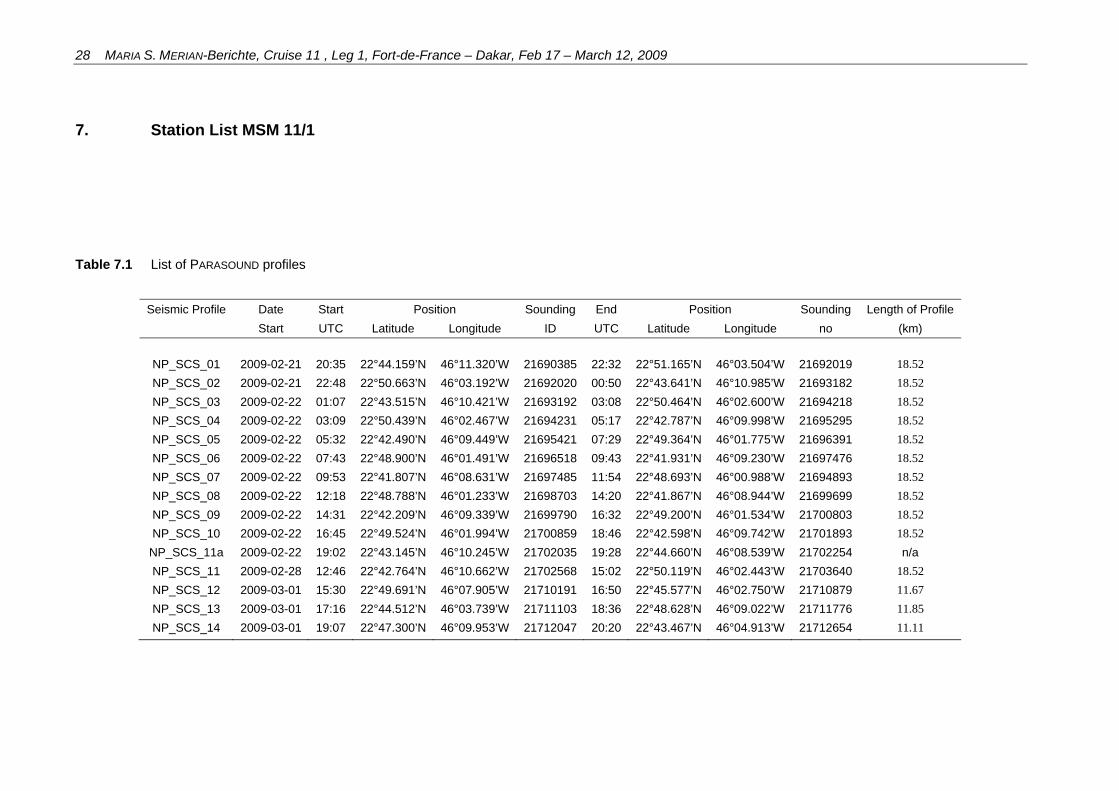
7. Station List MSM 11/1
Table 7.1 List of PARASOUND profiles
Seismic Profile Date Start Position Sounding End Position Sounding Length of Profile
Start UTC Latitude Longitude ID UTC Latitude Longitude no (km)
NP_SCS_01 2009-02-21 20:35 22°44.159’N 46°11.320’W 21690385 22:32 22°51.165’N 46°03.504’W 21692019 18.52
NP_SCS_02 2009-02-21 22:48 22°50.663’N 46°03.192’W 21692020 00:50 22°43.641’N 46°10.985’W 21693182 18.52
NP_SCS_03 2009-02-22 01:07 22°43.515’N 46°10.421’W 21693192 03:08 22°50.464’N 46°02.600’W 21694218 18.52
NP_SCS_04 2009-02-22 03:09 22°50.439’N 46°02.467’W 21694231 05:17 22°42.787’N 46°09.998’W 21695295 18.52
NP_SCS_05 2009-02-22 05:32 22°42.490’N 46°09.449’W 21695421 07:29 22°49.364’N 46°01.775’W 21696391 18.52
NP_SCS_06 2009-02-22 07:43 22°48.900’N 46°01.491’W 21696518 09:43 22°41.931’N 46°09.230’W 21697476 18.52
NP_SCS_07 2009-02-22 09:53 22°41.807’N 46°08.631’W 21697485 11:54 22°48.693’N 46°00.988’W 21694893 18.52
NP_SCS_08 2009-02-22 12:18 22°48.788’N 46°01.233’W 21698703 14:20 22°41.867’N 46°08.944’W 21699699 18.52
NP_SCS_09 2009-02-22 14:31 22°42.209’N 46°09.339’W 21699790 16:32 22°49.200’N 46°01.534’W 21700803 18.52
NP_SCS_10 2009-02-22 16:45 22°49.524’N 46°01.994’W 21700859 18:46 22°42.598’N 46°09.742’W 21701893 18.52
NP_SCS_11a 2009-02-22 19:02 22°43.145’N 46°10.245’W 21702035 19:28 22°44.660’N 46°08.539’W 21702254 n/a
NP_SCS_11 2009-02-28 12:46 22°42.764’N 46°10.662’W 21702568 15:02 22°50.119’N 46°02.443’W 21703640 18.52
NP_SCS_12 2009-03-01 15:30 22°49.691’N 46°07.905’W 21710191 16:50 22°45.577’N 46°02.750’W 21710879 11.67
NP_SCS_13 2009-03-01 17:16 22°44.512’N 46°03.739’W 21711103 18:36 22°48.628’N 46°09.022’W 21711776 11.85
NP_SCS_14 2009-03-01 19:07 22°47.300’N 46°09.953’W 21712047 20:20 22°43.467’N 46°04.913’W 21712654 11.11
MARIA S. MERIAN-Berichte, Cruise 11 , Leg 1, Fort-de-France – Dakar, Feb 17 – March12, 2009 29
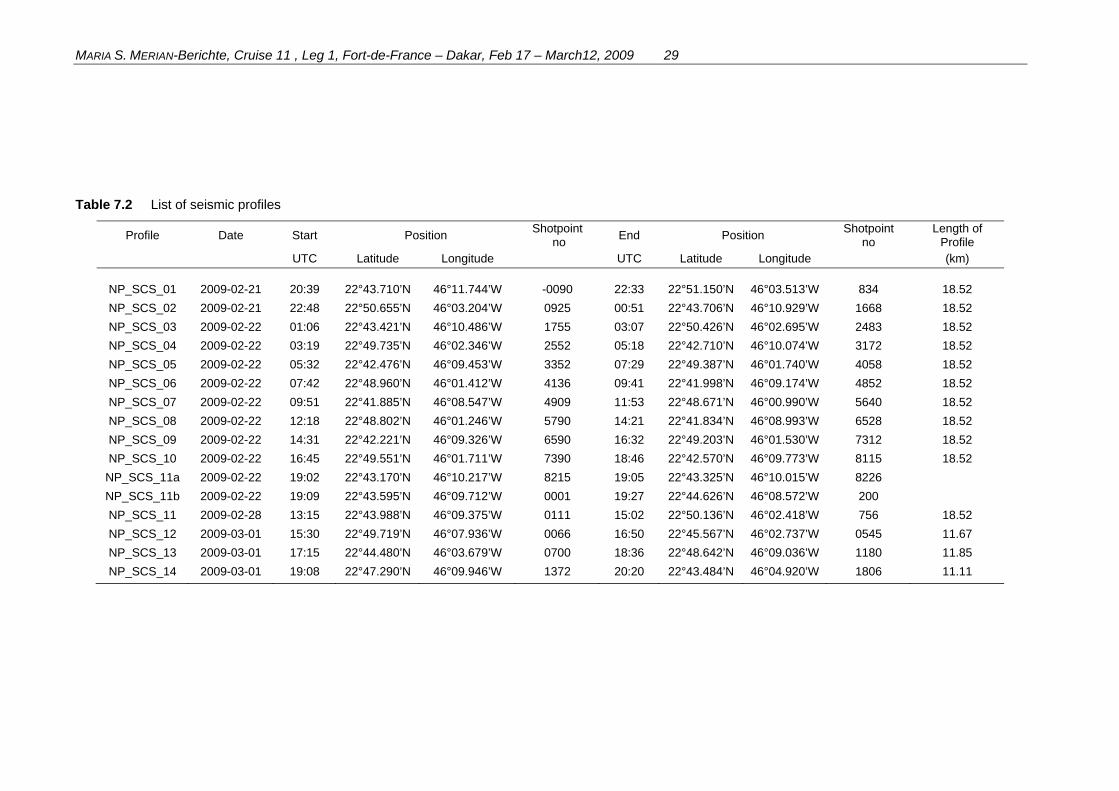
Table 7.2 List of seismic profiles
Profile Date Start Position Shotpoint
no End Position
Shotpoint no
Length of Profile
UTC Latitude Longitude UTC Latitude Longitude (km)
NP_SCS_01 2009-02-21 20:39 22°43.710’N 46°11.744’W -0090 22:33 22°51.150’N 46°03.513’W 834 18.52
NP_SCS_02 2009-02-21 22:48 22°50.655’N 46°03.204’W 0925 00:51 22°43.706’N 46°10.929’W 1668 18.52
NP_SCS_03 2009-02-22 01:06 22°43.421’N 46°10.486’W 1755 03:07 22°50.426’N 46°02.695’W 2483 18.52
NP_SCS_04 2009-02-22 03:19 22°49.735’N 46°02.346’W 2552 05:18 22°42.710’N 46°10.074’W 3172 18.52
NP_SCS_05 2009-02-22 05:32 22°42.476’N 46°09.453’W 3352 07:29 22°49.387’N 46°01.740’W 4058 18.52
NP_SCS_06 2009-02-22 07:42 22°48.960’N 46°01.412’W 4136 09:41 22°41.998’N 46°09.174’W 4852 18.52
NP_SCS_07 2009-02-22 09:51 22°41.885’N 46°08.547’W 4909 11:53 22°48.671’N 46°00.990’W 5640 18.52
NP_SCS_08 2009-02-22 12:18 22°48.802’N 46°01.246’W 5790 14:21 22°41.834’N 46°08.993’W 6528 18.52
NP_SCS_09 2009-02-22 14:31 22°42.221’N 46°09.326’W 6590 16:32 22°49.203’N 46°01.530’W 7312 18.52
NP_SCS_10 2009-02-22 16:45 22°49.551’N 46°01.711’W 7390 18:46 22°42.570’N 46°09.773’W 8115 18.52
NP_SCS_11a 2009-02-22 19:02 22°43.170’N 46°10.217’W 8215 19:05 22°43.325’N 46°10.015’W 8226
NP_SCS_11b 2009-02-22 19:09 22°43.595’N 46°09.712’W 0001 19:27 22°44.626’N 46°08.572’W 200
NP_SCS_11 2009-02-28 13:15 22°43.988’N 46°09.375’W 0111 15:02 22°50.136’N 46°02.418’W 756 18.52
NP_SCS_12 2009-03-01 15:30 22°49.719’N 46°07.936’W 0066 16:50 22°45.567’N 46°02.737’W 0545 11.67
NP_SCS_13 2009-03-01 17:15 22°44.480’N 46°03.679’W 0700 18:36 22°48.642’N 46°09.036’W 1180 11.85
NP_SCS_14 2009-03-01 19:08 22°47.290’N 46°09.946’W 1372 20:20 22°43.484’N 46°04.920’W 1806 11.11
30 MARIA S. MERIAN-Berichte, Cruise 11 , Leg 1, Fort-de-France – Dakar, Feb 17 – March 12, 2009
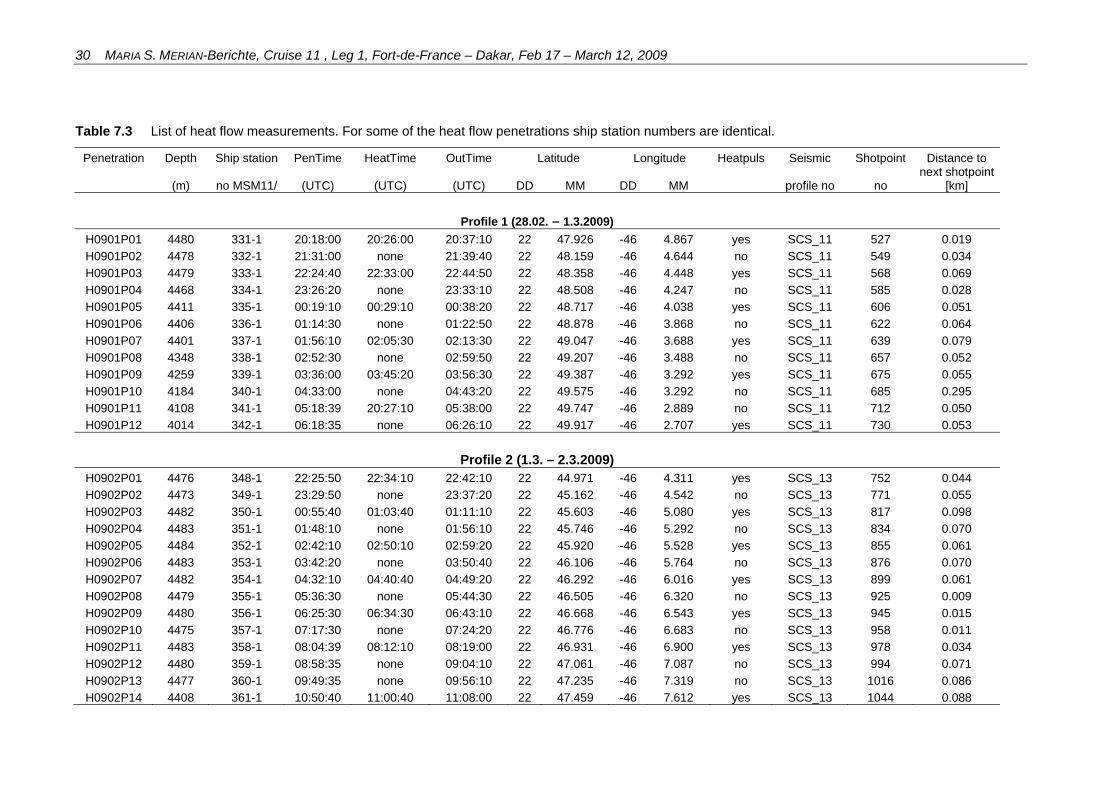
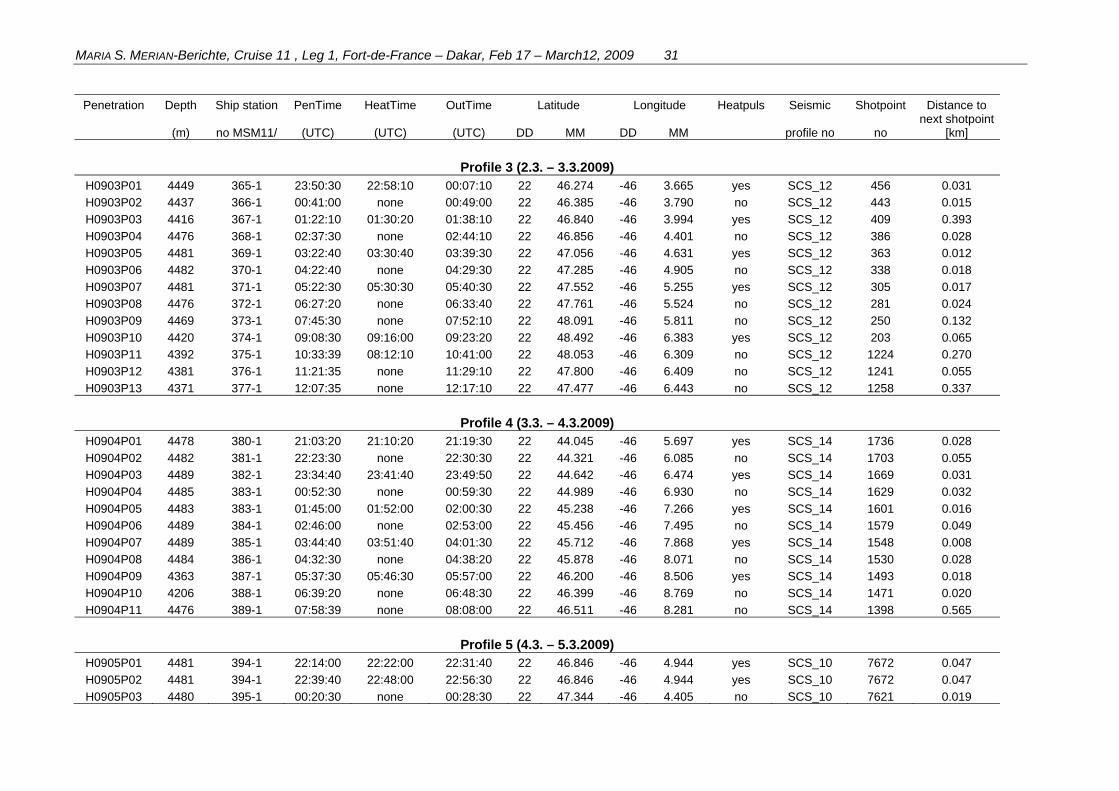
Table 7.3 List of heat flow measurements. For some of the heat flow penetrations ship station numbers are identical.
Penetration Depth Ship station PenTime HeatTime OutTime Latitude Longitude Heatpuls Seismic Shotpoint Distance to
(m) no MSM11/ (UTC) (UTC) (UTC) DD MM DD MM profile no no next shotpoint
[km]
Profile 1 (28.02. – 1.3.2009)
H0901P01 4480 331-1 20:18:00 20:26:00 20:37:10 22 47.926 -46 4.867 yes SCS_11 527 0.019
H0901P02 4478 332-1 21:31:00 none 21:39:40 22 48.159 -46 4.644 no SCS_11 549 0.034
H0901P03 4479 333-1 22:24:40 22:33:00 22:44:50 22 48.358 -46 4.448 yes SCS_11 568 0.069
H0901P04 4468 334-1 23:26:20 none 23:33:10 22 48.508 -46 4.247 no SCS_11 585 0.028
H0901P05 4411 335-1 00:19:10 00:29:10 00:38:20 22 48.717 -46 4.038 yes SCS_11 606 0.051
H0901P06 4406 336-1 01:14:30 none 01:22:50 22 48.878 -46 3.868 no SCS_11 622 0.064
H0901P07 4401 337-1 01:56:10 02:05:30 02:13:30 22 49.047 -46 3.688 yes SCS_11 639 0.079
H0901P08 4348 338-1 02:52:30 none 02:59:50 22 49.207 -46 3.488 no SCS_11 657 0.052
H0901P09 4259 339-1 03:36:00 03:45:20 03:56:30 22 49.387 -46 3.292 yes SCS_11 675 0.055
H0901P10 4184 340-1 04:33:00 none 04:43:20 22 49.575 -46 3.292 no SCS_11 685 0.295
H0901P11 4108 341-1 05:18:39 20:27:10 05:38:00 22 49.747 -46 2.889 no SCS_11 712 0.050
H0901P12 4014 342-1 06:18:35 none 06:26:10 22 49.917 -46 2.707 yes SCS_11 730 0.053
Profile 2 (1.3. – 2.3.2009) H0902P01 4476 348-1 22:25:50 22:34:10 22:42:10 22 44.971 -46 4.311 yes SCS_13 752 0.044
H0902P02 4473 349-1 23:29:50 none 23:37:20 22 45.162 -46 4.542 no SCS_13 771 0.055
H0902P03 4482 350-1 00:55:40 01:03:40 01:11:10 22 45.603 -46 5.080 yes SCS_13 817 0.098
H0902P04 4483 351-1 01:48:10 none 01:56:10 22 45.746 -46 5.292 no SCS_13 834 0.070
H0902P05 4484 352-1 02:42:10 02:50:10 02:59:20 22 45.920 -46 5.528 yes SCS_13 855 0.061
H0902P06 4483 353-1 03:42:20 none 03:50:40 22 46.106 -46 5.764 no SCS_13 876 0.070
H0902P07 4482 354-1 04:32:10 04:40:40 04:49:20 22 46.292 -46 6.016 yes SCS_13 899 0.061
H0902P08 4479 355-1 05:36:30 none 05:44:30 22 46.505 -46 6.320 no SCS_13 925 0.009
H0902P09 4480 356-1 06:25:30 06:34:30 06:43:10 22 46.668 -46 6.543 yes SCS_13 945 0.015
H0902P10 4475 357-1 07:17:30 none 07:24:20 22 46.776 -46 6.683 no SCS_13 958 0.011
H0902P11 4483 358-1 08:04:39 08:12:10 08:19:00 22 46.931 -46 6.900 yes SCS_13 978 0.034
H0902P12 4480 359-1 08:58:35 none 09:04:10 22 47.061 -46 7.087 no SCS_13 994 0.071
H0902P13 4477 360-1 09:49:35 none 09:56:10 22 47.235 -46 7.319 no SCS_13 1016 0.086
H0902P14 4408 361-1 10:50:40 11:00:40 11:08:00 22 47.459 -46 7.612 yes SCS_13 1044 0.088
MARIA S. MERIAN-Berichte, Cruise 11 , Leg 1, Fort-de-France – Dakar, Feb 17 – March12, 2009 31
Penetration Depth Ship station PenTime HeatTime OutTime Latitude Longitude Heatpuls Seismic Shotpoint Distance to
(m) no MSM11/ (UTC) (UTC) (UTC) DD MM DD MM profile no no next shotpoint
[km]
Profile 3 (2.3. – 3.3.2009)
H0903P01 4449 365-1 23:50:30 22:58:10 00:07:10 22 46.274 -46 3.665 yes SCS_12 456 0.031
H0903P02 4437 366-1 00:41:00 none 00:49:00 22 46.385 -46 3.790 no SCS_12 443 0.015
H0903P03 4416 367-1 01:22:10 01:30:20 01:38:10 22 46.840 -46 3.994 yes SCS_12 409 0.393
H0903P04 4476 368-1 02:37:30 none 02:44:10 22 46.856 -46 4.401 no SCS_12 386 0.028
H0903P05 4481 369-1 03:22:40 03:30:40 03:39:30 22 47.056 -46 4.631 yes SCS_12 363 0.012
H0903P06 4482 370-1 04:22:40 none 04:29:30 22 47.285 -46 4.905 no SCS_12 338 0.018
H0903P07 4481 371-1 05:22:30 05:30:30 05:40:30 22 47.552 -46 5.255 yes SCS_12 305 0.017
H0903P08 4476 372-1 06:27:20 none 06:33:40 22 47.761 -46 5.524 no SCS_12 281 0.024
H0903P09 4469 373-1 07:45:30 none 07:52:10 22 48.091 -46 5.811 no SCS_12 250 0.132
H0903P10 4420 374-1 09:08:30 09:16:00 09:23:20 22 48.492 -46 6.383 yes SCS_12 203 0.065
H0903P11 4392 375-1 10:33:39 08:12:10 10:41:00 22 48.053 -46 6.309 no SCS_12 1224 0.270
H0903P12 4381 376-1 11:21:35 none 11:29:10 22 47.800 -46 6.409 no SCS_12 1241 0.055
H0903P13 4371 377-1 12:07:35 none 12:17:10 22 47.477 -46 6.443 no SCS_12 1258 0.337
Profile 4 (3.3. – 4.3.2009)
H0904P01 4478 380-1 21:03:20 21:10:20 21:19:30 22 44.045 -46 5.697 yes SCS_14 1736 0.028
H0904P02 4482 381-1 22:23:30 none 22:30:30 22 44.321 -46 6.085 no SCS_14 1703 0.055
H0904P03 4489 382-1 23:34:40 23:41:40 23:49:50 22 44.642 -46 6.474 yes SCS_14 1669 0.031
H0904P04 4485 383-1 00:52:30 none 00:59:30 22 44.989 -46 6.930 no SCS_14 1629 0.032
H0904P05 4483 383-1 01:45:00 01:52:00 02:00:30 22 45.238 -46 7.266 yes SCS_14 1601 0.016
H0904P06 4489 384-1 02:46:00 none 02:53:00 22 45.456 -46 7.495 no SCS_14 1579 0.049
H0904P07 4489 385-1 03:44:40 03:51:40 04:01:30 22 45.712 -46 7.868 yes SCS_14 1548 0.008
H0904P08 4484 386-1 04:32:30 none 04:38:20 22 45.878 -46 8.071 no SCS_14 1530 0.028
H0904P09 4363 387-1 05:37:30 05:46:30 05:57:00 22 46.200 -46 8.506 yes SCS_14 1493 0.018
H0904P10 4206 388-1 06:39:20 none 06:48:30 22 46.399 -46 8.769 no SCS_14 1471 0.020
H0904P11 4476 389-1 07:58:39 none 08:08:00 22 46.511 -46 8.281 no SCS_14 1398 0.565
Profile 5 (4.3. – 5.3.2009)
H0905P01 4481 394-1 22:14:00 22:22:00 22:31:40 22 46.846 -46 4.944 yes SCS_10 7672 0.047
H0905P02 4481 394-1 22:39:40 22:48:00 22:56:30 22 46.846 -46 4.944 yes SCS_10 7672 0.047
H0905P03 4480 395-1 00:20:30 none 00:28:30 22 47.344 -46 4.405 no SCS_10 7621 0.019
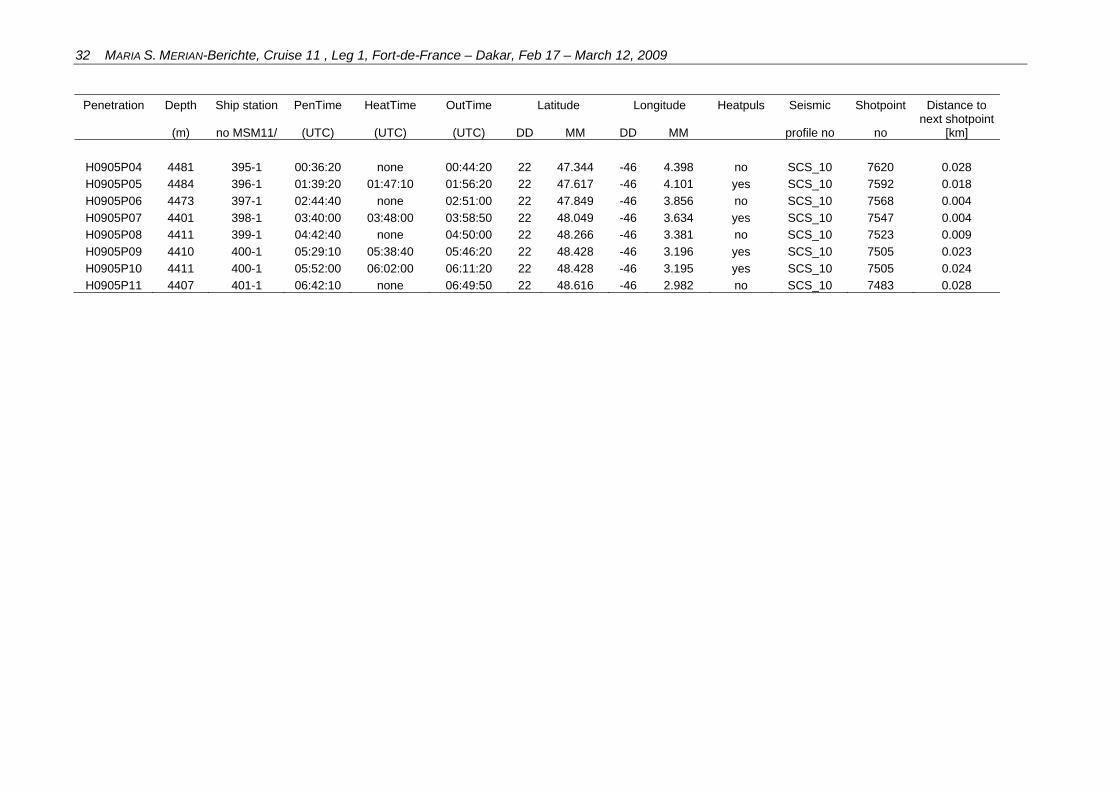
32 MARIA S. MERIAN-Berichte, Cruise 11 , Leg 1, Fort-de-France – Dakar, Feb 17 – March 12, 2009
Penetration Depth Ship station PenTime HeatTime OutTime Latitude Longitude Heatpuls Seismic Shotpoint Distance to
(m) no MSM11/ (UTC) (UTC) (UTC) DD MM DD MM profile no no next shotpoint
[km]
H0905P04 4481 395-1 00:36:20 none 00:44:20 22 47.344 -46 4.398 no SCS_10 7620 0.028
H0905P05 4484 396-1 01:39:20 01:47:10 01:56:20 22 47.617 -46 4.101 yes SCS_10 7592 0.018
H0905P06 4473 397-1 02:44:40 none 02:51:00 22 47.849 -46 3.856 no SCS_10 7568 0.004
H0905P07 4401 398-1 03:40:00 03:48:00 03:58:50 22 48.049 -46 3.634 yes SCS_10 7547 0.004
H0905P08 4411 399-1 04:42:40 none 04:50:00 22 48.266 -46 3.381 no SCS_10 7523 0.009
H0905P09 4410 400-1 05:29:10 05:38:40 05:46:20 22 48.428 -46 3.196 yes SCS_10 7505 0.023
H0905P10 4411 400-1 05:52:00 06:02:00 06:11:20 22 48.428 -46 3.195 yes SCS_10 7505 0.024
H0905P11 4407 401-1 06:42:10 none 06:49:50 22 48.616 -46 2.982 no SCS_10 7483 0.028
MARIA S. MERIAN-Berichte, Cruise 11 , Leg 1, Fort-de-France – Dakar, Feb 17 – March12, 2009 33
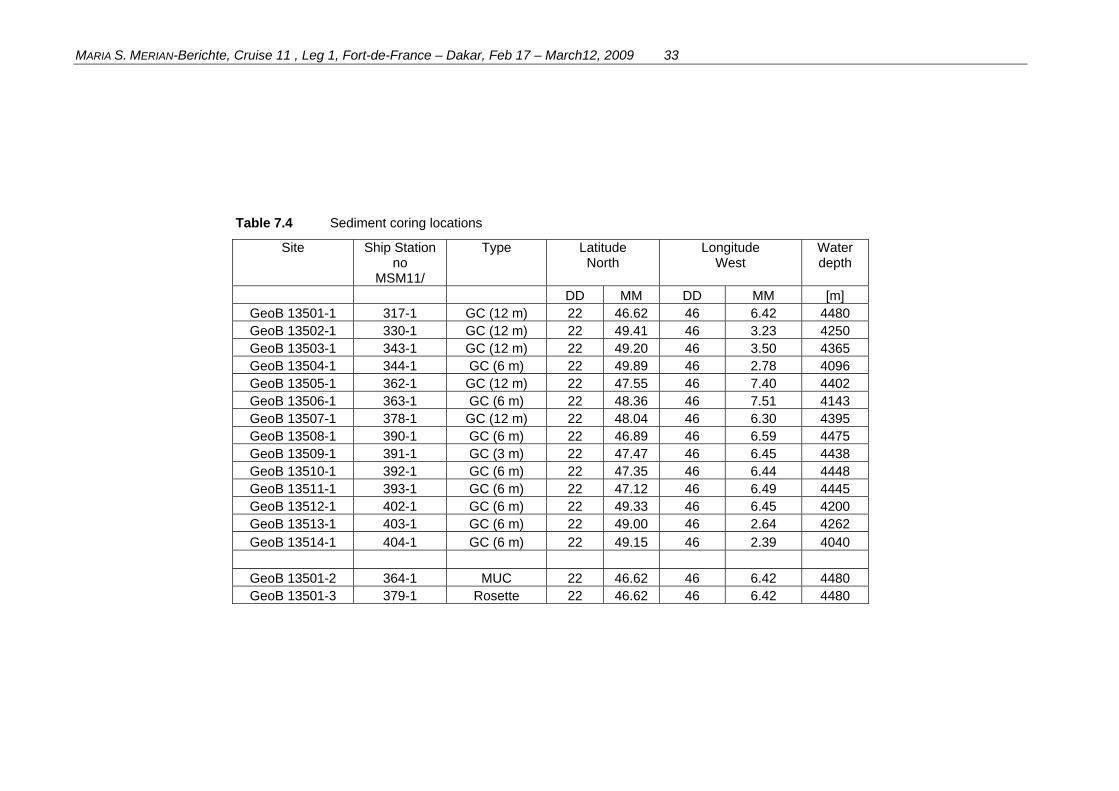
Table 7.4 Sediment coring locations
Site Ship Station no
MSM11/
Type Latitude North
Longitude West
Water depth
DD MM DD MM [m] GeoB 13501-1 317-1 GC (12 m) 22 46.62 46 6.42 4480 GeoB 13502-1 330-1 GC (12 m) 22 49.41 46 3.23 4250 GeoB 13503-1 343-1 GC (12 m) 22 49.20 46 3.50 4365 GeoB 13504-1 344-1 GC (6 m) 22 49.89 46 2.78 4096 GeoB 13505-1 362-1 GC (12 m) 22 47.55 46 7.40 4402 GeoB 13506-1 363-1 GC (6 m) 22 48.36 46 7.51 4143 GeoB 13507-1 378-1 GC (12 m) 22 48.04 46 6.30 4395 GeoB 13508-1 390-1 GC (6 m) 22 46.89 46 6.59 4475 GeoB 13509-1 391-1 GC (3 m) 22 47.47 46 6.45 4438 GeoB 13510-1 392-1 GC (6 m) 22 47.35 46 6.44 4448 GeoB 13511-1 393-1 GC (6 m) 22 47.12 46 6.49 4445 GeoB 13512-1 402-1 GC (6 m) 22 49.33 46 6.45 4200 GeoB 13513-1 403-1 GC (6 m) 22 49.00 46 2.64 4262 GeoB 13514-1 404-1 GC (6 m) 22 49.15 46 2.39 4040
GeoB 13501-2 364-1 MUC 22 46.62 46 6.42 4480 GeoB 13501-3 379-1 Rosette 22 46.62 46 6.42 4480
34 MARIA S. MERIAN-Berichte, Cruise 11 , Leg 1, Fort-de-France – Dakar, Feb 17 – March 12, 2009
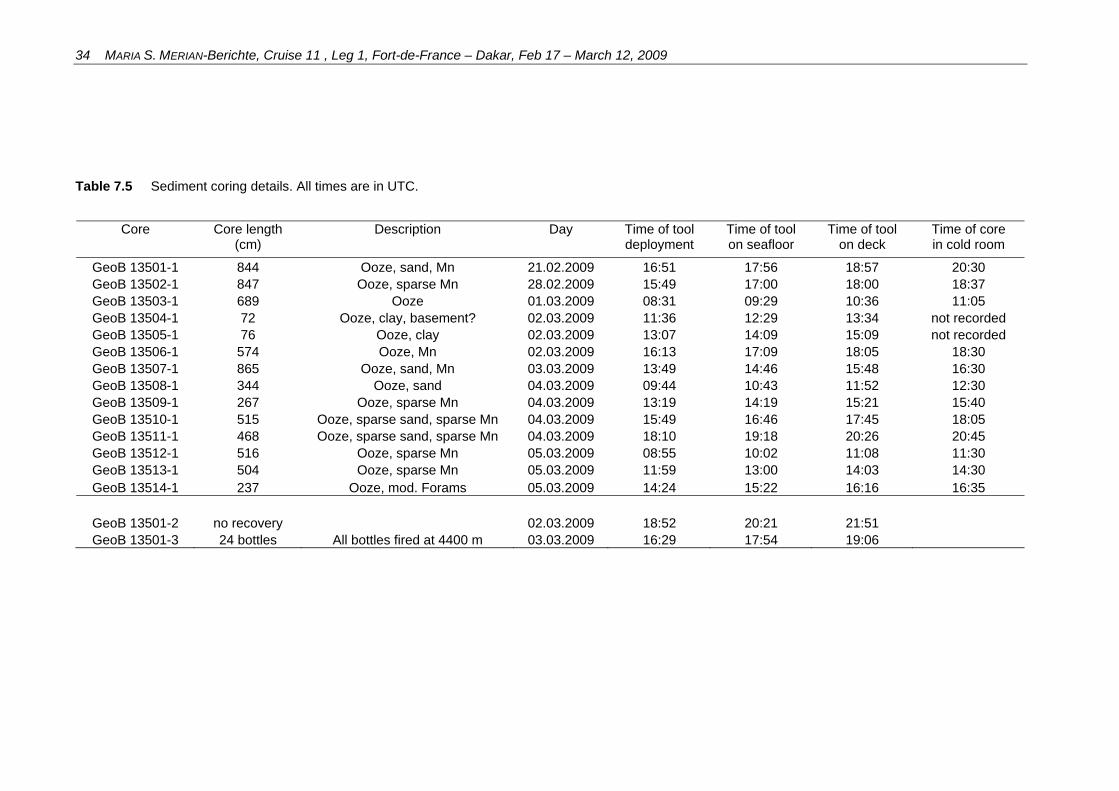
Table 7.5 Sediment coring details. All times are in UTC.
Core Core length
(cm) Description Day Time of tool
deployment Time of tool on seafloor
Time of tool on deck
Time of core in cold room
GeoB 13501-1 844 Ooze, sand, Mn 21.02.2009 16:51 17:56 18:57 20:30 GeoB 13502-1 847 Ooze, sparse Mn 28.02.2009 15:49 17:00 18:00 18:37 GeoB 13503-1 689 Ooze 01.03.2009 08:31 09:29 10:36 11:05 GeoB 13504-1 72 Ooze, clay, basement? 02.03.2009 11:36 12:29 13:34 not recorded GeoB 13505-1 76 Ooze, clay 02.03.2009 13:07 14:09 15:09 not recorded GeoB 13506-1 574 Ooze, Mn 02.03.2009 16:13 17:09 18:05 18:30 GeoB 13507-1 865 Ooze, sand, Mn 03.03.2009 13:49 14:46 15:48 16:30 GeoB 13508-1 344 Ooze, sand 04.03.2009 09:44 10:43 11:52 12:30 GeoB 13509-1 267 Ooze, sparse Mn 04.03.2009 13:19 14:19 15:21 15:40 GeoB 13510-1 515 Ooze, sparse sand, sparse Mn 04.03.2009 15:49 16:46 17:45 18:05 GeoB 13511-1 468 Ooze, sparse sand, sparse Mn 04.03.2009 18:10 19:18 20:26 20:45 GeoB 13512-1 516 Ooze, sparse Mn 05.03.2009 08:55 10:02 11:08 11:30 GeoB 13513-1 504 Ooze, sparse Mn 05.03.2009 11:59 13:00 14:03 14:30 GeoB 13514-1 237 Ooze, mod. Forams 05.03.2009 14:24 15:22 16:16 16:35
GeoB 13501-2 no recovery 02.03.2009 18:52 20:21 21:51 GeoB 13501-3 24 bottles All bottles fired at 4400 m 03.03.2009 16:29 17:54 19:06
MARIA S. MERIAN-Berichte, Cruise 11 , Leg 1, Fort-de-France – Dakar, Feb 17 – March12, 2009 35
8. Data and sample storage and availability
All geophysical data will be permanently stored in PANGAEA (http://www.pangaea.de/) and publically available three years post-cruise by April 2012. The site survey relevant data sets (bathymetry, seismic data and heat flow data) will be stored as required in the IODP site survey data bank (http://ssdb.iodp.org/). All recovered core material is stored in the MARUM GeoB Kernlager in Bremen and will be available 3 years post cruise by March 2012. All pore water samples and microbiological samples will be used up after investigations are completed.
9. Acknowledgements
Despite the fact that our planned working time was basically cut in half due to unforeseen circumstances the cruise was very successful. We were able to collect just enough data to choose the locations of the proposed primary and secondary IODP-drill sites. This was possible due to the tireless and unselfish efforts of Captain Bergmann and the crew of RV MS MERIAN.
10. References
Bullard, E.C., 1954. The flow of heat through the floor of the Atlantic Ocean, Proc. R. Soc.
London, A, 222, 408–425.
Bullard, E.C., 1939. Heat flow in South Africa, Proc. R. Soc. London, A, 173, 474–502.
Hartmann, A. and Villinger, H., 2002. Inversion of heat flow measurements by expansion of the temperature decay function. Geophys. J. Int. 148, 628–636
Hyndman, R.D., Davis, E.E. & Wright, J.A., 1979. The measurement of marine geothermal heat flow by a multipenetration probe with digital acoustic telemetry and in situ thermal conductivity, Mar. Geophys. Res., 4, 181–205.
Fabian, M., Kaul, N. and Gmeinder, T., 2008, The Bremen Lance Insertion Retardation (LIR) Meter to assess sea floor stability. Sea Technology, p 10-13.
Langseth, M.G., et al.,1992, Heat and fluid flux through sediments on the western flank of the Mid-Atlantic Ridge: A hydrogeological study of North Pond, Geophys. Res Lett, 19, 517-520.
Langseth, M.G., et al., 1984, The hydrogeological regime of isolated sediment ponds in mid-ocean ridges, in Initial Reports DSDP 78, B. Biju-Duval, et al., Eds., pp. 825-837, US Government Printing Office, Washington, DC.
Lister, C.R.B., 1970. Measurement of in situ sediment conductivity by means of a Bullard-type probe, Geophys. J. R Astr. Soc., 19, 521–532.
Lister, C.R.B., 1979. The pulse-probe method of conductivity measurement, Geophys. J. R. Astr. Soc., 57, 451–461.

36 MARIA S. MERIAN-Berichte, Cruise 11 , Leg 1, Fort-de-France – Dakar, Feb 17 – March 12, 2009
Villinger, H. & Davis, E.E., 1987. A new reduction algorithm for marine heat flow measurements, J. Geophys. Res., 92(B12), 12 846–12 856.
Spiess, V., 1993, Digitale Sedimenttomographie. Neue Wege zu einer hochauflösenden Akustostratigraphie, Berichte aus dem FB Geowissenschaften der Universität Bremen, 35: 199pp.
Wessel, P., & W. H. F. Smith, 1998. New, improved version of Generic Mapping Tools released, EOS Trans. Amer. Geophys. Union., vol. 79 (47), pp. 579.