Embed Size (px)
Citation preview
Prepared for: Wisconsin Lake Superior Basin Partner Team
With funding from: Great Lakes Commission – Great Lakes Basin program for Soil Erosion & Sediment Control
Ashland, Bayfield, Douglas & Iron County Land Conservation Committees University of Wisconsin Extension Service Basin Education Program
University of Wisconsin Sea Grant United States Department of Agriculture Forest Service
With: Grant Oversight Committee – Technical Work Group
By:
Copies of the report on the Hydrologic Condition of the Marengo River Watershed are available on the Lake Superior Basin partner team’s website basineducation.uwex.edu/lakesuperior/watershedmgmt.htm
August 2007
Community GIS, Inc. 230 E. Superior Street Duluth, MN 55802
Stable Solutions LLC 71245 Lindahl Road Ashland, WI 54806
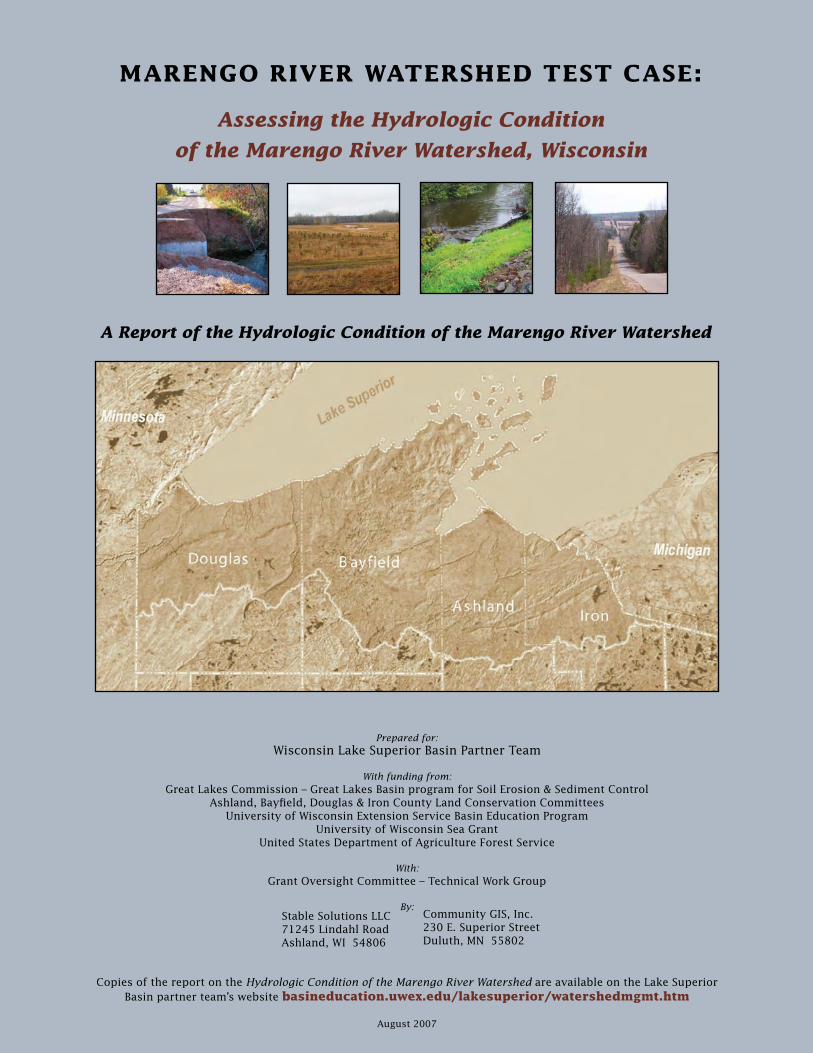
A Report of the Hydrologic Condition of the Marengo River Watershed
Marengo river Watershed test Case:Marengo river Watershed test Case:
Assessing the Hydrologic Condition
of the Marengo River Watershed, Wisconsin
2
executive summary Report of the Hydrologic Condition of the Marengo River Watershed
The Marengo River is located in central Ashland and Bayfield Counties and is known locally as a river of change. It’s not unusual to find sand filling in part of the stream that was a favorite fishing hole the month before. Stream banks become unstable as water rushes through carrying trees and brush, cutting new paths of travel and sometimes even new river channels. The way water circulates on or below the landscape or in the atmosphere – how much, how fast, the source and which path it takes – is known as hydrology. Knowing the hydrology of a watershed is a first step in understanding why sand is filling in favorite fishing holes or culverts are being washed out. It was the focus of a project sponsored by the Lake Superior Basin Partner Team – Assessing the Hydrologic Condition of the Marengo River Watershed, Wisconsin.
Project ideaThe Wisconsin Lake Superior Basin Partner Team (the Partner Team) was originally formed in 1998 by the Department of Natural Resources, to help implement the Lake Superior Bi-national Program and Area Lakewide Management Plan in Wisconsin. The Partner Team has since evolved into a unique blend of public, private and nonprofit organizations and individuals, whose mission today is to implement a watershed health initiative known as “slow the flow.”
The Partner Team selected the Marengo River watershed as its test area to develop and demonstrate a process for assessing the hydrologic condition of Lake Superior watersheds. A step by step guide, including lessons learned from the Marengo River test project, was created for other groups that want to do the same in their own watersheds.
Project objectives The Partner Team wanted specifically to learn which hydrologic factors had the most influence on the timing, quality and quantity of water in the Marengo River watershed. They further wanted to use this analysis to help identify and prioritize projects in the watershed.
Project resultsThe hydrologic assessment identified the following specific concerns or areas of concern in the Marengo River watershed:
• areas with more than 50 or 60% open land or young forest; • sand deposition in the lower reaches of the watershed and at the confluence with the Bad River, filling in and channelizing flow and restricting access to floodplains; • cropland tillage, rotation and surface drainage; • water channeled by road and ditch systems; and • drained wetlands contributing to the overall volume and velocity of water added to the river system during major runoff events.
In addition, other ongoing projects in the Marengo River watershed have identified the following areas as areas of concern:
• The area within elevations 750–1,150 feet above sea level, known as the “Lake Superior clay plain,” is considered an erodible area. This band cuts across the entire Wisconsin portion of the Lake Superior Basin.
• A stretch of the Marengo River located between Kyster Road and County Highway C, has been
identified, through a cooperative study by the US Geological Survey and the Bad River Natural
Resources Department, as a high risk area for suspended sediment contributions.
FutureThis assessment of the Marengo River watershed is only the first step. A newly forming committee is soliciting public involvement to help prepare a watershed management plan using the knowledge gained from this test project. People from the ten communities in the Marengo River watershed will work together to identify and recommend strategies that will slow the flow in the watershed to protect water quality, habitat, and infrastructure for future generations. Contact the Lake Superior Basin Educator at (715) 685-2674 for more information or to volunteer to help with this next step for the Marengo River watershed.
3
Contents
Project overview
Pilot Watershed Selection – Marengo River . . . . . . . . . . . . . . . . . . . . . . . . . . . . . . . . . . . . . . . . . . . . . . . . . . . . . . . . . . . . . . . . . . . . . . . . . . . . . . . . . . . . . . . . . . . . . . . . . . 5
The Approach . . . . . . . . . . . . . . . . . . . . . . . . . . . . . . . . . . . . . . . . . . . . . . . . . . . . . . . . . . . . . . . . . . . . . . . . . . . . . . . . . . . . . . . . . . . . . . . . . . . . . . . . . . . . . . . . . . . . . . . . . . . . . . . . . . . . . . . . . . . . . . . . . . . 5
The Setting. . . . . . . . . . . . . . . . . . . . . . . . . . . . . . . . . . . . . . . . . . . . . . . . . . . . . . . . . . . . . . . . . . . . . . . . . . . . . . . . . . . . . . . . . . . . . . . . . . . . . . . . . . . . . . . . . . . . . . . . . . . . . . . . . . . . . . . . . . . . . . . . . . . . . . . . 5
The Process . . . . . . . . . . . . . . . . . . . . . . . . . . . . . . . . . . . . . . . . . . . . . . . . . . . . . . . . . . . . . . . . . . . . . . . . . . . . . . . . . . . . . . . . . . . . . . . . . . . . . . . . . . . . . . . . . . . . . . . . . . . . . . . . . . . . . . . . . . . . . . . . . . . . . . 6
assessing the hydrologic Condition of the Marengo river Watershed
Step 1: Strength in Numbers – Assembling a Review Team . . . . . . . . . . . . . . . . . . . . . . . . . . . . . . . . . . . . . . . . . . . . . . . . . . . . . . . . . . . . . . . . . . . . . 7
Step 2: A Picture is Worth a Thousand Words – Mapping Your Watershed. . . . . . . . . . . . . . . . . . . . . . . . . . . . . . . . . . . . . . . . . . .10
Step 3: Get Your Feet Wet – Finding Information About Your Watershed . . . . . . . . . . . . . . . . . . . . . . . . . . . . . . . . . . . . . . . . . . . . .18
Step 4: Putting Pen to Paper – Rating Your Watershed Features . . . . . . . . . . . . . . . . . . . . . . . . . . . . . . . . . . . . . . . . . . . . . . . . . . . . . . . . . . . .25
Step 5: Which Watershed Features Get the Spotlight – Selecting Important Features . . . . . . . . . . . . . . . . . . . . . . . .34
Step 6: A Watershed Walk through Time – Learning From the Past to Protect the Future . . . . . . . . . . . . . . . . .38
Conclusion – Using the Results . . . . . . . . . . . . . . . . . . . . . . . . . . . . . . . . . . . . . . . . . . . . . . . . . . . . . . . . . . . . . . . . . . . . . . . . . . . . . . . . . . . . . . . . . . . . . . . . . . . . . . . . . . . . . . . . . . . . . . . . .41
FigUres & taBLes Table 2.1 & 2.3: Map Information Sources & Map Information Beyond the Basics . . . . . . . . . . . . . . . . . . . . . . 10-11
Table 3.1: Marengo River Watershed Case File Index . . . . . . . . . . . . . . . . . . . . . . . . . . . . . . . . . . . . . . . . . . . . . . . . . . . . . . . . . . . . . 18-19
Table 3.2: Watershed Information . . . . . . . . . . . . . . . . . . . . . . . . . . . . . . . . . . . . . . . . . . . . . . . . . . . . . . . . . . . . . . . . . . . . . . . . . . . . . . . . . . . . . . . . . . . . . 20-22
Table 3.3: Marengo Data for National Flood Frequency Model (4/10/06)(Schultz etal, 2006) . . . . . . . . . . . . . . .23
Table 3.4: Peak Discharge Calculation (NFF) following Technical Work Group Meeting
(4/11/06) (Schultz etal, 2006) . . . . . . . . . . . . . . . . . . . . . . . . . . . . . . . . . . . . . . . . . . . . . . . . . . . . . . . . . . . . . . . . . . . . . . . . . . . . . . . . . . . . . . . . . . . . . . . . . . . . . . . .24
Figure 3.1: Results of NFF Model on Marengo River Watershed Base Map (Schultz, 2006) . . . . . . . . . . . . . .24
Table 4.1: Marengo River Subjective Ratings & Rationale . . . . . . . . . . . . . . . . . . . . . . . . . . . . . . . . . . . . . . . . . . . . . . . . . . . . . 25-30
Figure 4.1: Longitudinal profiles of the Bad & Marengo Rivers showing landscape position
(USGS, 2006) . . . . . . . . . . . . . . . . . . . . . . . . . . . . . . . . . . . . . . . . . . . . . . . . . . . . . . . . . . . . . . . . . . . . . . . . . . . . . . . . . . . . . . . . . . . . . . . . . . . . . . . . . . . . . . . . . . . . . . . . . . . .31
Figure 4.2: Relationship of the amount of open land in a subwatershed to the change in
peak flow (Verry, 2006) . . . . . . . . . . . . . . . . . . . . . . . . . . . . . . . . . . . . . . . . . . . . . . . . . . . . . . . . . . . . . . . . . . . . . . . . . . . . . . . . . . . . . . . . . . . . . . . . . . . . . . . . . .32
Figure 4.3: Comparative Analysis of Hydrologic Units (CGIS, 2004). . . . . . . . . . . . . . . . . . . . . . . . . . . . . . . . . . . . . . . . . . . . . . . . . .33
Figure 4.4: Two distinct cross sections common in the Marengo River Watershed
(USGS, 2006) . . . . . . . . . . . . . . . . . . . . . . . . . . . . . . . . . . . . . . . . . . . . . . . . . . . . . . . . . . . . . . . . . . . . . . . . . . . . . . . . . . . . . . . . . . . . . . . . . . . . . . . . . . . . . . . . . . . . . . . . . . . .34
Table 5.1: Significant Watershed Features . . . . . . . . . . . . . . . . . . . . . . . . . . . . . . . . . . . . . . . . . . . . . . . . . . . . . . . . . . . . . . . . . . . . . . . . . . . . . . . . . . . . .35
Table 6.1: Watershed Recovery Potential & Recommendations . . . . . . . . . . . . . . . . . . . . . . . . . . . . . . . . . . . . . . . . . . . 38-41
Table 6.1A: Recommendations for the Watershed Planning Process Resulting from the
Hydrologic Condition Assessment for the Marengo River Watershed Pilot Area
(Schultz, 2006) . . . . . . . . . . . . . . . . . . . . . . . . . . . . . . . . . . . . . . . . . . . . . . . . . . . . . . . . . . . . . . . . . . . . . . . . . . . . . . . . . . . . . . . . . . . . . . . . . . . . . . . . . . . . . . . . . . . 42-43
references . . . . . . . . . . . . . . . . . . . . . . . . . . . . . . . . . . . . . . . . . . . . . . . . . . . . . . . . . . . . . . . . . . . . . . . . . . . . . . . . . . . . . . . . . . . . . . . . . . . . . . . . . . . . . . . . . . . . . . . . . . . . . . . . . . . . . . . . . . . . Back cover
4
Superior
LymanLake
BearLake
MudLake
DowlingLake
AmniconLake
SteeleLake
NebagamonLake
MinnisuingLake
IronLake
DeepLake
MillicentHart
Crooked
BellevueLake
PerchLake
LongLake
BladderLake
SiskiwitLake
Star Lake
Delta
Twin Bear
KernLake
MarengoLake
CoffeeLake
MineralLake
SpiderLake
CarolineLake
MederLake
LongLake
LakeGalilee
O'BrienLake
LakeIslandLake Pine
Lake
UptonLake
Pigeon Lake
LakeOwen Diamond
Lake
SpillerbergLake
GileFlowageLake
Flag
Riv
er
White River
N. Fish Creek
Bad
Rive
r
Marengo River
Bois
Bru
le R
iver
Bois Brule River
Am
nico
n
River
Popl
ar
Black R
iver
Mon
trea
l R
iver
W. Fork
Sand Riv
er
Siskiwit River
Cra
nber
ry
Rive
r
Rive
r
Mid
dle
Rive
r
Rive
r
Pokegama
River
S. Fish Creek
Pleasant
EnglishLake
DrummondLake
BassLake
EagleLake
Nemad
ji River Sioux
River
Beart
rap
Creek
Denom
ic Creek
Montreal
Bad
River
Potato River
River
Potato
Forks River
Tyler
Map produced by the UW-Extension Environmental Resources Center
DO
UG
LAS C
O.
BAY
FIELD C
O.
BAY
FIELD C
O.
ASH
LAN
D C
O.
ASH
LAN
D C
O.
IRO
N C
O.
Popular
LakeNebagamon
Brule
Mason
Iron River Ashland
Mellen
HurleyMellen
Washburn
Bayfield
SandBay
Montreal
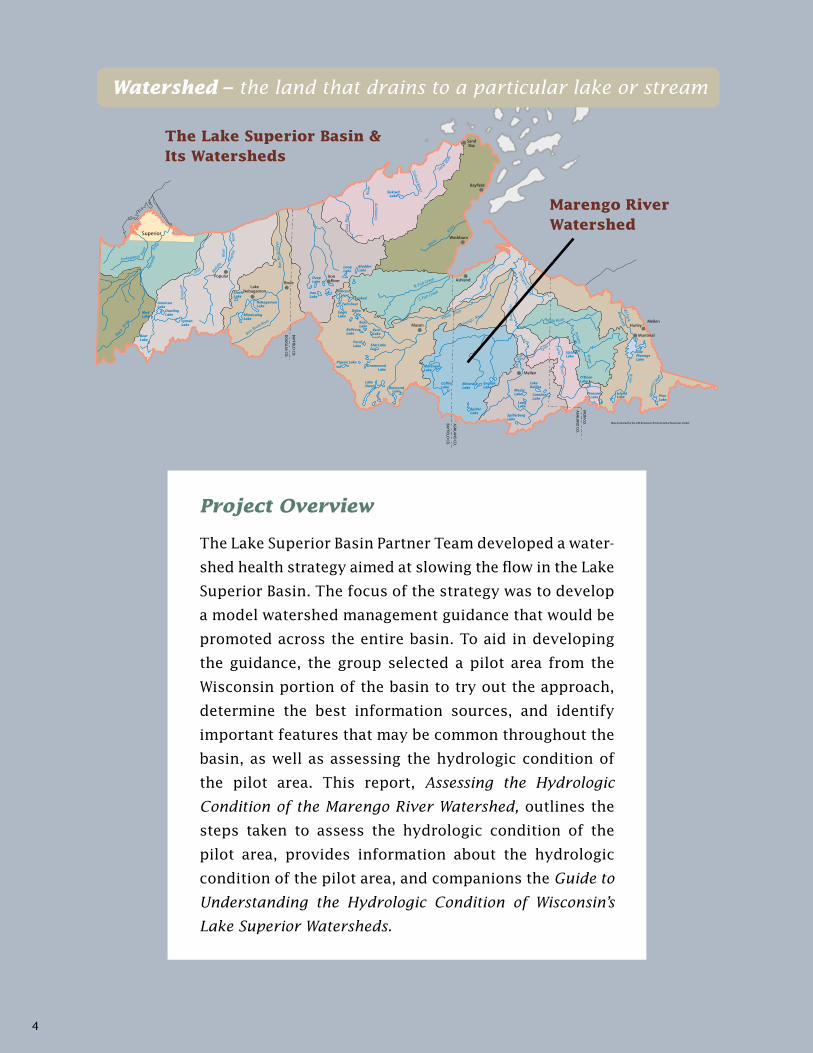
the Lake superior Basin &its Watersheds
Marengo riverWatershed
Project Overview
The Lake Superior Basin Partner Team developed a water-
shed health strategy aimed at slowing the flow in the Lake
Superior Basin. The focus of the strategy was to develop
a model watershed management guidance that would be
promoted across the entire basin. To aid in developing
the guidance, the group selected a pilot area from the
Wisconsin portion of the basin to try out the approach,
determine the best information sources, and identify
important features that may be common throughout the
basin, as well as assessing the hydrologic condition of
the pilot area. This report, Assessing the Hydrologic
Condition of the Marengo River Watershed, outlines the
steps taken to assess the hydrologic condition of the
pilot area, provides information about the hydrologic
condition of the pilot area, and companions the Guide to
Understanding the Hydrologic Condition of Wisconsin’s
Lake Superior Watersheds.
Watershed – the land that drains to a particular lake or stream
5
PiLot Watershed seLeCtion – Marengo river
The Wisconsin Lake Superior Basin Partner Team (the Partner Team) was originally formed in 1998 by the Department of Natural Resources, to help implement the Lake Superior Bi-national Program and Lakewide Management Plan in Wisconsin. The Partner Team has since evolved into a unique blend of public, private and nonprofit organizations and individuals, whose mission today is to implement a watershed health initiative known as “slow the flow.”
The Partner Team selected the Marengo River watershed as its test area to develop and demonstrate a process for assessing the hydrologic condition of Lake Superior watersheds. A step by step guide, including lessons learned from the Marengo River test project, was created for other groups that want to do the same in their own watersheds.
the aPProaCh
The approach selected to assess the hydrologic condition of the pilot area and as the basis for develop-ing a guidance document that would easily allow watershed and planning groups to perform a similar assessment was A Framework for Analyzing the Hydrologic Condition of Watersheds (McCammon, Rector, Gebhardt, 1998). This approach outlines a logical method paired with subjective ratings of watershed features to prepare an assessment tool. This tool, when combined with other information, becomes a part of the basis for identifying land management opportunities, setting priorities, and developing alternative management options that could maintain, improve, or restore healthy hydrologic condition to any watershed.
the setting
The Marengo River, located in central Ashland and south central Bayfield counties is a diverse watershed spanning 218 square miles (139,456 acres).
The upper portion of the watershed (elevations 1,443 feet to 1,033 feet above sea level) is forested and owned mostly by the US Forest Service with private land scattered throughout. It is characterized by sandy glacial till with rock outcroppings frequent, deciduous forests prevalent and a poorly developed drainage network with no valleys (USGS, 2005).
The middle portion of the watershed (elevations 1,033 feet to 771 feet above sea level) also known as the soil transitional area is mostly privately owned with a mix of hardwood and coniferous forest. Soils are mixed in this area with shallow sands (post-glacial) and mixed sand and clay as you move toward the clay plain, pockets of perched water and perched groundwater where clay layers are near the surface also occur. Springs and seeps are prevalent and the topography is characterized by steep unstable banks along stream channels, entrenched valleys with steep ravines often inundated with water in the spring and fall.
The lower potion of the Marengo watershed (elevations 771 feet to 711 feet above sea level) also known as the Lake Superior clay plain, typically is comprised of clayey till soils deposited (smeared) across the landscape by glaciers and glacial Lake Duluth. Entrenched, alluvial valleys are also found in a majority of this zone. Areas near the floodplains of the Marengo are frequently farmed as a result of loamier soil deposits from flood events.
6
Step
1strength in
numbers – Assembling a Review Team
Step
2a Picture is
Worth a thousand Words – Mapping Your Watershed
Step
3get Your Feet Wet – Finding
Information About Your Watershed
Step
4Putting Pen to Paper – Rating Your Watershed
Features
Step
5Which Watershed Features get the
spotlight – Selecting Important Features
Step
6a Watershed Walk through
time – Learning From the Past
to Protect the Future
GeneRAL STePS TO WATeRSHed PLAnnInG:
1. Build Partnerships
2. Characterize the Watershed 3. Finalize Goals and Identify Solutions
4. Design an Implementation Program
5. Implement Watershed Plan – take actions!
6. Measure Progress & Make Adjustments
Hydrologic Assessment
is an important part of
characterizing the water-
shed and identifying causes
and sources of pollution for
the Lake Superior basin.
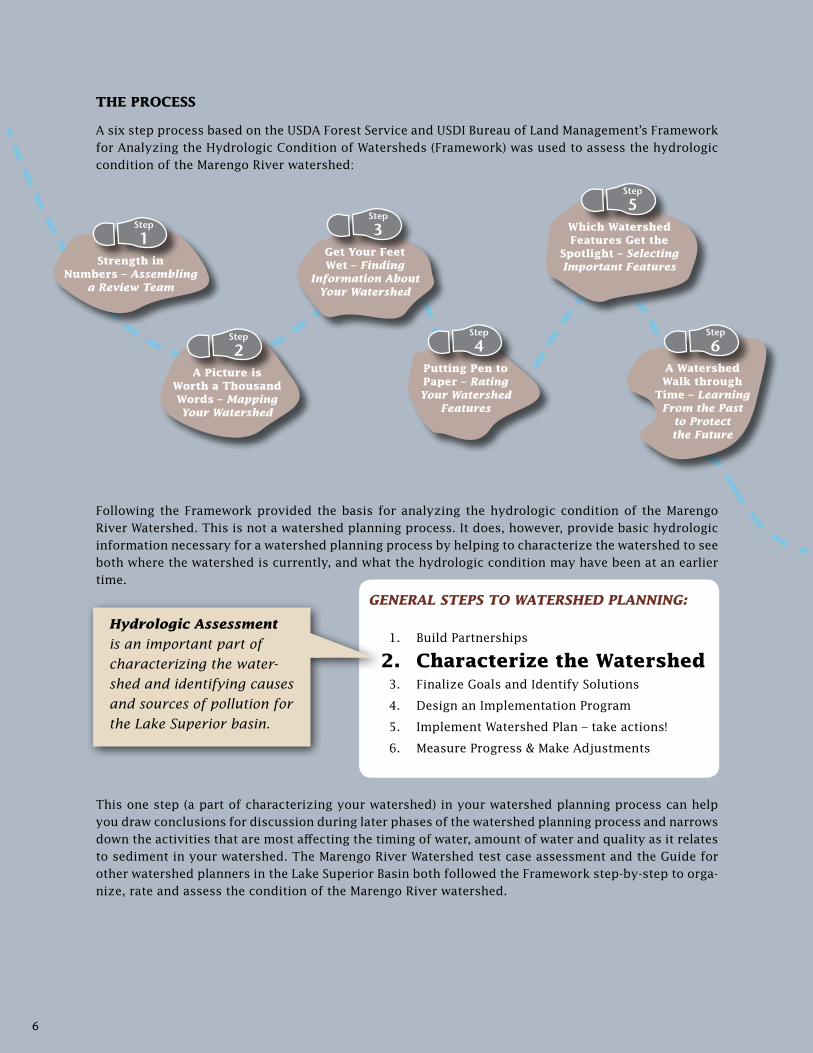
the ProCess
A six step process based on the USDA Forest Service and USDI Bureau of Land Management’s Framework for Analyzing the Hydrologic Condition of Watersheds (Framework) was used to assess the hydrologic condition of the Marengo River watershed:
Following the Framework provided the basis for analyzing the hydrologic condition of the Marengo River Watershed. This is not a watershed planning process. It does, however, provide basic hydrologic information necessary for a watershed planning process by helping to characterize the watershed to see both where the watershed is currently, and what the hydrologic condition may have been at an earlier time.
This one step (a part of characterizing your watershed) in your watershed planning process can help you draw conclusions for discussion during later phases of the watershed planning process and narrows down the activities that are most affecting the timing of water, amount of water and quality as it relates to sediment in your watershed. The Marengo River Watershed test case assessment and the Guide for other watershed planners in the Lake Superior Basin both followed the Framework step-by-step to orga-nize, rate and assess the condition of the Marengo River watershed.
7
ASSeSSInG THe HYdROLOGIC COndITIOn OF THe
MARenGO RIVeR WATeRSHed
l determined Project Area: Marengo River Watershed: 139,456 Acres (218 Square Miles) Watershed Length: 167,129 Meters (548,323 Feet) Subwatersheds: Silver Creek Headwaters Marengo River Brunsweiller River
Troutmere Creek
Trout Creek
l Identified Work Group Members & Stakeholders: Town Planning Committees & Boards Bad River Band of Lake Superior Tribe of Chippewa Indians USDA Forest Service State of Wisconsin DNR Watershed Association Agricultural Producers
l Technical Work Group Members: Agriculture George Mika, Ashland LCC Chairman and agricultural producer Sandra Schultz, Stable Solutions llc
Hydrologist Dale Higgins, USFS Forest Hydrologist
Education Nancy Larson, UWEX Lake Superior Basin Educator; Sue O’Halloran, UWEX Water Resources Specialist Kenneth Bro, Northland College Gene Clark, WI Sea Grant Coastal Engineering Specialist
Forestry Darryl Fenner, WDNR Forestry Supervisor
Fisheries Glenn Miller, USDI FWS Fishery Biologist Scott Toshner, WDNR Fishery Biologist
Mapping Tony Kroska, Community GIS Inc. Sandra Schultz, Stable Solutions llc
Private Sector John Wyssling, Grant Oversight Committee Co-Chair Soils Sandra Schultz, Stable Solutions llc
Water Resources Kirsten Cahow, BRNRD Natural Resources Specialist Watershed Association Karen Danielson, Bad River Watershed Association
Wildlife Todd Naas, WDNR Wildlife Biologist
Other Pam Dryer, USDI FWS Refuge Manager Diane Daulton, ABDI-LCD County Conservationist Amy Eliot, Amy Eliot Consulting
steP 1
strength in numbers Assembling a Review Team
8
l Prepared list of what members could expect and tentative timeline:
January 3 – March 31, 2006 Prepare Watershed Condition Report & Model Guidance
April 1 – May 10, 2006 Grant Oversight Committee Review
May 10 – June 1, 2006 Submit Final Report & Guidance
June 1 & June 7, 2006 Training Sessions
l This schedule was revised to:
January 3 – Sept 1, 2006 Prepare Watershed Condition Report & Model Guidance
Sept 1 - December 1, 2006 Grant Oversight Committee Review
December 1 – 28, 2006 Revise, locate & incorporate photos, provide mock up
Dec 28, 2006 – Jan 3, 2007 Finalize Appendix 2 (Watershed Condition Report)
January 22, 2007 Partner Team Meeting / Project Update
Dec 15, 2006 – Jan 15, 2007 DNR (Brule) Watershed Condition Report (20 copies)
BRNRD prints maps (20 copies)
February 12, 2007 Stakeholder Meeting / Watershed Condition Report
Presentation
Fall 2007 Printing
Fall 2007 Presentation on Assessment Guidance to Public
l Telephoned Potential Members
l notified by postcard of Informational Meeting
l drafted and released Project news Release (See Appendix 1)
l Organized and Prepared news Releases, Presentations & Handouts for Informational Session
9
Hydrology – the science of understanding the properties, distribution and circulation of water on or below the earth’s
surface and in the atmosphere.
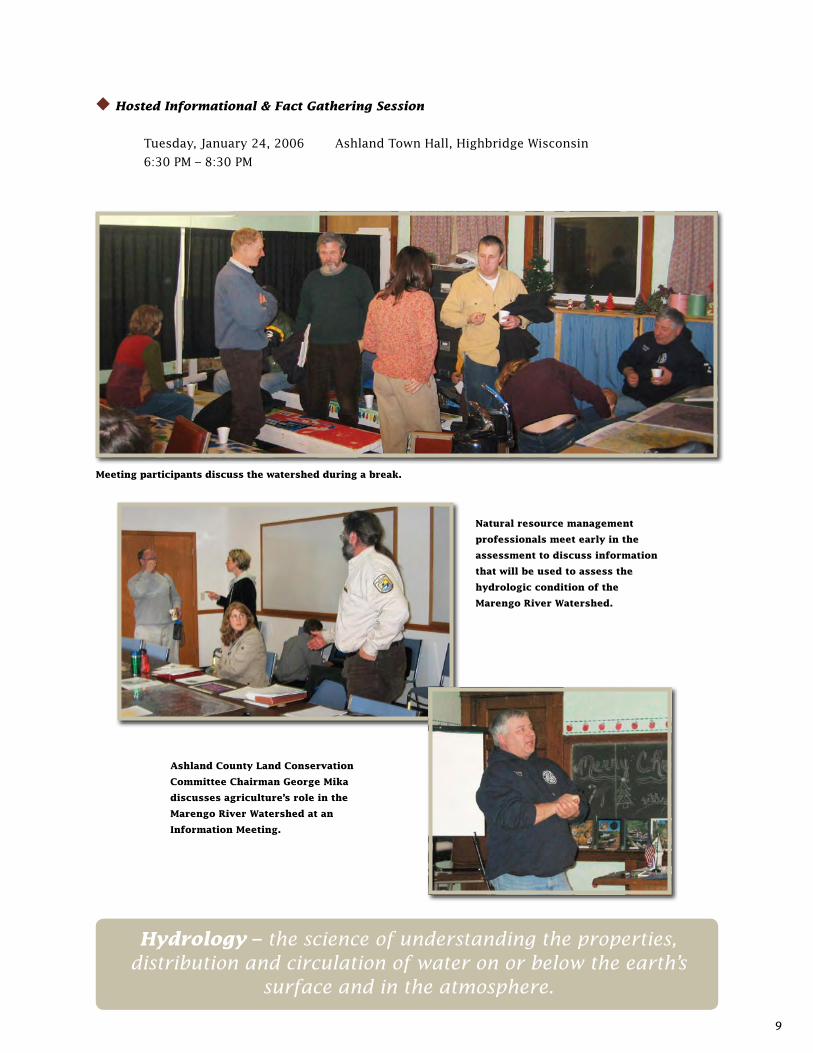
natural resource management
professionals meet early in the
assessment to discuss information
that will be used to assess the
hydrologic condition of the
Marengo river Watershed.
Meeting participants discuss the watershed during a break.
l Hosted Informational & Fact Gathering Session
Tuesday, January 24, 2006 Ashland Town Hall, Highbridge Wisconsin
6:30 PM – 8:30 PM
ashland County Land Conservation
Committee Chairman george Mika
discusses agriculture’s role in the
Marengo river Watershed at an
information Meeting.
10
ASSeSSInG THe HYdROLOGIC COndITIOn OF THe
MARenGO RIVeR WATeRSHed
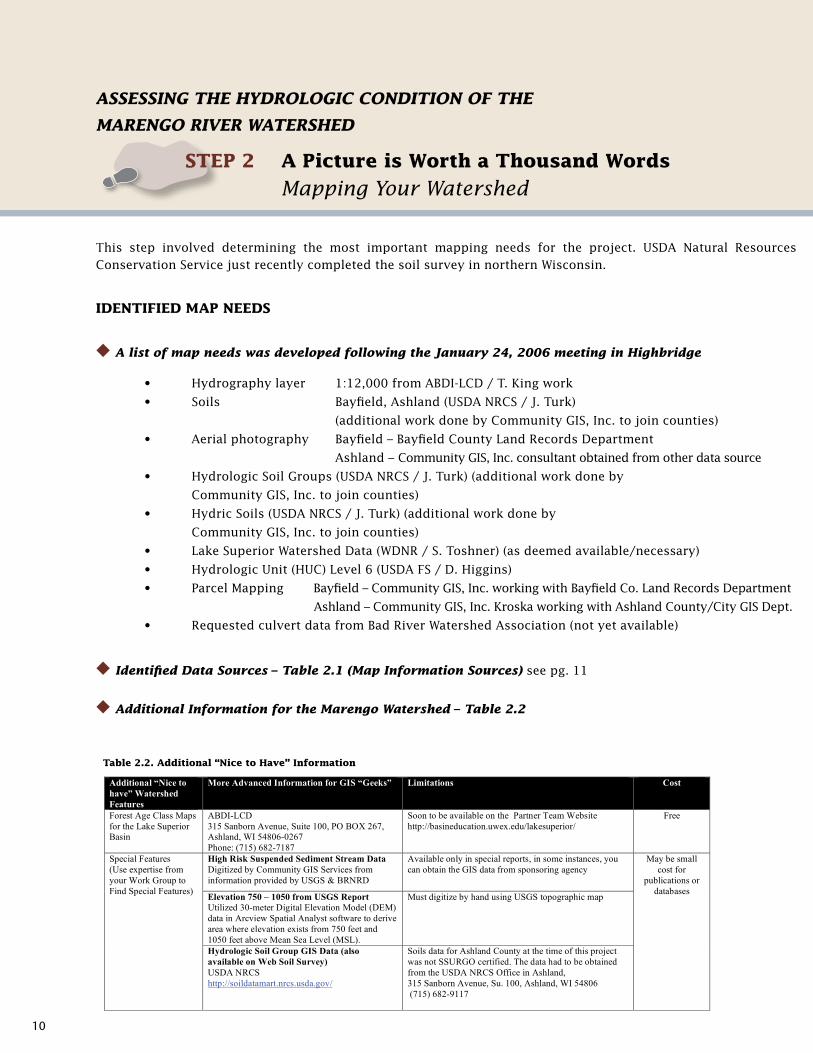
This step involved determining the most important mapping needs for the project. USDA Natural Resources Conservation Service just recently completed the soil survey in northern Wisconsin.
identiFied MaP needs
l A list of map needs was developed following the January 24, 2006 meeting in Highbridge
• Hydrographylayer 1:12,000fromABDI-LCD/T.Kingwork
• Soils Bayfield,Ashland(USDANRCS/J.Turk)
(additional work done by Community GIS, Inc. to join counties)
• Aerialphotography Bayfield–BayfieldCountyLandRecordsDepartment
Ashland – Community GIS, Inc. consultant obtained from other data source
• HydrologicSoilGroups(USDANRCS/J.Turk)(additionalworkdoneby
Community GIS, Inc. to join counties)
• HydricSoils(USDANRCS/J.Turk)(additionalworkdoneby
Community GIS, Inc. to join counties)
• LakeSuperiorWatershedData(WDNR/S.Toshner)(asdeemedavailable/necessary)
• HydrologicUnit(HUC)Level6(USDAFS/D.Higgins)
• ParcelMappingBayfield–CommunityGIS,Inc.workingwithBayfieldCo.LandRecordsDepartment
Ashland – Community GIS, Inc. Kroska working with Ashland County/City GIS Dept.
• RequestedculvertdatafromBadRiverWatershedAssociation(notyetavailable)
l Identified data Sources – Table 2.1 (Map Information Sources) see pg. 11
l Additional Information for the Marengo Watershed – Table 2.2
steP 2 a Picture is Worth a thousand Words
Mapping Your Watershed
A Slow the Flow Project A Report of the Hydrologic Condition of the Marengo River Watershed
Of The Lake Superior Basin Partner Team
January 2007 Stable Solutions LLC
with Community GIS, Inc.
43
Watershed Features Recommended Maps Where Do-It-Yourselfers Can Find the
Information
More Advanced Information for GIS “Geeks”
Public & Private Land Wisconsin DNR Surface Water Data Viewer –
http://maps.dnr.state.wi.us/imf/dnrimf.jsp?site=S
urfaceWaterViewer
or
County Land Information & Land Records
Department
Bayfield County
http://www.bayfieldcounty.org/landrecords/index.
htm
Ashland County
http://www.ashlandcogiws.com/html/default.htm\
Table 2.2: Map Information - Beyond the Basics
Additional “Nice to
have” Watershed
Features
More Advanced Information for GIS “Geeks” Limitations Cost
Forest Age Class Maps
for the Lake Superior
Basin
ABDI-LCD
315 Sanborn Avenue, Suite 100, PO BOX 267,
Ashland, WI 54806-0267
Phone: (715) 682-7187
Soon to be available on the Partner Team Website
http://basineducation.uwex.edu/lakesuperior/
Free
High Risk Suspended Sediment Stream Data
Digitized by Community GIS Services from
information provided by USGS & BRNRD
Available only in special reports, in some instances, you
can obtain the GIS data from sponsoring agency
Elevation 750 – 1050 from USGS Report
Utilized 30-meter Digital Elevation Model (DEM)
data in Arcview Spatial Analyst software to derive
area where elevation exists from 750 feet and
1050 feet above Mean Sea Level (MSL).
Must digitize by hand using USGS topographic map
Special Features
(Use expertise from
your Work Group to
Find Special Features)
Hydrologic Soil Group GIS Data (also
available on Web Soil Survey)
USDA NRCS
http://soildatamart.nrcs.usda.gov/
Soils data for Ashland County at the time of this project
was not SSURGO certified. The data had to be obtained
from the USDA NRCS Office in Ashland,
315 Sanborn Avenue, Su. 100, Ashland, WI 54806
(715) 682-9117
May be small
cost for
publications or
databases
table 2.2. additional “nice to have” information
11
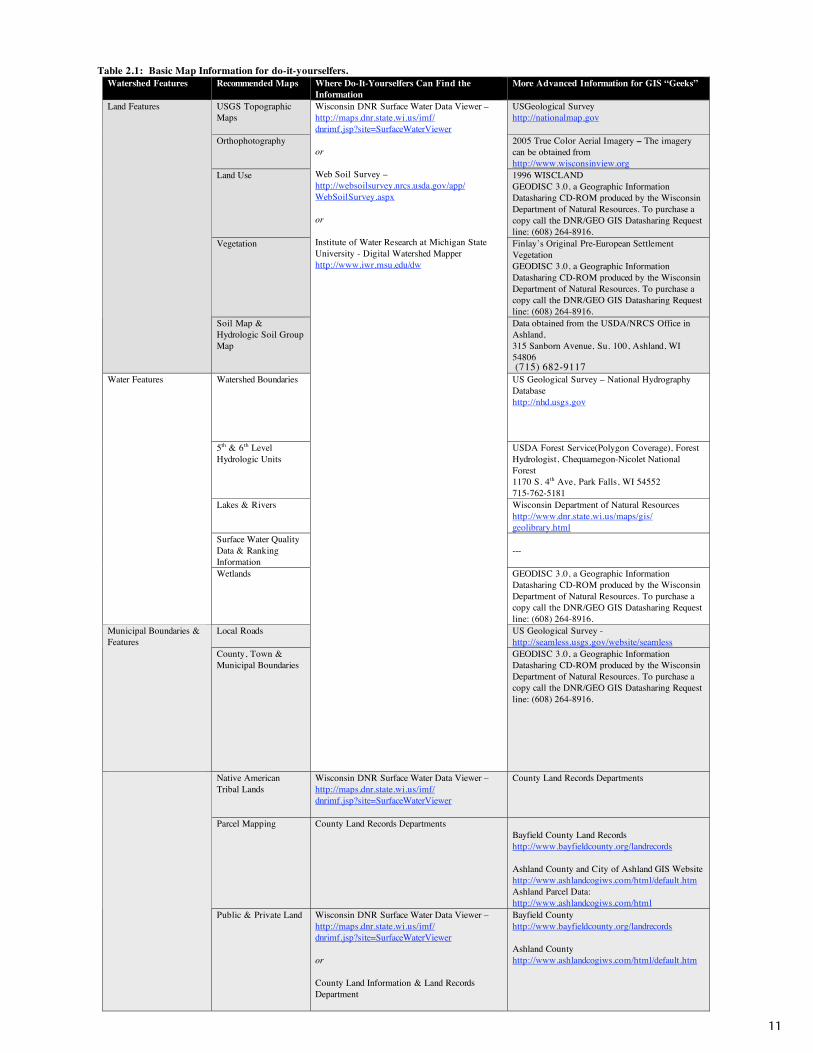
A Guide to Understanding the Hydrologic Condition of Wisconsin’s Lake Superior Watersheds Step 2: A Picture is Worth a Thousand Words – Mapping Your Watershed
Table 2.1: Basic Map Information for do-it-yourselfers.
Watershed Features Recommended Maps Where Do-It-Yourselfers Can Find the
Information
More Advanced Information for GIS “Geeks”
USGS Topographic
Maps
USGeological Survey
http://nationalmap.gov
Orthophotography 2005 True Color Aerial Imagery – The imagery
can be obtained from
http://www.wisconsinview.org
Land Use 1996 WISCLAND
GEODISC 3.0, a Geographic Information
Datasharing CD-ROM produced by the Wisconsin
Department of Natural Resources. To purchase a
copy call the DNR/GEO GIS Datasharing Request
line: (608) 264-8916.
Vegetation Finlay’s Original Pre-European Settlement
Vegetation
GEODISC 3.0, a Geographic Information
Datasharing CD-ROM produced by the Wisconsin
Department of Natural Resources. To purchase a
copy call the DNR/GEO GIS Datasharing Request
line: (608) 264-8916.
Land Features
Soil Map &
Hydrologic Soil Group
Map
Data obtained from the USDA/NRCS Office in
Ashland,
315 Sanborn Avenue, Su. 100, Ashland, WI
54806 (715) 682-9117
Watershed Boundaries
US Geological Survey – National Hydrography
Database
http://nhd.usgs.gov
5th & 6th Level
Hydrologic Units
USDA Forest Service(Polygon Coverage), Forest
Hydrologist, Chequamegon-Nicolet National
Forest
1170 S. 4th Ave, Park Falls, WI 54552
715-762-5181
Lakes & Rivers Wisconsin Department of Natural Resources
http://www.dnr.state.wi.us/maps/gis/
geolibrary.html
Surface Water Quality
Data & Ranking
Information
Wisconsin DNR Surface Water Data Viewer –
http://maps.dnr.state.wi.us/imf/
dnrimf.jsp?site=SurfaceWaterViewer
or
Web Soil Survey –
http://websoilsurvey.nrcs.usda.gov/app/
WebSoilSurvey.aspx
or
Institute of Water Research at Michigan State
University - Digital Watershed Mapper
http://www.iwr.msu.edu/dw
---
Water Features
Wetlands GEODISC 3.0, a Geographic Information
Datasharing CD-ROM produced by the Wisconsin
Department of Natural Resources. To purchase a
copy call the DNR/GEO GIS Datasharing Request
line: (608) 264-8916.
Local Roads US Geological Survey -
http://seamless.usgs.gov/website/seamless
Municipal Boundaries &
Features
County, Town &
Municipal Boundaries
GEODISC 3.0, a Geographic Information
Datasharing CD-ROM produced by the Wisconsin
Department of Natural Resources. To purchase a
copy call the DNR/GEO GIS Datasharing Request
line: (608) 264-8916.
Native American
Tribal Lands
Wisconsin DNR Surface Water Data Viewer –
http://maps.dnr.state.wi.us/imf/
dnrimf.jsp?site=SurfaceWaterViewer
County Land Records Departments
Parcel Mapping County Land Records Departments
Bayfield County Land Records
http://www.bayfieldcounty.org/landrecords
Ashland County and City of Ashland GIS Website
http://www.ashlandcogiws.com/html/default.htm
Ashland Parcel Data:
http://www.ashlandcogiws.com/html
Public & Private Land Wisconsin DNR Surface Water Data Viewer –
http://maps.dnr.state.wi.us/imf/
dnrimf.jsp?site=SurfaceWaterViewer
or
County Land Information & Land Records
Department
Bayfield County
http://www.bayfieldcounty.org/landrecords
Ashland County
http://www.ashlandcogiws.com/html/default.htm
12
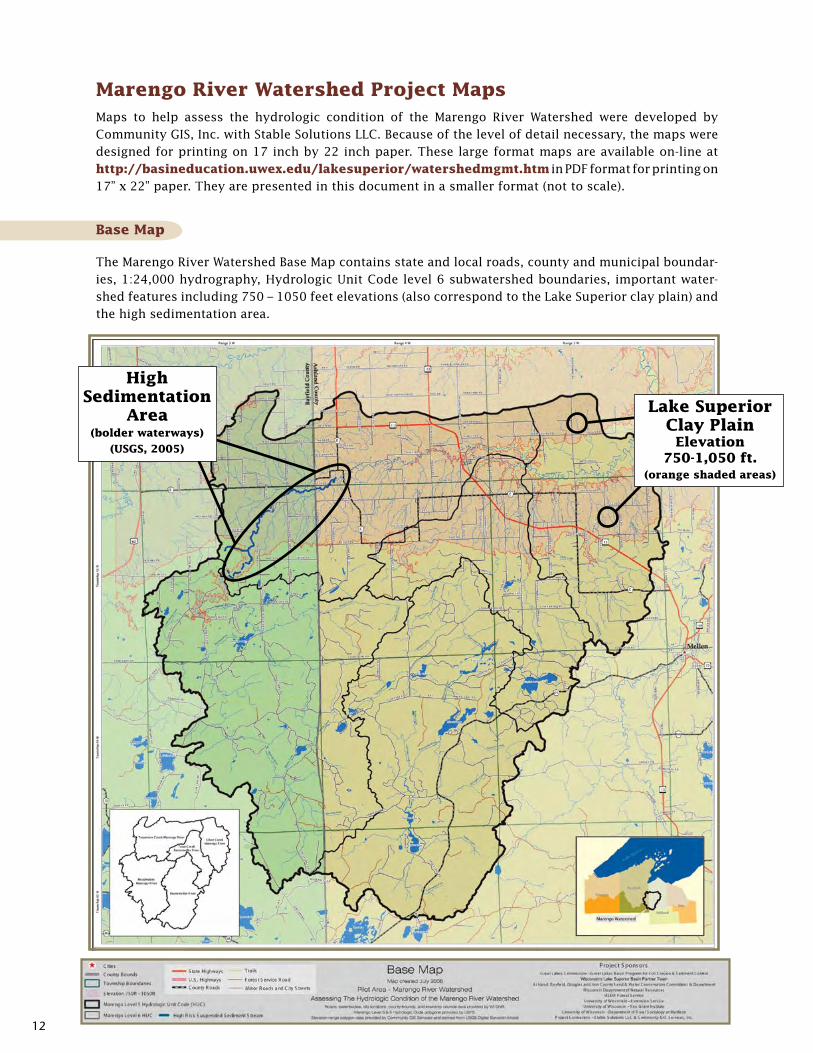
Marengo river Watershed Project Maps Maps to help assess the hydrologic condition of the Marengo River Watershed were developed by Community GIS, Inc. with Stable Solutions LLC. Because of the level of detail necessary, the maps were designed for printing on 17 inch by 22 inch paper. These large format maps are available on-line at http://basineducation.uwex.edu/lakesuperior/watershedmgmt.htm in PDF format for printing on 17” x 22” paper. They are presented in this document in a smaller format (not to scale).
Base Map
The Marengo River Watershed Base Map contains state and local roads, county and municipal boundar-ies, 1:24,000 hydrography, Hydrologic Unit Code level 6 subwatershed boundaries, important water-shed features including 750 – 1050 feet elevations (also correspond to the Lake Superior clay plain) and the high sedimentation area.
high sedimentation
area(bolder waterways)
(Usgs, 2005)
Lake superior Clay Plain
elevation 750-1,050 ft.
(orange shaded areas)
13
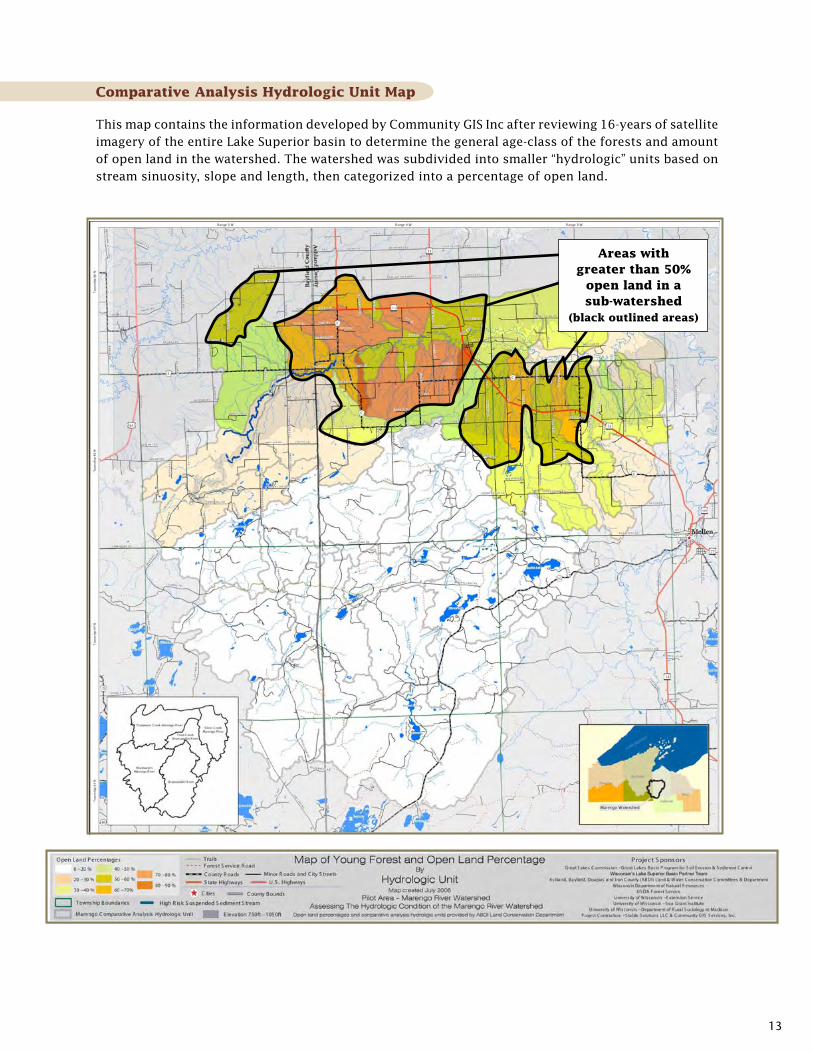
Comparative analysis hydrologic Unit Map
This map contains the information developed by Community GIS Inc after reviewing 16-years of satellite imagery of the entire Lake Superior basin to determine the general age-class of the forests and amount of open land in the watershed. The watershed was subdivided into smaller “hydrologic” units based on stream sinuosity, slope and length, then categorized into a percentage of open land.
areas with greater than 50%
open land in a sub-watershed
(black outlined areas)
14
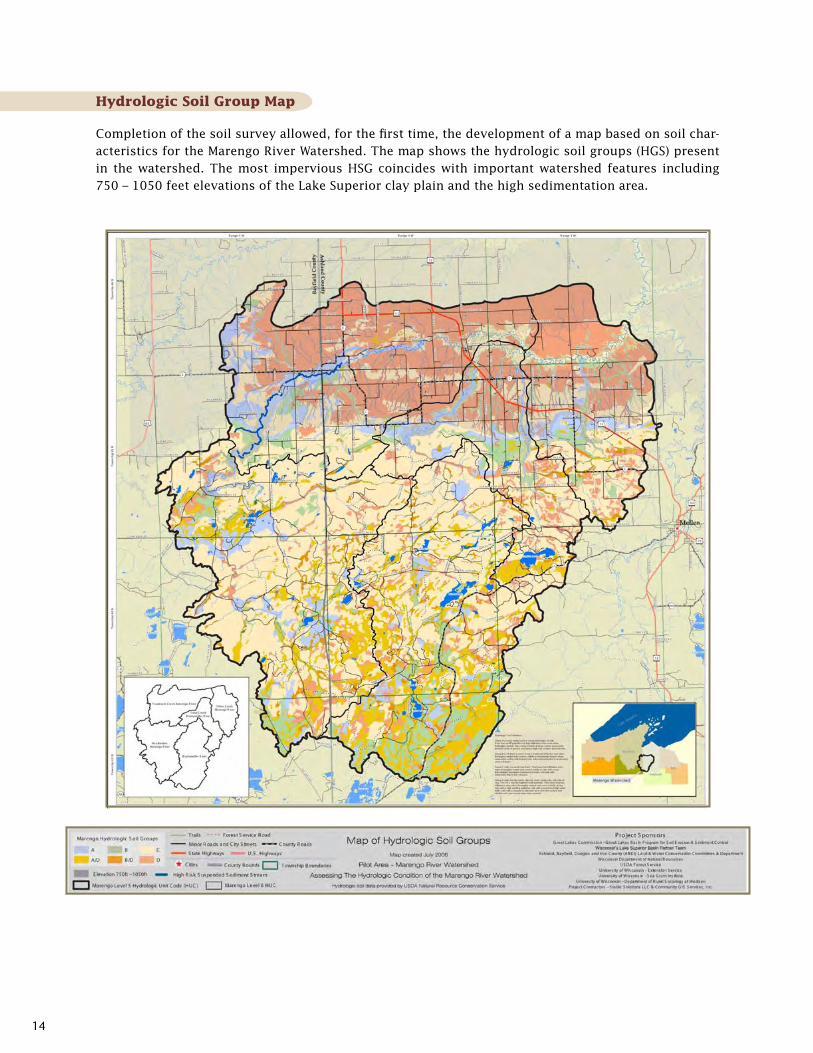
hydrologic soil group Map
Completion of the soil survey allowed, for the first time, the development of a map based on soil char-acteristics for the Marengo River Watershed. The map shows the hydrologic soil groups (HGS) present in the watershed. The most impervious HSG coincides with important watershed features including 750 – 1050 feet elevations of the Lake Superior clay plain and the high sedimentation area.
15
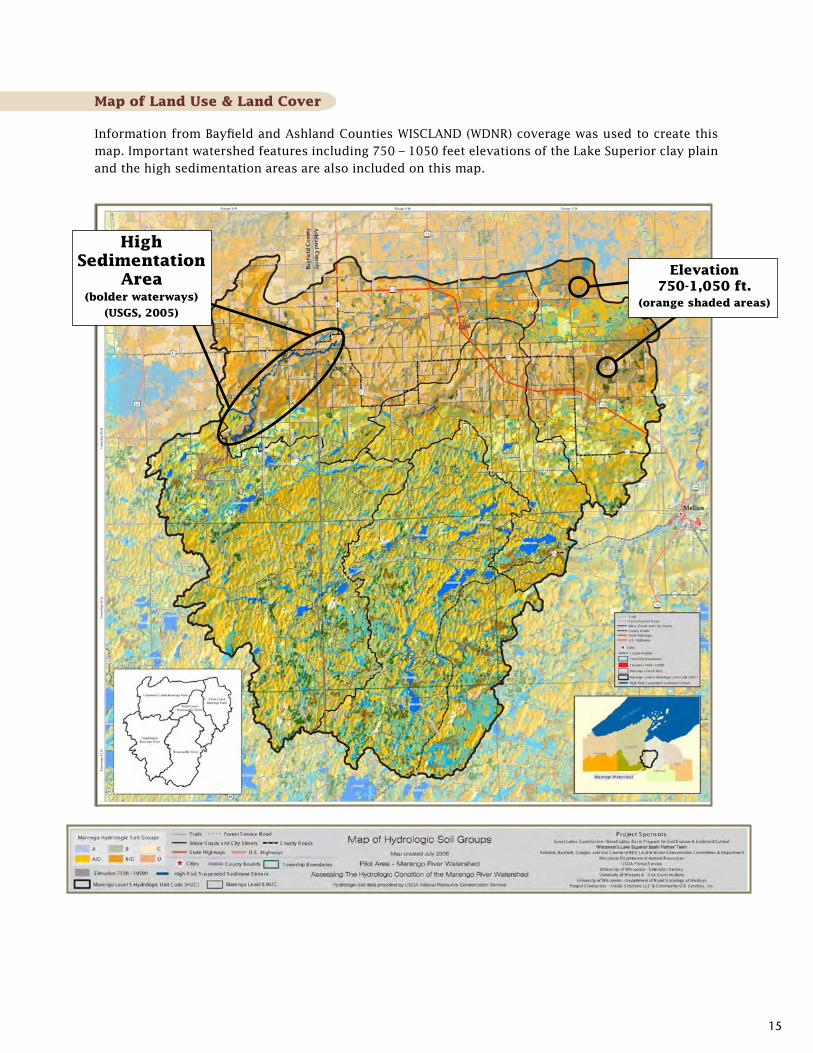
Map of Land Use & Land Cover
Information from Bayfield and Ashland Counties WISCLAND (WDNR) coverage was used to create this map. Important watershed features including 750 – 1050 feet elevations of the Lake Superior clay plain and the high sedimentation areas are also included on this map.
high sedimentation
area(bolder waterways)
(Usgs, 2005)
elevation 750-1,050 ft.
(orange shaded areas)
16
Map of Moderate & steep slopes
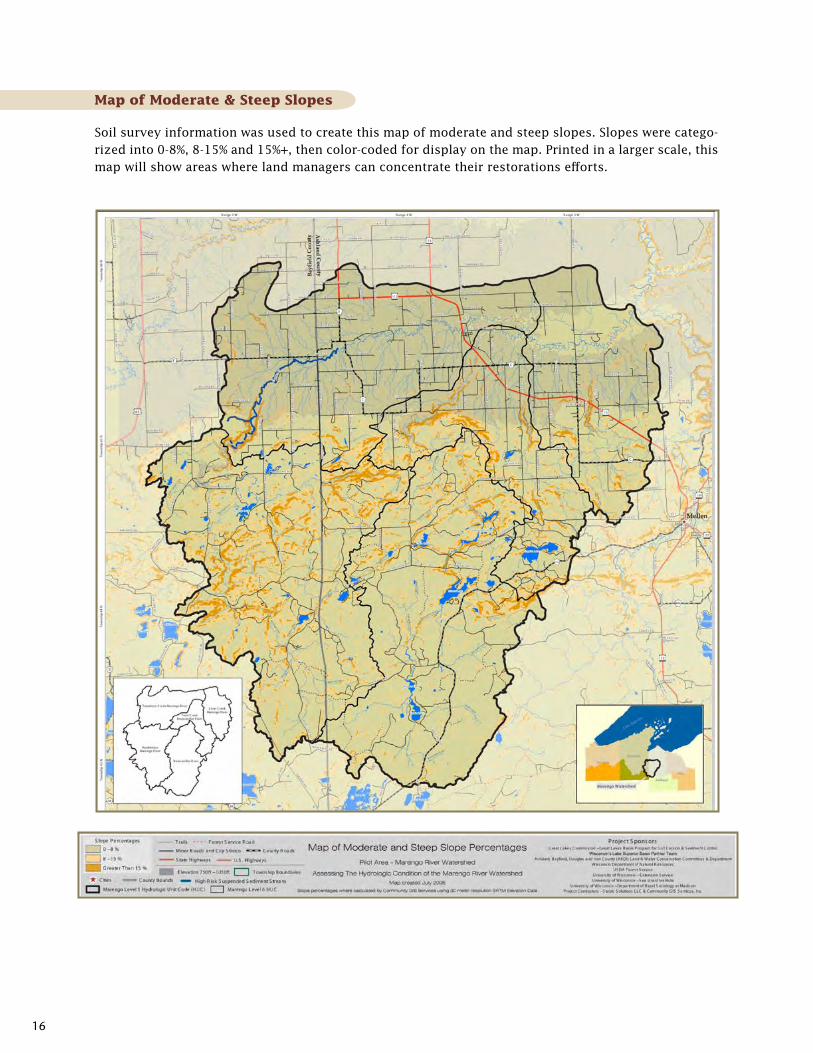
Soil survey information was used to create this map of moderate and steep slopes. Slopes were catego-rized into 0-8%, 8-15% and 15%+, then color-coded for display on the map. Printed in a larger scale, this map will show areas where land managers can concentrate their restorations efforts.
17
Map showing Percentage Land ownership
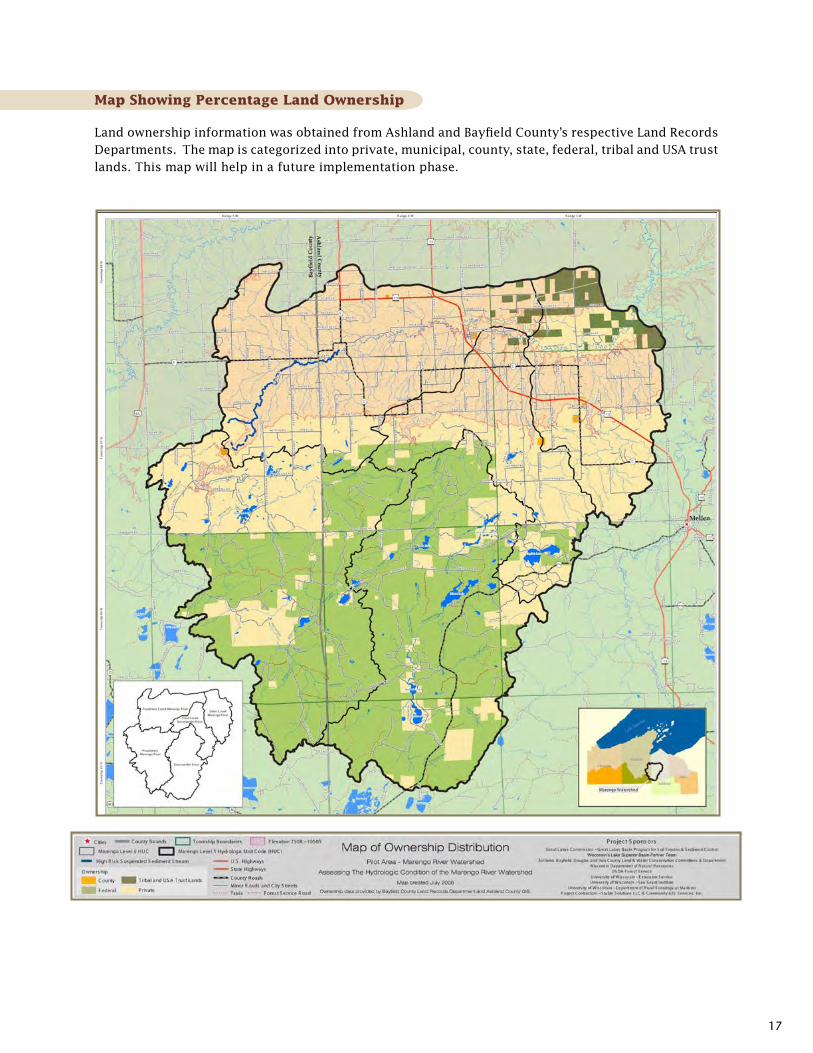
Land ownership information was obtained from Ashland and Bayfield County’s respective Land Records Departments. The map is categorized into private, municipal, county, state, federal, tribal and USA trust lands. This map will help in a future implementation phase.
18
ASSeSSInG THe HYdROLOGIC COndITIOn OF THe
MARenGO RIVeR WATeRSHed
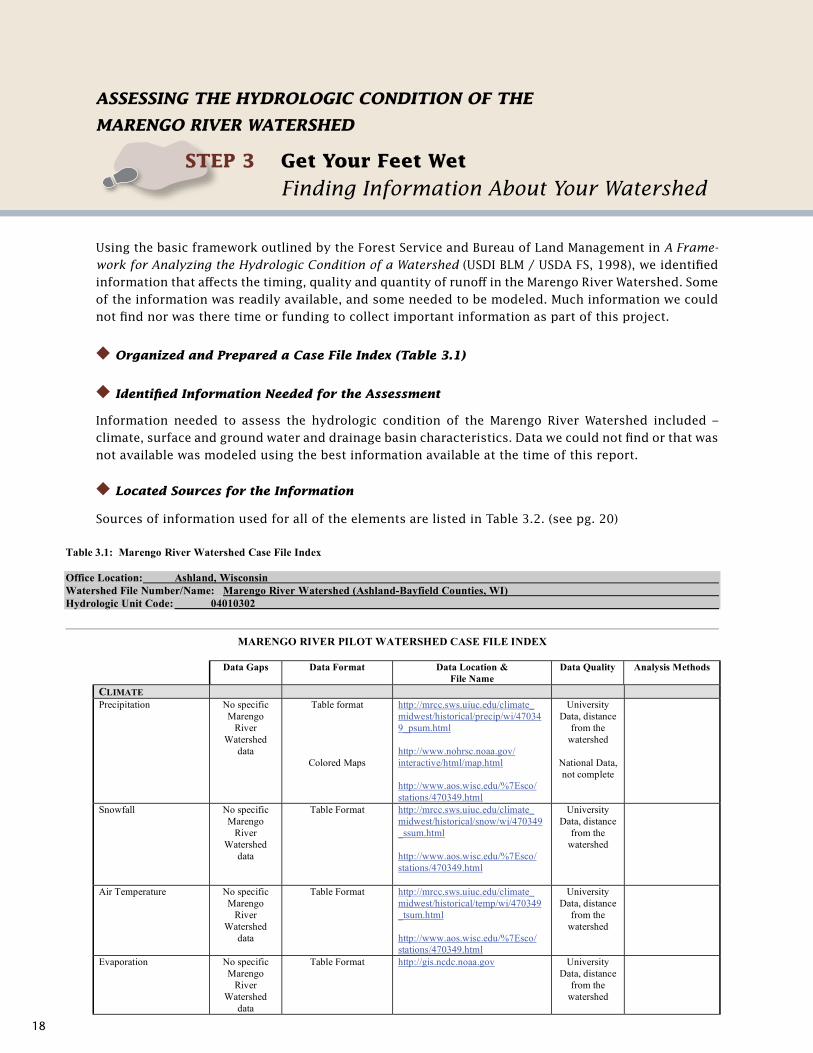
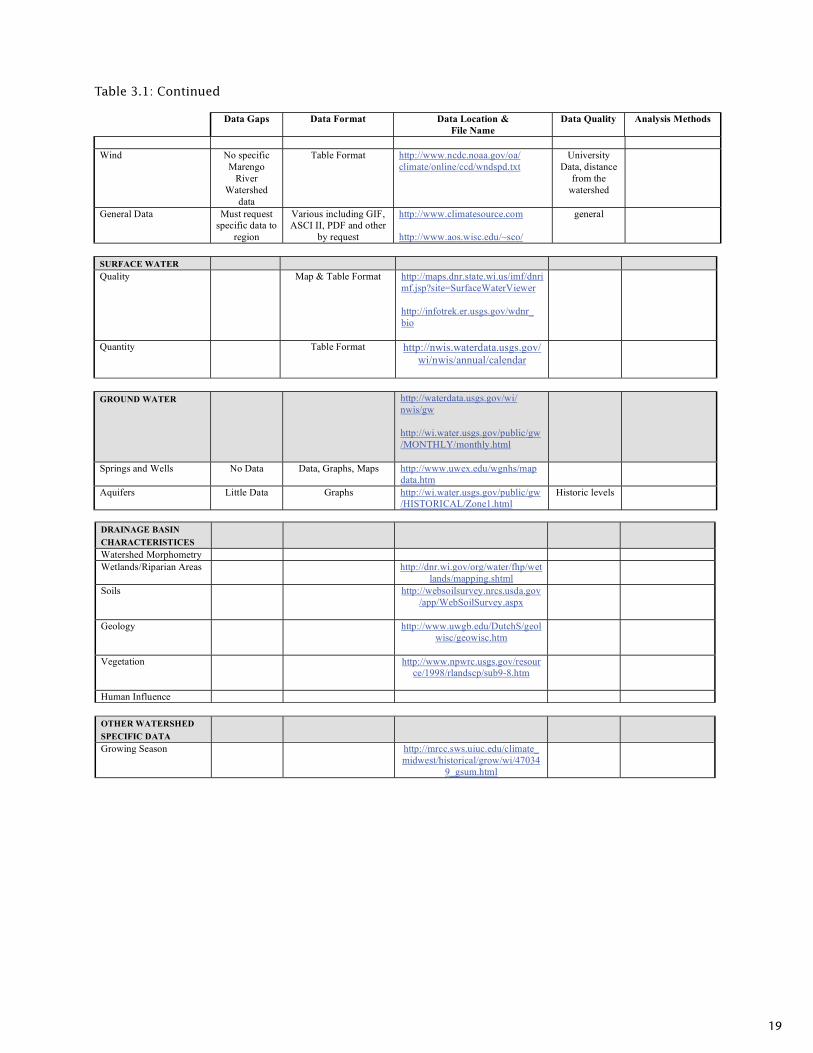
Using the basic framework outlined by the Forest Service and Bureau of Land Management in A Frame-work for Analyzing the Hydrologic Condition of a Watershed (USDI BLM / USDA FS, 1998), we identified information that affects the timing, quality and quantity of runoff in the Marengo River Watershed. Some of the information was readily available, and some needed to be modeled. Much information we could not find nor was there time or funding to collect important information as part of this project.
l Organized and Prepared a Case File Index (Table 3.1)
l Identified Information needed for the Assessment
Information needed to assess the hydrologic condition of the Marengo River Watershed included – climate, surface and ground water and drainage basin characteristics. Data we could not find or that was not available was modeled using the best information available at the time of this report.
l Located Sources for the Information
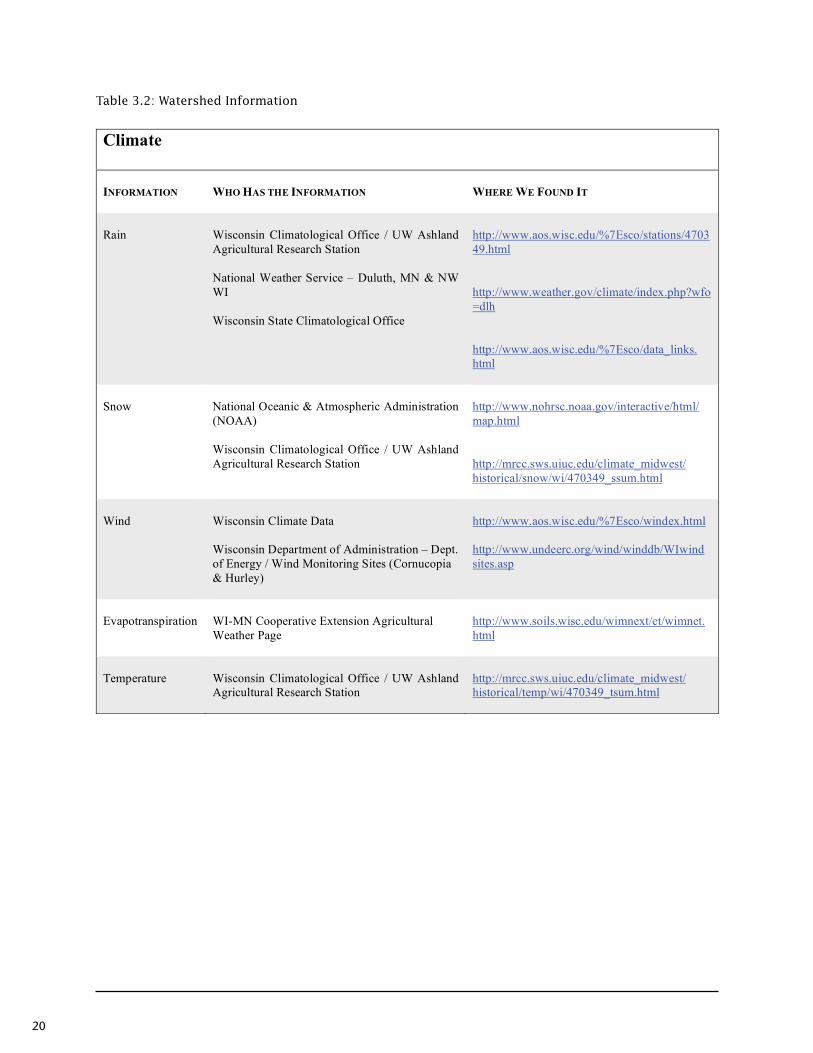
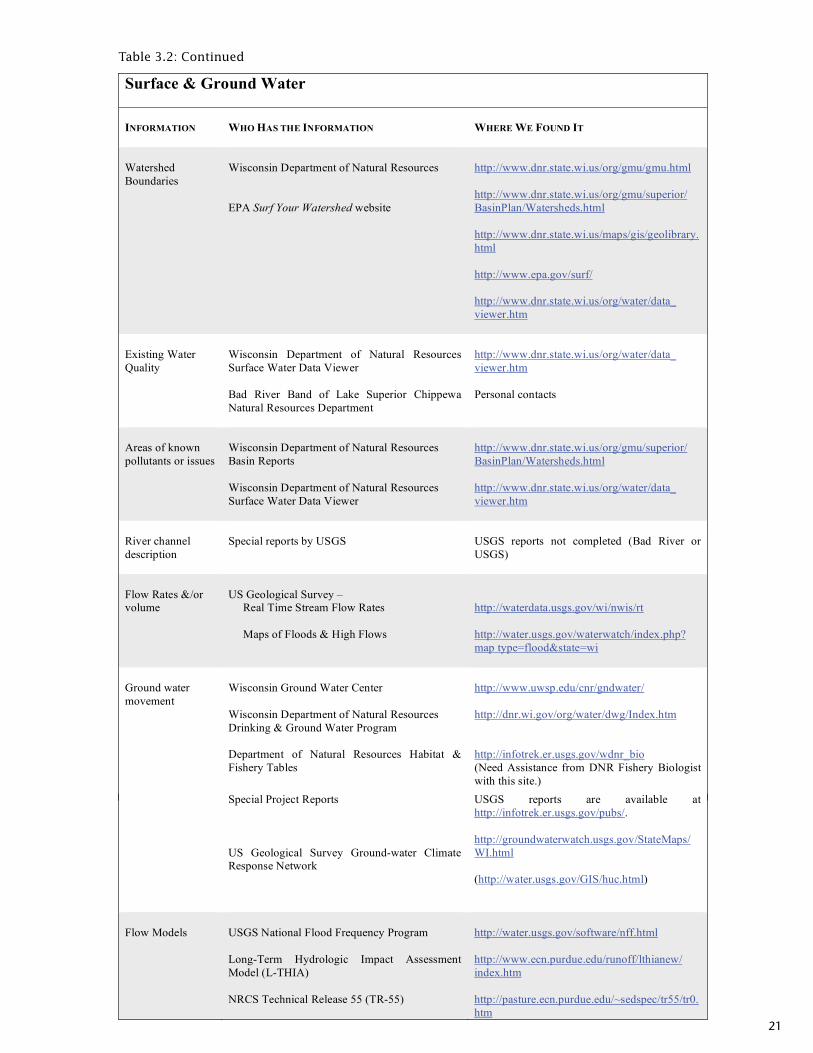
Sources of information used for all of the elements are listed in Table 3.2. (see pg. 20)
steP 3 get Your Feet Wet
Finding Information About Your Watershed
A Slow the Flow Project A Report of the Hydrologic Condition of the Marengo River Watershed
Of The Lake Superior Basin Partner Team
January 2007 Stable Solutions LLC
with Community GIS, Inc.
45
Table 3.1: Marengo River Watershed Case File Index
Office Location: Ashland, Wisconsin
Watershed File Number/Name: Marengo River Watershed (Ashland-Bayfield Counties, WI)
Hydrologic Unit Code: 04010302
MARENGO RIVER PILOT WATERSHED CASE FILE INDEX
Data Gaps Data Format Data Location &
File Name
Data Quality Analysis Methods
CLIMATE
Precipitation No specific
Marengo
River
Watershed
data
Table format
Colored Maps
http://mrcc.sws.uiuc.edu/climate_
midwest/historical/precip/wi/47034
9_psum.html
http://www.nohrsc.noaa.gov/
interactive/html/map.html
http://www.aos.wisc.edu/%7Esco/
stations/470349.html
University
Data, distance
from the
watershed
National Data,
not complete
Snowfall No specific
Marengo
River
Watershed
data
Table Format http://mrcc.sws.uiuc.edu/climate_
midwest/historical/snow/wi/470349
_ssum.html
http://www.aos.wisc.edu/%7Esco/
stations/470349.html
University
Data, distance
from the
watershed
Air Temperature No specific
Marengo
River
Watershed
data
Table Format http://mrcc.sws.uiuc.edu/climate_
midwest/historical/temp/wi/470349
_tsum.html
http://www.aos.wisc.edu/%7Esco/
stations/470349.html
University
Data, distance
from the
watershed
Evaporation No specific
Marengo
River
Watershed
data
Table Format http://gis.ncdc.noaa.gov
University
Data, distance
from the
watershed
19
A Slow the Flow Project A Report of the Hydrologic Condition of the Marengo River Watershed
Of The Lake Superior Basin Partner Team
January 2007 Stable Solutions LLC
with Community GIS, Inc.
46
Data Gaps Data Format Data Location &
File Name
Data Quality Analysis Methods
Wind No specific
Marengo
River
Watershed
data
Table Format http://www.ncdc.noaa.gov/oa/
climate/online/ccd/wndspd.txt
University
Data, distance
from the
watershed
General Data Must request
specific data to
region
Various including GIF,
ASCI II, PDF and other
by request
http://www.climatesource.com
http://www.aos.wisc.edu/~sco/
general
SURFACE WATER
Quality Map & Table Format http://maps.dnr.state.wi.us/imf/dnri
mf.jsp?site=SurfaceWaterViewer
http://infotrek.er.usgs.gov/wdnr_
bio
Quantity Table Format http://nwis.waterdata.usgs.gov/
wi/nwis/annual/calendar
GROUND WATER http://waterdata.usgs.gov/wi/
nwis/gw
http://wi.water.usgs.gov/public/gw
/MONTHLY/monthly.html
Springs and Wells No Data Data, Graphs, Maps http://www.uwex.edu/wgnhs/map
data.htm
Aquifers Little Data Graphs http://wi.water.usgs.gov/public/gw
/HISTORICAL/Zone1.html
Historic levels
A Slow the Flow Project A Report of the Hydrologic Condition of the Marengo River Watershed
Of The Lake Superior Basin Partner Team
January 2007 Stable Solutions LLC
with Community GIS, Inc.
47
DRAINAGE BASIN
CHARACTERISTICES
Watershed Morphometry
Wetlands/Riparian Areas http://dnr.wi.gov/org/water/fhp/wet
lands/mapping.shtml
Soils http://websoilsurvey.nrcs.usda.gov
/app/WebSoilSurvey.aspx
Geology http://www.uwgb.edu/DutchS/geol
wisc/geowisc.htm
Vegetation http://www.npwrc.usgs.gov/resour
ce/1998/rlandscp/sub9-8.htm
Human Influence
OTHER WATERSHED
SPECIFIC DATA
Growing Season http://mrcc.sws.uiuc.edu/climate_
midwest/historical/grow/wi/47034
9_gsum.html
Table 3.1: Continued
20
A Slow the Flow Project A Report of the Hydrologic Condition of the Marengo River Watershed
Of The Lake Superior Basin Partner Team
January 2007 Stable Solutions LLC
with Community GIS, Inc. 49
Table 3.2 Watershed Information
Climate
INFORMATION
WHO HAS THE INFORMATION
WHERE WE FOUND IT
Rain
Wisconsin Climatological Office / UW Ashland
Agricultural Research Station
National Weather Service – Duluth, MN & NW
WI
Wisconsin State Climatological Office
http://www.aos.wisc.edu/%7Esco/stations/4703
49.html
http://www.weather.gov/climate/index.php?wfo
=dlh
http://www.aos.wisc.edu/%7Esco/data_links.
html
Snow
National Oceanic & Atmospheric Administration
(NOAA)
Wisconsin Climatological Office / UW Ashland
Agricultural Research Station
http://www.nohrsc.noaa.gov/interactive/html/
map.html
http://mrcc.sws.uiuc.edu/climate_midwest/
historical/snow/wi/470349_ssum.html
Wind
Wisconsin Climate Data
Wisconsin Department of Administration – Dept.
of Energy / Wind Monitoring Sites (Cornucopia
& Hurley)
http://www.aos.wisc.edu/%7Esco/windex.html
http://www.undeerc.org/wind/winddb/WIwind
sites.asp
Evapotranspiration
WI-MN Cooperative Extension Agricultural
Weather Page
http://www.soils.wisc.edu/wimnext/et/wimnet.
html
Temperature
Wisconsin Climatological Office / UW Ashland
Agricultural Research Station
http://mrcc.sws.uiuc.edu/climate_midwest/
historical/temp/wi/470349_tsum.html
Table 3.2: Watershed Information
21
A Slow the Flow Project A Report of the Hydrologic Condition of the Marengo River Watershed
Of The Lake Superior Basin Partner Team
January 2007 Stable Solutions LLC
with Community GIS, Inc. 50
Surface & Ground Water
INFORMATION
WHO HAS THE INFORMATION
WHERE WE FOUND IT
Watershed
Boundaries
Wisconsin Department of Natural Resources
EPA Surf Your Watershed website
http://www.dnr.state.wi.us/org/gmu/gmu.html
http://www.dnr.state.wi.us/org/gmu/superior/
BasinPlan/Watersheds.html
http://www.dnr.state.wi.us/maps/gis/geolibrary.
html
http://www.epa.gov/surf/
http://www.dnr.state.wi.us/org/water/data_
viewer.htm
Existing Water
Quality
Wisconsin Department of Natural Resources
Surface Water Data Viewer
Bad River Band of Lake Superior Chippewa
Natural Resources Department
http://www.dnr.state.wi.us/org/water/data_
viewer.htm
Personal contacts
Areas of known
pollutants or issues
Wisconsin Department of Natural Resources
Basin Reports
Wisconsin Department of Natural Resources
Surface Water Data Viewer
http://www.dnr.state.wi.us/org/gmu/superior/
BasinPlan/Watersheds.html
http://www.dnr.state.wi.us/org/water/data_
viewer.htm
River channel
description
Special reports by USGS USGS reports not completed (Bad River or
USGS)
Flow Rates &/or
volume
US Geological Survey –
Real Time Stream Flow Rates
Maps of Floods & High Flows
http://waterdata.usgs.gov/wi/nwis/rt
http://water.usgs.gov/waterwatch/index.php?
map type=flood&state=wi
Ground water
movement
Wisconsin Ground Water Center
Wisconsin Department of Natural Resources
Drinking & Ground Water Program
Department of Natural Resources Habitat &
Fishery Tables
http://www.uwsp.edu/cnr/gndwater/
http://dnr.wi.gov/org/water/dwg/Index.htm
http://infotrek.er.usgs.gov/wdnr_bio
(Need Assistance from DNR Fishery Biologist
with this site.)
A Slow the Flow Project A Report of the Hydrologic Condition of the Marengo River Watershed
Of The Lake Superior Basin Partner Team
January 2007 Stable Solutions LLC
with Community GIS, Inc. 51
Surface & Ground Water
Special Project Reports
US Geological Survey Ground-water Climate
Response Network
USGS reports are available at
http://infotrek.er.usgs.gov/pubs/.
http://groundwaterwatch.usgs.gov/StateMaps/
WI.html
(http://water.usgs.gov/GIS/huc.html)
Flow Models
USGS National Flood Frequency Program
Long-Term Hydrologic Impact Assessment
Model (L-THIA)
NRCS Technical Release 55 (TR-55)
http://water.usgs.gov/software/nff.html
http://www.ecn.purdue.edu/runoff/lthianew/
index.htm
http://pasture.ecn.purdue.edu/~sedspec/tr55/tr0.
htm
Table 3.2: Continued
22
A Slow the Flow Project A Report of the Hydrologic Condition of the Marengo River Watershed
Of The Lake Superior Basin Partner Team
January 2007 Stable Solutions LLC
with Community GIS, Inc. 52
Drainage Basin Characteristics
INFORMATION
WHO HAS THE INFORMATION
WHERE WE FOUND IT
Topography –
lay of the land
US Geological Survey Topographic Maps or
windshield survey
http://maps.dnr.state.wi.us/imf/dnrimf.jsp?
site=SurfaceWaterViewer
We used a consultant’s services
Elevation at
headwater and
mouth of
watershed
Wisconsin Department of Natural Resources
Surface Water Data Viewer (US Geological
Survey Topographic Maps)
http://maps.dnr.state.wi.us/imf/dnrimf.jsp?
site=SurfaceWaterViewer
We used a consultant’s services.
Soils
(Hydrologic Soil
Group)
USDA Natural Resources Conservation
Service Center or Web Soil Survey
http://websoilsurvey.nrcs.usda.gov/app/
Areas with Steep
eroding banks
USDA Natural Resources Conservation Service
Service Center or Web Soil Survey
http://websoilsurvey.nrcs.usda.gov/app/
Wetland Areas
Wisconsin Department of Natural Resources
Wetland Maps
http://www.dnr.state.wi.us/org/water/fhp/
wetlands/mapping.shtml (inland wetlands)
http://www.dnr.state.wi.us/org/land/er/
publications/cw/ (coastal wetlands)
Land Use
County Land Information Departments
http://www.bayfieldcounty.org/landrecords/
index.htm (Bayfield County)
Vegetative Cover
Wisconsin Department of Natural Resources
WISCLAND Cover and
Finlay’s Original Vegetation
http://maps.dnr.state.wi.us/imf/dnrimf.jsp?site=
SurfaceWaterViewer
Existing Land
Management
Practices
Divide watershed and have your workgroup
members drive, hunt, bike, fish, run, etc. their
way through a portion of the watershed and
identify on a map where problem areas may exist
and why
Field inventory or interpret from WISCLAND
Agriculture
USDA Agricultural Statistics
http://www.nass.usda.gov/wi/rlsetoc.htm
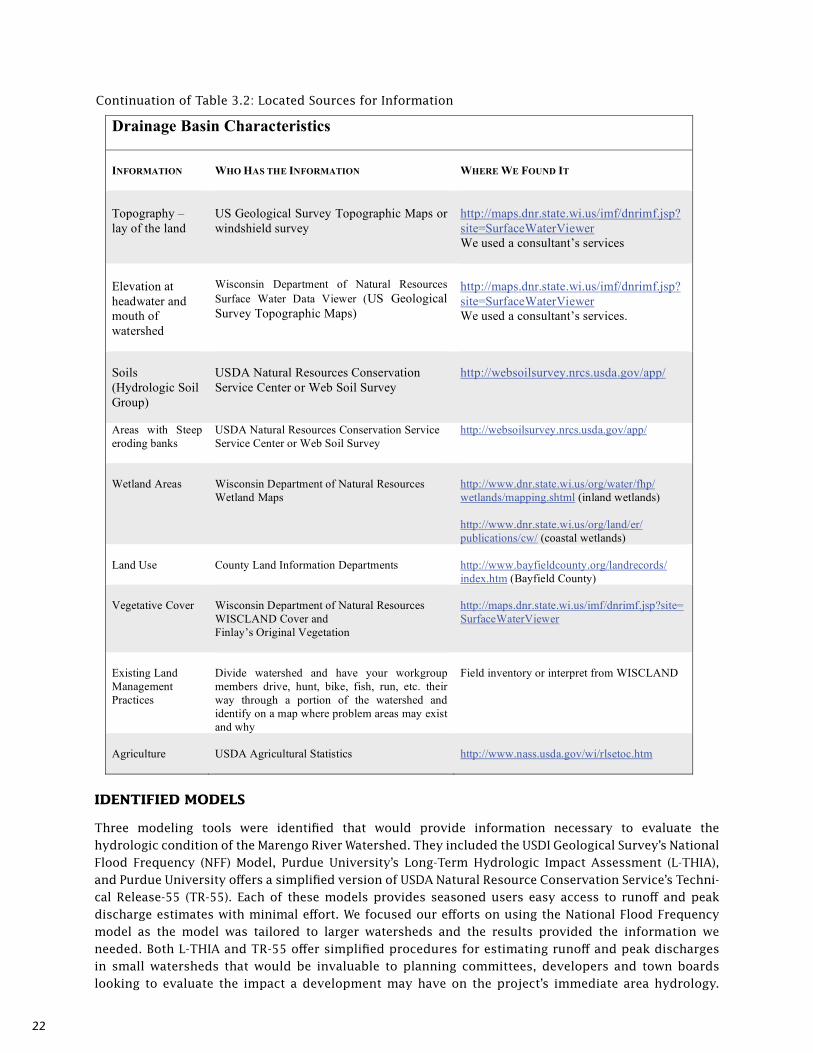
Continuation of Table 3.2: Located Sources for Information
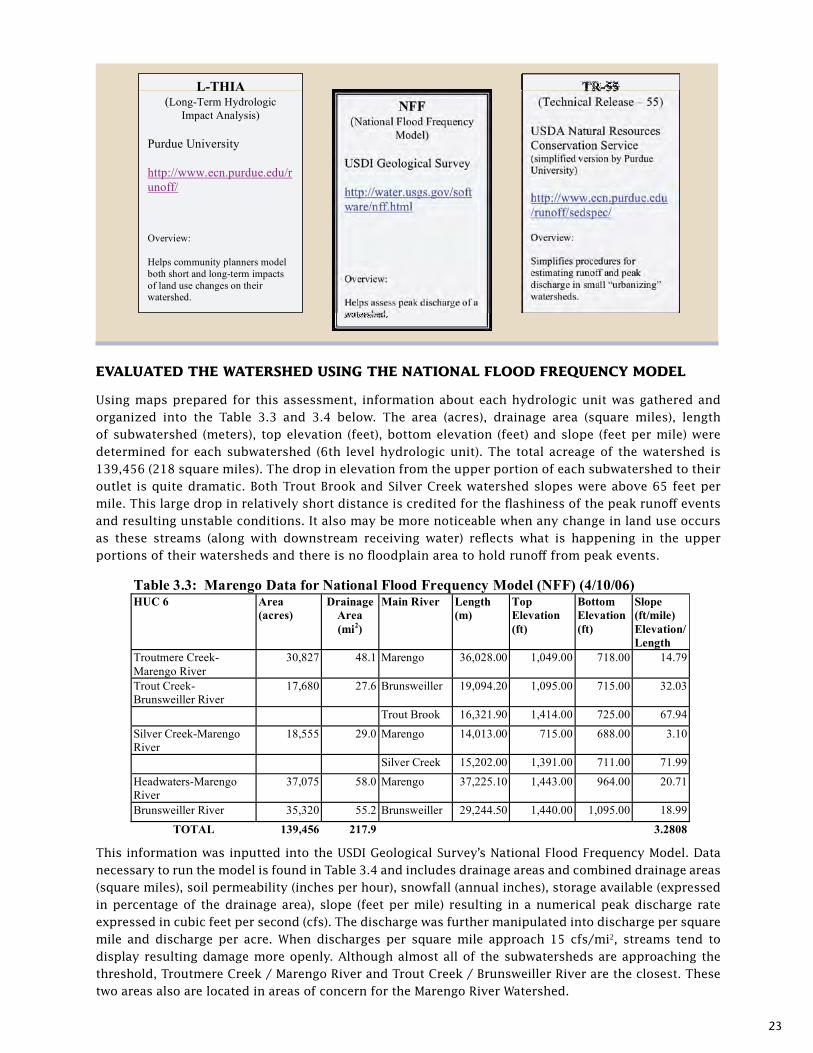
identiFied ModeLs
Three modeling tools were identified that would provide information necessary to evaluate the hydrologic condition of the Marengo River Watershed. They included the USDI Geological Survey’s National Flood Frequency (NFF) Model, Purdue University’s Long-Term Hydrologic Impact Assessment (L-THIA), and Purdue University offers a simplified version of USDA Natural Resource Conservation Service’s Techni-cal Release-55 (TR-55). Each of these models provides seasoned users easy access to runoff and peak discharge estimates with minimal effort. We focused our efforts on using the National Flood Frequency model as the model was tailored to larger watersheds and the results provided the information we needed. Both L-THIA and TR-55 offer simplified procedures for estimating runoff and peak discharges in small watersheds that would be invaluable to planning committees, developers and town boards looking to evaluate the impact a development may have on the project’s immediate area hydrology.
23
evaLUated the Watershed Using the nationaL FLood FreqUenCY ModeL
Using maps prepared for this assessment, information about each hydrologic unit was gathered and organized into the Table 3.3 and 3.4 below. The area (acres), drainage area (square miles), length of subwatershed (meters), top elevation (feet), bottom elevation (feet) and slope (feet per mile) were determined for each subwatershed (6th level hydrologic unit). The total acreage of the watershed is 139,456 (218 square miles). The drop in elevation from the upper portion of each subwatershed to their outlet is quite dramatic. Both Trout Brook and Silver Creek watershed slopes were above 65 feet per mile. This large drop in relatively short distance is credited for the flashiness of the peak runoff events and resulting unstable conditions. It also may be more noticeable when any change in land use occurs as these streams (along with downstream receiving water) reflects what is happening in the upper portions of their watersheds and there is no floodplain area to hold runoff from peak events.
A Slow the Flow Project A Report of the Hydrologic Condition of the Marengo River Watershed
Of The Lake Superior Basin Partner Team
January 2007 Stable Solutions LLC
with Community GIS, Inc. 12
NFF
(National Flood Frequency
Model)
USDI Geological Survey
http://water.usgs.gov/soft
ware/nff.html
Overview:
Helps assess peak discharge of a
watershed.
TR-55
(Technical Release – 55)
USDA Natural Resources
Conservation Service (simplified version by Purdue
University)
http://www.ecn.purdue.edu
/runoff/sedspec/
Overview:
Simplifies procedures for
estimating runoff and peak
discharge in small “urbanizing”
watersheds.
Identified Models
Three modeling tools were identified that would provide information necessary to evaluate the hydrologic
condition of the Marengo River Watershed. They included the USDI Geological Survey’s National Flood
Frequency (NFF) Model, Purdue University’s Long-Term Hydrologic Impact Assessment (L-THIA), and
Purdue University offers a simplified version of USDA Natural Resource Conservation Service’s
Technical Release-55 (TR-55). Each of these models provides seasoned users easy access to runoff and
peak discharge estimates with minimal effort. We focused our efforts on using the National Flood
Frequency model as the model was tailored to larger watersheds and the results provided the information
we needed. Both L-THIA and TR-55 offer simplified procedures for estimating runoff and peak
discharges in small watersheds that would be invaluable to planning committees, developers and town
boards looking to evaluate the impact a development may have on the project’s immediate area
hydrology.
L-THIA
(Long-Term Hydrologic
Impact Analysis)
Purdue University
http://www.ecn.purdue.edu/r
unoff/
Overview:
Helps community planners model
both short and long-term impacts
of land use changes on their watershed.
A Slow the Flow Project A Report of the Hydrologic Condition of the Marengo River Watershed
Of The Lake Superior Basin Partner Team
January 2007 Stable Solutions LLC
with Community GIS, Inc. 13
Evaluated the Watershed Using the National Flood Frequency Model Using maps prepared for this assessment, information about each hydrologic unit was gathered and
organized into the Table 3.3 and 3.4 below. The area (acres), drainage area (square miles), length of
subwatershed (meters), top elevation (feet), bottom elevation (feet) and slope (feet per mile) were
determined for each subwatershed (6th
level hydrologic unit). The total acreage of the watershed is
139,456 (218 square miles). The drop in elevation from the upper portion of each subwatershed to their
outlet is quite dramatic. Both Trout Brook and Silver Creek watershed slopes were above 65 feet per
mile. This large drop in relatively short distance is credited for the flashiness of the peak runoff events
and resulting unstable conditions. It also may be more noticeable when any change in land use occurs as
these streams (along with downstream receiving water) reflects what is happening in the upper portions of
their watersheds as there is no floodplain area to hold runoff from peak events.
Table 3.3: Marengo Data for National Flood Frequency Model (NFF) (4/10/06) HUC 6 Area
(acres)
Drainage
Area
(mi2)
Main River Length
(m)
Top
Elevation
(ft)
Bottom
Elevation
(ft)
Slope
(ft/mile)
Elevation/
Length
Troutmere Creek-
Marengo River
30,827 48.1 Marengo 36,028.00 1,049.00 718.00 14.79
Trout Creek-
Brunsweiller River
17,680 27.6 Brunsweiller 19,094.20 1,095.00 715.00 32.03
Trout Brook 16,321.90 1,414.00 725.00 67.94
Silver Creek-Marengo
River
18,555 29.0 Marengo 14,013.00 715.00 688.00 3.10
Silver Creek 15,202.00 1,391.00 711.00 71.99
Headwaters-Marengo
River
37,075 58.0 Marengo 37,225.10 1,443.00 964.00 20.71
Brunsweiller River 35,320 55.2 Brunsweiller 29,244.50 1,440.00 1,095.00 18.99
TOTAL 139,456 217.9 3.2808
This information was inputted into the USDI Geological Survey’s National Flood Frequency
Model. Data necessary to run the model is found in Table 3.4 and includes drainage areas and
combined drainage areas (square miles), soil permeability (inches per hour), snowfall (annual
inches), storage available (expressed in percentage of the drainage area), slope (feet per mile)
resulting in a numerical peak discharge rate expressed in cubic feet per second (cfs). The
discharge was further manipulated into discharge per square mile and discharge per acre. When
discharges per square mile approach 15 cfs/mi2, streams tend to display resulting damage more
openly. Although almost all of the subwatersheds are approaching the threshold, Troutmere
Creek / Marengo River and Trout Creek / Brunsweiller River are the closest. These two areas
also are located in areas of concern for the Marengo River Watershed.
Table 3.4: Peak Discharge Calculation (NFF) Following Technical Work Group Meeting (4/11/06)
Work by Dale Higgins / Sandy Schultz with the Technical Work Group
HUC 6 (Unit by Name) Combined DA
(square miles)
HUCs
Included
Soil Permeability
(in per hr)
Annual
Snowfall (in)
Storage
(% of
watershed)
Slope
(ft/mile)
Peak
Discharge
(CFS)
Discharge per
square mile
Discharge
per acre
Troutmere Creek - Marengo
River (mid)
106 Headwaters -
Marengo
River
.02 96 10 17 1500 14 cfs/mi2 0.022 cfs/ac
Trout Creek - Brunsweiller River (mouth)
83 Brunsweiller River (HW)
.02 96 19 25 1050 13 cfs/mi2 0.020 cfs/ac
Silver Creek - Marengo River (mouth)
218 All .02 96 13 15 2510 11 cfs/mi2 0.018 cfs/ac
Headwaters - Marengo River 58 n/a .15 96 18 21 726 12 cfs/mi2 0.020 cfs/ac
Brunsweiller River (headwater) 55 n/a .15 96 30 19 583 11 cfs/mi2 0.017 cfs/ac
This information was inputted into the USDI Geological Survey’s National Flood Frequency Model. Data necessary to run the model is found in Table 3.4 and includes drainage areas and combined drainage areas (square miles), soil permeability (inches per hour), snowfall (annual inches), storage available (expressed in percentage of the drainage area), slope (feet per mile) resulting in a numerical peak discharge rate expressed in cubic feet per second (cfs). The discharge was further manipulated into discharge per square mile and discharge per acre. When discharges per square mile approach 15 cfs/mi2, streams tend to display resulting damage more openly. Although almost all of the subwatersheds are approaching the threshold, Troutmere Creek / Marengo River and Trout Creek / Brunsweiller River are the closest. These two areas also are located in areas of concern for the Marengo River Watershed.
24
A Slow the Flow Project A Report of the Hydrologic Condition of the Marengo River Watershed
Of The Lake Superior Basin Partner Team
January 2007 Stable Solutions LLC
with Community GIS, Inc. 14
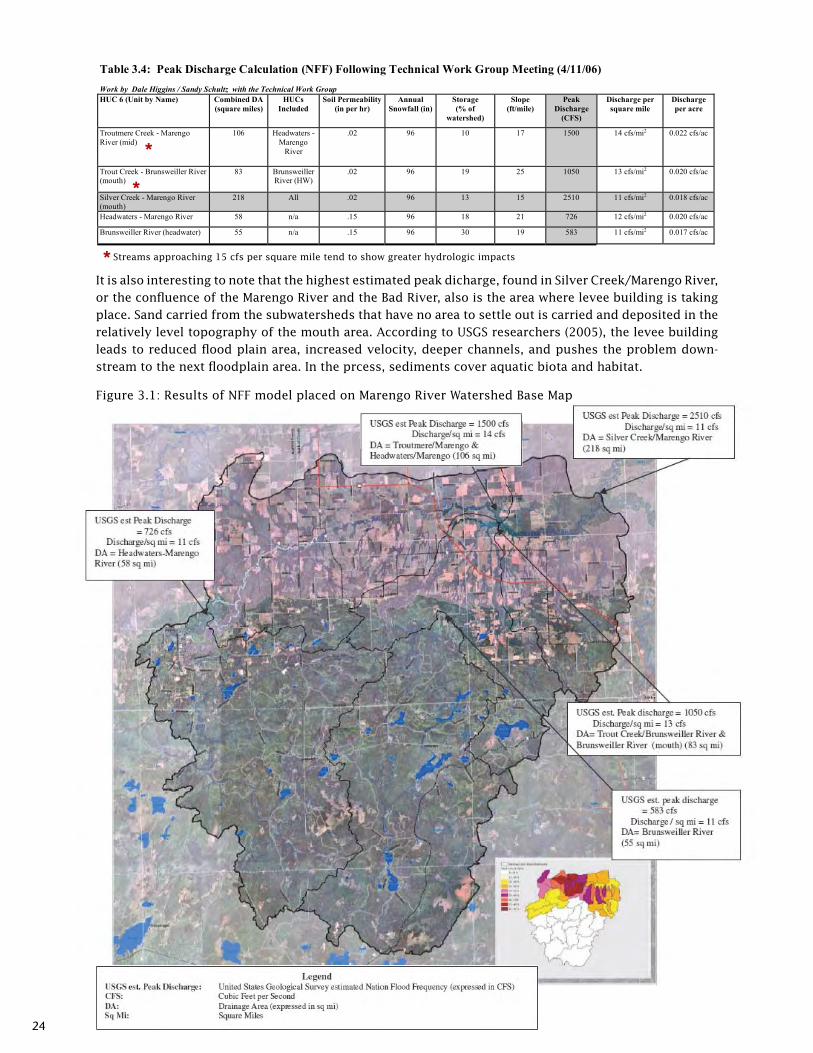
It is also interesting to note that the highest estimated peak discharge, found in Silver Creek/Marengo
River, or the confluence of the Marengo River and the Bad River, also is the area where levee building is
taking place. Sand carried from the subwatersheds that have no area to settle out is carried and deposited
in the relatively level topography of the mouth area. According to USGS researchers (2005), the levee
building leads to reduced flood plain area, increased velocity, deeper channels, and pushes the problem
downstream to the next floodplain area. In the process, sediments cover aquatic biota and habitat.
Figure 3.1: Results of NFF model placed on Marengo River Watershed Base Map
A Slow the Flow Project A Report of the Hydrologic Condition of the Marengo River Watershed
Of The Lake Superior Basin Partner Team
January 2007 Stable Solutions LLC
with Community GIS, Inc. 14
It is also interesting to note that the highest estimated peak discharge, found in Silver Creek/Marengo
River, or the confluence of the Marengo River and the Bad River, also is the area where levee building is
taking place. Sand carried from the subwatersheds that have no area to settle out is carried and deposited
in the relatively level topography of the mouth area. According to USGS researchers (2005), the levee
building leads to reduced flood plain area, increased velocity, deeper channels, and pushes the problem
downstream to the next floodplain area. In the process, sediments cover aquatic biota and habitat.
Figure 3.1: Results of NFF model placed on Marengo River Watershed Base Map
A Slow the Flow Project A Report of the Hydrologic Condition of the Marengo River Watershed
Of The Lake Superior Basin Partner Team
January 2007 Stable Solutions LLC
with Community GIS, Inc. 13
Evaluated the Watershed Using the National Flood Frequency Model Using maps prepared for this assessment, information about each hydrologic unit was gathered and
organized into the Table 3.3 and 3.4 below. The area (acres), drainage area (square miles), length of
subwatershed (meters), top elevation (feet), bottom elevation (feet) and slope (feet per mile) were
determined for each subwatershed (6th
level hydrologic unit). The total acreage of the watershed is
139,456 (218 square miles). The drop in elevation from the upper portion of each subwatershed to their
outlet is quite dramatic. Both Trout Brook and Silver Creek watershed slopes were above 65 feet per
mile. This large drop in relatively short distance is credited for the flashiness of the peak runoff events
and resulting unstable conditions. It also may be more noticeable when any change in land use occurs as
these streams (along with downstream receiving water) reflects what is happening in the upper portions of
their watersheds as there is no floodplain area to hold runoff from peak events.
Table 3.3: Marengo Data for National Flood Frequency Model (NFF) (4/10/06) HUC 6 Area
(acres)
Drainage
Area
(mi2)
Main River Length
(m)
Top
Elevation
(ft)
Bottom
Elevation
(ft)
Slope
(ft/mile)
Elevation/
Length
Troutmere Creek-
Marengo River
30,827 48.1 Marengo 36,028.00 1,049.00 718.00 14.79
Trout Creek-
Brunsweiller River
17,680 27.6 Brunsweiller 19,094.20 1,095.00 715.00 32.03
Trout Brook 16,321.90 1,414.00 725.00 67.94
Silver Creek-Marengo
River
18,555 29.0 Marengo 14,013.00 715.00 688.00 3.10
Silver Creek 15,202.00 1,391.00 711.00 71.99
Headwaters-Marengo
River
37,075 58.0 Marengo 37,225.10 1,443.00 964.00 20.71
Brunsweiller River 35,320 55.2 Brunsweiller 29,244.50 1,440.00 1,095.00 18.99
TOTAL 139,456 217.9 3.2808
This information was inputted into the USDI Geological Survey’s National Flood Frequency
Model. Data necessary to run the model is found in Table 3.4 and includes drainage areas and
combined drainage areas (square miles), soil permeability (inches per hour), snowfall (annual
inches), storage available (expressed in percentage of the drainage area), slope (feet per mile)
resulting in a numerical peak discharge rate expressed in cubic feet per second (cfs). The
discharge was further manipulated into discharge per square mile and discharge per acre. When
discharges per square mile approach 15 cfs/mi2, streams tend to display resulting damage more
openly. Although almost all of the subwatersheds are approaching the threshold, Troutmere
Creek / Marengo River and Trout Creek / Brunsweiller River are the closest. These two areas
also are located in areas of concern for the Marengo River Watershed.
Table 3.4: Peak Discharge Calculation (NFF) Following Technical Work Group Meeting (4/11/06)
Work by Dale Higgins / Sandy Schultz with the Technical Work Group
HUC 6 (Unit by Name) Combined DA
(square miles)
HUCs
Included
Soil Permeability
(in per hr)
Annual
Snowfall (in)
Storage
(% of
watershed)
Slope
(ft/mile)
Peak
Discharge
(CFS)
Discharge per
square mile
Discharge
per acre
Troutmere Creek - Marengo
River (mid)
106 Headwaters -
Marengo
River
.02 96 10 17 1500 14 cfs/mi2 0.022 cfs/ac
Trout Creek - Brunsweiller River (mouth)
83 Brunsweiller River (HW)
.02 96 19 25 1050 13 cfs/mi2 0.020 cfs/ac
Silver Creek - Marengo River (mouth)
218 All .02 96 13 15 2510 11 cfs/mi2 0.018 cfs/ac
Headwaters - Marengo River 58 n/a .15 96 18 21 726 12 cfs/mi2 0.020 cfs/ac
Brunsweiller River (headwater) 55 n/a .15 96 30 19 583 11 cfs/mi2 0.017 cfs/ac
It is also interesting to note that the highest estimated peak dicharge, found in Silver Creek/Marengo River, or the confluence of the Marengo River and the Bad River, also is the area where levee building is taking place. Sand carried from the subwatersheds that have no area to settle out is carried and deposited in the relatively level topography of the mouth area. According to USGS researchers (2005), the levee building leads to reduced flood plain area, increased velocity, deeper channels, and pushes the problem down-stream to the next floodplain area. In the prcess, sediments cover aquatic biota and habitat.
Figure 3.1: Results of NFF model placed on Marengo River Watershed Base Map
A Slow the Flow Project A Report of the Hydrologic Condition of the Marengo River Watershed
Of The Lake Superior Basin Partner Team
January 2007 Stable Solutions LLC
with Community GIS, Inc. 14
It is also interesting to note that the highest estimated peak discharge, found in Silver Creek/Marengo
River, or the confluence of the Marengo River and the Bad River, also is the area where levee building is
taking place. Sand carried from the subwatersheds that have no area to settle out is carried and deposited
in the relatively level topography of the mouth area. According to USGS researchers (2005), the levee
building leads to reduced flood plain area, increased velocity, deeper channels, and pushes the problem
downstream to the next floodplain area. In the process, sediments cover aquatic biota and habitat.
Figure 3.1: Results of NFF model placed on Marengo River Watershed Base Map
*Streams approaching 15 cfs per square mile tend to show greater hydrologic impacts
*
*
25
ASSeSSInG THe HYdROLOGIC COndITIOn OF THe
MARenGO RIVeR WATeRSHed
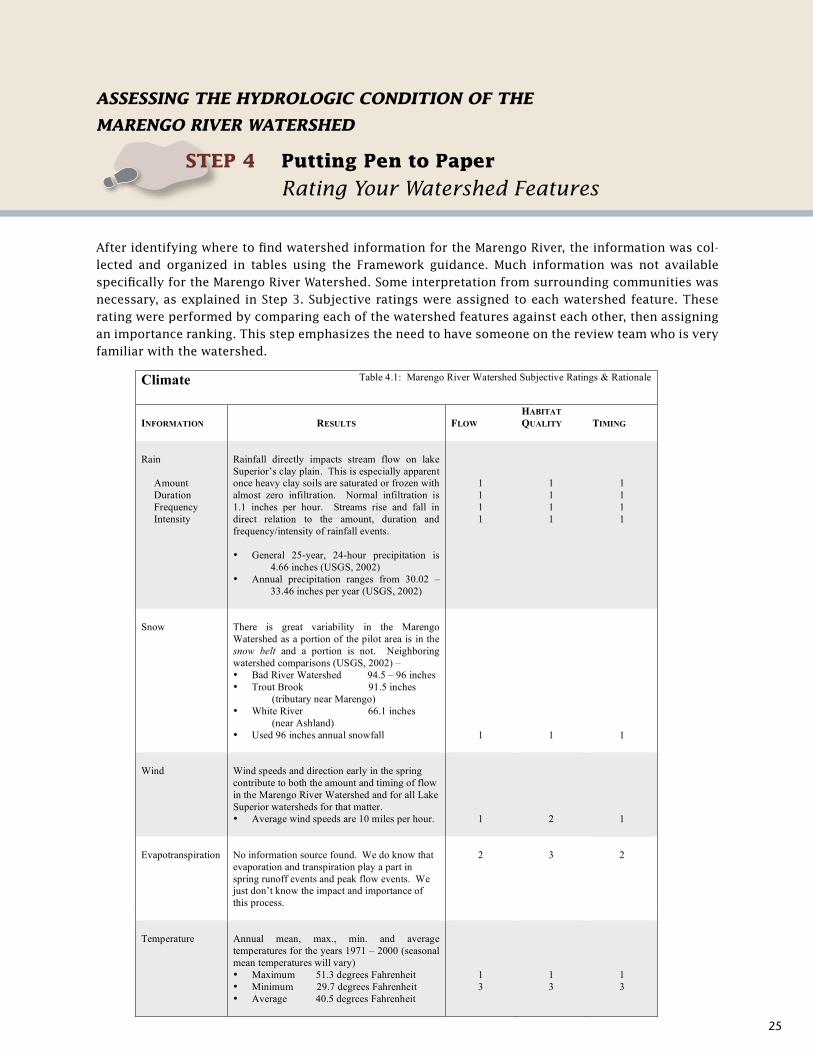
After identifying where to find watershed information for the Marengo River, the information was col-lected and organized in tables using the Framework guidance. Much information was not available specifically for the Marengo River Watershed. Some interpretation from surrounding communities was necessary, as explained in Step 3. Subjective ratings were assigned to each watershed feature. These rating were performed by comparing each of the watershed features against each other, then assigning an importance ranking. This step emphasizes the need to have someone on the review team who is very familiar with the watershed.
steP 4 Putting Pen to Paper
Rating Your Watershed Features
A Slow the Flow Project A Report of the Hydrologic Condition of the Marengo River Watershed
Of The Lake Superior Basin Partner Team
January 2007 Stable Solutions LLC
with Community GIS, Inc.
53
Climate
Table 4.1: Marengo River Watershed Subjective Ratings & Rationale
INFORMATION
RESULTS
FLOW
HABITAT
QUALITY
TIMING
Rain
Amount
Duration
Frequency
Intensity
Rainfall directly impacts stream flow on lake
Superior’s clay plain. This is especially apparent
once heavy clay soils are saturated or frozen with
almost zero infiltration. Normal infiltration is
1.1 inches per hour. Streams rise and fall in
direct relation to the amount, duration and
frequency/intensity of rainfall events.
• General 25-year, 24-hour precipitation is
4.66 inches (USGS, 2002)
• Annual precipitation ranges from 30.02 –
33.46 inches per year (USGS, 2002)
1
1
1
1
1
1
1
1
1
1
1
1
Snow
There is great variability in the Marengo
Watershed as a portion of the pilot area is in the
snow belt and a portion is not. Neighboring
watershed comparisons (USGS, 2002) –
• Bad River Watershed 94.5 – 96 inches
• Trout Brook 91.5 inches
(tributary near Marengo)
• White River 66.1 inches
(near Ashland)
• Used 96 inches annual snowfall
1
1
1
Wind
Wind speeds and direction early in the spring
contribute to both the amount and timing of flow
in the Marengo River Watershed and for all Lake
Superior watersheds for that matter.
• Average wind speeds are 10 miles per hour.
1
2
1
Evapotranspiration
No information source found. We do know that
evaporation and transpiration play a part in
spring runoff events and peak flow events. We
just don’t know the impact and importance of
this process.
2
3
2
Temperature
Annual mean, max., min. and average
temperatures for the years 1971 – 2000 (seasonal
mean temperatures will vary)
• Maximum 51.3 degrees Fahrenheit
• Minimum 29.7 degrees Fahrenheit
• Average 40.5 degrees Fahrenheit
1
3
1
3
1
3
26
A Slow the Flow Project A Report of the Hydrologic Condition of the Marengo River Watershed
Of The Lake Superior Basin Partner Team
January 2007 Stable Solutions LLC
with Community GIS, Inc.
54
Surface & Ground Water Table 4.1: Marengo River Watershed Subjective Ratings & Rationale
INFORMATION
RESULTS
FLOW
HABITAT
QUALITY
TIMING
Watershed
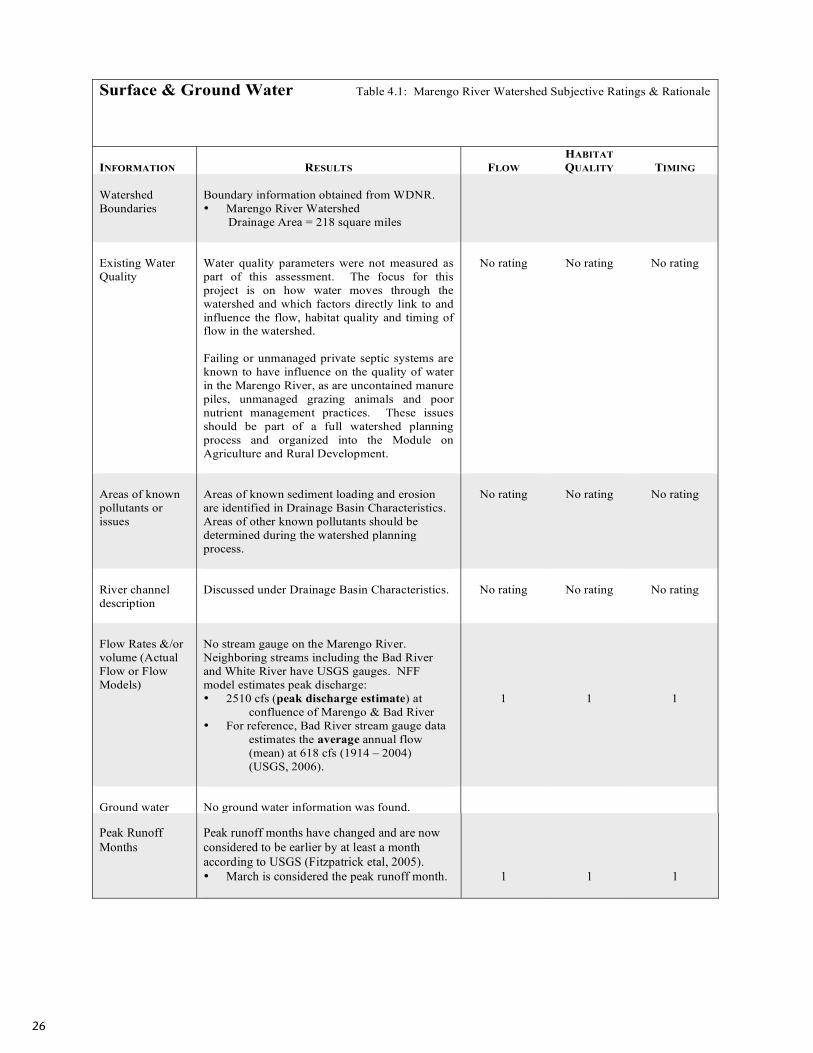
Boundaries
Boundary information obtained from WDNR.
• Marengo River Watershed
Drainage Area = 218 square miles
Existing Water
Quality
Water quality parameters were not measured as
part of this assessment. The focus for this
project is on how water moves through the
watershed and which factors directly link to and
influence the flow, habitat quality and timing of
flow in the watershed.
Failing or unmanaged private septic systems are
known to have influence on the quality of water
in the Marengo River, as are uncontained manure
piles, unmanaged grazing animals and poor
nutrient management practices. These issues
should be part of a full watershed planning
process and organized into the Module on
Agriculture and Rural Development.
No rating
No rating
No rating
Areas of known
pollutants or
issues
Areas of known sediment loading and erosion
are identified in Drainage Basin Characteristics.
Areas of other known pollutants should be
determined during the watershed planning
process.
No rating
No rating
No rating
River channel
description
Discussed under Drainage Basin Characteristics. No rating No rating No rating
Flow Rates &/or
volume (Actual
Flow or Flow
Models)
No stream gauge on the Marengo River.
Neighboring streams including the Bad River
and White River have USGS gauges. NFF
model estimates peak discharge:
• 2510 cfs (peak discharge estimate) at
confluence of Marengo & Bad River
• For reference, Bad River stream gauge data
estimates the average annual flow
(mean) at 618 cfs (1914 – 2004)
(USGS, 2006).
1
1
1
Ground water
No ground water information was found.
A Slow the Flow Project A Report of the Hydrologic Condition of the Marengo River Watershed
Of The Lake Superior Basin Partner Team
January 2007 Stable Solutions LLC
with Community GIS, Inc.
55
Surface & Ground Water Table 4.1: Marengo River Watershed Subjective Ratings & Rationale
INFORMATION
RESULTS
FLOW
HABITAT
QUALITY
TIMING
movement
Peak Runoff
Months
Peak runoff months have changed and are now
considered to be earlier by at least a month
according to USGS (Fitzpatrick etal, 2005).
• March is considered the peak runoff month.
1
1
1
27
A Slow the Flow Project A Report of the Hydrologic Condition of the Marengo River Watershed
Of The Lake Superior Basin Partner Team
January 2007 Stable Solutions LLC
with Community GIS, Inc.
56
Drainage Basin Characteristics Table 4.1: Marengo River Watershed Subjective Ratings & Rationale
INFORMATION
RESULTS
FLOW
HABITAT
QUALITY
TIMING
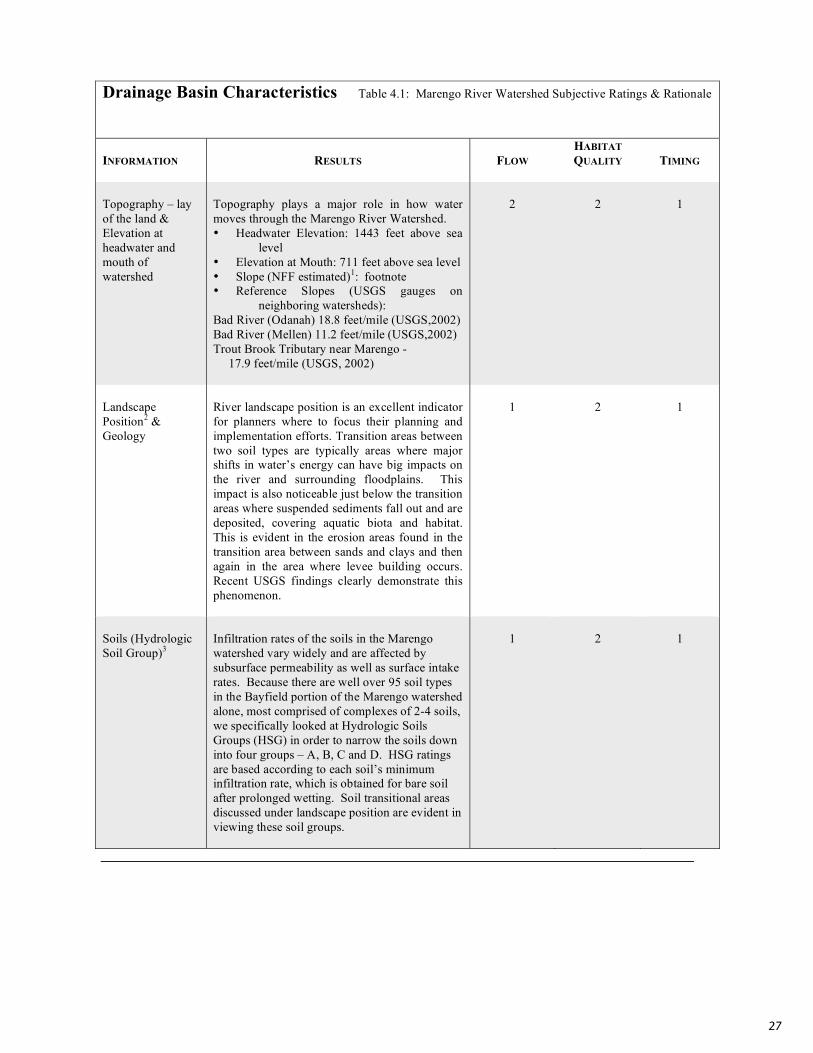
Topography – lay
of the land &
Elevation at
headwater and
mouth of
watershed
Topography plays a major role in how water
moves through the Marengo River Watershed.
• Headwater Elevation: 1443 feet above sea
level
• Elevation at Mouth: 711 feet above sea level
• Slope (NFF estimated)1: footnote
• Reference Slopes (USGS gauges on
neighboring watersheds):
Bad River (Odanah) 18.8 feet/mile (USGS,2002)
Bad River (Mellen) 11.2 feet/mile (USGS,2002)
Trout Brook Tributary near Marengo -
17.9 feet/mile (USGS, 2002)
2
2
1
Landscape
Position2 &
Geology
River landscape position is an excellent indicator
for planners where to focus their planning and
implementation efforts. Transition areas between
two soil types are typically areas where major
shifts in water’s energy can have big impacts on
the river and surrounding floodplains. This
impact is also noticeable just below the transition
areas where suspended sediments fall out and are
deposited, covering aquatic biota and habitat.
This is evident in the erosion areas found in the
transition area between sands and clays and then
again in the area where levee building occurs.
Recent USGS findings clearly demonstrate this
phenomenon.
1
2
1
Soils (Hydrologic
Soil Group)3
Infiltration rates of the soils in the Marengo
watershed vary widely and are affected by
subsurface permeability as well as surface intake
rates. Because there are well over 95 soil types
in the Bayfield portion of the Marengo watershed
alone, most comprised of complexes of 2-4 soils,
we specifically looked at Hydrologic Soils
Groups (HSG) in order to narrow the soils down
into four groups – A, B, C and D. HSG ratings
are based according to each soil’s minimum
infiltration rate, which is obtained for bare soil
after prolonged wetting. Soil transitional areas
discussed under landscape position are evident in
viewing these soil groups.
1
2
1
28
A Slow the Flow Project A Report of the Hydrologic Condition of the Marengo River Watershed
Of The Lake Superior Basin Partner Team
January 2007 Stable Solutions LLC
with Community GIS, Inc.
57
Drainage Basin Characteristics Table 4.1: Marengo River Watershed Subjective Ratings & Rationale
INFORMATION
RESULTS
FLOW
HABITAT
QUALITY
TIMING
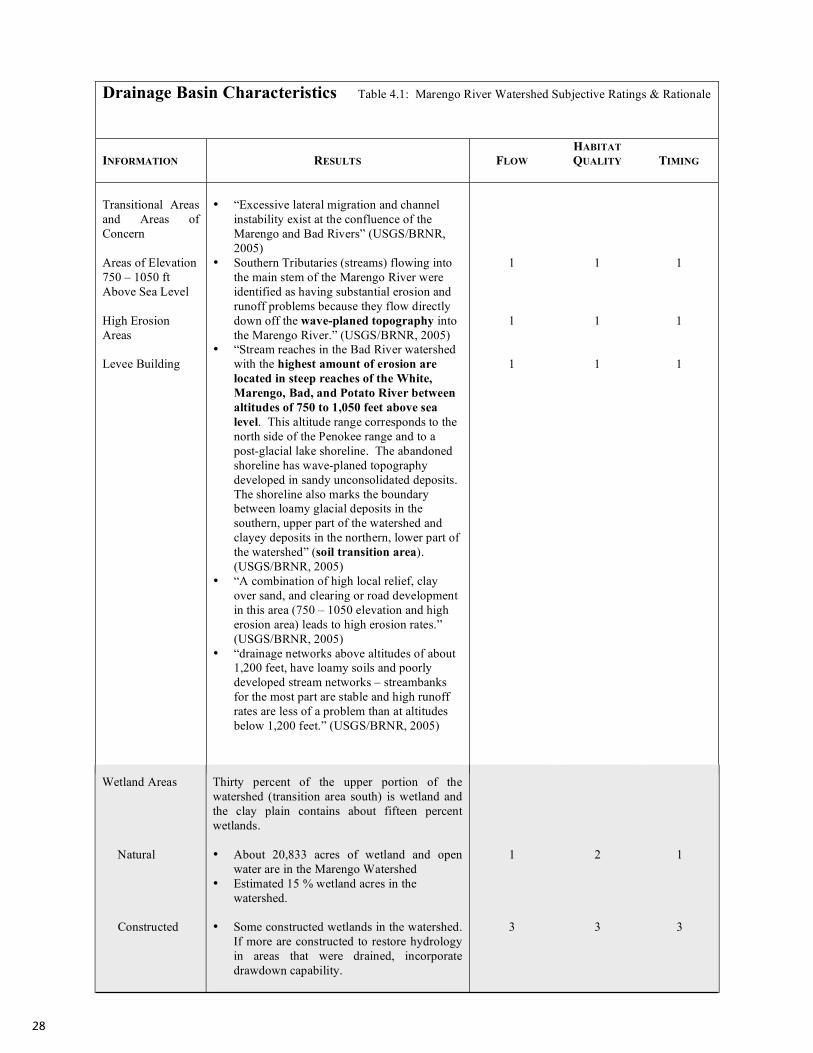
Transitional Areas
and Areas of
Concern
Areas of Elevation
750 – 1050 ft
Above Sea Level
High Erosion
Areas
Levee Building
• “Excessive lateral migration and channel
instability exist at the confluence of the
Marengo and Bad Rivers” (USGS/BRNR,
2005)
• Southern Tributaries (streams) flowing into
the main stem of the Marengo River were
identified as having substantial erosion and
runoff problems because they flow directly
down off the wave-planed topography into
the Marengo River.” (USGS/BRNR, 2005)
• “Stream reaches in the Bad River watershed
with the highest amount of erosion are
located in steep reaches of the White,
Marengo, Bad, and Potato River between
altitudes of 750 to 1,050 feet above sea
level. This altitude range corresponds to the
north side of the Penokee range and to a
post-glacial lake shoreline. The abandoned
shoreline has wave-planed topography
developed in sandy unconsolidated deposits.
The shoreline also marks the boundary
between loamy glacial deposits in the
southern, upper part of the watershed and
clayey deposits in the northern, lower part of
the watershed” (soil transition area).
(USGS/BRNR, 2005)
• “A combination of high local relief, clay
over sand, and clearing or road development
in this area (750 – 1050 elevation and high
erosion area) leads to high erosion rates.”
(USGS/BRNR, 2005)
• “drainage networks above altitudes of about
1,200 feet, have loamy soils and poorly
developed stream networks – streambanks
for the most part are stable and high runoff
rates are less of a problem than at altitudes
below 1,200 feet.” (USGS/BRNR, 2005)
1
1
1
1
1
1
1
1
1
A Slow the Flow Project A Report of the Hydrologic Condition of the Marengo River Watershed
Of The Lake Superior Basin Partner Team
January 2007 Stable Solutions LLC
with Community GIS, Inc.
58
Drainage Basin Characteristics Table 4.1: Marengo River Watershed Subjective Ratings & Rationale
INFORMATION
RESULTS
FLOW
HABITAT
QUALITY
TIMING
Wetland Areas
Natural
Constructed
Thirty percent of the upper portion of the
watershed (transition area south) is wetland and
the clay plain contains about fifteen percent
wetlands.
• About 20,833 acres of wetland and open
water are in the Marengo Watershed
• Estimated 15 % wetland acres in the
watershed.
• Some constructed wetlands in the watershed.
If more are constructed to restore hydrology
in areas that were drained, incorporate
drawdown capability.
1
3
2
3
1
3
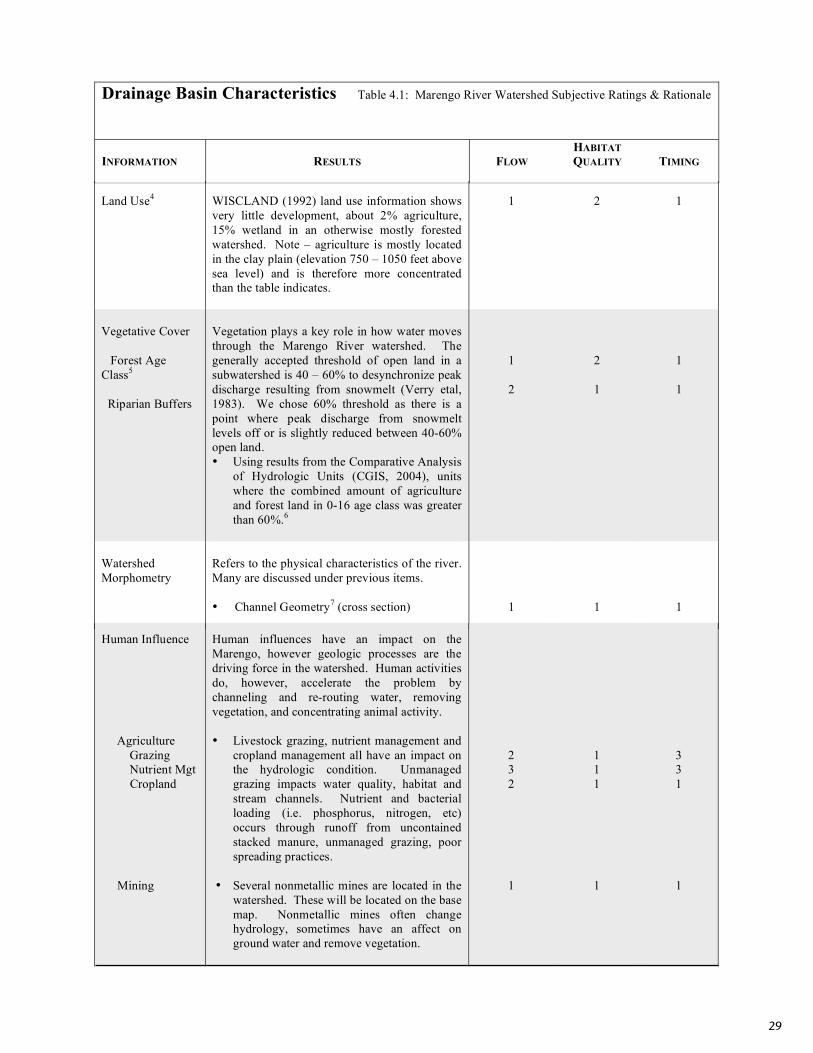
Land Use4
WISCLAND (1992) land use information shows
very little development, about 2% agriculture,
15% wetland in an otherwise mostly forested
watershed. Note – agriculture is mostly located
in the clay plain (elevation 750 – 1050 feet above
sea level) and is therefore more concentrated
than the table indicates.
1
2
1
Vegetative Cover
Forest Age
Class5
Riparian Buffers
Vegetation plays a key role in how water moves
through the Marengo River watershed. The
generally accepted threshold of open land in a
subwatershed is 40 – 60% to desynchronize peak
discharge resulting from snowmelt (Verry etal,
1983). We chose 60% threshold as there is a
point where peak discharge from snowmelt
levels off or is slightly reduced between 40-60%
open land.
• Using results from the Comparative Analysis
of Hydrologic Units (CGIS, 2004), units
where the combined amount of agriculture
and forest land in 0-16 age class was greater
than 60%.6
1
2
2
1
1
1
Watershed
Morphometry
Refers to the physical characteristics of the river.
Many are discussed under previous items.
• Channel Geometry7 (cross section)
1
1
1
29
A Slow the Flow Project A Report of the Hydrologic Condition of the Marengo River Watershed
Of The Lake Superior Basin Partner Team
January 2007 Stable Solutions LLC
with Community GIS, Inc.
58
Drainage Basin Characteristics Table 4.1: Marengo River Watershed Subjective Ratings & Rationale
INFORMATION
RESULTS
FLOW
HABITAT
QUALITY
TIMING
Wetland Areas
Natural
Constructed
Thirty percent of the upper portion of the
watershed (transition area south) is wetland and
the clay plain contains about fifteen percent
wetlands.
• About 20,833 acres of wetland and open
water are in the Marengo Watershed
• Estimated 15 % wetland acres in the
watershed.
• Some constructed wetlands in the watershed.
If more are constructed to restore hydrology
in areas that were drained, incorporate
drawdown capability.
1
3
2
3
1
3
Land Use4
WISCLAND (1992) land use information shows
very little development, about 2% agriculture,
15% wetland in an otherwise mostly forested
watershed. Note – agriculture is mostly located
in the clay plain (elevation 750 – 1050 feet above
sea level) and is therefore more concentrated
than the table indicates.
1
2
1
Vegetative Cover
Forest Age
Class5
Riparian Buffers
Vegetation plays a key role in how water moves
through the Marengo River watershed. The
generally accepted threshold of open land in a
subwatershed is 40 – 60% to desynchronize peak
discharge resulting from snowmelt (Verry etal,
1983). We chose 60% threshold as there is a
point where peak discharge from snowmelt
levels off or is slightly reduced between 40-60%
open land.
• Using results from the Comparative Analysis
of Hydrologic Units (CGIS, 2004), units
where the combined amount of agriculture
and forest land in 0-16 age class was greater
than 60%.6
1
2
2
1
1
1
Watershed
Morphometry
Refers to the physical characteristics of the river.
Many are discussed under previous items.
• Channel Geometry7 (cross section)
1
1
1
A Slow the Flow Project A Report of the Hydrologic Condition of the Marengo River Watershed
Of The Lake Superior Basin Partner Team
January 2007 Stable Solutions LLC
with Community GIS, Inc.
59
Drainage Basin Characteristics Table 4.1: Marengo River Watershed Subjective Ratings & Rationale
INFORMATION
RESULTS
FLOW
HABITAT
QUALITY
TIMING
Human Influence
Agriculture
Grazing
Nutrient Mgt
Cropland
Mining
Transportation
Rural-
Residential
Human influences have an impact on the
Marengo, however geologic processes are the
driving force in the watershed. Human activities
do, however, accelerate the problem by
channeling and re-routing water, removing
vegetation, and concentrating animal activity.
• Livestock grazing, nutrient management and
cropland management all have an impact on
the hydrologic condition. Unmanaged
grazing impacts water quality, habitat and
stream channels. Nutrient and bacterial
loading (i.e. phosphorus, nitrogen, etc)
occurs through runoff from uncontained
stacked manure, unmanaged grazing, poor
spreading practices.
• Several nonmetallic mines are located in the
watershed. These will be located on the base
map. Nonmetallic mines often change
hydrology, sometimes have an affect on
ground water and remove vegetation.
• (Harr etal, 1975) showed that road ditches
duplicate a stream system and road systems
whose total right-of-way area makes up 15%
of the basin will increase peak flow. “Road
crossings on the southern tributaries to the
Marengo River from County Line Road to
the confluence with the Bad River now
function as grade control structures
(USGS/BRNR, 2005). Road ditch systems
create hydrologic connectivity between
uplands and river systems (Technical Work
Group 2006).
Impacts from rural residential development,
more specifically, septic systems are an issue
that should be dealt with in an implementation
phase for the Marengo River Watershed.
2
3
2
1
1
3
1
1
1
1
1
1
3
3
1
1
1
3
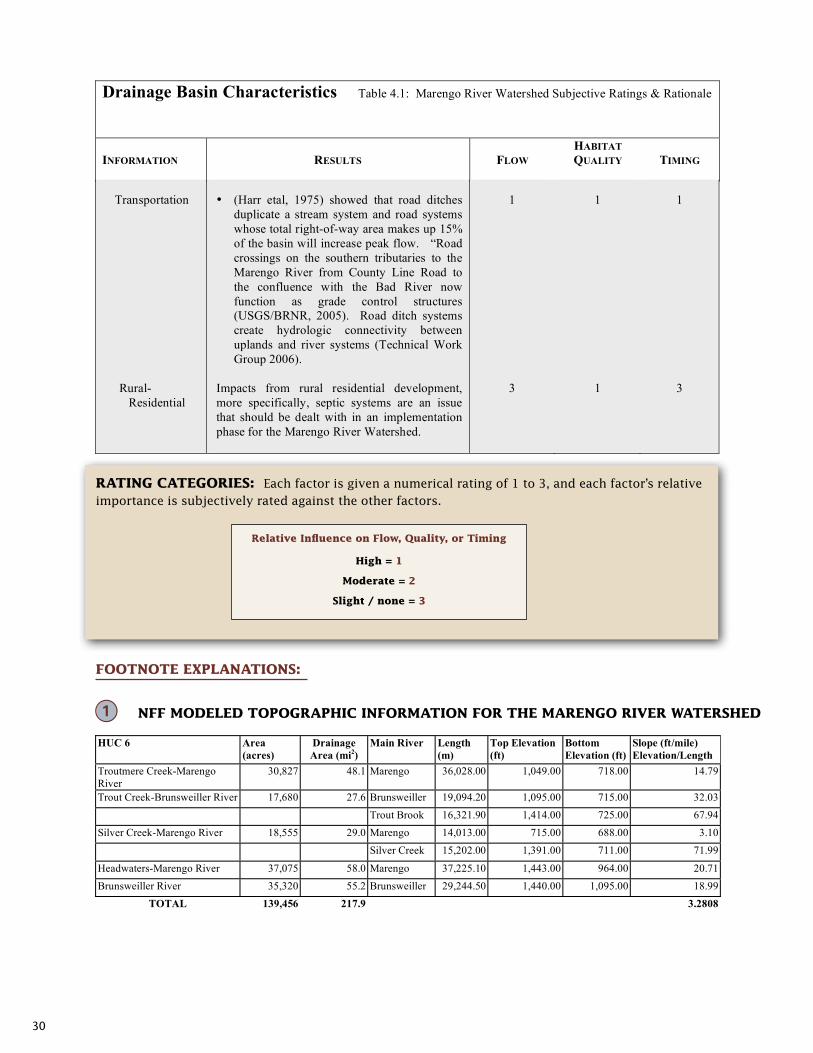
30
A Slow the Flow Project A Report of the Hydrologic Condition of the Marengo River Watershed
Of The Lake Superior Basin Partner Team
January 2007 Stable Solutions LLC
with Community GIS, Inc.
58
Drainage Basin Characteristics Table 4.1: Marengo River Watershed Subjective Ratings & Rationale
INFORMATION
RESULTS
FLOW
HABITAT
QUALITY
TIMING
Wetland Areas
Natural
Constructed
Thirty percent of the upper portion of the
watershed (transition area south) is wetland and
the clay plain contains about fifteen percent
wetlands.
• About 20,833 acres of wetland and open
water are in the Marengo Watershed
• Estimated 15 % wetland acres in the
watershed.
• Some constructed wetlands in the watershed.
If more are constructed to restore hydrology
in areas that were drained, incorporate
drawdown capability.
1
3
2
3
1
3
Land Use4
WISCLAND (1992) land use information shows
very little development, about 2% agriculture,
15% wetland in an otherwise mostly forested
watershed. Note – agriculture is mostly located
in the clay plain (elevation 750 – 1050 feet above
sea level) and is therefore more concentrated
than the table indicates.
1
2
1
Vegetative Cover
Forest Age
Class5
Riparian Buffers
Vegetation plays a key role in how water moves
through the Marengo River watershed. The
generally accepted threshold of open land in a
subwatershed is 40 – 60% to desynchronize peak
discharge resulting from snowmelt (Verry etal,
1983). We chose 60% threshold as there is a
point where peak discharge from snowmelt
levels off or is slightly reduced between 40-60%
open land.
• Using results from the Comparative Analysis
of Hydrologic Units (CGIS, 2004), units
where the combined amount of agriculture
and forest land in 0-16 age class was greater
than 60%.6
1
2
2
1
1
1
Watershed
Morphometry
Refers to the physical characteristics of the river.
Many are discussed under previous items.
• Channel Geometry7 (cross section)
1
1
1
A Slow the Flow Project A Report of the Hydrologic Condition of the Marengo River Watershed
Of The Lake Superior Basin Partner Team
January 2007 Stable Solutions LLC
with Community GIS, Inc.
59
Drainage Basin Characteristics Table 4.1: Marengo River Watershed Subjective Ratings & Rationale
INFORMATION
RESULTS
FLOW
HABITAT
QUALITY
TIMING
Human Influence
Agriculture
Grazing
Nutrient Mgt
Cropland
Mining
Transportation
Rural-
Residential
Human influences have an impact on the
Marengo, however geologic processes are the
driving force in the watershed. Human activities
do, however, accelerate the problem by
channeling and re-routing water, removing
vegetation, and concentrating animal activity.
• Livestock grazing, nutrient management and
cropland management all have an impact on
the hydrologic condition. Unmanaged
grazing impacts water quality, habitat and
stream channels. Nutrient and bacterial
loading (i.e. phosphorus, nitrogen, etc)
occurs through runoff from uncontained
stacked manure, unmanaged grazing, poor
spreading practices.
• Several nonmetallic mines are located in the
watershed. These will be located on the base
map. Nonmetallic mines often change
hydrology, sometimes have an affect on
ground water and remove vegetation.
• (Harr etal, 1975) showed that road ditches
duplicate a stream system and road systems
whose total right-of-way area makes up 15%
of the basin will increase peak flow. “Road
crossings on the southern tributaries to the
Marengo River from County Line Road to
the confluence with the Bad River now
function as grade control structures
(USGS/BRNR, 2005). Road ditch systems
create hydrologic connectivity between
uplands and river systems (Technical Work
Group 2006).
Impacts from rural residential development,
more specifically, septic systems are an issue
that should be dealt with in an implementation
phase for the Marengo River Watershed.
2
3
2
1
1
3
1
1
1
1
1
1
3
3
1
1
1
3
rating Categories: Each factor is given a numerical rating of 1 to 3, and each factor’s relative importance is subjectively rated against the other factors.
Footnote exPLanations:
nFF ModeLed toPograPhiC inForMation For the Marengo river Watershed
relative influence on Flow, quality, or timing
high = 1
Moderate = 2
slight / none = 3
A Slow the Flow Project A Report of the Hydrologic Condition of the Marengo River Watershed
Of The Lake Superior Basin Partner Team
January 2007 Stable Solutions LLC
with Community GIS, Inc.
60
Rating Categories: Each factor is given a numerical rating of 1 to 3, and each factor’s relative
importance is subjectively rated against the other factors.
Rating Relative Influence on
Flow, Quality, or Timing
1 High
2 Moderate
3 Slight / None
1 NFF Modeled topographic information for the Marengo River Watershed
HUC 6 Area
(acres)
Drainage
Area (mi2)
Main River Length
(m)
Top Elevation
(ft)
Bottom
Elevation (ft)
Slope (ft/mile)
Elevation/Length
Troutmere Creek-Marengo
River
30,827 48.1 Marengo 36,028.00 1,049.00 718.00 14.79
Trout Creek-Brunsweiller River 17,680 27.6 Brunsweiller 19,094.20 1,095.00 715.00 32.03
Trout Brook 16,321.90 1,414.00 725.00 67.94
Silver Creek-Marengo River 18,555 29.0 Marengo 14,013.00 715.00 688.00 3.10
Silver Creek 15,202.00 1,391.00 711.00 71.99
Headwaters-Marengo River 37,075 58.0 Marengo 37,225.10 1,443.00 964.00 20.71
Brunsweiller River 35,320 55.2 Brunsweiller 29,244.50 1,440.00 1,095.00 18.99
TOTAL 139,456 217.9 3.2808
2 Figure 4.1: Longitudinal profiles of the Bad & Marengo Rivers showing landscape position (USGS, 2006).
150
200
250
300
350
400
450
500
020406080100120
AL
TIT
UT
E, IN
ME
TE
RS
Bad RiverMarengo
River
Sandy glacial till,
Poorly developed
drainage network, no valley
Sandy post -glacial
shorelines,
entrenched valley
Clay plain,
entrenched/alluvial valley
Bedrock outcrop
Longitudinal Profiles
x
!
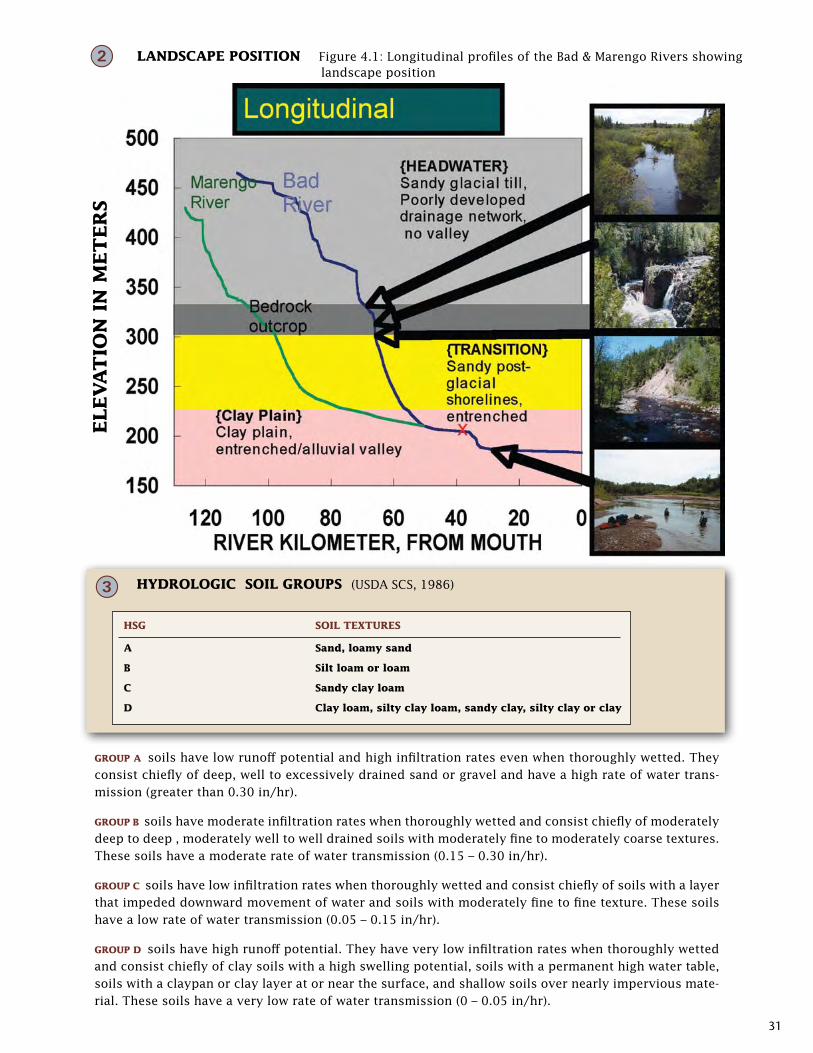
31
hYdroLogiC soiL groUPs (USDA SCS, 1986)
groUP a soils have low runoff potential and high infiltration rates even when thoroughly wetted. They consist chiefly of deep, well to excessively drained sand or gravel and have a high rate of water trans-mission (greater than 0.30 in/hr).
groUP B soils have moderate infiltration rates when thoroughly wetted and consist chiefly of moderately deep to deep , moderately well to well drained soils with moderately fine to moderately coarse textures. These soils have a moderate rate of water transmission (0.15 – 0.30 in/hr).
groUP C soils have low infiltration rates when thoroughly wetted and consist chiefly of soils with a layer that impeded downward movement of water and soils with moderately fine to fine texture. These soils have a low rate of water transmission (0.05 – 0.15 in/hr).
groUP d soils have high runoff potential. They have very low infiltration rates when thoroughly wetted and consist chiefly of clay soils with a high swelling potential, soils with a permanent high water table, soils with a claypan or clay layer at or near the surface, and shallow soils over nearly impervious mate-rial. These soils have a very low rate of water transmission (0 – 0.05 in/hr).
hsg soiL textUres
a sand, loamy sand
B silt loam or loam
C sandy clay loam
d Clay loam, silty clay loam, sandy clay, silty clay or clay
@
eLeva
tio
n i
n M
et
er
s
LandsCaPe Position Figure 4.1: Longitudinal profiles of the Bad & Marengo Rivers showing landscape position
#
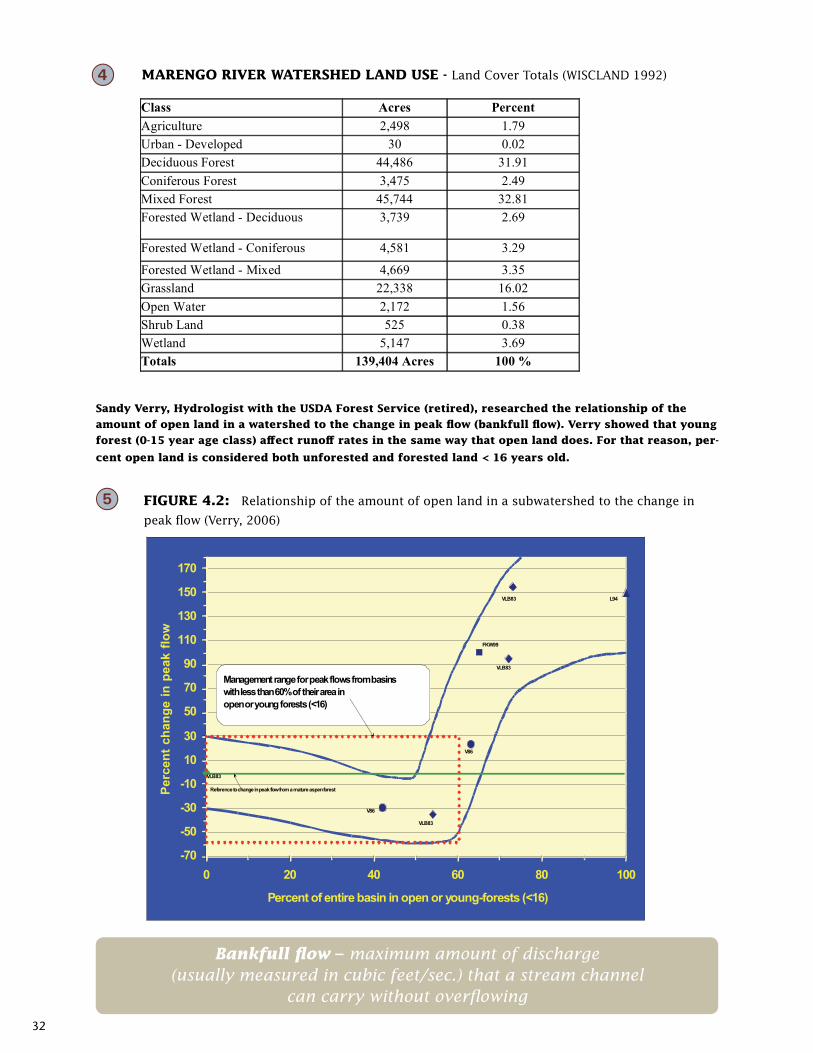
32
A Slow the Flow Project A Report of the Hydrologic Condition of the Marengo River Watershed
Of The Lake Superior Basin Partner Team
January 2007 Stable Solutions LLC
with Community GIS, Inc.
61
3 Hydrologic Soil Groups (USDA SCS, 1986)
HSG Soil Textures
A Sand, loamy sand, or sandy loam
B Silt loam or loam
C Sandy clay loam
D Clay loam, silty clay loam, sandy clay, silty clay,
or clay
Group A soils have low runoff potential and high infiltration rates even when thoroughly wetted. They
consist chiefly of deep, well to excessively drained sand or gravel and have a high rate of water
transmission (greater than 0.30 in/hr).
Group B soils have moderate infiltration rates when thoroughly wetted and consist chiefly of moderately
deep to deep , moderately well to well drained soils with moderately fine to moderately coarse textures.
These soils have a moderate rate of water transmission (0.15 – 0.30 in/hr).
Group C soils have low infiltration rates when thoroughly wetted and consist chiefly of soils with a layer
that impeded downward movement of water and soils with moderately fine to fine texture. These soils
have a low rate of water transmission (0.05 – 0.15 in/hr).
Group D soils have high runoff potential. They have very low infiltration rates when thoroughly wetted
and consist chiefly of clay soils with a high swelling potential, soils with a permanent high water table,
soils with a claypan or clay layer at or near the surface, and shallow soils over nearly impervious material.
These soils have a very low rate of water transmission (0 – 0.05 in/hr).
4 Marengo River Watershed Land Use – Land Cover Totals (WISCLAND, 1992)
Class Acres Percent
Agriculture 2,498 1.79
Urban - Developed 30 0.02
Deciduous Forest 44,486 31.91
Coniferous Forest 3,475 2.49
Mixed Forest 45,744 32.81
Forested Wetland - Deciduous 3,739 2.69
Forested Wetland - Coniferous 4,581 3.29
Forested Wetland - Mixed 4,669 3.35
Grassland 22,338 16.02
Open Water 2,172 1.56
Shrub Land 525 0.38
Wetland 5,147 3.69
Totals 139,404 Acres 100 %
sandy verry, hydrologist with the Usda Forest service (retired), researched the relationship of the
amount of open land in a watershed to the change in peak flow (bankfull flow). verry showed that young
forest (0-15 year age class) affect runoff rates in the same way that open land does. For that reason, per-
cent open land is considered both unforested and forested land < 16 years old.
FigUre 4.2: Relationship of the amount of open land in a subwatershed to the change in
peak flow (Verry, 2006)
A Slow the Flow Project A Report of the Hydrologic Condition of the Marengo River Watershed
Of The Lake Superior Basin Partner Team
January 2007 Stable Solutions LLC
with Community GIS, Inc. 62
5Figure 4.2: Relationship of the amount of open land in a subwatershed to the change in peak flow
(Verry, 2006)
Sandy Verry, Hydrologist with the USDA Forest Service (retired), researched the relationship of the
amount of open land in a watershed to the change in peak flow (bankfull flow).
Verry showed that young forest (0-15 year age class) affect runoff rates in the same way that open land
does. For that reason, percent open land is considered both unforested and forested land < 16 years old.
RESULTS: In a small watershed, with 50-60% open land, there is a marked increase in runoff rate.
Bankfull flow:
Maximum amount of discharge (usually measured in cubic feet/sec.) that a stream channel can carry
without overflowing.
-70
-50
-30
-10
10
30
50
70
90
110
130
150
170
0 20 40 60 80 100
Percent of entire basin in open or young-forests (<16)
Pe
rce
nt
ch
an
ge
in
pe
ak
flo
w
VLB83
VLB83
VLB83
VLB83
V86
V86
FKW99
L94
Reference to change in peak flow from a mature aspen forest
Management range for peak flows from basins
with less than 60% of their area in
open or young forests (<16)
Marengo river Watershed Land Use - Land Cover Totals (WISCLAND 1992)$
%
Bankfull flow – maximum amount of discharge (usually measured in cubic feet/sec.) that a stream channel
can carry without overflowing
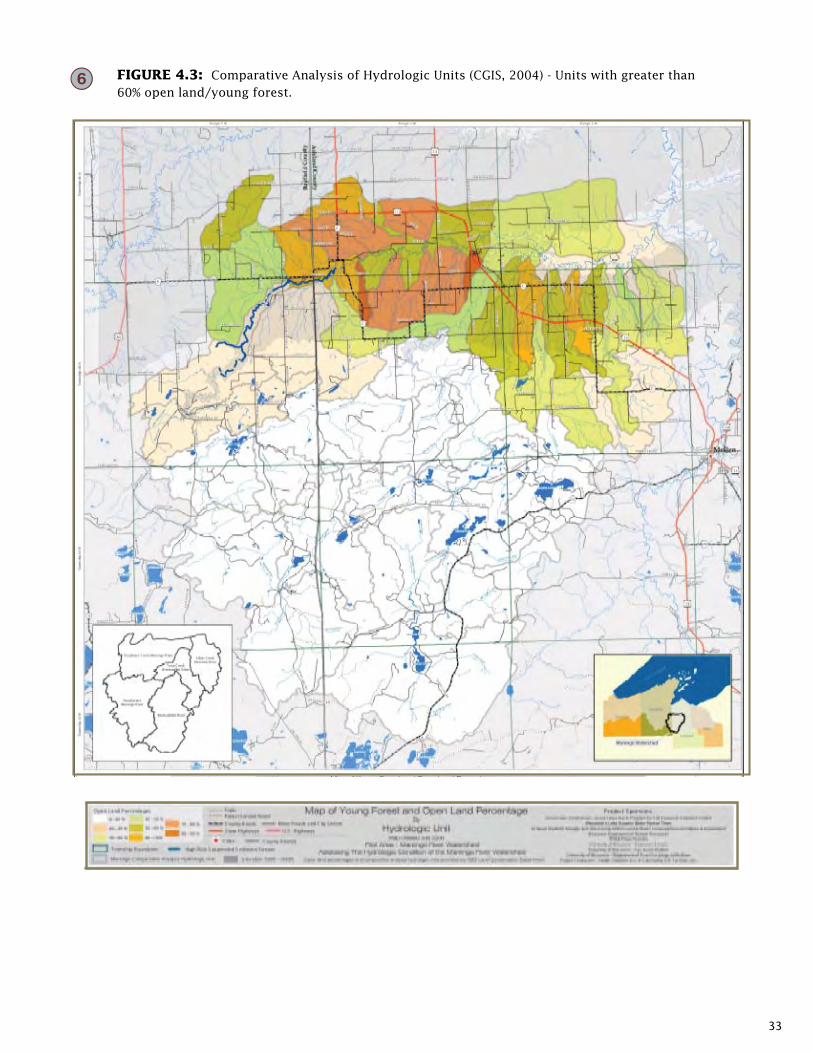
33
A Slow the Flow Project A Report of the Hydrologic Condition of the Marengo River Watershed
Of The Lake Superior Basin Partner Team
January 2007 Stable Solutions LLC
with Community GIS, Inc.
63
6 Figure 4.3: Comparative Analysis of Hydrologic Units (CGIS, 2004) - Units with greater than 60% open
land/young forest
FigUre 4.3: Comparative Analysis of Hydrologic Units (CGIS, 2004) - Units with greater than 60% open land/young forest.
^
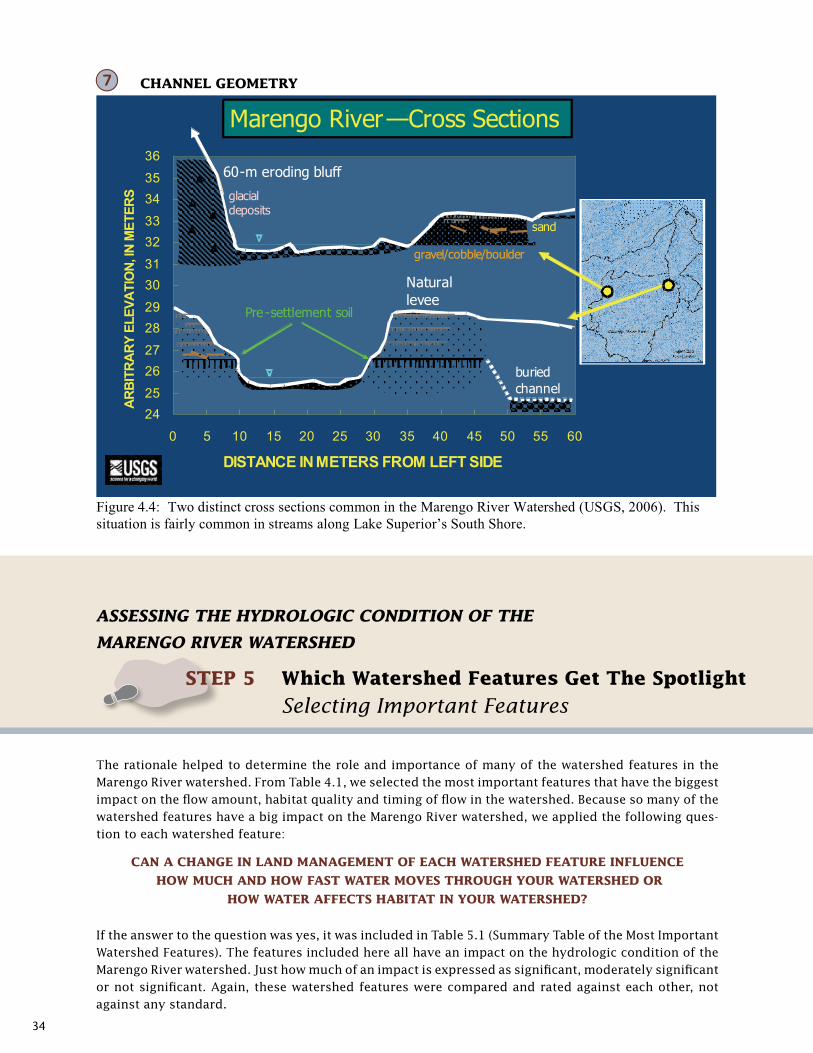
34
A Slow the Flow Project A Report of the Hydrologic Condition of the Marengo River Watershed
Of The Lake Superior Basin Partner Team
January 2007 Stable Solutions LLC
with Community GIS, Inc. 64
7 Channel Geometry
24
25
26
27
28
29
30
31
32
33
34
35
36
0 5 10 15 20 25 30 35 40 45 50 55 60
DISTANCE IN METERS FROM LEFT SIDE
AR
BIT
RA
RY
EL
EV
AT
ION
, IN
ME
TE
RS
Marengo River—Cross Sections
60-m eroding bluff
buried
channel
Natural
leveePre -settlement soil
sand
gravel/cobble/boulder
glacial deposits
Figure 4.4: Two distinct cross sections common in the Marengo River Watershed (USGS, 2006). This
situation is fairly common in streams along Lake Superior’s South Shore.
ASSeSSInG THe HYdROLOGIC COndITIOn OF THe
MARenGO RIVeR WATeRSHed
The rationale helped to determine the role and importance of many of the watershed features in the Marengo River watershed. From Table 4.1, we selected the most important features that have the biggest impact on the flow amount, habitat quality and timing of flow in the watershed. Because so many of the watershed features have a big impact on the Marengo River watershed, we applied the following ques-tion to each watershed feature:
Can a Change in Land ManageMent oF eaCh Watershed FeatUre inFLUenCe
hoW MUCh and hoW Fast Water Moves throUgh YoUr Watershed or
hoW Water aFFeCts haBitat in YoUr Watershed?
If the answer to the question was yes, it was included in Table 5.1 (Summary Table of the Most Important Watershed Features). The features included here all have an impact on the hydrologic condition of the Marengo River watershed. Just how much of an impact is expressed as significant, moderately significant or not significant. Again, these watershed features were compared and rated against each other, not against any standard.
steP 5 Which Watershed Features get the spotlight
Selecting Important Features
& ChanneL geoMetrY
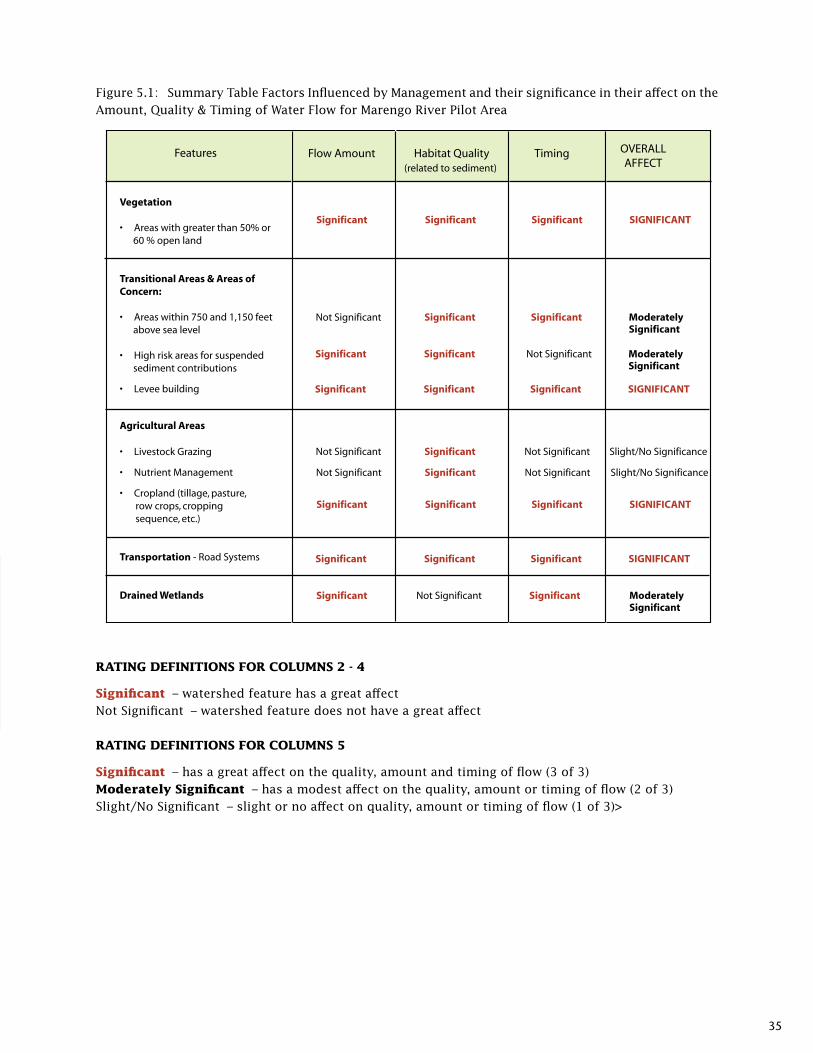
35
Figure 5.1: Summary Table Factors Influenced by Management and their significance in their affect on the Amount, Quality & Timing of Water Flow for Marengo River Pilot Area
Flow Amount Habitat Quality Timing (related to sediment)
OVERALLAFFECT
Features
Vegetation
• Areas with greater than 50% or 60 % open land
Transitional Areas & Areas of Concern:
• Areas within 750 and 1,150 feet above sea level
• High risk areas for suspended sediment contributions
• Levee building
Agricultural Areas
• Livestock Grazing
• Nutrient Management
• Cropland (tillage, pasture, row crops, cropping sequence, etc.)
Transportation - Road Systems
Drained Wetlands
Significant Significant Significant SIGNIFICANT
Not Significant Significant Significant Moderately Significant
Significant Significant Not Significant Moderately Significant
Significant Significant Significant SIGNIFICANT
Not Significant Significant Not Significant Slight/No Significance
Not Significant Significant Not Significant Slight/No Significance
Significant Significant Significant SIGNIFICANT
Significant Significant Significant SIGNIFICANT
Significant Not Significant Significant Moderately Significant
rating deFinitions For CoLUMns 2 - 4
significant – watershed feature has a great affectNot Significant – watershed feature does not have a great affect
rating deFinitions For CoLUMns 5
significant – has a great affect on the quality, amount and timing of flow (3 of 3)Moderately significant – has a modest affect on the quality, amount or timing of flow (2 of 3)Slight/No Significant – slight or no affect on quality, amount or timing of flow (1 of 3)>
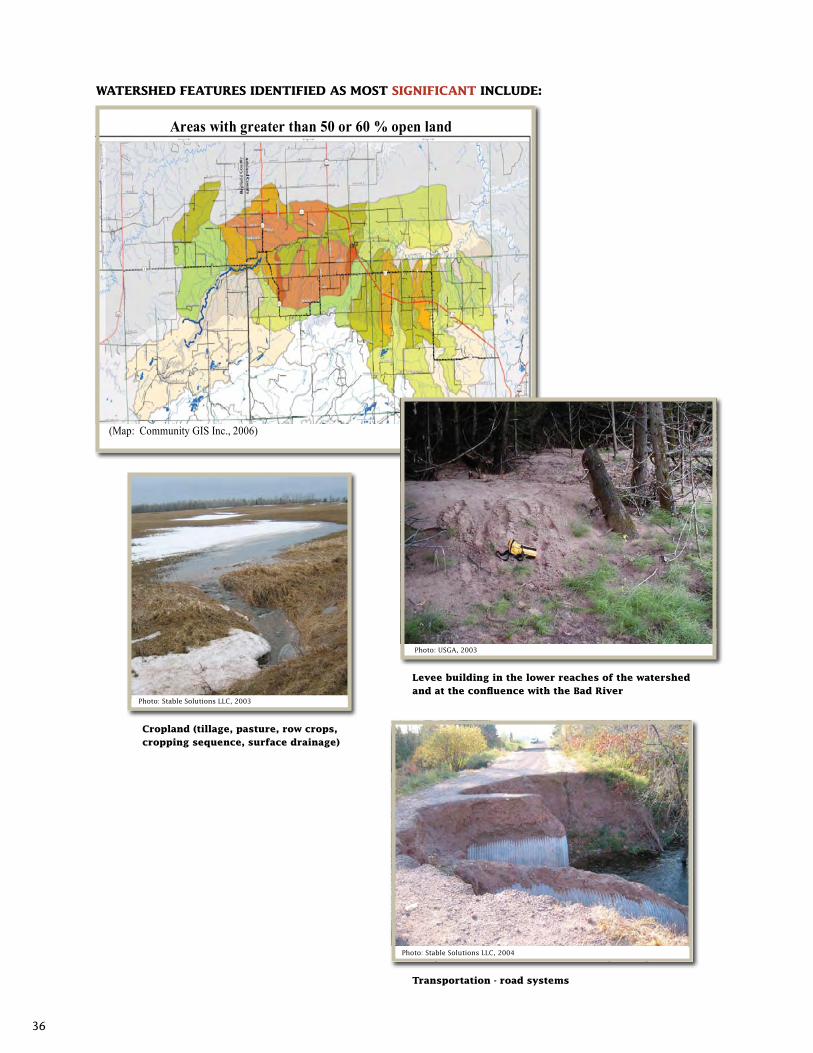
36
Levee building in the lower reaches of the watershed and at the confluence with the Bad river
A Slow the Flow Project A Report of the Hydrologic Condition of the Marengo River Watershed
Of The Lake Superior Basin Partner Team
January 2007 Stable Solutions LLC
with Community GIS, Inc. 17
Watershed features identified as most significant include:
Areas with greater than 50 or 60 % open land
(Map: Community GIS Inc., 2006)
Levee building in the Cropland (tillage, pasture, row crops,
lower reaches of the watershed cropping sequence, surface drainage)
and at the confluence with the Bad River
(Photo: USGS, 2003) (Photo: Stable Solutions LLC, 2005)
Transportation – road systems
(Photo: Stable Solutions LLC, 2004)
Photo: USGA, 2003
Cropland (tillage, pasture, row crops, cropping sequence, surface drainage)
A Slow the Flow Project A Report of the Hydrologic Condition of the Marengo River Watershed
Of The Lake Superior Basin Partner Team
January 2007 Stable Solutions LLC
with Community GIS, Inc. 17
Watershed features identified as most significant include:
Areas with greater than 50 or 60 % open land
(Map: Community GIS Inc., 2006)
Levee building in the Cropland (tillage, pasture, row crops,
lower reaches of the watershed cropping sequence, surface drainage)
and at the confluence with the Bad River
(Photo: USGS, 2003) (Photo: Stable Solutions LLC, 2005)
Transportation – road systems
(Photo: Stable Solutions LLC, 2004)
transportation - road systems
Watershed FeatUres identiFied as Most signiFiCant inCLUde:
Photo: Stable Solutions LLC, 2003
Photo: Stable Solutions LLC, 2004
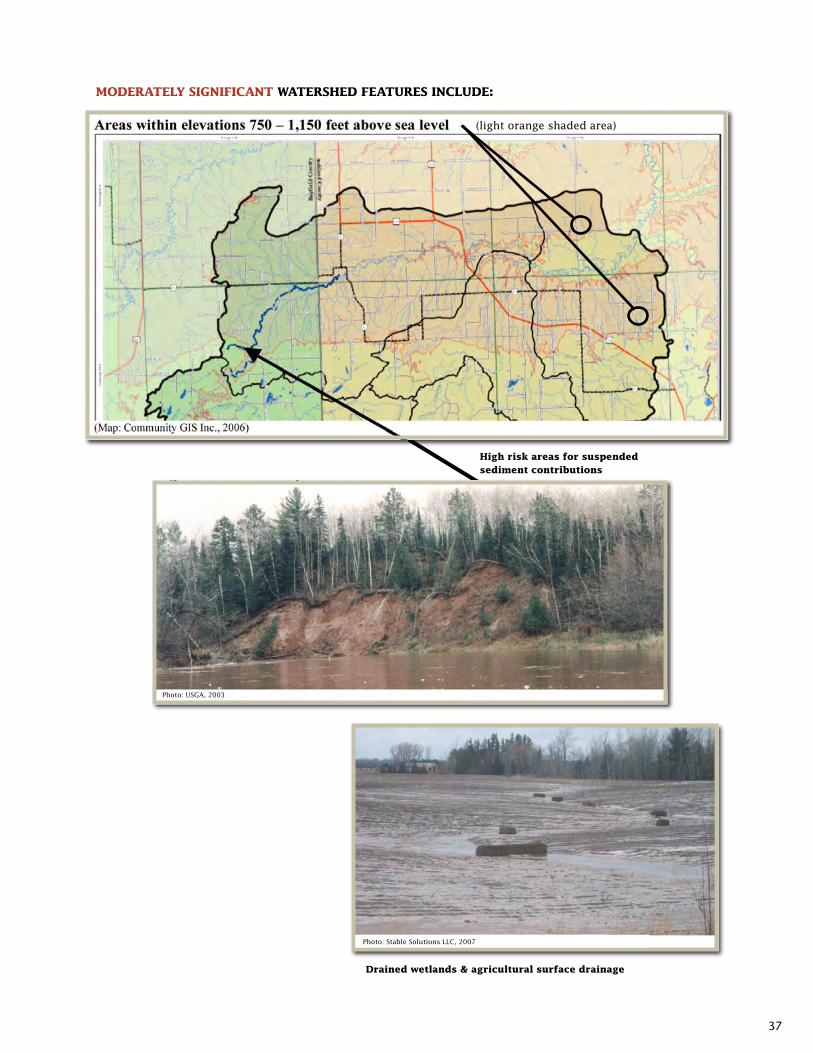
37
ModerateLY signiFiCant Watershed FeatUres inCLUde:
high risk areas for suspended sediment contributions
drained wetlands & agricultural surface drainage
Photo: USGA, 2003
Photo: Stable Solutions LLC, 2007
(light orange shaded area)
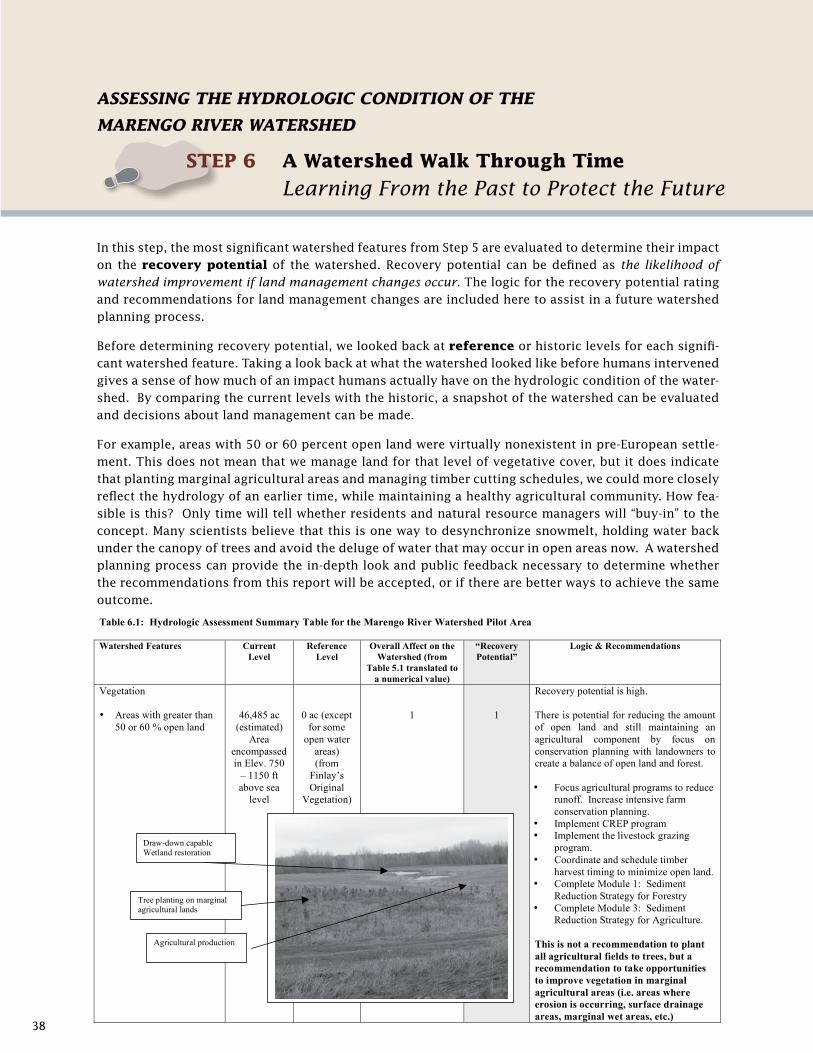
38
ASSeSSInG THe HYdROLOGIC COndITIOn OF THe
MARenGO RIVeR WATeRSHed
In this step, the most significant watershed features from Step 5 are evaluated to determine their impact on the recovery potential of the watershed. Recovery potential can be defined as the likelihood of watershed improvement if land management changes occur. The logic for the recovery potential rating and recommendations for land management changes are included here to assist in a future watershed planning process.
Before determining recovery potential, we looked back at reference or historic levels for each signifi-cant watershed feature. Taking a look back at what the watershed looked like before humans intervened gives a sense of how much of an impact humans actually have on the hydrologic condition of the water-shed. By comparing the current levels with the historic, a snapshot of the watershed can be evaluated and decisions about land management can be made.
For example, areas with 50 or 60 percent open land were virtually nonexistent in pre-European settle-ment. This does not mean that we manage land for that level of vegetative cover, but it does indicate that planting marginal agricultural areas and managing timber cutting schedules, we could more closely reflect the hydrology of an earlier time, while maintaining a healthy agricultural community. How fea-sible is this? Only time will tell whether residents and natural resource managers will “buy-in” to the concept. Many scientists believe that this is one way to desynchronize snowmelt, holding water back under the canopy of trees and avoid the deluge of water that may occur in open areas now. A watershed planning process can provide the in-depth look and public feedback necessary to determine whether the recommendations from this report will be accepted, or if there are better ways to achieve the same outcome.
steP 6 a Watershed Walk through time
Learning From the Past to Protect the Future
A Slow the Flow Project A Report of the Hydrologic Condition of the Marengo River Watershed
Of The Lake Superior Basin Partner Team
January 2007 Stable Solutions LLC
with Community GIS, Inc.
67
Table 6.1: Hydrologic Assessment Summary Table for the Marengo River Watershed Pilot Area
Watershed Features Current
Level
Reference
Level
Overall Affect on the
Watershed (from
Table 5.1 translated to
a numerical value)
“Recovery
Potential”
Logic & Recommendations
Vegetation
• Areas with greater than
50 or 60 % open land
46,485 ac
(estimated)
Area
encompassed
in Elev. 750
– 1150 ft
above sea
level
0 ac (except
for some
open water
areas)
(from
Finlay’s
Original
Vegetation)
1
1
Recovery potential is high.
There is potential for reducing the amount
of open land and still maintaining an
agricultural component by focus on
conservation planning with landowners to
create a balance of open land and forest.
• Focus agricultural programs to reduce
runoff. Increase intensive farm
conservation planning.
• Implement CREP program
• Implement the livestock grazing
program.
• Coordinate and schedule timber
harvest timing to minimize open land.
• Complete Module 1: Sediment
Reduction Strategy for Forestry
• Complete Module 3: Sediment
Reduction Strategy for Agriculture.
This is not a recommendation to plant
all agricultural fields to trees, but a
recommendation to take opportunities
to improve vegetation in marginal
agricultural areas (i.e. areas where
erosion is occurring, surface drainage
areas, marginal wet areas, etc.)
Draw-down capable Wetland restoration
Tree planting on marginal agricultural lands
Agricultural production
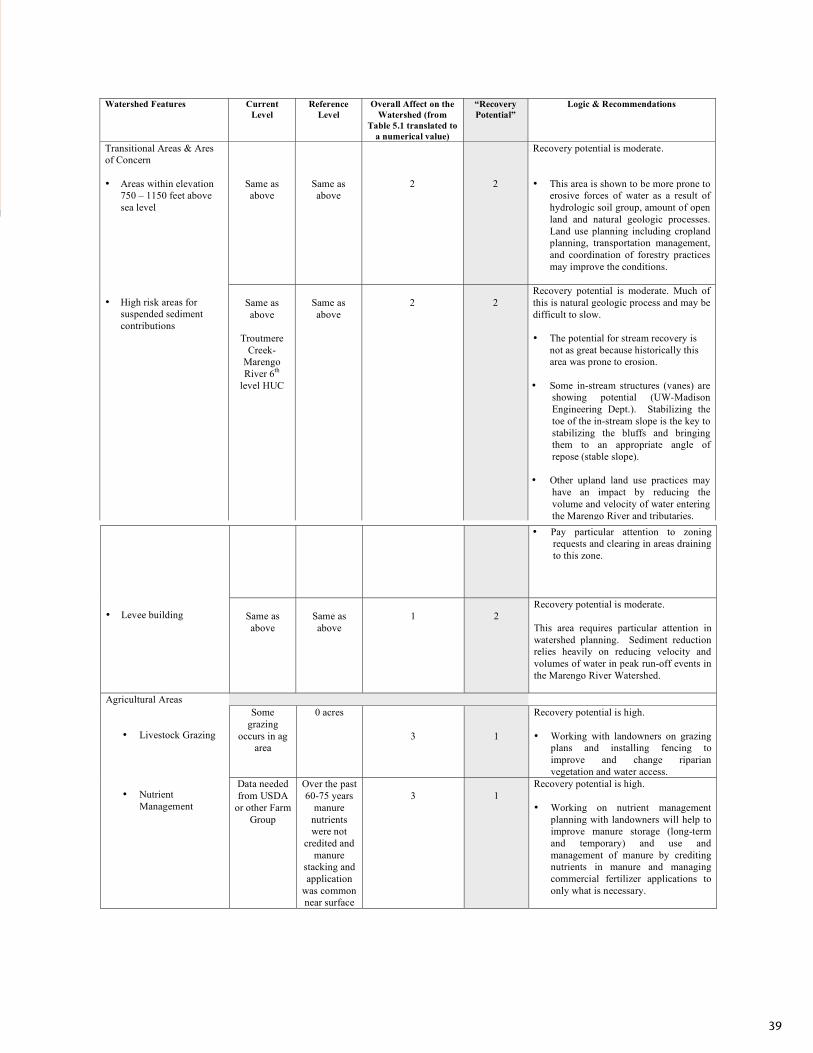
39
A Slow the Flow Project A Report of the Hydrologic Condition of the Marengo River Watershed
Of The Lake Superior Basin Partner Team
January 2007 Stable Solutions LLC
with Community GIS, Inc.
68
Watershed Features Current
Level
Reference
Level
Overall Affect on the
Watershed (from
Table 5.1 translated to
a numerical value)
“Recovery
Potential”
Logic & Recommendations
Same as
above
Same as
above
2
2
Recovery potential is moderate.
• This area is shown to be more prone to
erosive forces of water as a result of
hydrologic soil group, amount of open
land and natural geologic processes.
Land use planning including cropland
planning, transportation management,
and coordination of forestry practices
may improve the conditions.
Transitional Areas & Ares
of Concern
• Areas within elevation
750 – 1150 feet above
sea level
• High risk areas for
suspended sediment
contributions
Same as
above
Troutmere
Creek-
Marengo
River 6th
level HUC
Same as
above
2
2
Recovery potential is moderate. Much of
this is natural geologic process and may be
difficult to slow.
• The potential for stream recovery is
not as great because historically this
area was prone to erosion.
• Some in-stream structures (vanes) are
showing potential (UW-Madison
Engineering Dept.). Stabilizing the
toe of the in-stream slope is the key to
stabilizing the bluffs and bringing
them to an appropriate angle of
repose (stable slope).
• Other upland land use practices may
have an impact by reducing the
volume and velocity of water entering
the Marengo River and tributaries.
A Slow the Flow Project A Report of the Hydrologic Condition of the Marengo River Watershed
Of The Lake Superior Basin Partner Team
January 2007 Stable Solutions LLC
with Community GIS, Inc.
69
Watershed Features Current
Level
Reference
Level
Overall Affect on the
Watershed (from
Table 5.1 translated to
a numerical value)
“Recovery
Potential”
Logic & Recommendations
• Pay particular attention to zoning
requests and clearing in areas draining
to this zone.
• Levee building
Same as
above
Same as
above
1
2
Recovery potential is moderate.
This area requires particular attention in
watershed planning. Sediment reduction
relies heavily on reducing velocity and
volumes of water in peak run-off events in
the Marengo River Watershed.
Some
grazing
occurs in ag
area
0 acres
3
1
Recovery potential is high.
• Working with landowners on grazing
plans and installing fencing to
improve and change riparian
vegetation and water access.
Agricultural Areas
• Livestock Grazing
• Nutrient
Management
Data needed
from USDA
or other Farm
Group
Over the past
60-75 years
manure
nutrients
were not
credited and
manure
stacking and
application
was common
near surface
3
1
Recovery potential is high.
• Working on nutrient management
planning with landowners will help to
improve manure storage (long-term
and temporary) and use and
management of manure by crediting
nutrients in manure and managing
commercial fertilizer applications to
only what is necessary.
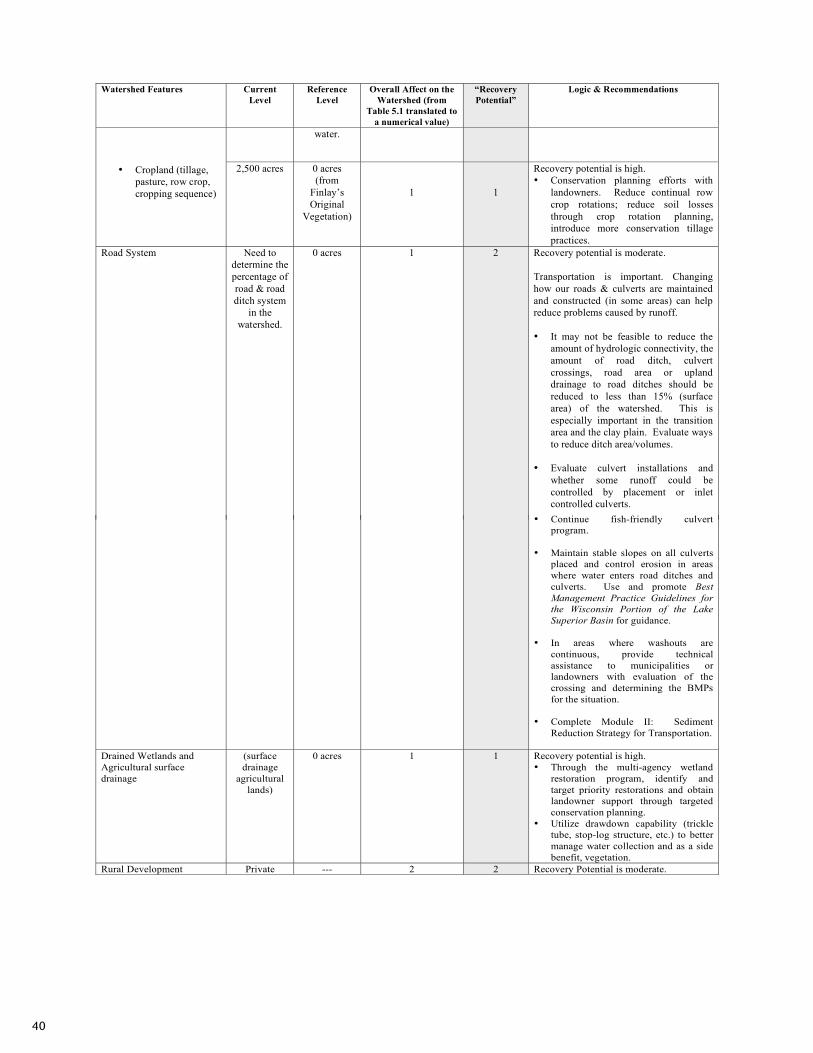
40
A Slow the Flow Project A Report of the Hydrologic Condition of the Marengo River Watershed
Of The Lake Superior Basin Partner Team
January 2007 Stable Solutions LLC
with Community GIS, Inc.
70
Watershed Features Current
Level
Reference
Level
Overall Affect on the
Watershed (from
Table 5.1 translated to
a numerical value)
“Recovery
Potential”
Logic & Recommendations
water.
• Cropland (tillage,
pasture, row crop,
cropping sequence)
2,500 acres 0 acres
(from
Finlay’s
Original
Vegetation)
1
1
Recovery potential is high.
• Conservation planning efforts with
landowners. Reduce continual row
crop rotations; reduce soil losses
through crop rotation planning,
introduce more conservation tillage
practices.
Road System Need to
determine the
percentage of
road & road
ditch system
in the
watershed.
0 acres 1 2 Recovery potential is moderate.
Transportation is important. Changing
how our roads & culverts are maintained
and constructed (in some areas) can help
reduce problems caused by runoff.
• It may not be feasible to reduce the
amount of hydrologic connectivity, the
amount of road ditch, culvert
crossings, road area or upland
drainage to road ditches should be
reduced to less than 15% (surface
area) of the watershed. This is
especially important in the transition
area and the clay plain. Evaluate ways
to reduce ditch area/volumes.
• Evaluate culvert installations and
whether some runoff could be
controlled by placement or inlet
controlled culverts.
A Slow the Flow Project A Report of the Hydrologic Condition of the Marengo River Watershed
Of The Lake Superior Basin Partner Team
January 2007 Stable Solutions LLC
with Community GIS, Inc.
71
Watershed Features Current
Level
Reference
Level
Overall Affect on the
Watershed (from
Table 5.1 translated to
a numerical value)
“Recovery
Potential”
Logic & Recommendations
• Continue fish-friendly culvert
program.
• Maintain stable slopes on all culverts
placed and control erosion in areas
where water enters road ditches and
culverts. Use and promote Best
Management Practice Guidelines for
the Wisconsin Portion of the Lake
Superior Basin for guidance.
• In areas where washouts are
continuous, provide technical
assistance to municipalities or
landowners with evaluation of the
crossing and determining the BMPs
for the situation.
• Complete Module II: Sediment
Reduction Strategy for Transportation.
Drained Wetlands and
Agricultural surface
drainage
(surface
drainage
agricultural
lands)
0 acres 1 1 Recovery potential is high.
• Through the multi-agency wetland
restoration program, identify and
target priority restorations and obtain
landowner support through targeted
conservation planning.
• Utilize drawdown capability (trickle
tube, stop-log structure, etc.) to better
manage water collection and as a side
benefit, vegetation.
Rural Development Private --- 2 2 Recovery Potential is moderate.
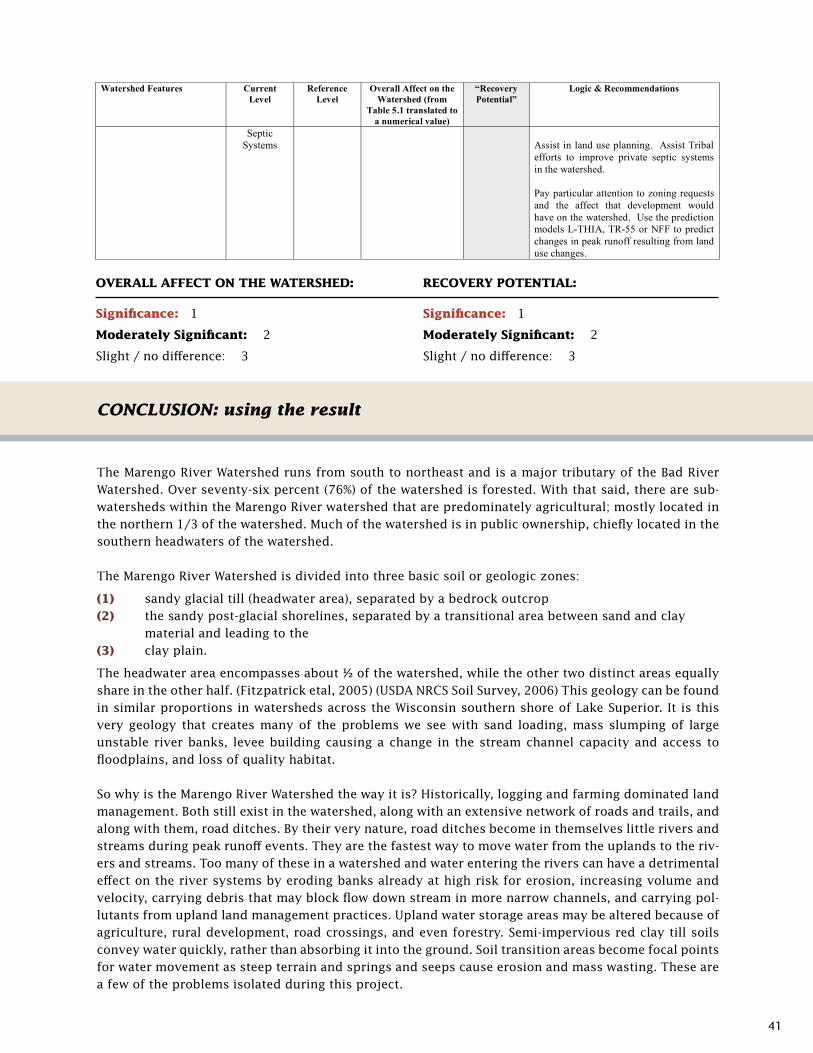
41
A Slow the Flow Project A Report of the Hydrologic Condition of the Marengo River Watershed
Of The Lake Superior Basin Partner Team
January 2007 Stable Solutions LLC
with Community GIS, Inc.
72
Watershed Features Current
Level
Reference
Level
Overall Affect on the
Watershed (from
Table 5.1 translated to
a numerical value)
“Recovery
Potential”
Logic & Recommendations
Septic
Systems
Assist in land use planning. Assist Tribal
efforts to improve private septic systems
in the watershed.
Pay particular attention to zoning requests
and the affect that development would
have on the watershed. Use the prediction
models L-THIA, TR-55 or NFF to predict
changes in peak runoff resulting from land
use changes.
Overall Affect on the Watershed
Significance: 1 Moderately Significant: 2 Slight / no difference: 3
Recovery Potential
High Potential: 1 Moderate Potential: 2 Slight / no potential: 3
overaLL aFFeCt on the Watershed:
significance: 1
Moderately significant: 2
Slight / no difference: 3
reCoverY PotentiaL:
significance: 1
Moderately significant: 2
Slight / no difference: 3
COnCLUSIOn: using the result
The Marengo River Watershed runs from south to northeast and is a major tributary of the Bad River Watershed. Over seventy-six percent (76%) of the watershed is forested. With that said, there are sub-watersheds within the Marengo River watershed that are predominately agricultural; mostly located in the northern 1/3 of the watershed. Much of the watershed is in public ownership, chiefly located in the southern headwaters of the watershed.
The Marengo River Watershed is divided into three basic soil or geologic zones:
(1) sandy glacial till (headwater area), separated by a bedrock outcrop (2) the sandy post-glacial shorelines, separated by a transitional area between sand and clay material and leading to the (3) clay plain.
The headwater area encompasses about ½ of the watershed, while the other two distinct areas equally share in the other half. (Fitzpatrick etal, 2005) (USDA NRCS Soil Survey, 2006) This geology can be found in similar proportions in watersheds across the Wisconsin southern shore of Lake Superior. It is this very geology that creates many of the problems we see with sand loading, mass slumping of large unstable river banks, levee building causing a change in the stream channel capacity and access to floodplains, and loss of quality habitat.
So why is the Marengo River Watershed the way it is? Historically, logging and farming dominated land management. Both still exist in the watershed, along with an extensive network of roads and trails, and along with them, road ditches. By their very nature, road ditches become in themselves little rivers and streams during peak runoff events. They are the fastest way to move water from the uplands to the riv-ers and streams. Too many of these in a watershed and water entering the rivers can have a detrimental effect on the river systems by eroding banks already at high risk for erosion, increasing volume and velocity, carrying debris that may block flow down stream in more narrow channels, and carrying pol-lutants from upland land management practices. Upland water storage areas may be altered because of agriculture, rural development, road crossings, and even forestry. Semi-impervious red clay till soils convey water quickly, rather than absorbing it into the ground. Soil transition areas become focal points for water movement as steep terrain and springs and seeps cause erosion and mass wasting. These are a few of the problems isolated during this project.
42
The focus of this project was to determine how humans impacted the hydrologic condition of the water-shed. That is, what is the impact of human activity on the amount of flow, the timing of the flow and the habitat quality (related to sediment loading). The Framework presents a logical process of collecting and analyzing information that is necessary for the watershed planning process.
• Current status of factor or watershed features influencing water flow, quality or timing
• The factors that had the most influence on water flow, quality or timing
• Management actions that affect water flow, quality, or timing
This information when added to other interdisciplinary information will lead to the development of management opportunities during a watershed planning process. Specific recommendations for a future watershed planning process are included in Table 6.1A that follows.A Slow the Flow Project A Report of the Hydrologic Condition of the Marengo River Watershed
Of The Lake Superior Basin Partner Team
January 2007 Stable Solutions LLC
with Community GIS, Inc. 21
Table 6.1A: Recommendations for the Watershed Planning Process Resulting from the Hydrologic
Condition Assessment for the Marengo River Watershed Pilot Area ( Table 6.1, complete with current
and reference levels, rating of the overall affect on the watershed and recovery potential rating can be found in the
addendum to this report.)
Watershed Features Logic & Recommendations
Vegetation
• Areas with greater than 50
or 60 % open land
Recovery potential is high.
There is potential for reducing the amount of open land and still maintaining an
agricultural component by focus on conservation planning with landowners to
create a balance of open land and forest.
• Focus agricultural programs to reduce runoff. Increase intensive farm
conservation planning.
• Implement CREP program
• Implement the livestock grazing program.
• Coordinate and schedule timber harvest timing to minimize open land.
• Complete Module 1: Sediment Reduction Strategy for Forestry
• Complete Module 3: Sediment Reduction Strategy for Agriculture.
This is not a recommendation to plant all agricultural fields to trees, but a
recommendation to take opportunities to improve vegetation in marginal
agricultural areas (i.e. areas where erosion is occurring, surface drainage
areas, marginal wet areas, etc.)
Recovery potential is moderate.
• This area is shown to be more prone to erosive forces of water as a result of
hydrologic soil group, amount of open land and natural geologic processes.
Land use planning including cropland planning, transportation management,
and coordination of forestry practices may improve the conditions.
Recovery potential is moderate. Much of this is natural geologic process and
may be difficult to slow.
• The potential for stream recovery is not as great because historically this
area was prone to erosion.
• Some in-stream structures (vanes) are showing potential (UW-Madison
Engineering Dept.). Stabilizing the toe of the in-stream slope is the key to
stabilizing the bluffs and bringing them to an appropriate angle of repose
(stable slope).
• Other upland land use practices may have an impact by reducing the volume
and velocity of water entering the Marengo River and tributaries.
• Pay particular attention to zoning requests and clearing in areas draining to
this zone.
Transitional Areas & Ares of
Concern
• Areas within elevation 750
– 1150 feet above sea level
• High risk areas for
suspended sediment
contributions
• Levee building
Recovery potential is moderate.
This area requires particular attention in watershed planning. Sediment
reduction relies heavily on reducing velocity and volumes of water in peak run-
off events in the Marengo River Watershed.
Agricultural Areas
43
A Slow the Flow Project A Report of the Hydrologic Condition of the Marengo River Watershed
Of The Lake Superior Basin Partner Team
January 2007 Stable Solutions LLC
with Community GIS, Inc. 22
Watershed Features Logic & Recommendations
Recovery potential is high.
• Working with landowners on grazing plans and installing fencing to
improve and change riparian vegetation and water access.
Recovery potential is high.
• Working on nutrient management planning with landowners will help to
improve manure storage (long-term and temporary) and use and
management of manure by crediting nutrients in manure and managing
commercial fertilizer applications to only what is necessary.
• Livestock Grazing
• Nutrient Management
• Cropland (tillage,
pasture, row crop,
cropping sequence)
Recovery potential is high.
• Conservation planning efforts with landowners. Reduce continual row crop
rotations; reduce soil losses through crop rotation planning, introduce more
conservation tillage practices.
Road System Recovery potential is moderate.
Transportation is important. Changing how our roads & culverts are maintained
and constructed (in some areas) can help reduce problems caused by runoff.
• It may not be feasible to reduce the amount of hydrologic connectivity, the
amount of road ditch, culvert crossings, road area or upland drainage to road
ditches should be reduced to less than 15% (surface area) of the watershed.
This is especially important in the transition area and the clay plain.
Evaluate ways to reduce ditch area/volumes.
• Evaluate culvert installations and whether some runoff could be controlled
by placement or inlet controlled culverts.
• Continue fish-friendly culvert program.
• Maintain stable slopes on all culverts placed and control erosion in areas
where water enters road ditches and culverts. Use and promote Best
Management Practice Guidelines for the Wisconsin Portion of the Lake
Superior Basin for guidance.
• In areas where washouts are continuous, provide technical assistance to
municipalities or landowners with evaluation of the crossing and
determining the BMPs for the situation.
• Complete Module II: Sediment Reduction Strategy for Transportation.
Drained Wetlands and
Agricultural surface drainage
Recovery potential is high.
• Through the multi-agency wetland restoration program, identify and target
priority restorations and obtain landowner support through targeted
conservation planning.
• Utilize drawdown capability (trickle tube, stop-log structure, etc.) to better
manage water collection and as a side benefit, vegetation.
Rural Development Recovery Potential is moderate.
A Slow the Flow Project A Report of the Hydrologic Condition of the Marengo River Watershed
Of The Lake Superior Basin Partner Team
January 2007 Stable Solutions LLC
with Community GIS, Inc. 21
Table 6.1A: Recommendations for the Watershed Planning Process Resulting from the Hydrologic
Condition Assessment for the Marengo River Watershed Pilot Area ( Table 6.1, complete with current
and reference levels, rating of the overall affect on the watershed and recovery potential rating can be found in the
addendum to this report.)
Watershed Features Logic & Recommendations
Vegetation
• Areas with greater than 50
or 60 % open land
Recovery potential is high.
There is potential for reducing the amount of open land and still maintaining an
agricultural component by focus on conservation planning with landowners to
create a balance of open land and forest.
• Focus agricultural programs to reduce runoff. Increase intensive farm
conservation planning.
• Implement CREP program
• Implement the livestock grazing program.
• Coordinate and schedule timber harvest timing to minimize open land.
• Complete Module 1: Sediment Reduction Strategy for Forestry
• Complete Module 3: Sediment Reduction Strategy for Agriculture.
This is not a recommendation to plant all agricultural fields to trees, but a
recommendation to take opportunities to improve vegetation in marginal
agricultural areas (i.e. areas where erosion is occurring, surface drainage
areas, marginal wet areas, etc.)
Recovery potential is moderate.
• This area is shown to be more prone to erosive forces of water as a result of
hydrologic soil group, amount of open land and natural geologic processes.
Land use planning including cropland planning, transportation management,
and coordination of forestry practices may improve the conditions.
Recovery potential is moderate. Much of this is natural geologic process and
may be difficult to slow.
• The potential for stream recovery is not as great because historically this
area was prone to erosion.
• Some in-stream structures (vanes) are showing potential (UW-Madison
Engineering Dept.). Stabilizing the toe of the in-stream slope is the key to
stabilizing the bluffs and bringing them to an appropriate angle of repose
(stable slope).
• Other upland land use practices may have an impact by reducing the volume
and velocity of water entering the Marengo River and tributaries.
• Pay particular attention to zoning requests and clearing in areas draining to
this zone.
Transitional Areas & Ares of
Concern
• Areas within elevation 750
– 1150 feet above sea level
• High risk areas for
suspended sediment
contributions
• Levee building
Recovery potential is moderate.
This area requires particular attention in watershed planning. Sediment
reduction relies heavily on reducing velocity and volumes of water in peak run-
off events in the Marengo River Watershed.
Agricultural Areas
A Slow the Flow Project A Report of the Hydrologic Condition of the Marengo River Watershed
Of The Lake Superior Basin Partner Team
January 2007 Stable Solutions LLC
with Community GIS, Inc. 23
Watershed Features Logic & Recommendations
Assist in land use planning. Assist Tribal efforts to improve private septic
systems in the watershed.
Pay particular attention to zoning requests and the affect that development would
have on the watershed. Use the prediction models L-THIA, TR-55 or NFF to
predict changes in peak runoff resulting from land use changes.
A Slow the Flow Project A Report of the Hydrologic Condition of the Marengo River Watershed
Of The Lake Superior Basin Partner Team
January 2007 Stable Solutions LLC
with Community GIS, Inc. 22
Watershed Features Logic & Recommendations
Recovery potential is high.
• Working with landowners on grazing plans and installing fencing to
improve and change riparian vegetation and water access.
Recovery potential is high.
• Working on nutrient management planning with landowners will help to
improve manure storage (long-term and temporary) and use and
management of manure by crediting nutrients in manure and managing
commercial fertilizer applications to only what is necessary.
• Livestock Grazing
• Nutrient Management
• Cropland (tillage,
pasture, row crop,
cropping sequence)
Recovery potential is high.
• Conservation planning efforts with landowners. Reduce continual row crop
rotations; reduce soil losses through crop rotation planning, introduce more
conservation tillage practices.
Road System Recovery potential is moderate.
Transportation is important. Changing how our roads & culverts are maintained
and constructed (in some areas) can help reduce problems caused by runoff.
• It may not be feasible to reduce the amount of hydrologic connectivity, the
amount of road ditch, culvert crossings, road area or upland drainage to road
ditches should be reduced to less than 15% (surface area) of the watershed.
This is especially important in the transition area and the clay plain.
Evaluate ways to reduce ditch area/volumes.
• Evaluate culvert installations and whether some runoff could be controlled
by placement or inlet controlled culverts.
• Continue fish-friendly culvert program.
• Maintain stable slopes on all culverts placed and control erosion in areas
where water enters road ditches and culverts. Use and promote Best
Management Practice Guidelines for the Wisconsin Portion of the Lake
Superior Basin for guidance.
• In areas where washouts are continuous, provide technical assistance to
municipalities or landowners with evaluation of the crossing and
determining the BMPs for the situation.
• Complete Module II: Sediment Reduction Strategy for Transportation.
Drained Wetlands and
Agricultural surface drainage
Recovery potential is high.
• Through the multi-agency wetland restoration program, identify and target
priority restorations and obtain landowner support through targeted
conservation planning.
• Utilize drawdown capability (trickle tube, stop-log structure, etc.) to better
manage water collection and as a side benefit, vegetation.
Rural Development Recovery Potential is moderate.
AW Research Laboratories, Inc. 2004. Marengo River Watershed Influence Maps. Brainerd, MN. AW Research Laboratories, Inc and Bad River Tribe of Lake Superior Chippewa Natural Resources Department, no publication number.
Fitzpatrick, F.; etal. 2005. Project Update - Investigation of Erosion, Sedimentation, Channel Migration, and Streamflow Trends for the Bad River, Wisconsin. U.S.D.I. Geological Survey and Bad River Tribe of Lake Superior Chippewa Natural Resources Department, project update/no publication number.
McCammon, B.; Rector, J.; Gebhardt, K. 1998. A Framework for Analyzing the Hydrologic Condition of Watersheds. U.S.D.A. Forest Service and U.S.D.I. Bureau of Land Management, BLM/RS/ST-98/004+7210.
Red Clay Interagency Committee. Erosion and Sedimentation Control on the Red Clay Soils of Northwestern Wisconsin. Soil Conservation Board, Madison WI, 1967.
Schultz, S.D. et al. 2003. Best Management Practice Guidelines for the Wisconsin Portion of the Lake Superior Basin. Stable Solutions LLC & Technical Review Group, and the ABDI-Land Conservation Department, no publication number.
U.S.D.A. Natural Resources Conservation Service. 2006. Ashland and Bayfield Counties Soil Survey. Data obtained from Soil Survey Crew in Ashland, WI.
Verry, E.S. 1997. Hydrological processes of natural, northern forested wetlands. Chapter 13. Northern forested wetlands, ecology and management, eds. C.C. Trettin, et al. New York: Lewis Publishers: 163-188.
Verry, E.S. 1992. Riparian systems and management. In Forest practice and water quality workshop: a Lake States Forestry Alliance initiative, 1992 May 27-29, Green Bay, WI. The Lakes States Forestry Initiative, Hancock, MI B1-B24.
Verry, E.S., J.R. Lewis, and K.N. Brooks. 1983. aspen clearcutting increases snowmelt and storm flow peaks in north central Minnesota. Water Resour. Bull.19(1):59-67.
Verry, E.S., J.W. Hornbeck, C.A.. Dolloff, eds. 2000. Riparian Management in Forests of the Continental Eastern United States. Boca Raton: Lewis Publishers (CRC Press LLC.) 2000. 402 pp.
Verry, E.S. 2001. Land Use and Steam Condition. USDA Forest Service, North Central Research Station, St. Paul, MN. 2pp.
REFERENCES:
Marengo River Watershed Test Case: Assessing the Hydrologic
Condition of the Marengo River Watershed, Wisconsin was funded
by a grant from the Great Lakes Commission Great Lakes Program
for Soil Erosion and Sediment Control to the Ashland Bayfield
Douglas Iron County Land and Water Conservation Department
on behalf of the Wisconsin Lake Superior Basin Partner Team.
Funding was also provided by the USDA Forest Service.
The project benefited from in-kind support provided by the
following organizations: Ashland Bayfield Douglas Iron County
Land and Water Conservation Department, Bad River Band of
Lake Superior Tribe of Chippewa Indians Natural Resources
Department, University of Wisconsin Extension, University of
Wisconsin Sea Grant, Wisconsin Department of Natural Resources,
and the Wisconsin Lake Superior Basin Partner Team Grant Over-
sight and Technical Committees.
Ashland, Bayfield, Douglas & Iron CountyLand Conservation Committees
assessing the hydrologic Condition of
the Marengo river Watershed