Embed Size (px)
Citation preview

Marco PaganoUniversity of Naples Federico II, CSEF, EIEF and
CEPR
Giovanni PicaUniversity of Salerno and CSEF
Economic Policy, 53rd panel meeting
15 and 16 April 2011 - Magyar Nemzeti Bank
Finance and Employment
Is finance the enemy of labor?
Textbook vision of the role of finance: efficient allocation of capital optimal risk sharing
Probably most workers instead view finance as: creating employment risk via corporate restructuring,
bankruptcies, and financial crises enabling or spurring firms to maximize share value at
labor’s expenses allowing bankers to earn astronomical bonuses, etc.
The crisis has reinforced this negative vision of finance. Good time to think about this…
Outline
1. How does financial development (FD) affect employment, wage and productivity growth?
2. How does it affect the variability of employment?
3. Does it magnify the employment losses at times of banking crisis?

Toy model of labor market response to FD
For a start, consider case of identical firms 1-size continuum of firms with Cobb-Douglas
technology:
Entrepreneur has wealth A He can “steal” (at most) fraction 1 of revenues (net
of wages: no stealing from workers) Better investor protection more funding to
firms (henceforth = degree of FD) Competitive credit and labor markets
1Y K L
FD also amplifies employment response to shocks
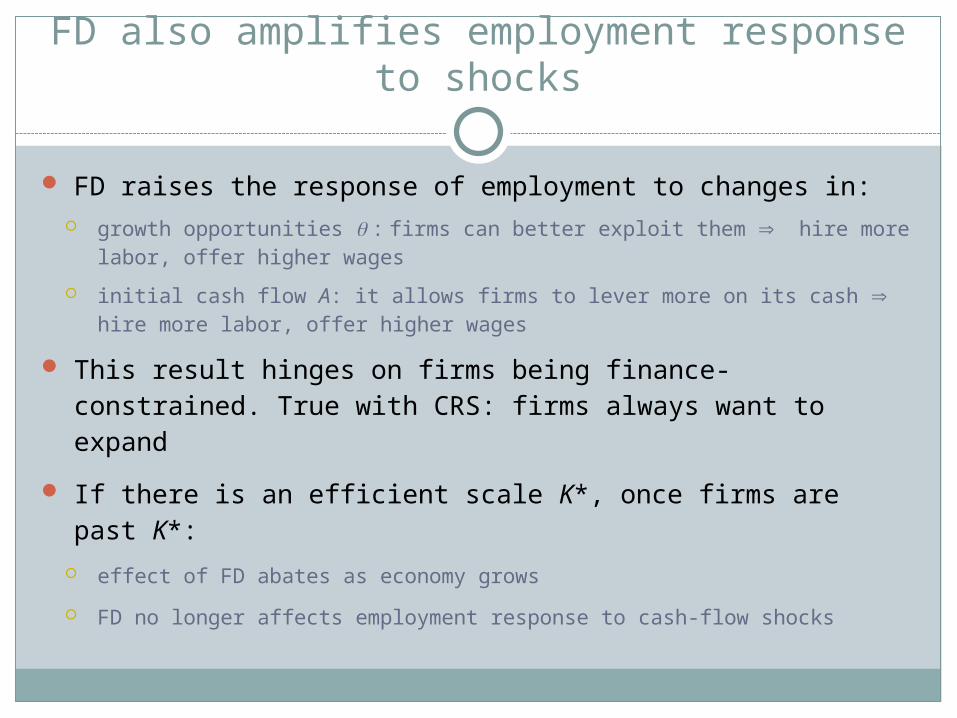
FD raises the response of employment to changes in: growth opportunities : firms can better exploit them hire more
labor, offer higher wages
initial cash flow A: it allows firms to lever more on its cash hire more labor, offer higher wages
This result hinges on firms being finance-constrained. True with CRS: firms always want to expand
If there is an efficient scale K*, once firms are past K*:
effect of FD abates as economy grows
FD no longer affects employment response to cash-flow shocks

Evidence on finance, employment and wages
We extend the approach by Rajan and Zingales (1998): FD should matter more for industries that are more “dependent on external finance”
External dependence = reliance on external finance by U.S. listed companies in the Compustat database
Baseline specification:1970( )jc c j jc j c jcY FD ED SHARE

Data
Value added, employment and wage bill (Yj c): UNIDO
INDSTAT3 2006 database, 1970-2003 yearly data for 28 three-digit-industries
63 countries
External dependence (EDj): Rajan and Zingales (1998)
Financial development (FDc):
private credit/GDP
stock market capitalization/GDP (1980–95 averages)

Finance, employment and wages: all countries
Dependent variable: Growth of Value Added
Employment Growth Wage GrowthLabor Productivity
Growth
Industry’s share in 1970 -0.156***
(0.030)0.204***
(0.027)0.141***
(0.026)0.167***
(0.029)0.020***
(0.003)0.022***
(0.003)0.002***
(0.001)0.002***
(0.001)
External dependence stock market capitalization (80-95)
0.026*
(0.014)0.037***
(0.013)0.00004(0.004)
0.002(0.011)
External dependence claims of banks and other fin. inst. (80-95)
0.034**
(0.016)0.055***
(0.014)0.002
(0.004)0.008(0.013)
Observations 1533 1637 1447 1526 1293 1370 1428 1505
R-squared 0.32 0.33 0.42 0.39 0.72 0.68 0.29 0.30
Effect is between 0.23% and 0.83% as FD rises from 25th to 75th percentile

Finance, employment and wages: OECD
Dependent variable: Growth of Value Added
Employment Growth Wage GrowthLabor Productivity
Growth
Industry’s share in 19700.212***
(0.054)0.212***
(0.055)0.153***
(0.044)0.155***
(0.045)0.022***
(0.004)0.022***
(0.004)0.001(0.001)
0.001(0.001)
External dependence stock market capitalization (80-95)
0.022(0.018)
0.011(0.012)
0.010(0.007)
0.002(0.004)
0.021**
(0.011)
External dependence claims of banks and other fin. inst. (80-95)
0.011(0.011)
0.009(0.008)
0.012*
(0.007)
Observations 628 628 624 624 594 594 622 622
R-squared 0.48 0.48 0.55 0.55 0.70 0.70 0.34 0.34
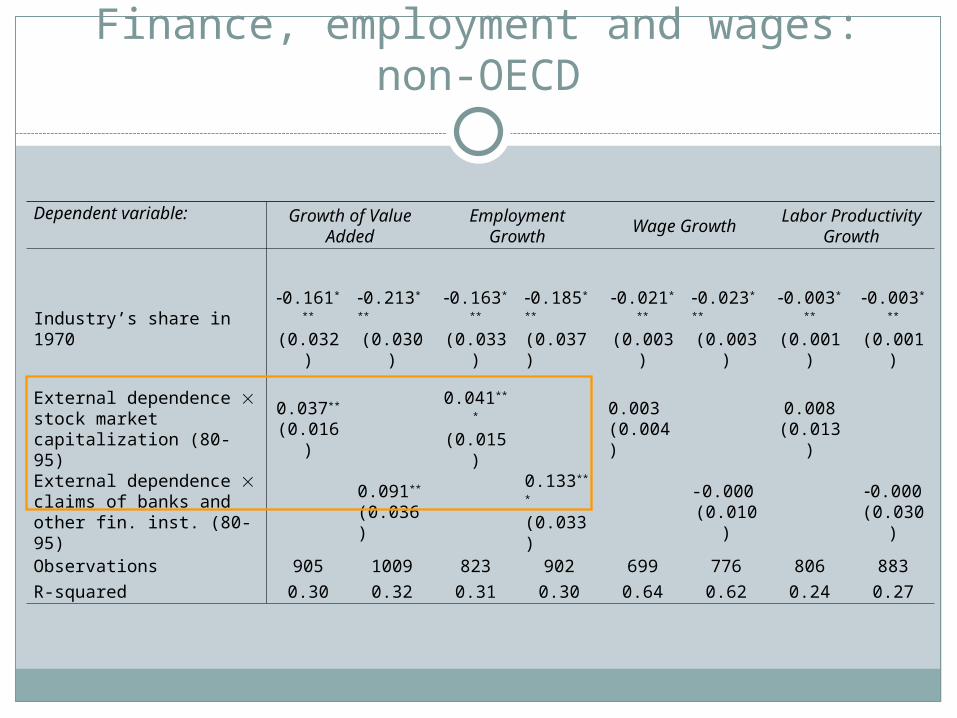
Finance, employment and wages: non-OECD
Dependent variable: Growth of Value Added
Employment Growth Wage GrowthLabor Productivity
Growth
Industry’s share in 19700.161***
(0.032)0.213***
(0.030)0.163***
(0.033)0.185***
(0.037)0.021***
(0.003)0.023***
(0.003)0.003***
(0.001)0.003***
(0.001)
External dependence stock market capitalization (80-95)
0.037**
(0.016)0.041***
(0.015)0.003(0.004)
0.008(0.013)
External dependence claims of banks and other fin. inst. (80-95)
0.091**
(0.036)0.133***
(0.033)-0.000
(0.010)0.000(0.030)
Observations 905 1009 823 902 699 776 806 883
R-squared 0.30 0.32 0.31 0.30 0.64 0.62 0.24 0.27

Effect on employment reallocation
Extend model to 2 industries with different prospects: strong industry H with high expected profitability H
weak industry L has low expected profitability L
Labor flows freely between them: single equilibrium wage w
Now FD affects not only total employment but also its distribution between industries – in favor of industry H !
With higher FD, industry H attracts more funds than L: employment in industry H grows by more than in industry L employment in industry L may drop (if Ls is sufficiently
inelastic) sufficiently high FD will eventually “shut off” industry L

Response to growth shocks and to cash flow shocks
With greater FD, sectoral growth shocks entail more cross-industry employment reallocations
But as FD proceeds, more and more firms achieve their efficient scale and become unconstrained:
these firms stop reacting to cash flow shocks…
As FD rises, it lowers the effect of cash flow shocks on job reallocations (eventually eliminates it)
Evidence on finance and labor reallocation
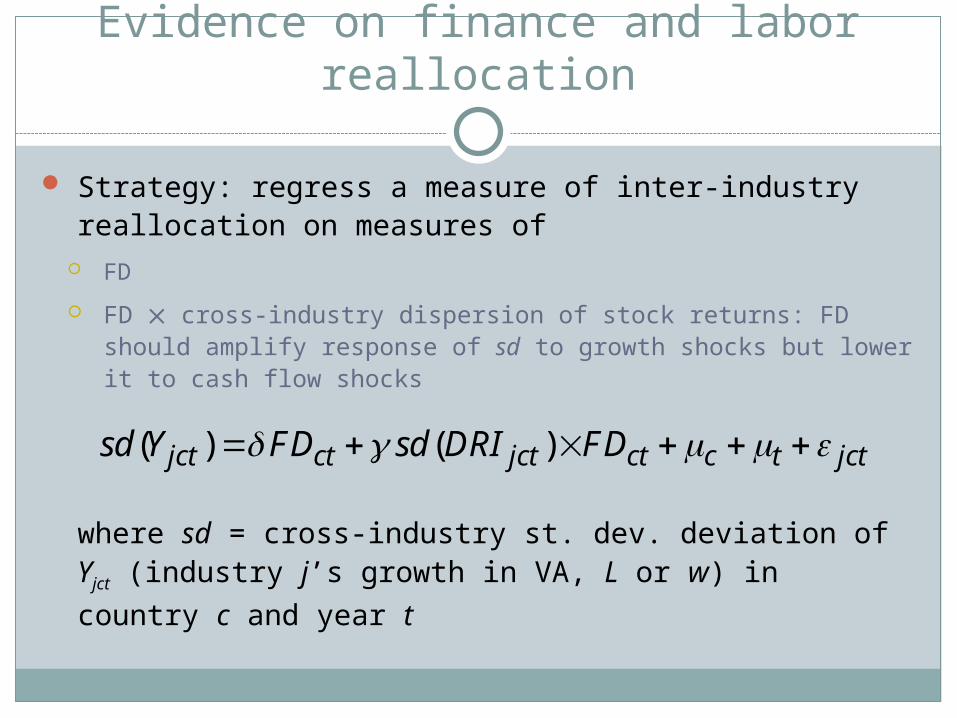
Strategy: regress a measure of inter-industry reallocation on measures of
FD
FD cross-industry dispersion of stock returns: FD should amplify response of sd to growth shocks but lower it to cash flow shocks
where sd = cross-industry st. dev. deviation of Yjct
(industry j’s growth in VA, L or w) in country c and year t
( ) ( )jct ct jct ct c t jctsd Y FD sd DRI FD

Finance and reallocation: augmented specification
Dependent variable: standard deviation by year and country of
Value added growth
Value added growth
Value added growth
Employ-ment
growth
Employ-ment
growth
Employ-ment
growth
Wage growth
Wage growth
Wage growth
Private credit by deposit money banks and other financial institutions to GDP
0.097(0.064)
0.013(0.043)
0.054*
(0.029)
Stock market capitalization to GDP
0.072***
(0.025)0.053***
(0.017)0.011(0.008)
Stock market total value traded to GDP
0.089*
(0.045)0.069***
(0.024)0.029**
(0.012)
Standard deviation of continental price shocks Fin. Dev.
0.152(0.191)
0.236**
(0.118)0.383
(0.250)0.069
(0.123)0.182**
(0.074)0.247**
(0.110)0.153**
(0.073)0.063**
(0.032)0.100*
(0.054)
Observations 1281 874 893 1246 857 875 1207 824 846R-squared 0.02 0.03 0.03 0.02 0.04 0.04 0.03 0.03 0.03

Crises: the “dark side” of financial development?
FD may become a handicap in a crisis because they create “dependence”: the more financial markets are trusted in normal times, the greater the damage to output and employment when a crisis hits
Most clearly seen by looking at liquidity provision: in normal times banks allow firms to save on liquidity deploy more resources to production
But when banks are hit by a liquidity shortage, the damage can be more severe

Evidence on banking crises
Two empirical strategies:
1. Kroszner et al. (2007): re-estimate Rajan-Zingales regressions before, during and after a financial crisis:
o 1 crisis observation per country, averaging crisis episodes for countries that experience more than one crisis
2.Panel data approach similar to Braun & Larrain (2005):
Financial crisis data from Laeven and Valencia (2010): universe of banking crises (1970-2009)
0 1 1 2
3
( ) ( )
( )
jct cjt j ct c j
c j ct ct j jct
Y SHARE ED crisis FD ED
FD ED crisis
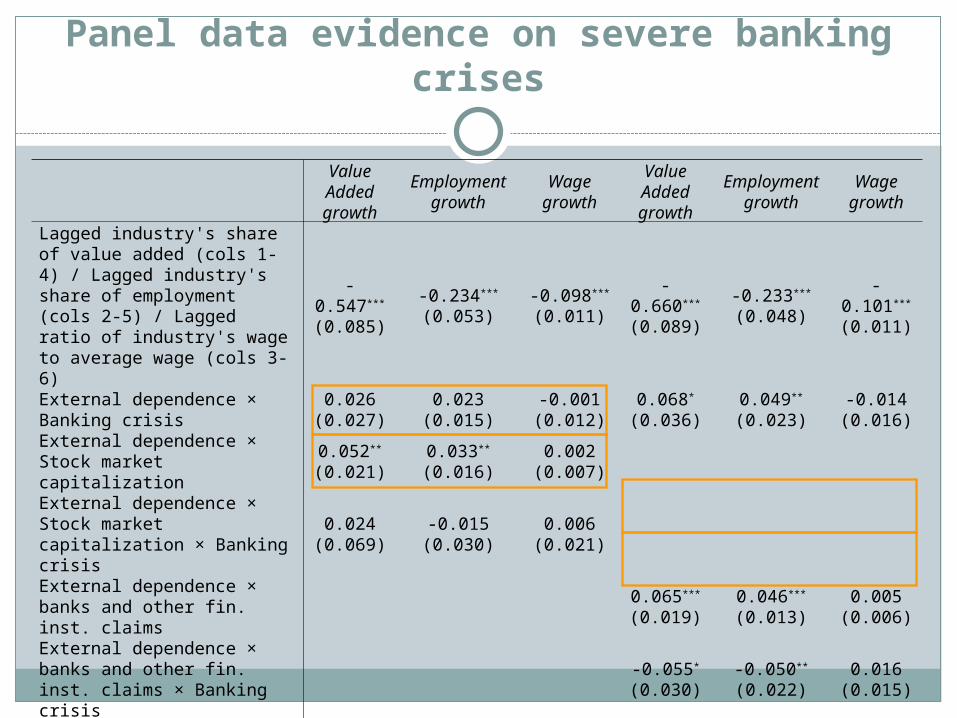
Panel data evidence on severe banking crises
Value Added growth
Employment growth
Wage growth
Value Added growth
Employment growth
Wage growth
Lagged industry's share of value added (cols 1-4) / Lagged industry's share of employment (cols 2-5) / Lagged ratio of industry's wage to average wage (cols 3-6)
-0.547***
(0.085)-0.234***
(0.053)-0.098***
(0.011)-0.660***
(0.089)-0.233***
(0.048)-0.101***
(0.011)
External dependence × Banking crisis
0.026(0.027)
0.023(0.015)
-0.001(0.012)
0.068*
(0.036)0.049**
(0.023)-0.014(0.016)
External dependence × Stock market capitalization
0.052**
(0.021)0.033**
(0.016)0.002
(0.007)
External dependence × Stock market capitalization × Banking crisis
0.024(0.069)
-0.015(0.030)
0.006(0.021)
External dependence × banks and other fin. inst. claims
0.065***
(0.019)0.046***
(0.013)0.005
(0.006)External dependence × banks and other fin. inst. claims × Banking crisis
-0.055*
(0.030)-0.050**
(0.022)0.016
(0.015)
Observations 44856 43293 42033 47431 45533 44265R-squared 0.01 0.01 0.05 0.01 0.01 0.05
Conclusions
Financial development is associated with
more employment growth, but only in non-OECD countries
less employment reallocation (cross-industry dispersion of employment growth)
but more employment reallocation in response to greater variability of shocks to growth opportunities (cross-industry dispersion of stock returns)
Some evidence of a “dark side” of financial development: during crises, employment growth drops more in financially
dependent sectors of countries with more developed financial markets