Embed Size (px)
Citation preview
MARCH INTERNATIONAL
Société d'Investissement à Capital Variable
Semi-Annual Report and UnauditedFinancial Statements
as atJune 30, 2017
R.C.S. Luxembourg B157545

3
MARCH INTERNATIONAL
TABLE OF CONTENTS
STATEMENT OF NET ASSETS......................................................................................................................................................................................... 9STATEMENT OF OPERATIONS AND CHANGES IN NET ASSETS............................................................................................................................ 10CHANGES IN THE NUMBER OF SHARES, IN NET ASSETS AND IN NET ASSET VALUE PER SHARE............................................................. 11STATEMENT OF INVESTMENTS IN SECURITIES AND OTHER NET ASSETS....................................................................................................... 12GEOGRAPHICAL CLASSIFICATION OF THE INVESTMENTS IN SECURITIES...................................................................................................... 18ECONOMIC CLASSIFICATION OF THE INVESTMENTS IN SECURITIES ............................................................................................................... 19
TORRENOVA LUX.................................................................................................................................................................................... .TORRENOVA LUXMARCH INTERNATIONAL - 9
STATEMENT OF NET ASSETS......................................................................................................................................................................................... 20STATEMENT OF OPERATIONS AND CHANGES IN NET ASSETS............................................................................................................................ 21CHANGES IN THE NUMBER OF SHARES, IN NET ASSETS AND IN NET ASSET VALUE PER SHARE............................................................. 22STATEMENT OF INVESTMENTS IN SECURITIES AND OTHER NET ASSETS....................................................................................................... 23GEOGRAPHICAL CLASSIFICATION OF THE INVESTMENTS IN SECURITIES...................................................................................................... 26ECONOMIC CLASSIFICATION OF THE INVESTMENTS IN SECURITIES ............................................................................................................... 27
MARCH VINI CATENA ............................................................................................................................................................................ .MARCH VINI CATENAMARCH INTERNATIONAL - 20
STATEMENT OF NET ASSETS......................................................................................................................................................................................... 28STATEMENT OF OPERATIONS AND CHANGES IN NET ASSETS............................................................................................................................ 29CHANGES IN THE NUMBER OF SHARES, IN NET ASSETS AND IN NET ASSET VALUE PER SHARE............................................................. 30STATEMENT OF INVESTMENTS IN SECURITIES AND OTHER NET ASSETS....................................................................................................... 31GEOGRAPHICAL CLASSIFICATION OF THE INVESTMENTS IN SECURITIES...................................................................................................... 33ECONOMIC CLASSIFICATION OF THE INVESTMENTS IN SECURITIES ............................................................................................................... 34
VALORES IBERIAN EQUITY.................................................................................................................................................................. .VALORES IBERIAN EQUITYMARCH INTERNATIONAL - 28
STATEMENT OF NET ASSETS......................................................................................................................................................................................... 35STATEMENT OF OPERATIONS AND CHANGES IN NET ASSETS............................................................................................................................ 36CHANGES IN THE NUMBER OF SHARES, IN NET ASSETS AND IN NET ASSET VALUE PER SHARE............................................................. 37STATEMENT OF INVESTMENTS IN SECURITIES AND OTHER NET ASSETS....................................................................................................... 38GEOGRAPHICAL CLASSIFICATION OF THE INVESTMENTS IN SECURITIES...................................................................................................... 41ECONOMIC CLASSIFICATION OF THE INVESTMENTS IN SECURITIES ............................................................................................................... 42
NOTES TO THE FINANCIAL STATEMENTS....................................................................................................................................... . 43
THE FAMILY BUSINESSES FUND......................................................................................................................................................... .THE FAMILY BUSINESSES FUNDMARCH INTERNATIONAL - 35
DIRECTORS AND ADMINISTRATION................................................................................................................................................. . 4
INFORMATION TO THE SHAREHOLDERS, NET ASSET VALUE PER SHARE AND OTHER INFORMATION........................ . 6
COMBINED STATEMENT OF NET ASSETS ........................................................................................................................................ . 7
COMBINED STATEMENT OF OPERATIONS AND CHANGES IN NET ASSETS ........................................................................... . 8
MARCH INTERNATIONAL
4
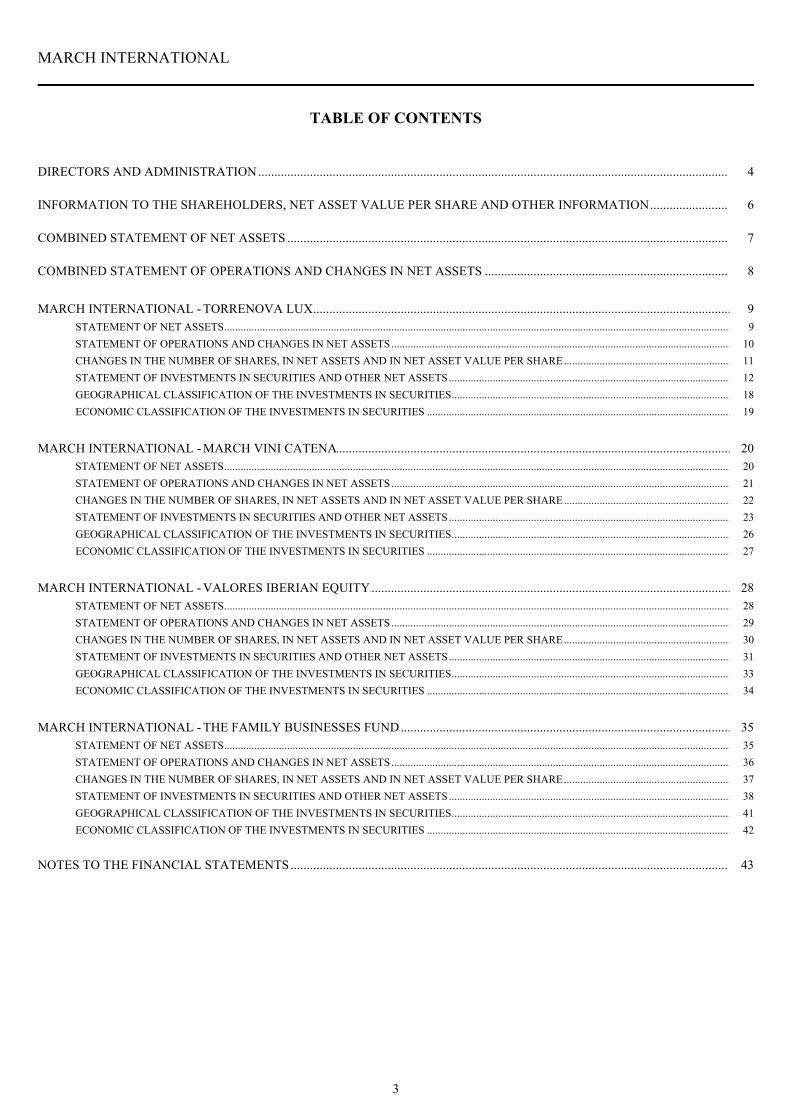
DIRECTORS AND ADMINISTRATION
REGISTERED OFFICE 20, Boulevard Emmanuel Servais L-2535 Luxembourg Grand-Duchy of Luxembourg BOARD OF DIRECTORS OF THE COMPANY Iñigo Damborenea Agorria Chairman Head of Legal Advice March A.M. SGIIC SA - Madrid Enrique Ruiz Crespo Director Banca March, S.A. José Ramón Aranda Godlewski Director Banca March, S.A. Maria Luisa Piñel Rubio Director March A.M. MANAGEMENT COMPANY, ADMINISTRATIVE AGENT, PAYING AGENT AND LISTING AGENT Edmond de Rothschild Asset Management (Luxembourg) 20, Boulevard Emmanuel Servais L-2535 Luxembourg Grand-Duchy of Luxembourg DEPOSITARY AND DOMICILIARY AGENT Edmond de Rothschild (Europe) 20, Boulevard Emmanuel Servais L-2535 Luxembourg Grand-Duchy of Luxembourg INVESTMENT MANAGER AND GLOBAL DISTRIBUTOR March A.M. SGIIC SA Calle de Castelló, 74 E-28006 Madrid Spain INDEPENDENT AUDITOR (CABINET DE REVISION AGREE) Deloitte Audit, Société à responsabilité limitée 560, Rue de Neudorf L-2220 Luxembourg Grand-Duchy of Luxembourg
LEGAL ADVISER Allen & Overy Luxembourg, Société en Commandite simple 33, Avenue J.F. Kennedy L-1855 Luxembourg Grand-Duchy of Luxembourg FUND REGISTRATION SERVICES (LUXEMBOURG, SPAIN, ITALY, UK, GERMANY, AUSTRIA), FUND MAINTENANCE AND REGULATORY REPORTING SERVICES Deloitte S.A. 560, Rue de Neudorf L-2220 Luxembourg Grand-Duchy of Luxembourg PAYING AND INFORMATION AGENT IN GERMANY Marcard, Stein & Co AG Ballindamm 36 D-20095 Hamburg Germany PAYING AND INFORMATION AGENT IN FRANCE CACEIS Bank 1/3, Place Valhubert F-75206 Paris Cedex 13 France PAYING AND INFORMATION AGENT IN AUSTRIA Erste Bank der Oesterreichischen Sparkassen AG Graben 21, A-1010 Vienna Austria PAYING AND INFORMATION AGENT IN SPAIN Allfunds Bank S.A. Madrid, Estafeta, 6 La Moraleja Complejo Plaza de la Fuente Alcobendas 28109 Spain

MARCH INTERNATIONAL
5
DIRECTORS AND ADMINISTRATION (continued)
PAYING AND INFORMATION AGENT IN ITALY State Street Bank S.p.a. Via Ferrante Aporti 10, 20125 Milan Italy Allfunds Bank S.A., Milan Branch Via Santa Margherita 7, 20121 Milan Italy
MARCH INTERNATIONAL
6
INFORMATION TO THE SHAREHOLDERS
Notices concerning MARCH INTERNATIONAL (the "Company") are published in newspapers designated by the Board of Directors of the Company and, if prescribed by law, are published in the Recueil Electronique des Sociétés et Associations (the “RESA”), the official gazette of Luxembourg, and are lodged with the Registrar of the Luxembourg District Court. The current Articles of Incorporation of the Company are lodged with the Registrar of the Luxembourg District Court, from whom copies may be obtained. The issue price and the net asset value of the Company shares are made public at the Registered Office of the Company, where annual reports may be obtained.
The shares of all Sub-Funds are listed on the Luxembourg Stock Exchange. Subscriptions cannot be received on the basis of financial reports. Subscriptions are valid only if made on the basis of the current Prospectus and the Key Investor Information Document (the “KIID”)(www.edmond-de-rothschild.com. (Section Institutional & Fund services, Presentation, NAV Centre)), supplemented by the last annual report, and the most recent semi-annual report, if published thereafter.
NET ASSET VALUE PER SHARE The Net Asset Value of each Sub-Fund is calculated in the Reference Currency of the relevant Sub-Fund or Class, as stipulated in the relevant Special Section of the current Prospectus, and is determined by the Management Company (or its sub-contractor) as on each Valuation Day as explained in the relevant Special Section of the Prospectus, by calculating the aggregate of: - the value of all assets of the Company which are allocated to the relevant Sub-Fund in accordance with the provisions of the Articles; less - all the liabilities of the Company which are allocated to the relevant Sub-Fund in accordance with the provisions of the Articles, and all fees attributable to the relevant Sub-Fund, which fees have been accrued but are unpaid on the relevant Valuation Day.
The Net Asset Value per Share is calculated in the Reference Currency of the relevant Sub-Fund by the Management Company (or its sub-contractor) at the Valuation Day of the relevant Sub-Fund by dividing the Net Asset Value of the relevant Sub-Fund by the number of Shares which are in issue on such Valuation Day in the relevant Sub-Fund (including Shares in relation to which a Shareholder has requested redemption on such Valuation Day).
OTHER INFORMATION
Securities Financing Transactions and of Reuse Regulation (“SFTR”) The Company does not use any instruments falling into the scope of SFTR.
7
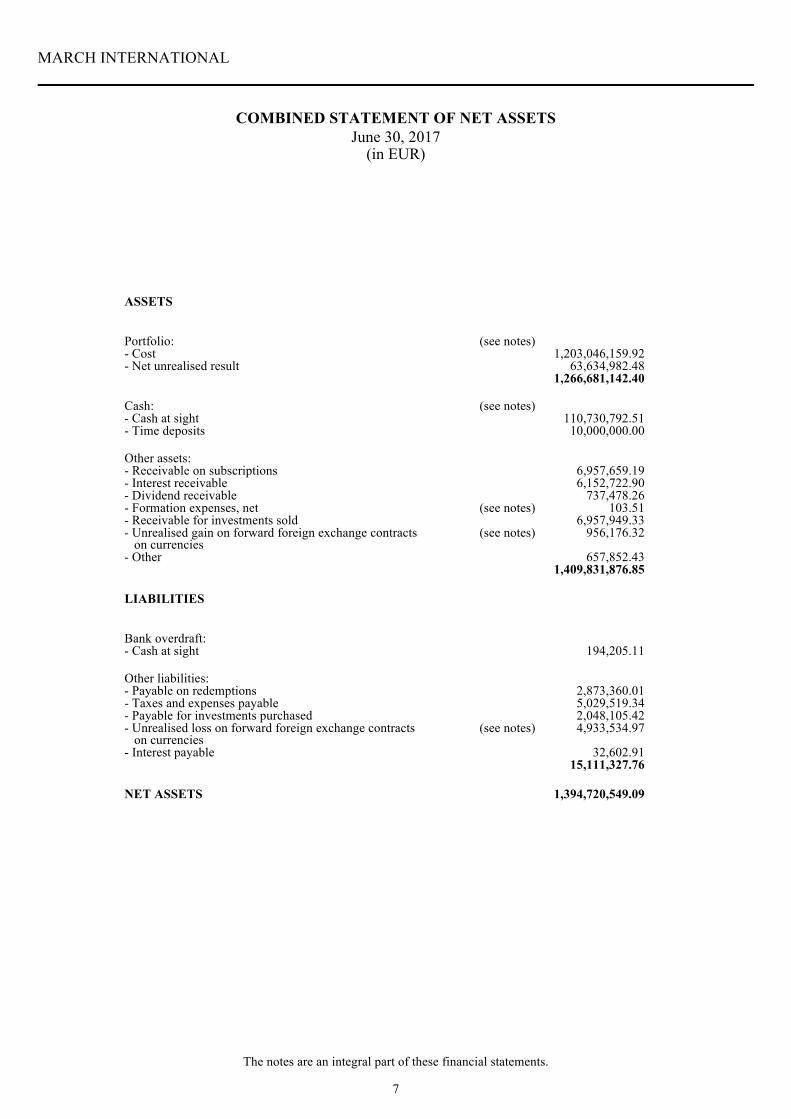
MARCH INTERNATIONAL
COMBINED STATEMENT OF NET ASSETSJune 30, 2017
ASSETS
Portfolio: (see notes)1,203,046,159.92- Cost
63,634,982.48- Net unrealised result1,266,681,142.40
Cash: (see notes)110,730,792.51- Cash at sight
10,000,000.00- Time deposits
Other assets:6,957,659.19- Receivable on subscriptions6,152,722.90- Interest receivable
737,478.26- Dividend receivable103.51- Formation expenses, net (see notes)
6,957,949.33- Receivable for investments sold956,176.32- Unrealised gain on forward foreign exchange contracts
on currencies(see notes)
657,852.43- Other1,409,831,876.85
LIABILITIES
Bank overdraft:194,205.11- Cash at sight
Other liabilities:2,873,360.01- Payable on redemptions5,029,519.34- Taxes and expenses payable2,048,105.42- Payable for investments purchased4,933,534.97- Unrealised loss on forward foreign exchange contracts
on currencies(see notes)
32,602.91- Interest payable15,111,327.76
NET ASSETS 1,394,720,549.09
(in EUR)
The notes are an integral part of these financial statements.
8
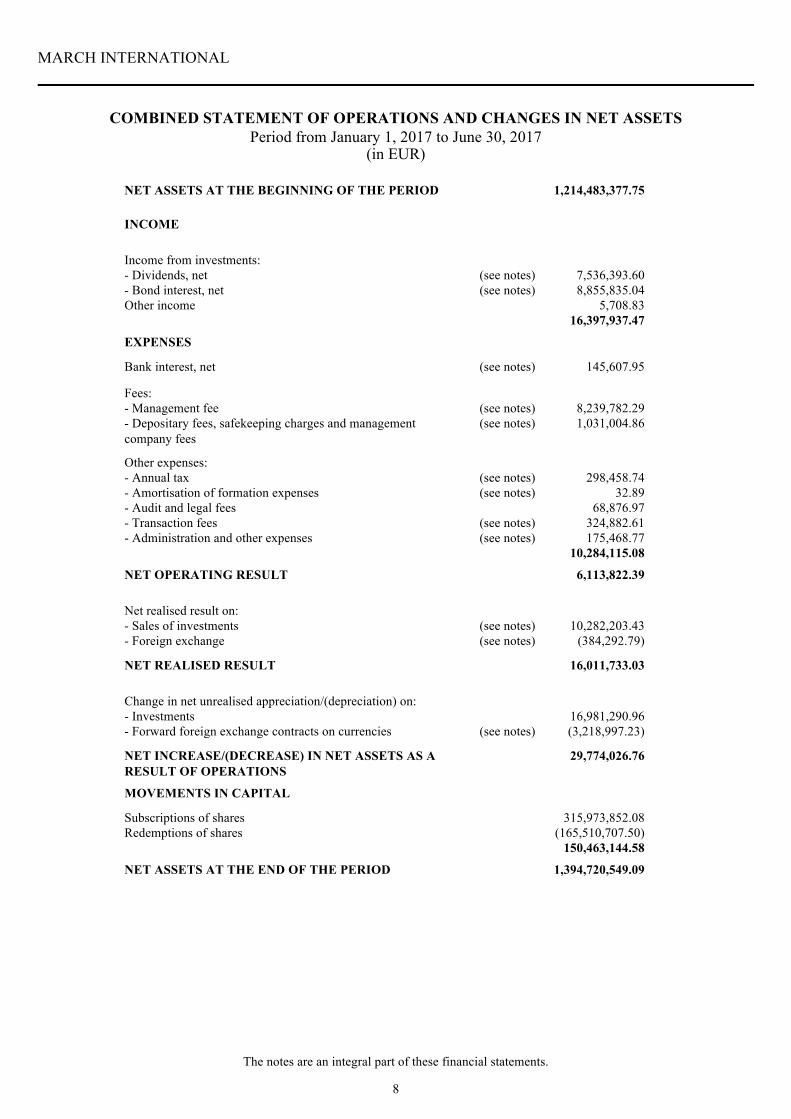
MARCH INTERNATIONAL
COMBINED STATEMENT OF OPERATIONS AND CHANGES IN NET ASSETSPeriod from January 1, 2017 to June 30, 2017
NET ASSETS AT THE BEGINNING OF THE PERIOD 1,214,483,377.75
INCOME
Income from investments:- Dividends, net (see notes) 7,536,393.60- Bond interest, net (see notes) 8,855,835.04Other income 5,708.83
16,397,937.47
EXPENSES
Bank interest, net (see notes) 145,607.95
Fees:- Management fee (see notes) 8,239,782.29- Depositary fees, safekeeping charges and managementcompany fees
(see notes) 1,031,004.86
Other expenses:- Annual tax (see notes) 298,458.74- Amortisation of formation expenses (see notes) 32.89- Audit and legal fees 68,876.97- Transaction fees (see notes) 324,882.61- Administration and other expenses (see notes) 175,468.77
10,284,115.08
NET OPERATING RESULT 6,113,822.39
Net realised result on:- Sales of investments (see notes) 10,282,203.43- Foreign exchange (see notes) (384,292.79)
NET REALISED RESULT 16,011,733.03
Change in net unrealised appreciation/(depreciation) on:- Investments 16,981,290.96- Forward foreign exchange contracts on currencies (see notes) (3,218,997.23)
NET INCREASE/(DECREASE) IN NET ASSETS AS ARESULT OF OPERATIONS
29,774,026.76
MOVEMENTS IN CAPITAL
Subscriptions of shares 315,973,852.08Redemptions of shares (165,510,707.50)
150,463,144.58
NET ASSETS AT THE END OF THE PERIOD 1,394,720,549.09
(in EUR)
The notes are an integral part of these financial statements.
9
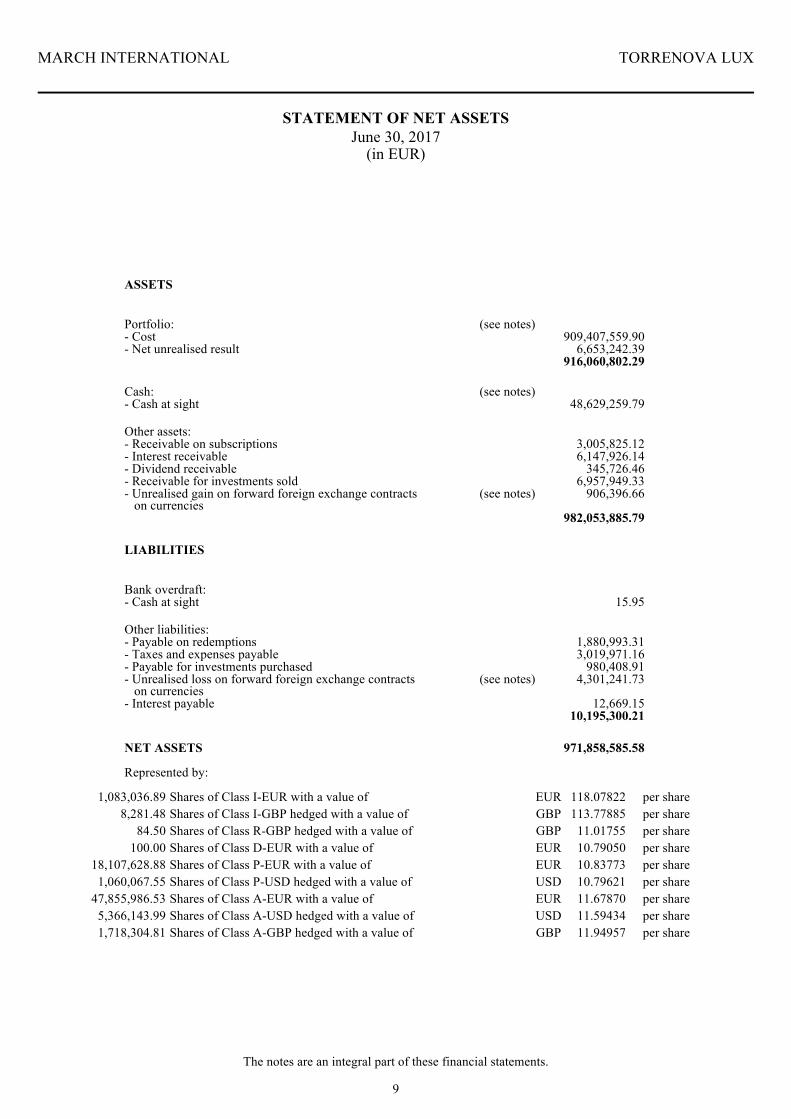
MARCH INTERNATIONAL TORRENOVA LUX
STATEMENT OF NET ASSETSJune 30, 2017
(in EUR)
The notes are an integral part of these financial statements.
ASSETS
Portfolio: (see notes)- Cost 909,407,559.90- Net unrealised result 6,653,242.39
916,060,802.29
Cash: (see notes)- Cash at sight 48,629,259.79
Other assets:- Receivable on subscriptions 3,005,825.12- Interest receivable 6,147,926.14- Dividend receivable 345,726.46- Receivable for investments sold 6,957,949.33- Unrealised gain on forward foreign exchange contracts on currencies
(see notes) 906,396.66
982,053,885.79
LIABILITIES
Bank overdraft:- Cash at sight 15.95
Other liabilities:- Payable on redemptions 1,880,993.31- Taxes and expenses payable 3,019,971.16- Payable for investments purchased 980,408.91- Unrealised loss on forward foreign exchange contracts on currencies
(see notes) 4,301,241.73
- Interest payable 12,669.1510,195,300.21
NET ASSETS 971,858,585.58
1,083,036.89 118.07822 per shareEURShares of Class I-EUR with a value of8,281.48 113.77885 per shareGBPShares of Class I-GBP hedged with a value of
84.50 11.01755 per shareGBPShares of Class R-GBP hedged with a value of100.00 10.79050 per shareEURShares of Class D-EUR with a value of
18,107,628.88 10.83773 per shareEURShares of Class P-EUR with a value of1,060,067.55 10.79621 per shareUSDShares of Class P-USD hedged with a value of
47,855,986.53 11.67870 per shareEURShares of Class A-EUR with a value of5,366,143.99 11.59434 per shareUSDShares of Class A-USD hedged with a value of1,718,304.81 11.94957 per shareGBPShares of Class A-GBP hedged with a value of
Represented by:
10
MARCH INTERNATIONAL TORRENOVA LUX
STATEMENT OF OPERATIONS AND CHANGES IN NET ASSETSPeriod from January 1, 2017 to June 30, 2017
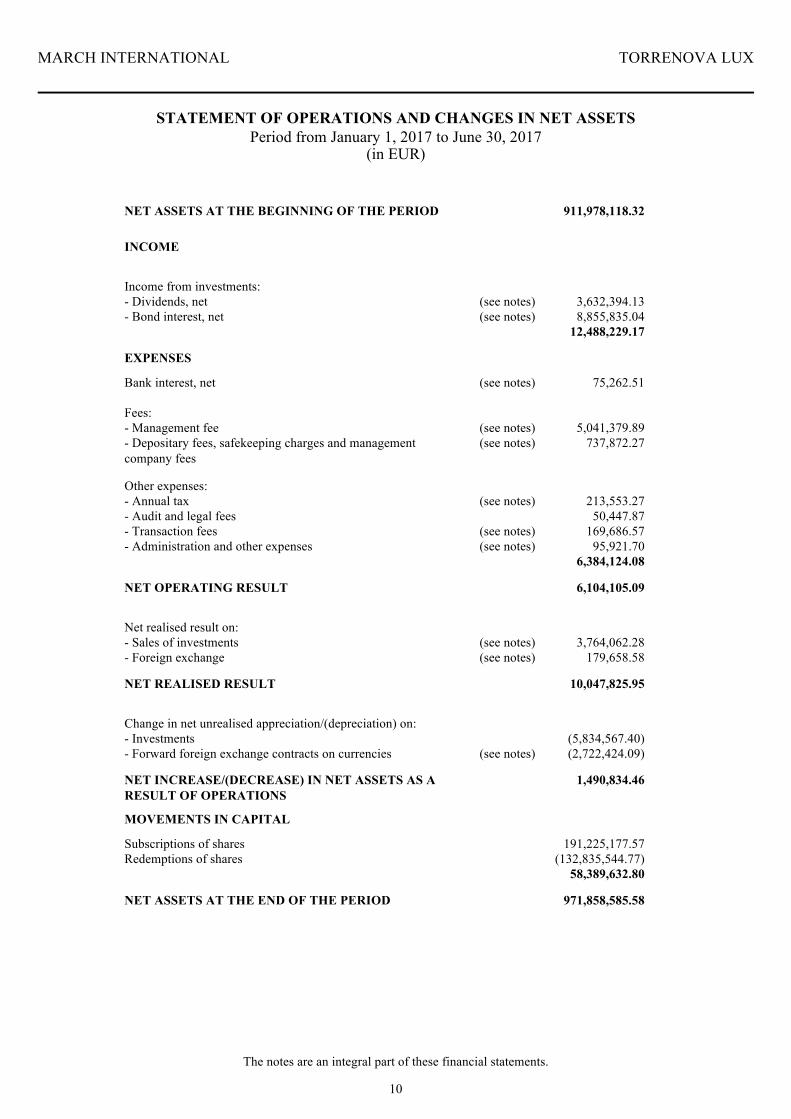
NET ASSETS AT THE BEGINNING OF THE PERIOD 911,978,118.32
INCOME
Income from investments:- Dividends, net (see notes) 3,632,394.13- Bond interest, net (see notes) 8,855,835.04
12,488,229.17
EXPENSES
Bank interest, net (see notes) 75,262.51
Fees:- Management fee (see notes) 5,041,379.89- Depositary fees, safekeeping charges and managementcompany fees
(see notes) 737,872.27
Other expenses:- Annual tax (see notes) 213,553.27- Audit and legal fees 50,447.87- Transaction fees (see notes) 169,686.57- Administration and other expenses (see notes) 95,921.70
6,384,124.08
NET OPERATING RESULT 6,104,105.09
Net realised result on:- Sales of investments (see notes) 3,764,062.28- Foreign exchange (see notes) 179,658.58
NET REALISED RESULT 10,047,825.95
Change in net unrealised appreciation/(depreciation) on:- Investments (5,834,567.40)- Forward foreign exchange contracts on currencies (see notes) (2,722,424.09)
NET INCREASE/(DECREASE) IN NET ASSETS AS ARESULT OF OPERATIONS
1,490,834.46
MOVEMENTS IN CAPITAL
Subscriptions of shares 191,225,177.57Redemptions of shares (132,835,544.77)
58,389,632.80
NET ASSETS AT THE END OF THE PERIOD 971,858,585.58
(in EUR)
The notes are an integral part of these financial statements.
11
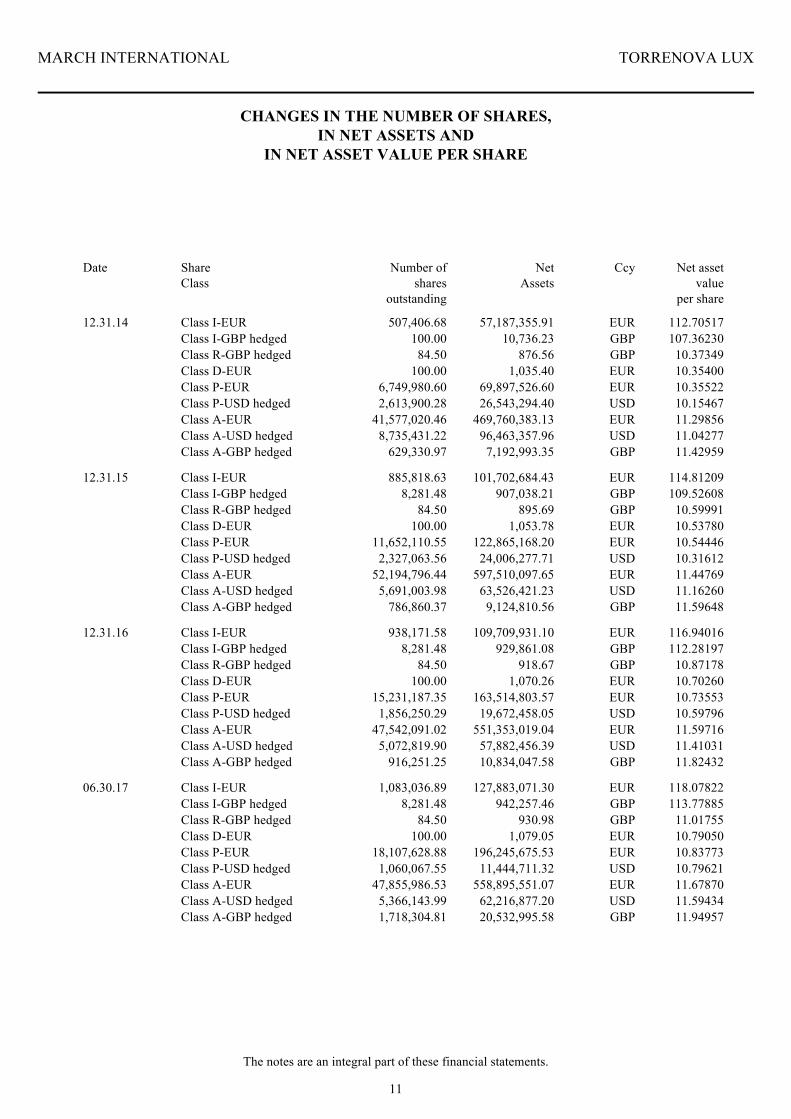
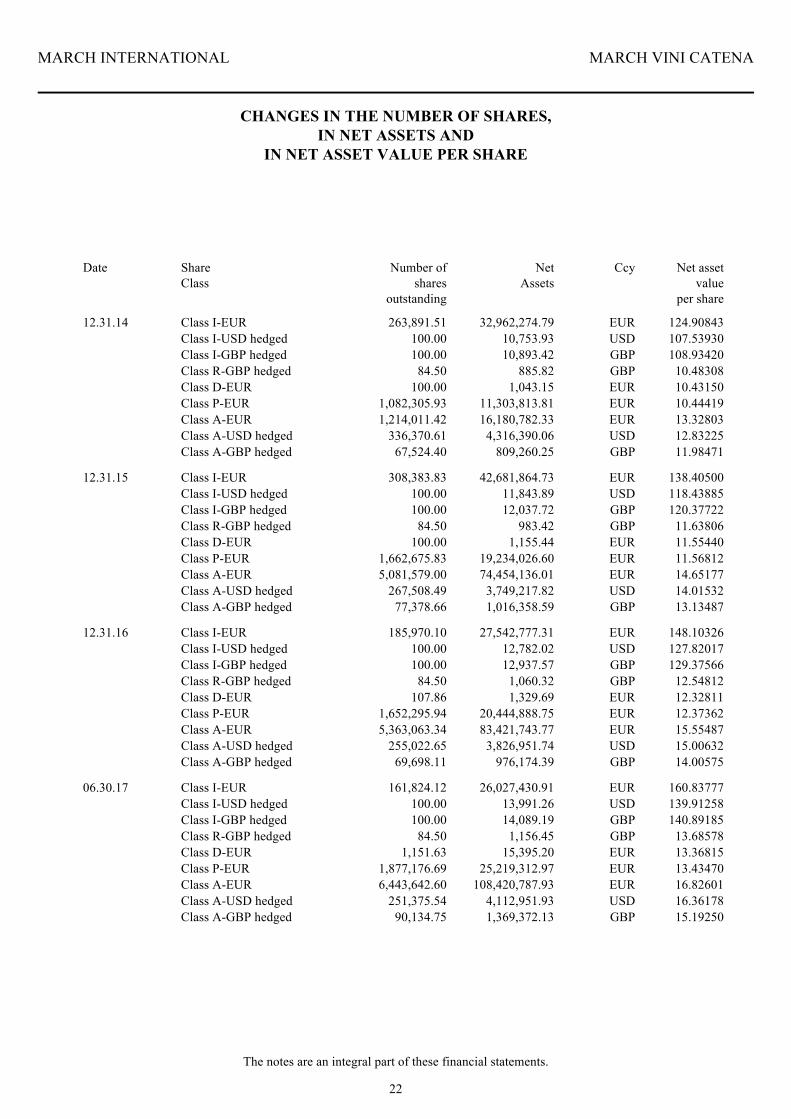
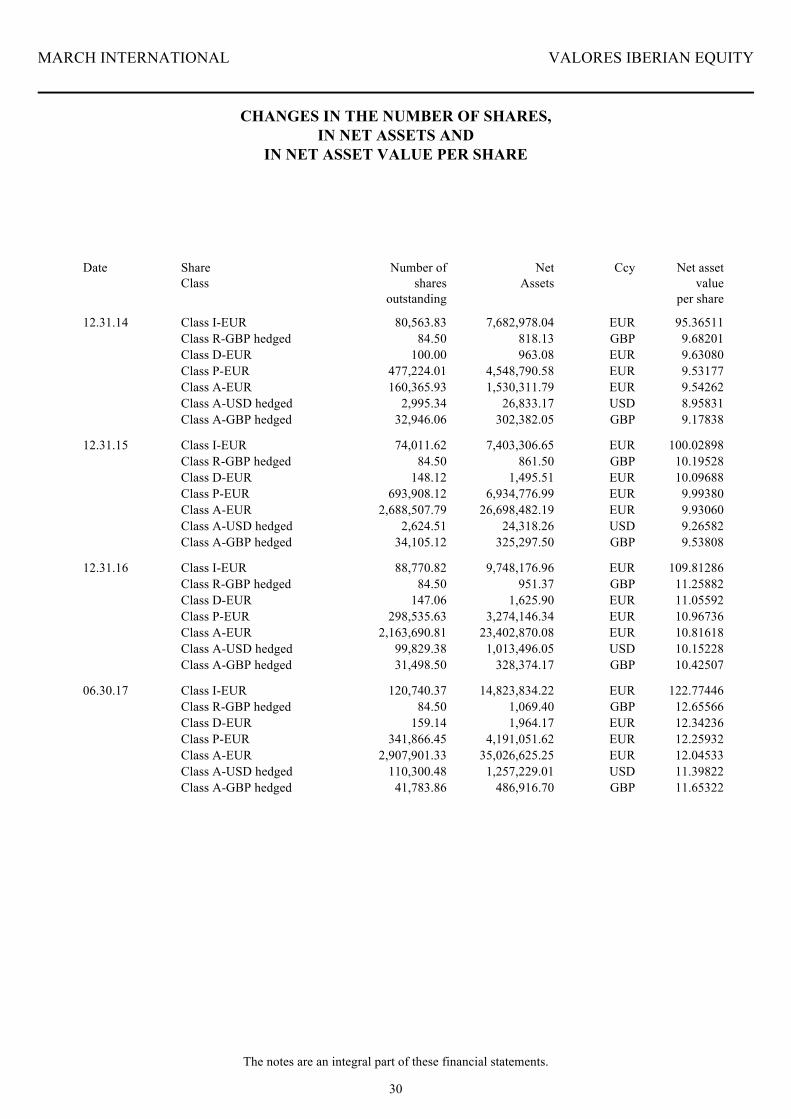
MARCH INTERNATIONAL TORRENOVA LUX
CHANGES IN THE NUMBER OF SHARES,IN NET ASSETS AND
IN NET ASSET VALUE PER SHARE
Date ShareClass
Number of shares
outstanding
NetAssets
Ccy Net assetvalue
per share
507,406.68 112.7051757,187,355.9112.31.14 Class I-EUR EUR100.00 107.3623010,736.23Class I-GBP hedged GBP
84.50 10.37349876.56Class R-GBP hedged GBP100.00 10.354001,035.40Class D-EUR EUR
6,749,980.60 10.3552269,897,526.60Class P-EUR EUR2,613,900.28 10.1546726,543,294.40Class P-USD hedged USD
41,577,020.46 11.29856469,760,383.13Class A-EUR EUR8,735,431.22 11.0427796,463,357.96Class A-USD hedged USD
629,330.97 11.429597,192,993.35Class A-GBP hedged GBP
885,818.63 114.81209101,702,684.43Class I-EUR EUR12.31.158,281.48 109.52608907,038.21Class I-GBP hedged GBP
84.50 10.59991895.69Class R-GBP hedged GBP100.00 10.537801,053.78Class D-EUR EUR
11,652,110.55 10.54446122,865,168.20Class P-EUR EUR2,327,063.56 10.3161224,006,277.71Class P-USD hedged USD
52,194,796.44 11.44769597,510,097.65Class A-EUR EUR5,691,003.98 11.1626063,526,421.23Class A-USD hedged USD
786,860.37 11.596489,124,810.56Class A-GBP hedged GBP
938,171.58 116.94016109,709,931.10Class I-EUR12.31.16 EUR8,281.48 112.28197929,861.08Class I-GBP hedged GBP
84.50 10.87178918.67Class R-GBP hedged GBP100.00 10.702601,070.26Class D-EUR EUR
15,231,187.35 10.73553163,514,803.57Class P-EUR EUR1,856,250.29 10.5979619,672,458.05Class P-USD hedged USD
47,542,091.02 11.59716551,353,019.04Class A-EUR EUR5,072,819.90 11.4103157,882,456.39Class A-USD hedged USD
916,251.25 11.8243210,834,047.58Class A-GBP hedged GBP
1,083,036.89 118.07822127,883,071.30Class I-EUR06.30.17 EUR8,281.48 113.77885942,257.46Class I-GBP hedged GBP
84.50 11.01755930.98Class R-GBP hedged GBP100.00 10.790501,079.05Class D-EUR EUR
18,107,628.88 10.83773196,245,675.53Class P-EUR EUR1,060,067.55 10.7962111,444,711.32Class P-USD hedged USD
47,855,986.53 11.67870558,895,551.07Class A-EUR EUR5,366,143.99 11.5943462,216,877.20Class A-USD hedged USD1,718,304.81 11.9495720,532,995.58Class A-GBP hedged GBP
The notes are an integral part of these financial statements.
12
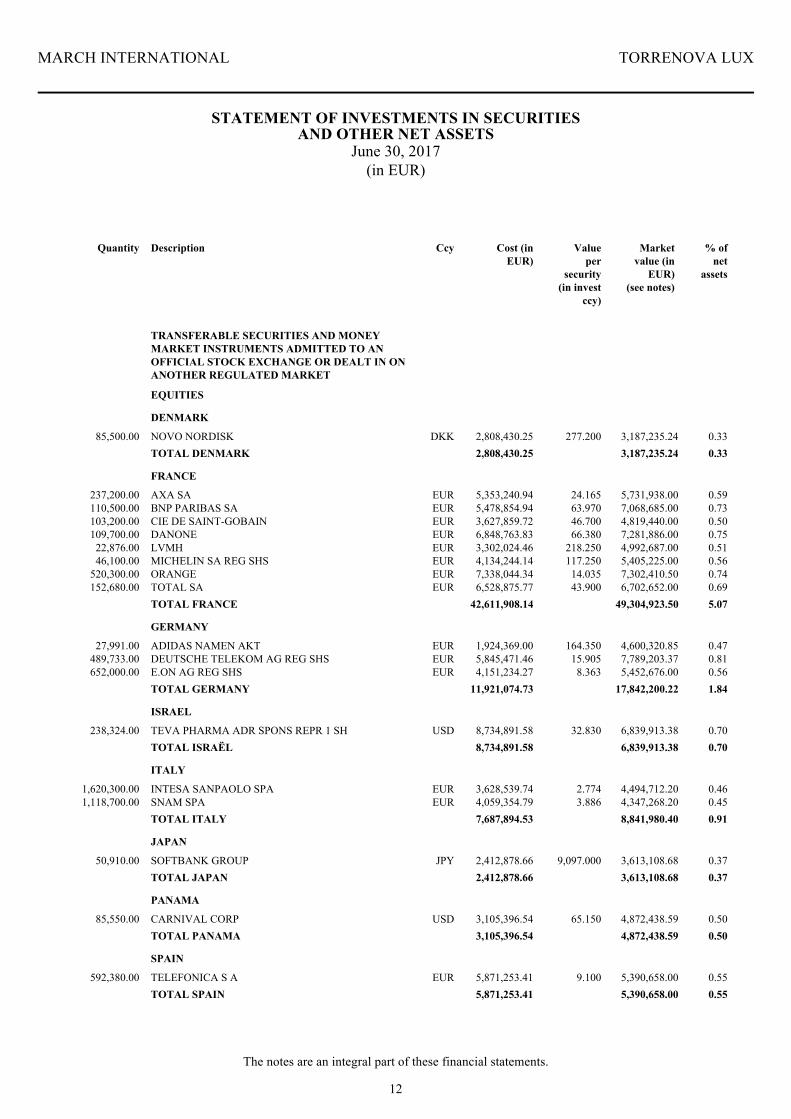
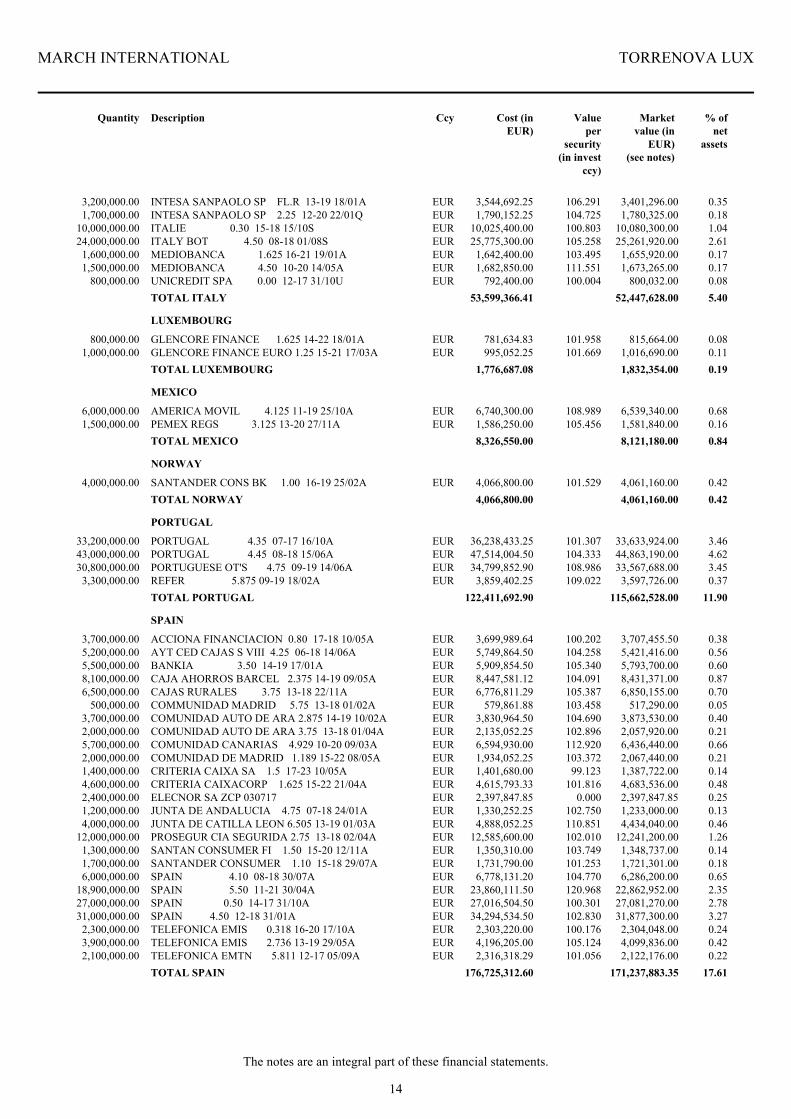
MARCH INTERNATIONAL TORRENOVA LUX
STATEMENT OF INVESTMENTS IN SECURITIESAND OTHER NET ASSETS
June 30, 2017(in EUR)
The notes are an integral part of these financial statements.
Quantity Description Cost (inEUR)
Valueper
security(in invest
ccy)
Marketvalue (in
EUR)(see notes)
% ofnet
assets
85,500.00 NOVO NORDISK DKK 277.200 3,187,235.24 0.332,808,430.25
DENMARK
EQUITIES
TRANSFERABLE SECURITIES AND MONEYMARKET INSTRUMENTS ADMITTED TO ANOFFICIAL STOCK EXCHANGE OR DEALT IN ONANOTHER REGULATED MARKET
0.333,187,235.242,808,430.25TOTAL DENMARK
237,200.00 AXA SA EUR 24.165 5,731,938.00 0.595,353,240.94
FRANCE
110,500.00 BNP PARIBAS SA EUR 63.970 7,068,685.00 0.735,478,854.94103,200.00 CIE DE SAINT-GOBAIN EUR 46.700 4,819,440.00 0.503,627,859.72109,700.00 DANONE EUR 66.380 7,281,886.00 0.756,848,763.83
22,876.00 LVMH EUR 218.250 4,992,687.00 0.513,302,024.4646,100.00 MICHELIN SA REG SHS EUR 117.250 5,405,225.00 0.564,134,244.14
520,300.00 ORANGE EUR 14.035 7,302,410.50 0.747,338,044.34152,680.00 TOTAL SA EUR 43.900 6,702,652.00 0.696,528,875.77
5.0749,304,923.5042,611,908.14TOTAL FRANCE
27,991.00 ADIDAS NAMEN AKT EUR 164.350 4,600,320.85 0.471,924,369.00
GERMANY
489,733.00 DEUTSCHE TELEKOM AG REG SHS EUR 15.905 7,789,203.37 0.815,845,471.46652,000.00 E.ON AG REG SHS EUR 8.363 5,452,676.00 0.564,151,234.27
1.8417,842,200.2211,921,074.73TOTAL GERMANY
238,324.00 TEVA PHARMA ADR SPONS REPR 1 SH USD 32.830 6,839,913.38 0.708,734,891.58
ISRAEL
0.706,839,913.388,734,891.58TOTAL ISRAËL
1,620,300.00 INTESA SANPAOLO SPA EUR 2.774 4,494,712.20 0.463,628,539.74
ITALY
1,118,700.00 SNAM SPA EUR 3.886 4,347,268.20 0.454,059,354.790.918,841,980.407,687,894.53TOTAL ITALY
50,910.00 SOFTBANK GROUP JPY 9,097.000 3,613,108.68 0.372,412,878.66
JAPAN
0.373,613,108.682,412,878.66TOTAL JAPAN
85,550.00 CARNIVAL CORP USD 65.150 4,872,438.59 0.503,105,396.54
PANAMA
0.504,872,438.593,105,396.54TOTAL PANAMA
592,380.00 TELEFONICA S A EUR 9.100 5,390,658.00 0.555,871,253.41
SPAIN
0.555,390,658.005,871,253.41TOTAL SPAIN
Ccy
13
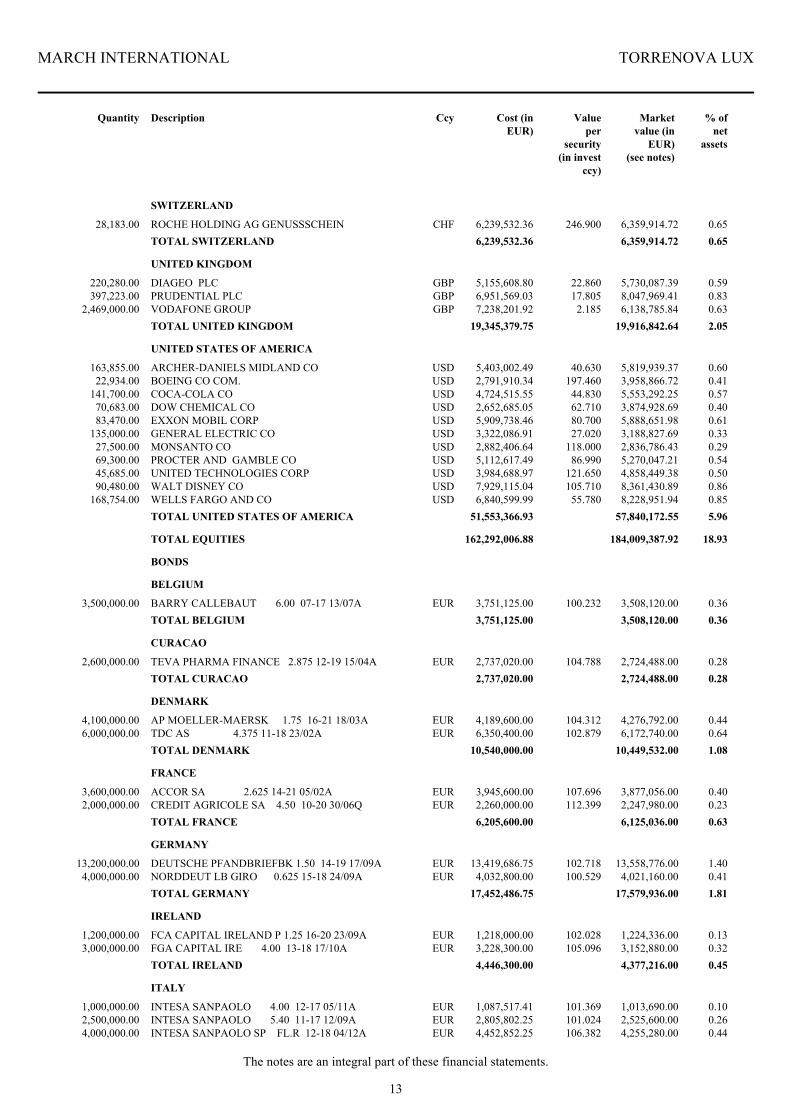
MARCH INTERNATIONAL TORRENOVA LUX
The notes are an integral part of these financial statements.
Quantity Description Cost (inEUR)
Valueper
security(in invest
ccy)
Marketvalue (in
EUR)(see notes)
% ofnet
assets
28,183.00 ROCHE HOLDING AG GENUSSSCHEIN CHF 246.900 6,359,914.72 0.656,239,532.36
SWITZERLAND
0.656,359,914.726,239,532.36TOTAL SWITZERLAND
220,280.00 DIAGEO PLC GBP 22.860 5,730,087.39 0.595,155,608.80
UNITED KINGDOM
397,223.00 PRUDENTIAL PLC GBP 17.805 8,047,969.41 0.836,951,569.032,469,000.00 VODAFONE GROUP GBP 2.185 6,138,785.84 0.637,238,201.92
2.0519,916,842.6419,345,379.75TOTAL UNITED KINGDOM
163,855.00 ARCHER-DANIELS MIDLAND CO USD 40.630 5,819,939.37 0.605,403,002.49
UNITED STATES OF AMERICA
22,934.00 BOEING CO COM. USD 197.460 3,958,866.72 0.412,791,910.34141,700.00 COCA-COLA CO USD 44.830 5,553,292.25 0.574,724,515.55
70,683.00 DOW CHEMICAL CO USD 62.710 3,874,928.69 0.402,652,685.0583,470.00 EXXON MOBIL CORP USD 80.700 5,888,651.98 0.615,909,738.46
135,000.00 GENERAL ELECTRIC CO USD 27.020 3,188,827.69 0.333,322,086.9127,500.00 MONSANTO CO USD 118.000 2,836,786.43 0.292,882,406.6469,300.00 PROCTER AND GAMBLE CO USD 86.990 5,270,047.21 0.545,112,617.4945,685.00 UNITED TECHNOLOGIES CORP USD 121.650 4,858,449.38 0.503,984,688.9790,480.00 WALT DISNEY CO USD 105.710 8,361,430.89 0.867,929,115.04
168,754.00 WELLS FARGO AND CO USD 55.780 8,228,951.94 0.856,840,599.995.9657,840,172.5551,553,366.93TOTAL UNITED STATES OF AMERICA
TOTAL EQUITIES 18.93184,009,387.92162,292,006.88
3,500,000.00 BARRY CALLEBAUT 6.00 07-17 13/07A EUR 100.232 3,508,120.00 0.363,751,125.00
BELGIUM
BONDS
0.363,508,120.003,751,125.00TOTAL BELGIUM
2,600,000.00 TEVA PHARMA FINANCE 2.875 12-19 15/04A EUR 104.788 2,724,488.00 0.282,737,020.00
CURACAO
0.282,724,488.002,737,020.00TOTAL CURACAO
4,100,000.00 AP MOELLER-MAERSK 1.75 16-21 18/03A EUR 104.312 4,276,792.00 0.444,189,600.00
DENMARK
6,000,000.00 TDC AS 4.375 11-18 23/02A EUR 102.879 6,172,740.00 0.646,350,400.001.0810,449,532.0010,540,000.00TOTAL DENMARK
3,600,000.00 ACCOR SA 2.625 14-21 05/02A EUR 107.696 3,877,056.00 0.403,945,600.00
FRANCE
2,000,000.00 CREDIT AGRICOLE SA 4.50 10-20 30/06Q EUR 112.399 2,247,980.00 0.232,260,000.000.636,125,036.006,205,600.00TOTAL FRANCE
13,200,000.00 DEUTSCHE PFANDBRIEFBK 1.50 14-19 17/09A EUR 102.718 13,558,776.00 1.4013,419,686.75
GERMANY
4,000,000.00 NORDDEUT LB GIRO 0.625 15-18 24/09A EUR 100.529 4,021,160.00 0.414,032,800.001.8117,579,936.0017,452,486.75TOTAL GERMANY
1,200,000.00 FCA CAPITAL IRELAND P 1.25 16-20 23/09A EUR 102.028 1,224,336.00 0.131,218,000.00
IRELAND
3,000,000.00 FGA CAPITAL IRE 4.00 13-18 17/10A EUR 105.096 3,152,880.00 0.323,228,300.000.454,377,216.004,446,300.00TOTAL IRELAND
1,000,000.00 INTESA SANPAOLO 4.00 12-17 05/11A EUR 101.369 1,013,690.00 0.101,087,517.41
ITALY
2,500,000.00 INTESA SANPAOLO 5.40 11-17 12/09A EUR 101.024 2,525,600.00 0.262,805,802.254,000,000.00 INTESA SANPAOLO SP FL.R 12-18 04/12A EUR 106.382 4,255,280.00 0.444,452,852.25
Ccy
14
MARCH INTERNATIONAL TORRENOVA LUX
The notes are an integral part of these financial statements.
Quantity Description Cost (inEUR)
Valueper
security(in invest
ccy)
Marketvalue (in
EUR)(see notes)
% ofnet
assets
3,200,000.00 INTESA SANPAOLO SP FL.R 13-19 18/01A EUR 106.291 3,401,296.00 0.353,544,692.251,700,000.00 INTESA SANPAOLO SP 2.25 12-20 22/01Q EUR 104.725 1,780,325.00 0.181,790,152.25
10,000,000.00 ITALIE 0.30 15-18 15/10S EUR 100.803 10,080,300.00 1.0410,025,400.0024,000,000.00 ITALY BOT 4.50 08-18 01/08S EUR 105.258 25,261,920.00 2.6125,775,300.00
1,600,000.00 MEDIOBANCA 1.625 16-21 19/01A EUR 103.495 1,655,920.00 0.171,642,400.001,500,000.00 MEDIOBANCA 4.50 10-20 14/05A EUR 111.551 1,673,265.00 0.171,682,850.00
800,000.00 UNICREDIT SPA 0.00 12-17 31/10U EUR 100.004 800,032.00 0.08792,400.005.4052,447,628.0053,599,366.41TOTAL ITALY
800,000.00 GLENCORE FINANCE 1.625 14-22 18/01A EUR 101.958 815,664.00 0.08781,634.83
LUXEMBOURG
1,000,000.00 GLENCORE FINANCE EURO 1.25 15-21 17/03A EUR 101.669 1,016,690.00 0.11995,052.250.191,832,354.001,776,687.08TOTAL LUXEMBOURG
6,000,000.00 AMERICA MOVIL 4.125 11-19 25/10A EUR 108.989 6,539,340.00 0.686,740,300.00
MEXICO
1,500,000.00 PEMEX REGS 3.125 13-20 27/11A EUR 105.456 1,581,840.00 0.161,586,250.000.848,121,180.008,326,550.00TOTAL MEXICO
4,000,000.00 SANTANDER CONS BK 1.00 16-19 25/02A EUR 101.529 4,061,160.00 0.424,066,800.00
NORWAY
0.424,061,160.004,066,800.00TOTAL NORWAY
33,200,000.00 PORTUGAL 4.35 07-17 16/10A EUR 101.307 33,633,924.00 3.4636,238,433.25
PORTUGAL
43,000,000.00 PORTUGAL 4.45 08-18 15/06A EUR 104.333 44,863,190.00 4.6247,514,004.5030,800,000.00 PORTUGUESE OT'S 4.75 09-19 14/06A EUR 108.986 33,567,688.00 3.4534,799,852.90
3,300,000.00 REFER 5.875 09-19 18/02A EUR 109.022 3,597,726.00 0.373,859,402.2511.90115,662,528.00122,411,692.90TOTAL PORTUGAL
3,700,000.00 ACCIONA FINANCIACION 0.80 17-18 10/05A EUR 100.202 3,707,455.50 0.383,699,989.64
SPAIN
5,200,000.00 AYT CED CAJAS S VIII 4.25 06-18 14/06A EUR 104.258 5,421,416.00 0.565,749,864.505,500,000.00 BANKIA 3.50 14-19 17/01A EUR 105.340 5,793,700.00 0.605,909,854.508,100,000.00 CAJA AHORROS BARCEL 2.375 14-19 09/05A EUR 104.091 8,431,371.00 0.878,447,581.126,500,000.00 CAJAS RURALES 3.75 13-18 22/11A EUR 105.387 6,850,155.00 0.706,776,811.29
500,000.00 COMMUNIDAD MADRID 5.75 13-18 01/02A EUR 103.458 517,290.00 0.05579,861.883,700,000.00 COMUNIDAD AUTO DE ARA 2.875 14-19 10/02A EUR 104.690 3,873,530.00 0.403,830,964.502,000,000.00 COMUNIDAD AUTO DE ARA 3.75 13-18 01/04A EUR 102.896 2,057,920.00 0.212,135,052.255,700,000.00 COMUNIDAD CANARIAS 4.929 10-20 09/03A EUR 112.920 6,436,440.00 0.666,594,930.002,000,000.00 COMUNIDAD DE MADRID 1.189 15-22 08/05A EUR 103.372 2,067,440.00 0.211,934,052.251,400,000.00 CRITERIA CAIXA SA 1.5 17-23 10/05A EUR 99.123 1,387,722.00 0.141,401,680.004,600,000.00 CRITERIA CAIXACORP 1.625 15-22 21/04A EUR 101.816 4,683,536.00 0.484,615,793.332,400,000.00 ELECNOR SA ZCP 030717 EUR 0.000 2,397,847.85 0.252,397,847.851,200,000.00 JUNTA DE ANDALUCIA 4.75 07-18 24/01A EUR 102.750 1,233,000.00 0.131,330,252.254,000,000.00 JUNTA DE CATILLA LEON 6.505 13-19 01/03A EUR 110.851 4,434,040.00 0.464,888,052.25
12,000,000.00 PROSEGUR CIA SEGURIDA 2.75 13-18 02/04A EUR 102.010 12,241,200.00 1.2612,585,600.001,300,000.00 SANTAN CONSUMER FI 1.50 15-20 12/11A EUR 103.749 1,348,737.00 0.141,350,310.001,700,000.00 SANTANDER CONSUMER 1.10 15-18 29/07A EUR 101.253 1,721,301.00 0.181,731,790.006,000,000.00 SPAIN 4.10 08-18 30/07A EUR 104.770 6,286,200.00 0.656,778,131.20
18,900,000.00 SPAIN 5.50 11-21 30/04A EUR 120.968 22,862,952.00 2.3523,860,111.5027,000,000.00 SPAIN 0.50 14-17 31/10A EUR 100.301 27,081,270.00 2.7827,016,504.5031,000,000.00 SPAIN 4.50 12-18 31/01A EUR 102.830 31,877,300.00 3.2734,294,534.50
2,300,000.00 TELEFONICA EMIS 0.318 16-20 17/10A EUR 100.176 2,304,048.00 0.242,303,220.003,900,000.00 TELEFONICA EMIS 2.736 13-19 29/05A EUR 105.124 4,099,836.00 0.424,196,205.002,100,000.00 TELEFONICA EMTN 5.811 12-17 05/09A EUR 101.056 2,122,176.00 0.222,316,318.29
17.61171,237,883.35176,725,312.60TOTAL SPAIN
Ccy
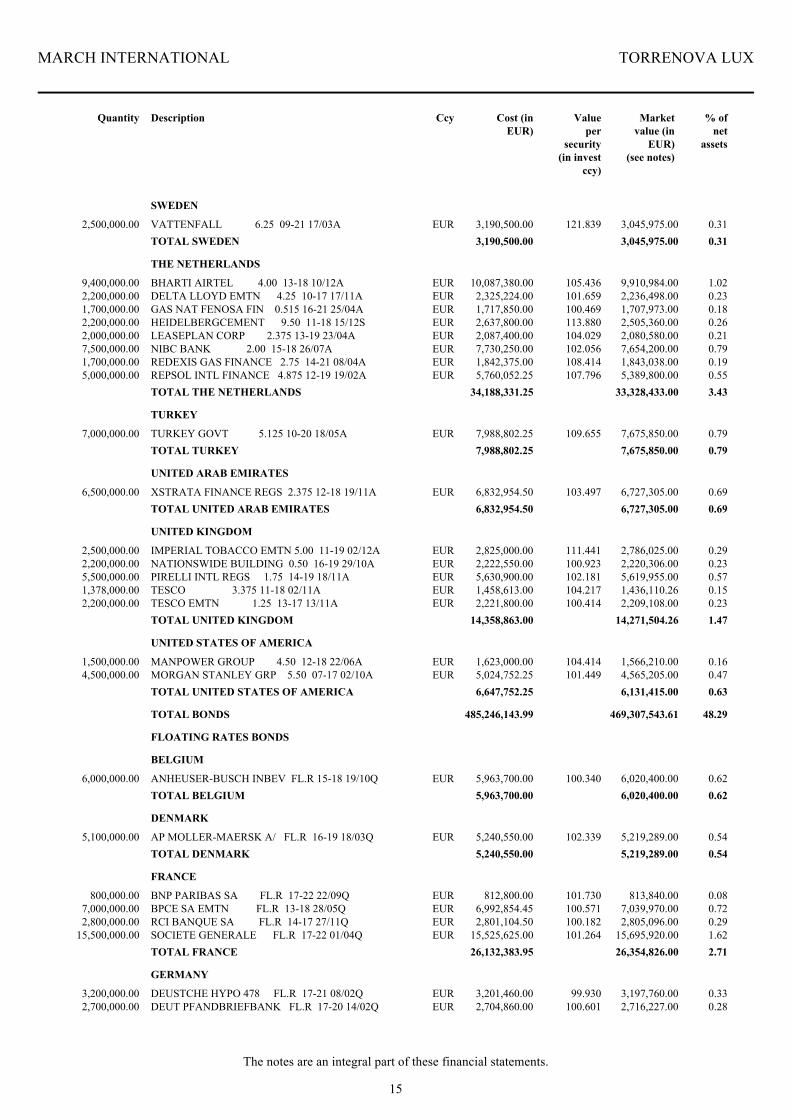
15
MARCH INTERNATIONAL TORRENOVA LUX
The notes are an integral part of these financial statements.
Quantity Description Cost (inEUR)
Valueper
security(in invest
ccy)
Marketvalue (in
EUR)(see notes)
% ofnet
assets
2,500,000.00 VATTENFALL 6.25 09-21 17/03A EUR 121.839 3,045,975.00 0.313,190,500.00
SWEDEN
0.313,045,975.003,190,500.00TOTAL SWEDEN
9,400,000.00 BHARTI AIRTEL 4.00 13-18 10/12A EUR 105.436 9,910,984.00 1.0210,087,380.00
THE NETHERLANDS
2,200,000.00 DELTA LLOYD EMTN 4.25 10-17 17/11A EUR 101.659 2,236,498.00 0.232,325,224.001,700,000.00 GAS NAT FENOSA FIN 0.515 16-21 25/04A EUR 100.469 1,707,973.00 0.181,717,850.002,200,000.00 HEIDELBERGCEMENT 9.50 11-18 15/12S EUR 113.880 2,505,360.00 0.262,637,800.002,000,000.00 LEASEPLAN CORP 2.375 13-19 23/04A EUR 104.029 2,080,580.00 0.212,087,400.007,500,000.00 NIBC BANK 2.00 15-18 26/07A EUR 102.056 7,654,200.00 0.797,730,250.001,700,000.00 REDEXIS GAS FINANCE 2.75 14-21 08/04A EUR 108.414 1,843,038.00 0.191,842,375.005,000,000.00 REPSOL INTL FINANCE 4.875 12-19 19/02A EUR 107.796 5,389,800.00 0.555,760,052.25
3.4333,328,433.0034,188,331.25TOTAL THE NETHERLANDS
7,000,000.00 TURKEY GOVT 5.125 10-20 18/05A EUR 109.655 7,675,850.00 0.797,988,802.25
TURKEY
0.797,675,850.007,988,802.25TOTAL TURKEY
6,500,000.00 XSTRATA FINANCE REGS 2.375 12-18 19/11A EUR 103.497 6,727,305.00 0.696,832,954.50
UNITED ARAB EMIRATES
0.696,727,305.006,832,954.50TOTAL UNITED ARAB EMIRATES
2,500,000.00 IMPERIAL TOBACCO EMTN 5.00 11-19 02/12A EUR 111.441 2,786,025.00 0.292,825,000.00
UNITED KINGDOM
2,200,000.00 NATIONSWIDE BUILDING 0.50 16-19 29/10A EUR 100.923 2,220,306.00 0.232,222,550.005,500,000.00 PIRELLI INTL REGS 1.75 14-19 18/11A EUR 102.181 5,619,955.00 0.575,630,900.001,378,000.00 TESCO 3.375 11-18 02/11A EUR 104.217 1,436,110.26 0.151,458,613.002,200,000.00 TESCO EMTN 1.25 13-17 13/11A EUR 100.414 2,209,108.00 0.232,221,800.00
1.4714,271,504.2614,358,863.00TOTAL UNITED KINGDOM
1,500,000.00 MANPOWER GROUP 4.50 12-18 22/06A EUR 104.414 1,566,210.00 0.161,623,000.00
UNITED STATES OF AMERICA
4,500,000.00 MORGAN STANLEY GRP 5.50 07-17 02/10A EUR 101.449 4,565,205.00 0.475,024,752.250.636,131,415.006,647,752.25TOTAL UNITED STATES OF AMERICA
TOTAL BONDS 48.29469,307,543.61485,246,143.99
6,000,000.00 ANHEUSER-BUSCH INBEV FL.R 15-18 19/10Q EUR 100.340 6,020,400.00 0.625,963,700.00
BELGIUM
FLOATING RATES BONDS
0.626,020,400.005,963,700.00TOTAL BELGIUM
5,100,000.00 AP MOLLER-MAERSK A/ FL.R 16-19 18/03Q EUR 102.339 5,219,289.00 0.545,240,550.00
DENMARK
0.545,219,289.005,240,550.00TOTAL DENMARK
800,000.00 BNP PARIBAS SA FL.R 17-22 22/09Q EUR 101.730 813,840.00 0.08812,800.00
FRANCE
7,000,000.00 BPCE SA EMTN FL.R 13-18 28/05Q EUR 100.571 7,039,970.00 0.726,992,854.452,800,000.00 RCI BANQUE SA FL.R 14-17 27/11Q EUR 100.182 2,805,096.00 0.292,801,104.50
15,500,000.00 SOCIETE GENERALE FL.R 17-22 01/04Q EUR 101.264 15,695,920.00 1.6215,525,625.002.7126,354,826.0026,132,383.95TOTAL FRANCE
3,200,000.00 DEUSTCHE HYPO 478 FL.R 17-21 08/02Q EUR 99.930 3,197,760.00 0.333,201,460.00
GERMANY
2,700,000.00 DEUT PFANDBRIEFBANK FL.R 17-20 14/02Q EUR 100.601 2,716,227.00 0.282,704,860.00
Ccy
16
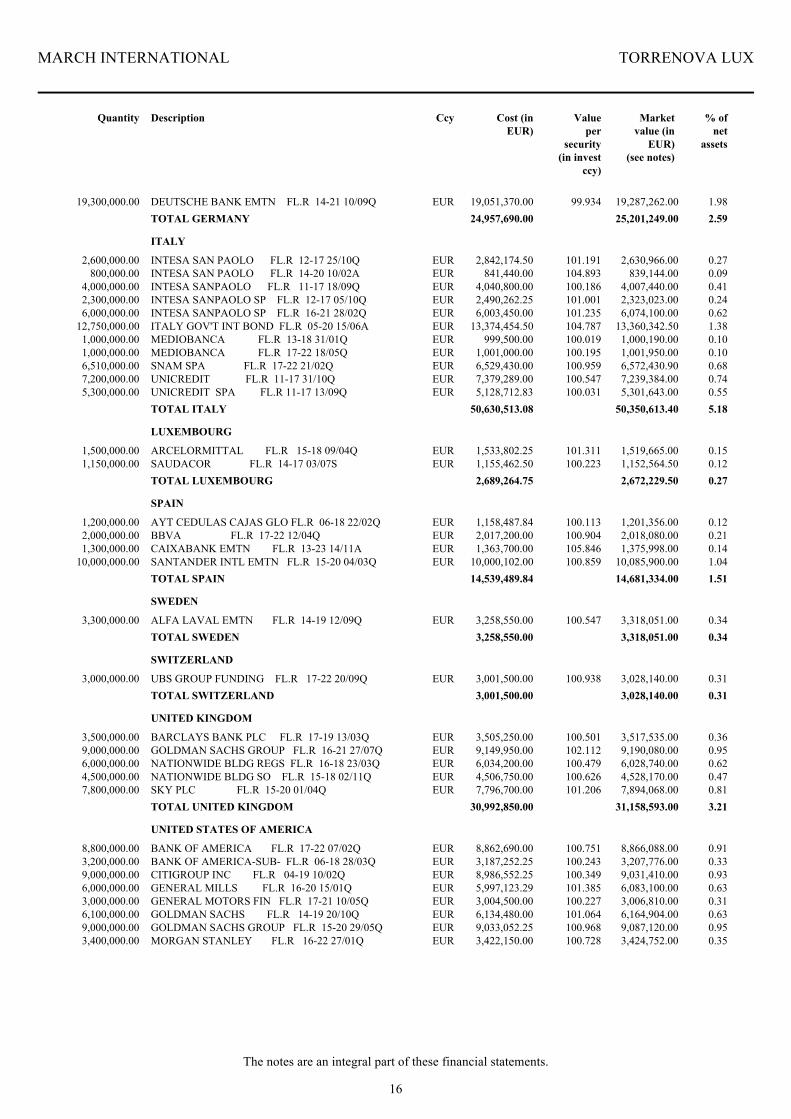
MARCH INTERNATIONAL TORRENOVA LUX
The notes are an integral part of these financial statements.
Quantity Description Cost (inEUR)
Valueper
security(in invest
ccy)
Marketvalue (in
EUR)(see notes)
% ofnet
assets
19,300,000.00 DEUTSCHE BANK EMTN FL.R 14-21 10/09Q EUR 99.934 19,287,262.00 1.9819,051,370.002.5925,201,249.0024,957,690.00TOTAL GERMANY
2,600,000.00 INTESA SAN PAOLO FL.R 12-17 25/10Q EUR 101.191 2,630,966.00 0.272,842,174.50
ITALY
800,000.00 INTESA SAN PAOLO FL.R 14-20 10/02A EUR 104.893 839,144.00 0.09841,440.004,000,000.00 INTESA SANPAOLO FL.R 11-17 18/09Q EUR 100.186 4,007,440.00 0.414,040,800.002,300,000.00 INTESA SANPAOLO SP FL.R 12-17 05/10Q EUR 101.001 2,323,023.00 0.242,490,262.256,000,000.00 INTESA SANPAOLO SP FL.R 16-21 28/02Q EUR 101.235 6,074,100.00 0.626,003,450.00
12,750,000.00 ITALY GOV'T INT BOND FL.R 05-20 15/06A EUR 104.787 13,360,342.50 1.3813,374,454.501,000,000.00 MEDIOBANCA FL.R 13-18 31/01Q EUR 100.019 1,000,190.00 0.10999,500.001,000,000.00 MEDIOBANCA FL.R 17-22 18/05Q EUR 100.195 1,001,950.00 0.101,001,000.006,510,000.00 SNAM SPA FL.R 17-22 21/02Q EUR 100.959 6,572,430.90 0.686,529,430.007,200,000.00 UNICREDIT FL.R 11-17 31/10Q EUR 100.547 7,239,384.00 0.747,379,289.005,300,000.00 UNICREDIT SPA FL.R 11-17 13/09Q EUR 100.031 5,301,643.00 0.555,128,712.83
5.1850,350,613.4050,630,513.08TOTAL ITALY
1,500,000.00 ARCELORMITTAL FL.R 15-18 09/04Q EUR 101.311 1,519,665.00 0.151,533,802.25
LUXEMBOURG
1,150,000.00 SAUDACOR FL.R 14-17 03/07S EUR 100.223 1,152,564.50 0.121,155,462.500.272,672,229.502,689,264.75TOTAL LUXEMBOURG
1,200,000.00 AYT CEDULAS CAJAS GLO FL.R 06-18 22/02Q EUR 100.113 1,201,356.00 0.121,158,487.84
SPAIN
2,000,000.00 BBVA FL.R 17-22 12/04Q EUR 100.904 2,018,080.00 0.212,017,200.001,300,000.00 CAIXABANK EMTN FL.R 13-23 14/11A EUR 105.846 1,375,998.00 0.141,363,700.00
10,000,000.00 SANTANDER INTL EMTN FL.R 15-20 04/03Q EUR 100.859 10,085,900.00 1.0410,000,102.001.5114,681,334.0014,539,489.84TOTAL SPAIN
3,300,000.00 ALFA LAVAL EMTN FL.R 14-19 12/09Q EUR 100.547 3,318,051.00 0.343,258,550.00
SWEDEN
0.343,318,051.003,258,550.00TOTAL SWEDEN
3,000,000.00 UBS GROUP FUNDING FL.R 17-22 20/09Q EUR 100.938 3,028,140.00 0.313,001,500.00
SWITZERLAND
0.313,028,140.003,001,500.00TOTAL SWITZERLAND
3,500,000.00 BARCLAYS BANK PLC FL.R 17-19 13/03Q EUR 100.501 3,517,535.00 0.363,505,250.00
UNITED KINGDOM
9,000,000.00 GOLDMAN SACHS GROUP FL.R 16-21 27/07Q EUR 102.112 9,190,080.00 0.959,149,950.006,000,000.00 NATIONWIDE BLDG REGS FL.R 16-18 23/03Q EUR 100.479 6,028,740.00 0.626,034,200.004,500,000.00 NATIONWIDE BLDG SO FL.R 15-18 02/11Q EUR 100.626 4,528,170.00 0.474,506,750.007,800,000.00 SKY PLC FL.R 15-20 01/04Q EUR 101.206 7,894,068.00 0.817,796,700.00
3.2131,158,593.0030,992,850.00TOTAL UNITED KINGDOM
8,800,000.00 BANK OF AMERICA FL.R 17-22 07/02Q EUR 100.751 8,866,088.00 0.918,862,690.00
UNITED STATES OF AMERICA
3,200,000.00 BANK OF AMERICA-SUB- FL.R 06-18 28/03Q EUR 100.243 3,207,776.00 0.333,187,252.259,000,000.00 CITIGROUP INC FL.R 04-19 10/02Q EUR 100.349 9,031,410.00 0.938,986,552.256,000,000.00 GENERAL MILLS FL.R 16-20 15/01Q EUR 101.385 6,083,100.00 0.635,997,123.293,000,000.00 GENERAL MOTORS FIN FL.R 17-21 10/05Q EUR 100.227 3,006,810.00 0.313,004,500.006,100,000.00 GOLDMAN SACHS FL.R 14-19 20/10Q EUR 101.064 6,164,904.00 0.636,134,480.009,000,000.00 GOLDMAN SACHS GROUP FL.R 15-20 29/05Q EUR 100.968 9,087,120.00 0.959,033,052.253,400,000.00 MORGAN STANLEY FL.R 16-22 27/01Q EUR 100.728 3,424,752.00 0.353,422,150.00
Ccy
17
MARCH INTERNATIONAL TORRENOVA LUX
The notes are an integral part of these financial statements.
Quantity Description Cost (inEUR)
Valueper
security(in invest
ccy)
Marketvalue (in
EUR)(see notes)
% ofnet
assets
7,570,000.00 WELLS FARGO & COMP FL.R 17-22 31/01Q EUR 100.450 7,604,065.00 0.787,571,996.505.8256,476,025.0056,199,796.54TOTAL UNITED STATES OF AMERICA
TOTAL FLOATING RATES BONDS 23.10224,480,749.90223,606,288.16
TOTAL TRANSFERABLE SECURITIES AND MONEYMARKET INSTRUMENTS ADMITTED TO ANOFFICIAL STOCK EXCHANGE OR DEALT IN ONANOTHER REGULATED MARKET
90.32877,797,681.43871,144,439.03
1,400,000.00 ACCI FINA FILI ZCP 03-11-17 EUR 0.000 1,390,102.85 0.141,390,102.85
SPAIN
MONEY MARKET INSTRUMENTS
17,600,000.00 ACCIONA FINANCIACION ZCP 270418 EUR 0.000 17,467,537.84 1.8117,467,537.845,000,000.00 ACS Y SERVICIOS SA ZCP 061017 EUR 0.000 4,949,455.06 0.514,949,455.065,500,000.00 ACS Y SERVICIOS SA ZCP 130318 EUR 0.000 5,477,875.16 0.565,477,875.164,400,000.00 ELECNOR SA ZCP 231117 EUR 0.000 4,382,369.92 0.454,382,369.932,200,000.00 IM FORTIA 1, FOND ZCP 100717 EUR 0.000 2,199,144.33 0.232,199,144.331,400,000.00 IM FORTIA 1, FOND ZCP 101117 EUR 0.000 1,398,467.43 0.141,398,467.431,000,000.00 TUBACEX SA ZCP 220917 EUR 0.000 998,168.27 0.10998,168.27
3.9438,263,120.8638,263,120.87TOTAL SPAIN
TOTAL MONEY MARKET INSTRUMENTS 3.9438,263,120.8638,263,120.87
TOTAL INVESTMENTS IN SECURITIES 94.26916,060,802.29909,407,559.90
Cash/(bank overdraft) 5.0048,629,243.84Other assets and liabilities 0.747,168,539.45
TOTAL NET ASSETS 100.00971,858,585.58
Ccy
18
MARCH INTERNATIONAL TORRENOVA LUX
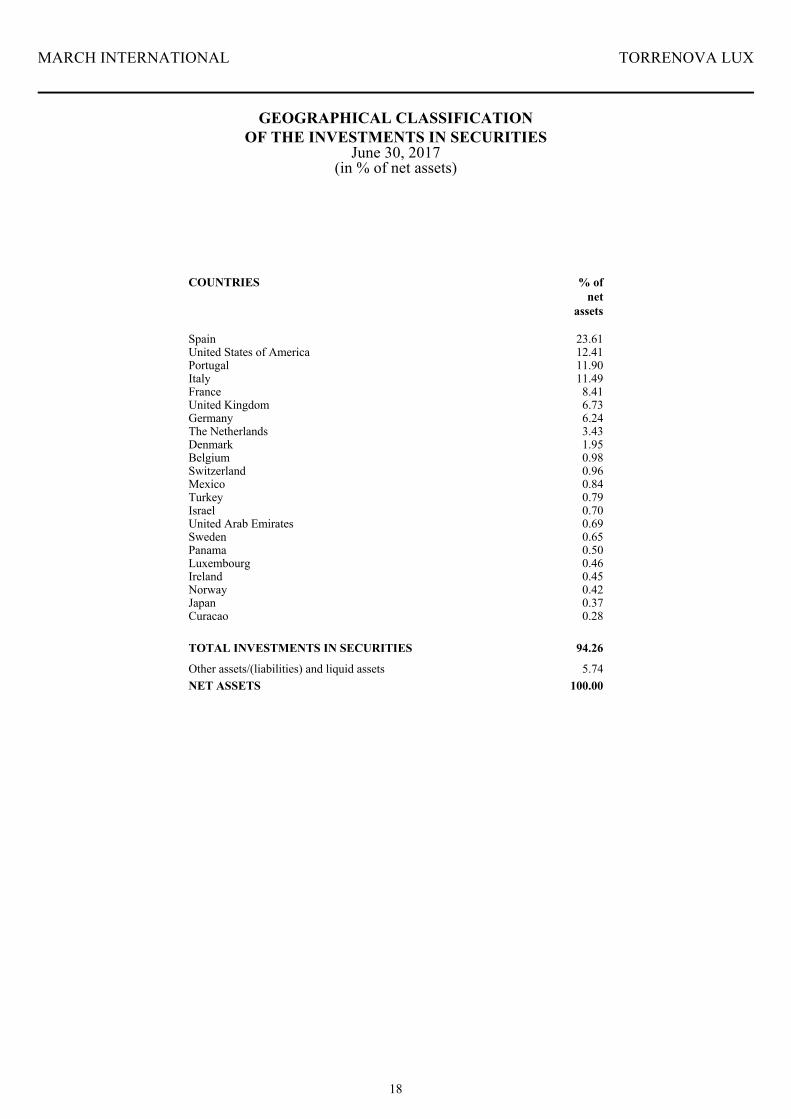
GEOGRAPHICAL CLASSIFICATIONOF THE INVESTMENTS IN SECURITIES
June 30, 2017(in % of net assets)
Spain 23.61United States of America 12.41Portugal 11.90Italy 11.49France 8.41United Kingdom 6.73Germany 6.24The Netherlands 3.43Denmark 1.95Belgium 0.98Switzerland 0.96Mexico 0.84Turkey 0.79Israel 0.70United Arab Emirates 0.69Sweden 0.65Panama 0.50Luxembourg 0.46Ireland 0.45Norway 0.42Japan 0.37Curacao 0.28
TOTAL INVESTMENTS IN SECURITIES
Other assets/(liabilities) and liquid assets 5.74NET ASSETS 100.00
94.26
% ofnet
assets
COUNTRIES
19
MARCH INTERNATIONAL TORRENOVA LUX
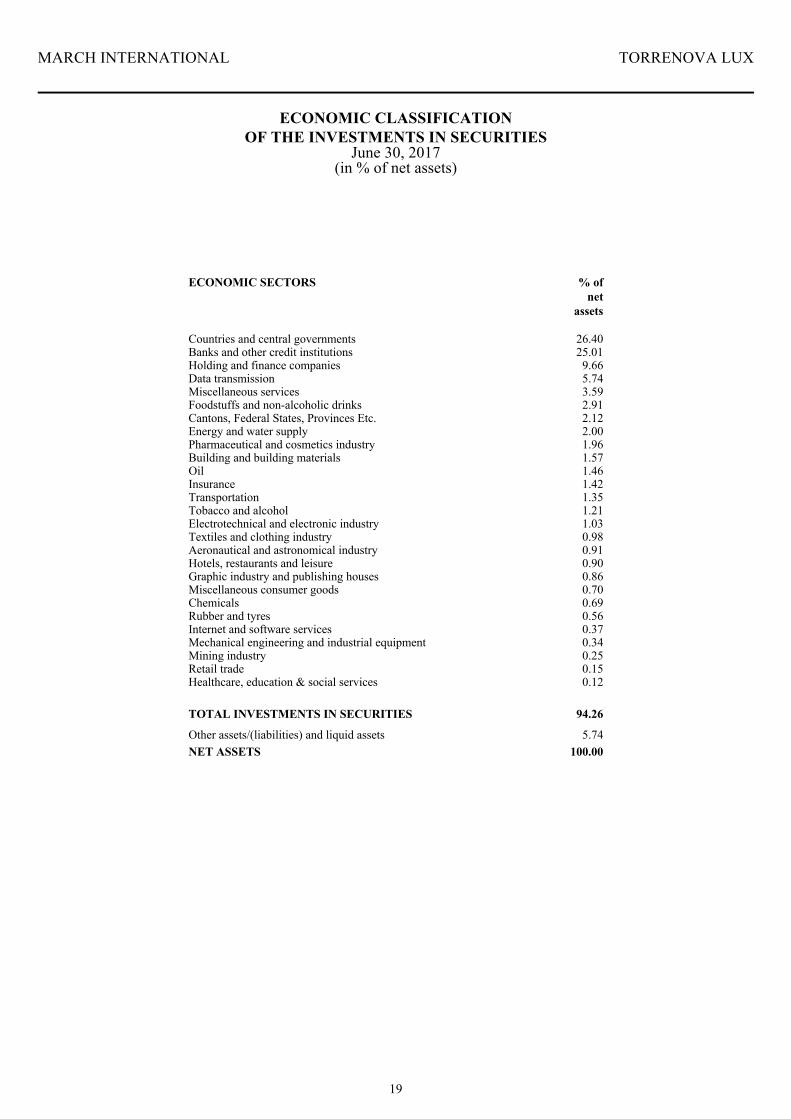
ECONOMIC CLASSIFICATIONOF THE INVESTMENTS IN SECURITIES
June 30, 2017(in % of net assets)
Countries and central governments 26.40Banks and other credit institutions 25.01Holding and finance companies 9.66Data transmission 5.74Miscellaneous services 3.59Foodstuffs and non-alcoholic drinks 2.91Cantons, Federal States, Provinces Etc. 2.12Energy and water supply 2.00Pharmaceutical and cosmetics industry 1.96Building and building materials 1.57Oil 1.46Insurance 1.42Transportation 1.35Tobacco and alcohol 1.21Electrotechnical and electronic industry 1.03Textiles and clothing industry 0.98Aeronautical and astronomical industry 0.91Hotels, restaurants and leisure 0.90Graphic industry and publishing houses 0.86Miscellaneous consumer goods 0.70Chemicals 0.69Rubber and tyres 0.56Internet and software services 0.37Mechanical engineering and industrial equipment 0.34Mining industry 0.25Retail trade 0.15Healthcare, education & social services 0.12
ECONOMIC SECTORS % ofnet
assets
TOTAL INVESTMENTS IN SECURITIES
Other assets/(liabilities) and liquid assets 5.74NET ASSETS 100.00
94.26
20
MARCH INTERNATIONAL MARCH VINI CATENA
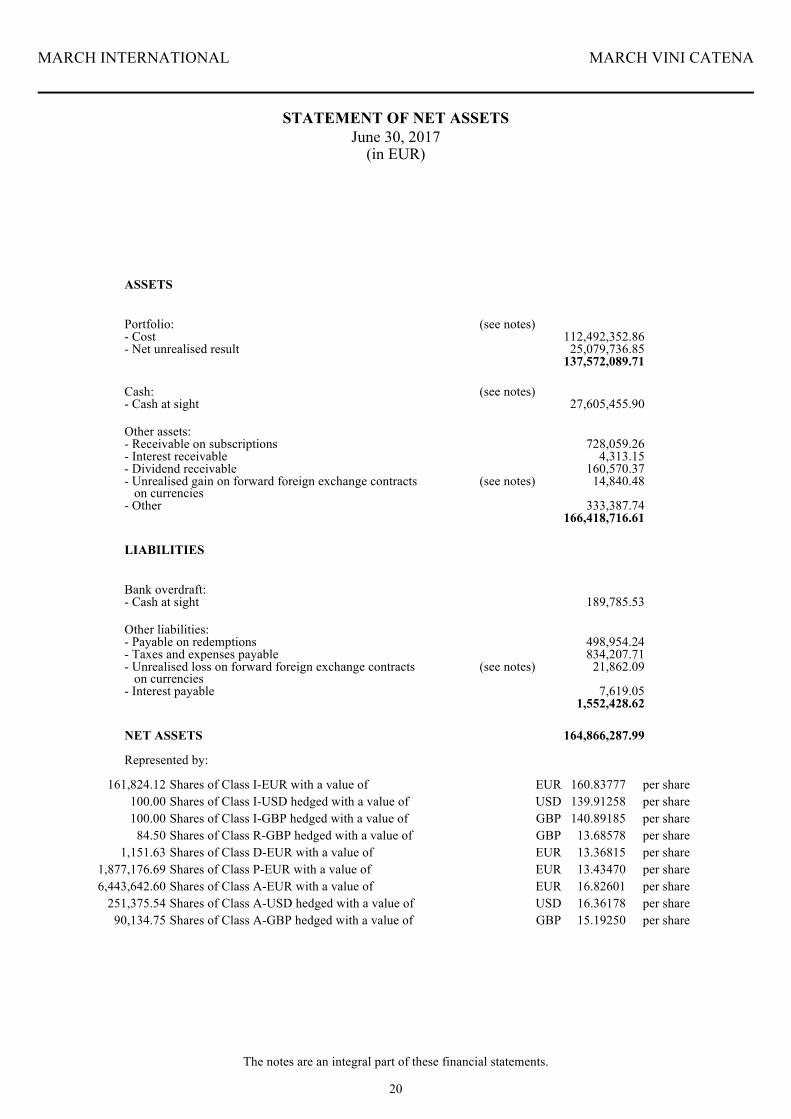
STATEMENT OF NET ASSETSJune 30, 2017
(in EUR)
The notes are an integral part of these financial statements.
ASSETS
Portfolio: (see notes)- Cost 112,492,352.86- Net unrealised result 25,079,736.85
137,572,089.71
Cash: (see notes)- Cash at sight 27,605,455.90
Other assets:- Receivable on subscriptions 728,059.26- Interest receivable 4,313.15- Dividend receivable 160,570.37- Unrealised gain on forward foreign exchange contracts on currencies
(see notes) 14,840.48
- Other 333,387.74166,418,716.61
LIABILITIES
Bank overdraft:- Cash at sight 189,785.53
Other liabilities:- Payable on redemptions 498,954.24- Taxes and expenses payable 834,207.71- Unrealised loss on forward foreign exchange contracts on currencies
(see notes) 21,862.09
- Interest payable 7,619.051,552,428.62
NET ASSETS 164,866,287.99
161,824.12 160.83777 per shareEURShares of Class I-EUR with a value of100.00 139.91258 per shareUSDShares of Class I-USD hedged with a value of100.00 140.89185 per shareGBPShares of Class I-GBP hedged with a value of
84.50 13.68578 per shareGBPShares of Class R-GBP hedged with a value of1,151.63 13.36815 per shareEURShares of Class D-EUR with a value of
1,877,176.69 13.43470 per shareEURShares of Class P-EUR with a value of6,443,642.60 16.82601 per shareEURShares of Class A-EUR with a value of
251,375.54 16.36178 per shareUSDShares of Class A-USD hedged with a value of90,134.75 15.19250 per shareGBPShares of Class A-GBP hedged with a value of
Represented by:
21
MARCH INTERNATIONAL MARCH VINI CATENA
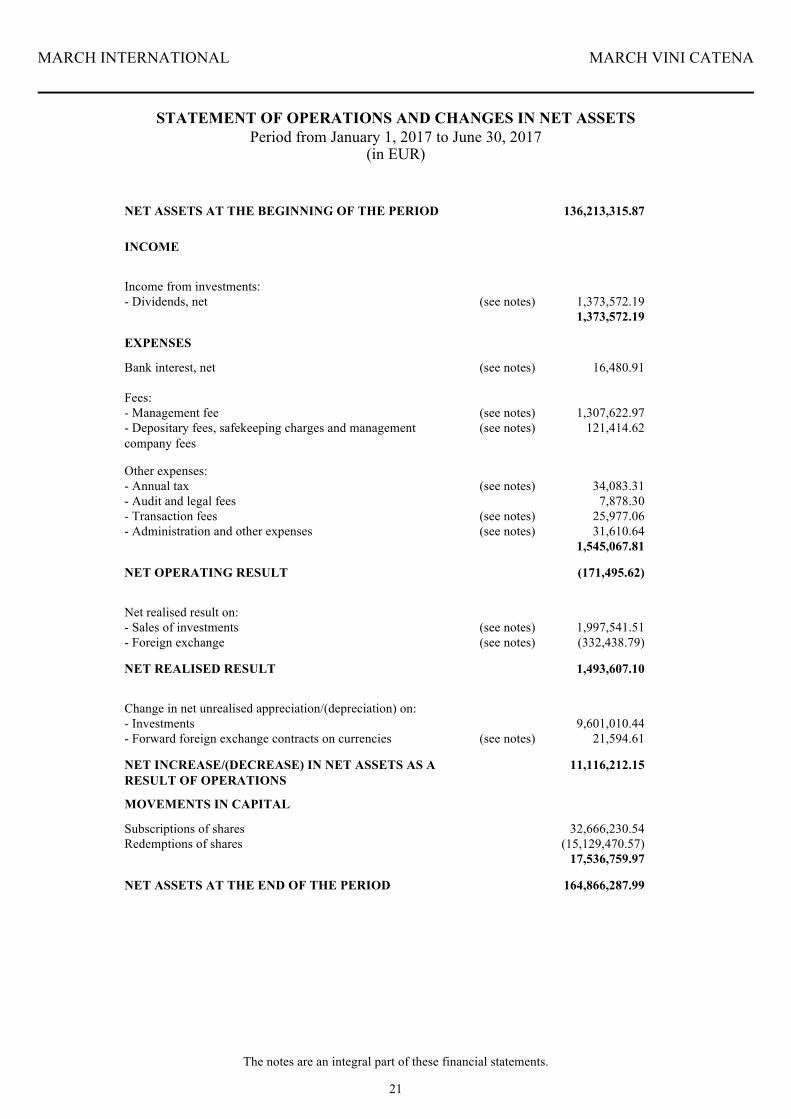
STATEMENT OF OPERATIONS AND CHANGES IN NET ASSETSPeriod from January 1, 2017 to June 30, 2017
NET ASSETS AT THE BEGINNING OF THE PERIOD 136,213,315.87
INCOME
Income from investments:- Dividends, net (see notes) 1,373,572.19
1,373,572.19
EXPENSES
Bank interest, net (see notes) 16,480.91
Fees:- Management fee (see notes) 1,307,622.97- Depositary fees, safekeeping charges and managementcompany fees
(see notes) 121,414.62
Other expenses:- Annual tax (see notes) 34,083.31- Audit and legal fees 7,878.30- Transaction fees (see notes) 25,977.06- Administration and other expenses (see notes) 31,610.64
1,545,067.81
NET OPERATING RESULT (171,495.62)
Net realised result on:- Sales of investments (see notes) 1,997,541.51- Foreign exchange (see notes) (332,438.79)
NET REALISED RESULT 1,493,607.10
Change in net unrealised appreciation/(depreciation) on:- Investments 9,601,010.44- Forward foreign exchange contracts on currencies (see notes) 21,594.61
NET INCREASE/(DECREASE) IN NET ASSETS AS ARESULT OF OPERATIONS
11,116,212.15
MOVEMENTS IN CAPITAL
Subscriptions of shares 32,666,230.54Redemptions of shares (15,129,470.57)
17,536,759.97
NET ASSETS AT THE END OF THE PERIOD 164,866,287.99
(in EUR)
The notes are an integral part of these financial statements.
22
MARCH INTERNATIONAL MARCH VINI CATENA
CHANGES IN THE NUMBER OF SHARES,IN NET ASSETS AND
IN NET ASSET VALUE PER SHARE
Date ShareClass
Number of shares
outstanding
NetAssets
Ccy Net assetvalue
per share
263,891.51 124.9084332,962,274.7912.31.14 Class I-EUR EUR100.00 107.5393010,753.93Class I-USD hedged USD100.00 108.9342010,893.42Class I-GBP hedged GBP
84.50 10.48308885.82Class R-GBP hedged GBP100.00 10.431501,043.15Class D-EUR EUR
1,082,305.93 10.4441911,303,813.81Class P-EUR EUR1,214,011.42 13.3280316,180,782.33Class A-EUR EUR
336,370.61 12.832254,316,390.06Class A-USD hedged USD67,524.40 11.98471809,260.25Class A-GBP hedged GBP
308,383.83 138.4050042,681,864.73Class I-EUR EUR12.31.15100.00 118.4388511,843.89Class I-USD hedged USD100.00 120.3772212,037.72Class I-GBP hedged GBP
84.50 11.63806983.42Class R-GBP hedged GBP100.00 11.554401,155.44Class D-EUR EUR
1,662,675.83 11.5681219,234,026.60Class P-EUR EUR5,081,579.00 14.6517774,454,136.01Class A-EUR EUR
267,508.49 14.015323,749,217.82Class A-USD hedged USD77,378.66 13.134871,016,358.59Class A-GBP hedged GBP
185,970.10 148.1032627,542,777.31Class I-EUR12.31.16 EUR100.00 127.8201712,782.02Class I-USD hedged USD100.00 129.3756612,937.57Class I-GBP hedged GBP
84.50 12.548121,060.32Class R-GBP hedged GBP107.86 12.328111,329.69Class D-EUR EUR
1,652,295.94 12.3736220,444,888.75Class P-EUR EUR5,363,063.34 15.5548783,421,743.77Class A-EUR EUR
255,022.65 15.006323,826,951.74Class A-USD hedged USD69,698.11 14.00575976,174.39Class A-GBP hedged GBP
161,824.12 160.8377726,027,430.91Class I-EUR06.30.17 EUR100.00 139.9125813,991.26Class I-USD hedged USD100.00 140.8918514,089.19Class I-GBP hedged GBP
84.50 13.685781,156.45Class R-GBP hedged GBP1,151.63 13.3681515,395.20Class D-EUR EUR
1,877,176.69 13.4347025,219,312.97Class P-EUR EUR6,443,642.60 16.82601108,420,787.93Class A-EUR EUR
251,375.54 16.361784,112,951.93Class A-USD hedged USD90,134.75 15.192501,369,372.13Class A-GBP hedged GBP
The notes are an integral part of these financial statements.
23
MARCH INTERNATIONAL MARCH VINI CATENA
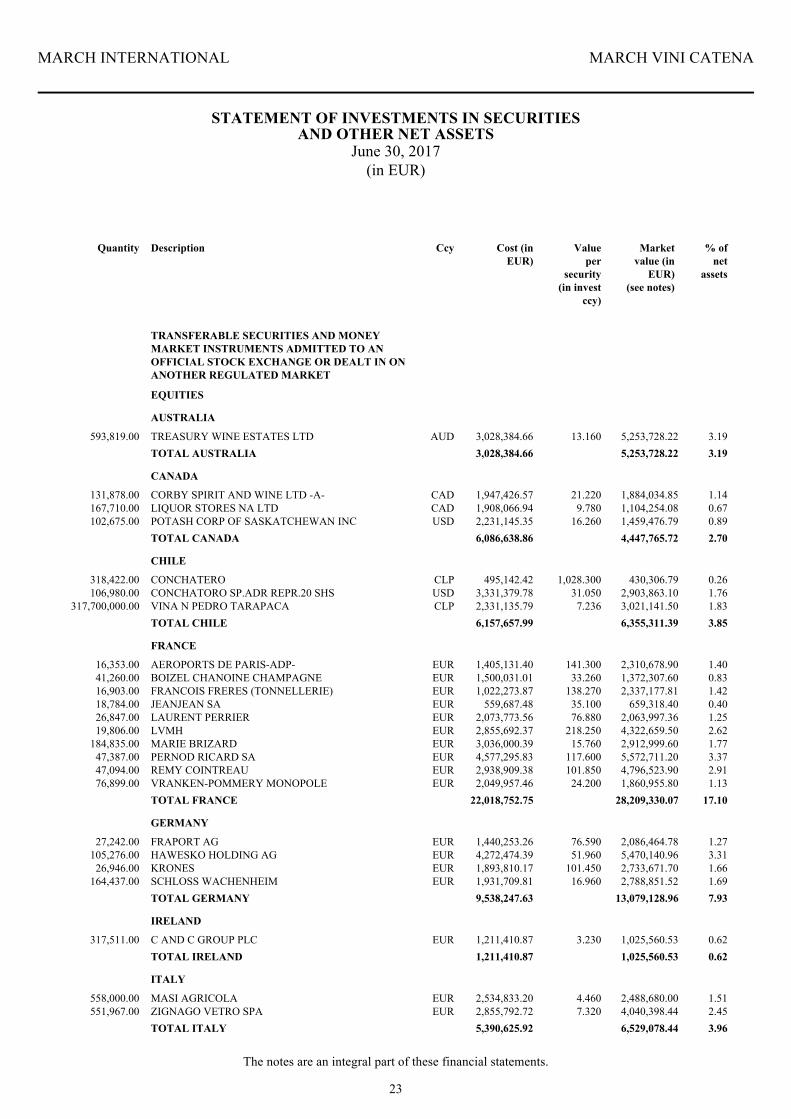
STATEMENT OF INVESTMENTS IN SECURITIESAND OTHER NET ASSETS
June 30, 2017(in EUR)
The notes are an integral part of these financial statements.
Quantity Description Cost (inEUR)
Valueper
security(in invest
ccy)
Marketvalue (in
EUR)(see notes)
% ofnet
assets
593,819.00 TREASURY WINE ESTATES LTD AUD 13.160 5,253,728.22 3.193,028,384.66
AUSTRALIA
EQUITIES
TRANSFERABLE SECURITIES AND MONEYMARKET INSTRUMENTS ADMITTED TO ANOFFICIAL STOCK EXCHANGE OR DEALT IN ONANOTHER REGULATED MARKET
3.195,253,728.223,028,384.66TOTAL AUSTRALIA
131,878.00 CORBY SPIRIT AND WINE LTD -A- CAD 21.220 1,884,034.85 1.141,947,426.57
CANADA
167,710.00 LIQUOR STORES NA LTD CAD 9.780 1,104,254.08 0.671,908,066.94102,675.00 POTASH CORP OF SASKATCHEWAN INC USD 16.260 1,459,476.79 0.892,231,145.35
2.704,447,765.726,086,638.86TOTAL CANADA
318,422.00 CONCHATERO CLP 1,028.300 430,306.79 0.26495,142.42
CHILE
106,980.00 CONCHATORO SP.ADR REPR.20 SHS USD 31.050 2,903,863.10 1.763,331,379.78317,700,000.00 VINA N PEDRO TARAPACA CLP 7.236 3,021,141.50 1.832,331,135.79
3.856,355,311.396,157,657.99TOTAL CHILE
16,353.00 AEROPORTS DE PARIS-ADP- EUR 141.300 2,310,678.90 1.401,405,131.40
FRANCE
41,260.00 BOIZEL CHANOINE CHAMPAGNE EUR 33.260 1,372,307.60 0.831,500,031.0116,903.00 FRANCOIS FRERES (TONNELLERIE) EUR 138.270 2,337,177.81 1.421,022,273.8718,784.00 JEANJEAN SA EUR 35.100 659,318.40 0.40559,687.4826,847.00 LAURENT PERRIER EUR 76.880 2,063,997.36 1.252,073,773.5619,806.00 LVMH EUR 218.250 4,322,659.50 2.622,855,692.37
184,835.00 MARIE BRIZARD EUR 15.760 2,912,999.60 1.773,036,000.3947,387.00 PERNOD RICARD SA EUR 117.600 5,572,711.20 3.374,577,295.8347,094.00 REMY COINTREAU EUR 101.850 4,796,523.90 2.912,938,909.3876,899.00 VRANKEN-POMMERY MONOPOLE EUR 24.200 1,860,955.80 1.132,049,957.46
17.1028,209,330.0722,018,752.75TOTAL FRANCE
27,242.00 FRAPORT AG EUR 76.590 2,086,464.78 1.271,440,253.26
GERMANY
105,276.00 HAWESKO HOLDING AG EUR 51.960 5,470,140.96 3.314,272,474.3926,946.00 KRONES EUR 101.450 2,733,671.70 1.661,893,810.17
164,437.00 SCHLOSS WACHENHEIM EUR 16.960 2,788,851.52 1.691,931,709.817.9313,079,128.969,538,247.63TOTAL GERMANY
317,511.00 C AND C GROUP PLC EUR 3.230 1,025,560.53 0.621,211,410.87
IRELAND
0.621,025,560.531,211,410.87TOTAL IRELAND
558,000.00 MASI AGRICOLA EUR 4.460 2,488,680.00 1.512,534,833.20
ITALY
551,967.00 ZIGNAGO VETRO SPA EUR 7.320 4,040,398.44 2.452,855,792.723.966,529,078.445,390,625.92TOTAL ITALY
Ccy
24
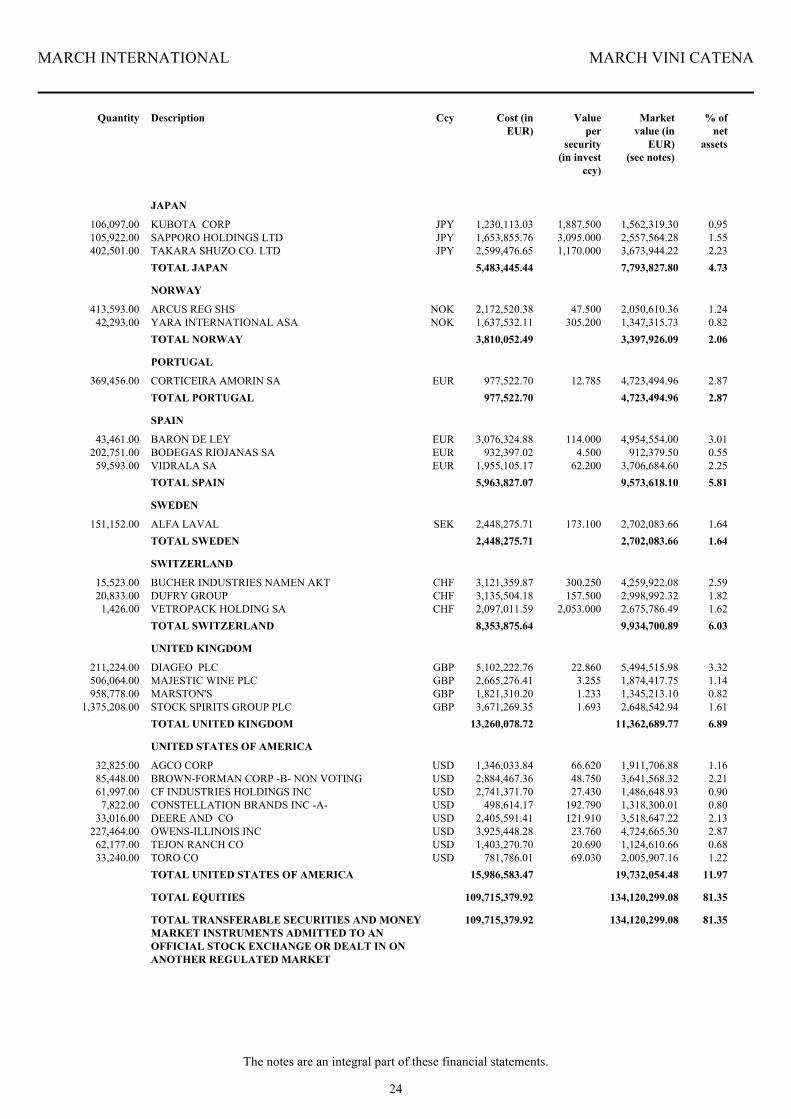
MARCH INTERNATIONAL MARCH VINI CATENA
The notes are an integral part of these financial statements.
Quantity Description Cost (inEUR)
Valueper
security(in invest
ccy)
Marketvalue (in
EUR)(see notes)
% ofnet
assets
106,097.00 KUBOTA CORP JPY 1,887.500 1,562,319.30 0.951,230,113.03
JAPAN
105,922.00 SAPPORO HOLDINGS LTD JPY 3,095.000 2,557,564.28 1.551,653,855.76402,501.00 TAKARA SHUZO CO. LTD JPY 1,170.000 3,673,944.22 2.232,599,476.65
4.737,793,827.805,483,445.44TOTAL JAPAN
413,593.00 ARCUS REG SHS NOK 47.500 2,050,610.36 1.242,172,520.38
NORWAY
42,293.00 YARA INTERNATIONAL ASA NOK 305.200 1,347,315.73 0.821,637,532.112.063,397,926.093,810,052.49TOTAL NORWAY
369,456.00 CORTICEIRA AMORIN SA EUR 12.785 4,723,494.96 2.87977,522.70
PORTUGAL
2.874,723,494.96977,522.70TOTAL PORTUGAL
43,461.00 BARON DE LEY EUR 114.000 4,954,554.00 3.013,076,324.88
SPAIN
202,751.00 BODEGAS RIOJANAS SA EUR 4.500 912,379.50 0.55932,397.0259,593.00 VIDRALA SA EUR 62.200 3,706,684.60 2.251,955,105.17
5.819,573,618.105,963,827.07TOTAL SPAIN
151,152.00 ALFA LAVAL SEK 173.100 2,702,083.66 1.642,448,275.71
SWEDEN
1.642,702,083.662,448,275.71TOTAL SWEDEN
15,523.00 BUCHER INDUSTRIES NAMEN AKT CHF 300.250 4,259,922.08 2.593,121,359.87
SWITZERLAND
20,833.00 DUFRY GROUP CHF 157.500 2,998,992.32 1.823,135,504.181,426.00 VETROPACK HOLDING SA CHF 2,053.000 2,675,786.49 1.622,097,011.59
6.039,934,700.898,353,875.64TOTAL SWITZERLAND
211,224.00 DIAGEO PLC GBP 22.860 5,494,515.98 3.325,102,222.76
UNITED KINGDOM
506,064.00 MAJESTIC WINE PLC GBP 3.255 1,874,417.75 1.142,665,276.41958,778.00 MARSTON'S GBP 1.233 1,345,213.10 0.821,821,310.20
1,375,208.00 STOCK SPIRITS GROUP PLC GBP 1.693 2,648,542.94 1.613,671,269.356.8911,362,689.7713,260,078.72TOTAL UNITED KINGDOM
32,825.00 AGCO CORP USD 66.620 1,911,706.88 1.161,346,033.84
UNITED STATES OF AMERICA
85,448.00 BROWN-FORMAN CORP -B- NON VOTING USD 48.750 3,641,568.32 2.212,884,467.3661,997.00 CF INDUSTRIES HOLDINGS INC USD 27.430 1,486,648.93 0.902,741,371.70
7,822.00 CONSTELLATION BRANDS INC -A- USD 192.790 1,318,300.01 0.80498,614.1733,016.00 DEERE AND CO USD 121.910 3,518,647.22 2.132,405,591.41
227,464.00 OWENS-ILLINOIS INC USD 23.760 4,724,665.30 2.873,925,448.2862,177.00 TEJON RANCH CO USD 20.690 1,124,610.66 0.681,403,270.7033,240.00 TORO CO USD 69.030 2,005,907.16 1.22781,786.01
11.9719,732,054.4815,986,583.47TOTAL UNITED STATES OF AMERICA
TOTAL EQUITIES 81.35134,120,299.08109,715,379.92
TOTAL TRANSFERABLE SECURITIES AND MONEYMARKET INSTRUMENTS ADMITTED TO ANOFFICIAL STOCK EXCHANGE OR DEALT IN ONANOTHER REGULATED MARKET
81.35134,120,299.08109,715,379.92
Ccy
25
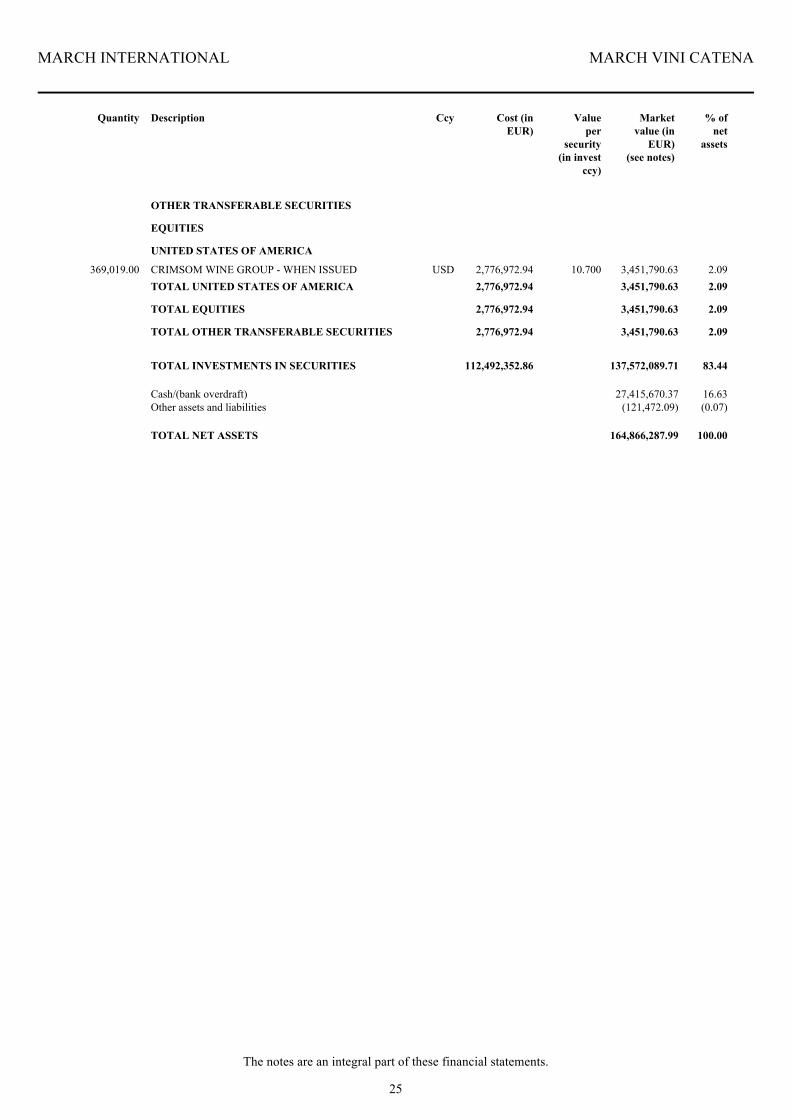
MARCH INTERNATIONAL MARCH VINI CATENA
The notes are an integral part of these financial statements.
Quantity Description Cost (inEUR)
Valueper
security(in invest
ccy)
Marketvalue (in
EUR)(see notes)
% ofnet
assets
369,019.00 CRIMSOM WINE GROUP - WHEN ISSUED USD 10.700 3,451,790.63 2.092,776,972.94
UNITED STATES OF AMERICA
EQUITIES
OTHER TRANSFERABLE SECURITIES
2.093,451,790.632,776,972.94TOTAL UNITED STATES OF AMERICA
TOTAL EQUITIES 2.093,451,790.632,776,972.94
TOTAL OTHER TRANSFERABLE SECURITIES 2.093,451,790.632,776,972.94
TOTAL INVESTMENTS IN SECURITIES 83.44137,572,089.71112,492,352.86
Cash/(bank overdraft) 16.6327,415,670.37Other assets and liabilities (0.07)(121,472.09)
TOTAL NET ASSETS 100.00164,866,287.99
Ccy
26
MARCH INTERNATIONAL MARCH VINI CATENA
GEOGRAPHICAL CLASSIFICATIONOF THE INVESTMENTS IN SECURITIES
June 30, 2017(in % of net assets)
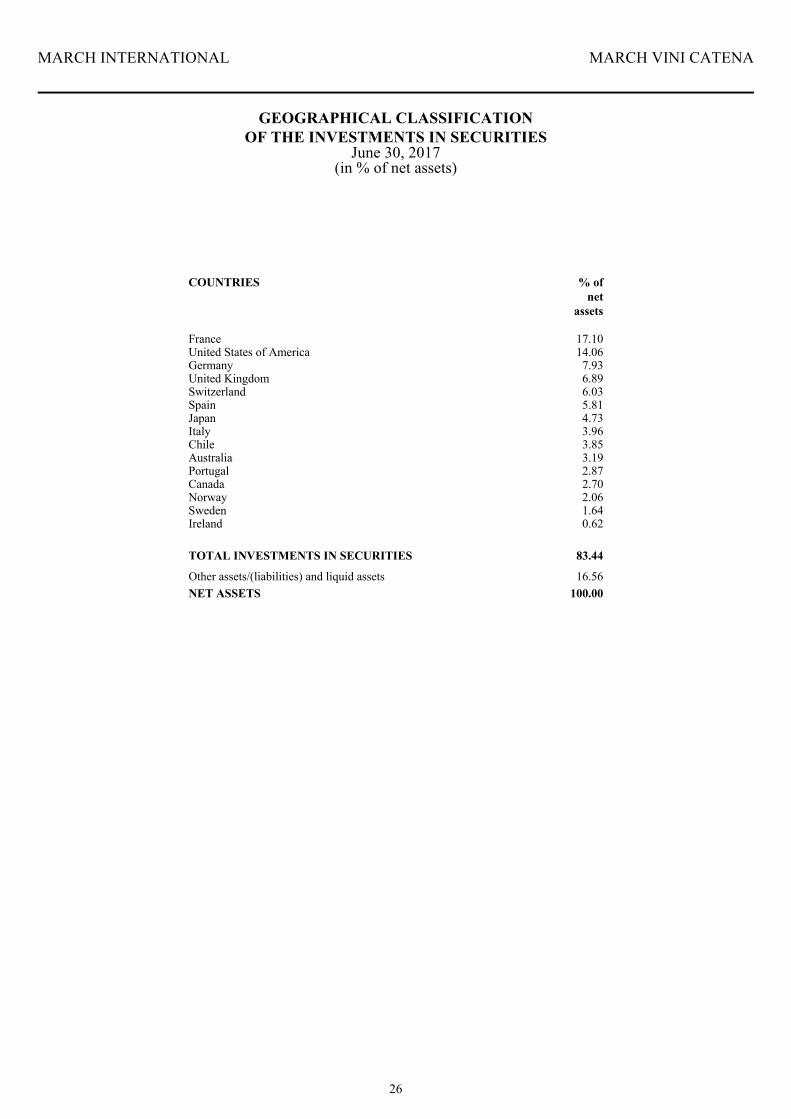
France 17.10United States of America 14.06Germany 7.93United Kingdom 6.89Switzerland 6.03Spain 5.81Japan 4.73Italy 3.96Chile 3.85Australia 3.19Portugal 2.87Canada 2.70Norway 2.06Sweden 1.64Ireland 0.62
TOTAL INVESTMENTS IN SECURITIES
Other assets/(liabilities) and liquid assets 16.56NET ASSETS 100.00
83.44
% ofnet
assets
COUNTRIES
27
MARCH INTERNATIONAL MARCH VINI CATENA
ECONOMIC CLASSIFICATIONOF THE INVESTMENTS IN SECURITIES
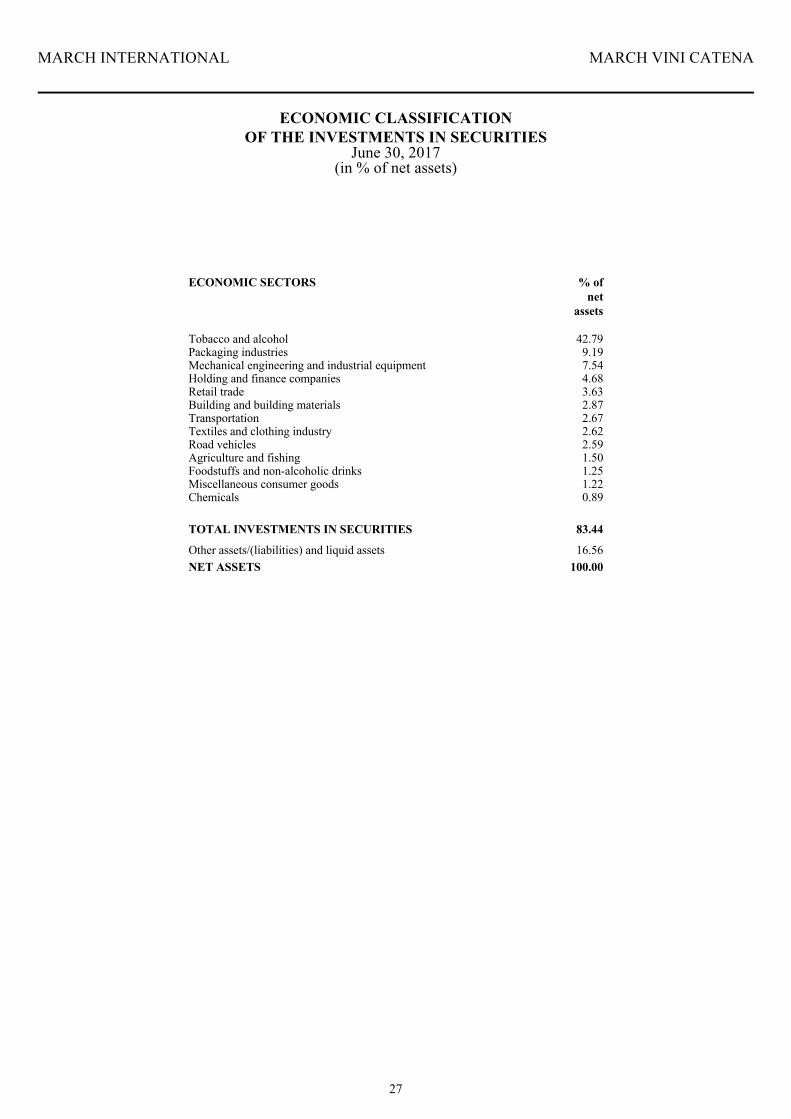
June 30, 2017(in % of net assets)
Tobacco and alcohol 42.79Packaging industries 9.19Mechanical engineering and industrial equipment 7.54Holding and finance companies 4.68Retail trade 3.63Building and building materials 2.87Transportation 2.67Textiles and clothing industry 2.62Road vehicles 2.59Agriculture and fishing 1.50Foodstuffs and non-alcoholic drinks 1.25Miscellaneous consumer goods 1.22Chemicals 0.89
ECONOMIC SECTORS % ofnet
assets
TOTAL INVESTMENTS IN SECURITIES
Other assets/(liabilities) and liquid assets 16.56NET ASSETS 100.00
83.44
28
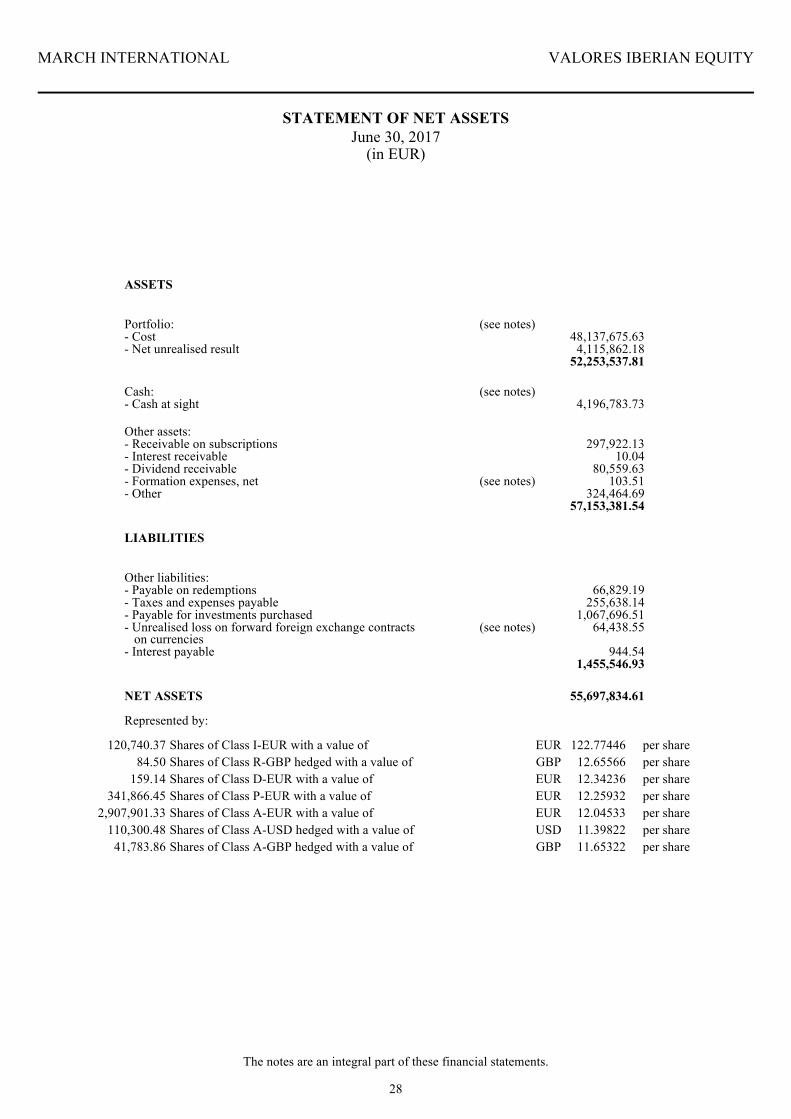
MARCH INTERNATIONAL VALORES IBERIAN EQUITY
STATEMENT OF NET ASSETSJune 30, 2017
(in EUR)
The notes are an integral part of these financial statements.
ASSETS
Portfolio: (see notes)- Cost 48,137,675.63- Net unrealised result 4,115,862.18
52,253,537.81
Cash: (see notes)- Cash at sight 4,196,783.73
Other assets:- Receivable on subscriptions 297,922.13- Interest receivable 10.04- Dividend receivable 80,559.63- Formation expenses, net (see notes) 103.51- Other 324,464.69
57,153,381.54
LIABILITIES
Other liabilities:- Payable on redemptions 66,829.19- Taxes and expenses payable 255,638.14- Payable for investments purchased 1,067,696.51- Unrealised loss on forward foreign exchange contracts on currencies
(see notes) 64,438.55
- Interest payable 944.541,455,546.93
NET ASSETS 55,697,834.61
120,740.37 122.77446 per shareEURShares of Class I-EUR with a value of84.50 12.65566 per shareGBPShares of Class R-GBP hedged with a value of
159.14 12.34236 per shareEURShares of Class D-EUR with a value of341,866.45 12.25932 per shareEURShares of Class P-EUR with a value of
2,907,901.33 12.04533 per shareEURShares of Class A-EUR with a value of110,300.48 11.39822 per shareUSDShares of Class A-USD hedged with a value of
41,783.86 11.65322 per shareGBPShares of Class A-GBP hedged with a value of
Represented by:
29
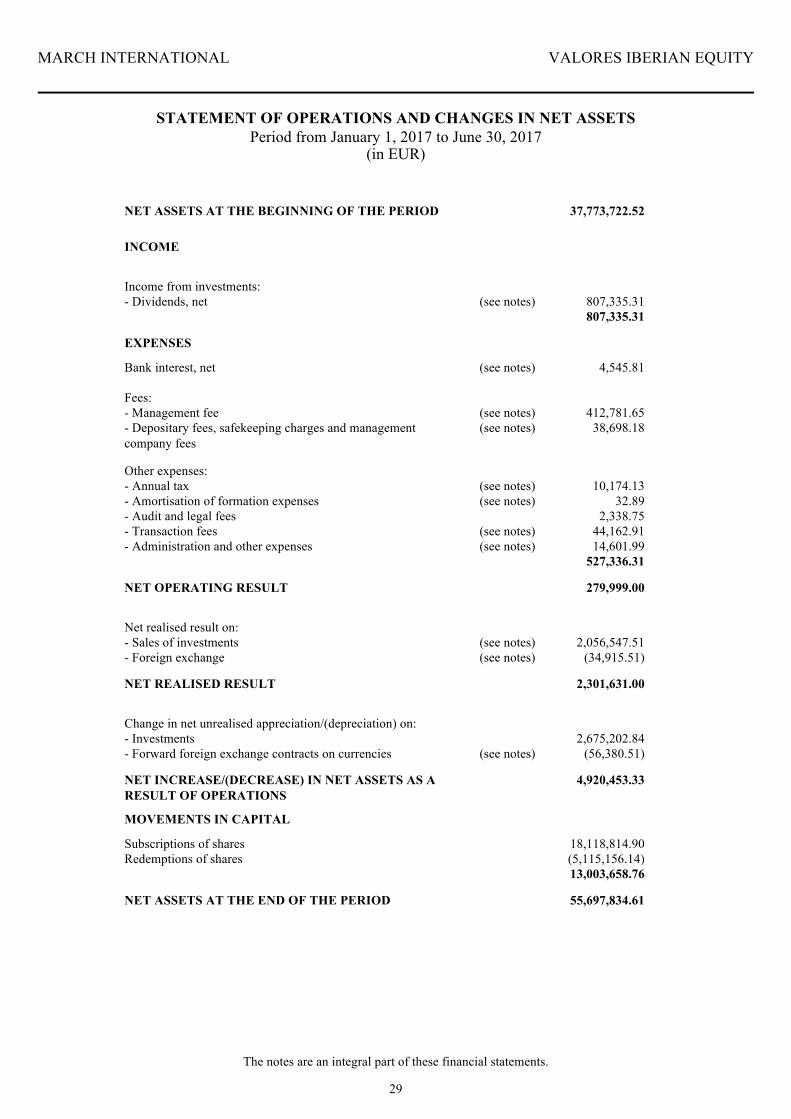
MARCH INTERNATIONAL VALORES IBERIAN EQUITY
STATEMENT OF OPERATIONS AND CHANGES IN NET ASSETSPeriod from January 1, 2017 to June 30, 2017
NET ASSETS AT THE BEGINNING OF THE PERIOD 37,773,722.52
INCOME
Income from investments:- Dividends, net (see notes) 807,335.31
807,335.31
EXPENSES
Bank interest, net (see notes) 4,545.81
Fees:- Management fee (see notes) 412,781.65- Depositary fees, safekeeping charges and managementcompany fees
(see notes) 38,698.18
Other expenses:- Annual tax (see notes) 10,174.13- Amortisation of formation expenses (see notes) 32.89- Audit and legal fees 2,338.75- Transaction fees (see notes) 44,162.91- Administration and other expenses (see notes) 14,601.99
527,336.31
NET OPERATING RESULT 279,999.00
Net realised result on:- Sales of investments (see notes) 2,056,547.51- Foreign exchange (see notes) (34,915.51)
NET REALISED RESULT 2,301,631.00
Change in net unrealised appreciation/(depreciation) on:- Investments 2,675,202.84- Forward foreign exchange contracts on currencies (see notes) (56,380.51)
NET INCREASE/(DECREASE) IN NET ASSETS AS ARESULT OF OPERATIONS
4,920,453.33
MOVEMENTS IN CAPITAL
Subscriptions of shares 18,118,814.90Redemptions of shares (5,115,156.14)
13,003,658.76
NET ASSETS AT THE END OF THE PERIOD 55,697,834.61
(in EUR)
The notes are an integral part of these financial statements.
30
MARCH INTERNATIONAL VALORES IBERIAN EQUITY
CHANGES IN THE NUMBER OF SHARES,IN NET ASSETS AND
IN NET ASSET VALUE PER SHARE
Date ShareClass
Number of shares
outstanding
NetAssets
Ccy Net assetvalue
per share
80,563.83 95.365117,682,978.0412.31.14 Class I-EUR EUR84.50 9.68201818.13Class R-GBP hedged GBP
100.00 9.63080963.08Class D-EUR EUR477,224.01 9.531774,548,790.58Class P-EUR EUR160,365.93 9.542621,530,311.79Class A-EUR EUR
2,995.34 8.9583126,833.17Class A-USD hedged USD32,946.06 9.17838302,382.05Class A-GBP hedged GBP
74,011.62 100.028987,403,306.65Class I-EUR EUR12.31.1584.50 10.19528861.50Class R-GBP hedged GBP
148.12 10.096881,495.51Class D-EUR EUR693,908.12 9.993806,934,776.99Class P-EUR EUR
2,688,507.79 9.9306026,698,482.19Class A-EUR EUR2,624.51 9.2658224,318.26Class A-USD hedged USD
34,105.12 9.53808325,297.50Class A-GBP hedged GBP
88,770.82 109.812869,748,176.96Class I-EUR12.31.16 EUR84.50 11.25882951.37Class R-GBP hedged GBP
147.06 11.055921,625.90Class D-EUR EUR298,535.63 10.967363,274,146.34Class P-EUR EUR
2,163,690.81 10.8161823,402,870.08Class A-EUR EUR99,829.38 10.152281,013,496.05Class A-USD hedged USD31,498.50 10.42507328,374.17Class A-GBP hedged GBP
120,740.37 122.7744614,823,834.22Class I-EUR06.30.17 EUR84.50 12.655661,069.40Class R-GBP hedged GBP
159.14 12.342361,964.17Class D-EUR EUR341,866.45 12.259324,191,051.62Class P-EUR EUR
2,907,901.33 12.0453335,026,625.25Class A-EUR EUR110,300.48 11.398221,257,229.01Class A-USD hedged USD
41,783.86 11.65322486,916.70Class A-GBP hedged GBP
The notes are an integral part of these financial statements.
31
MARCH INTERNATIONAL VALORES IBERIAN EQUITY
STATEMENT OF INVESTMENTS IN SECURITIESAND OTHER NET ASSETS
June 30, 2017(in EUR)
The notes are an integral part of these financial statements.
Quantity Description Cost (inEUR)
Valueper
security(in invest
ccy)
Marketvalue (in
EUR)(see notes)
% ofnet
assets
702,255.00 EDREAMS ODIGEO SA REG SHS EUR 3.085 2,166,456.68 3.891,898,912.07
LUXEMBOURG
EQUITIES
TRANSFERABLE SECURITIES AND MONEYMARKET INSTRUMENTS ADMITTED TO ANOFFICIAL STOCK EXCHANGE OR DEALT IN ONANOTHER REGULATED MARKET
3.892,166,456.681,898,912.07TOTAL LUXEMBOURG
54,000.00 CORTICEIRA AMORIN SA EUR 12.785 690,390.00 1.24579,128.40
PORTUGAL
387,986.00 CTT-CORREIOS DE PORTUGAL S.A. EUR 5.569 2,160,694.03 3.872,251,244.6485,877.00 GALP ENERGIA SA REG SHS -B- EUR 13.205 1,134,005.79 2.041,238,253.74
223,677.00 NOS REG SHS EUR 5.317 1,189,290.61 2.141,144,167.881,986,561.00 SONAE SGPS - REG SHS EUR 0.967 1,921,004.49 3.451,902,458.19
12.747,095,384.927,115,252.85TOTAL PORTUGAL
64,649.00 ABERTIS INFRAESTRUCTURAS SA -A- EUR 16.235 1,049,576.52 1.881,067,678.24
SPAIN
122,441.00 ACERINOX REG SHS EUR 11.930 1,460,721.13 2.621,595,290.7733,102.00 AMADEUS IT -A- EUR 51.890 1,717,662.78 3.081,325,037.37
108,638.00 APPLUS SERVICES S.A. EUR 10.895 1,183,611.01 2.13883,487.38226,845.00 BANKINTER REG.SHS EUR 8.129 1,844,023.01 3.311,914,119.22
9,095.00 BARON DE LEY EUR 114.000 1,036,830.00 1.86890,063.7537,890.00 BOLSAS Y MERCADOS ESPANOLES SA EUR 31.295 1,185,767.55 2.131,092,936.0462,669.00 CIE AUTOMOTIVE SA EUR 19.915 1,248,053.14 2.24978,502.5621,440.00 CONSTR AUXIL FERROC EUR 35.990 771,625.60 1.39587,132.6137,440.00 CORP FIN ALBA SPLIT ISS.99 EUR 52.400 1,961,856.00 3.521,572,027.50
149,573.00 DIA EUR 5.488 820,856.62 1.47694,082.3940,480.00 DISTRIBUCION INTEGRAL HOLDINGS EUR 23.285 942,576.80 1.69719,907.7263,819.00 ENDESA EUR 20.565 1,312,437.74 2.361,335,723.90
193,134.00 EUSKALTEL EUR 9.482 1,831,296.59 3.291,819,876.82107,467.00 FERROVIAL SA EUR 19.365 2,081,098.46 3.731,813,715.36
79,333.00 GAS NATURAL SDG EUR 20.750 1,646,159.75 2.961,462,554.80276,859.00 GLOBAL DOMINION ACCESS SA EUR 3.880 1,074,212.92 1.93987,933.45
98,334.00 GRIFOLS SA -B- EUR 18.495 1,818,687.33 3.271,510,156.5035,632.00 GRUPO CATALANA OCCIDENTE SA EUR 37.000 1,318,384.00 2.371,034,845.7560,669.00 INDITEX SHARE FROM SPLIT EUR 33.920 2,057,892.48 3.681,800,680.66
119,146.00 INDRA SISTEMAS SA EUR 12.525 1,492,303.65 2.681,165,011.64214,752.00 INMOBILIARIA COLONIAL SA EUR 7.590 1,629,967.68 2.931,415,305.33
75,542.00 MERLIN PROPERTIES SOCIMI S.A. EUR 11.115 839,649.33 1.51710,970.54294,834.00 NATURHOUSE EUR 4.200 1,238,302.80 2.221,296,379.89395,996.00 NH HOTELES SA EUR 5.145 2,037,399.42 3.661,811,475.67
62,500.00 PARQUETOS REUNIDOS EUR 16.010 1,000,625.00 1.80968,750.00218,107.00 PROSEGUR EUR 5.640 1,230,123.48 2.211,205,773.70
66,372.00 RED ELECTRICA EUR 18.235 1,210,293.42 2.171,161,484.2241,442.00 REPSOL SA EUR 13.525 560,503.05 1.01513,273.3431,455.00 TECNICAS REUNIDAS EUR 33.960 1,068,211.80 1.921,066,412.92
144,210.00 TELEFONICA S A EUR 9.100 1,312,311.00 2.361,470,146.68
Ccy
32
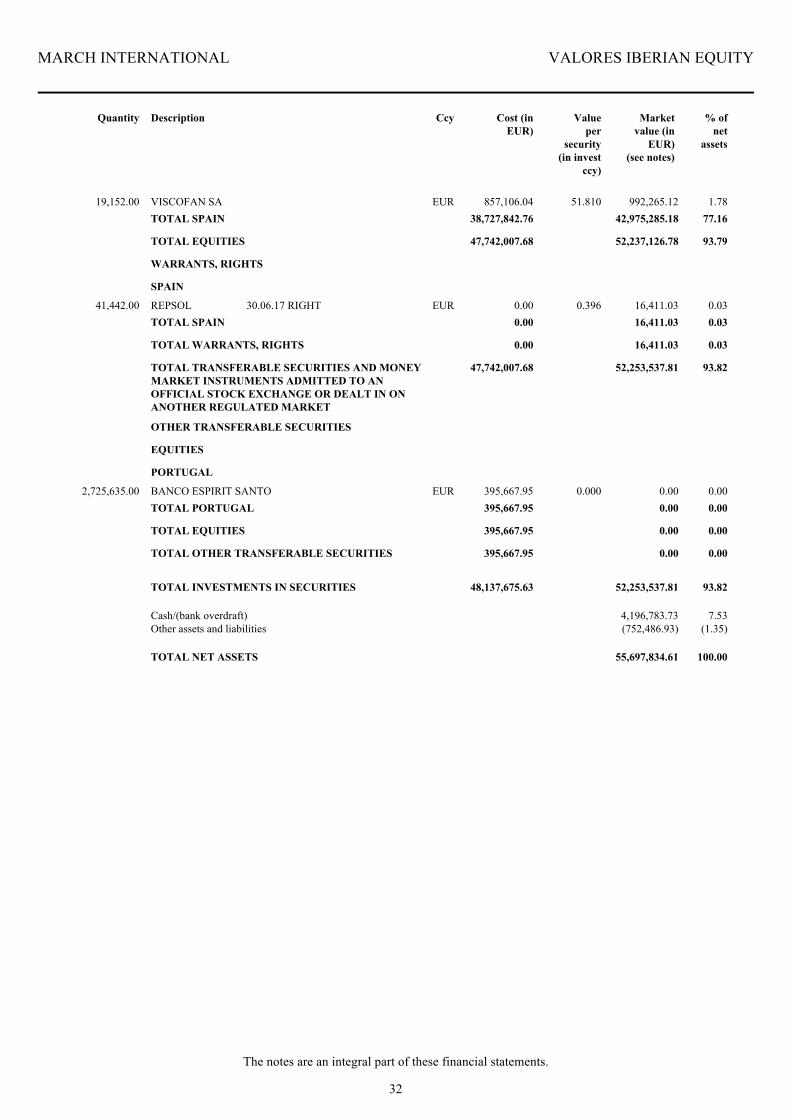
MARCH INTERNATIONAL VALORES IBERIAN EQUITY
The notes are an integral part of these financial statements.
Quantity Description Cost (inEUR)
Valueper
security(in invest
ccy)
Marketvalue (in
EUR)(see notes)
% ofnet
assets
19,152.00 VISCOFAN SA EUR 51.810 992,265.12 1.78857,106.0477.1642,975,285.1838,727,842.76TOTAL SPAIN
TOTAL EQUITIES 93.7952,237,126.7847,742,007.68
41,442.00 REPSOL 30.06.17 RIGHT EUR 0.396 16,411.03 0.030.00
SPAIN
WARRANTS, RIGHTS
0.0316,411.030.00TOTAL SPAIN
TOTAL WARRANTS, RIGHTS 0.0316,411.030.00
TOTAL TRANSFERABLE SECURITIES AND MONEYMARKET INSTRUMENTS ADMITTED TO ANOFFICIAL STOCK EXCHANGE OR DEALT IN ONANOTHER REGULATED MARKET
93.8252,253,537.8147,742,007.68
2,725,635.00 BANCO ESPIRIT SANTO EUR 0.000 0.00 0.00395,667.95
PORTUGAL
EQUITIES
OTHER TRANSFERABLE SECURITIES
0.000.00395,667.95TOTAL PORTUGAL
TOTAL EQUITIES 0.000.00395,667.95
TOTAL OTHER TRANSFERABLE SECURITIES 0.000.00395,667.95
TOTAL INVESTMENTS IN SECURITIES 93.8252,253,537.8148,137,675.63
Cash/(bank overdraft) 7.534,196,783.73Other assets and liabilities (1.35)(752,486.93)
TOTAL NET ASSETS 100.0055,697,834.61
Ccy
33
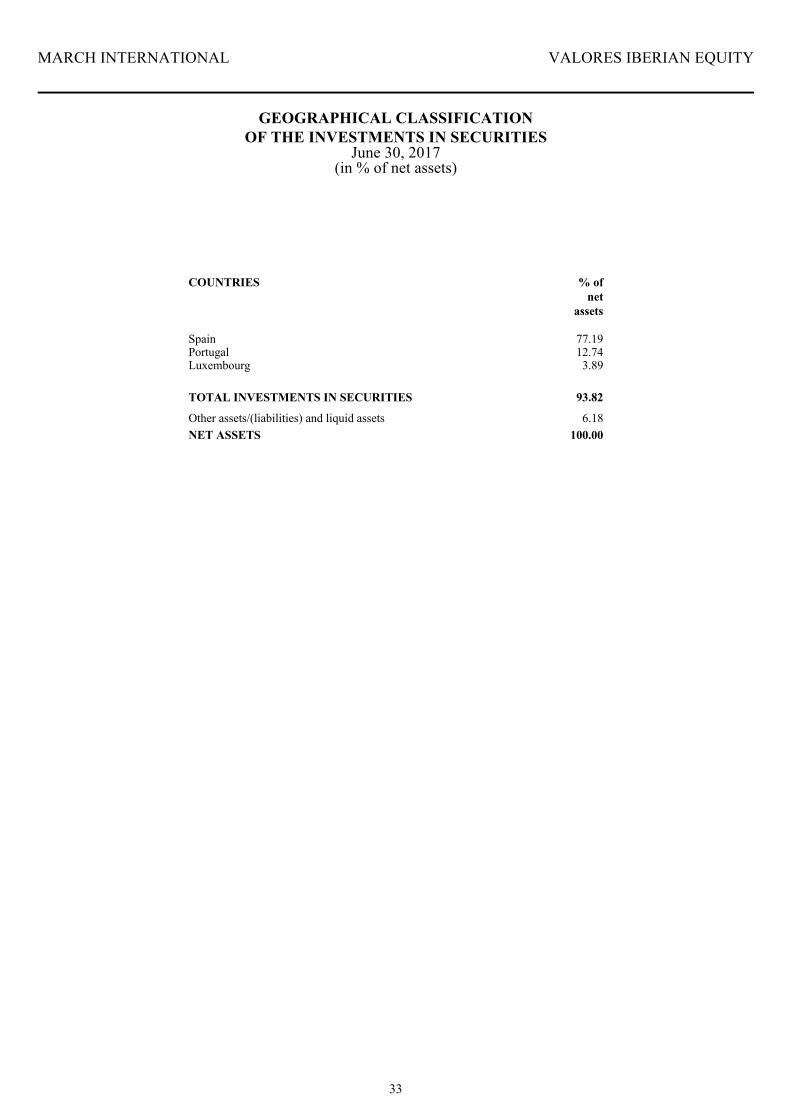
MARCH INTERNATIONAL VALORES IBERIAN EQUITY
GEOGRAPHICAL CLASSIFICATIONOF THE INVESTMENTS IN SECURITIES
June 30, 2017(in % of net assets)
Spain 77.19Portugal 12.74Luxembourg 3.89
TOTAL INVESTMENTS IN SECURITIES
Other assets/(liabilities) and liquid assets 6.18NET ASSETS 100.00
93.82
% ofnet
assets
COUNTRIES
34
MARCH INTERNATIONAL VALORES IBERIAN EQUITY
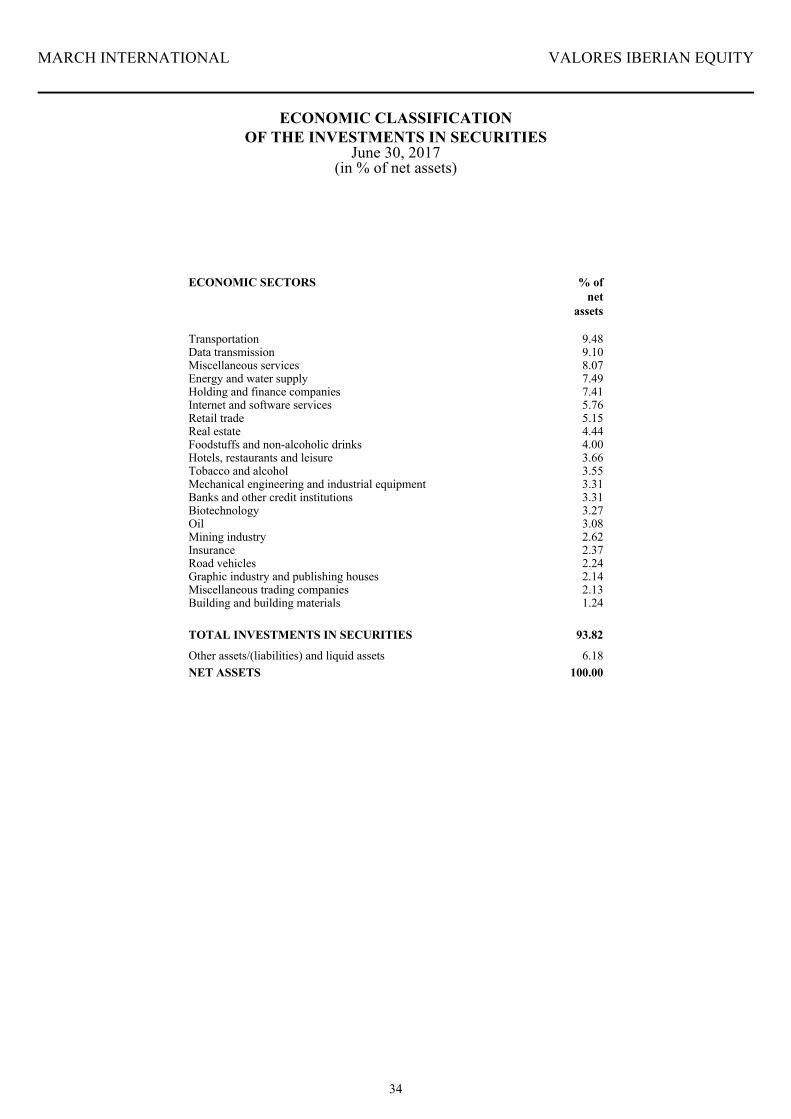
ECONOMIC CLASSIFICATIONOF THE INVESTMENTS IN SECURITIES
June 30, 2017(in % of net assets)
Transportation 9.48Data transmission 9.10Miscellaneous services 8.07Energy and water supply 7.49Holding and finance companies 7.41Internet and software services 5.76Retail trade 5.15Real estate 4.44Foodstuffs and non-alcoholic drinks 4.00Hotels, restaurants and leisure 3.66Tobacco and alcohol 3.55Mechanical engineering and industrial equipment 3.31Banks and other credit institutions 3.31Biotechnology 3.27Oil 3.08Mining industry 2.62Insurance 2.37Road vehicles 2.24Graphic industry and publishing houses 2.14Miscellaneous trading companies 2.13Building and building materials 1.24
ECONOMIC SECTORS % ofnet
assets
TOTAL INVESTMENTS IN SECURITIES
Other assets/(liabilities) and liquid assets 6.18NET ASSETS 100.00
93.82
35
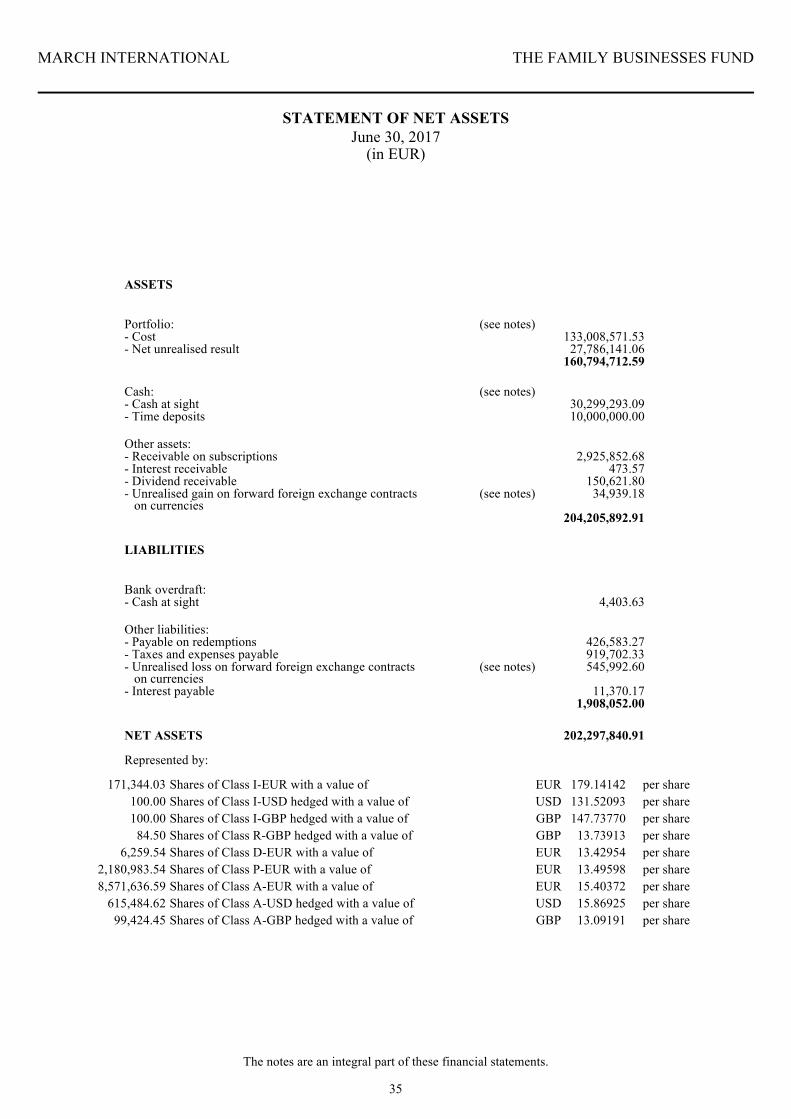
MARCH INTERNATIONAL THE FAMILY BUSINESSES FUND
STATEMENT OF NET ASSETSJune 30, 2017
(in EUR)
The notes are an integral part of these financial statements.
ASSETS
Portfolio: (see notes)- Cost 133,008,571.53- Net unrealised result 27,786,141.06
160,794,712.59
Cash: (see notes)- Cash at sight 30,299,293.09- Time deposits 10,000,000.00
Other assets:- Receivable on subscriptions 2,925,852.68- Interest receivable 473.57- Dividend receivable 150,621.80- Unrealised gain on forward foreign exchange contracts on currencies
(see notes) 34,939.18
204,205,892.91
LIABILITIES
Bank overdraft:- Cash at sight 4,403.63
Other liabilities:- Payable on redemptions 426,583.27- Taxes and expenses payable 919,702.33- Unrealised loss on forward foreign exchange contracts on currencies
(see notes) 545,992.60
- Interest payable 11,370.171,908,052.00
NET ASSETS 202,297,840.91
171,344.03 179.14142 per shareEURShares of Class I-EUR with a value of100.00 131.52093 per shareUSDShares of Class I-USD hedged with a value of100.00 147.73770 per shareGBPShares of Class I-GBP hedged with a value of
84.50 13.73913 per shareGBPShares of Class R-GBP hedged with a value of6,259.54 13.42954 per shareEURShares of Class D-EUR with a value of
2,180,983.54 13.49598 per shareEURShares of Class P-EUR with a value of8,571,636.59 15.40372 per shareEURShares of Class A-EUR with a value of
615,484.62 15.86925 per shareUSDShares of Class A-USD hedged with a value of99,424.45 13.09191 per shareGBPShares of Class A-GBP hedged with a value of
Represented by:
36
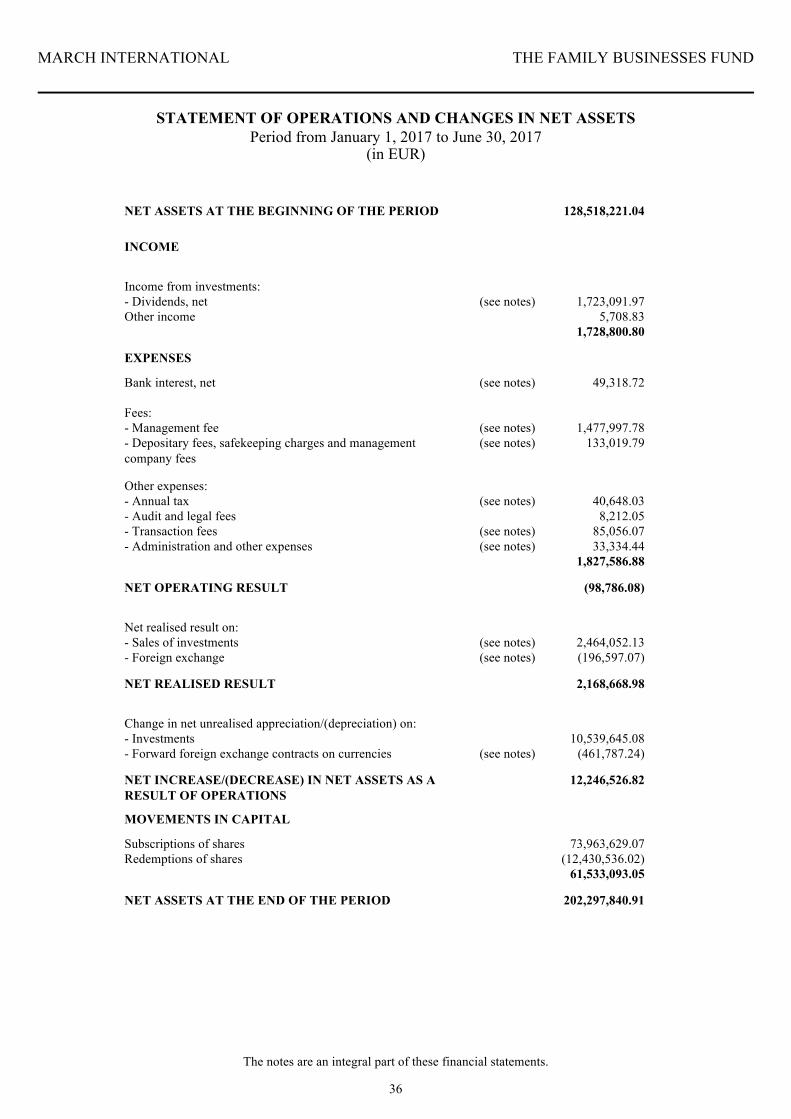
MARCH INTERNATIONAL THE FAMILY BUSINESSES FUND
STATEMENT OF OPERATIONS AND CHANGES IN NET ASSETSPeriod from January 1, 2017 to June 30, 2017
NET ASSETS AT THE BEGINNING OF THE PERIOD 128,518,221.04
INCOME
Income from investments:- Dividends, net (see notes) 1,723,091.97Other income 5,708.83
1,728,800.80
EXPENSES
Bank interest, net (see notes) 49,318.72
Fees:- Management fee (see notes) 1,477,997.78- Depositary fees, safekeeping charges and managementcompany fees
(see notes) 133,019.79
Other expenses:- Annual tax (see notes) 40,648.03- Audit and legal fees 8,212.05- Transaction fees (see notes) 85,056.07- Administration and other expenses (see notes) 33,334.44
1,827,586.88
NET OPERATING RESULT (98,786.08)
Net realised result on:- Sales of investments (see notes) 2,464,052.13- Foreign exchange (see notes) (196,597.07)
NET REALISED RESULT 2,168,668.98
Change in net unrealised appreciation/(depreciation) on:- Investments 10,539,645.08- Forward foreign exchange contracts on currencies (see notes) (461,787.24)
NET INCREASE/(DECREASE) IN NET ASSETS AS ARESULT OF OPERATIONS
12,246,526.82
MOVEMENTS IN CAPITAL
Subscriptions of shares 73,963,629.07Redemptions of shares (12,430,536.02)
61,533,093.05
NET ASSETS AT THE END OF THE PERIOD 202,297,840.91
(in EUR)
The notes are an integral part of these financial statements.
37
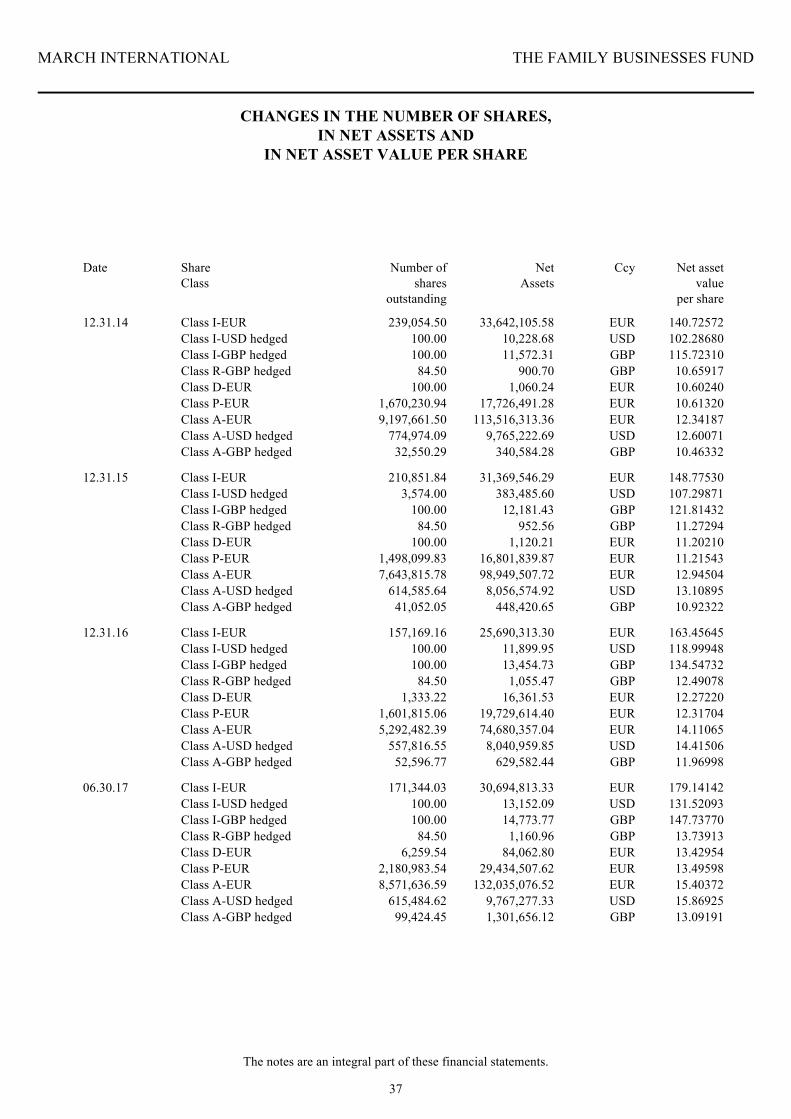
MARCH INTERNATIONAL THE FAMILY BUSINESSES FUND
CHANGES IN THE NUMBER OF SHARES,IN NET ASSETS AND
IN NET ASSET VALUE PER SHARE
Date ShareClass
Number of shares
outstanding
NetAssets
Ccy Net assetvalue
per share
239,054.50 140.7257233,642,105.5812.31.14 Class I-EUR EUR100.00 102.2868010,228.68Class I-USD hedged USD100.00 115.7231011,572.31Class I-GBP hedged GBP
84.50 10.65917900.70Class R-GBP hedged GBP100.00 10.602401,060.24Class D-EUR EUR
1,670,230.94 10.6132017,726,491.28Class P-EUR EUR9,197,661.50 12.34187113,516,313.36Class A-EUR EUR
774,974.09 12.600719,765,222.69Class A-USD hedged USD32,550.29 10.46332340,584.28Class A-GBP hedged GBP
210,851.84 148.7753031,369,546.29Class I-EUR EUR12.31.153,574.00 107.29871383,485.60Class I-USD hedged USD
100.00 121.8143212,181.43Class I-GBP hedged GBP84.50 11.27294952.56Class R-GBP hedged GBP
100.00 11.202101,120.21Class D-EUR EUR1,498,099.83 11.2154316,801,839.87Class P-EUR EUR7,643,815.78 12.9450498,949,507.72Class A-EUR EUR
614,585.64 13.108958,056,574.92Class A-USD hedged USD41,052.05 10.92322448,420.65Class A-GBP hedged GBP
157,169.16 163.4564525,690,313.30Class I-EUR12.31.16 EUR100.00 118.9994811,899.95Class I-USD hedged USD100.00 134.5473213,454.73Class I-GBP hedged GBP
84.50 12.490781,055.47Class R-GBP hedged GBP1,333.22 12.2722016,361.53Class D-EUR EUR
1,601,815.06 12.3170419,729,614.40Class P-EUR EUR5,292,482.39 14.1106574,680,357.04Class A-EUR EUR
557,816.55 14.415068,040,959.85Class A-USD hedged USD52,596.77 11.96998629,582.44Class A-GBP hedged GBP
171,344.03 179.1414230,694,813.33Class I-EUR06.30.17 EUR100.00 131.5209313,152.09Class I-USD hedged USD100.00 147.7377014,773.77Class I-GBP hedged GBP
84.50 13.739131,160.96Class R-GBP hedged GBP6,259.54 13.4295484,062.80Class D-EUR EUR
2,180,983.54 13.4959829,434,507.62Class P-EUR EUR8,571,636.59 15.40372132,035,076.52Class A-EUR EUR
615,484.62 15.869259,767,277.33Class A-USD hedged USD99,424.45 13.091911,301,656.12Class A-GBP hedged GBP
The notes are an integral part of these financial statements.
38
MARCH INTERNATIONAL THE FAMILY BUSINESSES FUND
STATEMENT OF INVESTMENTS IN SECURITIESAND OTHER NET ASSETS
June 30, 2017(in EUR)
The notes are an integral part of these financial statements.
Quantity Description Cost (inEUR)
Valueper
security(in invest
ccy)
Marketvalue (in
EUR)(see notes)
% ofnet
assets
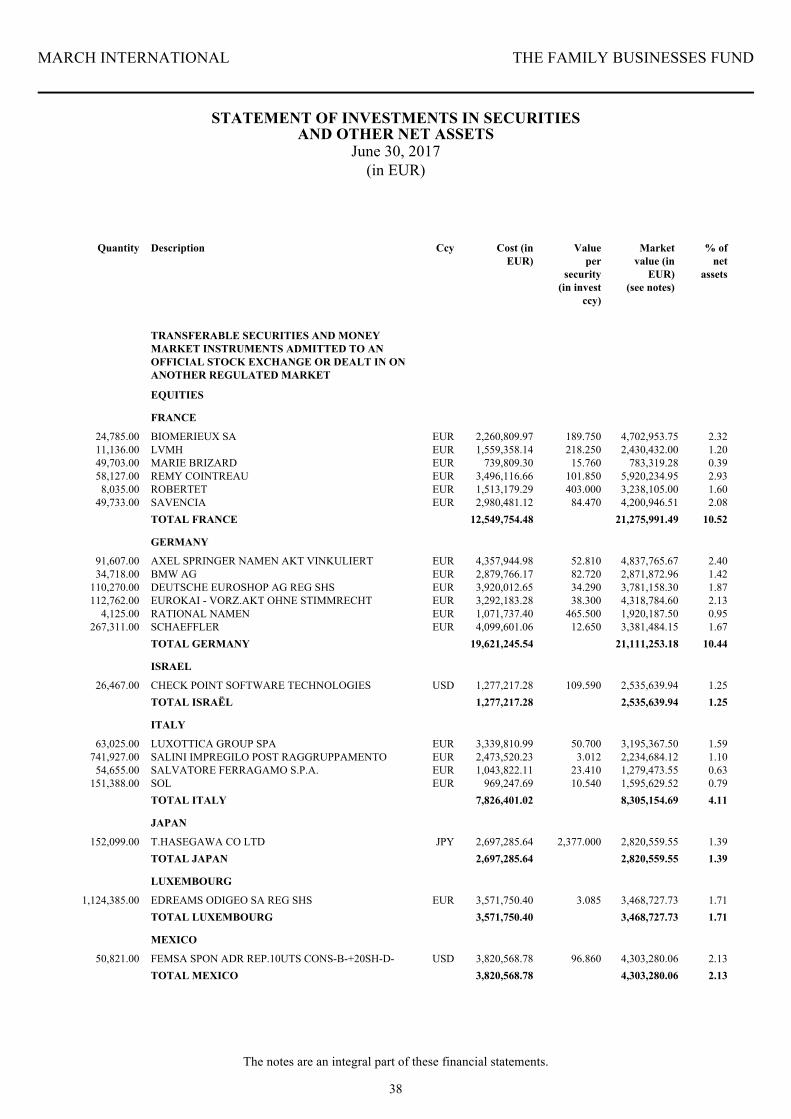
24,785.00 BIOMERIEUX SA EUR 189.750 4,702,953.75 2.322,260,809.97
FRANCE
EQUITIES
TRANSFERABLE SECURITIES AND MONEYMARKET INSTRUMENTS ADMITTED TO ANOFFICIAL STOCK EXCHANGE OR DEALT IN ONANOTHER REGULATED MARKET
11,136.00 LVMH EUR 218.250 2,430,432.00 1.201,559,358.1449,703.00 MARIE BRIZARD EUR 15.760 783,319.28 0.39739,809.3058,127.00 REMY COINTREAU EUR 101.850 5,920,234.95 2.933,496,116.66
8,035.00 ROBERTET EUR 403.000 3,238,105.00 1.601,513,179.2949,733.00 SAVENCIA EUR 84.470 4,200,946.51 2.082,980,481.12
10.5221,275,991.4912,549,754.48TOTAL FRANCE
91,607.00 AXEL SPRINGER NAMEN AKT VINKULIERT EUR 52.810 4,837,765.67 2.404,357,944.98
GERMANY
34,718.00 BMW AG EUR 82.720 2,871,872.96 1.422,879,766.17110,270.00 DEUTSCHE EUROSHOP AG REG SHS EUR 34.290 3,781,158.30 1.873,920,012.65112,762.00 EUROKAI - VORZ.AKT OHNE STIMMRECHT EUR 38.300 4,318,784.60 2.133,292,183.28
4,125.00 RATIONAL NAMEN EUR 465.500 1,920,187.50 0.951,071,737.40267,311.00 SCHAEFFLER EUR 12.650 3,381,484.15 1.674,099,601.06
10.4421,111,253.1819,621,245.54TOTAL GERMANY
26,467.00 CHECK POINT SOFTWARE TECHNOLOGIES USD 109.590 2,535,639.94 1.251,277,217.28
ISRAEL
1.252,535,639.941,277,217.28TOTAL ISRAËL
63,025.00 LUXOTTICA GROUP SPA EUR 50.700 3,195,367.50 1.593,339,810.99
ITALY
741,927.00 SALINI IMPREGILO POST RAGGRUPPAMENTO EUR 3.012 2,234,684.12 1.102,473,520.2354,655.00 SALVATORE FERRAGAMO S.P.A. EUR 23.410 1,279,473.55 0.631,043,822.11
151,388.00 SOL EUR 10.540 1,595,629.52 0.79969,247.694.118,305,154.697,826,401.02TOTAL ITALY
152,099.00 T.HASEGAWA CO LTD JPY 2,377.000 2,820,559.55 1.392,697,285.64
JAPAN
1.392,820,559.552,697,285.64TOTAL JAPAN
1,124,385.00 EDREAMS ODIGEO SA REG SHS EUR 3.085 3,468,727.73 1.713,571,750.40
LUXEMBOURG
1.713,468,727.733,571,750.40TOTAL LUXEMBOURG
50,821.00 FEMSA SPON ADR REP.10UTS CONS-B-+20SH-D- USD 96.860 4,303,280.06 2.133,820,568.78
MEXICO
2.134,303,280.063,820,568.78TOTAL MEXICO
Ccy
39
MARCH INTERNATIONAL THE FAMILY BUSINESSES FUND
The notes are an integral part of these financial statements.
Quantity Description Cost (inEUR)
Valueper
security(in invest
ccy)
Marketvalue (in
EUR)(see notes)
% ofnet
assets
5,946,494.00 SONAE SGPS - REG SHS EUR 0.967 5,750,259.70 2.846,011,437.19
PORTUGAL
2.845,750,259.706,011,437.19TOTAL PORTUGAL
6,170.00 SAMSUNG ELEC GDR REP.0.5 VGT HS -144A- USD 1,041.000 5,614,975.09 2.782,817,007.29
SOUTH KOREA
2.785,614,975.092,817,007.29TOTAL SOUTH KOREA
95,090.00 GRUPO CATALANA OCCIDENTE SA EUR 37.000 3,518,330.00 1.742,383,268.85
SPAIN
89,771.00 INDITEX SHARE FROM SPLIT EUR 33.920 3,045,032.32 1.512,031,766.42897,986.00 PROSEGUR EUR 5.640 5,064,641.04 2.504,440,792.20
1,000,000.00 PROSEGUR CASH SA EUR 2.270 2,270,000.00 1.122,000,000.006.8713,898,003.3610,855,827.47TOTAL SPAIN
122,821.00 TOBII SEK 40.100 508,633.34 0.25790,084.56
SWEDEN
0.25508,633.34790,084.56TOTAL SWEDEN
11,446.00 BUCHER INDUSTRIES NAMEN AKT CHF 300.250 3,141,085.37 1.552,402,485.07
SWITZERLAND
70,622.00 CIE FINANCIERE RICHEMONT NAMEN AKT CHF 78.600 5,073,475.19 2.514,888,427.2425,936.00 ROCHE HOLDING AG GENUSSSCHEIN CHF 246.900 5,852,845.63 2.905,724,500.1428,434.00 SCHINDLER HOLDING SA CHF 203.500 5,288,656.43 2.613,162,087.0113,670.00 THE SWATCH GROUP CHF 353.400 4,415,481.22 2.184,399,495.84
1,694.00 VETROPACK HOLDING SA CHF 2,053.000 3,178,669.23 1.572,469,793.1513.3226,950,213.0723,046,788.45TOTAL SWITZERLAND
84,722.00 HEINEKEN HOLDING EUR 80.110 6,787,079.42 3.354,848,694.07
THE NETHERLANDS
3.356,787,079.424,848,694.07TOTAL THE NETHERLANDS
309,135.00 ANTOFAGASTA PLC GBP 8.045 2,829,985.30 1.402,796,864.75
UNITED KINGDOM
1,203,056.00 ASHMORE GROUP GBP 3.548 4,857,126.41 2.405,166,273.941,050,336.00 SPORTS DIRECT GBP 2.972 3,552,114.92 1.763,546,057.10
5.5611,239,226.6311,509,195.79TOTAL UNITED KINGDOM
50,308.00 BERKSHIRE HATHAWAY -B- USD 169.300 7,445,707.14 3.675,578,175.21
UNITED STATES OF AMERICA
44,934.00 ESTEE LAUDER COMPANIES INC -A- USD 95.620 3,756,088.01 1.862,994,618.4258,486.00 HELMERICH PAINE USD 54.370 2,779,861.72 1.373,320,253.48
157,432.00 ORACLE CORP USD 50.200 6,908,896.23 3.425,537,495.3334,057.00 WAL-MART STORES INC USD 75.930 2,260,641.67 1.121,938,034.12
11.4423,151,194.7719,368,576.56TOTAL UNITED STATES OF AMERICA
TOTAL EQUITIES 77.96157,720,192.02130,611,834.52
TOTAL TRANSFERABLE SECURITIES AND MONEYMARKET INSTRUMENTS ADMITTED TO ANOFFICIAL STOCK EXCHANGE OR DEALT IN ONANOTHER REGULATED MARKET
77.96157,720,192.02130,611,834.52
Ccy
40
MARCH INTERNATIONAL THE FAMILY BUSINESSES FUND
The notes are an integral part of these financial statements.
Quantity Description Cost (inEUR)
Valueper
security(in invest
ccy)
Marketvalue (in
EUR)(see notes)
% ofnet
assets
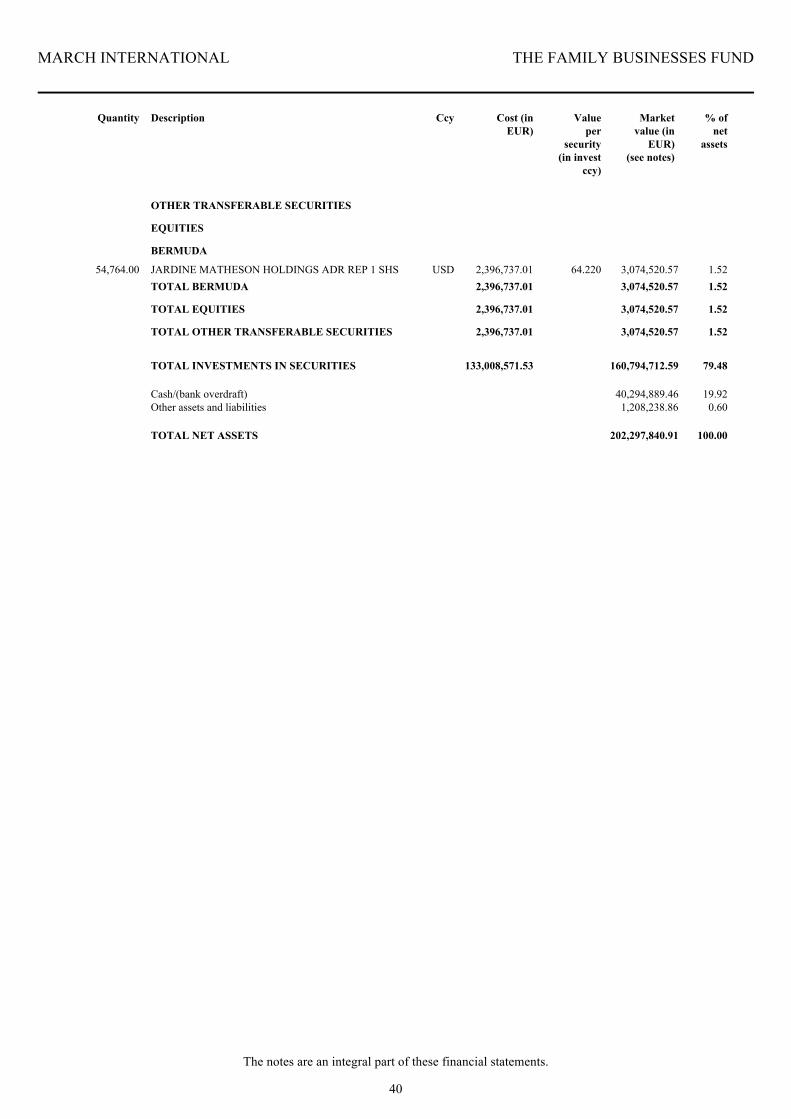
54,764.00 JARDINE MATHESON HOLDINGS ADR REP 1 SHS USD 64.220 3,074,520.57 1.522,396,737.01
BERMUDA
EQUITIES
OTHER TRANSFERABLE SECURITIES
1.523,074,520.572,396,737.01TOTAL BERMUDA
TOTAL EQUITIES 1.523,074,520.572,396,737.01
TOTAL OTHER TRANSFERABLE SECURITIES 1.523,074,520.572,396,737.01
TOTAL INVESTMENTS IN SECURITIES 79.48160,794,712.59133,008,571.53
Cash/(bank overdraft) 19.9240,294,889.46Other assets and liabilities 0.601,208,238.86
TOTAL NET ASSETS 100.00202,297,840.91
Ccy
41
MARCH INTERNATIONAL THE FAMILY BUSINESSES FUND
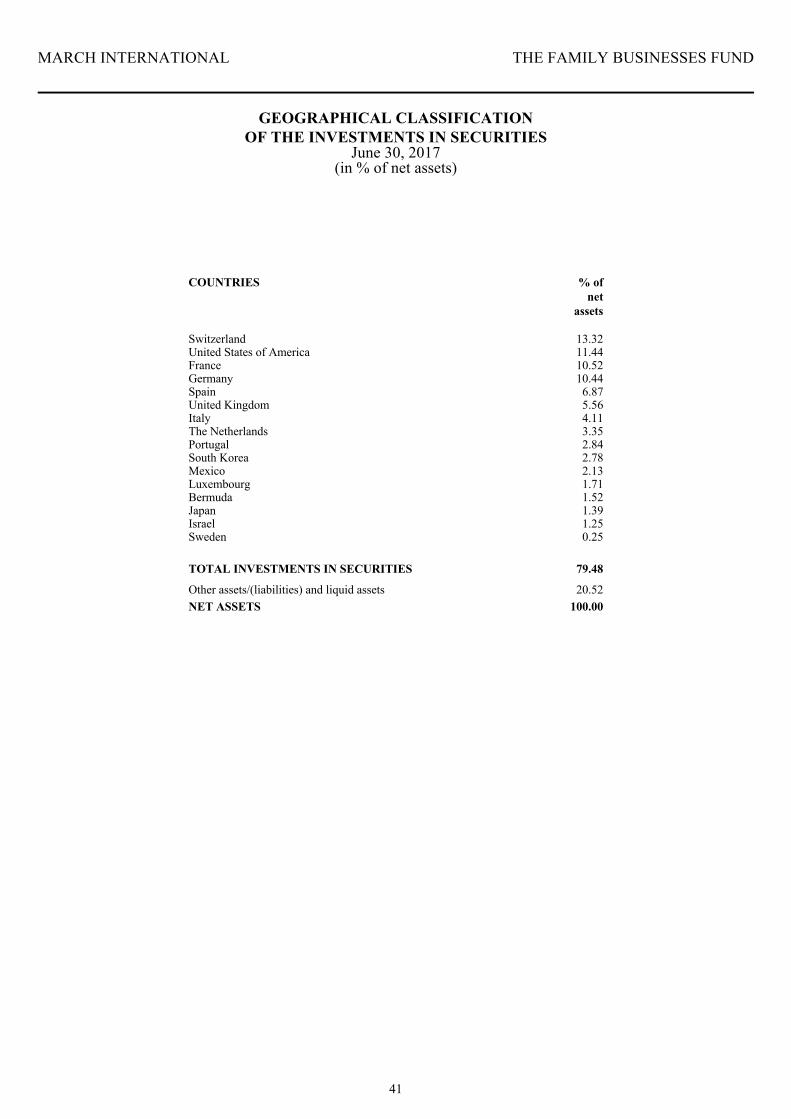
GEOGRAPHICAL CLASSIFICATIONOF THE INVESTMENTS IN SECURITIES
June 30, 2017(in % of net assets)
Switzerland 13.32United States of America 11.44France 10.52Germany 10.44Spain 6.87United Kingdom 5.56Italy 4.11The Netherlands 3.35Portugal 2.84South Korea 2.78Mexico 2.13Luxembourg 1.71Bermuda 1.52Japan 1.39Israel 1.25Sweden 0.25
TOTAL INVESTMENTS IN SECURITIES
Other assets/(liabilities) and liquid assets 20.52NET ASSETS 100.00
79.48
% ofnet
assets
COUNTRIES
42
MARCH INTERNATIONAL THE FAMILY BUSINESSES FUND
ECONOMIC CLASSIFICATIONOF THE INVESTMENTS IN SECURITIES
June 30, 2017(in % of net assets)
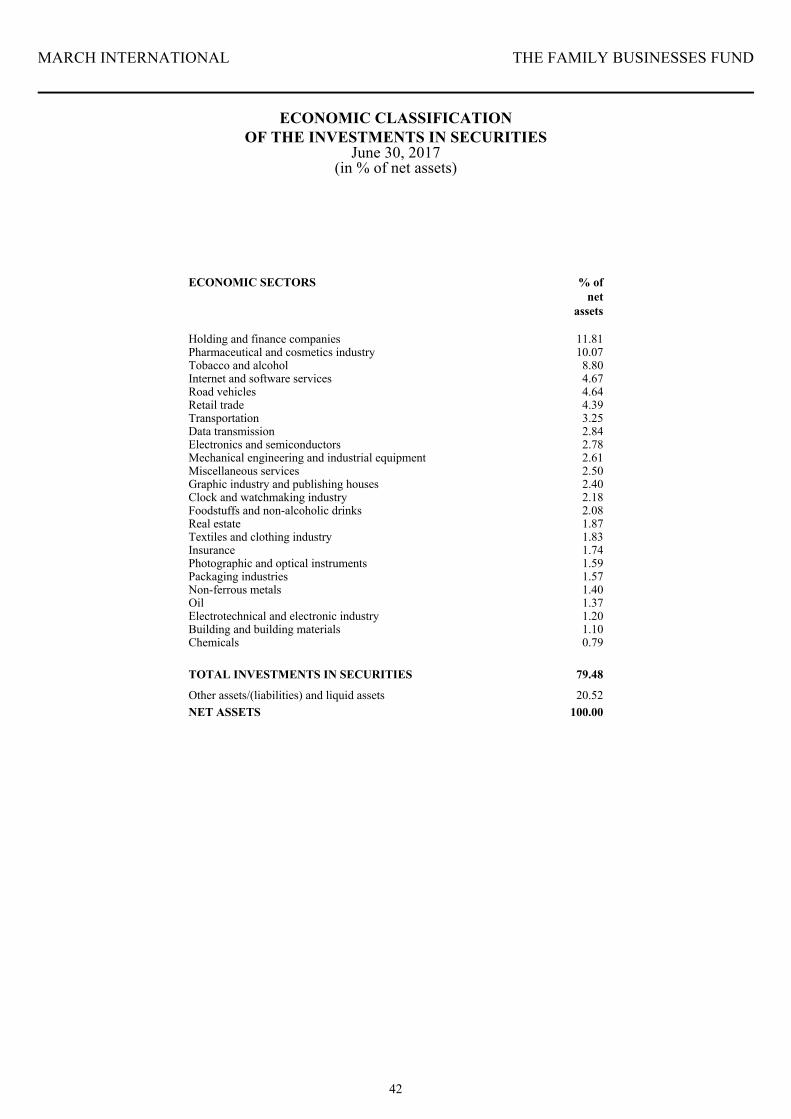
Holding and finance companies 11.81Pharmaceutical and cosmetics industry 10.07Tobacco and alcohol 8.80Internet and software services 4.67Road vehicles 4.64Retail trade 4.39Transportation 3.25Data transmission 2.84Electronics and semiconductors 2.78Mechanical engineering and industrial equipment 2.61Miscellaneous services 2.50Graphic industry and publishing houses 2.40Clock and watchmaking industry 2.18Foodstuffs and non-alcoholic drinks 2.08Real estate 1.87Textiles and clothing industry 1.83Insurance 1.74Photographic and optical instruments 1.59Packaging industries 1.57Non-ferrous metals 1.40Oil 1.37Electrotechnical and electronic industry 1.20Building and building materials 1.10Chemicals 0.79
ECONOMIC SECTORS % ofnet
assets
TOTAL INVESTMENTS IN SECURITIES
Other assets/(liabilities) and liquid assets 20.52NET ASSETS 100.00
79.48
MARCH INTERNATIONAL
43
NOTES TO THE FINANCIAL STATEMENTS
June 30, 2017
GENERAL MARCH INTERNATIONAL (the “Company”) is an open-ended investment company organised under the laws of Luxembourg as a société d'investissement à capital variable (SICAV), incorporated under the form of a public limited liability company (société anonyme) on December 1, 2010 and authorised under part I of the amended law of December 17, 2010 relating to Undertakings for Collective Investment in Transferable Securities (the "2010 Act"). The Company is registered with the Luxembourg trade and companies register under the number B157545. Its original Articles have been published in the “RESA”, Recueil Electronique des Sociétés et Associations on December 29, 2010. The Company has an umbrella structure consisting of one or several Sub-Funds. A separate portfolio of assets is maintained for each Sub-Fund and is invested in accordance with the investment objective and policy applicable to that Sub-Fund. The investment objective, policy, as well as the risk profile and other specific features of each Sub-Fund are set forth in the relevant Special Section of the Company’s prospectus. The Company is one single legal entity. However, the rights of the Shareholders and creditors relating to a Sub-Fund or arising from the setting-up, operation and liquidation of a Sub-Fund are limited to the assets of that Sub-Fund. The assets of a Sub-Fund are exclusively dedicated to the satisfaction of the rights of the Shareholders relating to that Sub-Fund and the rights of those creditors whose claims have arisen in connection with the setting-up, operation and liquidation of that Sub-Fund. The Company's capital and the net assets of all the Sub-Funds are expressed in Euros (EUR). As at June 30, 2017, the following Sub-Funds are available to investors: - MARCH INTERNATIONAL - TORRENOVA LUX - MARCH INTERNATIONAL - MARCH VINI
CATENA - MARCH INTERNATIONAL - VALORES IBERIAN
EQUITY - MARCH INTERNATIONAL - THE FAMILY
BUSINESSES FUND
The Board of Directors of the Company may decide to issue one or more Classes, the assets of which will be commonly invested but subject to different fee structures, distribution, marketing targets, currency or other specific features. A separate Net Asset Value per Share, which may differ as a consequence of these variable factors, will be calculated for each Class. The Company may, at any time, create additional Classes whose features may differ from the existing Classes and additional Sub-Funds, whose investment objectives may differ from those of the existing Sub-Funds. To ensure effective management of the Company, the Board of Directors and the Management Company may decide to manage all or part of the assets of one or more Sub-Funds with those of other Sub-Funds in the Company (pooling technique) or, where applicable, to co-manage all or part of the assets, except for a cash reserve, if necessary, of one or more Sub-Funds with the assets of other Luxembourg investment funds or of one or more sub-funds of other Luxembourg investment funds (hereinafter referred to as the Party(ies) to the co-managed assets) for which the Depositary is the appointed Depositary. These assets will be managed in accordance with the respective investment policies of the Parties to the co-managed assets, each of which is pursuing identical or comparable objectives. Parties to the co-managed assets will only participate in co-managed assets which are in accordance with the stipulations of their respective prospectuses and investment restrictions. Each Party to the co-managed assets will participate in the co-managed assets in proportion to the assets it has contributed to the co-management. Assets and liabilities will be allocated to each Party to the co-managed assets in proportion to its contribution to the co-managed assets. As at June 30, 2017, co-management principle is not applied.
MARCH INTERNATIONAL
44
SUMMARY OF SIGNIFICANT
ACCOUNTING POLICIES The Company prepares its financial statements in conformity with legal and regulatory requirements in Luxembourg applicable to Undertakings for Collective Investment in Transferable Securities and generally accepted accounting principles. The preparation of financial statements in conformity with generally accepted accounting principles in Luxembourg requires management to make estimates and assumptions that affect the reported amounts of assets and liabilities and disclosures of contingent assets and liabilities during the reporting year. Actual results could differ from those estimates. The significant accounting policies used by the Company are as follows: a) Combined financial statements
The combined financial statements of the Company are expressed in Euros (EUR) being the “Reference Currency” of the net assets of the Company. The financial statements relating to the various Sub-Funds are expressed in the Reference Currency of the relevant Sub-Fund. The various positions of the combined financial statements of the Company are equal to the sum of the various corresponding positions in the financial statements of each Sub-Fund and are expressed in EUR.
b) Valuation of cash
The value of any cash in hand or on deposit, notes and bills payable on demand and accounts receivable (including reimbursements of fees and expenses payable by any UCI (Undertakings for Collective Investment) in which the Company may invest), prepaid expenses and cash dividends declared and interest accrued but not yet collected, shall be deemed the nominal value of these assets unless it is improbable that it can be paid and collected in full; in which case, the value will be arrived at after deducting such amounts as the Board of Directors of the Company may consider appropriate to reflect the true value of these assets.
c) Valuation of investment securities
Securities listed and money market instrument on an official stock exchange or dealt on any other Regulated Market will be valued at their last available price in Luxembourg on the Valuation Day and, if the security is traded on several markets, on the basis of the last known price on the main market of this security. If the last known price is not representative, valuation will be
based on the fair value at which it is expected it can be sold, as determined with prudence and in good faith by the Board of Directors of the Company. Unlisted securities and securities or money market instrument not traded on a stock exchange or any other Regulated Market as well as listed securities and securities listed on a Regulated Market for which no price is available, or securities whose quoted price is, in the opinion of the Board of Directors of the Company, not representative of actual market value, will be valued at their last known price in Luxembourg or, in the absence of such price, on the basis of their probable realisation value, as determined with prudence and in good faith by the Board of Directors of the Company. Money Market Instruments are valued at amortised cost. Securities or Money Market Instruments denominated in a currency other than the relevant Sub-Fund's valuation currency will be converted at the average exchange rate of the currency concerned applicable on the Valuation Day.
d) Valuation of forward foreign exchange contracts
Forward foreign exchange contracts are valued at the forward rate applicable at the statement of net date for the remaining period until maturity. The resulting gains and losses are presented in the statement of operations and changes in net assets.
e) Administration and other expenses
This item mainly include the registrar fees expenses. f) Net realised gain or loss on sales of investments
Realised gains or losses on sales of investments are calculated on the basis of average cost of the investments sold.
g) Income and expense recognition
Dividends are taken into account on the date upon which the relevant investments are first listed as ex-dividend. Interest income is accrued on a daily basis. Income is recorded net of withholding tax, if any. Expenses are accounted for an accrual basis. Expenses are charged to the Statement of Operations and Changes in Net Assets.
MARCH INTERNATIONAL
45
SUMMARY OF SIGNIFICANT
ACCOUNTING POLICIES (continued)
h) Conversion on foreign currency Assets and liabilities expressed in currencies other than the Sub-Fund’s reporting currency are converted into the reporting currency at the exchange rates prevailing on the Valuation date. Income and expenses in currencies other than the Sub-Fund’s reporting currency are converted at the rate of exchange prevailing at transaction date. The resulting gains and losses are presented in the statement of operations and changes in net assets.
i) Cost of investments in securities
Cost of investments in securities in currencies other than EUR is converted into EUR at the exchange rate applicable at purchase date.
j) Formation expenses Formation expenses are amortised on a straight line basis over a period of 5 years.
EXCHANGE RATES AS AT JUNE 30, 2017
1 EUR = 1.48745 AUD
= 1.48535 CAD = 1.09410 CHF = 760.93000 CLP = 7.43610 DKK = 0.87880 GBP = 8.92815 HKD = 128.18000 JPY = 9.58040 NOK = 9.68305 SEK = 1.14390 USD = 14.89490 ZAR
ISSUE, CONVERSION AND REPURCHASE
OF THE COMPANY'S SHARES Subscriptions for Shares in the Sub-Funds are accepted on each Valuation Day. Applications for subscriptions must be received by the Management Company (in its capacity as administrative agent) not later than 4.00 p.m. (Luxembourg time) on the Business Day before the relevant Valuation Day. Applications received after that time are processed on the next Valuation Day.
Shares in the Sub-Funds may be redeemed on each Valuation Day. Redemption requests must be sent in writing to the Management Company (in its capacity as administrative agent) or the Distributor(s). Redemption requests must be received by the Administrative Agent no later than 4.00 p.m. (Luxembourg time) on the Business Day before the relevant Valuation Day. Redemption requests received after this deadline will be processed on the next following Valuation Day. Redemptions are paid by the Depositary in EUR within 3 Business Days after the relevant Valuation Day. Shares in the Sub-Funds may be converted on each Valuation Day. Conversion requests must be received by the Management Company (in its capacity as administrative agent) no later than 4.00 p.m. (Luxembourg time) on the Business Day before the relevant Valuation Day. Conversion requests received after this deadline will be processed on the next following Valuation Day.
MANAGEMENT COMPANY The Board of Directors of the Company has appointed Edmond de Rothschild Asset Management (Luxembourg) to serve as its designated management company within the meaning of article 27 of the 2010 Act pursuant to the Management Company Agreement. The Management Company is governed by Chapter 15 of the 2010 Act and is authorised to perform collective portfolio management activities. Edmond de Rothschild Asset Management (Luxembourg) is a public limited company, wholly-owned subsidiary of Edmond de Rothschild (Europe), and is under the supervision of the Commission de Surveillance du Secteur Financier (“CSSF”). The Management Company provides, subject to the overall control of the Board of Directors of the Company and without limitation, investment management services, administrative services and marketing, distribution and sales services to the Company. The rights and duties of the Management Company are further laid down in articles 107 et seq. of the 2010 Act. The Management Company must at all times act honestly and fairly in conducting its activities in the best interest of the Shareholders and in conformity with the 2010 Act, the Prospectus and the Articles of the Company.
CENTRAL ADMINISTRATION Edmond de Rothschild (Europe) has been appointed Central Administration for the Company as at December 8, 2014.
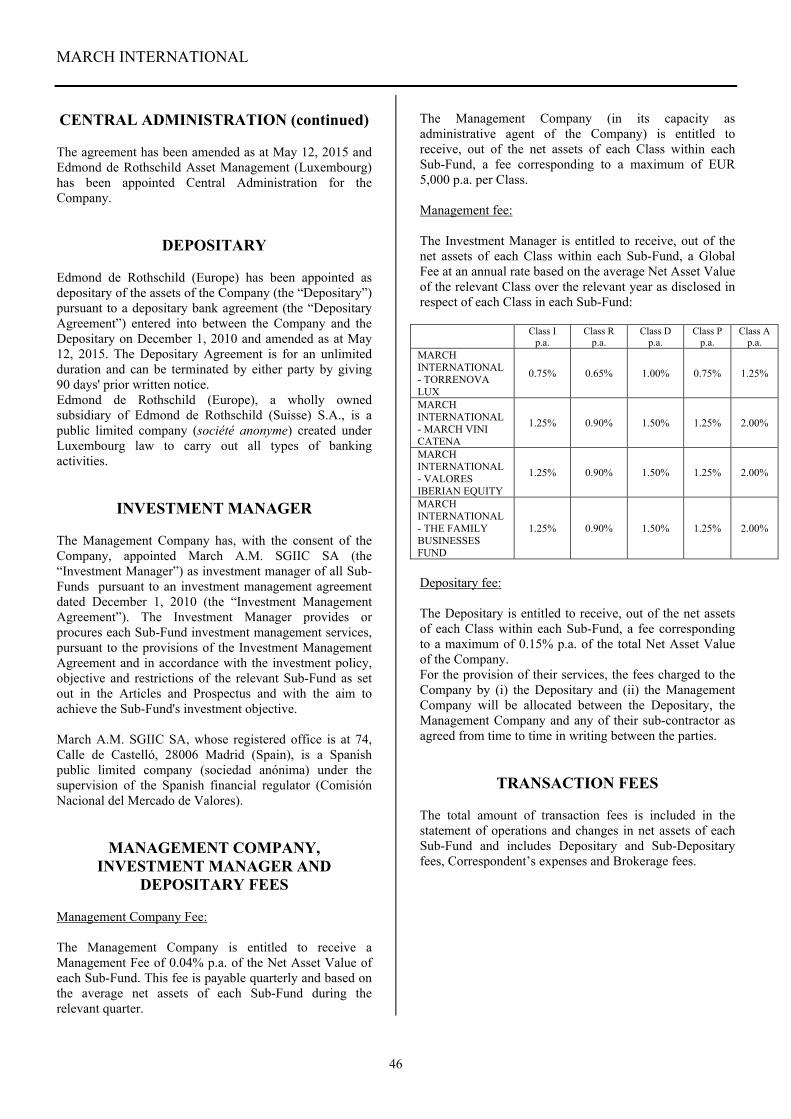
MARCH INTERNATIONAL
46
CENTRAL ADMINISTRATION (continued) The agreement has been amended as at May 12, 2015 and Edmond de Rothschild Asset Management (Luxembourg) has been appointed Central Administration for the Company.
DEPOSITARY Edmond de Rothschild (Europe) has been appointed as depositary of the assets of the Company (the “Depositary”) pursuant to a depositary bank agreement (the “Depositary Agreement”) entered into between the Company and the Depositary on December 1, 2010 and amended as at May 12, 2015. The Depositary Agreement is for an unlimited duration and can be terminated by either party by giving 90 days' prior written notice. Edmond de Rothschild (Europe), a wholly owned subsidiary of Edmond de Rothschild (Suisse) S.A., is a public limited company (société anonyme) created under Luxembourg law to carry out all types of banking activities.
INVESTMENT MANAGER The Management Company has, with the consent of the Company, appointed March A.M. SGIIC SA (the “Investment Manager”) as investment manager of all Sub-Funds pursuant to an investment management agreement dated December 1, 2010 (the “Investment Management Agreement”). The Investment Manager provides or procures each Sub-Fund investment management services, pursuant to the provisions of the Investment Management Agreement and in accordance with the investment policy, objective and restrictions of the relevant Sub-Fund as set out in the Articles and Prospectus and with the aim to achieve the Sub-Fund's investment objective. March A.M. SGIIC SA, whose registered office is at 74, Calle de Castelló, 28006 Madrid (Spain), is a Spanish public limited company (sociedad anónima) under the supervision of the Spanish financial regulator (Comisión Nacional del Mercado de Valores).
MANAGEMENT COMPANY, INVESTMENT MANAGER AND
DEPOSITARY FEES Management Company Fee: The Management Company is entitled to receive a Management Fee of 0.04% p.a. of the Net Asset Value of each Sub-Fund. This fee is payable quarterly and based on the average net assets of each Sub-Fund during the relevant quarter.
The Management Company (in its capacity as administrative agent of the Company) is entitled to receive, out of the net assets of each Class within each Sub-Fund, a fee corresponding to a maximum of EUR 5,000 p.a. per Class. Management fee: The Investment Manager is entitled to receive, out of the net assets of each Class within each Sub-Fund, a Global Fee at an annual rate based on the average Net Asset Value of the relevant Class over the relevant year as disclosed in respect of each Class in each Sub-Fund:
Class I
p.a. Class R
p.a. Class D
p.a. Class P
p.a. Class A
p.a. MARCH INTERNATIONAL - TORRENOVA LUX
0.75% 0.65% 1.00% 0.75% 1.25%
MARCH INTERNATIONAL - MARCH VINI CATENA
1.25% 0.90% 1.50% 1.25% 2.00%
MARCH INTERNATIONAL - VALORES IBERIAN EQUITY
1.25% 0.90% 1.50% 1.25% 2.00%
MARCH INTERNATIONAL - THE FAMILY BUSINESSES FUND
1.25% 0.90% 1.50% 1.25% 2.00%
Depositary fee: The Depositary is entitled to receive, out of the net assets of each Class within each Sub-Fund, a fee corresponding to a maximum of 0.15% p.a. of the total Net Asset Value of the Company. For the provision of their services, the fees charged to the Company by (i) the Depositary and (ii) the Management Company will be allocated between the Depositary, the Management Company and any of their sub-contractor as agreed from time to time in writing between the parties.
TRANSACTION FEES
The total amount of transaction fees is included in the statement of operations and changes in net assets of each Sub-Fund and includes Depositary and Sub-Depositary fees, Correspondent’s expenses and Brokerage fees.
MARCH INTERNATIONAL
47
DELEGATION
Edmond de Rothschild Asset Management (Luxembourg) and Edmond de Rothschild (Europe) may delegate all or part of their functions and duties to a sub-contractor which, having regard to the nature of the functions and duties to be delegated, must be qualified and capable of undertaking the duties in question.
ANNUAL TAX The Company's assets are subject to a subscription tax (taxe d'abonnement) in Luxembourg of 0.05% p.a. on total net assets of each Sub-Fund (and 0.01% p.a. on total net assets in case of Sub-Funds or Classes are reserved to Institutional Investors), payable quarterly. In case some Sub-Funds are invested in other Luxembourg UCIs, which in turn are subject to the annual subscription tax (“taxe d'abonnement”) provided for by the 2010 Act or the Luxembourg amended act of February 13, 2007 relating to specialized investment funds, as amended, no annual subscription tax (“taxe d'abonnement”) is due from the Company on the portion of assets invested therein. The Company's income is not taxable in Luxembourg. Income received from the Company may be subject to withholding taxes in the country of origin of the issuer of the security, in respect of which such income is paid. No duty or tax is payable in Luxembourg in connection with the issue of Shares of the Company, except for a fixed registration duty of EUR 75 due each time the Articles are amended.
Under current legislation, Shareholders are not subject to any capital gains, income, withholding, estate, inheritance or other taxes in Luxembourg, except for those Shareholders domiciled, resident or having a permanent establishment in Luxembourg.
CHANGES IN THE SECURITIES PORTFOLIO
A copy of the list of changes in the securities portfolio of each Sub-Fund may be obtained free of charge at the registered office of the Company for the period from January 1, 2017 to June 30, 2017.
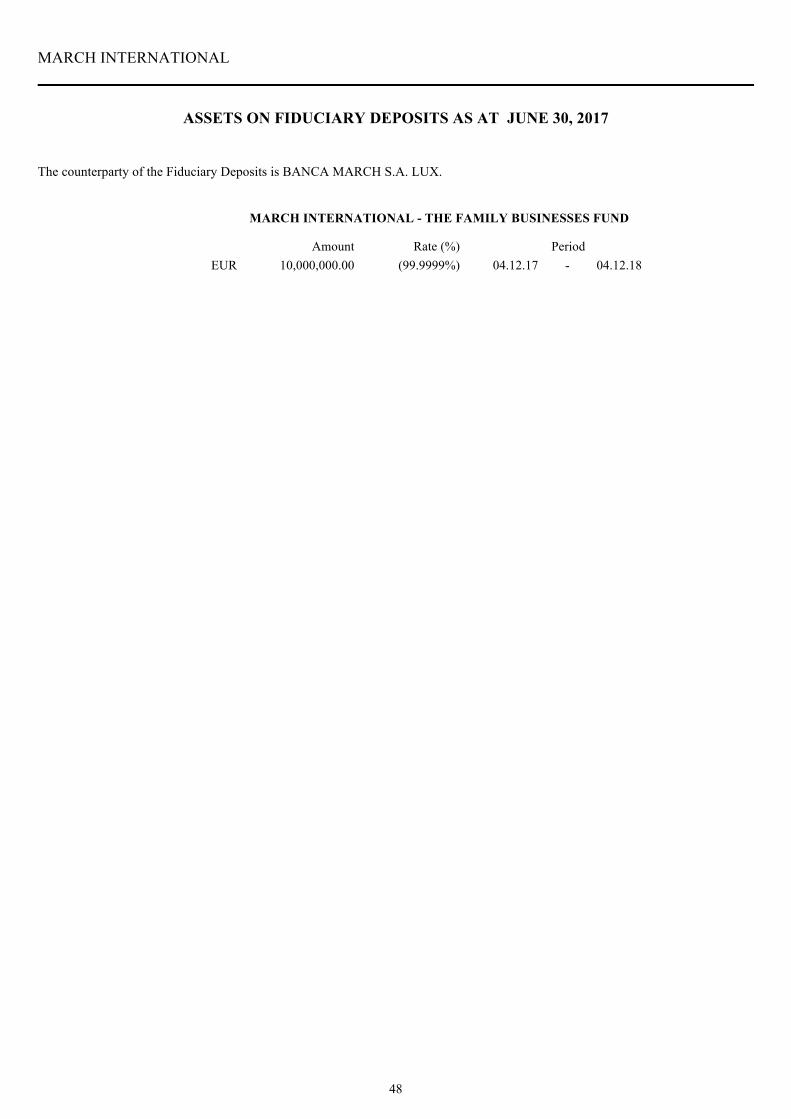
48
MARCH INTERNATIONAL
ASSETS ON FIDUCIARY DEPOSITS AS AT JUNE 30, 2017
Amount Rate (%) PeriodEUR 10,000,000.00 (99.9999%) 04.12.17 04.12.18-
MARCH INTERNATIONAL - THE FAMILY BUSINESSES FUND
The counterparty of the Fiduciary Deposits is BANCA MARCH S.A. LUX.
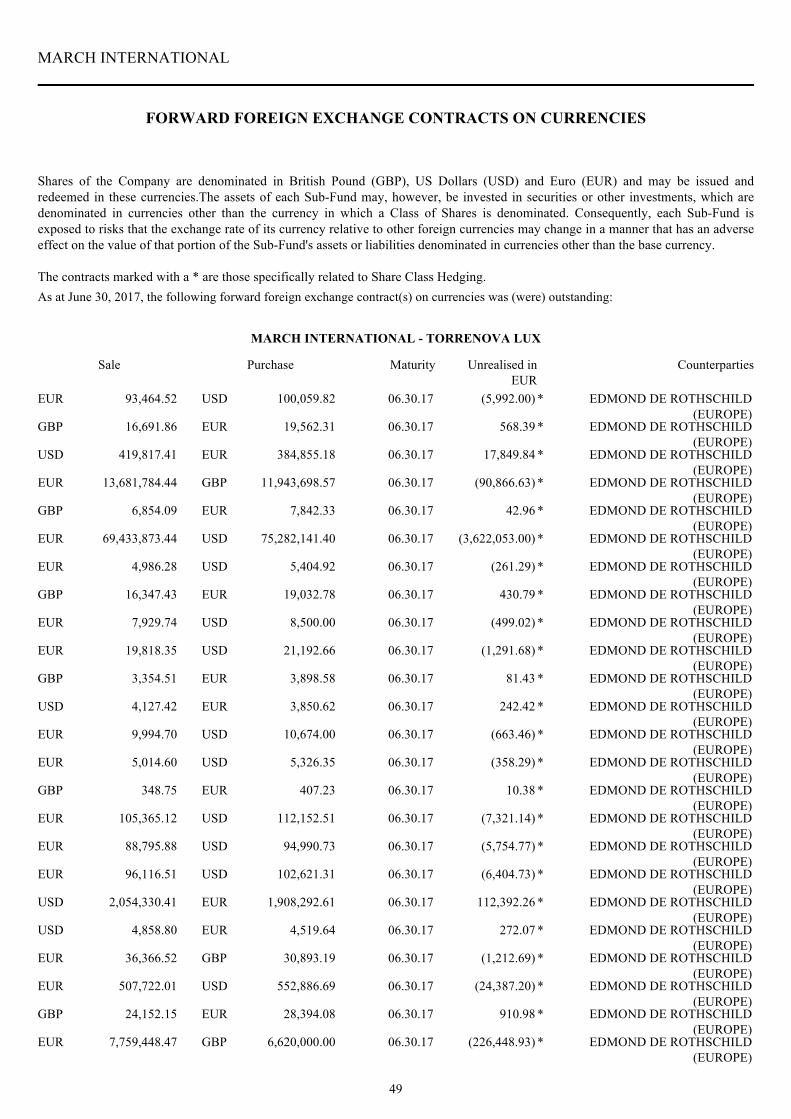
49
MARCH INTERNATIONAL
FORWARD FOREIGN EXCHANGE CONTRACTS ON CURRENCIES
MARCH INTERNATIONAL - TORRENOVA LUX
Sale Purchase Maturity
EUR 93,464.52 USD 100,059.82 06.30.17 (5,992.00) * EDMOND DE ROTHSCHILD(EUROPE)
Unrealised inEUR
Counterparties
GBP 16,691.86 EUR 19,562.31 06.30.17 568.39 * EDMOND DE ROTHSCHILD(EUROPE)
USD 419,817.41 EUR 384,855.18 06.30.17 17,849.84 * EDMOND DE ROTHSCHILD(EUROPE)
EUR 13,681,784.44 GBP 11,943,698.57 06.30.17 (90,866.63) * EDMOND DE ROTHSCHILD(EUROPE)
GBP 6,854.09 EUR 7,842.33 06.30.17 42.96 * EDMOND DE ROTHSCHILD(EUROPE)
EUR 69,433,873.44 USD 75,282,141.40 06.30.17 (3,622,053.00) * EDMOND DE ROTHSCHILD(EUROPE)
EUR 4,986.28 USD 5,404.92 06.30.17 (261.29) * EDMOND DE ROTHSCHILD(EUROPE)
GBP 16,347.43 EUR 19,032.78 06.30.17 430.79 * EDMOND DE ROTHSCHILD(EUROPE)
EUR 7,929.74 USD 8,500.00 06.30.17 (499.02) * EDMOND DE ROTHSCHILD(EUROPE)
EUR 19,818.35 USD 21,192.66 06.30.17 (1,291.68) * EDMOND DE ROTHSCHILD(EUROPE)
GBP 3,354.51 EUR 3,898.58 06.30.17 81.43 * EDMOND DE ROTHSCHILD(EUROPE)
USD 4,127.42 EUR 3,850.62 06.30.17 242.42 * EDMOND DE ROTHSCHILD(EUROPE)
EUR 9,994.70 USD 10,674.00 06.30.17 (663.46) * EDMOND DE ROTHSCHILD(EUROPE)
EUR 5,014.60 USD 5,326.35 06.30.17 (358.29) * EDMOND DE ROTHSCHILD(EUROPE)
GBP 348.75 EUR 407.23 06.30.17 10.38 * EDMOND DE ROTHSCHILD(EUROPE)
EUR 105,365.12 USD 112,152.51 06.30.17 (7,321.14) * EDMOND DE ROTHSCHILD(EUROPE)
EUR 88,795.88 USD 94,990.73 06.30.17 (5,754.77) * EDMOND DE ROTHSCHILD(EUROPE)
EUR 96,116.51 USD 102,621.31 06.30.17 (6,404.73) * EDMOND DE ROTHSCHILD(EUROPE)
USD 2,054,330.41 EUR 1,908,292.61 06.30.17 112,392.26 * EDMOND DE ROTHSCHILD(EUROPE)
USD 4,858.80 EUR 4,519.64 06.30.17 272.07 * EDMOND DE ROTHSCHILD(EUROPE)
EUR 36,366.52 GBP 30,893.19 06.30.17 (1,212.69) * EDMOND DE ROTHSCHILD(EUROPE)
EUR 507,722.01 USD 552,886.69 06.30.17 (24,387.20) * EDMOND DE ROTHSCHILD(EUROPE)
GBP 24,152.15 EUR 28,394.08 06.30.17 910.98 * EDMOND DE ROTHSCHILD(EUROPE)
EUR 7,759,448.47 GBP 6,620,000.00 06.30.17 (226,448.93) * EDMOND DE ROTHSCHILD(EUROPE)
As at June 30, 2017, the following forward foreign exchange contract(s) on currencies was (were) outstanding:
Shares of the Company are denominated in British Pound (GBP), US Dollars (USD) and Euro (EUR) and may be issued andredeemed in these currencies.The assets of each Sub-Fund may, however, be invested in securities or other investments, which aredenominated in currencies other than the currency in which a Class of Shares is denominated. Consequently, each Sub-Fund isexposed to risks that the exchange rate of its currency relative to other foreign currencies may change in a manner that has an adverseeffect on the value of that portion of the Sub-Fund's assets or liabilities denominated in currencies other than the base currency.
The contracts marked with a * are those specifically related to Share Class Hedging.
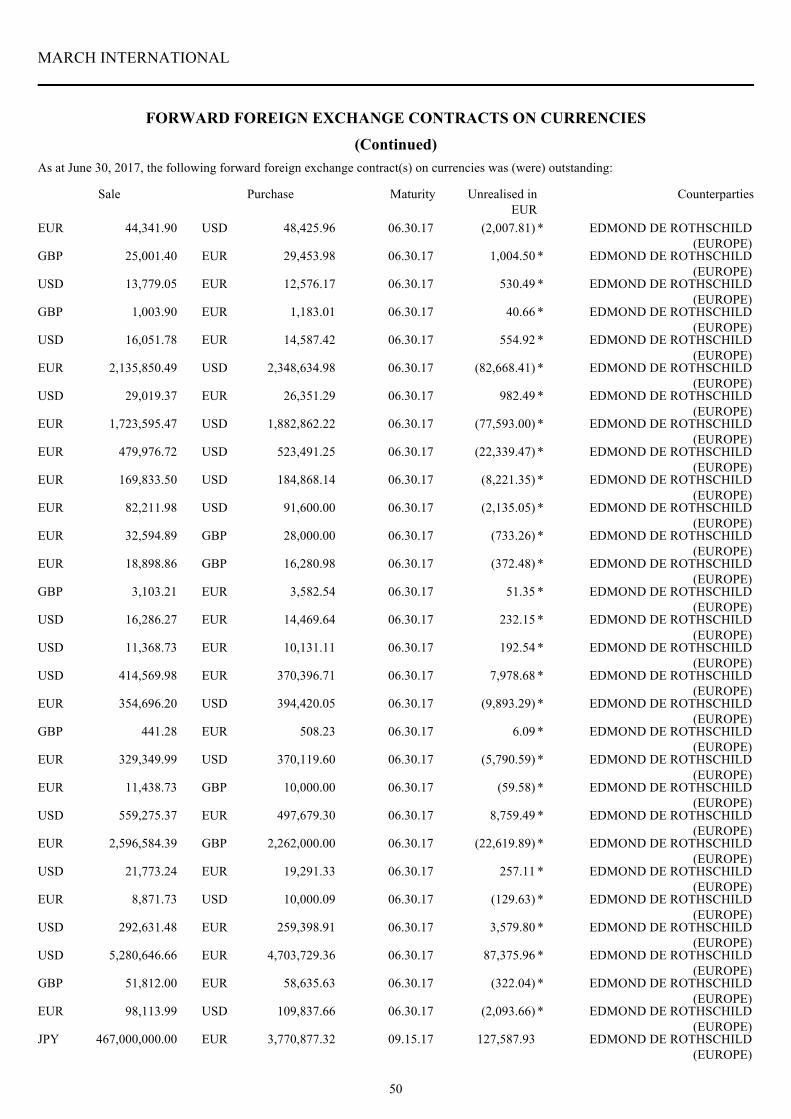
50
MARCH INTERNATIONAL
(Continued)
FORWARD FOREIGN EXCHANGE CONTRACTS ON CURRENCIES
Sale Purchase Maturity
EUR 44,341.90 USD 48,425.96 06.30.17 (2,007.81) * EDMOND DE ROTHSCHILD(EUROPE)
Unrealised inEUR
Counterparties
GBP 25,001.40 EUR 29,453.98 06.30.17 1,004.50 * EDMOND DE ROTHSCHILD(EUROPE)
USD 13,779.05 EUR 12,576.17 06.30.17 530.49 * EDMOND DE ROTHSCHILD(EUROPE)
GBP 1,003.90 EUR 1,183.01 06.30.17 40.66 * EDMOND DE ROTHSCHILD(EUROPE)
USD 16,051.78 EUR 14,587.42 06.30.17 554.92 * EDMOND DE ROTHSCHILD(EUROPE)
EUR 2,135,850.49 USD 2,348,634.98 06.30.17 (82,668.41) * EDMOND DE ROTHSCHILD(EUROPE)
USD 29,019.37 EUR 26,351.29 06.30.17 982.49 * EDMOND DE ROTHSCHILD(EUROPE)
EUR 1,723,595.47 USD 1,882,862.22 06.30.17 (77,593.00) * EDMOND DE ROTHSCHILD(EUROPE)
EUR 479,976.72 USD 523,491.25 06.30.17 (22,339.47) * EDMOND DE ROTHSCHILD(EUROPE)
EUR 169,833.50 USD 184,868.14 06.30.17 (8,221.35) * EDMOND DE ROTHSCHILD(EUROPE)
EUR 82,211.98 USD 91,600.00 06.30.17 (2,135.05) * EDMOND DE ROTHSCHILD(EUROPE)
EUR 32,594.89 GBP 28,000.00 06.30.17 (733.26) * EDMOND DE ROTHSCHILD(EUROPE)
EUR 18,898.86 GBP 16,280.98 06.30.17 (372.48) * EDMOND DE ROTHSCHILD(EUROPE)
GBP 3,103.21 EUR 3,582.54 06.30.17 51.35 * EDMOND DE ROTHSCHILD(EUROPE)
USD 16,286.27 EUR 14,469.64 06.30.17 232.15 * EDMOND DE ROTHSCHILD(EUROPE)
USD 11,368.73 EUR 10,131.11 06.30.17 192.54 * EDMOND DE ROTHSCHILD(EUROPE)
USD 414,569.98 EUR 370,396.71 06.30.17 7,978.68 * EDMOND DE ROTHSCHILD(EUROPE)
EUR 354,696.20 USD 394,420.05 06.30.17 (9,893.29) * EDMOND DE ROTHSCHILD(EUROPE)
GBP 441.28 EUR 508.23 06.30.17 6.09 * EDMOND DE ROTHSCHILD(EUROPE)
EUR 329,349.99 USD 370,119.60 06.30.17 (5,790.59) * EDMOND DE ROTHSCHILD(EUROPE)
EUR 11,438.73 GBP 10,000.00 06.30.17 (59.58) * EDMOND DE ROTHSCHILD(EUROPE)
USD 559,275.37 EUR 497,679.30 06.30.17 8,759.49 * EDMOND DE ROTHSCHILD(EUROPE)
EUR 2,596,584.39 GBP 2,262,000.00 06.30.17 (22,619.89) * EDMOND DE ROTHSCHILD(EUROPE)
USD 21,773.24 EUR 19,291.33 06.30.17 257.11 * EDMOND DE ROTHSCHILD(EUROPE)
EUR 8,871.73 USD 10,000.09 06.30.17 (129.63) * EDMOND DE ROTHSCHILD(EUROPE)
USD 292,631.48 EUR 259,398.91 06.30.17 3,579.80 * EDMOND DE ROTHSCHILD(EUROPE)
USD 5,280,646.66 EUR 4,703,729.36 06.30.17 87,375.96 * EDMOND DE ROTHSCHILD(EUROPE)
GBP 51,812.00 EUR 58,635.63 06.30.17 (322.04) * EDMOND DE ROTHSCHILD(EUROPE)
EUR 98,113.99 USD 109,837.66 06.30.17 (2,093.66) * EDMOND DE ROTHSCHILD(EUROPE)
JPY 467,000,000.00 EUR 3,770,877.32 09.15.17 127,587.93 EDMOND DE ROTHSCHILD(EUROPE)
As at June 30, 2017, the following forward foreign exchange contract(s) on currencies was (were) outstanding:
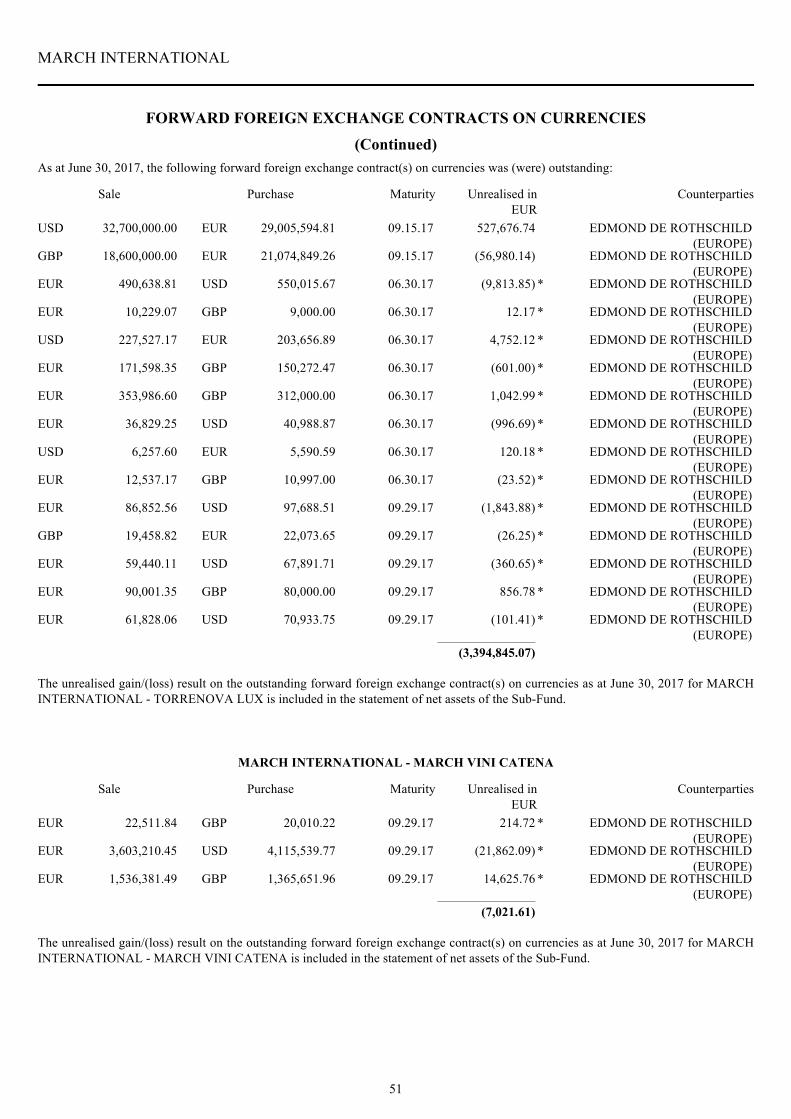
51
MARCH INTERNATIONAL
(Continued)
FORWARD FOREIGN EXCHANGE CONTRACTS ON CURRENCIES
Sale Purchase Maturity
USD 32,700,000.00 EUR 29,005,594.81 09.15.17 527,676.74 EDMOND DE ROTHSCHILD(EUROPE)
Unrealised inEUR
Counterparties
GBP 18,600,000.00 EUR 21,074,849.26 09.15.17 (56,980.14) EDMOND DE ROTHSCHILD(EUROPE)
EUR 490,638.81 USD 550,015.67 06.30.17 (9,813.85) * EDMOND DE ROTHSCHILD(EUROPE)
EUR 10,229.07 GBP 9,000.00 06.30.17 12.17 * EDMOND DE ROTHSCHILD(EUROPE)
USD 227,527.17 EUR 203,656.89 06.30.17 4,752.12 * EDMOND DE ROTHSCHILD(EUROPE)
EUR 171,598.35 GBP 150,272.47 06.30.17 (601.00) * EDMOND DE ROTHSCHILD(EUROPE)
EUR 353,986.60 GBP 312,000.00 06.30.17 1,042.99 * EDMOND DE ROTHSCHILD(EUROPE)
EUR 36,829.25 USD 40,988.87 06.30.17 (996.69) * EDMOND DE ROTHSCHILD(EUROPE)
USD 6,257.60 EUR 5,590.59 06.30.17 120.18 * EDMOND DE ROTHSCHILD(EUROPE)
EUR 12,537.17 GBP 10,997.00 06.30.17 (23.52) * EDMOND DE ROTHSCHILD(EUROPE)
EUR 86,852.56 USD 97,688.51 09.29.17 (1,843.88) * EDMOND DE ROTHSCHILD(EUROPE)
GBP 19,458.82 EUR 22,073.65 09.29.17 (26.25) * EDMOND DE ROTHSCHILD(EUROPE)
EUR 59,440.11 USD 67,891.71 09.29.17 (360.65) * EDMOND DE ROTHSCHILD(EUROPE)
EUR 90,001.35 GBP 80,000.00 09.29.17 856.78 * EDMOND DE ROTHSCHILD(EUROPE)
EUR 61,828.06 USD 70,933.75 09.29.17 (101.41) * EDMOND DE ROTHSCHILD(EUROPE)
The unrealised gain/(loss) result on the outstanding forward foreign exchange contract(s) on currencies as at June 30, 2017 for MARCHINTERNATIONAL - TORRENOVA LUX is included in the statement of net assets of the Sub-Fund.
(3,394,845.07)
As at June 30, 2017, the following forward foreign exchange contract(s) on currencies was (were) outstanding:
MARCH INTERNATIONAL - MARCH VINI CATENA
Sale Purchase Maturity
EUR 22,511.84 GBP 20,010.22 09.29.17 214.72 * EDMOND DE ROTHSCHILD(EUROPE)
Unrealised inEUR
Counterparties
EUR 3,603,210.45 USD 4,115,539.77 09.29.17 (21,862.09) * EDMOND DE ROTHSCHILD(EUROPE)
EUR 1,536,381.49 GBP 1,365,651.96 09.29.17 14,625.76 * EDMOND DE ROTHSCHILD(EUROPE)
The unrealised gain/(loss) result on the outstanding forward foreign exchange contract(s) on currencies as at June 30, 2017 for MARCHINTERNATIONAL - MARCH VINI CATENA is included in the statement of net assets of the Sub-Fund.
(7,021.61)
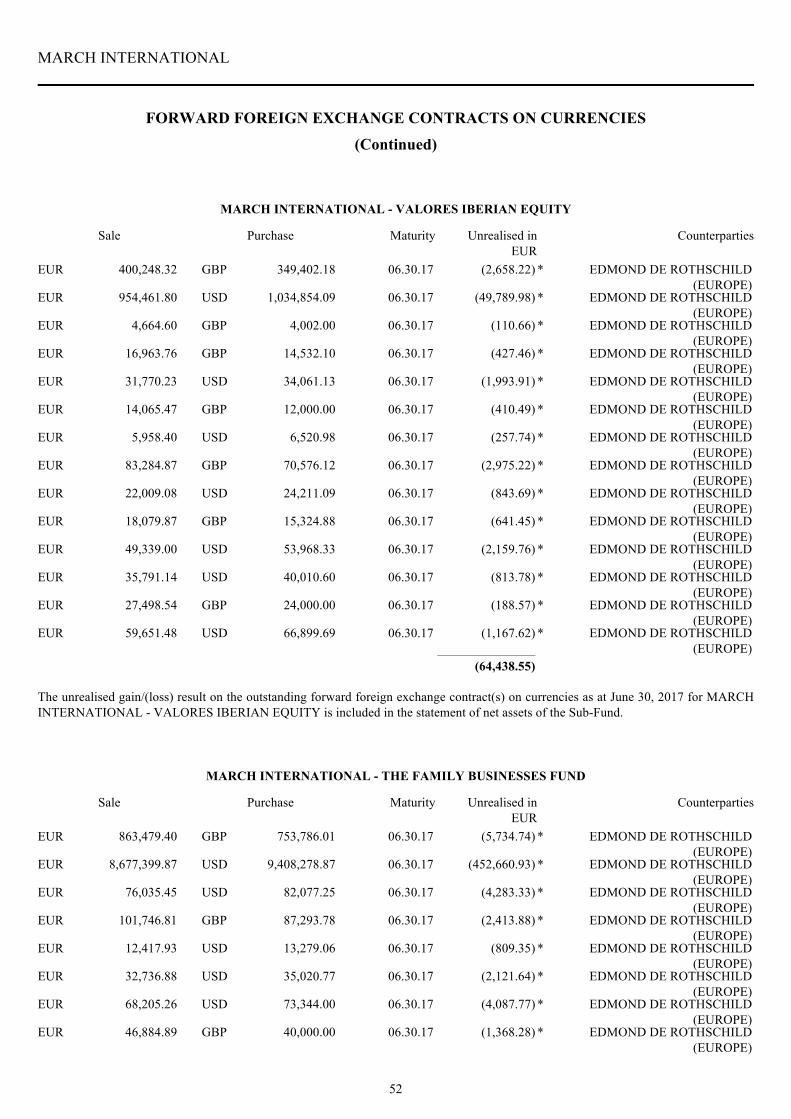
52
MARCH INTERNATIONAL
(Continued)
FORWARD FOREIGN EXCHANGE CONTRACTS ON CURRENCIES
MARCH INTERNATIONAL - VALORES IBERIAN EQUITY
Sale Purchase Maturity
EUR 400,248.32 GBP 349,402.18 06.30.17 (2,658.22) * EDMOND DE ROTHSCHILD(EUROPE)
Unrealised inEUR
Counterparties
EUR 954,461.80 USD 1,034,854.09 06.30.17 (49,789.98) * EDMOND DE ROTHSCHILD(EUROPE)
EUR 4,664.60 GBP 4,002.00 06.30.17 (110.66) * EDMOND DE ROTHSCHILD(EUROPE)
EUR 16,963.76 GBP 14,532.10 06.30.17 (427.46) * EDMOND DE ROTHSCHILD(EUROPE)
EUR 31,770.23 USD 34,061.13 06.30.17 (1,993.91) * EDMOND DE ROTHSCHILD(EUROPE)
EUR 14,065.47 GBP 12,000.00 06.30.17 (410.49) * EDMOND DE ROTHSCHILD(EUROPE)
EUR 5,958.40 USD 6,520.98 06.30.17 (257.74) * EDMOND DE ROTHSCHILD(EUROPE)
EUR 83,284.87 GBP 70,576.12 06.30.17 (2,975.22) * EDMOND DE ROTHSCHILD(EUROPE)
EUR 22,009.08 USD 24,211.09 06.30.17 (843.69) * EDMOND DE ROTHSCHILD(EUROPE)
EUR 18,079.87 GBP 15,324.88 06.30.17 (641.45) * EDMOND DE ROTHSCHILD(EUROPE)
EUR 49,339.00 USD 53,968.33 06.30.17 (2,159.76) * EDMOND DE ROTHSCHILD(EUROPE)
EUR 35,791.14 USD 40,010.60 06.30.17 (813.78) * EDMOND DE ROTHSCHILD(EUROPE)
EUR 27,498.54 GBP 24,000.00 06.30.17 (188.57) * EDMOND DE ROTHSCHILD(EUROPE)
EUR 59,651.48 USD 66,899.69 06.30.17 (1,167.62) * EDMOND DE ROTHSCHILD(EUROPE)
The unrealised gain/(loss) result on the outstanding forward foreign exchange contract(s) on currencies as at June 30, 2017 for MARCHINTERNATIONAL - VALORES IBERIAN EQUITY is included in the statement of net assets of the Sub-Fund.
(64,438.55)
MARCH INTERNATIONAL - THE FAMILY BUSINESSES FUND
Sale Purchase Maturity
EUR 863,479.40 GBP 753,786.01 06.30.17 (5,734.74) * EDMOND DE ROTHSCHILD(EUROPE)
Unrealised inEUR
Counterparties
EUR 8,677,399.87 USD 9,408,278.87 06.30.17 (452,660.93) * EDMOND DE ROTHSCHILD(EUROPE)
EUR 76,035.45 USD 82,077.25 06.30.17 (4,283.33) * EDMOND DE ROTHSCHILD(EUROPE)
EUR 101,746.81 GBP 87,293.78 06.30.17 (2,413.88) * EDMOND DE ROTHSCHILD(EUROPE)
EUR 12,417.93 USD 13,279.06 06.30.17 (809.35) * EDMOND DE ROTHSCHILD(EUROPE)
EUR 32,736.88 USD 35,020.77 06.30.17 (2,121.64) * EDMOND DE ROTHSCHILD(EUROPE)
EUR 68,205.26 USD 73,344.00 06.30.17 (4,087.77) * EDMOND DE ROTHSCHILD(EUROPE)
EUR 46,884.89 GBP 40,000.00 06.30.17 (1,368.28) * EDMOND DE ROTHSCHILD(EUROPE)
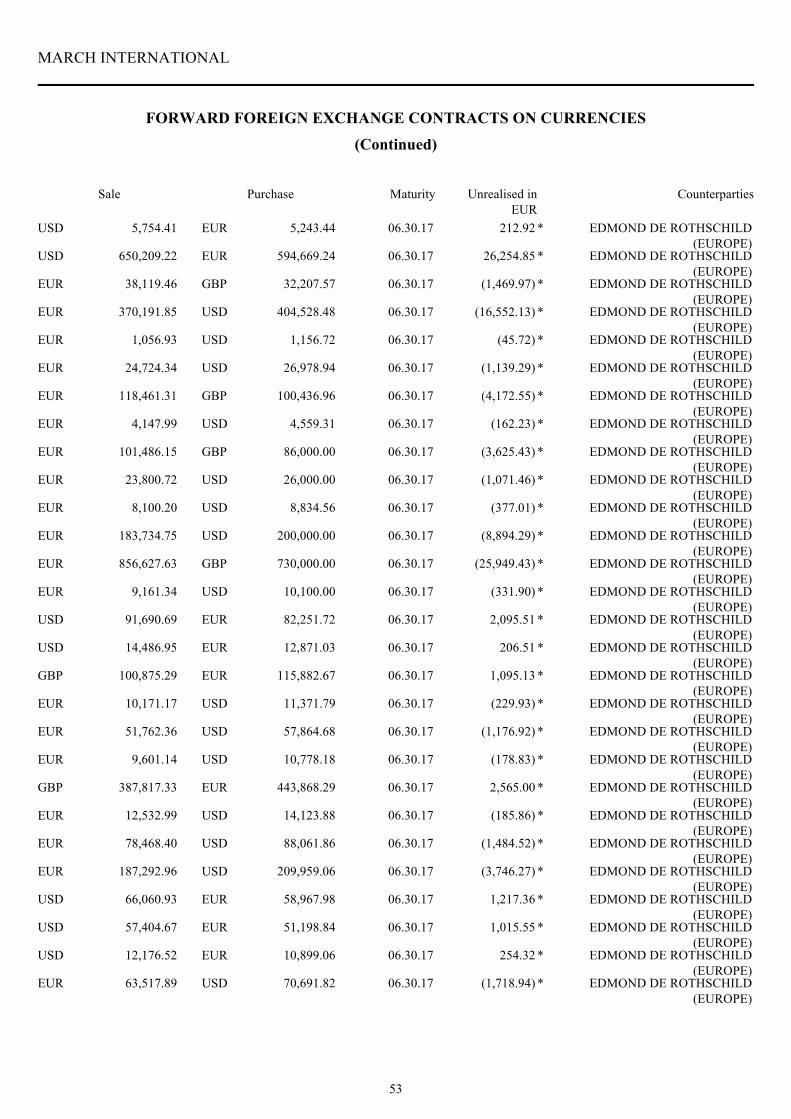
53
MARCH INTERNATIONAL
(Continued)
FORWARD FOREIGN EXCHANGE CONTRACTS ON CURRENCIES
Sale Purchase Maturity
USD 5,754.41 EUR 5,243.44 06.30.17 212.92 * EDMOND DE ROTHSCHILD(EUROPE)
Unrealised inEUR
Counterparties
USD 650,209.22 EUR 594,669.24 06.30.17 26,254.85 * EDMOND DE ROTHSCHILD(EUROPE)
EUR 38,119.46 GBP 32,207.57 06.30.17 (1,469.97) * EDMOND DE ROTHSCHILD(EUROPE)
EUR 370,191.85 USD 404,528.48 06.30.17 (16,552.13) * EDMOND DE ROTHSCHILD(EUROPE)
EUR 1,056.93 USD 1,156.72 06.30.17 (45.72) * EDMOND DE ROTHSCHILD(EUROPE)
EUR 24,724.34 USD 26,978.94 06.30.17 (1,139.29) * EDMOND DE ROTHSCHILD(EUROPE)
EUR 118,461.31 GBP 100,436.96 06.30.17 (4,172.55) * EDMOND DE ROTHSCHILD(EUROPE)
EUR 4,147.99 USD 4,559.31 06.30.17 (162.23) * EDMOND DE ROTHSCHILD(EUROPE)
EUR 101,486.15 GBP 86,000.00 06.30.17 (3,625.43) * EDMOND DE ROTHSCHILD(EUROPE)
EUR 23,800.72 USD 26,000.00 06.30.17 (1,071.46) * EDMOND DE ROTHSCHILD(EUROPE)
EUR 8,100.20 USD 8,834.56 06.30.17 (377.01) * EDMOND DE ROTHSCHILD(EUROPE)
EUR 183,734.75 USD 200,000.00 06.30.17 (8,894.29) * EDMOND DE ROTHSCHILD(EUROPE)
EUR 856,627.63 GBP 730,000.00 06.30.17 (25,949.43) * EDMOND DE ROTHSCHILD(EUROPE)
EUR 9,161.34 USD 10,100.00 06.30.17 (331.90) * EDMOND DE ROTHSCHILD(EUROPE)
USD 91,690.69 EUR 82,251.72 06.30.17 2,095.51 * EDMOND DE ROTHSCHILD(EUROPE)
USD 14,486.95 EUR 12,871.03 06.30.17 206.51 * EDMOND DE ROTHSCHILD(EUROPE)
GBP 100,875.29 EUR 115,882.67 06.30.17 1,095.13 * EDMOND DE ROTHSCHILD(EUROPE)
EUR 10,171.17 USD 11,371.79 06.30.17 (229.93) * EDMOND DE ROTHSCHILD(EUROPE)
EUR 51,762.36 USD 57,864.68 06.30.17 (1,176.92) * EDMOND DE ROTHSCHILD(EUROPE)
EUR 9,601.14 USD 10,778.18 06.30.17 (178.83) * EDMOND DE ROTHSCHILD(EUROPE)
GBP 387,817.33 EUR 443,868.29 06.30.17 2,565.00 * EDMOND DE ROTHSCHILD(EUROPE)
EUR 12,532.99 USD 14,123.88 06.30.17 (185.86) * EDMOND DE ROTHSCHILD(EUROPE)
EUR 78,468.40 USD 88,061.86 06.30.17 (1,484.52) * EDMOND DE ROTHSCHILD(EUROPE)
EUR 187,292.96 USD 209,959.06 06.30.17 (3,746.27) * EDMOND DE ROTHSCHILD(EUROPE)
USD 66,060.93 EUR 58,967.98 06.30.17 1,217.36 * EDMOND DE ROTHSCHILD(EUROPE)
USD 57,404.67 EUR 51,198.84 06.30.17 1,015.55 * EDMOND DE ROTHSCHILD(EUROPE)
USD 12,176.52 EUR 10,899.06 06.30.17 254.32 * EDMOND DE ROTHSCHILD(EUROPE)
EUR 63,517.89 USD 70,691.82 06.30.17 (1,718.94) * EDMOND DE ROTHSCHILD(EUROPE)
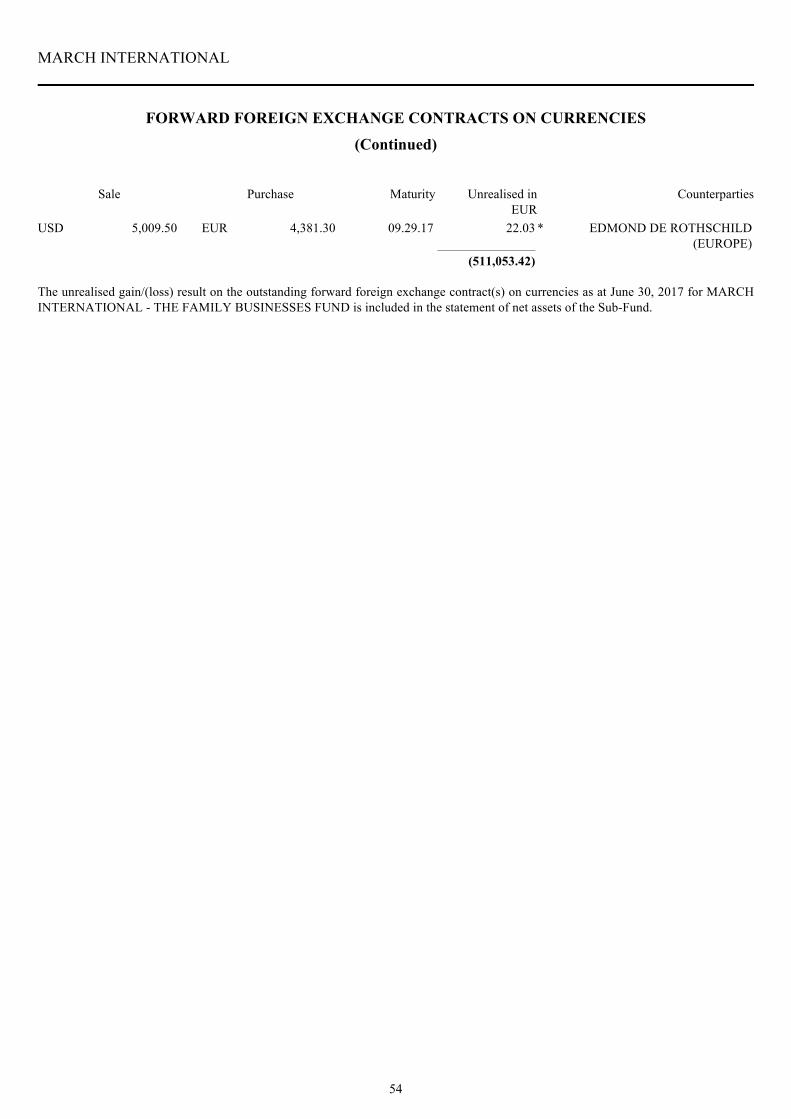
54
MARCH INTERNATIONAL
(Continued)
FORWARD FOREIGN EXCHANGE CONTRACTS ON CURRENCIES
Sale Purchase Maturity
USD 5,009.50 EUR 4,381.30 09.29.17 22.03 * EDMOND DE ROTHSCHILD(EUROPE)
The unrealised gain/(loss) result on the outstanding forward foreign exchange contract(s) on currencies as at June 30, 2017 for MARCHINTERNATIONAL - THE FAMILY BUSINESSES FUND is included in the statement of net assets of the Sub-Fund.
Unrealised inEUR
(511,053.42)
Counterparties