Embed Size (px)
Citation preview

Susitna-Watana Hydroelectric Project
(FERC No. 14241)
Mapping of Aquatic Macrohabitat Types at Selected
Sites in the Middle and Lower Susitna River Segments
from 1980s and 2012 Aerials
2012 Study Technical Memorandum
Prepared for
Alaska Energy Authority
Prepared by
Tetra Tech Inc.
February 2013

This page intentionally left blank.

TECHNICAL MEMORANDUM AQUATIC MACROHABITAT TYPES
Susitna-Watana Hydroelectric Project Alaska Energy Authority FERC Project No. 14241 Page i February 2013
TABLE OF CONTENTS
1. Introduction ........................................................................................................................1
2. Study Objectives.................................................................................................................2
3. Study Area ..........................................................................................................................3
3.1. General .....................................................................................................................3
3.2. Susitna River Segments ...........................................................................................3
4. Methods ...............................................................................................................................4
4.1. Deviations from Study Plan .....................................................................................4
4.1.1. Middle River 2012 Aerial Photo Acquisition ................................. 4
4.1.2. Lower River 2012 Aerial Photo Acquisition .................................. 5 4.1.3. Middle River Habitat Mapping ....................................................... 5
4.1.4. Lower River Habitat Mapping ........................................................ 6
4.2. Processing of Aerial Photography ...........................................................................6
4.3. Site Selection and Stability Assessment ..................................................................7
4.3.1. Site Selection .................................................................................. 7 4.3.2. Stability Assessment ..................................................................... 10
4.3.3. Scaling Methodology .................................................................... 13 4.3.4. Quality Control ............................................................................. 15
5. Results ...............................................................................................................................15
5.1. Middle Susitna River Segment Habitat Sites 1 through 17 ...................................16
5.1.1. Site 1 – Whiskers Slough (PRM 104.4 to PRM 105.9) ................ 16 5.1.2. Site 2 – Slough 4 (PRM 108.7 to PRM 110.2) ............................. 17 5.1.3. Site 3 – Slough 5 (PRM 110.7 to PRM 112.1) ............................. 17
5.1.4. Site 4 – Slough 6A (PRM 115.5 to PRM 116.5) .......................... 17
5.1.5. Site 5 – Slough 8 (PRM 116.9 to PRM 119.0) ............................. 18 5.1.6. Site 6 – Oxbow II (PRM 121.9 to PRM 124.0) ............................ 18 5.1.7. Site 7 – Slough 8A (PRM 128 to PRM 130.2) ............................. 18 5.1.8. Site 8 – Slough 9 (PRM131.3 to PRM 132.8) .............................. 19 5.1.9. Site 9 – Side Channel 10A (PRM134.1 to PRM 136.1) ............... 19
5.1.10. Site 10 – Side Channel 10 (PRM 136.3 to PRM 137.6) ............... 19 5.1.11. Site 11 – Slough 11 (PRM 137.6 to PRM 140.0) ......................... 20 5.1.12. Site 12 – Gold Creek (PRM 140.0 to PRM 141.6) ....................... 20
5.1.13. Site 13 – Indian River (PRM 141.7 to PRM 143.1)...................... 21 5.1.14. Site 14 – Slough 21 (PRM 143.1 to PRM 145.8) ......................... 21 5.1.15. Site 15 – Slough 22 (PRM 147.4 to PRM 148.3) ......................... 22 5.1.16. Site 16 – Fat Canoe Island (PRM 149.9 to PRM 151.0)............... 22
5.1.17. Site 17 – Portage Creek (PRM 151.8 to PRM 152.3) ................... 22
5.2. Middle Susitna River Segment Habitat Sites 18 through 23 .................................22

TECHNICAL MEMORANDUM AQUATIC MACROHABITAT TYPES
Susitna-Watana Hydroelectric Project Alaska Energy Authority FERC Project No. 14241 Page ii February 2013
5.3. Lower Susitna River Segment Habitat Sites 1 through 5 ......................................23
5.3.1. Site 1 – SC IV-4 (PRM 36.5 to PRM 40) ..................................... 23 5.3.2. Site 2 – Willow Creek (PRM 52.5 to PRM 56.0) ......................... 23 5.3.3. Site 3 – Goose Creek (PRM 73.0 to PRM 77.0) ........................... 24
5.3.4. Site 4 – Montana Creek (PRM 80.5 to PRM 82) .......................... 24 5.3.5. Site 5 – Sunshine Slough (PRM 88.0 to PRM 92.0) ..................... 24
6. Discussion and Conclusions ............................................................................................25
6.1. Discussion of Results .............................................................................................25
6.1.1. Middle Susitna River Segment Habitat Sites Discussion ............. 25
6.1.2. Lower Susitna River Segment Habitat Sites Discussion .............. 28
6.2. Conclusions and Recommendations Concerning 2013 and 2014 Studies .............30
6.2.1. Middle Susitna River Segment ..................................................... 30 6.2.2. Lower Susitna River Segment ...................................................... 31 6.2.3. Use of 1980s Aerials for 2013 and 2014 Studies .......................... 32 6.2.4. 2013 Efforts .................................................................................. 34
7. References .........................................................................................................................35
8. Tables ................................................................................................................................37
9. Figures ...............................................................................................................................67
LIST OF TABLES
Table 4.1-1. Summary of 1980s aerial dates, discharges, and project river mile extents. ............ 37
Table 4.1-2. Summary of 2012 aerial dates, discharges, and project river mile extents. ............. 38
Table 4.3-1 Summary of rationale for selection of Middle River Segment aquatic habitat sites. 39
Table 4.3-2 Selected aquatic habitat sites in the Middle Susitna River Segment. ........................ 43
Table 4.3-3 Selected aquatic habitat sites in the Lower Susitna River Segment. ......................... 44
Table 5.1-1. Comparison of areas of digitized aquatic habitat types from 1983 to 2012 at
Whiskers Slough. .................................................................................................................. 45
Table 5.1-2. Comparison of areas of mapped aquatic habitat types from 1983 to 2012 at
Slough 4. ............................................................................................................................... 45
Table 5.1-3. Comparison of areas of mapped aquatic habitat types from 1983 to 2012 at
Slough 5. ............................................................................................................................... 45
Table 5.1-4. Comparison of areas of mapped aquatic habitat types from 1983 to 2012 at
Slough 6A. ............................................................................................................................ 46
Table 5.1-5. Comparison of areas of mapped aquatic habitat types from 1983 to 2012 at
Slough 8. ............................................................................................................................... 46
Table 5.1-6. Comparison of areas of mapped aquatic habitat types from 1983 to 2012 at
Oxbow II. .............................................................................................................................. 46

TECHNICAL MEMORANDUM AQUATIC MACROHABITAT TYPES
Susitna-Watana Hydroelectric Project Alaska Energy Authority FERC Project No. 14241 Page iii February 2013
Table 5.1-7. Comparison of areas of mapped aquatic habitat types from 1983 to 2012 at
Slough 8A. ............................................................................................................................ 47
Table 5.1-8. Comparison of areas of mapped aquatic habitat types from 1983 to 2012 at
Slough 9. ............................................................................................................................... 47
Table 5.1-9. Comparison of areas of mapped aquatic habitat types from 1983 to 2012 at Side
Channel 10A. ........................................................................................................................ 47
Table 5.1-10. Comparison of areas of mapped aquatic habitat types from 1983 to 2012 at Side
Channel 10. ........................................................................................................................... 48
Table 5.1-11. Comparison of areas of mapped aquatic habitat types from 1983 to 2012 at
Slough 11. ............................................................................................................................. 48
Table 5.1-12. Comparison of areas of mapped aquatic habitat types from 1983 to 2012 at
Gold Creek. ........................................................................................................................... 48
Table 5.1-13. Comparison of areas of mapped aquatic habitat types from 1983 to 2012 at
Indian River. ......................................................................................................................... 49
Table 5.1-14. Comparison of areas of mapped aquatic habitat types from 1983 to 2012 at
Slough 21. ............................................................................................................................. 49
Table 5.1-15. Comparison of areas of mapped aquatic habitat types from 1983 to 2012 at
Slough 22. ............................................................................................................................. 49
Table 5.1-16. Comparison of areas of mapped aquatic habitat types from 1983 to 2012 at Fat
Canoe Island. ......................................................................................................................... 50
Table 5.1-17. Comparison of areas of mapped aquatic habitat types from 1983 to 2012 at
Portage Creek. ....................................................................................................................... 50
Table 5.2-1. Wetted area of aquatic macrohabitat types at 17,000 cfs (Gold Creek gage) for
Middle River Segment Sites 18 through 23. ......................................................................... 51
Table 5.3-1. Comparison of areas of mapped aquatic habitat types from 1983 to 2012 at
SC IV-4. ................................................................................................................................ 52
Table 5.3-2. Comparison of areas of mapped aquatic habitat types from 1983 to 2012 at
Willow Creek. ....................................................................................................................... 52
Table 5.3-3. Comparison of areas of mapped aquatic habitat types from 1983 to 2012 at
Goose Creek. ......................................................................................................................... 53
Table 5.3-4. Comparison of areas of mapped aquatic habitat types from 1983 to 2012 at
Montana Creek. ..................................................................................................................... 53
Table 5.3-5. Comparison of areas of mapped aquatic habitat types from 1983 to 2012 at
Sunshine Slough. ................................................................................................................... 54
Table 6.1-1. Summation of areas by aquatic macrohabitat types for Sites 1 through 13 in the
Middle River Segment. ......................................................................................................... 55
Table 6.1-2. Summation of areas by aquatic macrohabitat type for Sites 6 through 13 in
Geomorphic Reach MR-6. .................................................................................................... 55
TECHNICAL MEMORANDUM AQUATIC MACROHABITAT TYPES
Susitna-Watana Hydroelectric Project Alaska Energy Authority FERC Project No. 14241 Page iv February 2013
Table 6.1-3. Summation of areas by aquatic macrohabitat type for Sites 2 through 5 in
Geomorphic Reach MR-7. .................................................................................................... 56
Table 6.1-4. Summation areas by aquatic macrohabitat for Site 1 in Geomorphic Reach MR-8. 56
Table 6.1-5. Comparison of changes from 1983 to 2012 at specific sloughs in the Middle
Susitna River. ........................................................................................................................ 57
Table 6.1-6. Comparison of changes from 1983 to 2012 at specific tributaries, sloughs, or side
channels in the Lower Susitna River..................................................................................... 63
LIST OF FIGURES
Figure 3.2-1. Susitna River Geomorphology study area and large-scale river segments. ............ 69
Figure 4.2-1. 2012 Aerial photograph locations. .......................................................................... 70
Figure 4.3-1. Surface area-discharge relationships at SC IV-4 habitat control area. .................... 71
Figure 4.3-2. Application of scaling method to 2012 areas for turbid backwater features at
SC IV-4. ................................................................................................................................ 72
Figure 6.2-1. Relative proportion of aquatic macrohabitat types for sampled sites in Geomorphic
Reach MR-5 of the Middle Susitna River Segment for 1983 and 2012 ............................... 73
Figure 6.2-2. Relative proportion of aquatic macrohabitat types for sampled sites in Geomorphic
Reach MR-6 of the Middle Susitna River Segment for 1983 and 2012. .............................. 74
Figure 6.2-3. Relative proportion of aquatic macrohabitat types for sampled sites in Geomorphic
Reach MR-7 of the Middle Susitna River Segment for 1983 and 2012 ............................... 75
Figure 6.2-4. Relative proportion of aquatic macrohabitat types for sampled sites in Geomorphic
Reach MR-8 of the Middle Susitna River Segment for 1983 and 2012 ............................... 76
Figure 6.2-5. Relative proportion of aquatic macrohabitat types for Site 1 – SC IV-4 (LR-4),
1983 and 2012. ...................................................................................................................... 77
Figure 6.2-6. Relative proportion of aquatic macrohabitat types for Site 2 – Willow Creek
(LR-3), 1983 and 2012. ......................................................................................................... 78
Figure 6.2-7. Relative proportion of aquatic macrohabitat types for Site 3 – Goose Creek (LR-2),
1983 and 2012. ...................................................................................................................... 79
Figure 6.2-8. Relative proportion of aquatic macrohabitat types for Site 4 – Montana Creek
(LR-2), 1983 and 2012. ......................................................................................................... 80
Figure 6.2-9. Relative proportion of aquatic macrohabitat types for Site 5 – Sunshine Slough
(LR-1), 1983 and 2012. ......................................................................................................... 81

TECHNICAL MEMORANDUM AQUATIC MACROHABITAT TYPES
Susitna-Watana Hydroelectric Project Alaska Energy Authority FERC Project No. 14241 Page v February 2013
APPENDICES
Appendix 1. 1983 Middle River Segment Habitat Sites
Appendix 2. 2012 Middle River Segment Habitat Sites
Appendix 3. 1983 Lower River Segment Habitat Sites
Appendix 4. 2012 Lower River Segment Habitat Sites
Appendix 5. Middle River Segment Macrohabitat Types
Appendix 6. Lower River Segment Macrohabitat Types
Appendix 7. Middle River Segment Macrohabitat Type Area Bar Charts
Appendix 8. Lower River Segment Macrohabitat Type Area Bar Charts
TECHNICAL MEMORANDUM AQUATIC MACROHABITAT TYPES
Susitna-Watana Hydroelectric Project Alaska Energy Authority FERC Project No. 14241 Page vi February 2013
LIST OF ACRONYMS AND SCIENTIFIC LABELS
Abbreviation Definition
AEA Alaska Energy Authority
AOI Area of Interest
AOW Additional open water
AT Aerotriangulation
cfs cubic feet per second
DEM Digital Elevation Modern
DMC Digital Mapping Camera
DTM Digital Terrain Model
FERC Federal Energy Regulatory Commission
FIPS Federal Information Processing Standard
GIS Geographic Information System
GPS Global Positioning System. A system of radio-emitting and -receiving satellites used for determining positions on the earth.
Hz Hertz
ILP Integrated Licensing Process
IMU Inertial measurement unit
LiDAR Light Detection and Ranging
LR Lower River
MR Middle River Segment
NAD North American Datum
NAVD North American Vertical Datum
NEPA National Environmental Policy Act
PRM Project River Mile
QC Quality control
RM River Mile(s)
SC side channel
USGS U.S. Geological Survey

TECHNICAL MEMORANDUM AQUATIC MACROHABITAT TYPES
Susitna-Watana Hydroelectric Project Alaska Energy Authority FERC Project No. 14241 Page vii February 2013
Summary
The overall purpose of the work presented in this technical memorandum is to quantify aquatic
macrohabitat types at selected sites in the Middle and Lower Susitna River Segments, compare
the resulting areas, and determine the applicability of the 1980s information to current
conditions. Specific objectives included: identification of surface area of riverine habitat types
(aquatic habitat and geomorphic features) over a range of stream flows and compare existing and
1980s aquatic habitat types to characterize the relative stability (proportionality of the various
units) of the 1980s study sites under unregulated flow conditions.
A complete set of color aerial photographs was collected and processes for the Middle River for
flows ranging from 12,900 cfs to 17,000 cfs and for the Lower River at flows ranging from
38,200 cfs to 55,000 cfs. Orthorectified digital aerial images of black and white aerial
photographs collected in 1983 at 12,500 cfs in the Middle River and 36,600 cfs in the Lower
River were obtained. Both geomorphic features and the wetted surface area for the various
habitat types were delineated at 23 sites in the Middle River and five sites in the Lower River to
create a GIS database of the aquatic habitat at the sites. The surface area of the aquatic habitat
was determined from by processing the GIS information.
The surface areas for the various aquatic habits types defined in the 1980s as main channel, side
channels, side sloughs, upland sloughs and tributary mouths in the Middle River and with the
additional habitat types of turbid backwaters, secondary side channels in the Lower River were
tabulated and compared between the 1983 and 2012 conditions. This included aggregating the
data by reach in the Middle River where 50 percent of the total length was sampled. The data
was also processed to compare the relative proportion (percentage) of the various habitat types at
the sites and in the case in the Middle River by geomorphic reaches. The results of the
comparison between the 1983 and 2012 data were used to determine whether changes have
affected the frequency and distribution of macrohabitat units.
The study identified appreciable changes in the distribution and proportion of aquatic habitat
types in both the Middle and Lower Susitna River Segments between the 1980s and 2012. For
example, from 1983 to 2012 there has been a 42 percent reduction in the area of side slough
habitat in the Middle River sites sampled. The side slough had changed to side channels. This is
in contrast to a 1985 report which indicated that out of 33 lateral habitats analyzed, 12 had
changed classification of which 11 had evolved to a less connected habitat type either side
channel to side slough or side slough to upland slough. Only one channel went to a more
connected type, in this case side slough to side channel. This is the opposite of the trend between
1983 and 2012 where the trend was to change to a more connected type, side slough to side
channel. This suggest a fairly high level of natural variability associated with the whether a
particular lateral habitat will be a side channel or side slough. Middle River Segment, changes
have generally been more subtle than in the Lower River Segment. In the Lower River, the
changes have been associated with large scale erosion that has resulted in altering the locations
and types of connections between the main channel and the lateral habitats or in some cases
eroding the geomorphic features associated with the lateral habitat. The Lower River displayed
even more dynamic behavior in terms of the relative proportion of habitat in each type present in
1983 versus 2012 than the Middle River. For example, the combined clearwater/side slough
habitat type either increased or decreased by a factor of nearly two for all five sites with three
sites showing an increase and two sites a decrease.

TECHNICAL MEMORANDUM AQUATIC MACROHABITAT TYPES
Susitna-Watana Hydroelectric Project Alaska Energy Authority FERC Project No. 14241 Page viii February 2013
This page intentionally left blank.

TECHNICAL MEMORANDUM AQUATIC MACROHABITAT TYPES
Susitna-Watana Hydroelectric Project Alaska Energy Authority FERC Project No. 14241 Page 1 February 2013
1. INTRODUCTION
The Alaska Energy Authority (AEA) is preparing a License Application that will be submitted to
the Federal Energy Regulatory Commission (FERC) for the Susitna-Watana Hydroelectric
Project (Project) using the Integrated Licensing Process (ILP). The Project is located on the
Susitna River, an approximately 300-mile-long river in the South-Central Region of Alaska. The
Project’s dam site will be located at Project River Mile (PRM) 187.1. The results of this study
will provide information that will inform the 2013–2014 formal study program, Exhibit E of a
license application, and FERC’s National Environmental Policy Act (NEPA) analysis for the
Project license.
This technical memorandum provides the results from tasks that are part of the following two
2012 Study Plans:
2012 G-S2: Aquatic Habitat and Geomorphic Mapping of the Middle River using Aerial
Photography
2012 G-S4: Reconnaissance-Level Geomorphic and Aquatic Habitat Assessment of
Project Effects on Lower River Channel
The 2012 G-S2 Study Plan addresses efforts in the Middle Susitna River Segment. The G-S2
effort presented in this technical memorandum includes the entire Aerial Photography task. In
addition, it includes the riverine habitat-related portions of the following: Digitize Geomorphic
Features and River Habitat Types task, and the Riverine Habitat and Geomorphic Analysis task.
The subtasks covered under the digitization task include: Aerial Photography Analysis Riverine
Habitat Study Sites RM 98 to RM 150 (PRM 102 to PRM 154.5), 1980s Riverine Habitat Types
RM 98 to RM 150 (PRM 102 to PRM 154.5), and 2012 Riverine Habitat Types RM 98 to RM
184 (PRM 102 to187.1). Under the second task, analysis involved the aquatic habitat portions of
the following three subtasks: RM 98 to 150 (PRM 102 to PRM 154.5), RM 150 to RM 184
(PRM 154.5 to PRM 187.1), and 1980s Study Site Stability. The geomorphology aspects of these
subtasks are presented under a separate technical memorandum, Mapping of Geomorphic
Features and Assessment of Channel Change in the Middle and Lower Susitna River Segments
from 1980s and 2012 Aerials (Tetra Tech 2013a).
The 2012 G-S4 Study Plan addresses efforts in the Lower Susitna River Segment. This technical
memorandum presents portions of the Riverine Habitat-Flow Relationship Assessment task of
the 2012 G-S4 Study Plan effort. This includes the Site Selection and Stability Assessment
subtask and the Aerial Photography Analysis Riverine Habitat Study Sites RM 28 to RM 98
(PRM 32 to PRM 102) subtask. The River Stage subtask is presented in the 2012 study technical
memorandum Stream Flow Assessment (Tetra Tech 2013b). The 1980s habitat synthesis subtask
is presented in the 2012 study technical memorandum Synthesis of 1980s Aquatic Habitat
Information (Tetra Tech 2013c). It should also be noted that the aerial photography based
geomorphology effort for the Lower River is presented in the 2012 study technical memorandum
Mapping of Geomorphic Features and Assessment of Channel Change in the Middle and Lower
Susitna River Segments from 1980s and 2012 Aerials (Tetra Tech 2013a).
The work presented in this technical memorandum involved three primary items. The first was
collection of aerial photographs for both the Middle and Lower Susitna River Segments. The

TECHNICAL MEMORANDUM AQUATIC MACROHABITAT TYPES
Susitna-Watana Hydroelectric Project Alaska Energy Authority FERC Project No. 14241 Page 2 February 2013
intent of this portion of the scope was to collect aerials for three discharges in the Middle River
and one discharge in the Lower River. For the Middle River, flows of 23,000 cubic feet per
second (cfs), 12,500 cfs, and 5,100 cfs (measured at Gold Creek) were targeted as the covered
range of flows collected in the 1980s. For the Lower River, a moderate flow of 36,600 cfs
(measured at Sunshine) was chosen as the target for aerial photograph collection. Creation of the
digital orthorectified 2012 aerial images was part of this effort as was obtaining orthorectified
digital images of the 1980s aerials that corresponded to the targeted flow(s) in both river
segments.
The second major category of work consisted of using the digital images and Geographic
Information System (GIS) software to transfer the 1980s aquatic macrohabitat areas delineated in
the map books to the 1980s orthorectified digital images. The 2012 aerial images were used to
delineate 2012 macrohabitat types at selected sites based on the 1980s macrohabitat type
definitions.
The final aspect of the effort consisted of developing the wetted areas for each macrohabitat type
at each site for both the 1980s and 2012 habitat delineations from the resulting polygons. These
areas were compared with each other, along with visual comparison of the aerials and digitized
polygons, to assess the changes in aquatic macrohabitat areas and the potential applicability of
the 1980s macrohabitat results for the current effort.
Since a major portion of this study involved digitization of 1980s habitat, extensive use has been
made of several 1980s study products. The two map books, Response of Aquatic Habitat Surface
Areas to Mainstem Discharge in the Talkeetna-To-Devil Canyon Segment of the Susitna River,
Alaska (Trihey & Associates 1985a) and Response of Aquatic Habitat Surface Areas to
Mainstem Discharge in the Yentna to Talkeetna Reach of the Susitna River (R&M Consultants,
Inc. and Trihey & Associates 1985a), presenting the 1980s habitat delineation work for the
Middle and Lower Susitna River Segments were the basis for the digitization. In addition, two
reports further discussing important aspects of the aquatic macrohabitat classification and
analysis, Characterization of Aquatic Habitats in the Talkeetna-to-Devil Canyon Segment of the
Susitna River, Alaska (Trihey & Associates 1985b) and Assessment of Access by Spawning
Salmon into Tributaries of the Lower Susitna River (R&M Consultants, Inc. and Trihey &
Associates 1985b), were consulted to better understand the 1980s work and to assist in site
selection.
2. STUDY OBJECTIVES
The overall purpose of the work presented in this technical memorandum is to quantify aquatic
macrohabitat types at selected sites in the Middle and Lower Susitna River Segments, compare
the resulting areas, and determine the applicability of the 1980s information to current
conditions. The 2012 G-S2 Study Plan states in the objectives that:
Understanding the extent to which current (2012) aquatic habitat and geomorphic
features are similar to or different from 1980s conditions will not only provide
information on the long-term equilibrium of the channel, but will also help inform the
extent to which other datasets collected in the 1980s can be relied upon to describe
and supplement more recent aquatic habitat and geomorphic data.

TECHNICAL MEMORANDUM AQUATIC MACROHABITAT TYPES
Susitna-Watana Hydroelectric Project Alaska Energy Authority FERC Project No. 14241 Page 3 February 2013
The specific objectives of the G-S2 (Middle River) effort are listed below. (Note: the
geomorphology aspects are covered in a separate 2012 study technical memorandum [Tetra Tech
2013a].)
Identify the surface area of riverine habitat types (aquatic habitat and geomorphic
features) over a range of stream flows.
Compare existing and 1980s geomorphic feature/units and associated aquatic habitat
types to characterize the relative stability (proportionality of the various units) of the
1980s study sites and river morphology under unregulated flow conditions.
The G-S4 (Lower River) effort presented in this technical memorandum is part of the following
objective from the 2012 G-S4 Study Plan:
Conduct a geomorphic assessment of historic channel change and its drivers as well as
determine whether changes have affected the frequency and distribution of macrohabitat
units.
The portion of the objective presented in this technical memorandum is the “determine whether
changes have affected the frequency and distribution of macrohabitat units.” The geomorphology
aspects of the objective are covered in a separate 2012 technical memorandum (Tetra Tech
2013a).
3. STUDY AREA
3.1. General
The Susitna River located in south-central Alaska drains an area of approximately 20,010 square
miles and flows about 320 miles from its headwaters at the Susitna, West Fork Susitna, and East
Fork Susitna glaciers to Cook Inlet (U.S. Geological Survey [USGS] 2012). The Susitna River
Basin is bounded on the west and north by the Alaska Range, on the east by the Talkeetna
Mountains and Copper River Lowlands, and on the south by Cook Inlet. The highest elevation in
the basin is at Mt. McKinley at 20,320 feet while its lowest elevation is at sea level where the
river discharges into Cook Inlet. Major tributaries to the Susitna River between the headwaters
and Cook Inlet include the Chulitna, Talkeetna, and Yentna rivers, which are also glacially fed in
their respective headwaters. The basin receives, on average, 35 inches of precipitation annually
with average annual air temperatures of approximately 29oF.
3.2. Susitna River Segments
The overall study area extends from PRM 0 at Cook Inlet to the Maclaren River confluence at
PRM 261.3. Within the geomorphology study area, the Susitna River has been subdivided into
three segments whose general characteristics are governed by the basin geology as described by
Wilson et al. (2009). The segments are referred to as the Upper, Middle, and Lower Susitna
River Segments and are identified in Figure 3.2-1 with the associated extents:

TECHNICAL MEMORANDUM AQUATIC MACROHABITAT TYPES
Susitna-Watana Hydroelectric Project Alaska Energy Authority FERC Project No. 14241 Page 4 February 2013
Upper Susitna River Segment: Maclaren River confluence (PRM 261.3 / RM 260)
downstream to the proposed Watana Dam site (PRM 187.1 / RM 184).1
Middle Susitna River Segment: Proposed Watana Dam site (PRM 187.1 / RM 184)
downstream to the Three Rivers Confluence (PRM 102.4 / RM 98.5).
Lower Susitna River Segment: Three Rivers Confluence (PRM 102.4 / RM 98.5)
downstream to Cook Inlet (PRM 3.3 / RM 0).
The study effort for the work presented in this technical memorandum covers the Middle and
Lower Susitna River Segments. The Upper River is not part of the 2012 study effort documented
in this technical memorandum. The Middle River (MR) segment extends from the Watana Dam
site to the Three Rivers Confluence at about PRM 102.4 (RM 98.5). The general characteristics
of the river in this segment are heavily influenced by bedrock outcrop as well as Quaternary-age
glaciations. The Lower River (LR) segment extends from the Three Rivers Confluence (PRM
102.4 / RM 98.5) to the tidal flats at Cook Inlet (PRM 3.3 / RM 0). The morphologic
characteristics of the river in this segment are dominated by sediment loading from the major
tributaries and variable resistance to erosion of the Pleistocene-age, glacially-derived materials
including tills (moraines), glacio-fluvial sediments in various elevation outwash-surfaces, and
glacio-lacustrine sediments that control the width of the valley.
4. METHODS
4.1. Deviations from Study Plan
The two primary deviations for the 2012 G-S2 and G-S4 Study Plans involve collection of the
2012 aerial photographs in the Middle and Lower Susitna River Segments. In both segments, it
was the intent to collect aerials at specific discharges, targeted to correspond to flows for aquatic
habitat that was mapped in the 1980s. For the Lower River, a single flow was targeted and in the
Middle River three flows were targeted. The specifics of the deviations in the 2012 aerial photo
acquisition and the resulting implications to other portions of the 2012 habitat mapping study
efforts are identified in the following subsections.
4.1.1. Middle River 2012 Aerial Photo Acquisition
It was the intent of the 2012 G-S2 (Middle River) Study Plan to obtain three sets of aerial
photography in the Middle River in 2012 at the following approximate discharges: 23,000 cfs,
12,500 cfs, and 5,100 cfs. (Note: Seven sets of aerial photographs were flown and evaluated in
the 1980s study at the stream flows of 5,100 cfs, 7,400 cfs, 10,600 cfs, 12,500 cfs, 16,000 cfs,
18,000 cfs, and 23,000 cfs.) The combination of weather conditions and river flows only allowed
portions of the 12,500 cfs (PRM 102.4 to PRM 143.6) and 23,000 cfs (PRM 102.3 to PRM 119)
1 Note: Project River Miles (PRMs) are the river mile system used for the current Susitna-Watana Project. River Miles (RMs)
were the river mile system used in the 1980s project. The PRM delineation starts about 3 miles farther into Cook Inlet than the
RMs and has a slightly different thalweg than that of the 1980s. Thus, PRM values are generally 3 to 4 miles higher than the RM
values. Because this analysis is a temporal comparison, both systems are referenced.

TECHNICAL MEMORANDUM AQUATIC MACROHABITAT TYPES
Susitna-Watana Hydroelectric Project Alaska Energy Authority FERC Project No. 14241 Page 5 February 2013
aerials to be collected in 2012. Additional aerials were collected at a flow of 17,000 cfs on
September 30, 2012 to ensure that complete coverage of the Middle River was available,
regardless of flow level. No aerials were obtained for the lowest flow of 5,100 cfs as ice and
snow cover formed prior to the Susitna River dropping to this level.
The flow levels intended to be collected in 2013 will be the remainder of the 12,500 and 23,000
cfs acquisitions and all of the 5,100 cfs acquisition. If weather and discharge conditions do not
occur to allow for collection of the aerials at the specified discharges by September 1, 2013, a
more opportunistic approach to obtaining the aerials will be instituted and alternate flows may be
substituted for the 12,500 cfs and 5,100 cfs discharges to ensure that complete sets of images at
medium and low flow are collected by the end of 2013. The dates, discharges, and PRM extents
of the Middle River aerial acquisition in the 1980s and 2012 are summarized in Table 4.1-1 and
Table 4.1-2, respectively.
4.1.2. Lower River 2012 Aerial Photo Acquisition
The 2012 G-S4 (Lower River) Study Plan called for acquisition of Lower River aerial
photographs at a flow of 36,600 cfs. (Note: Five sets of aerial photographs were flown and
evaluated in the 1980s in the Lower Susitna River Segment at Susitna River discharges measured
at Sunshine of 75,200 cfs, 59,100 cfs, 36,600 cfs, 21,100 cfs, and 13,900 cfs.) The combination
of weather conditions and river flows only allowed portions of the 36,600 cfs (PRM 102.3 to
PRM 78) to be collected at a flow approximately equal to the target flow. The actual discharge in
the Susitna River during the September 10, 2012 aerial acquisition was 38,200 cfs. The
remainder of the Susitna River aerial coverage for 2012 was developed from aerials collected at
flows of 53,000 cfs (PRM 78 to PRM 63 7/27/2012), 55,000 cfs (PRM 63 to PRM 33.5 and
PRM 22.5 to PRM 0 10/10/2013), and 48,000 cfs (PRM 33.5 to PRM 22.5 9/30/2012). The
dates, discharges, and PRM extents of the Lower River aerial acquisition in the 1980s and 2012
are summarized in Table 4.1-1 and Table 4.1-2, respectively.
In 2013, complete coverage of the Lower River will be obtained at or near the targeted flow of
36,600 cfs. Additional discharges may be obtained depending on evaluation of the needs of other
ongoing studies for the Project, including the Fish and Aquatics Instream Flow Study and the
Riparian Instream Flow Study.
4.1.3. Middle River Habitat Mapping
Because only a small portion of the Middle River, approximately 17 miles, was covered by
aerials acquired in 2012 at 23,000 cfs, and no aerials at 5,100 cfs were collected for the Middle
River, 2012 habitat mapping was not developed for 23,000 cfs and 5,100 cfs target flows. As a
result of the collection of portions of the Middle River aerial images at flows considerably higher
than the 12,500 cfs medium flow target, habitat from PRM 143.6 to PRM 187.1 was delineated
at 17,000 cfs. In order for habitat areas delineated from the 2012 images to be compared to those
delineated in the 1980s, the habitat areas determined at 17,000 cfs were scaled down using the
habitat area versus flow relationships developed from 1980s data. The scaling procedure is
described in Section 4.3.3.

TECHNICAL MEMORANDUM AQUATIC MACROHABITAT TYPES
Susitna-Watana Hydroelectric Project Alaska Energy Authority FERC Project No. 14241 Page 6 February 2013
4.1.4. Lower River Habitat Mapping
As a result of the collection of portions of the Lower River aerial images at flows considerably
higher than the 36,600 cfs target, several Lower River habitat sites were delineated at flows on
the order of 50,000 cfs. In order for habitat areas delineated from the 2012 images to be
compared to those delineated in the 1980s, the areas determined at the higher 2012 flows were
scaled down using the habitat area versus flow relationships developed from 1980s data. The
scaling procedure is described in Section 4.3.3.
4.2. Processing of Aerial Photography
The digital color aerial photographs were collected in 2012 at a scale of 1:12,000 and with a
pixel resolution of 1 foot or better. The creation of digital orthoimagery for Susitna River from
these images has entailed several steps.
The aerial imagery was received from AeroMetric in 4-band, 16-bit TIFF format. Four band
means that the imagery contains the red, green, blue, and infrared bands. Sixteen bit means that
the imagery contains the full radiometric range, and the pixel intensities have not been
compressed to 8 bit (equals intensities 0 to 255). Tetra Tech received 393 images for ‘event A’
flown in July of 2012 and 1,962 images for ‘event B’ flown during September and October of
2012. Each TIFF file was about 1.1 GigaByte in size. Figure 4.2-1 identifies the portions of the
study area flown in these two periods.
For acquisition, AeroMetric used several cameras. All digital mapping cameras (DMCs) were
equipped with airborne global positioning system (GPS) and inertial measurement unit (IMU).
The airborne GPS was collected at 1 hertz (Hz) frequency; the IMU was collected at 200 Hz
frequency. Integration of the kinematic airborne GPS and of the IMU data in post-processing
provided strong results for position and attitude of the camera at any given moment during
acquisition. In addition to the TIFF image files, AeroMetric delivered the camera calibration
reports and the processed airborne GPS and IMU data.
The acquisition specifications asked for flight acquisition to occur with a sun angle above
30 degrees to reduce shadows and with a geometrically strong constellation of GPS satellites.
The AeroMetric team was also requested to collect imagery that was free of clouds, haze, and
smoke. Due to persistent poor weather conditions and high flows, AeroMetric was instructed in
early September to collect any available imagery within the Area of Interest (AOI) that could be
collected. This resulted in the high flow event imagery being collected with some cloud cover
and below the specified 30-degree sun angle.
The study team reviewed all incoming data, including imagery and GPS photo-center plots. The
quality control (QC) personnel reviewed the processed imagery for geometric and radiometric
quality, sun hot spots, sharpness, possible color problems, possible gaps in coverage, and cloud
coverage or smoke in the images. The study team verified output target coordinate system,
datum, units, and geoid used.
The study team performed its own aerotriangulation (AT) of the imagery. Input for the AT
included the images, the camera data, and the result of the airborne GPS processing. The AT
images were tied together by automatically measured so called tie-points. Surveyed ground
control was not collected for this project. The AT provides the basis for geometric accuracy for
the project. The geometric quality of the orthoimagery ultimately depends on the result of the AT

TECHNICAL MEMORANDUM AQUATIC MACROHABITAT TYPES
Susitna-Watana Hydroelectric Project Alaska Energy Authority FERC Project No. 14241 Page 7 February 2013
and on the digital terrain model (DTM). After completing the AT, before proceeding with
orthorectification, the study team evaluated the quality and fit of the available DTM data.
Orthomosaic tiles were created separately for events A and B. Inputs are the raw images and the
result of the AT and the DTM. The study team received all aerial images that had been acquired
by AeroMetric. This includes images that had later been reflown due to heavy cloud coverage.
The study team first made a selection of the images, based on river discharge and aerial quality,
to be used for orthorectification. In a batch, all selected aerial images were orthorectified. All
orthoimages were then radiometrically balanced. Images underwent histogram operations to
optimize brightness and contrast. Images were globally balanced on a per project basis to
mitigate color and brightness and contrast differences between flightlines or even acquisition
dates. Part of the Susitna Project area was flown during summer conditions and part with snow
on the ground. These conditions cannot be seamlessly adjusted and a clear cutline exists instead.
During this radiometric balancing, process images were converted from 16-bit radiometric range
to 8-bit radiometric range per color band.
The individual orthoimages were stitched together along seamlines to create a seamless mosaic.
The seamline creation is an automated process; however, all seamlines were reviewed and
manually edited wherever necessary. Since the complete mosaic was too large to be stored in one
single file, the mosaics were written into manageable mosaic tiles. Each mosaic tile was saved as
a geoTIFF file with accompanying GIS World File tfw header and Microsoft Excel xls metadata
file. Each geoTIFF tile contains 4 bands (red, green, blue, and infrared).
MrSid-compressed orthoimages were also created. MrSid version 3 files were saved separately
as 3-band natural color (red, green, and blue) images and as 3-band color infrared (infrared, red,
and green) images.
Metadata was generated in ArcMap to be compatible with ArcMap 10 platforms. The final
product was passed through QC procedures following internal orthoimage QC guidelines. The
final product was inspected for geometric accuracy, radiometric quality of the imagery, and
completeness of the data set. Special attention was paid to areas along seamlines.
4.3. Site Selection and Stability Assessment
4.3.1. Site Selection
A total of 28 sites on the Susitna River below the Watana Dam site were selected for mapping of
2012 aquatic macrohabitat and comparison with similar mapping in the 1980s. These sites were
selected and defined, in terms of their extents, by the Geomorphology Study in coordination with
the ongoing Fish and Aquatics Instream Flow Study, the Riparian Instream Flow Study and the
Ice Processes Study. Five sites were selected in the Lower Susitna River Segment and 23 sites in
the Middle Susitna River Segment.
4.3.1.1. Middle River Susitna River Segment
In the 1980s, only the portion of the Middle River from PRM 104 to PRM 153 (RM 101 to RM
149) was mapped for habitat (Trihey & Associates 1985a). Within this 49-mile section of the
Middle River, 17 sites were selected to develop comparisons of 2012 aquatic macrohabitat with
the aquatic macrohabitat mapped in the 1980s. These sites total 27.2 miles and represent over

TECHNICAL MEMORANDUM AQUATIC MACROHABITAT TYPES
Susitna-Watana Hydroelectric Project Alaska Energy Authority FERC Project No. 14241 Page 8 February 2013
50 percent of the 49-mile total length of this portion of the Middle River. The sites were selected
to:
represent a wide range of aquatic macrohabitat types,
include areas with considerable study information available from the 1980s,
include sites within all the geomorphic reaches, and
represent the range of change that has occurred within the Middle River between the
1980s and 2012.
The 17 selected sites are listed in Table 4.3-1 along with their rationale for selection. Based on
the side-by-side comparison of the 1983 and 2012 images flown at approximately 12,500 cfs,
large scale channel changes were not detected. Over the 30-year period of comparison, the
Middle River was relatively stable with the most common change being increased extent of
vegetation on islands. Vegetation encroachments were also apparent on some of the lateral
habitats. In several cases, sites include lateral habitat features that appear to have changed their
level of connectivity with the main channel or side channel. There were a few areas where
erosion of attached bars or formation of mid-channel bars was observed, but no major changes in
channel dimensions or alignment were detected from the qualitative comparison of the 1983 and
2012 aerials.
At least one site was selected in each geomorphic reach. Geomorphic Reach MR-1 has only one
site selected, Whiskers Slough, but this reach is short and habitat in the lower 2 miles of the
reach was not mapped in the 1980s. The 1.5-mile site represents nearly 50 percent of the 3.5
miles of the reach that were mapped for aquatic macrohabitat in the 1980s. All other reaches
have at least two sites, with MR-6, the longest reach, having nine sites selected and MR-7, the
next longest reach, having five sites selected.
The Middle Susitna River Segment upstream of PRM 153 was not studied in the 1980s;
however, the current habitat features are to be delineated for up to 50 percent of the portion of
the segment encompassing Geomorphic Reaches MR-1 and MR-2 (PRM 187.1 to PRM 169.6).
Geomorphic Reaches MR-3 and MR-4 (PRM 169.6 to PRM 153.9) are not being studied in this
effort since data cannot be collected safely in these reaches due to the extreme gradient and
hydraulic conditions in Devils Canyon. Six sites were selected in Geomorphic Reaches MR-1
and MR-2, representing a variety of conditions and totaling 9 miles of the total 17.5 miles of
combined Geomorphic Reaches MR-1 and MR-2. These sites include three proposed Focus
Areas and represent over 50 percent of length of Geomorphic Reaches MR-1 and MR-2. One site
is located in MR-1 and five sites are located in MR-2. The sites selected represent the more
complex aquatic macrohabitat found in these reaches, including the majority of the lateral habitat
and split channel areas. The selected sites also include one of the two largest tributaries in this
portion of the Middle River. Table 4.3-2 lists the location of all 23 sites in the Middle Susitna
River Segment selected for mapping of aquatic macrohabitat as part of the ongoing
Geomorphology Study.
Though the 2012 effort represents mapping approximately 50 percent of the Middle Susitna
River Segment, aerial photography for both the 1980s and present condition was obtained for the
entire Middle River Segment so that aquatic macrohabitat in other areas could be mapped. In
addition, geomorphic features were mapped for 100 percent of the Middle River including the
portion in MR-3 and MR-4 (Tetra Tech 2013a).

TECHNICAL MEMORANDUM AQUATIC MACROHABITAT TYPES
Susitna-Watana Hydroelectric Project Alaska Energy Authority FERC Project No. 14241 Page 9 February 2013
4.3.1.2. Lower Susitna River Segment
In the 1980s habitat mapping was conducted at eight sites in the Lower Susitna River (R&M
Consultants, Inc. and Trihey & Associates 1985a). Except for one site, Side Channel (SC) IV-4,
these sites all had a significant tributary that formed part of the lateral habitat. One of the 1980s
macrohabitat mapping sites, Willow Creek, has two tributaries studied, Willow Creek and Little
Willow Creek. Of the eight sites, seven were investigated in Assessment of Access by Spawning
Salmon in the Tributaries of the Lower Susitna River (R&M Consultants, Inc. and Trihey &
Associates 1985b). The eight sites mapped in the 1980s were:
Birch Creek Slough
Sunshine Slough (Sunshine Creek)
Montana Creek
Goose Creek
Sheep Creek
Caswell Creek
Willow Creek
Side Channel IV-4
Five of these sites were selected for comparison of aquatic macrohabitat mapped in the 1980s
and 2012. To select these sites, a side-by-side comparison using the 1983 36,600 cfs aerials and
the 2011 aerials from the Mat-Su Borough Light Detection and Ranging (LiDAR) Project
(Matanuska-Susitna Borough 2011) were used to qualitatively assess site stability. Only sites that
had been relatively stable during the period from the 1980s to present were selected. The five
sites selected were: Side Channel IV-4 (SC IV-4), Willow Creek (SC III-1), Goose Creek (SC II-
4), Montana Creek (SC II-1), and Sunshine Slough (SC I-5). Side Channel IV-4 was chosen
since it represented the only site studied in the 1980s mapping effort that did not have a tributary
as a component of the aquatic macrohabitat mapped at the site. Caswell Creek and Sheep Creek
were not selected since the interaction with the Susitna River is only at the mouth of the
tributary. Birch Creek was not selected because the Susitna River had migrated over 1,000 feet to
the east, splitting the slough into two segments.
The five selected sites are presented in Table 4.3-3. At least one site was selected in the four
geomorphic reaches above the Yentna River confluence, with two sites selected in Geomorphic
Reach LR-2. Though the 2012 effort represents mapping a small portion of the Lower River, the
five sites represent over 50 percent of the habitat mapping performed in the Lower River in the
1980s. Aerial photography for both the 1980s and 2012 was obtained for the entire Lower River
Segment so aquatic macrohabitat in other areas could be mapped. In addition, geomorphic
features were mapped for 100 percent of the Lower River from PRM 102.4 to PRM 3.3 (Tetra
Tech 2013a).

TECHNICAL MEMORANDUM AQUATIC MACROHABITAT TYPES
Susitna-Watana Hydroelectric Project Alaska Energy Authority FERC Project No. 14241 Page 10 February 2013
4.3.2. Stability Assessment
4.3.2.1. Digitization Procedure
Prior to performing the aquatic macrohabitat delineations, boundaries were defined for the
selected habitat sites. Within each habitat site, polygons were delineated for exposed substrate,
vegetated islands, and wetted habitat types. Wetted areas were mapped as one of the aquatic
habitat types only if the area had a connection to the Susitna River. This connection did not have
to be direct, but could be through one or more additional wetted habitat types. For example, an
upland slough could connect to a side slough, which connects to a side channel and ultimately
the main channel. If the water body was isolated and there was not a connection to the Susitna
River, then the wetted area was mapped as additional open water (AOW).
Delineations were made using ArcGIS 10.0 at a scale of 1:3000. Habitat delineations from the
2012 aerials were assisted by use of the 2011 Mat Su LiDAR (Matanuska-Susitna Borough
2011) to determine elevation differences to better define the boundary between channel areas and
floodplain or island areas. The LiDAR was used to determine bank and water surface elevations
in areas of shadows and under vegetation cover in the upper ends of sloughs. The LiDAR dataset
is referenced to a coordinate system of North American Datum (NAD) 1983 State Plane Alaska
4 Federal Information Processing Standard (FIPS) 5,004 Feet.
Area measurements (square feet) were calculated to the sixth decimal point and tabulated to an
accuracy of 1,000 sq. ft. Each habitat type within the habitat sites as well as the total area of the
habitat site (control area) was summed for comparison. To verify that all habitat surface areas
were accounted for, each habitat type was summed and compared to the control area.
Comparisons between summed individual areas and the total control area were considered
acceptable if the difference was less than 0.5 percent. The habitat type areas were used in this
analysis to compare habitat type surface areas between 1983 and 2012.
4.3.2.2. Riverine Habitat Classification Definitions
Two sets of aquatic macrohabitat classification definitions were used: one for the sites in the
Lower Susitna River Segment and one for the sites in the Middle Susitna River Segment. The
riverine aquatic macrohabitat classifications (all channels, sloughs, and tributaries) apply to the
wetted area of a feature. The aquatic macrohabitat along with the exposed substrate contained
within the banks of perennial vegetation comprise geomorphic features which are bounded at
their mouths and inlets. Geomorphic feature mapping was performed for all areas within the
geomorphic boundary of the Middle and Lower Susitna River Segments. This is in contrast to
aquatic habitat type mapping which was for 23 selected habitat sites in the Middle river and five
habitat sites in the Lower River. Further, while many habitat types are classified similarly, or the
same as, geomorphic types (i.e., main channel, side channel), there were distinctions made
pertaining to the wetted connectivity of the area. For example, while a wetted area in a side
slough with regions of exposed substrate isolating it from the main wetted slough region would
still be classified as part of the side slough by the geomorphic classification system, the isolated
wetted region would be classified as an AOW by the habitat classification system. This
distinction is due to the lack of a wetted connection through which aquatic organisms can pass.
The results of the geomorphic feature mapping are presented in a separate technical
memorandum (Tetra Tech 2013a).

TECHNICAL MEMORANDUM AQUATIC MACROHABITAT TYPES
Susitna-Watana Hydroelectric Project Alaska Energy Authority FERC Project No. 14241 Page 11 February 2013
4.3.2.2.1. Middle Susitna River Segment Habitat
The aquatic macrohabitat in the Middle Susitna River Segment was classified using categories as
defined in Trihey & Associates (1985a). The Middle Susitna River Segment macrohabitat types
were classified into the following categories: vegetated areas, exposed substrate, and aquatic
macrohabitat (main channel, side channel, side sloughs, upland sloughs, and tributary mouths).
As previously mentioned, isolated wetted areas were mapped as additional open water and were
not considered part of the riverine habitat. With the inclusion of tributaries and additional open
water, the classifications were defined in 2012 as follows:
Main Channel habitat types are those channels of the river that normally convey
streamflow throughout the entire year. They are visually recognizable by their turbid
glacial water and high velocities. In general, they convey more than 10 percent
(approximate) of the total flow passing a given location.
Side Channel habitat types are also characterized by turbid glacial water. Velocities
often appear lower than in mainstem sites. In general, they convey less than 10 percent
(approximate) of the total flow passing a given location. Side channel habitat may exist in
well-defined channels or in areas possessing numerous islands and submerged gravel
bars. When the upstream berms of side channels are dewatered and the channels contain
clear water, they are classified as side sloughs.
Side Slough habitat types contain clear water. Small tributaries, upwelling groundwater,
and local surface runoff are the primary sources of clear water for these areas. Side
sloughs have non-vegetated upper thalwegs that are overtopped during periods of
moderate to high mainstem discharge. When these areas are overtopped they convey
turbid water and are then classified as side channels.
Upland Slough habitat types also contain clear water and depend on small streams,
upwelling, and local surface runoff for their water supply. Upland sloughs possess
vegetated upper thalwegs that are rarely overtopped by mainstem discharge.
Tributary habitat is the portion of a tributary channel flowing across the floodplain.
Tributaries are typically clear water except in the case of the large channels such as the
Yentna, Talkeetna and Chulitna, which were not classified as tributaries but rather as
separate reaches of the Lower Susitna River Segment.
Tributary Mouth habitat types are clear water areas that exist where tributaries flow into
main channel or side channel habitats. This habitat type is manifest as a clear water
plume extending out into the turbid receiving water. Tributary mouth habitat also extends
upstream into the tributary to the upper extent of any backwater influence that might
exist. The surface area of tributary mouth habitat is affected both by tributary discharge
and mainstem state. Tributary mouths were delineated per geomorphic feature with a
main channel, side channel, and tributary adjective for the 2012 habitat delineation.
Vegetated Islands consist of discrete, large vegetated islands that exist within or along
the main channel. Vegetated islands have perimeters of perennial vegetation edges.

TECHNICAL MEMORANDUM AQUATIC MACROHABITAT TYPES
Susitna-Watana Hydroelectric Project Alaska Energy Authority FERC Project No. 14241 Page 12 February 2013
Additional Open Water (AOW) is defined as standing water areas that are not channels
or sloughs or rivers. These are isolated bodies of water without a discernible direct or
indirect surface connection to the Susitna River. This category was applied in the 2012
Middle Susitna Segment habitat and geomorphology, but not the 1980s habitat.
Exposed Substrate is a non-wetted mapping type that is typically composed of gravel
and cobble but can also have annual vegetation or immature perennial vegetation.
Exposed substrate is mapped within the boundaries of the geomorphic features including
sloughs, channels, vegetated islands, and tributaries that are above the water surface
elevation. The combination of exposed substrate and wetted habitat comprise the area
within a geomorphic feature.
4.3.2.2.2. Lower Susitna River Segment Habitat
For the Lower Susitna River Segment habitat mapping sites, the set of classification definitions
followed that of R&M Consultants, Inc. and Trihey & Associates (1985b). These included:
vegetated areas, exposed substrate, and aquatic macrohabitat (mainstem, side channel, side
sloughs, upland sloughs, and tributary mouths). Mainstem was replaced with main channel to
distinguish between main and side channels. Main channels and the other classifications were
defined in 2012 as follows:
Main Channel habitats consist of the thalweg channel, major subchannels and alluvial
island complexes. This habitat type was, in most cases, outside the boundaries of the
control areas used to define representative areas.
Primary Side Channel habitats are those channels that normally convey streamflow
throughout the entire year. They exhibit characteristics similar to Middle Susitna River
mainstem habitat types, as described by Klinger and Trihey (1984). They are
characterized by turbid glacial water, high velocities, and few mid-channel gravel bars.
Secondary Side Channel habitats also have turbid water, but exhibit characteristics of
the middle river side channels. For example, there are mid-channel gravel bars and riffles
of water surface features that indicate slower moving shallow water.
Turbid Backwater habitats are non-breached channels containing turbid water. They
have non-vegetated upper thalwegs that are overtopped during periods of moderate to
high mainstem discharge. They represent a transitional habitat type between breached
secondary side channel habitats and non-breached clearwater or side slough habitats.
Side Slough habitats contain clear water. Upwelling and local surface runoff appear to
supply sufficient clear water to these areas to maintain wetted areas at a mainstem
discharge of 13,900 cfs. Side sloughs also have non-vegetated upper thalwegs that are
overtopped at moderate to high mainstem discharges. Clearwater and side slough habitats
are differentiated as separate entities for 1980s mapping. Since differentiation requires
aerials at or near 13,900 cfs, they could not be mapped separately from clearwater
habitats in 2012. The clearwater and side slough habitats were included in a combined
habitat type referred to as clearwater/side slough. For comparative purposes, the 1980s
clearwater and side slough habitat types were combined in the results tables for
comparison to the 2012 clearwater/side slough results.

TECHNICAL MEMORANDUM AQUATIC MACROHABITAT TYPES
Susitna-Watana Hydroelectric Project Alaska Energy Authority FERC Project No. 14241 Page 13 February 2013
Clearwater habitats are non-breached channels containing clear water that dewater
completely at a mainstem discharge of 13,900 cfs or higher. These channels have non-
vegetated upper thalwegs that are overtopped during periods of moderate to high
mainstem discharge. Groundwater and local surface runoff appear to supply water to
these areas at mainstem flows above 13,900 cfs. As mentioned above, clearwater and side
slough habitats are differentiated as separate entities for 1980s mapping. Since
differentiation requires aerials at or near 13,900 cfs, they could not be mapped separately
from clearwater habitats in 2012. The clearwater and side slough habitats were included
in a combined habitat type referred to as clearwater/side slough. For comparative
purposes, the 1980s clearwater and side slough habitat types were combined in the results
tables for comparison to the 2012 clearwater/side slough results.
Clearwater/Side Slough is a classification used in the 2012 mapping and is a
combination of the clearwater and side slough habitat types from the 1980s. Clearwater
and side sloughs could not be differentiated in the 2012 mapping since aerials at or near
13,900 cfs are not available for 2012. For comparative purposes, the 1980s clearwater
and side slough habitat types were combined in the results tables for comparison to the
2012 clearwater/side slough results.
Tributary Mouth habitats are clear water habitats that exist between the downstream
extent of a clear water plume and upstream into the tributary to the upper extent of the
backwater influence. The surface area depends on the discharge of both the tributary and
the mainstem.
Tributary habitat exists upstream of the tributary mouth habitat. Tributary habitat may
increase dramatically when the tributary flows into a non-breached side channel and the
clear tributary flows through the side channel to join the Susitna River.
Vegetated Island habitat consists of discrete, large vegetated islands that exist within or
along the main channel. Vegetated islands have perimeters of perennial vegetation edges.
Exposed Substrate is a non-wetted mapping type that is typically composed of sand,
gravel, and cobble but can also have annual vegetation or immature perennial vegetation.
Exposed substrate is mapped within the boundaries of the geomorphic features. The
combination of exposed substrate and wetted habitat comprise the area within a
geomorphic feature.
4.3.3. Scaling Methodology
Because the 2012 aerials were not at the target discharges of 12,500 cfs in the Middle River or
36,600 cfs in the Lower River, a methodology was developed in order to scale the 2012 digitized
habitat areas to the comparable 1983 discharge. Slightly different procedures were used in the
Middle and Lower River Segments due to differences in available 1980s information on the
habitat areas versus flow relationships.
4.3.3.1. Middle Susitna River Segment Habitat Scaling
Habitat type surface area tables were not available for the Middle River habitat sites. Scaling
factors for the Middle River habitat sites were determined from four geomorphologically distinct
subsegments (Trihey & Associates 1985a). As defined per the 1980s RM system, the extents of
TECHNICAL MEMORANDUM AQUATIC MACROHABITAT TYPES
Susitna-Watana Hydroelectric Project Alaska Energy Authority FERC Project No. 14241 Page 14 February 2013
these subsegments include RM 101 to RM 113 (PRM 104.9 to PRM 116.5), RM 113 to RM 122
(PRM 116.5 to PRM 125.6), RM 122 to RM 138 (PRM 125.6 to PRM 141.4), and RM 138 to
RM 149 (PRM 141.4 to PRM 152.5) (Trihey & Associates 1985a). With the absence of a table of
values for the Middle River habitat sites, logarithmic-linear plots displaying total surface area
(for each habitat type) versus mainstem discharge at Gold Creek for the four Middle River
subsegments were used (Trihey & Associates 1984). The total surface area for each habitat type
was extracted from the plot at discharges of 12,500 cfs, 16,000 cfs, and 23,000 cfs.
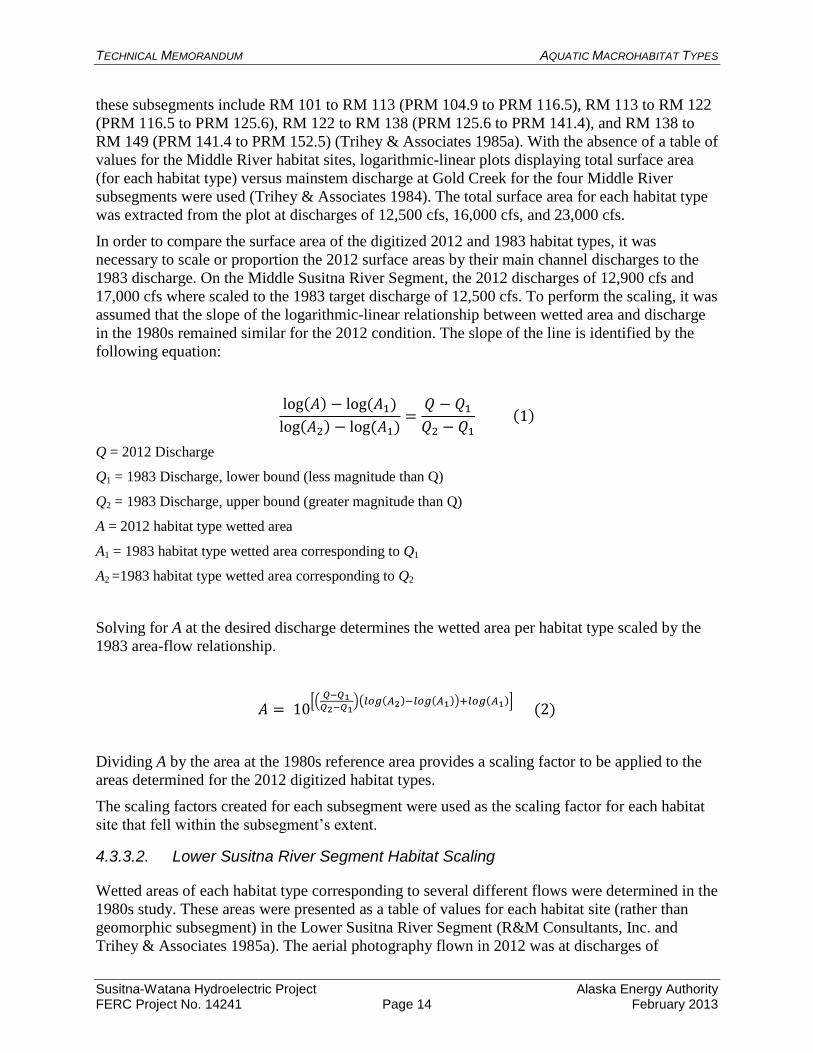
In order to compare the surface area of the digitized 2012 and 1983 habitat types, it was
necessary to scale or proportion the 2012 surface areas by their main channel discharges to the
1983 discharge. On the Middle Susitna River Segment, the 2012 discharges of 12,900 cfs and
17,000 cfs where scaled to the 1983 target discharge of 12,500 cfs. To perform the scaling, it was
assumed that the slope of the logarithmic-linear relationship between wetted area and discharge
in the 1980s remained similar for the 2012 condition. The slope of the line is identified by the
following equation:
( ) ( )
( ) ( )
( )
Q = 2012 Discharge
Q1 = 1983 Discharge, lower bound (less magnitude than Q)
Q2 = 1983 Discharge, upper bound (greater magnitude than Q)
A = 2012 habitat type wetted area
A1 = 1983 habitat type wetted area corresponding to Q1
A2 =1983 habitat type wetted area corresponding to Q2
Solving for A at the desired discharge determines the wetted area per habitat type scaled by the
1983 area-flow relationship.
[(
)( ( ) ( )) ( )] (2)
Dividing A by the area at the 1980s reference area provides a scaling factor to be applied to the
areas determined for the 2012 digitized habitat types.
The scaling factors created for each subsegment were used as the scaling factor for each habitat
site that fell within the subsegment’s extent.
4.3.3.2. Lower Susitna River Segment Habitat Scaling
Wetted areas of each habitat type corresponding to several different flows were determined in the
1980s study. These areas were presented as a table of values for each habitat site (rather than
geomorphic subsegment) in the Lower Susitna River Segment (R&M Consultants, Inc. and
Trihey & Associates 1985a). The aerial photography flown in 2012 was at discharges of

TECHNICAL MEMORANDUM AQUATIC MACROHABITAT TYPES
Susitna-Watana Hydroelectric Project Alaska Energy Authority FERC Project No. 14241 Page 15 February 2013
55,000 cfs for the SC IV-4 and Willow Creek sites, 48,000 cfs for the Goose Creek site, and
38,200 cfs for the Montana Creek and Sunshine Slough sites. All of these discharges fell
between 36,600 cfs and 59,100 cfs used in the 1983 study. On the Lower Susitna River Segment
the 2012 discharges of 38,200 cfs, 48,000 cfs, and 55,000 cfs where scaled to the 1983 target
discharge of 36,600 cfs. To visually note the trends between the surface area of a habitat type
and discharge, the table of values was plotted on a logarithmic-linear scale. An example of the
plotted surface area-discharge relationship is shown in Figure 4.3-1.
An example of how this method was applied to scale the 2012 areas is shown for several flows
for the turbid backwater features at SC IV-4 in Figure 4.3-2; scaling the 2012 digitized area of
the turbid backwater habitat type at various discharges effectively translates the points parallel to
the 1980s slope.
Scaling factors were determined for each habitat type for all of the Lower River Segment aquatic
macrohabitat sites.
4.3.4. Quality Control
The Geomorphology Program Lead and the Geomorphology Task Lead provided training to the
senior hydraulic engineers/geomorphologist and the GIS analysts to ensure appropriate
identification and application of the classification categories. Senior hydraulic engineers/
geomorphologists reviewed the macrohabitat type delineations for completeness, adherence to
the classifications, and scale criteria. The senior hydraulic engineers/geomorphologists
frequently consulted with the Geomorphology Program Lead and the Geomorphology Task Lead
on application of the definitions and for advice when differentiation between macrohabitat types
was challenging.
Markups were provided to the staff performing the delineation in comments on the GIS files,
marked up Adobe Acrobat PDFs and written instructions. Comments were provided for both
specific items such as changing the classification types of a specific feature or general concerns
such as the quality of the digitization and proper interpretation of the definitions. The GIS
analysts performed the corrections per the instructions of the reviewers. The reviewers conducted
a back-check of the changes made to the fields and provided additional instructions on changes;
the correction-review cycle was repeated if necessary. Throughout the process, the senior
engineers consulted with the Geomorphology Program Lead or the Geomorphology Task Lead to
refine definitions and help make decisions for unique situations encountered. The files were then
reviewed for topology errors such as gaps between delineations (slivers) and overlaps. A final
check was run on the tabulated areas for the reaches and control areas. The summed areas of the
features and habitats were compared to their outer boundary to ensure complete and non-
overlapping coverage.
5. RESULTS
The Middle and Lower River Segment habitat site analysis provides the area of the various
aquatic habitat types for the Middle and Lower Susitna River Segments for 1983 and 2012. It
also compares the changes in habitat area and site conditions, to which some of the change can
be attributed. Comparative terms, such as increase and reduce, are a function of area differences
(2012 area vs. 1980s area) determined from the tabulated habitat areas.
TECHNICAL MEMORANDUM AQUATIC MACROHABITAT TYPES
Susitna-Watana Hydroelectric Project Alaska Energy Authority FERC Project No. 14241 Page 16 February 2013
Aerial photographs with the aquatic habitat types mapped for the Middle Susitna River Segment
are provided in Appendix 1 for 1983 and Appendix 2 for 2012. The habitat mapping for the
Lower Susitna River Segment sites is provided in Appendices 3 and 4 for 1983 and 2012,
respectively. Tabulated area for each aquatic macrohabitat type is provided in Appendix 5 for the
Middle River Segment sites and Appendix 6 for the Lower River Segment sites. Appendix 7
provides bar charts for the Middle River Segment habitat sites with the 1983 and 2012 habitat
type areas displayed side by side for comparison. Appendix 8 contains similar charts for the
Lower River Segment.
5.1. Middle Susitna River Segment Habitat Sites 1 through 17
The 1983 aerials used in this analysis for the Middle River were flown between PRM 102.4 to
PRM 158 (RM 98.5 to RM 154.5) at 12,500 cfs, which includes Sites 1 through 17. The 2012
aerials were flown over two different dates and are divided by their respective segment extents.
The first extent includes PRM 102.4 to PRM 143.6 (RM 98.5 to RM 140) at 12,900 cfs, covering
Sites 1 through 13 and the downstream portion of Site 14. The second extent includes PRM
143.6 to PRM 187.1 (RM 140 to RM 184) at 17,000 cfs, covering the upstream portion of Site 14
and Sites 15 through 23.
The areas mapped for each aquatic macrohabitat type for 1983 and 2012 for the 17 sites in the
Middle River Segment are presented in Tables 5.1-1 through 5.1-17. The values tabulated for
2012 have been scaled to a flow of 12,500 cfs. The tables also include the percent change from
1983 to 2012. The aquatic macrohabitat type areas in 1983 and 2012 for each site are also
presented as bar charts in Appendix 7. A master table of delineated habitat type areas in the
Middle River in 1983 and 2012 can be found in Appendix 5.
5.1.1. Site 1 – Whiskers Slough (PRM 104.4 to PRM 105.9)
The main channel has expanded in area in 2012 to include Whiskers West Side Channel as well
as the channel downstream of Whiskers East Side Channel. These channels previously classified
as side channels in 1983 are now classified as main channel habitat because they were estimated
to convey at least 10 percent of main channel flow by visual interpretation (Note: The change in
classification is a result of interpretation of the 10 percent flow criteria rather than due to an
apparent physical change in the side channels. The issue of differentiating side channels from the
main channel is further discussed in the Section 6.1.1.2 off the Conclusions.). There have been
limited changes in bar locations and minor lateral channel migration among both of these side
channels. Deposition appears to have occurred at the head of Whisker’s West Side Channel near
the upstream right section of the site. Small AOW areas have been delineated within the exposed
and vegetated region just upstream of this side channel. A higher flow would likely breach these
AOW areas, which would then be classified as side channel habitat. Upland slough area has
increased by 84 percent (1983 area = 46,000 sq. ft, 2012 area = 85,000 sq. ft) due to upstream
extension of Slough 3A. This area was disconnected by a beaver dam in 1983 that no longer
existed by 2012. While this upland slough generally appears to have a larger wetted surface area
in 2012 than 1983, the area above the beaver dam in 1983 was wetted but excluded from
delineation. Vegetation has increased around Whiskers Slough and remained relatively sparse
around Slough 3B. Side slough habitat has reduced 37 percent (1983 area = 388,000 sq. ft, 2012
area = 245,000 sq. ft) partially due to a breach at Slough 2 in 2012, changing its classification
into a side channel. Further, there has been gravel bar development along the downstream, left

TECHNICAL MEMORANDUM AQUATIC MACROHABITAT TYPES
Susitna-Watana Hydroelectric Project Alaska Energy Authority FERC Project No. 14241 Page 17 February 2013
bank of the slough. Vegetation has increased on some of the vegetated islands. Although present
in 1983, the tributary mouth at Whiskers Slough was not delineated so there is not a 1983
tributary mouth wetted area to compare with the 2012 value.
5.1.2. Site 2 – Slough 4 (PRM 108.7 to PRM 110.2)
Upland slough habitat has reduced 77 percent (1983 area = 132,000 sq. ft, 2012 area = 30,000 sq.
ft). The reduction at upland Slough 4 occurred due to less standing water and a beaver dam now
regulating flow at Slough 4’s upstream end. Upstream of the beaver dam, the slough has changed
classification to AOW. Overall, there is less area associated with AOW on the floodplain of Site
3 in the 2012 aerials. Portions of the 2012 main channel that were classified as side channel in
1983 were judged to contain at least 10 percent of main channel flow. The two islands on the
upstream end of the site have divided and shifted to create three islands in 2012. The exposed
substrate around the island at PRM 109.5 has been encroached by low-lying vegetation. A small
tributary mouth habitat (6,000 sq. ft) was delineated at the mouth of Slough 4 in 2012 but not in
1983.
5.1.3. Site 3 – Slough 5 (PRM 110.7 to PRM 112.1)
Upland slough habitat area has increased in 2012 by 66 percent (1983 area = 40,000 sq. ft, 2012
area = 67,000 sq. ft). An upland slough was delineated in 2012 at the southeast corner of the
habitat site, and was also present but not delineated in 1983. Since 1983, the mouth of Slough 5
(upland slough) has narrowed between banks that appear to have aggraded. This has increased
the backwater in the slough and resulted in an expansion of its area. In 2012, a larger wetted
surface area is present in the upland slough, Slough 6. AOW areas are delineated in 2012 along
the site’s right bank and were also present in 1983 but not delineated. The side channel on the
south end of the site appears to have aggraded at its head, limiting flow and reducing the
subsequent wetted surface area of the side channel. Main channel features exhibited little lateral
migration or change in the extent of mid-channel bars. Vegetation has encroached upon the
exposed substrate on the main channel gravel bar.
5.1.4. Site 4 – Slough 6A (PRM 115.5 to PRM 116.5)
Slough 6A exhibited a slight increase in area due to a connection through the beaver dam causing
the upland slough wetted area to increase 6 percent (1983 area = 105,000 sq. ft, 2012 area =
111,000 sq. ft). In 2012 there is slight erosion on the right bank at the upstream end of the site, as
well as upstream of upland Slough 6A’s mouth. Side Channel 6A classified as side channel
habitat in 1983. It is classified as main channel habitat in 2012 because it was visually
interpreted to convey at least 10 percent of main channel flow in 2012. Mid-channel bar
development has occurred on the downstream end of Side Channel 6A since 1983. Scattered
AOW areas on the site’s right bank are relatively the same size in wetted area between the 1983
and 2012 aerials. Vegetation on the island’s right side has encroached exposed substrate regions
toward Side Channel 6A.

TECHNICAL MEMORANDUM AQUATIC MACROHABITAT TYPES
Susitna-Watana Hydroelectric Project Alaska Energy Authority FERC Project No. 14241 Page 18 February 2013
5.1.5. Site 5 – Slough 8 (PRM 116.9 to PRM 119.0)
Slough 8 (Lane Creek Slough), classified as a side slough in 1983, has reduced in size and
included a beaver dam across its upper thalweg in 2012. Because aggradation has occurred at the
slough mouth and there no longer is a wetted connection, the 1983 slough has been classified as
an AOW in 2012. A large AOW has developed inland of the beaver dam. A portion of the side
channel along the left bank of the habitat site has been classified as main channel in 2012
because it was visually estimated to convey more than 10 percent of main channel flow. The side
channel at the upstream end of the site has breached the lower end of the side slough,
reclassifying the side slough’s lower portion as a side channel and reducing the overall amount
of side slough habitat (1983 area = 178,000 sq. ft, 2012 area = 97,000 sq. ft). The connection
between the mouth of the slough and the side channel habitat is minimal at this flow. Vegetation
encroachment has occurred within this side channel and downstream of the new connection. The
tributary mouth from Lane Creek has decreased between aerial timeframes (1983 area = 49,000
sq. ft, 2012 area = 39,000 sq. ft). A wetted region on the largest vegetated island has been
classified as an AOW; however, once breached at a higher flow it would be classified as side
channel habitat. Vegetation encroachment and increases in exposed substrate is apparent around
the vegetated islands while some bar erosion is also present. Overall the site has experienced
encroachment of vegetation since 1983.
5.1.6. Site 6 – Oxbow II (PRM 121.9 to PRM 124.0)
The overall side slough wetted area has experienced a 61 percent reduction (1983 area = 265,000
sq. ft, 2012 area = 103,000 sq. ft) due to dewatering as well as changes in classifications in some
areas from side slough to side channel. The side slough near Downunda Creek has narrowed and
been encroached by vegetation. Tributaries and tributary mouths that were not delineated in 1983
have increased in size in 2012 at Downunda Creek and Fromunda Creek (2012 area = 9,000 sq.
ft). Vegetation has increased on some islands and along the exposed banks of side sloughs.
Exposed main channel substrate along the bank lines has experienced vegetation encroachment.
The upstream mid-channel bar in Site 6 had widened by 30 percent since 1983 causing a
20 percent widening in the main channel in the same location. This contributed to a loss of 400 ft
to the downstream extents of Curry Slough. Little to no change was seen for Little Rock Side
Channel.
5.1.7. Site 7 – Slough 8A (PRM 128 to PRM 130.2)
Slough 8A (side slough) has more wetted area at its upstream end, elongating the delineated
slough. Isolated wetted regions, classified as AOW, have developed along Slough 8A’s east-west
branch toward the main channel. The main channel’s left bank at the slough’s mouth has begun
to erode and recede eastward. Brush and low-lying vegetation has begun to develop over the
exposed substrate regions of this slough. A 47 percent reduction in side slough area can be noted
(1983 area = 1,138,000 sq. ft, 2012 area = 602,000 sq. ft). This is partially due to Slough B,
which has been classified as a side channel in 2012 due to the presence of turbid water. In
addition a side slough from the 1983 delineation in the middle of the site has been breached by
main channel flow and another has been classified as side channel habitat. Skull Creek Side
Channel was visually estimated to be conveying more than 10 percent of flow, causing its
delineation to be classified as main channel in 2012. The area of vegetated islands has increased
TECHNICAL MEMORANDUM AQUATIC MACROHABITAT TYPES
Susitna-Watana Hydroelectric Project Alaska Energy Authority FERC Project No. 14241 Page 19 February 2013
as vegetation has encroached upon exposed substrate in the main channel. By 2012 there has
been moderate mid-channel bar formation in Skull Creek Side Channel. The main channel has
experienced both bar removal and bar formation within the middle of the site. There has been no
apparent main channel lateral migration. In addition, there has only been a small reduction in
tributary mouth habitat area (1983 area = 8,000 sq. ft, 2012 area = 7,000 sq. ft).
5.1.8. Site 8 – Slough 9 (PRM131.3 to PRM 132.8)
Delineated side channel habitat in 1983 at the upstream end of the site was classified as main
channel habitat in 2012 due to visual estimation that more than 10 percent of flow is within its
channel. The downstream end of Slough 9 has been captured by the adjacent side channel
reducing the total side slough area (1983 area = 494,000 sq. ft, 2012 area = 418,000 sq. ft).
Slough 9B (upland slough) has been impounded by a beaver dam at its mouth establishing a non-
wetted vegetated region between Slough 9B and Slough 9, thereby reclassifying Slough 9B as an
AOW. Upland slough habitat is not present in 2012 (1983 area = 74,000 sq. ft, 2012 area = 0 sq.
ft). Low-lying vegetation has encroached upon exposed substrate within sloughs, side channels,
and around vegetated islands since 1983.
5.1.9. Site 9 – Side Channel 10A (PRM134.1 to PRM 136.1)
Side channel habitat along the left bank has been classified as main channel habitat in 2012
because it was visually estimated to convey at least 10 percent of main channel flow. Side
channel habitat along the right bank, including Side Channel 10A and side channels within the
Fourth of July Side Channel Complex, have been reduced since 1983. Vegetation has encroached
upon main channel inlets to the side channel complex since 1983. The outlet of Side Channel A,
which once connected to the Fourth of July Side Channel Complex, has now shifted eastward
and connects to the main channel. Sherman Creek has slight increases in tributary mouth habitat
and exposed tributary substrate in 2012. In addition to a slight increase in tributary mouth habitat
at Fourth of July Creek, the site’s tributary mouth habitat has increased in 2012 (1983 area =
79,000 sq. ft, 2012 area = 90,000 sq. ft). The one side slough within this habitat site (Sioux City
Slough) was dewatered and has experienced vegetation encroachment in 2012, effectively
eliminating side slough habitat from the site (1983 area = 22,000 sq. ft, 2012 area = 0 sq. ft).
Two small upland sloughs were added to the 2012 delineation (1983 area = 0 sq. ft, 2012 area =
10,000 sq. ft). One upland slough was created since 1983 in the upstream left corner of the site.
The other was part of a larger upland slough to the north of the site evident in the 1983 aerials.
The right branch of the main channel at the site’s upstream end is beginning to erode the large
vegetated island. A gravel bar at the site’s upstream end has shifted and divided since 1983.
5.1.10. Site 10 – Side Channel 10 (PRM 136.3 to PRM 137.6)
The left branch of the side channel at the site’s downstream end, classified as a side channel in
1983, is classified as main channel in 2012 because it was visually estimated to convey at least
10 percent of main channel flow. Side Channel 10, classified as a side slough in 1983 has
changed classifications to side channel habitat since becoming breached with turbid water.
Slough 9A, classified as a side slough in both 1983 and 2012, has lost area as its upper thalweg
has been encroached by vegetation, and gravel has deposited upstream of this newly vegetated
region. Upstream of Slough 9A is an upland slough that was present in both 1983 and 2012.
Overall, side slough habitat at the site has reduced 61 percent (1983 area = 333,000 sq. ft, 2012

TECHNICAL MEMORANDUM AQUATIC MACROHABITAT TYPES
Susitna-Watana Hydroelectric Project Alaska Energy Authority FERC Project No. 14241 Page 20 February 2013
area = 129,000 sq. ft). A wetted surface area of Slough 10 was further delineated upstream in
2012, although it was present but not delineated in 1983, increasing the total upland slough
habitat by 7 percent (1983 area = 80,000 sq. ft, 2012 area = 86,000 sq. ft). The vegetated islands
have increased in size from 1983 to 2012 (1983 area = 2,299,000 sq. ft, 2012 area = 3,109,000
sq. ft). There has been slight mid-channel bar shifting and no apparent lateral migration of the
main channel.
5.1.11. Site 11 – Slough 11 (PRM 137.6 to PRM 140.0)
Slough 11, classified as a side slough in both 1983 and 2012, has slightly more wetted surface
area in 2012. Regions of exposed substrate are present in both years along the banks of the
slough and in a nearly 500-foot-long region at its head. Wetted area is present at the slough’s
head in 2012 and low-lying vegetation has encroached upon the wetted regions at the head as
well as along the body of the slough. Two isolated water bodies delineated within the exposed
region between the slough head and slough body have been classified as AOW in 2012. Slough
12, classified as an upland slough in 1983, has been encroached by vegetation in its upper extent
in 2012. Slough 13, a side slough, has reduced in size since 1983 and the exposed substrate
region between the slough and the main channel is now becoming vegetated. Upper Side
Channel 11, a side slough in 1983, has been reclassified as a side channel in 2012 due to the
presence of turbid water. Lower Side Channel 11 has remained a side channel and the island
separating it from the main channel has become more vegetated. The inlet to the side channel,
while once completely surrounded by exposed substrate in 1983, is becoming encroached by
low-lying vegetation. Isolated water bodies within the exposed channels on the vegetated islands
have been classified as AOW. The region of Doug’s Delight is classified as a side channel in
2012 because it conveys less than 10 percent of main channel flow. The region has developed
more gravel bars on its banks and appears to have aggraded at its head since 1983. The Gold
Creek tributary mouth area is reduced in the 2012 aerial versus the 1983 aerial and does not
extend to Site 11 in the 2012 aerials (1983 area = 80,000 sq. ft, 2012 area = 0 sq. ft). Main
channel features exhibit no apparent change with no detectible lateral migration or change in
extent of mid-channel bars. Overall side slough habitat has decreased (1983 area = 321,000 sq.
ft, 2012 area = 285,000 sq. ft) and upland slough area has been eliminated (1983 area = 42,000
sq. ft, 2012 area = 0 sq. ft).
5.1.12. Site 12 – Gold Creek (PRM 140.0 to PRM 141.6)
The main channel has remained roughly the same size between 1983 and 2012 in the Gold Creek
habitat site (1983 area = 3,219,000 sq. ft, 2012 area = 3,376,000 sq. ft). There has been no
apparent lateral migration or change in the extent of mid-channel bars. The side channel on the
downstream end of the site has less wetted habitat in 2012, reducing the overall side channel
habitat area (1983 area = 324,000 sq. ft, 2012 area = 232,000 sq. ft). Two small isolated water
bodies have been classified as AOW in this side channel region in 2012.While turbid water still
remains within the side channel, the inlet has reduced in size. Exposed substrate still surrounds
the side channel inlet but it is being encroached upon by vegetation. Gold Creek Slough,
classified as an upland slough in 1983, has been encroached upon by vegetation, and the wetted
area is not identifiable in the 2012 aerials. Slough 15 was classified as an upland slough in 1983
and 2012. Upstream of the head of Slough 15, vegetation has encroached upon exposed
substrate. There is less wetted area in Slough 16 in 2012 and no wetted area in Slough 15B,

TECHNICAL MEMORANDUM AQUATIC MACROHABITAT TYPES
Susitna-Watana Hydroelectric Project Alaska Energy Authority FERC Project No. 14241 Page 21 February 2013
thereby greatly decreasing the overall side slough habitat type area (1983 area = 142,000 sq. ft,
2012 area = 33,000 sq. ft). While the areas of the tributary mouth from Indian River are similar
between the two periods, the tributary mouth from Gold Creek significantly reduced in the 2012
aerials. Overall the tributary mouth habitat type area has decreased since 1983 (1983 area =
274,000 sq. ft, 2012 area = 153,000 sq. ft).
5.1.13. Site 13 – Indian River (PRM 141.7 to PRM 143.1)
Slough 17, an upland slough in 1983, was also mapped as such in 2012; however, its upstream
limit has nearly extended to the upstream side channel (1983 area = 67,000 sq. ft, 2012 area =
73,000 sq. ft). Thick low-lying vegetation covers the slough’s banklines. Slough 18 labeled
within the site was not delineated as aquatic habitat in 1983 and 2012. Its channel is visible in
1983 and ponded water is present at the downstream end possibly due to a beaver dam. By 2012,
no ponded water is present and vegetation encroaches upon the area. Significant main channel
flow has overtopped the exposed substrate that once divided the main channel from a side
channel in 1983 resulting in classification of the channel along the left bank as main channel in
2012. This has increased the overall main channel habitat area (1983 area = 3,283,000 sq. ft,
2012 area = 5,389,000 sq. ft) and greatly reduced the overall side channel habitat (1983 area =
2,051,000 sq. ft, 2012 area = 271,000 sq. ft). The Indian River tributary, not delineated in 1983,
has added a distributary in 2012, and the tributary mouth habitat has slightly increased (1983
area = 113,000 sq. ft, 2012 area = 120,000 sq. ft). Mid-channel bars have increased in size and
shifted further downstream. Lateral migration of the main channel is not evident.
5.1.14. Site 14 – Slough 21 (PRM 143.1 to PRM 145.8)
Slough 19 was classified as two different sloughs in 1983. It was composed of a side slough at its
downstream end and an upland slough at its upstream end. By 2012, the side slough was
completely lost due to main channel erosion along the left bank. The upland slough now extends
slightly farther inland. Slough 20, a side slough in both years, has slightly increased in width and
still contains an exposed upper thalweg. The side channel upstream of Slough 20 has been
classified as main channel habitat in 2012 due to visual estimation that it was conveying at least
10 percent of the flow in the 2012 aerials. This could be a product of the higher discharge in the
2012 aerial photographs-thus, although the surface areas are scaled to a 12,500 cfs discharge, the
2012 surface areas were delineated and therefore classified at a 17,000 cfs discharge. Side
Channel 21 was classified as a side slough in 1983 and has changed classifications to side
channel habitat in 2012 in its downstream portion. This change in classifications occurred due to
breaching in 2012 at PRM 144.9. This was verified by comparing the breaching locations at
16,000 cfs in Trihey & Associates (1985a) to the 2012 aerials. The 1983 aerials show breaching
at PRM 145, about 500 feet upstream of the 2012 breaching location. The side slough portion of
Slough 21 has expanded in area at its upstream end. Mid-channel gravel bars in 1983 have been
washed away by 2012. Vegetation has developed on some exposed gravel bars. Overall, side
slough habitat has increased (1983 area = 743,000 sq. ft, 2012 area = 823,000 sq. ft) in addition
to upland slough habitat (1983 area = 15,000 sq. ft, 2012 area = 31,000 sq. ft). Main channel
widening is present near the locations of the 2012 mid-channel bars at PRM 144.5 and PRM 145.
The main channel has eroded up to 250 feet of the left bank of the vegetated island for an extent
of 1,000 feet in the middle of the site at PRM 144.5.

TECHNICAL MEMORANDUM AQUATIC MACROHABITAT TYPES
Susitna-Watana Hydroelectric Project Alaska Energy Authority FERC Project No. 14241 Page 22 February 2013
5.1.15. Site 15 – Slough 22 (PRM 147.4 to PRM 148.3)
The right branch of the main channel on the site’s downstream end is classified as main channel
in 2012, rather than side channel in 1983, because it was visually estimated to convey at least
10 percent of main channel flow. The tributary mouth from Jack Long Creek has increased by
31 percent (1983 area = 54,000 sq. ft, 2012 area = 71,000 sq. ft. The Jack Long Creek tributary
was present but not delineated in 1983. The area of the vegetated island within the site has
increased (1983 area = 2,363,000 sq. ft, 2012 area = 2,521,000 sq. ft). Main channel features
exhibit no apparent lateral migration. Slough 22 had a slight reduction in wetted habitat in 2012
reducing the overall area of side slough habitat (1983 area = 134,000 sq. ft, 2012 area = 104,000
sq. ft).
5.1.16. Site 16 – Fat Canoe Island (PRM 149.9 to PRM 151.0)
There has been no apparent lateral movement within the main channel between 1983 and 2012,
and there has been little change in main channel habitat area (1983 area = 3,018,000 sq. ft, 2012
area = 2,846,000 sq. ft). Fat Canoe Island (vegetated island) remains roughly the same size. The
difference in vegetated islands between the years (1983 area = 574,000 sq. ft, 2012 area =
645,000 sq. ft) is due to the delineation of a 45,000 sq. ft vegetated island along the downstream
right bank line of the site. Vegetation has slightly encroached upon exposed substrate regions
along the main channel banks.
5.1.17. Site 17 – Portage Creek (PRM 151.8 to PRM 152.3)
Portage Creek has added a third distributary among the tributary delta in 2012. The difference in
tributary mouth extents (1983 area = 100,000 sq. ft, 2012 area = 37,000 sq. ft) could be due to
the higher 2012 main channel discharge and/or lower tributary flow in 2012. Lateral migration of
the main channel is not evident between 1983 and 2012, and main channel habitat area exhibited
minimal change (1983 area = 1,009,000 sq. ft, 2012 area = 1,017,000 sq. ft). Vegetation has
slightly encroached upon exposed substrate regions along the main channel banks.
5.2. Middle Susitna River Segment Habitat Sites 18 through 23
Wetted areas for the aquatic macrohabitat types were mapped for Middle Susitna River
Segments, Sites 18 to 23, from the 2012 aerials. These areas were determined for a flow of
17,000 cfs (Gold Creek gage), and the results are presented in Table 5.2-1. The 2012 areas for
these sites are not scaled to 12,500 cfs since there are no 1983 areas at these sites for comparison.
Delineated habitat type areas for Site 18 through Site 23 in 1983 and 2012 can be found in
Appendix 5.
Delineation in 1983 was performed between PRM 105 to PRM 152.5 (RM 101 to RM 149),
which includes Sites 1 through 17. Although not delineated, aerials beyond PRM 152.5 (RM
149) were still obtained in the 1980s. In 1983, aerials up to PRM 158 (RM 154) at a discharge of
16,000 cfs were obtained. In 1980, aerials between PRM 152.5 to PRM 187 (RM 101 to RM184)
at discharges of 35,800 cfs and 31,600 cfs were obtained. The 1983 and 2012 geomorphic feature
delineation and comparison for this portion of the Middle River is provided in a separate
technical memorandum (Tetra Tech 2013a).
TECHNICAL MEMORANDUM AQUATIC MACROHABITAT TYPES
Susitna-Watana Hydroelectric Project Alaska Energy Authority FERC Project No. 14241 Page 23 February 2013
5.3. Lower Susitna River Segment Habitat Sites 1 through 5
The 1983 aerials used in this analysis for the Lower River were flown between PRM 0 and
PRM 102 (RM 0 and RM 99) at 36,600 cfs, which includes Sites 1 through 5. The 2012 aerials
were flown between PRM 33.5 and PRM 69 (RM 29.5 and RM 65), covering Sites 1 and 2 at
55,000 cfs; between PRM 69 and PRM 78 (RM 65 and RM 74), covering Site 3 at 48,000 cfs;
and between PRM 78 and PRM 102 (RM 74 and RM 98), covering Sites 4 and 5 at 38,200 cfs.
Areas from the 2012 aerials were scaled down to the 36,600 cfs level using the procedure
identified in Section 4.3.3.2. Table 5.3-1 through Table 5.3-5 provides results of wetted area for
each site by aquatic macrohabitat type for 1983 and 2012 (scaled). The aquatic macrohabitat type
areas in 1983 and 2012 for each site are also presented as bar charts in Appendix 8. A master
table of delineated habitat type areas for Site 1 through Site 5 in the Lower River in 1983 and
2012 can be found in Appendix 6.
5.3.1. Site 1 – SC IV-4 (PRM 36.5 to PRM 40)
Since the 1980s, the main channel has migrated approximately 300 feet eastward in the northern
and southern portions of this site, slightly increasing the main channel area (1983 area =
6,071,000 sq. ft, 2012 area = 6,700,000 sq. ft). Three fairly large channels classified as
clearwater habitat in 1983 were classified as secondary side channel in 2012, leading to a
substantial decrease in clearwater/side slough area (1983 area = 293,000 sq. ft, 2012 area =
61,000 sq. ft). This change is likely flow dependent, with a higher turbidity in the streams at
higher flows. An area classified as turbid backwater in 1983 has been classified as secondary
side channel in 2012, as the upper end of the channel was breached at the 2012 discharge. These
changes from clearwater/side slough and turbid backwater led to a slight increase in secondary
side channel area (1983 area = 5,906,000 sq. ft, 2012 area = 6,249,000 sq. ft). Also, several small
side sloughs, which did not exist in 1983, had formed and were delineated in 2012.
5.3.2. Site 2 – Willow Creek (PRM 52.5 to PRM 56.0)
The bulk of the flow in the Susitna River at this Willow Creek site had run along the western
edge of this site in 1983. In 2012, the majority of the flow passed through a branch west of the
site, so the area classified as main channel in 1983 was classified as secondary side channel in
2012. The tributary habitat area increased substantially (1983 area = 1,513,000 sq. ft, 2012 area
= 4,307,000 sq. ft) in 2012. Two tributary systems flow into this site, Willow Creek and Little
Willow Creek. Willow Creek remained relatively unchanged from 1983 to 2012. Little Willow
Creek was classified differently in 2012, although there were few geomorphic changes in the
tributary system. The most southerly branch of the Little Willow Creek network is distinctly
turbid in 1983 with clearwater/side slough habitat in 2012. This difference in classification
accounts for the increase in tributary area. Several additional side sloughs were delineated in
2012 that did not exist in 1983. A turbid backwater area in the southern portion of the site was
classified as a side slough in 2012 due to the absence of turbidity. The additional side sloughs
and the turbid backwater changing class to clearwater/side slough led to a substantial increase in
clearwater/ side slough habitat area (1983 area = 306,000 sq. ft, 2012 area = 644,000 sq. ft). An
area classified as turbid backwater near the center of the site in 1983 was breached in 2012 and
classified as a secondary side channel.

TECHNICAL MEMORANDUM AQUATIC MACROHABITAT TYPES
Susitna-Watana Hydroelectric Project Alaska Energy Authority FERC Project No. 14241 Page 24 February 2013
5.3.3. Site 3 – Goose Creek (PRM 73.0 to PRM 77.0)
The main channel migrated approximately 400 feet eastward into the site since 1983, increasing
the area of main channel features in this site in 2012. A large channel running along the eastern
edge of the site was turbid in 1983 and was classified as a secondary side channel; however, this
stream was not turbid in 2012 and was classified as a clearwater/side slough. This accounted for
a considerable increase in the clearwater/side slough habitat (1983 area = 947,000 sq. ft, 2012
area = 6,983,000 sq. ft). The tributary area from Goose Creek was delineated much larger in
1983 than it was in 2012. Most of that 1983 tributary area was delineated as clearwater/side
slough in 2012. The difference in delineation likely depends more on the discharge coming from
Little Willow Creek rather than the main channel discharge; the discharge at Little Willow Creek
was not recorded in either 1983 or 2012. Several additional turbid backwater features that didn’t
exist in 1983 were classified in 2012; however, a very large turbid backwater feature that had
been classified in 1983 no longer existed in 2012. After scaling the areas to account for reduction
in flow, the total turbid backwater area was reduced from 252,000 sq. ft in 1983 to 134,000 sq. ft
in 2012.
5.3.4. Site 4 – Montana Creek (PRM 80.5 to PRM 82)
The main channel passing through this habitat site had migrated west and out of the southern
portion of the site since 1983; however, it also cut approximately 1,000 feet into the northern
portion of the vegetated island such that the net change in main channel area from 1983 to 2012
was minimal (1983 area = 3,729,000 sq. ft, 2012 area = 3,595,000 sq. ft). The largest change
occurred with Montana Creek itself. The creek was mostly classified as a tributary in 1983, with
a small area classified as tributary mouth. In 2012, the majority of the area was classified as a
tributary mouth, and only a small portion was classified as a tributary. The tributary mouth
habitat area was 21,000 sq. ft in 1983 and 291,000 sq. ft in 2012. The tributary habitat area was
250,000 sq. ft in 1983 and 70,000 sq. ft in 2012. This may be a result of the tributary discharge
being independent of the Susitna River discharge. The side slough and clearwater features at the
site in 1983 were turbid in 2012 and were classified as secondary side channels in 2012.
5.3.5. Site 5 – Sunshine Slough (PRM 88.0 to PRM 92.0)
The main channel migrated approximately 1,000 feet southward into the site, cutting
substantially into the floodplain and increasing the main channel area (1983 area = 6,701,000 sq.
ft, 2012 area = 12,436,000 sq. ft). This also accounted for some of the reduction (1983 area =
9,850,000 sq. ft, 2012 area = 7,811,000 sq. ft) in the secondary side channel feature area. Sunrise
Side Channel was classified as secondary side channel in 1983, and was classified as
clearwater/side slough in 2012, partially accounting for the reduction in secondary side channel
area and the increase (1983 area = 278,000 sq. ft, 2012 area = 637,000 sq. ft) in clearwater/side
slough area. A turbid backwater feature in the southern portion of the site was breached and
classified as clearwater/side slough in 2012. Sunshine Creek was classified similarly between
1983 and 2012; the change in area (1983 tributary mouth area = 36,000 sq. ft, 2012 tributary
mouth area = 63,000 sq. ft; 1983 tributary area = 85,000 sq. ft, 2012 tributary area = 93,000 sq.
ft) likely depends on the discharge from Sunshine Creek, which was not recorded in either 1983
or 2012.

TECHNICAL MEMORANDUM AQUATIC MACROHABITAT TYPES
Susitna-Watana Hydroelectric Project Alaska Energy Authority FERC Project No. 14241 Page 25 February 2013
6. DISCUSSION
6.1. Discussion of Results
Analysis of the Middle and Lower Susitna River Segments showed a number of appreciable
differences in habitat areas from 1983 to 2012. Some of these differences are due to observed
physical changes at the site from geomorphic and biogeomorphic processes. However, in some
cases the differences may be attributable to the mapping process including: inconsistent or
missing 1980s delineations, difficulty in interpreting the original 1980s delineations, and the lack
of 2012 aerial photography at some sites at flows similar to the 1980s aerial photography.
A summary of observations are presented in this section regarding the changes in aquatic
macrohabitat areas between 1983 and 2012 for the Middle and Lower Susitna River Segments.
The most definitive observations concerning aquatic macrohabitat area changes are based on
comparison of aerials at nearly identical flows. This occurs within the Middle Susitna River
Segment from PRM 102 to PRM 143.6 (Sites 1 through 13) at 12,500 cfs in 1983 and 12,900 cfs
in 2012 and Lower Susitna River Site 4 (Montana Creek), and Site 5 (Sunshine Slough) at
36,600 cfs in 1983 and 38,200 cfs in 2012.
6.1.1. Middle Susitna River Segment Habitat Sites Discussion
To identify overall changes in the Middle Susitna River, 1983 and 2012 areas by aquatic
macrohabitat types for comparable flows in the Middle River (Site 1 through Site 13) were
summed in Table 6.1-1. To identify overall changes by geomorphic reach, 1983 and 2012
aquatic macrohabitat type areas in Site 1 through Site 13 were summarized by geomorphic reach
and are tabulated in Table 6.1-2 through Table 6.1-4. Sites 14 through 17 were not used for this
comparison since the flow areas were scaled from a considerably higher flow (17,000 cfs to
12,500 cfs). Sites 18 through 23 were not used for the comparison since habitat was not mapped
upstream of PRM 154 in the 1980s.
6.1.1.1. Habitat Classification Changes Due to Geomorphic Change
Habitat changes in the Middle River due to changes in morphology were primarily related to the
biogeomorphic processes of vegetation establishment and beaver dam building. Overall, these
process contributed to a 42 percent reduction in side slough habitat and an18 percent reduction in
upland slough habitat for Sites 1 through 17 (Table 6.1-1). Vegetation establishment has
included both colonization of exposed substrate and succession of annual vegetation to perennial
vegetation. This is evident to some extent at each of the habitat Sites 1 through 17. Since 1983,
vegetation has encroached upon multiple side channels between the vegetated islands in Sites 5,
8, 9, and 11. The vegetative encroachment in Site 9 was so extensive that the Sioux City Slough
(side slough) in the Fourth of July side channel complex is no longer a slough or side channel in
2012.
Beaver dam construction in Sloughs 4, 5, 6A, and 8 (Lane Creek Slough) has limited the
upstream extents of these features within Sites 2, 3, 4, and 5, respectively. Slough 4 reduced by
more than 50 percent due to a beaver dam and lower water levels in 2012. Slough 6A has an
identifiable connection across what was formerly a beaver dam in 1983. Sloughs 5 and 8 have

TECHNICAL MEMORANDUM AQUATIC MACROHABITAT TYPES
Susitna-Watana Hydroelectric Project Alaska Energy Authority FERC Project No. 14241 Page 26 February 2013
had minimal changes in upland slough area; however, Slough 8 now backwaters a 7-acre pond
between the main channel and the railroad tracks.
Other noticeable physical changes included minor variation in channel location (bank erosion or
accretion) or width between the 1983 and 2012 aerials. Localized main and side channel
narrowing appears to have been caused by sediment deposition within the Middle Susitna River
Segment habitat sites and changed the amount of habitat area available in a few sites. The west
side channel in Site 1 appears to have increased sediment deposition along its upstream right
bank. The side channel area between the islands has narrowed and appears to have aggraded. The
narrowing of the wetted width of side channels in Sites 5, 8, and 9 was also detected. The
upstream mid-channel bar in Site 6 had widened by 30 percent since 1983 causing a 20 percent
widening in the main channel in the same location. This contributed to a loss of 400 feet to the
downstream extent of Curry Slough. In Site 13, a 65 percent increase in the width of the
downstream mid-channel bar contributed to the complete loss of the portion of Slough 19 that
was a side slough in 1983. The vegetated island, which separates Side Channel 21 (Site 14) from
the main channel, has reduced in width from 340 feet to 70 feet at PRM 145.5 and may continue
to erode in the future, leading to the loss of the side channel’s lower extent through its capture by
the main channel.
6.1.1.2. Difficulties in Differentiating between Main and Side Channel Classifications
The areas delineated for main channel and side channel show considerable differences between
1983 and 2012. The inconsistency occurs because 10 percent of the total flow proportion that
defines the difference between the main channels and the side channels cannot be accurately
determined from aerial photography. A surrogate for flow is width, but without knowledge of
velocity or depth, width in itself can be a misleading indicator of the flow in a particular channel.
In some cases, it can be seen that the flow is shallow based on visual clues such as intermittent
exposure of substrate or a different shade of the water. However, in many cases the aerials
provide little information besides wetted width for estimating flow in the various channels.
A conservative approach was taken in 2012 to determine side channel flow conveyance based on
a comparison of main and side channel widths and assumed similar depths. If shallow side
channel depths could be seen in the 2012 aerials, a lower conveyance was assumed per unit
width than the main channel. Nevertheless, typically the 1980s classification of side channel
habitat type occurred whenever the main channel split from a single channel to multiple
channels. When analyzed again, many of these side channels appear to visually convey more
than 10 percent of the flow, which would classify them as main channel habitat. Thus,
comparisons between main channel and side channel habitat type from the 1983 and 2012 aerials
are inconclusive. For this reason, tables and bar charts that display the combined main channel
and side channel habitat types were developed (see Appendix 5 for the tables and Appendix 7 for
the bar charts). From this data, changes in the combined habitat type surface areas were assessed.
The combined total area of main and side channel have not changed appreciably between 1983
and 2012. For Sites 1 through 13, which had comparable flows, there was only a 4 percent
increase in the total channel (main and side) area from 1983 to 2012. In all sites, the increase in
the main channel area by itself was much larger than for the combined total, but was offset by a
nearly comparable decrease in side channel area. This is illustrated by the bar charts in Appendix
7.

TECHNICAL MEMORANDUM AQUATIC MACROHABITAT TYPES
Susitna-Watana Hydroelectric Project Alaska Energy Authority FERC Project No. 14241 Page 27 February 2013
6.1.1.3. Apparent Changes in Side Slough Area
For Sites 1 through 13, which had comparable flows of 12,500 cfs and 12,900 cfs, side slough
habitat area decreased by 42 percent from 1983 to 2012 (Table 6.1-1). Of the habitat sites that
experienced a decrease in side slough habitat area from 1983 to 2012, Site 1 and Site 5 through
Site 12, side slough area decreased on average 50 percent (mean) and 47 percent median per site.
Since the area analysis was per site not per individual habitat feature a direct determination of the
proportion of the change that was due to transformation from one habitat type is not available.
However, it was estimated that approximately 80 percent of the side slough area loss stemmed
from upstream breaching (conversion to side or main channels) and 20 percent was lost due to
vegetation encroachment. Of the 13 sites with comparable flows, nine exhibited appreciable
changes in side slough area. Side sloughs in 1983 within Sites 1, 5, 7, 8, 10, and 11 had breached
and transformed to side channel habitat in 2012. Site 6 had a reduction in side slough area due to
both breaching, resulting in transformation to a side channel, and vegetation encroachment. The
Sioux City Slough (Site 9) and Slough 15B (Site 12) were completely encroached by vegetation.
Table 6.1-5 presents a summary of selected side and upland sloughs, identified and labeled in
Trihey & Associates (1985a), including the respective 1983 and 2012 classifications as well as
comments pertaining to the selected habitat type in both years.
6.1.1.4. Apparent Changes in Upland Slough Area
For Sites 1 through 13 that had comparable flows of 12,500 cfs and 12,900 cfs, upland slough
area decreased by 18 percent from 1983 to 2012. Biogeomorphic processes were the most
commonly attributed to upland slough area increases in Sites 1, 2, and 4 with a decrease in
Site 8. Vegetation encroachment accounted for the loss of the Gold Creek Slough (Site 12) and
Slough 12 (Site 11). Additional upland slough area was added through a new slough in Sites 3
and 9 and extension of the upstream extents of sloughs in Sites 10 and 13. Beavers were the
cause of upland slough reduction in a few sites. In Site 2, upland slough habitat surface area was
decreased by 77 percent when a beaver dam caused the upstream portion of the slough to be
classified as AOW in 2012. This again happened in Site 8, when 100 percent of an upland slough
was lost to conversion into an AOW from a beaver dam.
6.1.1.5. Apparent Changes in Tributary Mouth Area
For Sites 1 through 13, which had comparable flows of 12,500 cfs and 12,900 cfs, tributary
mouth area decreased by 20 percent from 1983 to 2012. The wide range of tributary mouth
percent change seen in Table 5.1-1 through Table 5.1-17 can be attributed to the relative
discharges of the tributary and the main channel. For Sites 14 through 17, the use of a 17,000 cfs
discharge instead of a flow comparable to 12,500 cfs likely increased the rate of tributary clear
water mixing into main channel turbid water, thereby reducing the tributary mouth area.
6.1.1.6. Difficulties in Classification and Comparison of Habitat Areas Due to Flow Differences
The 1980s study had the advantage of full aerial photography at several different flows. In 2012,
aerial photography was acquired at 12,900 cfs, 17,000 cfs, and 22,200 cfs; however, these only
provided partial coverage (Note: the intent was to collect three sets of aerials at 23,000 cfs,
12,500 cfs, and 5,100 cfs in 2012, but full aerial coverage of the three flows was not acquired

TECHNICAL MEMORANDUM AQUATIC MACROHABITAT TYPES
Susitna-Watana Hydroelectric Project Alaska Energy Authority FERC Project No. 14241 Page 28 February 2013
due to difficulties with weather conditions and late season high flows.) Delineations in 2012
were compared to delineations made in 1983 at a discharge of 12,500 cfs. This was
accomplished by scaling the flows using the habitat versus flow relationships from the 1980s.
Scaling the flows upstream of PRM 143.6 for Sites 14 through 17, where the flows of 17,000 cfs
were considerably higher than 12,500 cfs, reduces the accuracy of the comparisons. The tributary
mouth areas are difficult to compare between years since the tributaries are likely at different
discharges between 1983 and 2012, regardless of the similarity of the Susitna River flow.
6.1.2. Lower Susitna River Segment Habitat Sites Discussion
In the Lower Susitna River Segment, five specific habitat locations were analyzed to identify the
magnitude and sources of changes in the area of aquatic macrohabitat types from 1983 to 2012.
Changes at specific habitat locations are presented in Table 6.1-6. Habitat classification changes
were primarily caused by geomorphic processes in Site 4 and Site 5. There were instances where
it was difficult to interpret the delineations from the 1980s mapbook. Sources of changes could
not be definitively determined at Site 1 through Site 3, where the flows were not comparable to
the target flow of 36,600 cfs.
6.1.2.1. Habitat Classification Changes Due to Geomorphic Change
There were a number of differences between habitat areas delineated for 1983 and 2012 for the
36,600 cfs flow in the Lower River Susitna River Segment. Some of the major as well as minor
differences can be attributed to geomorphic changes. For example, main channel migration into
the northern portion of the Montana Creek site led to the loss of a large gravel bar, and main
channel migration away from the southern portion of the Montana Creek site has led to the
creation of a large gravel bar. Loss of the northern gravel bar led to the side slough running
through the center of the site being breached, thereby changing its classification to a secondary
side channel in 2012. The loss of the gravel bar also led to the secondary side channel at the far
north of the site being fed directly by the main channel, increasing the flow through the
secondary side channel. The aerial photography for the Montana Creek site was acquired at a
discharge of 38,200 cfs, comparable to the 1983 flow of 36,600 cfs, so the change in
classification is not likely due to the difference in flows seen in the SC IV-4, Willow Creek, and
Goose Creek sites. This increased flow fed by the main channel through the two large secondary
side channels present in 2012 also affected the outlet of Montana Creek. In 1983, the discharge
from Montana Creek overwhelmed the flow from the secondary side channel and side slough
emptying to the north of the outlet of Montana Creek. In 2012, more flow passed though those
channels and overwhelmed flow from Montana Creek. As a result, the tributary habitat area was
reduced by 72 percent, and the tributary mouth habitat area was increased by over 1,300 percent.
Main channel migration eastward into the Sunshine Slough site eroded away an entire vegetated
island and substantially increased the main channel area. A vegetated island formed at the inlet
of a secondary side channel near the center of the site at approximately PRM 90.4. The formation
of the island reduced flow into the secondary side channel. Vegetation encroached upon the
channel, and the channel narrowed significantly. By 2012, the channel was nearly totally
abandoned.

TECHNICAL MEMORANDUM AQUATIC MACROHABITAT TYPES
Susitna-Watana Hydroelectric Project Alaska Energy Authority FERC Project No. 14241 Page 29 February 2013
6.1.2.2. Apparent Inconsistencies in 1983 Habitat Classifications
Unlike the Middle River, there was no difficulty in distinguishing between main channel and
side channel habitat types in the Lower River; however, there were a few other notable
inconsistencies in classifications used in the 1980s. The length of the northern boundary of the
Goose Creek area differs between what is presented in Figures B-18 and B-19 in R&M
Consultants, Inc., and Trihey & Associates (1985a). Figure B-18 was selected for use in this
study. In the same reference, the eastern boundary of the Montana Creek site differs between
Figures B-22 and B-23. Figure B-23 was selected for use in this study. In the areas tabulated for
site SC IV-4 in Table 3.3 (R&M Consultants, Inc., and Trihey & Associates 1985a), no side
sloughs are quantified; however, Figure B-3 shows a side slough in the northeast corner of the
site. The Goose Creek tributary area was delineated much larger in 1983 than in 2012. The most
easterly branch of the area was classified as tributary in 1983; however, it appears a classification
of side slough is more appropriate as the branch is not connected to the rest of the Goose Creek
tributary. In the Sunshine Slough area, there is a feature classified as a secondary side channel in
1983. However, this channel does not appear to be connected at the upstream end, and would
seem to be more consistent with a classification of a turbid backwater.
These inconsistencies may be due to current difficulty in interpreting the data provided from the
1980s study in the current study. The habitat classifications from the 1980s mapbook were
digitized in 2012 using GIS with the goal of accurately reproducing the work done in the 1980s.
However, the maps in the available copies of R&M Consultants, Inc. and Trihey & Associates
(1985a) are often very difficult to read, and while the features are labeled, there are no outlines
of the wetted habitat, just lines separating habitat types at the confluence of two habitat types.
The habitat sites were also viewed from a helicopter in the 1980s, helping with the classification
of the sites. It is not clear as to how these observations may have changed the classification or
delineation of the aquatic habitats. The GIS reproductions in 2012 of the 1983 photos were made
solely with aerial photography, and not with that first-hand visual confirmation of the habitat
types by on the ground visits or the helicopter flights.
The 1980s study also had the advantage of full aerial photography at several different flows. In
2012, aerial photography was acquired at several different flows; however, these only provided
partial coverage. (Note: the intent was to collect one set of aerial at 36,600 cfs in 2102, but
aerials ended up being acquired at a range of flows due to difficulties with weather conditions
and late season high flows.) Delineations in 2012 were compared to delineations made in 1983 at
a discharge of 36,600 cfs. The actual discharges in 2012 were 55,000 cfs for SC IV-4 and
Willow Creek, 48,000 cfs for Goose Creek, and 38,200 cfs for Montana Creek and Sunshine
Slough. In order to compare the flows, the 2012 areas were scaled down using the habitat versus
flow relationships from the 1980s.
6.1.2.3. Difficulties in Classification and Comparison of Habitat Areas Due to Flow Differences
Since the classification of several types of habitat in the Lower River is flow dependent, having
full coverage at multiple discharges would have proved very useful. While the areas can be
scaled to account for differences in flows, the classifications may not change accordingly. For
instance, in 2012 at 48,000 cfs, a channel on the western edge of Goose Creek was breached, and
was classified as a secondary side channel. The same channel in 1983 at 36,600 cfs was not

TECHNICAL MEMORANDUM AQUATIC MACROHABITAT TYPES
Susitna-Watana Hydroelectric Project Alaska Energy Authority FERC Project No. 14241 Page 30 February 2013
breached, and was classified as a side slough. It is impossible to know from the aerials whether
the conditions at 2012 would result in clear water in this channel at a flow of 36,600 cfs.
Easterly lateral migration of the main channel into the SC IV-4 site led to a loss of the inlet bars
near the mouth of Hooligan Side Channel. Also, a large logjam that had been present in 1983 in a
connector channel between Hooligan Side Channel and Eagles Nest Side Channel was no longer
present in 2012. These two changes may have increased flow in the channel, leading to a more
direct connection with the main channel and increased turbidity. The channel is no longer
classified as a clearwater channel as it had been in 1983; in 2012 it was classified as a secondary
side channel. However, in 1983 at 59,100 cfs, much closer to the original discharge of 55,000 cfs
in 2012 at this site, this channel was also turbid. This indicates that new aerial photography at a
flow closer to the reference flow of 36,600 cfs may be necessary to definitively determine if
there was an actual change.
There was no discharge data available for the tributaries entering the sites. As tributary discharge
is independent of the main channel discharge, the area of tributary and tributary mouth also
varies not only with the flow in the adjacent main channel or side channel, but also with the flow
in the tributary. For instance, the tributary area of Little Willow Creek was delineated much
smaller in 1983 than in 2012. The eastern fork of the tributary has a confluence with a secondary
side channel and turbidity increases in 1983, and was classified as a secondary side channel. In
2012, the water was not turbid and was classified as a clearwater/side slough. The turbidity is
likely due to the difference in flow between the secondary side channel and Little Willow Creek.
If the discharge in Little Willow Creek is dominated by the discharge from the secondary side
channel, the southern branch of Little Willow Creek will have increased turbidity. Otherwise, it
will likely be clear. The large changes in tributary area (1983 area = 250,000 sq. ft, 2012 area =
70,000 sq. ft) and tributary mouth area (1983 area = 21,000 sq. ft, 2012 area = 291,000 sq. ft) in
the Montana Creek site are also likely due to the independent flow from Montana Creek. Even if
comparable aerial photography were available for all of the sites, tributary flows in 2012 would
likely have been different from those in 1983. Gaging the major tributaries in the Lower River
would help to determine the contribution of those tributaries to habitat areas. Also, because the
distinction between clearwater and side slough habitat types is flow dependent and that
information was not available in 2012, those features were combined for the 2012 classifications.
6.2. Conclusions and Recommendations Concerning 2013 and 2014 Studies
Based on the results of the comparison of aquatic macrohabitat mapping developed from 1983
and 2012 aerial photography and the experience gained in performing the work, conclusions and
recommendations are presented in this section concerning ways to improve the results of the
mapping efforts and whether 1980s aquatic habitat mapping information should be used for the
2013 – 2014 studies.
6.2.1. Middle Susitna River Segment
It is recommended that an alternative to determining aquatic macrohabitat surface area based on
the use of aerial photography acquired at targeted flows be pursued in the Middle River. A more
flexible approach would be acquisition of LiDAR during low flow conditions to develop an
accurate digital elevation model (DEM) of the exposed channel. The DEM combined with water

TECHNICAL MEMORANDUM AQUATIC MACROHABITAT TYPES
Susitna-Watana Hydroelectric Project Alaska Energy Authority FERC Project No. 14241 Page 31 February 2013
surface elevations determined from the open-water flow routing model would be used to create
surfaces within the various aquatic macrohabitats. This approach would allow flexibility in
determining macrohabitat area over a range of flows and also would not be subjected to the same
constraints placed on the targeted flow approach in terms of having appropriate weather and flow
condition to acquire the aerials. LiDAR is more flexible as to when it can be flown since sun
angle, shadows and darkness do not affect it.
A field survey of the relative slough breaching elevations is recommended at any sites not
adequately covered by LiDAR, in conjunction with hydraulic modeling, to determine the
breaching flow at which side sloughs with clear water become side channels with turbid water.
Water surface elevations should be collected in the areas of the upstream entrance to help
calibrate the hydraulic modeling in these critical areas.
Upland sloughs with beaver ponds would benefit from a classification that considered fish access
to the upstream extents and field assessment of potential barriers.
The use of reference flows in conjunction with hydraulic modeling could be used as a more
consistent threshold in classifying side sloughs versus side channels, than allowing the
classification to vary for a specific feature depending on whether the feature is breached or not.
For instance, a side slough could be defined as a habitat that had clear water up to a flow of
12,500 cfs. If it breached at a lower flow, it would be considered a side channel. Regardless of
the classification, the breaching flow would be used to determine the component of habitat
suitability associated with turbid versus clear water and possibly water temperature if
appropriate. This approach would seem to provide a stronger link to the physical processes than
was applied in the Middle River in the 1980s.
6.2.2. Lower Susitna River Segment
Similar to the Middle River, it is recommended that an alternative to determining aquatic
macrohabitat surface area based on the use of aerial photography acquired at targeted flows be
pursued in the Lower River. A more flexible approach would be acquisition of LiDAR during
low flow conditions to develop an accurate digital elevation model (DEM) of the exposed
channel. This DEM combined with water surface elevations determined from the open-water
flow routing model would be used to create surfaces within the various aquatic macrohabitats.
This approach would allow for more flexibility in determining macrohabitat area over a range of
flows and also would not be subjected to the same constraints placed on the targeted flow
approach in terms of having appropriate weather and flow condition to acquire the aerials.
LiDAR is more flexible as to when it can be flown since sun angle, shadows and darkness do not
affect it.
Alexander Creek, Deshka River, Willow Creek, Little Willow Creek, Kashwitna River, Caswell
Creek, Sheep Creek, Goose Creek, Montana Creek, Rabideux Creek, Sunshine Creek, Birch
Creek, and Trapper Creek were evaluated in R&M Consultants, Inc. and Trihey & Associates
(1985b) to assess adult salmon passage into these tributaries. For tributaries that may be included
in the 2013-2014 studies in the Lower River it is recommended that level loggers be installed and
flow measurements taken in order to establish the flow regimes on the tributaries. This is
important to understand fish access as well as the relationship between mainstem and tributary
discharges in determining the area of tributary mouths and backwater habitat (holding)
conditions.

TECHNICAL MEMORANDUM AQUATIC MACROHABITAT TYPES
Susitna-Watana Hydroelectric Project Alaska Energy Authority FERC Project No. 14241 Page 32 February 2013
6.2.3. Use of 1980s Aerials for 2013 and 2014 Studies
Several factors make it difficult to compare the 1980s macrohabitat mapping against the 2012
effort including:
Differences in flow values between the dates,
Lack of field verification for the 2012 effort,
Challenges in applying the 1980s definitions for the various habitat types,
Poor quality of the 1980s mapbook reproductions which made digitizing difficult
Apparent inconsistencies in the 1980s delineations (wetted habitat that were missed,
outlines of areas that clearly do not coincide with the wetted habitat on the photograph,
and in the Lower River lack of outlining of the wetted habitat in the 1980s Lower River
mapbooks).
Although these issues make it difficult to compare the habitat areas between the two periods,
sufficient indicators are present to conclude that there have been appreciable changes in the
distribution and proportion of aquatic macrohabitat types in both the Middle and Lower Susitna
River Segments between the 1980s and 2012.
Figures 6.2-1 through 6.2-4 provide the site relative proportion (percentages) of habitat in
Geomorphic Reaches MR-5 through MR-8 of the Middle River for the 1983 and 2012 habitat
mapping. Each reach has two sets of charts, one in which the main channel and side channel
habitat are shown separately and the other with the two types combined into a single percentage.
The combined figure was included because of the large differences in the application of the main
channel versus side channel criteria between the 1980s and current effort. Tables 6.2-1 and 6.2-2
provide the same information in tabulated form. In reviewing percentages, it is obvious that the
main channel and side channel habitat by far comprise the vast majority of the habitat area in the
Middle River for a discharge of 12,500 cfs, with all four geomorphic reaches having over 90
percent combined main channel / side channel habitat.
It is in habitat classifications other than main and side channel that there are appreciable
differences in the proportions between the two periods in some of the geomorphic reaches. For
example, in the three reaches where side slough habitat is present at the sites mapped, it
decreased from 1983 to 2012 by 33 to 50 percent. Upland slough habitat decreased in the sites
mapped in MR-6 by 17 percent and in MR-7 by 25 percent. In contrast, for the single site
mapped in MR-8, upland Slough habitat doubled in MR-8. The side slough habitat was mainly
reduced due to two factors, conversion of upland sloughs to side channels and encroachment by
vegetation. Increase in upland slough habitat was typically a result of beaver dam construction
and encroachment of vegetation; whereas, increase in area was the result of the upstream
extension of existing upland sloughs or creation of a new upland slough.
Figure 6.2-5 through Figure 6.2-9 present charts of the relative percentage of the seven Lower
River macrohabitat types at each of the five sites mapped for both the 1983 and 2012 effort at
36,600 cfs. The eighth habitat type, primary side channel, did not exist at 36,600 cfs at any of the
five sites. Table 6.2-3 provides the same information in tabular form for each site. In general, the
Lower River displayed even more dynamic behavior in terms of the relative proportion of habitat
in each type present in 1983 versus 2012 than the Middle River. For example, the combined
clearwater/side slough habitat type either increased or decreased by a factor of nearly two for all
five sites with three sites showing an increase and two sites a decrease. Turbid backwater and

TECHNICAL MEMORANDUM AQUATIC MACROHABITAT TYPES
Susitna-Watana Hydroelectric Project Alaska Energy Authority FERC Project No. 14241 Page 33 February 2013
tributary habitat showed similar behavior with three of the four sites that had these habitats
present exhibit changes of at least a factor of two. In the case of turbid backwater, all three sites
showed decrease in the area. For tributary habitat, three of the sites showed large decrease and
one a large increase. Tributary mouth habitat showed more similarity between the two periods in
three of the four sites with this habitat having changes varying from a 50 percent increase to a 33
percent decrease. However, one site, Montana Creek increased by over a factor of 10 due to
geomorphic change at the tributary mouth. The proportions of main channel and secondary side
channel habitat also showed large changes between 1983 and 2012 at some of the sites mapped
in both the 1983 and 2012 aerials. These changes were again due to geomorphic changes
typically involving the migration of the main channel into or away from the site and/or change in
the distribution of flow in the braid plain such that the designation of the main channel and side
channels switched.
Middle River Segment changes have generally been more subtle than in the Lower River
Segment. In the Middle River, the changes have largely been associated with encroachment of
vegetation and either scour or deposition of sediment near the inlets of side channels and side
sloughs. There have also been changes in upland slough habitat primarily by biogeomorphic
processes of beaver dam construction and encroachment of vegetation. In the Lower River, the
changes have been associated with large scale erosion that has resulted in altering the locations
and types of connections between the main channel and the lateral habitats or in some cases
eroding the geomorphic features associated with the lateral habitat.
Labelle et al. (1985) studied channel changes within the Middle River from 1949 to 1982 using a
series of aerial photographs. The results of that effort indicated that 12 sloughs and side channels
changed classification type. Of these 12 (Table 2 of Labelle et al. 1985), 6 side channels became
side sloughs, 5 side sloughs changed to upland sloughs, and 1 upland slough converted to a side
slough. In general, all but one change, the side slough to a side channel, involved a change to a
less connected classification. Labelle et al. (1985) hypothesized that this was a result of a general
trend toward main channel degradation (lowering) in the Middle River. However, the results of
the current study indicate that between 1983 and 2012, side slough habitat area decreased by 42
percent (Table 6.1-1). Therefore it appears that for both periods, there was considerable change
in habitat classification in terms of the sloughs and side channels and that the two 30-year
periods exhibited opposite trends. This suggests a level of natural variability associated with
whether a particular lateral habitat will be a side channel or side slough over a period of decades.
Because of the variability in the habitat mapping between 1980s and 2012, the historical
macrohabitat mapping is not sufficiently representative of current conditions in order to be used
as the sole information source to support final site selection or to quantify either pre-Project or
post-Project aquatic macrohabitat. It is also recommended that the 1980s habitat mapping not be
used as the primary basis for extrapolation of current results of habitat quantifications in sampled
areas to unsampled areas.
However, the 1980s habitat mapping and results are still useful to the current studies. The results
are extremely valuable to developing and understanding the long term temporal variability and
evolution of aquatic macrohabitat in the Middle and Lower Susitna River Segments. The results
also provide valuable information in identifying the key physical processes that create, maintain,
and contribute to the changes in the aquatic habitat of the Susitna River. The geomorphology
studies will work with the Ice Processes Study, Riparian IFS and Fish and Aquatics IFS to

TECHNICAL MEMORANDUM AQUATIC MACROHABITAT TYPES
Susitna-Watana Hydroelectric Project Alaska Energy Authority FERC Project No. 14241 Page 34 February 2013
develop the understanding of the how and what physical processes are responsible for
determining the behavior of the Susitna River and its important lateral habitats.
The 1980s mapping of the macrohabitat also provides additional insight into results of the
instream flow modeling conducted in the Middle River, pertaining to the conditions associated
with meso and microhabitat modeling by IFG-4, RJHAB and DIHAB. Though the proportion of
the macrohabitat types have changed within reaches (Middle River) or at individual sites (Lower
River), it does not mean that the information gained from modeling the habitats at finer scales
within these habitats does not provide useful information on developing the current studies both
in terms of data to collect and potential modeling procedures to help identify potential Project
effects. The 1980s aerials also provide valuable information to the Riparian IFS on the changes
in vegetation within the floodplain. This information may be correlated with the mapped
locations of ice jams to help determine the influence ice may have on vegetation.
6.2.4. 2013 Efforts
Because of the limitations of the 1980s habitat mapping effort, aquatic macrohabitat was
quantified for current conditions throughout the Middle Susitna River by line mapping
techniques using recent aerial photographs and 2012 high definition, low altitude videography of
the river corridor (HDR Alaska, Inc. 2013). This mapping was used to support the identification
and selection of Focus Areas within the Middle River. In 2013, the remaining portion,
approximately 50 percent, of the Middle River will be mapped for aquatic macrohabitat at the
12,500 cfs level. Coordination will occur with the Fish and Aquatics Instream Flow Study team
to determine if any definitions of habitat types will be changed from the 1980s to provide more
functional definition in the current study. For example, a specific breaching flow could be
assigned to determine the difference between a side channel and a side slough rather than
allowing the feature to switch classifications when it is breached. There is also potential to
improve the definition of side channels versus main channels or to at least use a more
quantifiable procedure to determine whether a channel feature has more than 10 percent of the
flow and identify a reference flow for this determination. Once definitions are refined, the results
of the aquatic macrohabitat mapping through line mapping (HDR Alaska, Inc. 2013) and aerial
mapping (this study) should be compared. Discrepancies in classifications of individual features
should then be resolved and the mapping and analysis results updated.

TECHNICAL MEMORANDUM AQUATIC MACROHABITAT TYPES
Susitna-Watana Hydroelectric Project Alaska Energy Authority FERC Project No. 14241 Page 35 February 2013
7. REFERENCES
HDR Alaska, Inc. 2013. Middle Susitna River Segment Remote Line Habitat Mapping. Technical
Memorandum prepared for Alaska Energy Authority. Anchorage. January. 27p.
Klinger, S. and W. Trihey. 1984. Response of Aquatic Habitat Surface Areas to Mainstem
Discharge in the Talkeetna to Devil Canyon Reach of the Susitna River, Alaska. Prepared
by Trihey & Associates under contract to Harza-Ebasco for Alaska Power Authority,
Document No. 1693.
Labelle, J.C., M. Arend, L. Leslie, and W. Wilson. 1985. Geomorphic Change in the Middle
Susitna River since 1949. Report by Arctic Environmental Information and Data Center.
Prepared for the Alaska Power Authority.
Matanuska-Susitna Borough. 2011. Matanuska Susitna Borough LiDAR/Imagery Project.
http://matsu.gina.alaska.edu.
R&M Consultants, Inc. and Trihey & Associates. 1985a. Response of Aquatic Habitat Surface
Areas to Mainstem Discharge in the Yentna to Talkeetna Reach of the Susitna River.
Prepared under contract to Harza-Ebasco, for Alaska Power Authority, document No.
2774, June.
R&M Consultants, Inc. and Trihey & Associates. 1985b. Assessment of Access by Spawning
Salmon into Tributaries of the Lower Susitna River. Prepared under contract to Harza-
Ebasco, for Alaska Power Authority, document No. 2775, June.
Tetra Tech, Inc., 2013a. Mapping of Geomorphic Features and Assessment of Channel Change
in the Middle and Lower Susitna River Segments from 1980s and 2012 Aerials. Susitna-
Watana Hydroelectric Project. 2012 Study Technical Memorandum. Prepared for the
Alaska Energy Authority. Anchorage, Alaska.
Tetra Tech, Inc., 2013b. Stream Flow Assessment. Susitna-Watana Hydroelectric Project. 2012
Study Technical Memorandum. Prepared for the Alaska Energy Authority. Anchorage,
Alaska.
Tetra Tech, Inc., 2013c. Synthesis of 1980s Aquatic Habitat Information. Susitna-Watana
Hydroelectric Project. 2012 Study Technical Memorandum. Prepared for the Alaska
Energy Authority. Anchorage, Alaska.
Trihey & Associates. 1985a. Response of Aquatic Habitat Surface Areas to Mainstem Discharge
in the Talkeetna-To-Devil Canyon Segment of the Susitna River, Alaska. Prepared under
contract to Harza-Ebasco, for Alaska Power Authority, document No. 2945.
Trihey & Associates. 1985b. Characterization of Aquatic Habitats in the Talkeetna-to-Devil
Canyon Segment of the Susitna River, Alaska. Prepared under contract to Harza-Ebasco,
for Alaska Power Authority, document No. 2919, October.
U.S. Geological Survey. 2012. Streamflow Record Extension for Selected Streams in the Susitna
River Basin, Alaska, Scientific Investigations Report 2012–5210. 46 p.

TECHNICAL MEMORANDUM AQUATIC MACROHABITAT TYPES
Susitna-Watana Hydroelectric Project Alaska Energy Authority FERC Project No. 14241 Page 36 February 2013
Wilson, F. H., C. P. Hults, H. R. Schmoll, P. J. Haeussler, J. M. Schmidt, L. A. Yehle and K. A.
Labay. 2009. Preliminary Mapping of the Cook Inlet Region Alaska Including Parts of
the Talkeetna, Talkeetna Mountains, Tyonek, Anchorage, Lake Clark, Seward, Iliamna,
Seldovia, Mount Katmai, and Afognak 1:250,000 Scale Quadrangles. USGS Open-File
Report 2009-1108. 54p plus maps.

TECHNICAL MEMORANDUM AQUATIC MACROHABITAT TYPES
Susitna-Watana Hydroelectric Project Alaska Energy Authority FERC Project No. 14241 Page 37 February 2013
8. TABLES
Table 4.1-1. Summary of 1980s aerial dates, discharges, and project river mile extents.
Aerial Coverage (PRM) Date Discharge (cfs)
From To (MM/DD/YYYY) Gold Creek Sunshine Station
Upper Susitna River Segment
251 187 7/19 and 7/20/1980 35,800 & 31,600 ---
Middle Susitna River Segment
187 152 7/19 and 7/20/1980 35,800 & 31,600 ---
158 102 9/11/1983 12,500 (12,200
published) ---
Lower Susitna River Segment
102 0 9/6/1983 --- 36,600

TECHNICAL MEMORANDUM AQUATIC MACROHABITAT TYPES
Susitna-Watana Hydroelectric Project Alaska Energy Authority FERC Project No. 14241 Page 38 February 2013
Table 4.1-2. Summary of 2012 aerial dates, discharges, and project river mile extents.
Aerial Coverage (PRM) Date Discharge (cfs)
From To (MM/DD/YYYY) Gold Creek Sunshine Station
Upper Susitna River Segment
266.5 231.5 10/20/2012 7,410 ---
231.5 187 9/30/2012 17,000 ---
Middle Susitna River Segment
187 143.6 9/30/2012 17,000 ---
143.6 102 9/10/2012 12,900 ---
119 102 7/27/2012 22,200 ---
Lower Susitna River Segment
102 63 7/27/2012 --- 53,000
102 78 9/10/2012
38,200
78 69 9/30/2012 --- 48,000
69 33.5 10/10/2012 --- 55,000
33.5 22.5 9/30/2012
48,000
22.5 0 10/10/2012 --- 55,000

TECHNICAL MEMORANDUM AQUATIC MACROHABITAT TYPES
Susitna-Watana Hydroelectric Project Alaska Energy Authority FERC Project No. 14241 Page 39 February 2013
Table 4.3-1 Summary of rationale for selection of Middle River Segment aquatic habitat sites.
Habitat Site Project River Mile / River Mile¹ Site Length² (miles)
Geomorphic Reach
Selection Rationale Number Name Upstream Downstream
17 Portage Creek 152.3 / 148.8 151.8 / 148.4 0.5 MR-5 • Large tributary mouth with fan • Tributary mouth plume
16 Fat Canoe Island 151.0 / 147.5 149.9 / 146.5 1.1 MR-5 • IFG Site 147.1L (Rearing) • Main channel habitat only • Channel split around island
15 Slough 22 148.3 / 144.9 147.4 / 144.0 0.9 MR-6 • RJHAB Site Slough 22 (RM 144.3) (Surface and breaching elevations) • Some chum and sockeye spawning and rearing in Slough 22 (Jennings 1984). • Some vegetation development on islands
14 Slough 21 145.8 / 142.2 143.1 / 139.6 2.7 MR-6 • Spawning Instream Flow Sites at Side Channel 21 (141.2) and Slough 21 (RM 141.8) • Complex on right bank of sloughs (Sloughs 19, 20, and 21) and Side Channel 21 • Key chum and sockeye spawning in Slough 21. Key chum rearing in Slough 21 and sockeye rearing in Slough 19 (less in Slough 20) (Jennings 1984). • Some possible erosion of attached bars
13 Indian River 143.1 / 139.6 141.7 / 138.3 1.4 MR-6 • DIHAB Sites 138.7L (spawning), 139.0L (spawning), and 139.4L (spawning and rearing) • Complex of sloughs (Sloughs 17 and 18) on left bank • Key chum spawning in Slough 17 (some sockeye) (Jennings 1984) • Erosion of attached bars • Formation of mid channel bars • Some vegetation development on islands • Large tributary mouth
12 Gold Creek 141.6 / 138.2 140.0 / 136.6 1.6 MR-6 • DIHAB Site 137.5R (spawning and rearing) • Gold Creek Slough on right bank and complex of sloughs (Sloughs 15, 16, and 16B) on left bank • Some chum spawning in Slough 16 (Jennings 1984) • Some vegetation development on islands

TECHNICAL MEMORANDUM AQUATIC MACROHABITAT TYPES
Susitna-Watana Hydroelectric Project Alaska Energy Authority FERC Project No. 14241 Page 40 February 2013
Habitat Site Project River Mile / River Mile¹ Site Length² (miles)
Geomorphic Reach
Selection Rationale Number Name Upstream Downstream
11 Slough 11 140.0 / 136.6 137.6 / 134.2 2.4 MR-6 • Spawning Instream Flow Sites at Lower (RM 134.6) and Upper Slough 11 (RM 136.2) • Key sockeye and chum spawning at right bank Slough 11 in 1981-1983 (Jennings 1984) • Lateral slough/side channel complex on both banks (Sloughs 11, 12, 13, 14 and side channel 11) • IFG site 136.0L (spawning ) • Some vegetation development on islands
10 Side Channel 10 137.6 / 134.2 136.3 / 133.0 1.3 MR-6 • DIHAB Site 133.8L (spawning) • Side Channel 10 Spawning Instream Flow Site (chum and sockeye) on left bank. • Some chum and sockeye spawning in Side Channel 10 (Jennings 1984). • Some vegetation development on islands • Possible increased connectivity in side slough
9 Side Channel 10A
136.1 / 132.8 134.1 / 130.8 2 MR-6 • DIHAB Site 131.3L (spawning) • Side Channel 10A RJHAB Site (surface elevation); lower extent of side channel complex extends to 4th of July Creek • IFG Sites 131.7L (spawning and rearing) and 132.6L (rearing) • Tributary mouth habitat • Both erosion and development of islands • Possible increased connectivity in side slough
8 Slough 9 132.8 / 129.4 131.3 / 128.0 1.5 MR-6 • DIHAB Site 130.2R (spawning and rearing) • Slough 9 Spawning Instream Flow Site (RM 128.8) (chum and sockeye) • Key chum spawning at right bank Slough 9 in 1981-1983; some chum spawning in Slough 9B and sockeye spawning in Sloughs 9 and 9B (Jennings 1984). • Some vegetation development on islands • Stable side sloughs

TECHNICAL MEMORANDUM AQUATIC MACROHABITAT TYPES
Susitna-Watana Hydroelectric Project Alaska Energy Authority FERC Project No. 14241 Page 41 February 2013
Habitat Site Project River Mile / River Mile¹ Site Length² (miles)
Geomorphic Reach
Selection Rationale Number Name Upstream Downstream
7 Slough 8A 130.2 / 126.6 128 / 124.1 2.2 MR-6 • DIHAB Site 125.2R (spawning and rearing) • Slough 8A Spawning Instream Flow Site (RM 125.3) (chum and sockeye) • Large right bank complex of sloughs (A’, A, 8A, B) and side channel (Skull Creek Side Channel) • Key chum and sockeye spawning at right bank Slough 8A in 1981-1983 (Jennings 1984). Key chum rearing in Slough 8A (Jennings 1984). • Both encroachment and removal of vegetation
6 Oxbow II 124 / 120.5 122.7 1.3 MR-6 • DIHAB Sites 118.9L and 119.1L (spawning) • IFG Site 119.2R (rearing) • Oxbow II Side Channel complex on left bank at confluence of Downunda and Fromunda Creeks • Some vegetation development on islands • Some vegetation encroachment in side slough
6 Oxbow II 122.7 121.9 / 118.3 0.8 MR-7
5 Slough 8 119 / 115.5 116.9 / 113.4 2.1 MR-7 • Slough 8 RJHAB Site (surface and breach elevations) • DIHAB Sites 114.1R and 115.0R (spawning) • Key chum spawning in Slough 8; some chum, sockeye, and coho rearing in Slough 8 and Mainstem II Side Channel site (Right bank at RM 114.4) (Jennings 1984). • Some vegetation development on islands • Possible vegetation encroachment in side slough
4 Slough 6A 116.5 / 113.0 115.5 / 112.0 1 MR-7 • Slough 6A RJHAB Site (surface elevation) • IFG Site 112.6L (Side Channel 6A; rearing) • Key sockeye, some chum rearing in Slough 6A; some chum spawning in Slough 6A (Jennings 1984). • Upland slough area may have increased
3 Slough 5 112.1 / 108.4 110.7 / 106.9 1.4 MR-7 • Slough 5 RJHAB Site (surface elevation) • Some sockeye rearing in Slough 5 (Jennings 1984). • Right bank complex of sloughs (Sloughs 5 and 6) • Some vegetation development on islands

TECHNICAL MEMORANDUM AQUATIC MACROHABITAT TYPES
Susitna-Watana Hydroelectric Project Alaska Energy Authority FERC Project No. 14241 Page 42 February 2013
Habitat Site Project River Mile / River Mile¹ Site Length² (miles)
Geomorphic Reach
Selection Rationale Number Name Upstream Downstream
2 Slough 4 110.2 / 106.5 108.7 / 105.0 1.5 MR-7 • DIHAB Site 105.8L (rearing) • Right bank slough complex (Slough 4) • Possible reduction in upland slough area
1 Whiskers Slough 105.9 / 102.0 104.4 / 100.5 1.5 MR-8 • IFG Sites: 101.2R (spawning), 101.5L (rearing) • DIHAB Site 101.7L (spawning, rearing) • Whiskers Slough RJHAB site (RM 101.2) (surface and breaching elevations) • Key chum and sockeye rearing sites in Whiskers Slough and Side Channel (Jennings 1984). • Right bank slough (Slough 2) and side channel (Whiskers East) and left bank complex of sloughs (Whiskers, 3B, 3A) and side channel (Whiskers West). • Some increased vegetation on islands
Notes:
1 First Value is in current Project River Miles (PRM). Project River Miles were intersected with river thalweg and rounded to first decimal place. Second
value, in italics, is in the 1980s River Mile (RM) System. River miles (1980s river-mile system) are approximate based on
River_Mile_Index_1981_md.shp.
2 Habitat Site Length is calculated based on PRM values.

TECHNICAL MEMORANDUM AQUATIC MACROHABITAT TYPES
Susitna-Watana Hydroelectric Project Alaska Energy Authority FERC Project No. 14241 Page 43 February 2013
Table 4.3-2 Selected aquatic habitat sites in the Middle Susitna River Segment.
Habitat Site Project River Mile Geomorphic Reach
Number Name Upstream Downstream
Middle Susitna River Segment
23 Below Dam¹,2 185.7 184.7 MR-1
22 MR-2 Island Bend2 183.5 180.8 MR-2
21 MR-2 Tributary2 179.7 178.7 MR-2
20 MR-2 Straight2 177.8 176.1 MR-2
19 MR-2 Wide¹,2 175.4 173.6 MR-2
18 MR-2 Narrow¹,2 173 171.6 MR-2
17 Portage Creek¹ 152.3 151.8 MR-5
16 Fat Canoe Island 151.0 149.9 MR-5
15 Slough 22 148.3 147.4 MR-6
14 Slough 21¹ 145.8 143.1 MR-6
13 Indian River1 143.1 141.7 MR-6
12 Gold Creek 141.6 140 MR-6
11 Slough 11¹ 140 137.6 MR-6
10 Side Channel 10 137.6 136.3 MR-6
9 Side Channel 10A 136.1 134.1 MR-6
8 Slough 9 132.8 131.3 MR-6
7 Slough 8A¹ 130.2 128 MR-6
6 Oxbow II 124 122.7 MR-6
6 Oxbow II 122.7 121.9 MR-7
5 Slough 8 119 116.9 MR-7
4 Slough 6A¹ 116.5 115.5 MR-7
3 Slough 5 112.1 110.7 MR-7
2 Slough 4 110.2 108.7 MR-7
1 Whiskers Slough¹ 105.9 104.4 MR-8
Notes:
1 Proposed Focus Area
2 Site not studied in the 1980s

TECHNICAL MEMORANDUM AQUATIC MACROHABITAT TYPES
Susitna-Watana Hydroelectric Project Alaska Energy Authority FERC Project No. 14241 Page 44 February 2013
Table 4.3-3 Selected aquatic habitat sites in the Lower Susitna River Segment.
Habitat Site Project River Mile Geomorphic Reach
Number Name Upstream Downstream
Lower Susitna River Segment
5 Sunshine Slough 91.7 87.9 1 LR-1
4 Montana Creek 82.1 80.5 1 LR-2
3 Goose Creek 77 1 72.5 1 LR-2
2 Willow Creek 56 1 53.5 1 LR-3
1 SC IV-4 40 1 36.8 LR-4
Notes:
1 Habitat Site boundaries are outside of the main channel extent and therefore Project River Miles are
approximate.

TECHNICAL MEMORANDUM AQUATIC MACROHABITAT TYPES
Susitna-Watana Hydroelectric Project Alaska Energy Authority FERC Project No. 14241 Page 45 February 2013
Table 5.1-1. Comparison of areas of digitized aquatic habitat types from 1983 to 2012 at Whiskers Slough.
Site 1, Whiskers Slough at 12,500 cfs
Habitat Type 1983 Digitized 2012 Scaled
Percent Change (sq. ft)
Main Channel 3,818,000 6,096,000 60%
Side Channel 2,893,000 904,000 -69%
Side Slough 388,000 245,000 -34%
Upland Slough 46,000 85,000 84%
Tributary Mouth 0 57,000 U
Notes:
U-Unable to calculate percent change due to feature absence in the 1980s.
Table 5.1-2. Comparison of areas of mapped aquatic habitat types from 1983 to 2012 at Slough 4.
Site 2, Slough 4 at 12,500 cfs
Habitat Type 1983 Digitized 2012 Scaled
Percent Change (sq. ft)
Main Channel 5,015,000 5,438,000 8%
Side Channel 441,000 0 -100%
Side Slough 0 0 0%
Upland Slough 132,000 30,000 -77%
Tributary Mouth 0 6,000 U
Notes:
U-Unable to calculate percent change due to feature absence in the 1980s.
Table 5.1-3. Comparison of areas of mapped aquatic habitat types from 1983 to 2012 at Slough 5.
Site 3, Slough 5 at 12,500 cfs
Habitat Type 1983 Digitized 2012 Scaled
Percent Change (sq. ft)
Main Channel 4,459,000 4,492,000 1%
Side Channel 177,000 133,000 -25%
Side Slough 0 0 0%
Upland Slough 40,000 67,000 66%
Tributary Mouth 0 0 0%

TECHNICAL MEMORANDUM AQUATIC MACROHABITAT TYPES
Susitna-Watana Hydroelectric Project Alaska Energy Authority FERC Project No. 14241 Page 46 February 2013
Table 5.1-4. Comparison of areas of mapped aquatic habitat types from 1983 to 2012 at Slough 6A.
Site 4, Slough 6A at 12,500 cfs
Habitat Type 1983 Digitized 2012 Scaled
Percent Change (sq. ft)
Main Channel 2,565,000 4,488,000 75%
Side Channel 2,172,000 0 -100%
Side Slough 0 0 0%
Upland Slough 105,000 111,000 6%
Tributary Mouth 0 0 0%
Table 5.1-5. Comparison of areas of mapped aquatic habitat types from 1983 to 2012 at Slough 8.
Site 5, Slough 8 at 12,500 cfs
Habitat Type 1983 Digitized 2012 Scaled
Percent Change (sq. ft)
Main Channel 4,756,000 5,997,000 26%
Side Channel 3,288,000 1,447,000 -56%
Side Slough 178,000 97,000 -45%
Upland Slough 0 0 0%
Tributary Mouth 49,000 39,000 -20%
Table 5.1-6. Comparison of areas of mapped aquatic habitat types from 1983 to 2012 at Oxbow II.
Site 6, Oxbow II at 12,500 cfs
Habitat Type 1983 Digitized 2012 Scaled
Percent Change (sq. ft)
Main Channel 5,805,000 5,939,000 2%
Side Channel 2,004,000 2,210,000 10%
Side Slough 265,000 103,000 -61%
Upland Slough 0 0 0%
Tributary Mouth 0 9,000 U
Notes:
U-Unable to calculate percent change due to feature absence in the 1980s.

TECHNICAL MEMORANDUM AQUATIC MACROHABITAT TYPES
Susitna-Watana Hydroelectric Project Alaska Energy Authority FERC Project No. 14241 Page 47 February 2013
Table 5.1-7. Comparison of areas of mapped aquatic habitat types from 1983 to 2012 at Slough 8A.
Site 7, Slough 8A at 12,500 cfs
Habitat Type 1983 Digitized 2012 Scaled
Percent Change (sq. ft)
Main Channel 5,623,000 8,188,000 46%
Side Channel 2,024,000 726,000 -64%
Side Slough 1,138,000 602,000 -47%
Upland Slough 0 0 0%
Tributary Mouth 8,000 7,000 -18%
Table 5.1-8. Comparison of areas of mapped aquatic habitat types from 1983 to 2012 at Slough 9.
Site 8, Slough 9 at 12,500 cfs
Habitat Type 1983 Digitized 2012 Scaled
Percent Change (sq. ft)
Main Channel 3,246,000 4,028,000 24%
Side Channel 1,627,000 1,051,000 -35%
Side Slough 494,000 418,000 -15%
Upland Slough 74,000 0 -100%
Tributary Mouth 0 0 0%
Table 5.1-9. Comparison of areas of mapped aquatic habitat types from 1983 to 2012 at Side Channel 10A.
Site 9, Side Channel 10A at 12,500 cfs
Habitat Type 1983 Digitized 2012 Scaled
Percent Change (sq. ft)
Main Channel 5,028,000 6,417,000 28%
Side Channel 2,440,000 1,054,000 -57%
Side Slough 22,000 0 -100%
Upland Slough 0 10,000 U
Tributary Mouth 79,000 90,000 14%
Notes:
U-Unable to calculate percent change due to feature absence in the 1980s.
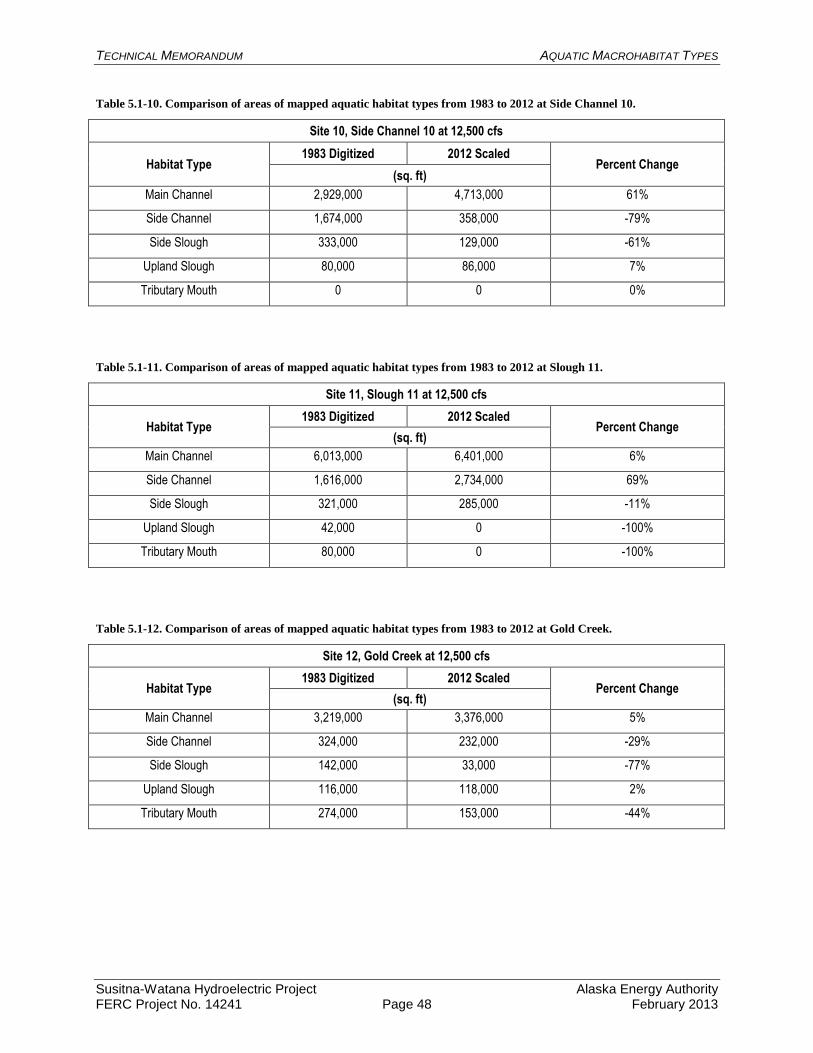
TECHNICAL MEMORANDUM AQUATIC MACROHABITAT TYPES
Susitna-Watana Hydroelectric Project Alaska Energy Authority FERC Project No. 14241 Page 48 February 2013
Table 5.1-10. Comparison of areas of mapped aquatic habitat types from 1983 to 2012 at Side Channel 10.
Site 10, Side Channel 10 at 12,500 cfs
Habitat Type 1983 Digitized 2012 Scaled
Percent Change (sq. ft)
Main Channel 2,929,000 4,713,000 61%
Side Channel 1,674,000 358,000 -79%
Side Slough 333,000 129,000 -61%
Upland Slough 80,000 86,000 7%
Tributary Mouth 0 0 0%
Table 5.1-11. Comparison of areas of mapped aquatic habitat types from 1983 to 2012 at Slough 11.
Site 11, Slough 11 at 12,500 cfs
Habitat Type 1983 Digitized 2012 Scaled
Percent Change (sq. ft)
Main Channel 6,013,000 6,401,000 6%
Side Channel 1,616,000 2,734,000 69%
Side Slough 321,000 285,000 -11%
Upland Slough 42,000 0 -100%
Tributary Mouth 80,000 0 -100%
Table 5.1-12. Comparison of areas of mapped aquatic habitat types from 1983 to 2012 at Gold Creek.
Site 12, Gold Creek at 12,500 cfs
Habitat Type 1983 Digitized 2012 Scaled
Percent Change (sq. ft)
Main Channel 3,219,000 3,376,000 5%
Side Channel 324,000 232,000 -29%
Side Slough 142,000 33,000 -77%
Upland Slough 116,000 118,000 2%
Tributary Mouth 274,000 153,000 -44%
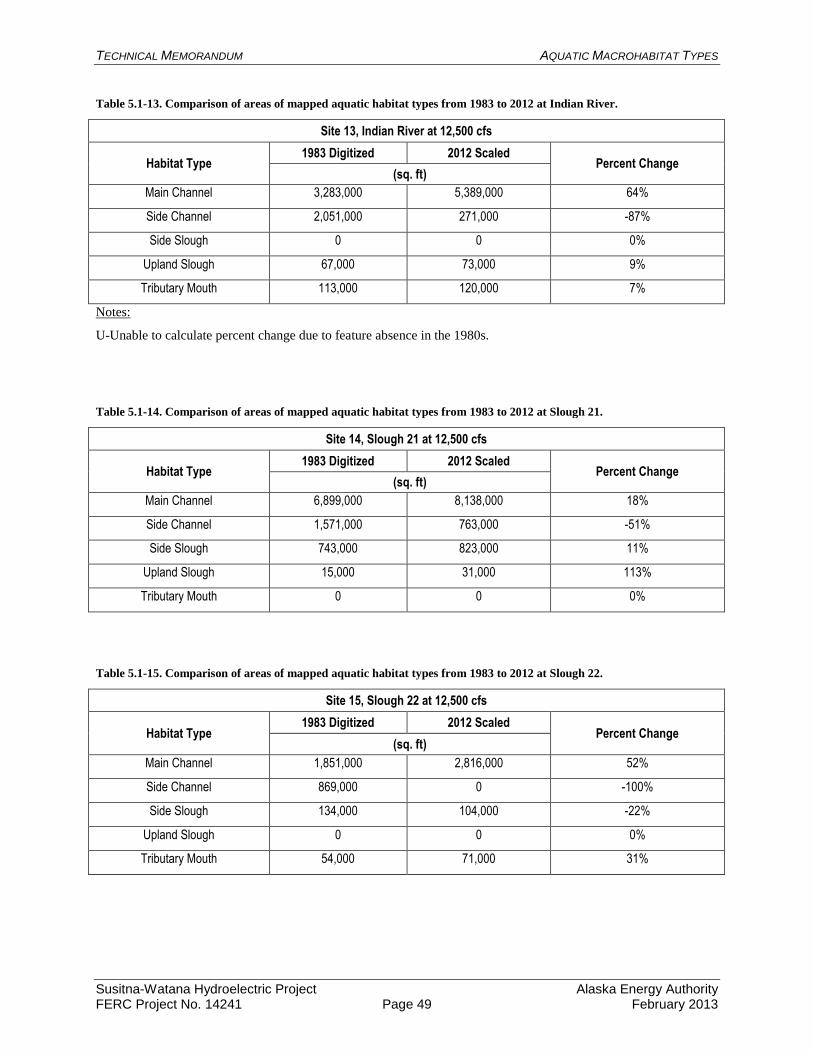
TECHNICAL MEMORANDUM AQUATIC MACROHABITAT TYPES
Susitna-Watana Hydroelectric Project Alaska Energy Authority FERC Project No. 14241 Page 49 February 2013
Table 5.1-13. Comparison of areas of mapped aquatic habitat types from 1983 to 2012 at Indian River.
Site 13, Indian River at 12,500 cfs
Habitat Type 1983 Digitized 2012 Scaled
Percent Change (sq. ft)
Main Channel 3,283,000 5,389,000 64%
Side Channel 2,051,000 271,000 -87%
Side Slough 0 0 0%
Upland Slough 67,000 73,000 9%
Tributary Mouth 113,000 120,000 7%
Notes:
U-Unable to calculate percent change due to feature absence in the 1980s.
Table 5.1-14. Comparison of areas of mapped aquatic habitat types from 1983 to 2012 at Slough 21.
Site 14, Slough 21 at 12,500 cfs
Habitat Type 1983 Digitized 2012 Scaled
Percent Change (sq. ft)
Main Channel 6,899,000 8,138,000 18%
Side Channel 1,571,000 763,000 -51%
Side Slough 743,000 823,000 11%
Upland Slough 15,000 31,000 113%
Tributary Mouth 0 0 0%
Table 5.1-15. Comparison of areas of mapped aquatic habitat types from 1983 to 2012 at Slough 22.
Site 15, Slough 22 at 12,500 cfs
Habitat Type 1983 Digitized 2012 Scaled
Percent Change (sq. ft)
Main Channel 1,851,000 2,816,000 52%
Side Channel 869,000 0 -100%
Side Slough 134,000 104,000 -22%
Upland Slough 0 0 0%
Tributary Mouth 54,000 71,000 31%

TECHNICAL MEMORANDUM AQUATIC MACROHABITAT TYPES
Susitna-Watana Hydroelectric Project Alaska Energy Authority FERC Project No. 14241 Page 50 February 2013
Table 5.1-16. Comparison of areas of mapped aquatic habitat types from 1983 to 2012 at Fat Canoe Island.
Site 16, Fat Canoe Island at 12,500 cfs
Habitat Type 1983 Digitized 2012 Scaled
Percent Change (sq. ft)
Main Channel 3,018,000 2,846,000 -6%
Side Channel 0 0 0%
Side Slough 0 0 0%
Upland Slough 0 0 0%
Tributary Mouth 0 0 0%
Table 5.1-17. Comparison of areas of mapped aquatic habitat types from 1983 to 2012 at Portage Creek.
Site 17, Portage Creek at 12,500 cfs
Habitat Type 1983 Digitized 2012 Scaled
Percent Change (sq. ft)
Main Channel 1,009,000 1,017,000 1%
Side Channel 0 0 0%
Side Slough 0 0 0%
Upland Slough 0 0 0%
Tributary Mouth 100,000 37,000 -63%

TECHNICAL MEMORANDUM AQUATIC MACROHABITAT TYPES
Susitna-Watana Hydroelectric Project Alaska Energy Authority FERC Project No. 14241 Page 51 February 2013
Table 5.2-1. Wetted area of aquatic macrohabitat types at 17,000 cfs (Gold Creek gage) for Middle River Segment Sites 18
through 23.
Habitat Types at 17,000 cfs (Gold Creek Gage)
Habitat Site Number
18 19 20 21 22 23
Wetted Habitat Area (sq. ft)
Main Channel 3,893,000 4,883,000 4,860,000 2,285,000 9,148,000 2,653,000
Side Channel 17,000 0 143,000 0 9,000 222,000
Side Slough 50,000 534,000 0 0 110,000 0
Upland Slough 0 0 32,000 16,000 0 0
Tributary Mouth 0 0 0 40,000 0 0
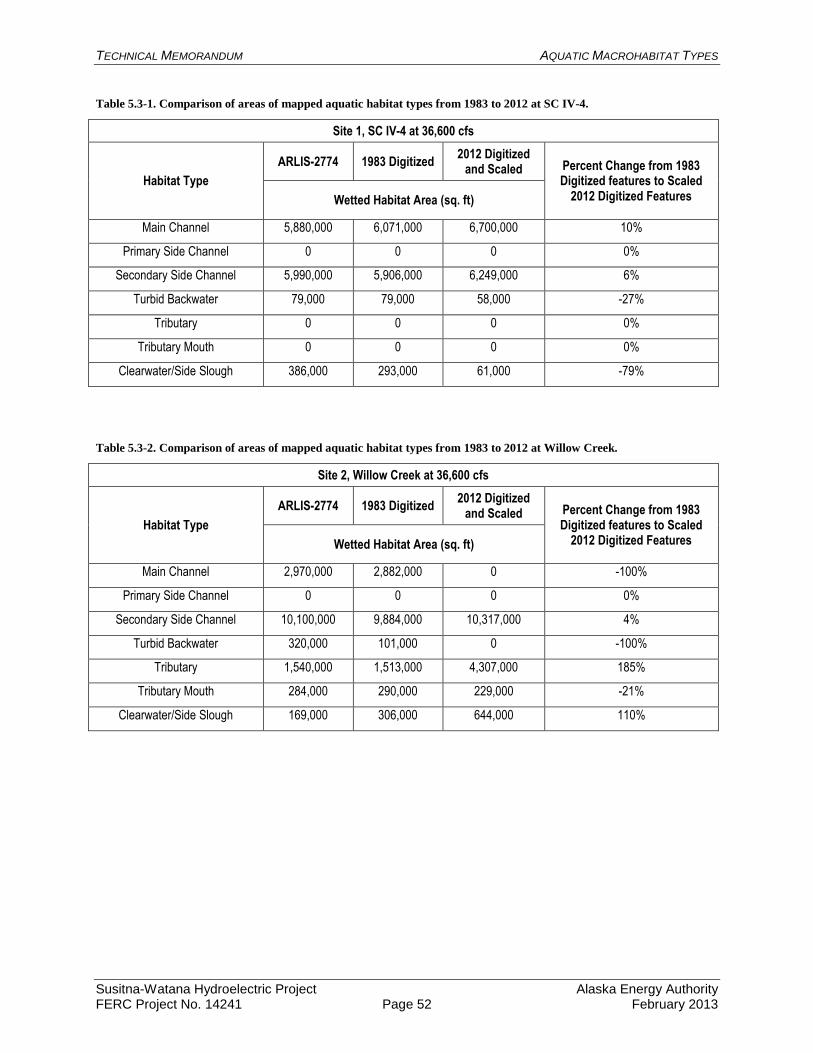
TECHNICAL MEMORANDUM AQUATIC MACROHABITAT TYPES
Susitna-Watana Hydroelectric Project Alaska Energy Authority FERC Project No. 14241 Page 52 February 2013
Table 5.3-1. Comparison of areas of mapped aquatic habitat types from 1983 to 2012 at SC IV-4.
Site 1, SC IV-4 at 36,600 cfs
Habitat Type
ARLIS-2774 1983 Digitized 2012 Digitized
and Scaled Percent Change from 1983 Digitized features to Scaled
2012 Digitized Features Wetted Habitat Area (sq. ft)
Main Channel 5,880,000 6,071,000 6,700,000 10%
Primary Side Channel 0 0 0 0%
Secondary Side Channel 5,990,000 5,906,000 6,249,000 6%
Turbid Backwater 79,000 79,000 58,000 -27%
Tributary 0 0 0 0%
Tributary Mouth 0 0 0 0%
Clearwater/Side Slough 386,000 293,000 61,000 -79%
Table 5.3-2. Comparison of areas of mapped aquatic habitat types from 1983 to 2012 at Willow Creek.
Site 2, Willow Creek at 36,600 cfs
Habitat Type
ARLIS-2774 1983 Digitized 2012 Digitized
and Scaled Percent Change from 1983 Digitized features to Scaled
2012 Digitized Features Wetted Habitat Area (sq. ft)
Main Channel 2,970,000 2,882,000 0 -100%
Primary Side Channel 0 0 0 0%
Secondary Side Channel 10,100,000 9,884,000 10,317,000 4%
Turbid Backwater 320,000 101,000 0 -100%
Tributary 1,540,000 1,513,000 4,307,000 185%
Tributary Mouth 284,000 290,000 229,000 -21%
Clearwater/Side Slough 169,000 306,000 644,000 110%

TECHNICAL MEMORANDUM AQUATIC MACROHABITAT TYPES
Susitna-Watana Hydroelectric Project Alaska Energy Authority FERC Project No. 14241 Page 53 February 2013
Table 5.3-3. Comparison of areas of mapped aquatic habitat types from 1983 to 2012 at Goose Creek.
Site 3, Goose Creek at 36,600 cfs
Habitat Type
ARLIS-2774 1983 Digitized 2012 Digitized
and Scaled Percent Change from 1983 Digitized features to Scaled
2012 Digitized Features Wetted Habitat Area (sq. ft)
Main Channel 3,590,000 3,473,000 5,175,000 49%
Primary Side Channel 0 0 0 0%
Secondary Side Channel 4,240,000 3,995,000 2,705,000 -32%
Turbid Backwater 338,000 252,000 134,000 -47%
Tributary 445,000 425,000 73,000 -83%
Tributary Mouth 66,000 52,000 68,000 29%
Clearwater/Side Slough 985,000 947,000 6,983,000 637%
Table 5.3-4. Comparison of areas of mapped aquatic habitat types from 1983 to 2012 at Montana Creek.
Site 4, Montana Creek at 36,600 cfs
Habitat Type
ARLIS-2774 1983 Digitized 2012 Digitized
and Scaled Percent Change from 1983 Digitized features to Scaled
2012 Digitized Features Wetted Habitat Area (sq. ft)
Main Channel 3,890,000 3,729,000 3,595,000 -4%
Primary Side Channel 0 0 0 0%
Secondary Side Channel 590,000 555,000 1,798,000 224%
Turbid Backwater 0 0 0 0%
Tributary 309,000 250,000 70,000 -72%
Tributary Mouth 11,000 21,000 291,000 1317%
Clearwater/Side Slough 273,000 283,000 30,000 -89%

TECHNICAL MEMORANDUM AQUATIC MACROHABITAT TYPES
Susitna-Watana Hydroelectric Project Alaska Energy Authority FERC Project No. 14241 Page 54 February 2013
Table 5.3-5. Comparison of areas of mapped aquatic habitat types from 1983 to 2012 at Sunshine Slough.
Site 5, Sunshine Slough at 36,600 cfs
Habitat Type
ARLIS-2774 1983 Digitized 2012 Digitized
and Scaled Percent Change from 1983 Digitized features to Scaled
2012 Digitized Features Wetted Habitat Area (sq. ft)
Main Channel 7,460,000 6,701,000 12,436,000 86%
Primary Side Channel 0 0 0 0%
Secondary Side Channel 10,300,000 9,850,000 7,811,000 -21%
Turbid Backwater 448,000 202,000 2,000 -99%
Tributary 61,000 85,000 93,000 10%
Tributary Mouth 38,000 36,000 63,000 73%
Clearwater/Side Slough 335,000 278,000 637,000 129%

TECHNICAL MEMORANDUM AQUATIC MACROHABITAT TYPES
Susitna-Watana Hydroelectric Project Alaska Energy Authority FERC Project No. 14241 Page 55 February 2013
Table 6.1-1. Summation of areas by aquatic macrohabitat types for Sites 1 through 13 in the Middle River Segment.
Habitat Sites 1 - 13
Year
Total Main Channel & Side Channel
Total Side Slough Total Upland Slough Total Tributary Mouth
Wetted Habitat Area (sq. ft)
1983 78,488,000 3,281,000 702,000 603,000
2012 82,081,000 1,913,000 579,000 481,000
Percent Change 5% -42% -18% -20%
Table 6.1-2. Summation of areas by aquatic macrohabitat type for Sites 6 through 13 in Geomorphic Reach MR-6.
MR-6 (Sites 6 - 13)¹
Year
Total Main Channel & Side Channel
Total Side Slough Total Upland Slough Total Tributary Mouth
Wetted Habitat Area (sq. ft)
1983 48,905,000 2,715,000 379,000 554,000
2012 53,086,000 1,571,000 287,000 379,000
Percent Change 9% -42% -24% -32%
Notes:
1 Habitat Sites 14 and 15 are within this geomorphic reach however because they were classified at a higher
flow (17,000 cfs), they were excluded from this summation.

TECHNICAL MEMORANDUM AQUATIC MACROHABITAT TYPES
Susitna-Watana Hydroelectric Project Alaska Energy Authority FERC Project No. 14241 Page 56 February 2013
Table 6.1-3. Summation of areas by aquatic macrohabitat type for Sites 2 through 5 in Geomorphic Reach MR-7.
MR-7 (Sites 2 - 5)
Year
Total Main Channel & Side Channel
Total Side Slough Total Upland Slough Total Tributary Mouth
Wetted Habitat Area (sq. ft)
1983 22,872,000 178,000 277,000 49,000
2012 21,995,000 97,000 207,000 45,000
Percent Change -4% -46% -25% -8%
Table 6.1-4. Summation areas by aquatic macrohabitat for Site 1 in Geomorphic Reach MR-8.
MR- 8 (Site 1)
Year
Total Main Channel & Side Channel
Total Side Slough Total Upland Slough Total Tributary Mouth
Wetted Habitat Area (sq. ft)
1983 6,711,000 388,000 46,000 0
2012 7,000,000 245,000 85,000 57,000
Percent Change 4% -37% 85% U

TECHNICAL MEMORANDUM AQUATIC MACROHABITAT TYPES
Susitna-Watana Hydroelectric Project Alaska Energy Authority FERC Project No. 14241 Page 57 February 2013
Table 6.1-5. Comparison of changes from 1983 to 2012 at specific sloughs in the Middle Susitna River.
Habitat Site
Slough
Classification Location
Notes Number Name 1980s 2012 PRM RM
1 Whiskers 2 SS SC 104.6 100.6 Side slough developed into side channel with gravel bar growth. Vegetated island developed fuller and denser vegetation.
1 Whiskers Whiskers SS SS 105.5 101.5 Remained relatively similar. Thin slough that runs around a large vegetated island and is fed by tributary at its lower extents. Exposed substrate around both slough banks in 1983 are now vegetated with low brush in 2012.
1 Whiskers 3A SS SS 105.8 102
High brush and low trees in 1983 surrounding the slough has lost some tree coverage in 2012 and now is surrounded by low brush. The slough has had a thin wetted surface area in 1983 and 2012 of less than 20 feet wide. The connection to Slough 3B appears to be nearly blocked by a beaver dam.
1 Whiskers 3B SS SS 105.6 101.8 High brush and low trees in 1983 surrounding the wetted SS has lost some tree coverage in 2012 and now is surrounded by low brush. The two locations within the slough where other connections are present have developed log buildup, potentially inhibiting flow.
2 Slough 4 4 US US 109 105.2
In 1983 the upland slough had a mouth of exposed substrate and low brush vegetation. In 2012 the mouth has become fully vegetated with high brush. Only a small trickle drains into the main channel. The body of the slough has mostly dried up since 1983 from approximately 65 - 85 feet wide to only a few feet wide in 2012 and become vegetated. The upper thalweg has remained relatively similar consisting of a thin and long open body surrounded by low vegetation. A portion of the upstream end of the slough has developed into an AOW in 2012.
3 Slough 5 5 US US 111.4 107.5 Exposed substrate of about 40 feet wide has developed at the sloughs mouth since 1983. The body of the slough has slightly widened (perhaps due to the buildup of substrate at the mouth) and low brush has developed at the water’s edge.
3 Slough 5 6 US US 111.9 108.2
The runoff and upwelling of water has increased in 2012 (could be due to weather conditions in current year, possibly wetter in 2012 than 1983). The increased drainage is likely due to an AOW just upstream of the habitat site. The size of the slough and amount of exposed substrate at its mouth has remained roughly the same. Vegetation has remained low and sparse since 1983.
4 Slough 6A 6A US US 116 112.5
Slough has slightly increased in wetted area in 2012 as 1983. This is partially due to further delineation in 2012 of wetted area that was also present but not delineated in 1983. Main channel has eroded the MC right bank that connects to the slough about 100 feet in length and 75 feet wide. Vegetation and surrounding AOWs similar in size and sparse density between the years.
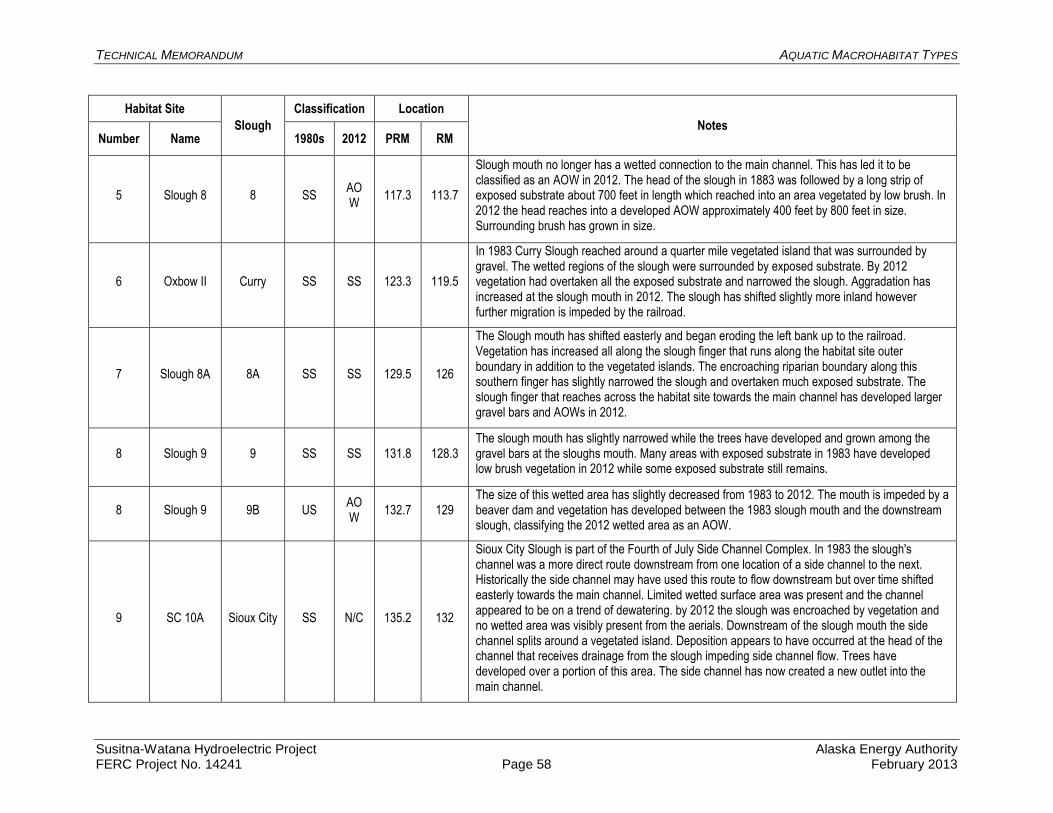
TECHNICAL MEMORANDUM AQUATIC MACROHABITAT TYPES
Susitna-Watana Hydroelectric Project Alaska Energy Authority FERC Project No. 14241 Page 58 February 2013
Habitat Site
Slough
Classification Location
Notes Number Name 1980s 2012 PRM RM
5 Slough 8 8 SS AOW
117.3 113.7
Slough mouth no longer has a wetted connection to the main channel. This has led it to be classified as an AOW in 2012. The head of the slough in 1883 was followed by a long strip of exposed substrate about 700 feet in length which reached into an area vegetated by low brush. In 2012 the head reaches into a developed AOW approximately 400 feet by 800 feet in size. Surrounding brush has grown in size.
6 Oxbow II Curry SS SS 123.3 119.5
In 1983 Curry Slough reached around a quarter mile vegetated island that was surrounded by gravel. The wetted regions of the slough were surrounded by exposed substrate. By 2012 vegetation had overtaken all the exposed substrate and narrowed the slough. Aggradation has increased at the slough mouth in 2012. The slough has shifted slightly more inland however further migration is impeded by the railroad.
7 Slough 8A 8A SS SS 129.5 126
The Slough mouth has shifted easterly and began eroding the left bank up to the railroad. Vegetation has increased all along the slough finger that runs along the habitat site outer boundary in addition to the vegetated islands. The encroaching riparian boundary along this southern finger has slightly narrowed the slough and overtaken much exposed substrate. The slough finger that reaches across the habitat site towards the main channel has developed larger gravel bars and AOWs in 2012.
8 Slough 9 9 SS SS 131.8 128.3 The slough mouth has slightly narrowed while the trees have developed and grown among the gravel bars at the sloughs mouth. Many areas with exposed substrate in 1983 have developed low brush vegetation in 2012 while some exposed substrate still remains.
8 Slough 9 9B US AOW
132.7 129 The size of this wetted area has slightly decreased from 1983 to 2012. The mouth is impeded by a beaver dam and vegetation has developed between the 1983 slough mouth and the downstream slough, classifying the 2012 wetted area as an AOW.
9 SC 10A Sioux City SS N/C 135.2 132
Sioux City Slough is part of the Fourth of July Side Channel Complex. In 1983 the slough's channel was a more direct route downstream from one location of a side channel to the next. Historically the side channel may have used this route to flow downstream but over time shifted easterly towards the main channel. Limited wetted surface area was present and the channel appeared to be on a trend of dewatering. by 2012 the slough was encroached by vegetation and no wetted area was visibly present from the aerials. Downstream of the slough mouth the side channel splits around a vegetated island. Deposition appears to have occurred at the head of the channel that receives drainage from the slough impeding side channel flow. Trees have developed over a portion of this area. The side channel has now created a new outlet into the main channel.

TECHNICAL MEMORANDUM AQUATIC MACROHABITAT TYPES
Susitna-Watana Hydroelectric Project Alaska Energy Authority FERC Project No. 14241 Page 59 February 2013
Habitat Site
Slough
Classification Location
Notes Number Name 1980s 2012 PRM RM
10 SC 10 9A SS SS 137 133.5
The vegetated regions surrounding the sloughs boundaries and along the vegetated island have increased in breadth and size since 1983. The vegetation has developed from low brush and trees into high brush and trees in 2012. The sloughs mouth has slightly expanded in 2012 and its body has slightly meandered from the 1983 trajectory. Gravel deposition appears to have occurred at the sloughs head since 1983 inhibiting flow into the side slough.
10 SC 10 10 US US 137.1 133.6
The slough wetted surface area is approximately the same size in 1983 and 2012 however there has been a slight increase in 2012 due to further delineation. The banks surrounding the slough were mostly surrounded by exposed substrate in 1983. By 2012 the vegetation line has crept up to the water’s edge.
11 Slough 11 11 SS SS 139.4 135.9
Vegetation has developed from sparsely populated trees and low-lying brush to densely populated trees and high brush surrounding the slough as well as across the vegetated island along one its banks. Vegetation has grown over the exposed substrate at the sloughs head. Gravel bars have remained in the 2012 slough since 1983 while they have reduced in number and size.
11 Slough 11 12 US SS 138.8 135.3 The upland slough has reduced from approximately 30 feet wide in 1983 to less than 10 feet wide in 2012. The slough has lost most of its wetted area and changed classifications to a side slough.
11 Slough 11 13 SS SS 139 135.6
In 1983 the slough was surrounded by exposed substrate. In 2012 dense high brush vegetation has completely surrounded the slough. The slough is roughly the same size in 1983 and 2012 however the slough's upstream body now reaches towards the main channel rather than further inland in 1983.
11 Slough 11 14 N/C AOW
139.5 136 This slough was not classified in 1983. An AOW existed inland of the identified slough area in 1983 but was not delineated. In 2012 the AOW was approximately the same size as in 1983 and was delineated.
12 Gold Creek Gold
Creek US N/C 140.2 136.8
Gold Creek Slough, an upland slough in 1983 was encroached by vegetation and visually unidentifiable as a wetted water body in 2012.
12 Gold Creek 15 US US 141.2 137.7
In 1983 the slough was surrounded by low brush and exposed substrate. All of the exposed substrate has been covered by low vegetation. The slough maintains its shape since 1983 and has slightly more water. The slough mouth has expanded and eroded the exposed substrate from the upland slough and the main channel that once confined it.

TECHNICAL MEMORANDUM AQUATIC MACROHABITAT TYPES
Susitna-Watana Hydroelectric Project Alaska Energy Authority FERC Project No. 14241 Page 60 February 2013
Habitat Site
Slough
Classification Location
Notes Number Name 1980s 2012 PRM RM
12 Gold Creek 16 SS SS 141.3 137.8 The slough is still surrounded by exposed substrate from 1983 to 2012 however the wetted area has reduced and the upstream connection to Slough 15B no longer exists. In 2012, low-lying vegetation is beginning to grow over the exposed substrate.
12 Gold Creek 15B SS N/C 141.5 138 Slough 15B was a continuation of Slough 16 in 1983. By 2012, the channel has been encroached by vegetation and all that remains of the slough is an AOW at its downstream end.
13 Indian River
17 US US 142.5 139
The slough shape and wetted area is approximately the same from 1983 to 2012. A narrow strip of wetted area that extends near the upstream side channel has been further delineated in 2012 although it was present but not delineated in 1983. Thick vegetation surrounded this slough in 1983 and 2012.
13 Indian River
18 N/C N/C 142.6 139.1 This slough was identified by the ARLIS 2945 mapbook for a 23,000 cfs flow but was not identified as a slough in 1983 or 2012 aerials at their respective flows of 12,500 cfs and 12,900 cfs. A small wetted area existed at the downstream end of this channel in 1983 but was not delineated.
14 Slough 21 19 SS N/C 143.1 139.7
This side slough comprised the downstream portion of the Slough 19. In 1983, the side slough ran along the left bank of the main channel. The upper portion of Slough 19, classified as an upland slough, drained into this side slough that had a head of exposed substrate (island-like) with a 60 ft diameter of vegetation upon the substrate "island". In 2012, the side slough exposed substrate had been washed away along with the side slough itself.
14 Slough 21 19 US US 143.2 139.8
In 1980s, the upland slough was surrounded by dense vegetation and trees. Pockets of exposed substrate populated the slough. The slough mouth contained channel-wide exposed substrate. The upland slough maintained channel-wide substrate at its mouth that inhibits open flow into the main channel. A dense riparian boundary remains along the slough and the wetted slough has widened to this riparian extent eliminating any visible exposed substrate.
14 Slough 21 20 SS SS 143.6 140.2
This 1980s slide slough branched from the main channel at its head with approximately 350 feet long by 60 feet wide (slough width) of exposed substrate. The wetted slough contained thin exposed substrate regions that ran along the slough body. The slough flowed around a large densely vegetated island before draining into the main channel, creating a delta-like collection of exposed substrate. By 2012 the exposed substrate of the slough had been mostly washed away. Exposed substrate regions along the slough body are not visible from the 2012 aerials. The mouth of the slough has become more pronounced and drains into the main channel saddled by two fairly large regions (55 x 400 ft) of exposed substrate. The overall wetted surface area has increased in 2012.

TECHNICAL MEMORANDUM AQUATIC MACROHABITAT TYPES
Susitna-Watana Hydroelectric Project Alaska Energy Authority FERC Project No. 14241 Page 61 February 2013
Habitat Site
Slough
Classification Location
Notes Number Name 1980s 2012 PRM RM
14 Slough 21 21 SS SS 145.5 141.9
The wetted habitat of this side slough was up to 160 feet wide in regions. It existed within a reach of exposed substrate and vegetated islands along the left bank. Almost a fifth of a mile in exposed side slough substrate at the slough head divided wetted habitat from the main channel extents. The lower region of the side slough encounters a side channel and then cuts around a vegetated island before discharging into the main channel. In 2012 the side slough roughly maintains its shape as it flows through the exposed substrate and vegetated region along the left bank. A small finger of the side slough at its lower limits has been identified since 1980.
15 Slough 22 22 SS SS 148.2 144.7
The side slough has a large region of exposed substrate at its head in 1983. This exposed region is maintained in 2012. The body of the slough runs around a vegetated island and drains into the main channel between two large regions of exposed substrate in1983. In 2012 the side slough maintained these characteristics with the exception that vegetation is beginning to cover the exposed regions.
TECHNICAL MEMORANDUM AQUATIC MACROHABITAT TYPES
Susitna-Watana Hydroelectric Project Alaska Energy Authority FERC Project No. 14241 Page 62 February 2013
This page intentionally left blank.

TECHNICAL MEMORANDUM AQUATIC MACROHABITAT TYPES
Susitna-Watana Hydroelectric Project Alaska Energy Authority FERC Project No. 14241 Page 63 February 2013
Table 6.1-6. Comparison of changes from 1983 to 2012 at specific tributaries, sloughs, or side channels in the Lower Susitna River.
Habitat Site Specific Habitat
Location
Classification Location
Notes Number Name 1980s 2012 PRM RM
1 SC IV-4 Hooligan Channel SSC SSC 40 36 Vegetation has developed in 2012 where the gravel bars were located in 1983 throughout Hooligan Channel. The channel itself no longer has any attached or midstream gravel bars. None of the logjams present in 1983 were present in 2012.
1 SC IV-4 Eagles Nest Side
Channel SSC SSC 40 36
As with Hooligan Creek, vegetation has developed on the gravel bars along the length of Eagles Nest Side Channel. The channel has slightly widened in 2012. There are also fewer instances of exposed substrate within the channel.
2 Willow Creek
Willow Creek TR TR 55 49.1
Changes in the channel and surrounding vegetation from 1983 to 2012 were mostly minor. The tributary is also wider in 2012. There is some slight migration in the upstream portion of Willow Creek. Willow Creek enters the control area in 2012 north of its position in 1983, due to the channel having cut through the vegetated area between the bend. The tributary in 2012 has considerably less exposed substrate than in 1983.
2 Willow Creek
Little Willow Creek TR TR 54 50.5 The channel and surrounding vegetation in 2012 itself has changed very little since 1983, however the lower extent of the tributary extends further south in 2012. This portion of the channel is clearly turbid in 1983, and clear in 2012.
3 Goose Creek
Goose Creek TR TR 77 72
Goose Creek has noticeably migrated since 1983, with sinuosity increasing. Several gravel bars are present in 2012 that were not present in 1983. The clear water plume at the tributary mouth is larger in 2012 than in 1983. Logjams are present at the upstream part of the creek within the site, approximately 325 ft from the control area boundary.
3 Goose Creek
Chum Channel SS SSC 73.5 70
Chum Channel is much more clearly defined in 2012 than in 1983. Vegetation has developed on large portions of the upstream end of the channel which had been exposed substrate in 1983, as well as the gravel bars along the length of the channel. No substrate is exposed in 2012.
4 Montana
Creek Montana Creek TR TR 81 77
A larger amount of flow has been diverted though the two large channels at the mouth of Montana Creek, substantially altering the flow characteristics. The large area of exposed substrate at the mouth has been reduced from 1983 to 2012. A small amount of vegetation has developed on the remaining exposed substrate.
5 Sunshine Slough
Sunshine Creek TR TR 88.5 85.1 Sunshine Creek remains mostly unchanged from 1983 to 2012. The width of the channel is effectively the same, and vegetation is nearly the same. Even the log jam at the side channel entering Sunshine creek is nearly the same.
5 Sunshine Slough
Beaver Dam Slough
SS SS 90.5 86.5 The upper portion of the slough has remained unchanged since 1983. Vegetation has developed in the lower portion of the reach, where it had been exposed substrate in 1983.

TECHNICAL MEMORANDUM AQUATIC MACROHABITAT TYPES
Susitna-Watana Hydroelectric Project Alaska Energy Authority FERC Project No. 14241 Page 64 February 2013
Habitat Site Specific Habitat
Location
Classification Location
Notes Number Name 1980s 2012 PRM RM
5 Sunshine Slough
Sunrise Side Channel
SSC SS 91 87
Vegetation has developed in 2012 in two locations within Sunrise Side Channel in 2012 which had previously been exposed substrate. The water within the channel is less turbid in 2012, and has been classified as a clearwater/side slough, as opposed to the previous classification of secondary side channel. The channel itself has narrowed since 1983, and a connector channel to Sunset Side Channel has been abandoned.
5 Sunshine Slough
Sunset Side Channel
SSC SSC 91 87 Vegetation has developed along previously exposed areas on the left bank of Sunset Side Channel. Otherwise, the channel has remained relatively unchanged since 1983.
6 Sunshine Slough
Sucker Side Channel
SSC SSC 88.5 85.1 Sucker Side Channel was a small connector channel in 1983, and in 2012 is almost totally overgrown with vegetation and abandoned

TECHNICAL MEMORANDUM AQUATIC MACROHABITAT TYPES
Susitna-Watana Hydroelectric Project Alaska Energy Authority FERC Project No. 14241 Page 65 February 2013
Table 6.2-1. Relative proportion of aquatic macrohabitat types for sampled sites by reaches in the Middle Susitna River
Segment for 1983 and 2012, main channels and side channels tracked separately.
Proportion of Area for Aquatic Macrohabitat Type by Reach (%)
Main Channel Side Channel Side Slough Upland Slough Tributary Mouth
1983 2012 1983 2012 1983 2012 1983 2012 1983 2012
MR-5 (2 Sites)
97.6 99.0 0.0 0.0 0.0 0.0 0.0 0.0 2.4 1.0
MR-6 (10 Sites)
67.9 81.4 25.0 13.8 5.6 3.7 0.6 0.5 0.9 0.7
MR-7 (4 Sites)
71.8 91.4 26.0 7.1 0.8 0.4 1.2 0.9 0.2 0.2
MR-8 (1 Site)
53.4 82.5 40.5 12.2 5.4 3.3 0.6 1.2 0.0 0.8
Table 6.2-2. Relative proportion of aquatic macrohabitat types for sampled sites by reaches in the Middle Susitna River
Segment for 1983 and 2012, main channels and side channels combined.
Proportion of Area for Aquatic Macrohabitat Type by Reach (%)
Main Channel & Side Channel
Side Slough Upland Slough Tributary Mouth
1983 2012 1983 2012 1983 2012 1983 2012
MR-5 (2 Sites)
97.6 99.1 0.0 0.0 0.0 0.0 2.4 1.0
MR-6 (10 Sites)
92.9 95.2 5.6 3.7 0.6 0.5 0.9 0.7
MR-7 (4 Sites)
97.8 98.4 0.8 0.4 1.2 0.9 0.2 0.2
MR-8 (1 Site)
93.9 94.8 5.4 3.3 0.6 1.2 0.0 0.8

TECHNICAL MEMORANDUM AQUATIC MACROHABITAT TYPES
Susitna-Watana Hydroelectric Project Alaska Energy Authority FERC Project No. 14241 Page 66 February 2013
Table 6.2-3. Relative proportion of aquatic macrohabitat types for sampled sites in the Lower Susitna River Segment,
1983 and 2012.
Proportion of Area for Aquatic Macrohabitat Type by Site (%)
Main Channel Secondary Side
Channel Turbid Backwater Tributary Tributary Mouth
Clearwater/Side Slough
1983 2012 1983 2012 1983 2012 1983 2012 1983 2012 1983 2012
Site 1, SC IV-4 (LR-4)
49.2 51.3 47.8 47.8 0.6 0.4 0.0 0.0 0.0 0.0 2.4 0.5
Site 2, Willow Creek (LR-3)
19.2 0.0 66.0 66.6 0.7 0.0 10.1 27.8 1.9 1.5 2.0 4.2
Site 3, Goose Creek (LR-2)
38.0 34.2 43.7 17.9 2.8 0.9 4.6 0.5 0.6 0.4 10.4 46.1
Site 4, Montana Creek (LR-2)
77.1 62.2 11.5 31.1 0.0 0.0 5.2 1.2 0.4 5.0 5.8 0.5
Site 5, Sunshine Slough (LR-1)
39.1 59.1 57.4 37.1 1.2 0.0 0.5 0.4 0.2 0.3 1.6 3.0
TECHNICAL MEMORANDUM AQUATIC MACROHABITAT TYPES
Susitna-Watana Hydroelectric Project Alaska Energy Authority FERC Project No. 14241 Page 67 February 2013
9. FIGURES

TECHNICAL MEMORANDUM AQUATIC MACROHABITAT TYPES
Susitna-Watana Hydroelectric Project Alaska Energy Authority FERC Project No. 14241 Page 68 February 2013
This page intentionally left blank.

TECHNICAL MEMORANDUM AQUATIC MACROHABITAT TYPES
Susitna-Watana Hydroelectric Project Alaska Energy Authority FERC Project No. 14241 Page 69 February 2013
Figure 3.2-1. Susitna River Geomorphology study area and large-scale river segments.

TECHNICAL MEMORANDUM AQUATIC MACROHABITAT TYPES
Susitna-Watana Hydroelectric Project Alaska Energy Authority FERC Project No. 14241 Page 70 February 2013
Figure 4.2-1. 2012 Aerial photograph locations.

TECHNICAL MEMORANDUM AQUATIC MACROHABITAT TYPES
Susitna-Watana Hydroelectric Project Alaska Energy Authority FERC Project No. 14241 Page 71 February 2013
Figure 4.3-1. Surface area-discharge relationships at SC IV-4 habitat control area.

TECHNICAL MEMORANDUM AQUATIC MACROHABITAT TYPES
Susitna-Watana Hydroelectric Project Alaska Energy Authority FERC Project No. 14241 Page 72 February 2013
Figure 4.3-2. Application of scaling method to 2012 areas for turbid backwater features at SC IV-4.

TECHNICAL MEMORANDUM AQUATIC MACROHABITAT TYPES
Susitna-Watana Hydroelectric Project Alaska Energy Authority FERC Project No. 14241 Page 73 February 2013
Figure 6.2-1. Relative proportion of aquatic macrohabitat types for sampled sites in Geomorphic Reach MR-5 of the Middle Susitna River Segment for 1983 and 2012,
(top charts main channels and side channels combined / bottom charts main channels and side channels tracked separately).
97.6%
0.0% 0.0%
2.4%
1983 MR-5
99.1%
0.0% 0.0%
0.9%
2012 MR-5
Main Channel & SideChannel
Side Slough
Upland Slough
Tributary Mouth
97.6%
0.0%
0.0% 0.0% 2.4%
1983 MR-5
99.0%
0.0%
0.0% 0.0% 1.0%
2012 MR-5
Main Channel
Side Channel
Side Slough
Upland Slough
Tributary Mouth

TECHNICAL MEMORANDUM AQUATIC MACROHABITAT TYPES
Susitna-Watana Hydroelectric Project Alaska Energy Authority FERC Project No. 14241 Page 74 February 2013
Figure 6.2-2. Relative proportion of aquatic macrohabitat types for sampled sites in Geomorphic Reach MR-6 of the Middle Susitna River Segment for 1983 and 2012, (top charts main channels and side channels combined / bottom charts main channels and side channels tracked separately).
92.9%
5.6%
0.6% 0.9%
1983 MR-6
95.2%
3.7% 0.5% 0.7%
2012 MR-6
Main Channel & Side Channel
Side Slough
Upland Slough
Tributary Mouth
67.9%
25.0%
5.6% 0.6%
0.9%
1983 MR-6
81.4%
13.8%
3.7% 0.5% 0.7%
2012 MR-6
Main Channel
Side Channel
Side Slough
Upland Slough
Tributary Mouth

TECHNICAL MEMORANDUM AQUATIC MACROHABITAT TYPES
Susitna-Watana Hydroelectric Project Alaska Energy Authority FERC Project No. 14241 Page 75 February 2013
Figure 6.2-3. Relative proportion of aquatic macrohabitat types for sampled sites in Geomorphic Reach MR-7 of the Middle Susitna River Segment for 1983 and 2012,
(top charts main channels and side channels combined / bottom charts main channels and side channels tracked separately).
97.8%
0.8% 1.2% 0.2%
1983 MR-7
98.4%
0.4% 0.9% 0.2%
2012 MR-7
Main Channel & SideChannel
Side Slough
Upland Slough
Tributary Mouth
71.8%
26.0%
0.8% 1.2% 0.2%
1983 MR-7
91.4%
7.1%
0.4% 0.9%
0.2%
2012 MR-7
Main Channel
Side Channel
Side Slough
Upland Slough
Tributary Mouth

TECHNICAL MEMORANDUM AQUATIC MACROHABITAT TYPES
Susitna-Watana Hydroelectric Project Alaska Energy Authority FERC Project No. 14241 Page 76 February 2013
Figure 6.2-4. Relative proportion of aquatic macrohabitat types for sampled sites in Geomorphic Reach MR-8 of the Middle Susitna River Segment for 1983 and 2012,
(top charts main channels and side channels combined / bottom charts main channels and side channels tracked separately).
93.9%
5.4% 0.6% 0.0%
1983 MR-8
94.8%
3.3% 1.2% 0.8%
2012 MR-8
Main Channel & SideChannel
Side Slough
Upland Slough
Tributary Mouth
53.4% 40.5%
5.4% 0.6% 0.0%
1983 MR-8
82.5%
12.2%
3.3% 1.2% 0.8%
2012 MR-8
Main channel
Side Channel
Side Slough
Upland Slough
Tributary Mouth

TECHNICAL MEMORANDUM AQUATIC MACROHABITAT TYPES
Susitna-Watana Hydroelectric Project Alaska Energy Authority FERC Project No. 14241 Page 77 February 2013
Figure 6.2-5. Relative proportion of aquatic macrohabitat types for Site 1 – SC IV-4 (LR-4), 1983 and 2012.
49.2%
47.8%
0.6% 0.0%
0.0% 2.4%
1983-Site 1
51.3% 47.8%
0.4%
0.0% 0.0% 0.5%
2012-Site 1
Main Channel
Secondary Side Channel
Turbid Backwater
Tributary
Tributary Mouth
Clear Water/Side Slough

TECHNICAL MEMORANDUM AQUATIC MACROHABITAT TYPES
Susitna-Watana Hydroelectric Project Alaska Energy Authority FERC Project No. 14241 Page 78 February 2013
Figure 6.2-6. Relative proportion of aquatic macrohabitat types for Site 2 – Willow Creek (LR-3), 1983 and 2012.
19.2%
66.0%
0.7%
10.1% 1.9%
2.0% 1983-Site 2
0.0%
66.6%
0.0%
27.8%
1.5% 4.2%
2012-Site 2
Main Channel
Secondary Side Channel
Turbid Backwater
Tributary
Tributary Mouth
Clear Water/Side Slough

TECHNICAL MEMORANDUM AQUATIC MACROHABITAT TYPES
Susitna-Watana Hydroelectric Project Alaska Energy Authority FERC Project No. 14241 Page 79 February 2013
Figure 6.2-7. Relative proportion of aquatic macrohabitat types for Site 3 – Goose Creek (LR-2), 1983 and 2012.
38.0%
43.7%
2.8%
4.6% 0.6%
10.4%
1983-Site 3
34.2%
17.9% 0.9% 0.5%
0.4%
46.1%
2012-Site 3
Main Channel
Secondary Side Channel
Turbid Backwater
Tributary
Tributary Mouth
Clear Water/Side Slough

TECHNICAL MEMORANDUM AQUATIC MACROHABITAT TYPES
Susitna-Watana Hydroelectric Project Alaska Energy Authority FERC Project No. 14241 Page 80 February 2013
Figure 6.2-8. Relative proportion of aquatic macrohabitat types for Site 4 – Montana Creek (LR-2), 1983 and 2012.
77.1%
11.5%
0.0% 5.2%
0.4% 5.8%
1983-Site 4
62.2%
31.1%
0.0% 1.2%
5.0% 0.5% 2012-Site 4
Main Channel
Secondary Side Channel
Turbid Backwater
Tributary
Tributary Mouth
Clear Water/Side Slough

TECHNICAL MEMORANDUM AQUATIC MACROHABITAT TYPES
Susitna-Watana Hydroelectric Project Alaska Energy Authority FERC Project No. 14241 Page 81 February 2013
Figure 6.2-9. Relative proportion of aquatic macrohabitat types for Site 5 – Sunshine Slough (LR-1), 1983 and 2012.
39.1%
57.4%
1.2% 0.5%
0.2% 1.6%
1983-Site 5
59.1%
37.1%
0.0%
0.4%
0.3%
3.0%
2012-Site 5
Main Channel
Secondary Side Channel
Turbid Backwater
Tributary
Tributary Mouth
Clear Water/Side Slough