Embed Size (px)
Citation preview
BUFFALO FISCAL STABILITY AUTHORITY
BOARD OF DIRECTORS MEETING
March 18, 2020
BUFFALO FISCAL STABILITY AUTHORITY March 18, 2020 Audit, Finance and Budget Committee ~ 12:30 PM Board Meeting ~ 1:00 PM Market Arcade Building, 617 Main Street, 1st Floor Conference Room Buffalo, New York 14203
Audit, Finance and Budget Committee ~ 12:30 PM
TAB 1
Roll Call of Committee Members Approval of September 23, 2019 Meeting Minutes [RESOLUTION] Review of BFSA 2020-21 Preliminary Budget and 2021-2024 Financial Plan [RESOLUTION] Approval of BFSA Audit Engagement [RESOLUTION] Internal Controls Reports
Board Meeting ~ 1:00 PM
TAB 2
Opening Remarks Roll Call of Directors Approval of December 12, 2019 Minutes Approval of February 25, 2020 Minutes
TAB 3 City Items Review of the 2nd Quarter Report Review of Impact of the New York State Executive Budget
TAB 4
Buffalo City School District Review of the 2nd Quarter Report Review of Impact of the New York State Executive Budget Analysis of the Update to the 2020-2023 Financial Plan
TAB 5 Buffalo Urban Renewal Agency Financial Statement Review Review of the 2nd Quarter Report
TAB 6 Buffalo Municipal Housing Authority Review of the 2nd Quarter Report 2019-20 Capital Plan
TAB 7
Left intentionally blank
Privilege of the Floor OTHER BUSINESS AND ANNOUNCEMENTS Note: Meetings may be rescheduled based on Directors availability
Upcoming Events Date Location
Audit, Finance & Budget Committee ~ 12:30 PM Full Board Meeting ~ 1:00 PM
Wednesday, May 20, 2020
Market Arcade Building
617 Main Street 1st Floor Conference Room Buffalo, New York 14203 Audit, Finance & Budget Committee ~ 12:30 PM
Full Board Meeting ~ 1:00 PM Wednesday, June 24, 2020
0
[RESOLUTION]
1
BUFFALO FISCAL STABILITY AUTHORITY
Audit, Finance and Budget Committee Meeting Minutes
September 23, 2019
The following are the minutes from the meeting of the Audit, Finance and Budget Committee (the “Committee”) of the Buffalo Fiscal Stability Authority (the “BFSA”) held on Monday, September 23, 2019, in the first-floor conference room of the Buffalo Market Arcade Complex. The meeting was called to order at 12:48 P.M. Committee Members Present
Committee Chair R. Nils Olsen, Jr. Director Frederick G. Floss Additional Directors Present
Secretary George K. Arthur Director Dottie E. Gallagher Mayor Byron Brown (Estrich) Committee Member Excused
Interim Vice-Chair Jeanette T. Jurasek Staff Present
Executive Director Jeanette M. Robe Principal Analyst/Media Liaison Bryce E. Link Senior Analyst II/Manager of Technology Nathan D. Miller Administrative Assistant Nikita M. Fortune Additionally Present
Sara M. Dayton, CPA Partner, Lumsden & McCormick, LLP Richard A. Grimm, III, Esq., Magavern Magavern & Grimm LLP Opening Remarks
Committee Chair Olsen opened the meeting, welcomed the attendees, and reviewed the agenda.
Roll Call
Chair Olsen called a roll of the members, and finding a quorum present, the meeting commenced. Approval of Minutes Committee Chair Olsen introduced AFB Resolution No. 19-05: “Approval of June 17, 2019 Meeting Minutes,” and requested a motion to approve. Director Floss made a motion to approve AFB Resolution No. 19-05. Committee Chair Olsen seconded the motion.
The Committee voted 2-0 to approve AFB Resolution No. 19-05.
2
Presentation of BFSA’s Fiscal Year 2019 Independent Auditors’ Report by Lumsden
McCormick, LLP
Committee Chair Olsen noted the receipt of the independent audit of the BFSA for the fiscal year ended June 30, 2019 and stated the draft financial statements had been provided in the Board books for review. Upon full Board approval, they will be issued in “final form.” Ms. Sara Dayton, a partner of Lumsden McCormick, LLP, was then given the floor to present the audit findings. Ms. Dayton stated the audit went very well and there were no surprises or issues to be reported. BFSA was granted an unmodified opinion, which is a clean opinion on the financial statements. Ms. Dayton explained the financial statements are required to be reported on both a government-wide basis and a fund basis. The government-wide basis reflects all debt including long-term debt, long-term liabilities, receivables and capital assets. BFSA’s net position for 2019 totaled a slight deficit of $132,000 with a restricted portion of $5.8M which mainly represents cash and investments at June 30, 2019 less interest payable in the debt service fund. The real net impact is approximately zero based on timing. There was a change in net position of $526,000 from 2018. Ms. Dayton stated reported revenue reflects continued improvement in sales tax which increased 3.9%, or $5.1M, over the prior year. New York State Aid and Incentives for Municipalities (“State AIM”) remained the same as in the prior year. Distributions to the City of Buffalo (“City”) and Buffalo City School District (“District”) increased as the payments reflect the transmittal of remaining sales tax proceeds, which increased over last year. General and administrative expenses increased by $89,000 due to salary increases of $14,000, increases in health insurance premiums, the composition of single vs. family plans provided to employees and the increase in the OPEB liability, which is a non-cash actuarial adjustment. The change in net position year to year on a government-wide basis was a decrease of $526,000. Ms. Dayton advised that Governmental Accounting Standards Board Statement No. 88 (“GASB 88”) was implemented and affected the debt disclosures; specifically, a disclosure was added that debt is secured by future sales tax and state aid. Ms. Dayton stated there were no difficulties performing the audit. Any suggested adjustments were posted by BFSA’s management. No material weaknesses were found. Ms. Dayton advised GASB Statement No. 87 will be implemented in 2021 which will recognize all leases as capital leases and therefore will be reflected on the balance sheet as a right of use asset, a lease liability and amortized over the life of the lease term. Director Floss asked if GASB Statement No. 87 will cause a significant impact. Ms. Dayton responded the impact should be minimal unless there are significant accelerators within the lease agreement. Committee Chair Olsen thanked Ms. Dayton for her presentation. He requested a motion to accept the audit’s findings and to send the audit to the full Board with a recommendation for approval.
3
Director Floss made the requested motion. Committee Chair Olsen seconded the motion. The Committee voted 2-0 to accept the audit’s findings and to send the audit to the full Board with a recommendation for approval. BFSA Annual Report
Committee Chair Olsen advanced the agenda to the review of the BFSA Annual Report to be presented by BFSA Executive Director Ms. Jeanette M. Robe. Director Gallagher entered the meeting at 1:02 P.M. Ms. Robe gave an overview of the components of the BFSA Annual Report which aligns with the requirements of New York State Public Authorities Law and summarizes the accomplishments of the most recent fiscal year ended June 30, 2019. The three main sections of the report are: I. Organizational:
• Information on Board members and staff
• Background information on BFSA
• Mission Statement, general governance and administration information II. Accomplishments:
• Discussion on progress towards fiscal stability by the City of Buffalo and the covered organizations:
o the Buffalo City School District (the “BCSD”) o the Buffalo Municipal Housing Authority (the “BMHA”) o the Buffalo Urban Renewal Agency (“BURA”)
• Discussion on the significance of the multi-year financial planning process as representing the core of BFSA’s financial oversight by the City of Buffalo (the “City”) and the covered organizations.
• A description of each report issued by BFSA over the last year is provided along with recommendations and comments
• Other areas of fiscal monitoring conducted by BFSA, such as the monitoring of workforce trends, are included
• Cumulative financial impact schedule which indicates the total impact of the BFSA as of June 30, 2019 of $458.5M. The City and District’s estimated cumulative financial impact from the wage freeze is $240.4M
III. The four individual reports on the review and analysis of the final budgets and four-year
financial plans for each entity.
4
Ms. Robe stated the annual report will be filed with the New York State (“NYS”) Comptroller, other NYS officials as required by law, as well as posted on the BFSA website. Ms. Robe thanked Mr. Bryce Link for his extensive work on compiling the annual report.
Committee Chair Olsen highlighted BFSA’s continuing impact as an advisory board on the City’s improved bond rating. Director Floss stated the advisory status of the Board has also had a positive impact on the covered organizations and asked if the covered organization will receive copies of the BFSA annual report. Ms. Robe stated she would ensure each entity receives a copy.
BFSA Investment Report
Ms. Robe stated there have been no changes to the investment guidelines which were last reviewed at the July 29, 2019 board meeting. The summary of the investment activity has also been reported in the audited financial statements. Total cash and investments were $6.4M at cost and $6.5M at fair market value at June 30, 2019. All investments mature no later than August 30, 2019 with the exception of one investment in State and Local Government treasury securities of $135,000 which matures September 1, 2021. This investment was structured to avoid any yield restrictions associated with the BFSA 2015A refunding bond. Total investment earnings for the year were $199,555; interest earnings are remitted to the City periodically. The majority was earned on forward delivery agreements, providing guaranteed interest rates ranging between 4.48% and 5.13%, which continues to exceed the market and assists in reducing overall debt costs. The funds are remitted biannually to the City. There were no investment fees or commission paid with respect to the investment portfolio for 2018-19. Trustee fees were reported as $8,790. No fees were paid on operating accounts as the fees were covered by the compensating balances. Hearing no questions or comments, Committee Chair Olsen requested a motion to approve both the BFSA Annual Report and the BFSA Annual Investment Report. Director Floss made a motion to approve both the 2019 BFSA Annual Report and Annual Investment Report. Committee Chair Olsen seconded the motion. The Committee voted 2-0 to accept both the annual report and the investment report.
5
PFM Financial Advisors
Committee Chair Olsen introduced AFB Resolution No. 19-06: “Approve Engagement of Public Financial Management as Financial Advisors.” Public Financial Management (“PFM”) served as the financial advisor for the BFSA’s period of issuing debt on behalf of the City and retains the historical knowledge related to these complex transactions. The engagement serves for October 1, 2019 through September 30, 2020 and would extend the terms of the original contract from 2018. Director Floss made a motion to approve AFB Resolution No. 19-06. Committee Chair Olsen seconded the motion. The Committee voted 2-0 to approve AFB Resolution No. 19-06.
Adjournment
Committee Chair Olsen asked if there was additional business to be considered by the Committee. Director Floss offered a motion to adjourn. Committee Chair Olsen seconded the motion. The Committee voted 2-0 to adjourn the meeting. The Committee adjourned 1:10 P.M.
BUFFALO FISCAL STABILITY AUTHORITY AUDIT, FINANCE & BUDGET COMMITTEE RESOLUTION NO. 20-01
APPROVING MINUTES AND RESOLUTIONS FROM
SEPTEMBER 23, 2019
BE IT RESOLVED that the Buffalo Fiscal Stability Authority’s Audit, Finance and
Budget Committee approves the minutes of its meeting on September 23, 2019.
BE IT FURTHUR RESOLVED that the Buffalo Fiscal Stability Authority’s Audit, Finance and
Budget Committee ratifies and affirms Resolution Nos. 19-05 and 19-06 which were
approved as of said date.
This resolution shall take effect immediately.
Approved March 18, 2020
Frederick G. Floss
Committee Chair Pro Tem
BUFFALO FISCAL STABILITY AUTHORITY
2021-2024
PRELIMINARY BUDGET AND FINANCIAL PLAN
BUFFALO FISCAL STABILITY AUTHORITY
ii
Buffalo Fiscal Stability Authority
Authority Directors and Staff as of March 18, 2020
Directors
R. Nils Olsen, Jr., Chair
Jeanette T. Jurasek, Interim Vice-Chair
George K. Arthur, Secretary
Frederick G. Floss
Byron W. Brown (ex officio)
Mark C. Poloncarz (ex officio)
Staff
Jeanette M. Robe, CPA
Executive Director
Nikita M. Fortune, BA
Administrative Assistant
Bryce E. Link, MPA
Principal Analyst/Media Contact/Treasurer
Nathan D. Miller, BS
Senior Analyst/Manager of Technology
Claire A. Waldron, CPA
Comptroller
Contact
Market Arcade Building
617 Main Street, Suite 400
Buffalo, New York 14203
Phone: 716.853.0907
Media: 716.359.1443
Fax: 716.853.9052
Email: [email protected]
Web: www.bfsa.state.ny.us
iii
Table of Contents ORGANIZATION ............................................................................................................ 1
BUDGET PROCESS ........................................................................................................ 3
PRINCIPAL BUDGETARY ASSUMPTIONS AND ASSESSMENT
OF BUDGETARY RISKS ............................................................................................... 4
2021 PRELIMINARY BUDGET & RELATED FOUR-YEAR FINANCIAL PLAN 6
FORECASTED 2020 REVENUES AND EXPENDITURES ....................................... 8
NUMBER OF EMPLOYEES .......................................................................................... 9
STATEMENT OF BORROWED DEBT ........................................................................ 9
SCHEDULE OF LONG-TERM DEBT ........................................................................ 11
LONG-TERM DEBT-DEBT SERVICE REQUIREMENTS: ................................... 11
1
ORGANIZATION
The Buffalo Fiscal Stability Authority (“BFSA” or “Authority”) is a corporate governmental
agency and instrumentality of the State of New York constituting a public benefit corporation
created by the BFSA Act (the “Act”), Chapter 122 of the Laws of 2003, as amended from time to
time, and signed by the Governor on July 3, 2003. BFSA has a broad range of financial control
and oversight powers over the City of Buffalo (the “City”) and its non-exempted Covered
Organizations including the Buffalo Public School District (the “School District”), the Buffalo
Municipal Housing Authority, the Buffalo Urban Renewal Agency, the Joint Schools
Construction Board and other covered organizations as defined by the Act.
According to its enabling statute, BFSA will continue in existence until its oversight, control or
other responsibilities and its liabilities, which include the payment of BFSA bonds and notes,
have been met or discharged, which in no event may be later than June 30, 2037. In addition,
BFSA has certain powers under the Act to control, oversee and monitor the City’s finances,
including Covered Organizations, particularly during a “control period”, which began on the
effective date of the BFSA Act of July 3, 2003.
BFSA is governed by a board of nine directors, seven of which are to be appointed by the
Governor of the State. Of the seven directors appointed by the Governor, one must be a resident
of the City, one is to be appointed following the recommendation of the State Comptroller, and
one is to be appointed on the joint recommendation of the Speaker of the Assembly and the
Temporary President of the Senate. The Mayor of the City and the County Executive serve as ex
officio directors. The Governor designates the Chairperson and Vice Chair from among the
directors. Five directors constitute a quorum. All directors of BFSA serve without salary.
The Act provides for BFSA to have different financial control and oversight powers depending
upon whether the City’s financial condition causes it to be in a “control period” or an “advisory
period.”
Under the Act, BFSA began its existence during a City control period, which means that BFSA
commenced operation with its maximum authorized complement of financial control and
oversight powers. Under an advisory period, the BFSA operates with a reduced set of financial
oversight powers and responsibilities.
On May 29, 2012, BFSA made a determination that all provisions of the Act with respect to
transitioning into an advisory period had been met and resolved to enter into an advisory period
effective July 1, 2012. An advisory period shall continue through June 30, 2037, unless a control
period is reimposed.
2
After an advisory period has been established, a control period could be reimposed on the City
upon a determination by BFSA that a fiscal crisis is imminent or that any of the following events
has occurred or that there is a substantial likelihood and imminence of its occurrence: (a) the City
shall have failed to adopt a balanced budget, financial plan or budget modification as required by
Sections 3856 and 3857 of the Act; (b) the City shall have failed to pay the principal of or
interest on any of its bonds or notes when due; (c) the City shall have incurred an operating
deficit of one percent or more in the aggregate results of operations of any major fund of the City
or a Covered Organization during its fiscal year assuming all revenues and expenditures are
reported in accordance with generally accepted accounting principles, subject to the provisions
of the Act; (d) the chief fiscal officer’s certification at any time, at the request of BFSA or on the
chief fiscal officer’s initiative, which certification shall be made from time to time as promptly as
circumstances warrant and reported to BFSA, that on the basis of facts existing at such time such
officer could not make the certification described in subdivision one of Section 3851 of the Act;
or (e) the City shall have violated any provision of the Act.
During a control period, BFSA is empowered, among other things, (i) to approve or disapprove
contracts, including collective bargaining agreements to be entered into by the City or any
Covered Organization, binding or purporting to bind the City or any Covered Organization; (ii)
to approve or disapprove the terms of borrowings by the City and Covered Organizations; (iii) to
approve, disapprove or modify the City’s financial plans and take any action necessary in order
to implement the financial plan should the City or any Covered Organization fail to comply with
any material action necessary to fulfill the plan, including issuing binding orders to the
appropriate local officials; (iv) to set a maximum level of spending for any proposed budget of
any Covered Organization; (v) to impose a wage or hiring freeze, or both, with respect to
employees of the City or any Covered Organization; (vi) to review the operation, management,
efficiency and productivity of the City and any Covered Organization; and (vii) to terminate the
control period upon finding that no condition exists which would permit imposition of a control
period, provided that budgetary operations for the prior three years were balanced without
Authority assistance.
During an advisory period, as defined in the Act, BFSA is empowered, among other things, (i) to
review the operation, management, efficiency and productivity of City operations and of any
Covered Organization’s operations, and to make reports and recommendations thereon; (ii) to
review and comment on the budget, financial plan and financial plan modifications of the City
and any of the Covered Organization’s; (iii) to audit compliance with the City and any of the
Covered Organization’s financial plans; (iv) to review and comment on the terms of any
proposed borrowing, including the prudence of each proposed issuance of bonds or notes by the
City; (v) to assess and comment on the impact of any collective bargaining agreement to be
entered by the City; and (vi) to impose a control period upon making one of the statutory
findings.
3
Revenues of BFSA consist of state aid, sales tax revenue and investment earnings on funds
deposited in BFSA bank accounts and on set-aside funds deposited with the bond trustee to pay
bond interest and principal payments. Revenues of BFSA that are not required to pay operating
expenses and other costs of BFSA are payable to the City and the School District as frequently as
practicable.
BUDGET PROCESS
Adopted Budget and Financial Plan
BFSA’s adopted budget and financial plan are prepared in accordance with accounting principles
generally accepted in the United States of America on a full accrual basis, but also include
information for cash basis accounting as necessary. Comparative amounts for the fiscal year
ended June 30, 2019 were derived from BFSA’s audited financial statements, copies of which
were previously delivered to the BFSA’s Board of Directors and approved by Resolution No. 19-
24 on September 23, 2019. Amounts budgeted for fiscal year ending June 30, 2021 and forecasts
included in the financial plan have been developed using assumptions and methods of estimation
disclosed in budget and financial plan notes and sections herein. Working papers that document
the reasonable assumptions and methods of estimation, consistent with prudent budgetary
practices, have been prepared contemporaneously with the plan and will be maintained by
BFSA.
The proposed budget and financial plan is submitted to BFSA’s Audit, Finance and Budget
Committee and also to the Board of Directors for review no later than 60 days prior to the
commencement of its next fiscal year along with a certification by BFSA’s Executive Director
attesting to the reasonableness of the assumptions and methods of estimation used to prepare the
budget and financial plan. The proposed budget and financial plan is posted on BFSA’s website
and made available to the public for a period of not less than 45 days, at least 30 of which must
be prior to approval by the Board.
The budget and financial plan, and all amendments or modifications to the budget and financial
plan, are approved by the BFSA’s Board of Directors. Additionally, the final approved budget
and financial plan is posted to the BFSA website not less than 7 days before commencement of
the next fiscal year and is submitted to the State Comptroller within 7 days of approval.
Approved Budget and Financial Plan
BFSA staff provides the BFSA’s Board of Directors with quarterly updates on actual revenues
and expenses compared to annual budget targets. No later than 90 days after the close of each
fiscal year, BFSA staff report publicly on the prior year’s actual versus budgeted results. Should
any situation arise that has the potential to have a material, adverse effect on the approved budget
and financial plan, BFSA staff are required to notify the State Comptroller in writing of the
situation.
4
PRINCIPAL BUDGETARY ASSUMPTIONS AND ASSESSMENT OF BUDGETARY
RISKS
The budget and financial plan includes estimates developed using assumptions as disclosed in
notes to the plan. Estimates are subject to risk due to assumptions made about future scenarios.
State aid and sales tax receipt estimates constitute the majority of BFSA’s budgeted and
forecasted revenue. State aid is forecasted at amounts consistent with the Governor’s Executive
Budget. Sales tax revenue is conservatively projected at levels consistent with the 2020
forecasted sales tax revenue amount and held flat over the out-years of the financial plan. Sales
tax receipts are sensitive to the fluctuations in economic activity in the City, which has gone
through numerous cycles of expansion and contraction over the years.
Investment income is earned by BFSA primarily from set-aside funds deposited with financial
services firms to pay the semi-annual interest payment and annual principal payment. These
funds are invested in accordance with forward delivery agreements and earn a guaranteed rate of
return on the investments. Investment income also includes investment earnings on funds
deposited in BFSA trustee accounts and bank accounts; these earnings are subject to fluctuation
due to the balances held by BFSA as well as changes in interest rates.
BFSA has a perfected interest in the state aid and sales tax collections for the City and the School
District and receives remittances from the NYS Department of Taxation and Finance for the
purpose of withholding debt service set-aside monies and expenses, prior to remittance to the
City and the School District. BFSA’s costs are closely monitored by BFSA staff. As a result,
there is little budget risk to BFSA or its bond holders.
No material non-recurring resources or transactions that shift material resources from one year to
another or from reserves are included in this preliminary budget or financial plan.
Approximately 64% of total budgeted operating expenses represents staff related costs. The
budget includes five budgeted positions, all of which are filled. There is a 2% salary increase
budgeted for each position annually. Staff related costs also include employee benefits such as
health insurance, pension expense and payroll taxes. Employee health insurance is budgeted at
current rates and is projected to increase by 5.5% annually over the course of the financial plan;
this projected increase is based on recent historical experience as well as available market data.
Pension expense is determined based on the projected contribution rates as provided by the New
York State Comptroller.
Professional fees are the second largest category of operating expenses, representing
approximately 27% of the total budget. This category includes amounts budgeted for litigation,
general legal counsel services, the independent audit, trustee fees and bank charges, and other
professional fees. This category is estimated based on past historical experience and
conservatively includes amounts so that in the event such services are necessary, there are
adequate amounts budgeted.
5
All other operating expenses represent approximately 9% of the total budget for operating
expenses. The BFSA operates as leanly as possible, understanding that fiscal constraint is
extraordinarily important.
Salaries expense is budgeted to decrease 1.6% as compared to prior year. The BFSA was able to
replace the full-time budgeted position for Comptroller with a part-time position, resulting in the
year-to-year decrease. There were no other significant fluctuations noted from last year’s final
budget.
After amounts are retained for debt service, operating expenses, and for any other purpose as
provided for in New York State law, sales taxes are remitted as soon as practical to the City of
Buffalo and the Buffalo City School District. Those amounts are represented as Distributions
within the Adopted Budget.
6
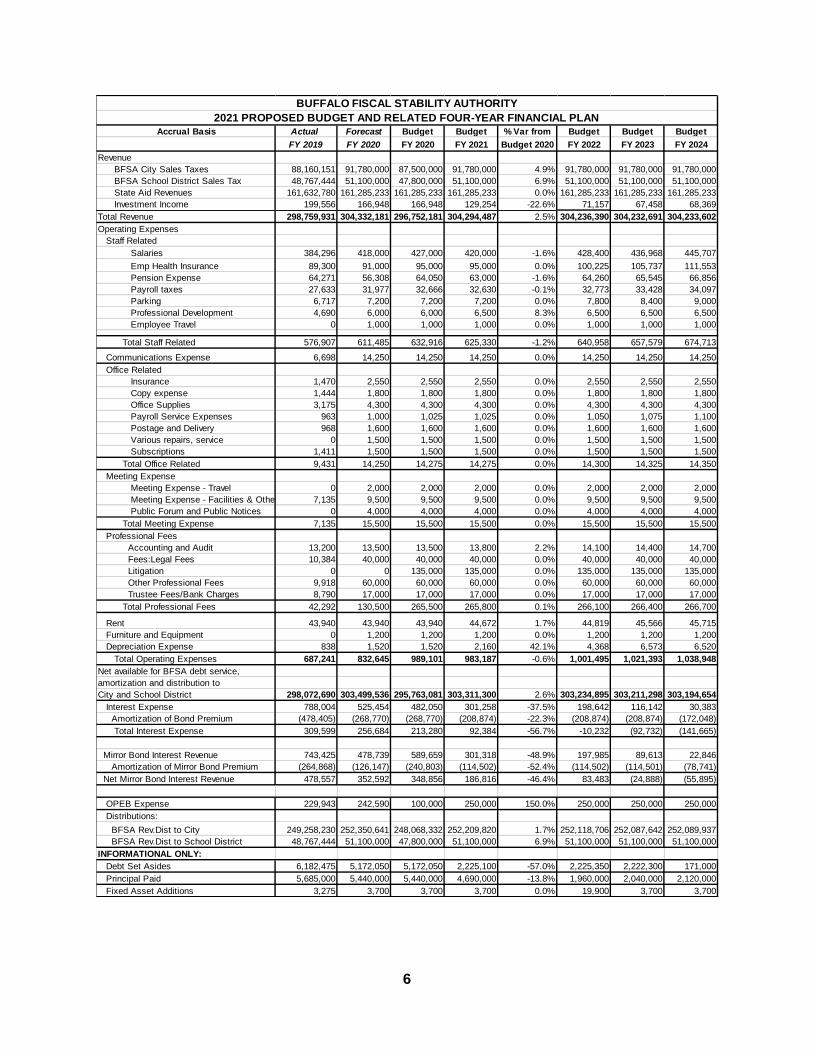
Accrual Basis Actual Forecast Budget Budget % Var from Budget Budget Budget
FY 2019 FY 2020 FY 2020 FY 2021 Budget 2020 FY 2022 FY 2023 FY 2024
Revenue
BFSA City Sales Taxes 88,160,151 91,780,000 87,500,000 91,780,000 4.9% 91,780,000 91,780,000 91,780,000
BFSA School District Sales Tax 48,767,444 51,100,000 47,800,000 51,100,000 6.9% 51,100,000 51,100,000 51,100,000
State Aid Revenues 161,632,780 161,285,233 161,285,233 161,285,233 0.0% 161,285,233 161,285,233 161,285,233
Investment Income 199,556 166,948 166,948 129,254 -22.6% 71,157 67,458 68,369
Total Revenue 298,759,931 304,332,181 296,752,181 304,294,487 2.5% 304,236,390 304,232,691 304,233,602
Operating Expenses
Staff Related
Salaries 384,296 418,000 427,000 420,000 -1.6% 428,400 436,968 445,707
Emp Health Insurance 89,300 91,000 95,000 95,000 0.0% 100,225 105,737 111,553
Pension Expense 64,271 56,308 64,050 63,000 -1.6% 64,260 65,545 66,856
Payroll taxes 27,633 31,977 32,666 32,630 -0.1% 32,773 33,428 34,097
Parking 6,717 7,200 7,200 7,200 0.0% 7,800 8,400 9,000
Professional Development 4,690 6,000 6,000 6,500 8.3% 6,500 6,500 6,500
Employee Travel 0 1,000 1,000 1,000 0.0% 1,000 1,000 1,000
Total Staff Related 576,907 611,485 632,916 625,330 -1.2% 640,958 657,579 674,713
Communications Expense 6,698 14,250 14,250 14,250 0.0% 14,250 14,250 14,250
Office Related
Insurance 1,470 2,550 2,550 2,550 0.0% 2,550 2,550 2,550
Copy expense 1,444 1,800 1,800 1,800 0.0% 1,800 1,800 1,800
Office Supplies 3,175 4,300 4,300 4,300 0.0% 4,300 4,300 4,300
Payroll Service Expenses 963 1,000 1,025 1,025 0.0% 1,050 1,075 1,100
Postage and Delivery 968 1,600 1,600 1,600 0.0% 1,600 1,600 1,600
Various repairs, service 0 1,500 1,500 1,500 0.0% 1,500 1,500 1,500
Subscriptions 1,411 1,500 1,500 1,500 0.0% 1,500 1,500 1,500
Total Office Related 9,431 14,250 14,275 14,275 0.0% 14,300 14,325 14,350
Meeting Expense
Meeting Expense - Travel 0 2,000 2,000 2,000 0.0% 2,000 2,000 2,000
Meeting Expense - Facilities & Other 7,135 9,500 9,500 9,500 0.0% 9,500 9,500 9,500
Public Forum and Public Notices 0 4,000 4,000 4,000 0.0% 4,000 4,000 4,000
Total Meeting Expense 7,135 15,500 15,500 15,500 0.0% 15,500 15,500 15,500
Professional Fees
Accounting and Audit 13,200 13,500 13,500 13,800 2.2% 14,100 14,400 14,700
Fees:Legal Fees 10,384 40,000 40,000 40,000 0.0% 40,000 40,000 40,000
Litigation 0 0 135,000 135,000 0.0% 135,000 135,000 135,000
Other Professional Fees 9,918 60,000 60,000 60,000 0.0% 60,000 60,000 60,000
Trustee Fees/Bank Charges 8,790 17,000 17,000 17,000 0.0% 17,000 17,000 17,000
Total Professional Fees 42,292 130,500 265,500 265,800 0.1% 266,100 266,400 266,700
Rent 43,940 43,940 43,940 44,672 1.7% 44,819 45,566 45,715
Furniture and Equipment 0 1,200 1,200 1,200 0.0% 1,200 1,200 1,200
Depreciation Expense 838 1,520 1,520 2,160 42.1% 4,368 6,573 6,520
Total Operating Expenses 687,241 832,645 989,101 983,187 -0.6% 1,001,495 1,021,393 1,038,948
Net available for BFSA debt service,
amortization and distribution to
City and School District 298,072,690 303,499,536 295,763,081 303,311,300 2.6% 303,234,895 303,211,298 303,194,654
Interest Expense 788,004 525,454 482,050 301,258 -37.5% 198,642 116,142 30,383
Amortization of Bond Premium (478,405) (268,770) (268,770) (208,874) -22.3% (208,874) (208,874) (172,048)
Total Interest Expense 309,599 256,684 213,280 92,384 -56.7% -10,232 (92,732) (141,665)
Mirror Bond Interest Revenue 743,425 478,739 589,659 301,318 -48.9% 197,985 89,613 22,846
Amortization of Mirror Bond Premium (264,868) (126,147) (240,803) (114,502) -52.4% (114,502) (114,501) (78,741)
Net Mirror Bond Interest Revenue 478,557 352,592 348,856 186,816 -46.4% 83,483 (24,888) (55,895)
OPEB Expense 229,943 242,590 100,000 250,000 150.0% 250,000 250,000 250,000
Distributions:
BFSA Rev.Dist to City 249,258,230 252,350,641 248,068,332 252,209,820 1.7% 252,118,706 252,087,642 252,089,937
BFSA Rev.Dist to School District 48,767,444 51,100,000 47,800,000 51,100,000 6.9% 51,100,000 51,100,000 51,100,000
INFORMATIONAL ONLY:
Debt Set Asides 6,182,475 5,172,050 5,172,050 2,225,100 -57.0% 2,225,350 2,222,300 171,000
Principal Paid 5,685,000 5,440,000 5,440,000 4,690,000 -13.8% 1,960,000 2,040,000 2,120,000
Fixed Asset Additions 3,275 3,700 3,700 3,700 0.0% 19,900 3,700 3,700
BUFFALO FISCAL STABILITY AUTHORITY
2021 PROPOSED BUDGET AND RELATED FOUR-YEAR FINANCIAL PLAN
7
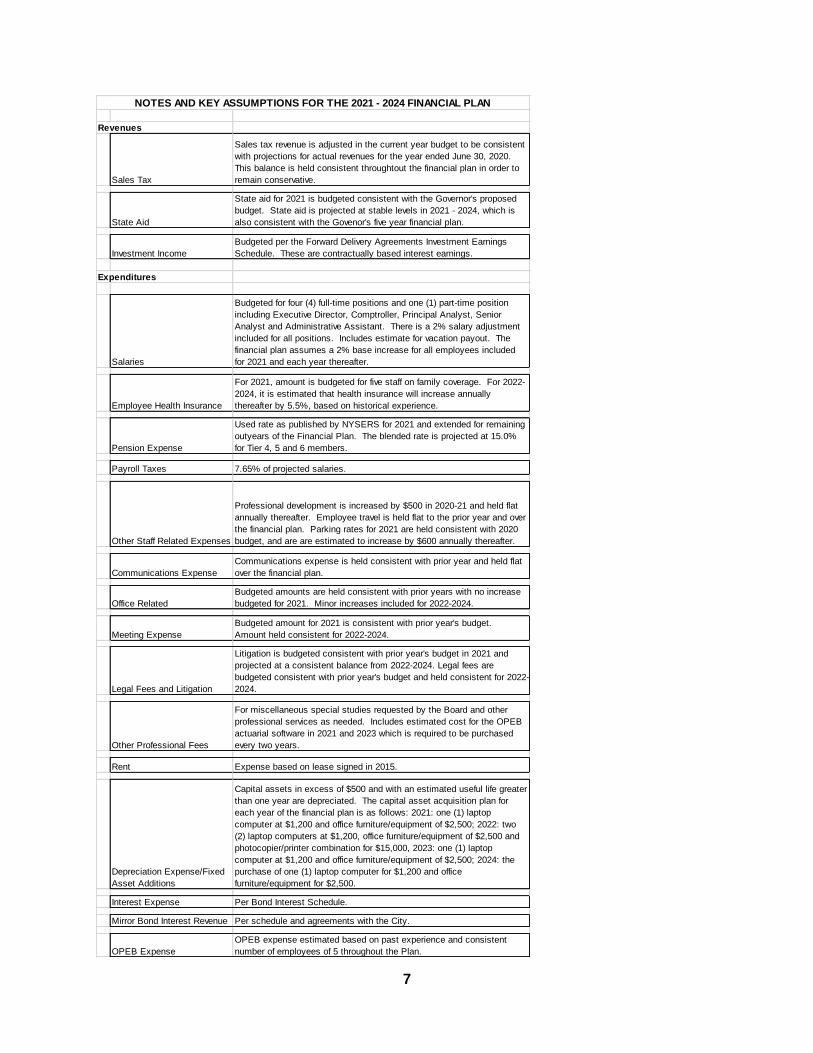
Revenues
Sales Tax
Sales tax revenue is adjusted in the current year budget to be consistent
with projections for actual revenues for the year ended June 30, 2020.
This balance is held consistent throughtout the financial plan in order to
remain conservative.
State Aid
State aid for 2021 is budgeted consistent with the Governor's proposed
budget. State aid is projected at stable levels in 2021 - 2024, which is
also consistent with the Govenor's five year financial plan.
Investment Income
Budgeted per the Forward Delivery Agreements Investment Earnings
Schedule. These are contractually based interest earnings.
Expenditures
Salaries
Budgeted for four (4) full-time positions and one (1) part-time position
including Executive Director, Comptroller, Principal Analyst, Senior
Analyst and Administrative Assistant. There is a 2% salary adjustment
included for all positions. Includes estimate for vacation payout. The
financial plan assumes a 2% base increase for all employees included
for 2021 and each year thereafter.
Employee Health Insurance
For 2021, amount is budgeted for five staff on family coverage. For 2022-
2024, it is estimated that health insurance will increase annually
thereafter by 5.5%, based on historical experience.
Pension Expense
Used rate as published by NYSERS for 2021 and extended for remaining
outyears of the Financial Plan. The blended rate is projected at 15.0%
for Tier 4, 5 and 6 members.
Payroll Taxes 7.65% of projected salaries.
Other Staff Related Expenses
Professional development is increased by $500 in 2020-21 and held flat
annually thereafter. Employee travel is held flat to the prior year and over
the financial plan. Parking rates for 2021 are held consistent with 2020
budget, and are are estimated to increase by $600 annually thereafter.
Communications Expense
Communications expense is held consistent with prior year and held flat
over the financial plan.
Office Related
Budgeted amounts are held consistent with prior years with no increase
budgeted for 2021. Minor increases included for 2022-2024.
Meeting Expense
Budgeted amount for 2021 is consistent with prior year's budget.
Amount held consistent for 2022-2024.
Legal Fees and Litigation
Litigation is budgeted consistent with prior year's budget in 2021 and
projected at a consistent balance from 2022-2024. Legal fees are
budgeted consistent with prior year's budget and held consistent for 2022-
2024.
Other Professional Fees
For miscellaneous special studies requested by the Board and other
professional services as needed. Includes estimated cost for the OPEB
actuarial software in 2021 and 2023 which is required to be purchased
every two years.
Rent Expense based on lease signed in 2015.
Depreciation Expense/Fixed
Asset Additions
Capital assets in excess of $500 and with an estimated useful life greater
than one year are depreciated. The capital asset acquisition plan for
each year of the financial plan is as follows: 2021: one (1) laptop
computer at $1,200 and office furniture/equipment of $2,500; 2022: two
(2) laptop computers at $1,200, office furniture/equipment of $2,500 and
photocopier/printer combination for $15,000, 2023: one (1) laptop
computer at $1,200 and office furniture/equipment of $2,500; 2024: the
purchase of one (1) laptop computer for $1,200 and office
furniture/equipment for $2,500.
Interest Expense Per Bond Interest Schedule.
Mirror Bond Interest Revenue Per schedule and agreements with the City.
OPEB Expense
OPEB expense estimated based on past experience and consistent
number of employees of 5 throughout the Plan.
NOTES AND KEY ASSUMPTIONS FOR THE 2021 - 2024 FINANCIAL PLAN
8
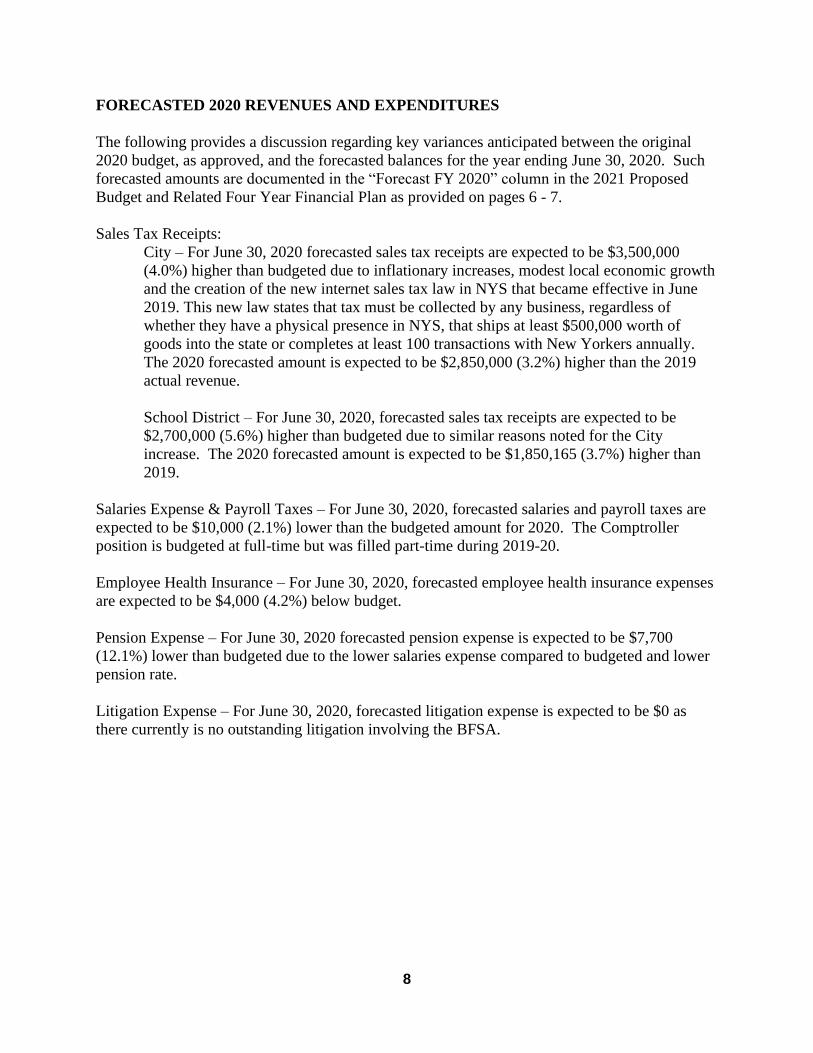
FORECASTED 2020 REVENUES AND EXPENDITURES
The following provides a discussion regarding key variances anticipated between the original
2020 budget, as approved, and the forecasted balances for the year ending June 30, 2020. Such
forecasted amounts are documented in the “Forecast FY 2020” column in the 2021 Proposed
Budget and Related Four Year Financial Plan as provided on pages 6 - 7.
Sales Tax Receipts:
City – For June 30, 2020 forecasted sales tax receipts are expected to be $3,500,000
(4.0%) higher than budgeted due to inflationary increases, modest local economic growth
and the creation of the new internet sales tax law in NYS that became effective in June
2019. This new law states that tax must be collected by any business, regardless of
whether they have a physical presence in NYS, that ships at least $500,000 worth of
goods into the state or completes at least 100 transactions with New Yorkers annually.
The 2020 forecasted amount is expected to be $2,850,000 (3.2%) higher than the 2019
actual revenue.
School District – For June 30, 2020, forecasted sales tax receipts are expected to be
$2,700,000 (5.6%) higher than budgeted due to similar reasons noted for the City
increase. The 2020 forecasted amount is expected to be $1,850,165 (3.7%) higher than
2019.
Salaries Expense & Payroll Taxes – For June 30, 2020, forecasted salaries and payroll taxes are
expected to be $10,000 (2.1%) lower than the budgeted amount for 2020. The Comptroller
position is budgeted at full-time but was filled part-time during 2019-20.
Employee Health Insurance – For June 30, 2020, forecasted employee health insurance expenses
are expected to be $4,000 (4.2%) below budget.
Pension Expense – For June 30, 2020 forecasted pension expense is expected to be $7,700
(12.1%) lower than budgeted due to the lower salaries expense compared to budgeted and lower
pension rate.
Litigation Expense – For June 30, 2020, forecasted litigation expense is expected to be $0 as
there currently is no outstanding litigation involving the BFSA.
9
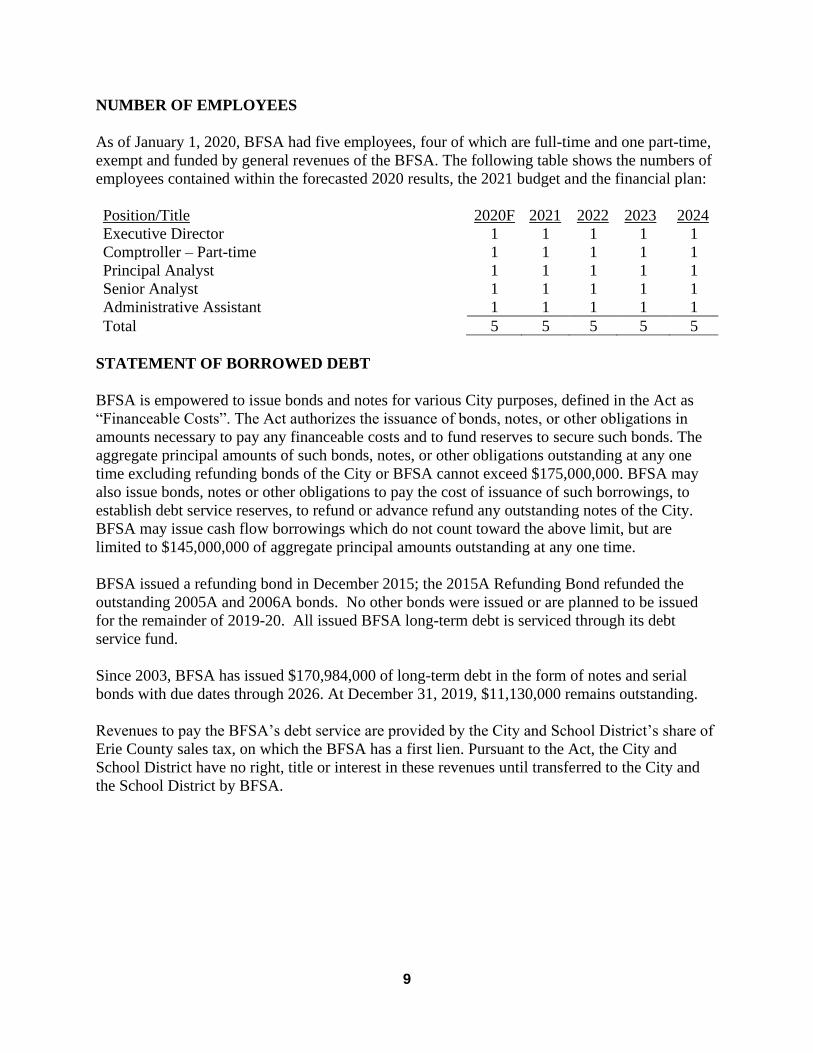
NUMBER OF EMPLOYEES
As of January 1, 2020, BFSA had five employees, four of which are full-time and one part-time,
exempt and funded by general revenues of the BFSA. The following table shows the numbers of
employees contained within the forecasted 2020 results, the 2021 budget and the financial plan:
Position/Title 2020F 2021 2022 2023 2024
Executive Director 1 1 1 1 1
Comptroller – Part-time 1 1 1 1 1
Principal Analyst 1 1 1 1 1
Senior Analyst 1 1 1 1 1
Administrative Assistant 1 1 1 1 1
Total 5 5 5 5 5
STATEMENT OF BORROWED DEBT
BFSA is empowered to issue bonds and notes for various City purposes, defined in the Act as
“Financeable Costs”. The Act authorizes the issuance of bonds, notes, or other obligations in
amounts necessary to pay any financeable costs and to fund reserves to secure such bonds. The
aggregate principal amounts of such bonds, notes, or other obligations outstanding at any one
time excluding refunding bonds of the City or BFSA cannot exceed $175,000,000. BFSA may
also issue bonds, notes or other obligations to pay the cost of issuance of such borrowings, to
establish debt service reserves, to refund or advance refund any outstanding notes of the City.
BFSA may issue cash flow borrowings which do not count toward the above limit, but are
limited to $145,000,000 of aggregate principal amounts outstanding at any one time.
BFSA issued a refunding bond in December 2015; the 2015A Refunding Bond refunded the
outstanding 2005A and 2006A bonds. No other bonds were issued or are planned to be issued
for the remainder of 2019-20. All issued BFSA long-term debt is serviced through its debt
service fund.
Since 2003, BFSA has issued $170,984,000 of long-term debt in the form of notes and serial
bonds with due dates through 2026. At December 31, 2019, $11,130,000 remains outstanding.
Revenues to pay the BFSA’s debt service are provided by the City and School District’s share of
Erie County sales tax, on which the BFSA has a first lien. Pursuant to the Act, the City and
School District have no right, title or interest in these revenues until transferred to the City and
the School District by BFSA.
10
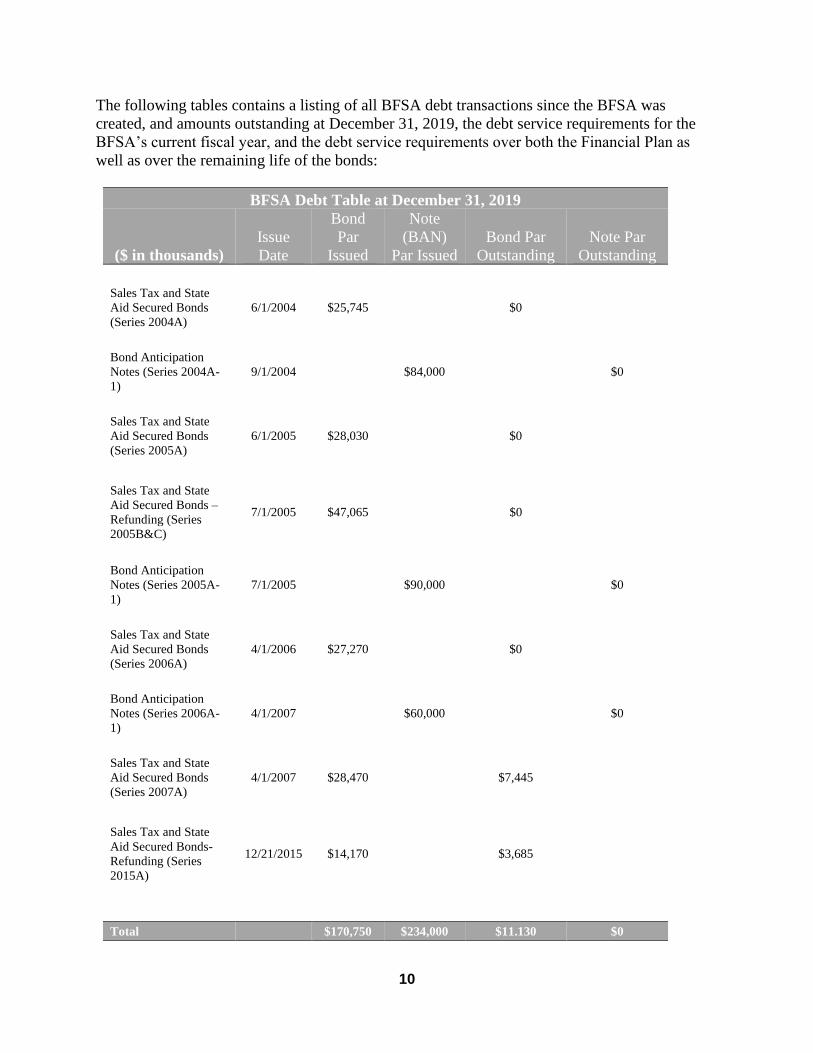
The following tables contains a listing of all BFSA debt transactions since the BFSA was
created, and amounts outstanding at December 31, 2019, the debt service requirements for the
BFSA’s current fiscal year, and the debt service requirements over both the Financial Plan as
well as over the remaining life of the bonds:
BFSA Debt Table at December 31, 2019
($ in thousands)
Issue
Date
Bond
Par
Issued
Note
(BAN)
Par Issued
Bond Par
Outstanding
Note Par
Outstanding
Sales Tax and State
Aid Secured Bonds
(Series 2004A)
6/1/2004 $25,745 $0
Bond Anticipation
Notes (Series 2004A-
1)
9/1/2004 $84,000 $0
Sales Tax and State
Aid Secured Bonds
(Series 2005A)
6/1/2005 $28,030 $0
Sales Tax and State
Aid Secured Bonds –
Refunding (Series
2005B&C)
7/1/2005 $47,065 $0
Bond Anticipation
Notes (Series 2005A-
1)
7/1/2005 $90,000 $0
Sales Tax and State
Aid Secured Bonds
(Series 2006A)
4/1/2006 $27,270 $0
Bond Anticipation
Notes (Series 2006A-
1)
4/1/2007 $60,000 $0
Sales Tax and State
Aid Secured Bonds
(Series 2007A)
4/1/2007 $28,470 $7,445
Sales Tax and State
Aid Secured Bonds-
Refunding (Series
2015A)
12/21/2015 $14,170 $3,685
Total $170,750 $234,000 $11.130 $0
11
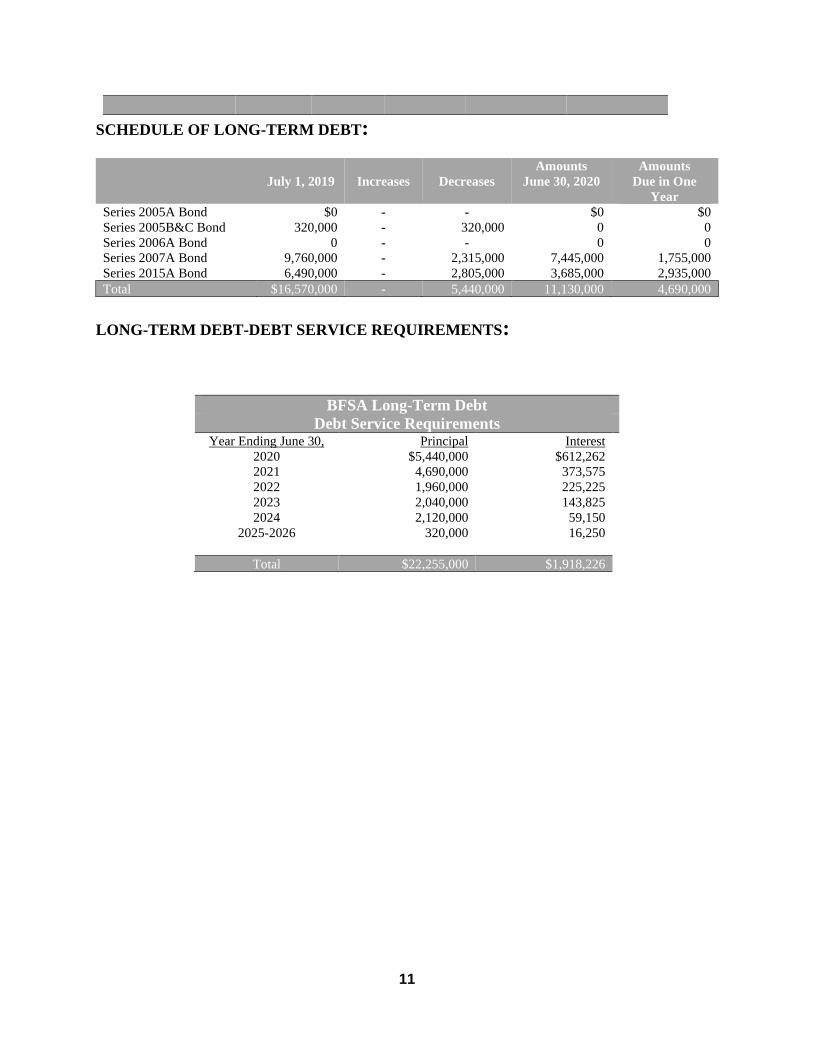
SCHEDULE OF LONG-TERM DEBT:
July 1, 2019
Increases
Decreases
Amounts
June 30, 2020
Amounts
Due in One
Year
Series 2005A Bond $0 - - $0 $0
Series 2005B&C Bond 320,000 - 320,000 0 0
Series 2006A Bond 0 - - 0 0
Series 2007A Bond 9,760,000 - 2,315,000 7,445,000 1,755,000
Series 2015A Bond 6,490,000 - 2,805,000 3,685,000 2,935,000
Total $16,570,000 - 5,440,000 11,130,000 4,690,000
LONG-TERM DEBT-DEBT SERVICE REQUIREMENTS:
BFSA Long-Term Debt
Debt Service Requirements Year Ending June 30, Principal Interest
2020 $5,440,000 $612,262
2021 4,690,000 373,575
2022 1,960,000 225,225
2023 2,040,000 143,825
2024 2,120,000 59,150
2025-2026 320,000 16,250
Total $22,255,000 $1,918,226
BUFFALO FISCAL STABILITY AUTHORITY
AUDIT, FINANCE AND BUDGET COMMITTEE
RESOLUTION NO. 20-XX
AUTHORIZE THE BFSA TO POST THE PRELIMINARY 2021 BUDGET AND RELATED
FOUR-YEAR FINANCIAL PLAN
WHEREAS, the Buffalo Fiscal Stability Authority (the “BFSA”) was created by Chapter 122 of the
Laws of 2003, as amended from time to time (“the BFSA Act”), to be a corporate governmental agency
and instrumentality of the State of New York constituting a public benefit corporation with a broad
range of financial control and oversight powers over the City of Buffalo; and
WHEREAS, the BFSA will have costs and expenses to operate and carry out its functions including, but
not limited to, paying the costs and expenses of its agents, employees, and facilities hereof,
reimbursement of costs incurred by Directors for actual and necessary expenses incurred in the
performance of such Director’s official duties, and otherwise to carry on and effectively carry out the
obligations required by the BFSA Act; and
WHEREAS, the staff of the BFSA has carefully reviewed the revenues to be received and expenses and
costs anticipated to be incurred in carrying out the duties and functions of the BFSA and has prepared a
budget (attached) based upon its reasonable assumptions of such revenues, costs and expenses; and
WHEREAS, the staff of the BFSA has forecasted revenues to be received and expenses and costs
anticipated in carrying out the duties and functions of the BFSA over the period for fiscal years 2021
through 2024; and
WHEREAS, consistent with the regulations of the Office of the State Comptroller, the BFSA will make
available proposed budgets and financial plans for public inspection at least 30 days before approval by
the Board, and not less than 60 days before the commencement of the next fiscal year, and for a period
of not less than 45 days.
NOW THEREFORE BE IT RESOLVED, that the Buffalo Fiscal Stability Authority’s Audit, Finance
and Budget Committee does hereby authorize the posting of the preliminary 2021 budget and related
four-year financial plan in a minimum of five separate locations of the Buffalo and Erie County Public
Library system for the next 45 days.
BE IT FURTHER RESOLVED, that the Buffalo Fiscal Stability Authority’s Audit, Finance and Budget
Committee does hereby authorize the posting of its preliminary 2021 budget and related four-year
financial plan on its website for the next 45 days.
This resolution shall take effect immediately.
Approved March 18, 2020
____________________________
Frederick G. Floss,
Committee Chair Pro Tem
1
BUFFALO FISCAL STABILITY AUTHORITY
Meeting Minutes
December 12, 2019
The following are the minutes from the meeting of the Buffalo Fiscal Stability Authority (the
“BFSA” or the “Authority”) held on Thursday, December 12, 2019 in the first-floor conference
room of the Buffalo Market Arcade Complex. The meeting was called to order at 1:04 PM.
Board Members Present
Chair R. Nils Olsen, Jr. (via video)
Interim Vice-Chair Jeanette Jurasek
Secretary George K. Arthur
Director Frederick G. Floss
Mayor Byron W. Brown (proxy Estrich)
County Executive Mark C. Poloncarz (proxy Cornell)
Staff Present
Executive Director Jeanette M. Robe
Principal Analyst/Media Liaison Bryce E. Link
Senior Analyst II/Manager of Technology Nathan D. Miller
Administrative Assistant Nikita M. Fortune
Comptroller Claire Waldron
Additionally Present
Mr. James L. Magavern, Esq., Magavern Magavern & Grimm LLP
Mr. Jason Shell, Commissioner of Assessment and Taxation, City of Buffalo
Opening Remarks
Interim Vice Chair Jurasek served as Chair Pro Tem, welcomed everyone to the December
Board meeting, thanked all who were in attendance, reviewed the logistics and agenda of the
meeting and advised that the Governance Committee met earlier, and recommended that the full
Board approve several items.
Roll Call of the Directors
Secretary Arthur called the roll, a quorum being present, the meeting commenced.
Erie County Budget Analyst, Mr. Mark Cornell, represented County Executive Mark C.
Poloncarz, while City of Buffalo Commissioner of Finance, Administration, Policy, and Urban
Affairs, Ms. Donna Estrich, represented Mayor Byron W. Brown, in accordance with
Subdivision 1 of §3853 of the BFSA Act.
Subdivision 1 of §3853 of the BFSA Act reads: “…The Mayor and the County Executive shall
serve as ex officio members. Every director, who is otherwise an elected official of the City or
County, shall be entitled to designate a single representative to attend, in his or her place,
meetings of the Authority and to vote or otherwise act in his or her behalf. Such designees shall
be residents of the City of Buffalo. Written notice of such designation shall be furnished prior to
any participation by the signal designee….”
2
Chair Pro Tem Jurasek introduced Resolution No. 19-25, “Approving Minutes and Resolutions
from September 23, 2019 and October 29, 2019.”
Director Floss made a motion to approve.
Chair Olsen seconded the motion.
The Board voted 6-0 to approve Resolution No. 19-25.
BFSA Items
Chair Pro Tem Jurasek advanced the agenda and stated that the Governance Committee met
earlier in the day and recommended the approval of the following items:
1. 2020 BFSA Board Meeting Calendar
2. 2020-21 Minority and Women-Owned Business Enterprise (“MWBE”) Goal Plan
3. 2020-21 Service-Disabled Veteran-Owned Business Development (“SDVOB”) Goal
Plan
Secretary Arthur made a motion to approve Resolution No. 19-26, “Adoption of a BFSA Board
of Director Regular Meeting Schedule for Calendar Year 2020.”
Chair Olsen seconded the motion.
The Board voted 6 to 0 to approve.
Chair Pro Tem Jurasek requested a motion to approve Resolution No. 19-27, “Approval of 2020-
21 MWBE Master Goal Plan.”
Director Floss made the motion as requested.
Secretary Arthur seconded the motion.
The Board voted 6 to 0 to approve.
Chair Pro Tem Jurasek requested a motion to approve Resolution No. 19-28, “Approval of the
2020-1 SDVOB Enterprise Master Goal Plan.”
Director Floss made the motion as requested.
Secretary Arthur seconded the motion.
The Board voted 6 to 0 to approve.
Director Floss asked Executive Director Robe to provide an overview of the MWBE and
SDVOB plans and achievements from the last fiscal year. Ms. Robe stated the goals of both
programs remain consistent with prior years. The SDVOB goal is 6% of qualified expenditures,
while the MWBE goal is 30% (Minority-owned Business Enterprises 15% and Woman-owned
Business Enterprises 15%). The majority of the BFSA budget is not subject to the goals,
therefore the total available budget for goals is $9,200 and the MWBE goal is $2,760 and
3
SDVOB goal is $522. Ms. Robe stated the goals were exceeded for both programs for fiscal
year (“FY”) 2018-19 as follows:
• MBE expenditure 23.6%
• WBE expenditures 20.2%
• SDVOB expenditures 6.24%
Director Floss expressed his appreciation for staff exceeding the established goals.
City of Buffalo (“City”)
Real Property Tax Assessment Review and Discussion
Chair Pro Tem Jurasek advanced the agenda to review the City’s recent property tax
reassessment and welcomed Mr. Jason Shell, Commissioner of Assessment and Taxation, to
present the findings to the Board.
Mr. Shell stated a total reassessment had not been completed in over twenty years. He stated
New York State Real Property Tax Law requires every property be assessed uniformly, fairly
and accurately which was the primary goal of the project for the City’s 94,000 properties that
were valued for reassessment. Outreach was conducted across the City for interested parties in a
myriad of community spaces via hand outs and power point presentations. On average, all of the
93 tax districts in the City increased in value. Mr. Shell stated all property owners were assessed
and paying taxes at a uniform level of assessment. Prior to the reassessment project properties
were assessed at 64% of full market value; it is expected the equalization rate will be at 90%
value of the full market value after the reassessment goes into effect on July 1, 2020. Since
2014, the City saw dramatic increases in real estate transactions. Mr. Shell stated an inequity
was created within the tax roll when assessments weren’t conducted regularly, which resulted in
some properties being subsidized by others. Reassessment redistributed the tax base in a more
equitable manner. Reassessment itself does not raise the tax levy, as that is based on the tax rates
that result from the budget. Mr. Shell explained the difference between budget and levy in that a
budget is determined by City Administration and Common Council, and the levy amount is
determined as the funds needed to fully cover the expenses after all other revenues and fees have
been accounted for and that the levy is then distributed amongst the taxpayers. The tax cap
prevents the amount of the levy from going up more than 2% annually without certain override
procedures. The tax cap has been in place since 2011.
There was an increase of 63% in total assessed value for the City of Buffalo and an increase of
84% in the value of the taxable properties of the City. The formal review process, which was the
first phase to challenge new assessments, has been completed. The second opportunity to
challenge assessments is the board of assessment review process. The third process is small
claims assessment reviews (“SCARs”) for residential and commercial challenges. There is an
expectation that some projects will decrease in value once all challenge processes have been
completed.
Secretary Arthur asked Mr. Shell what stage of the challenge process his office participates in.
Mr. Shell responded that while the second phase of challenge is taking place, the board of
assessment review, and his office offers support by providing information from tax rolls, real
property services database and any supporting documentation that may be requested, in addition
4
to scheduling the appointments.
Mr. Shell stated the large increase in taxable assessed value would cause a large decrease in the
tax rate and property owners were notified by disclosure notices of their assessment change
based on the market value of their home.
Director Floss asked what steps are in place to assist seniors on fixed incomes regarding a higher
reassessment. Mr. Shell replied four or five of the twelve available exemptions are specifically
for seniors, including Enhanced Star, Low-Income Seniors and Long-Time Resident exemptions.
There are also payment plans available to assist homeowners
Secretary Arthur expressed his concern that Fruit Belt residents, specifically senior property
owners, may not be aware of their options to challenge their assessments in a timely manner.
Mr. Shell stated specific exemptions were made available for the Fruit Belt and other census
tracks which were passed by local law in early November 2019 and several meetings were held
across the City, as established by individual council offices, to disseminate information regarding
reassessment and exemptions. Mr. Shell stated Assemblymember Crystal Peoples-Stokes and
Council President Darius Pridgen worked for the past year on distributing information
throughout the Fruit Belt Community. Secretary Arthur stated the timing of the passing of the
law was inadequate as grievances are only able to be filed December 1st thru December 31st and
hearings begin in January.
Director Floss asked how the Board can assist the City with disseminating information regarding
the reassessment and grievance process. Mr. Shell stated standard media notifications were sent
out, and public information sessions were held. Additionally, notifications were included in the
property tax bill were sent to each property owner within the targeted census tracks. Secretary
Arthur emphasized there are less than 14 business days remaining for grievances to be filed.
Chair Olsen asked what percentage of Fruit Belt property owners took advantage of the
assistance navigating the process as the renaissance is geographic and there are neighborhoods
being left behind. Secretary Arthur highlighted the fact that absentee landlords with tax
increases will then pass the increase on to their renters.
Chair Pro Tem Jurasek asked if there is a way BFSA could assist to maximize the Assessment
Department’s efforts for educational outreach and if Ms. Robe would work with Mr. Shell to
identify such ways to ensure there are no residents negatively impacted by the reassessments and
penalized due to the timing of the grievance process. Mr. James Magavern stated that the
Partnership for the Public Good has a coalition that focuses on educational efforts and
encouraged contacting them for possible collaboration.
Secretary Arthur requested statistics in the Fruit Belt regarding absentee ownership and
residential ownership. Mr. Shell replied he will work to provide that information.
Mr. Cornell expressed his personal experience and dissatisfaction with the reassessment
grievance process as he found it difficult and confusing. Mr. Shell acknowledged there were a
few errors with the process and advised problems would be rectified if they haven’t been already.
Mr. Shell also stated over 3300 people took advantage of the informal review process and
5
approximately 1900 obtained changes.
Ms. Estrich, Commissioner of Audit of Finance, stated the City made multiple attempts through
Councilmembers and other agencies to distribute information in as timely a manner as possible.
Chair Olsen emphasized the concern to monitor the effective use of exemptions especially in
neighborhoods that might be adversely affected in terms of long-term residents, so people are not
being taken advantage of. Chair Pro Tem Jurasek agreed and directed Ms. Robe to work with
Mr. Shell to capture data required to ensure equity and fairness are not encumbered.
Chair Pro Tem asked for clarification on Assemblymember Crystal Peoples-Stokes’ and Council
President Darius Pridgen’s involvement in the reassessment process, specifically the new
exemption for long-term residents residing in certain census tracks. Mr. Shell stated the two of
them were the driving force behind legislation to include the new long-term resident exemption
passed at the New York State legislature. Secretary Arthur explained the Common Council had
to pass a Home Rule message before the New York State Legislature could pass the exemption;
therefore, the two worked together to get the process finalized.
Director Floss offered his services to assist with any needed analysis as it is something he is
familiar with.
Chair Pro Tem Jurasek thanked Mr. Shell for his presentation and advanced the agenda.
Audited City of Buffalo Financial Statements FY ended June 30, 2019
Ms. Robe reviewed the City’s audited financial statements as submitted by the Comptroller’s
Office in early November.
Ms. Robe gave the following overview:
• Total revenues reported were $491.6M, or 96.5% of the total budget of $509.6M
• Total expenditures were $490.7M, or 95.4% of the adopted budget. In addition there are
$7.3M of encumbrances reported at year-end
• The result is a surplus of $0.9M and total fund balance of $92.9M
• The difference between the adopted budget and the final budget of $8.4M is for
encumbrances which were carried over from the previous year
• On a year-to-year basis, total revenues increased 5.4% or $24.3M. Other financing
sources declined by $4.0M for a total increase of $20.3M, or 4.3% due to the following:
o Intergovernmental revenue increase of $8.9M
▪ $7.5M in Tribal State Compact revenue advance by NYS, which leaves $9.5M
outstanding. The outstanding receivable is not included as a revenue in the
2019-20 budget.
▪ $2.6M in increased sales tax collections year-to-year
▪ All other net decrease of $1.2M
o Property taxes, assessments, and other taxes increased $6.3M due to the increase
in the property tax levy which was offset by a decrease in STAR by $1.0M
o Miscellaneous increased $4.7M, due mainly to real estate sales and $0.8M in
donations
o Licenses, permits, fines and service charges increased $1.6M; street metered
parking increased $0.5M
6
o All other revenue sources provided a net increase of $2.8M
o Transfers in decreased $4.0M
▪ $4.3M decrease from Parking Enterprise Fund
▪ $0.3M increase from Water Enterprise Fund
▪ Transfers had increased by $4.4M in the prior year
Ms. Robe stated final real property tax revenue totaled $137.5M which represents 29% of total
revenue; 82% of the City’s total revenue is comprised of three buckets:
o Property tax levy (increased $5.7M year-to-year)
o Sales tax (increased $2.6M, or 3.1% year-to-year)
o State AIM (held flat since FY 2012)
• General Fund expenditures were overall consistent year-to-year and decreased by $3.5M,
which was less than 1% of the budget
o Departmental expenditures increased year-to-year by $2.2M; no significant
fluctuations
o General Charges decreased $4.7M primarily due to judgements and claims
• Interfund transfers out decreased $1.0M
o $3.6M decrease to Solid Waste & Recycling Enterprise Fund
o $0.5M decrease to Capital Projects Fund
o $3.1M increase for debt service
Historically, over the last four years, the City has recognized 96-97% of total budgeted revenues.
There was an unfavorable budgeted revenue variance of $18.0M compared to the Adopted
Budget:
• $7.0M unfavorable variance in miscellaneous revenue:
o $4.0M due to real property sales and capital assets sales
o $2.0M due to City-owned venue surcharge
o $1.2M lower in gifts & donations - $0.8M was received
Secretary Arthur asked for clarification on the City’s venue surcharge. Ms. Estrich stated
negotiations are ongoing to capture monies with a method other than through a ticket surcharge.
• $7.0M unfavorable variance in intergovernmental revenue:
o Casino revenue under budget by $9.5M
o Sales tax positive variance of $2.8M
• $4.1M unfavorable variance in fines
o $3.1M unfavorable variance for traffic violation fines
o $0.7M unfavorable variance for parking fines
o $0.3M net unfavorable variance for all other fines
• $1.5M unfavorable variance from transfers in from the parking enterprise fund
Ms. Robe explained the City’s total expenditures, including encumbrances, has been between
95% -99% of budget over the past four fiscal years.
7
There was a FY 2018-19 favorable variance for budgeted appropriations of $24.0M:
• $14.2M favorable variance in fringe benefits
o Health insurance – active = $(0.4M)
o Health insurance – retiree = $2.8M
o NYSERS = $4.2M
o NYSPFRS = $4.5M
o Salary Adjustment Line = $2.4M
• Combined $0.4M unfavorable variance in the fire and police departments due to
overtime. While this category usually has a significant impact on the budget it was
noted that expenses were well maintained for both fire and police.
• $9.7M favorable variance in all other departments due to vacancies and decrease in
expenditures for supplies and services.
The fund balance summary demonstrated a $22.9M decrease in fund balance from FYE 2017 to
FYE 2019. The individual fund balance categorizes were discussed.
It was noted fund balance was $36.0M when BFSA oversight began in FY 2002-03 whereas at
the end of FY 2018-19 the City had a fund balance of $92.9M.
Ms. Robe shared the present value of the Other Postemployment Benefits (“OPEB”) liability was
$1.128B as of June 30, 2019 on an all funds basis, $54.0M represented the liability of the
Enterprise Funds. The year-to-year reduction from $1.255B 1was largely due to the change in
the assumed increase in the healthcare costs from 7.6% to 5.3%. It was noted this category is
expensed on a pay-as-you go basis and therefore is not captured on the general fund financial
statements except as a payment for retiree health insurance.
Solid Waste and Recycling Fund
Charges for services were enhanced this last year for refuse fees which resulted in operating
income of $6.0M being reported after many years of operating at a loss. There was a $2.9M
reduction in fringe benefits related to a decrease in the OPEB liability. For the first time in a
number of years there was a reduction to the cash advances made to the solid waste and
recycling fund from the general fund. While there isn’t a formal repayment policy in place, there
is an informal one in which the liability will be repaid from surpluses.
Mr. Cornell asked for clarification on the State’s advance of casino monies and the potential of
the State re-capturing the advance. Ms. Estrich responded the State is confident the funds will be
received since the arbitration has been finalized.
Director Floss exited the meeting at 2:17pm.
Chair Olsen commended the City on presenting a balanced budget with ample constitutional
taxing authority and noted the BFSA is appropriately in an advisory status.
8
City of Buffalo (“City”)
First Quarter Report
Chair Pro Tem Jurasek advanced the agenda to the review of the City’s first quarter. Ms. Robe
began the presentation stating adopted budget revenues were $508.7M; the City is projecting
year-end revenues of $508.6M which is consistent with the budget. The City is also projecting
$507.2M for actual year-end expenditures resulting in a total projected surplus of $1.4M. Ms.
Robe gave the following overview of FYE total revenue projection:
o $121,000 total unfavorable variance consisting of:
• $0.6M projected to be under budget in Service Charges
▪ $0.4M due to easement fees with National Fuel Gas
▪ $0.2M in relation to the mortgage default fee
• $0.5M over budget in Miscellaneous revenue
▪ $0.6M variance is attributed to an awarded SAFR Grant
▪ $0.2M variance is attributed to estimated parking fees from parking
surcharge at public City facilities
Ms. Robe noted miscellaneous revenue for sale of property and assets for the first quarter has
already exceeded the total year-end budget largely due to the sale of the former police
headquarters.
The total expenditure projection for FYE 2020 is $1.5M below the adopted budget and explained
as follows:
o $1.2M total favorable budgetary variance projected for Departmental expenditures
• Fire Department expected to exceed the budget by $1.0M
• Police Department expected to be favorable by $1.2M
• Remaining departments projected to be favorable by $1.0M
o $0.3M total projected favorable budgetary variance in General Charges for debt service
• The City does not expect to issue a RAN during the current fiscal year
As of September 30, 2019, the vacancy rate for positions funded through the General Fund was
9.4%. The police department had an 8.3% vacancy rate and the fire department had a vacancy
rate of 5.4%. Ms. Estrich confirmed the vacancy rate usually trends about 10%.
Recommendations and Considerations
Ms. Robe noted casino revenue was included as a projection for year-end and does not include
the past due amount of $9.5M which would increase the surplus at year-end if received before
June 30. BFSA continues to recommend the monitoring of revenues and expenditures,
especially overtime in the fire department, in order determine how the collective bargaining
agreements have changed overtime.
Three unions are out of contract which are expected to be settled during the current fiscal year:
o Police Benevolent Association
o Local 264 – Blue Collar
o Crossing Guards
Ms. Robe stated the City’s finances are trending well and Chair Pro Tem Jurasek advanced the
agenda.
9
Capital Budget
Review of 2020 Capital Budget and related 2020-2024 Capital Improvement Program
Mr. Bryce Link began his presentation stating the Common Council passed the Capital Budget
on December 10, 2019 with minor amendments. The proposed capital budget is in the amount of
$37.2M, of which $19.9M is requested for financing and $17.3M will be for projects that are
authorized but unissued. The Comptroller’s debt limit for the current year is $25.3M.
Requested financing of $25.3M is categorized as follows:
• City buildings $7.1M, or 28%;
• Infrastructure $9.4M, or 37%;
• Vehicles $3.3M, or 13%;
• Economic development and culturals $2.4M, or 9%;
• Demolition and tree management $1.7M, or 7%;
• Parks $1.4M, or 6%.
Additionally, the requested financing of $25.3M consists of the following:
o $19.9M – from the Capital Plan
o $4.0M – previously authorized but unissued
o $1.4M – previously budgeted but unauthorized
Secretary Arthur asked if the Hurd decision is still in effect regarding the sale of bonds. Mr.
Magavern responded that the Hurd decision was an attempt to capitalize on an investment in
vocational education and human services, and that the Hurd decision is no longer in effect.
Mr. Link stated the City has not borrowed on behalf of the Buffalo City School District
(“BCSD”) since 2012. Since then the District has been utilizing refunding savings from the Joint
School Construction Board (“JSCB”) debt and has approximately $8.2M available for projects.
As of June 30, 2019, the City has $23.3M of unspent capital bond proceeds outstanding.
Conclusion
Mr. Link provided the following summary:
o No projects again included for the District
• District is currently using savings from refundings of JSCB debt; $8.2M is
remaining for capital projects
o BFSA has recommended to minimize long-term financing for ongoing general operating
expenses (i.e., demolitions and tree removal)
• Uses limit bonding capacity
▪ $1.7 M included in proposed 2020 borrowing, or 7% of total
▪ $8.4 M over the five-year Capital Improvements Program (6.2% of total)
• Recognition of fiscal pressure if such projects were funded on a pay-as-you-go
basis
o There is $24.0M in total authorized and unissued projects
• Approximately $15.6M are provided for in the out-years of the Capital
Improvements Program
10
▪ Remaining balance of $8.4M to be provided for beyond the current plan
o There remains $6.3M in budgeted and unauthorized projects
Once the minor amendments that were approved by Common Council on December 10, 2019 are
submitted to the BFSA the analysis will be updated. Ms. Estrich commented that the
amendments do not change the dollar amount of the budget, only the allocation of funds within
their respective council districts.
Chair Pro Tem Jurasek thanked staff for the presentation and advanced the agenda to the next
item.
Buffalo City School District (“BCSD” or “District”)
Hearing no additional comments Chair Pro Tem Jurasek advanced the agenda to review several
District items as presented by Mr. Nathan Miller.
Audited Financial Statement FY ended June 30, 2019
Mr. Miller provided the following overview of the 2018-19 final budget as compared to the fiscal
year-end (“FYE”) actual:
• The 2018-19 original budget included $897.4M in revenue and expenditures of $916.4M.
There was a planned deficit of $19.0M. The actual revenue totaled $911.5M with
expenditures of $882.6M resulting in a surplus of $28.9M.
• Actual revenues exceeded budgeted revenues by $14.1M, or 101.6% of final budget, due
to a one-time $15.0M reimbursement for the overpayment of healthcare premium-
equivalent payments. Other contributing factors were:
o Erie County sales tax receipts were favorable by $1.9M
o NYS Aid was favorable by $4.1M
Chair Pro Tem Jurasek asked if there were other revenue enhancements which were being
monitored as gap closing measures. Mr. Miller replied that health insurance savings was an
indentified gap closing measure. The District is focusing on efficiencies and enhancements in
order to provide health insurance more effectively and at at reduced rate of increase.
• Total actual expenditures were $36.3M under the final budget, or 96.6% of final budget.
Significant variances included employee benefits of $17.2M due to the District
converting to a traditional method of self-insurance for employee and retiree healthcare
costs effective July 1, 2018. In addition, New York State Employee Retirement
System/Teachers’ Retirement System pension payments were favorable by $1.1M.
Positive variances were also noted for the following expenditures:
o Regular school instruction $9.1M
o General support $5.0M
o Pupil transportation $3.9M
Mr. Miller provided the following fund balance summary:
• FYE 2019 had total fund balance of $223.7M:
o Nonspendable/restricted $25.7M
o Assigned $111.9M
o Unassigned $86.1M
11
• FYE 2018 had total fund balance of $194.8M
o Nonspendable/restricted $25.6M
o Assigned $91.4M
o Unassigned $77.8M
• The net change to total fund balance was a favorable $28.9M
The total assigned fund balance increased by $20.5M from year-to-year. Two new categories
were added for FY 2019:
o Designated for health insurance: this funding helps to support the new self-
insured model, and equal to $15.1M
o Designated for school budget equity: this funding is provided as a resource to
address issues identified with respect to inequitable individual school funding
and is equal to $5.0M
Mr. Miller reviewed significant fluctuations in general fund revenue over the prior fiscal year of
$32.7M, or 3.7%:
• NYS Aid increased $13.9M, or 1.9%
• City contribution increased $0.0M, or 0%
• Erie County sales tax increased $2.3M, or 5.3%
• Miscellaneous increased $16.0M or 151.0% (one-timed recognition for reimbursement of
prior year overpayments for health insurance)
Significant fluctuations in general fund expenditures over the prior year of $15.9M, or 1.8%
were:
• Operating expenditures decreased $1.7M, or 0.2%
o Instruction regular schools increased $18.9M, or 5.9%
o Instruction charter schools increased $7.0M, or 5.9%
o General support decreased $4.6M, or 6.4%
o Employee benefits decreased $11.1M, or 6.0%
Mr. Miller stated the actuarial accrued liability of other postemployment benefits (“OPEB”)
increased to almost $2.4B as compared to almost $2.3B in FY 2018 in part due to changed
assumptions as well as from District efforts to curtail retiree health insurance expenditures.
Mr. Magavern noted that the Annual Required Contribution (“ARC”) includes both the cost of
OPEB benefits attributable to the current year of services as well as an amortization of past
service costs to fund the Actuarial Accrued Liability. The ARC is significantly greater than the
actual retiree benefits paid in any given year in that it includes the accrued liability. Mr.
Magavern noted that there have been efforts to establish a formal process for governmental
entities to set funds aside for the full ARC. Mr. Miller responded that there was no current,
formal legal mechanism for entities such as the District to set aside funds for the full ARC. The
District is on a pay-as-you-go system for actual post-employment benefits. District management
had designated $52.1 million for OPEB at July1, 2019 to address this accrued liability.
12
BCSD First Quarter
Mr. Miller stated the 2019-20 budget was adopted with a $10.0M deficit; however, a favorable
variance of $0.6M is currently projected for FYE. District management has every intention to
fill vacancies, if they are not filled, additional savings can be recognized at mid-year within all
employee compensation benefit categories. Two revenue items expected to have a positive
variance are Erie County sales tax of $0.4M and Federal Medicaid reimbursement of $0.2M.
Expenditures are not anticipated to differ from revenues as of September 30, 2019.
As of September 30, 2019, there were 237.5 vacancies on an All Funds basis and 162.1
vacancies on a General Funds basis. The majority of which were teachers and white-collar
employees. The vacancy rate of 4.1% is substantial.
Summary
The District’s FY 2019-20 budget is currently balanced with the appropriation of $10.0M in
Fund Balance with a minor $0.6 M favorable budgetary surplus currently projected.
BFSA notes that the District had a substantial vacancy rate of 4.1% at September 30, 2019 and
recognizes if a significant vacancy level continues, various Employee Compensation and
Employee Benefit lines will be less-than-budget. The District has conveyed its intent to fill the
vacant positions and that the FY 2019-20 Second Quarter Report will provide adjustments to
various Employee Compensation and Employee Benefit expenditure lines as appropriate.
Chair Pro Tem Jurasek thanked Mr. Miller for his presentation and asked for the student numbers
for the District as compared to Charter schools. Mr. Miller replied that staff would provide the
requested materials.
Hearing no additional comments or questions Chair Pro Tem Jurasek asked for a motion that
BMHA reports scheduled to be reviewed today be tabled until the next Board meeting.
Secretary Arthur made the motion as requested.
Ms. Estrich seconded the motion.
The Board voted 5 to 0 to approve.
Chair Pro Tem Jurasek asked that BURA reports scheduled to be presented today be tabled until
the next Board meeting.
Secretary Arthur made the motion as requested.
Chair Olsen seconded the motion.
The Board voted 5 to 0 to approve.
13
BFSA Business
Due to recent opinions and critiques regarding BFSA duties Chair Pro Temp Jurasek asked Ms.
Robe to read a statement as drafted by staff to succinctly explain the budget process of the City
and the role of the BFSA in the process. Ms. Robe read the following statement for the record:
The intent behind the creation of the BFSA in a control period was to provide budgetary
relief and correct the financial course of the City. After the City was able to reset and
make significant structural changes to labor contracts, the BFSA transitioned into an
advisory board. During either a control or advisory period the financial planning process
and quarterly monitoring is the BFSA’s primary charge and most effective tool.
The BFSA continues to monitor the financial position of the City and advises the City on
such matters. BFSA is not in a position to restrain the City’s budget; budget development
is a political decision made by the Mayor and the Common Council during the annual
budget deliberation and through-out the year as the budget is modified. The role of the
BFSA during an advisory period is to monitor, advise and assist when requested, for
example through borrowings or lobbying on behalf of the City with the State. The
financial impact from BFSA’s actions to date is $458 million of which $240 million is
attributed alone to savings from the wage freeze. The BFSA has been, and continues to
be, open in its deliberation process concerning the City and covered entities and provides
copies of all meeting materials including agendas and reports in advance of BFSA
meetings.
The BFSA is charged with reviewing the four-year financial plans annually and has
submitted comments to the Administration and Common Council and issued thorough
reports analyzing the financial plan including budget assumptions and areas of concern.
The reports are detailed and provide insight to the City’s financial operations and should
be used as a resource by those charged with affecting financial decisions on behalf of the
City. The lack of carryover and spend down of fund balance was addressed by the
BFSA. The BFSA has recommended that the City continue to diversify revenues and to
begin replenishing its undesignated fund balance to be better prepared for future
uncertainties. All three major credit rating agencies continuously cite BFSA as a
prominent factor in their ratings of the City and the City enjoys a healthier bond rating
due to the continued oversight of the BFSA, which in turn provides substantial savings to
the City.
The BFSA received a very clear external opinion that as long as the budget is balanced,
the City is not in a deficit, and furthermore the use of fund balance is an appropriate
source to balance the budget. Such a financial tool, being the use of fund balance to
balance a budget, is a normal and routine budgeting mechanism used by many
municipalities and school districts. If fund balance had not been used to balance the
budget as an available resource, the City would have been faced with increasing taxes or
reducing services to City residents. The City has been successful in balancing the
services provided to its residents and not overtaxing them; this was accomplished by
utilizing fund balance as opposed to raising the property tax rates.
14
We continue to assert our opinion that the City’s financial position remains stable under
the leadership of Mayor Brown and have no immediate concerns regarding the overall
financial position. A control period may be reimposed as a last resort and only if it is
absolutely necessary. A determination to move back to a control period should never be
casually determined or flippantly discussed. The BFSA should be viewed as an ally that
has collaborated with the City to assist in strengthening the City’s financial position, as it
continues to do, and not viewed as a blemish to or a hinderance against the City.
Chair Pro Tem Jurasek thanked Ms. Robe and asked for consensus on the statement. Secretary
Arthur stated any statements regarding BFSA should be made from the Chair of the Board and
Chair Olsen concurred and no further action needs to be taken at this time.
Privilege of the Floor
Chair Pro Tem Jurasek noted no members of the public were present for comment and asked for
a motion to adjourn.
Adjournment
Secretary Arthur made a motion to adjourn.
The Board adjourned by consensus.
The Board adjourned at 3:09 PM.
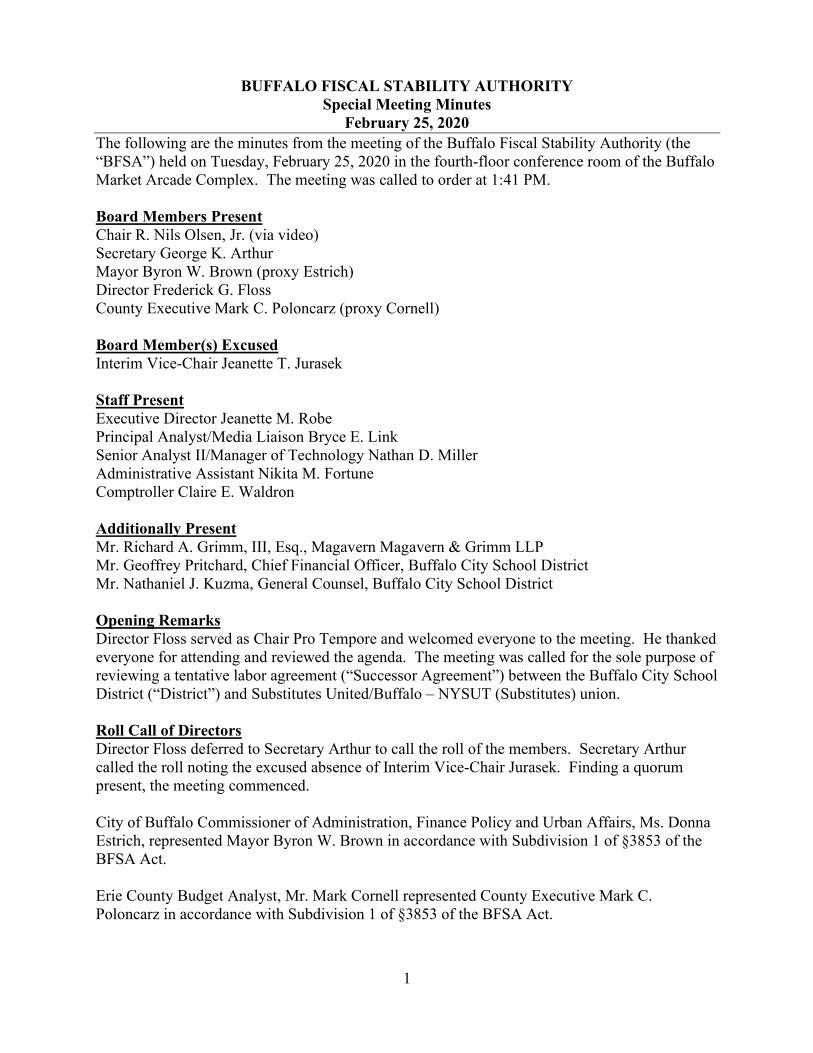
1
BUFFALO FISCAL STABILITY AUTHORITY
Special Meeting Minutes
February 25, 2020
The following are the minutes from the meeting of the Buffalo Fiscal Stability Authority (the
“BFSA”) held on Tuesday, February 25, 2020 in the fourth-floor conference room of the Buffalo
Market Arcade Complex. The meeting was called to order at 1:41 PM.
Board Members Present
Chair R. Nils Olsen, Jr. (via video)
Secretary George K. Arthur
Mayor Byron W. Brown (proxy Estrich)
Director Frederick G. Floss
County Executive Mark C. Poloncarz (proxy Cornell)
Board Member(s) Excused
Interim Vice-Chair Jeanette T. Jurasek
Staff Present
Executive Director Jeanette M. Robe
Principal Analyst/Media Liaison Bryce E. Link
Senior Analyst II/Manager of Technology Nathan D. Miller
Administrative Assistant Nikita M. Fortune
Comptroller Claire E. Waldron
Additionally Present
Mr. Richard A. Grimm, III, Esq., Magavern Magavern & Grimm LLP
Mr. Geoffrey Pritchard, Chief Financial Officer, Buffalo City School District
Mr. Nathaniel J. Kuzma, General Counsel, Buffalo City School District
Opening Remarks
Director Floss served as Chair Pro Tempore and welcomed everyone to the meeting. He thanked
everyone for attending and reviewed the agenda. The meeting was called for the sole purpose of
reviewing a tentative labor agreement (“Successor Agreement”) between the Buffalo City School
District (“District”) and Substitutes United/Buffalo – NYSUT (Substitutes) union.
Roll Call of Directors
Director Floss deferred to Secretary Arthur to call the roll of the members. Secretary Arthur
called the roll noting the excused absence of Interim Vice-Chair Jurasek. Finding a quorum
present, the meeting commenced.
City of Buffalo Commissioner of Administration, Finance Policy and Urban Affairs, Ms. Donna
Estrich, represented Mayor Byron W. Brown in accordance with Subdivision 1 of §3853 of the
BFSA Act.
Erie County Budget Analyst, Mr. Mark Cornell represented County Executive Mark C.
Poloncarz in accordance with Subdivision 1 of §3853 of the BFSA Act.
2
Subdivision 1 of §3853 of the BFSA Act reads: “…The Mayor and the County Executive shall
serve as ex officio members. Every director, who is otherwise an elected official of the City or
County, shall be entitled to designate a single representative to attend, in his or her place,
meetings of the Authority and to vote or otherwise act in his or her behalf. Such designees shall
be residents of the City of Buffalo. Written notice of such designation shall be furnished prior to
any participation by the signal designee….”
Successor Agreement
Director Floss advanced the agenda to review the Successor Agreement between the District and
Substitutes. BFSA Executive Director Jeanette M. Robe and Senior Analyst II Nathan D. Miller
were asked to present the staff’s analysis.
Mr. Miller provided the Successor Agreement’s overview. The previous labor agreement
expired on June 30, 2019. The Successor Agreement would be effective from July 1, 2019
through June 30, 2021. The District employed 619 part-time employees at December 20, 2019.
The Successor Agreement proposed the following new terms:
Proposed compensation increases:
• $3.00/day increase effective date of union ratification (December 18, 2019); rate of
increase 2.2% – 2.7%
• $4.00/day increase effective July 1, 2020; rate of increase 2.9% - 3.5%
The compensation rates of increase vary based on the per diem rate.
The Successor Agreement includes additional changes to provisions:
• Incentive Bonus: The terms of both the existing labor agreement and the Successor
Agreement include an incentive bonus of $850 for substitute teachers who teach for 65
days or more within a semester (September through January and/or February through
June). The Successor Agreement changes the payment date from the pay period
following the teachers’ 65 days to the last pay period within a semester.
• Incentive Premium: Additional $5.00/day for working in “low fill” rate schools, as
determined biannually or as needed by District management.
Secretary Arthur asked for the list of “low fill” schools. Mr. Miller identified the following
public schools:
1. PS #197: Math Science & Technology Prep
2. PS #206: South Park High School
3. PS #196: Math Science & Technology Prep @ 39
4. PS #43: Lovejoy Discovery School
5. PS #18: Dr. Antonia Pantoja Community School
6. PS #94: West Hertel Academy
7. PS #37: Marva J. Daniel Futures Preparatory School
8. PS #31: Harriet Ross Tubman School
9. PS #89: Dr. Lydia T. Wright School of Excellence
3
Ms. Estrich, City of Buffalo Commissioner of Administration, Finance Policy and Urban Affairs,
asked for more clarification on what classifies a school as “low fill.” Mr. Miller noted that these
are schools the District had identified as having a greater substitute teacher need. He deferred to
District officials to provide additional information. Mr. Nathaniel Kuzma, General Counsel,
Buffalo City School District, stated schools are identified as “low fill” based on average teacher
absenteeism and the ability to cover teacher absences with Substitutes. The District is subject to
high teacher absenteeism and has up to 1,000 absences per day. Subsequently, the average fill
rate across the District is 75%, which means 25% of classes remain uncovered. In those cases,
administration has to make adjustments to provide coverage from other classrooms within the
school. The nine identified schools had a 50% to 60% fill rate, hence the incentive to have
Substitutes take assignments at “low fill” schools.
Director Floss asked if there is a lack of certified STEM (Science, Technology, Engineering, and
Mathematics) teachers. Mr. Kuzma confirmed this.
Director Floss asked how the District’s pay rates fare with surrounding areas. Mr. Kuzma stated
the District needs to stay competitive and the District is near the top tier for daily rate.
Mr. Miller continued his presentation regarding contractual changes.
• Due Process: all references to employees’ due process rights are changed from 15 days
to 25 days
Director Floss asked for clarification on the dates. Mr. Kuzma stated the dates referred to the
length of time an employee can be held on unpaid status while an investigation into alleged
misconduct is taking place.
The following terms were unaffected by the CBA:
• Health Insurance: Employees who worked at least thirty days in the preceding year are
eligible to participate in the District’s group health insurance plan provided that they pay
100% of the premium cost. No Substitutes currently participate.
• Workday: four hours and thirty minutes
• Minimum Workdays Required: Twenty days in a school year to maintain substitute
teacher status
• Retiree Health Insurance: Employees are not eligible for District-provided health
insurance upon retirement
Mr. Kuzma noted that a Substitute’s standard workday is 7 hour and 20 minutes. Executive
Director Robe clarified that the contract provides that a full-time day for pay purposes is 4 hours
and 30 minutes. If a Substitute works less than that, the payment is pro-rated for hours worked.
Mr. Kuzma concurred.
Mr. Miller provided the estimated All Funds net costs of the Successor Agreement at $2.2
million over the four-year financial plan. No savings are associated with the labor agreement.
The net cost is estimated at $282,023 in fiscal year (“FY”) 2019-20. The District has adequate
funding available to absorb the costs of the Successor Agreement and intends to perform budget
transfers as needed from expenditure lines that are projecting favorable budgetary variances.
The Financial Plan has not been modified.
4
Conclusions & Recommendations
Ms. Robe thanked Mr. Miller for his presentation. The agreement brings the contract with the
Substitutes current, as it expired this past June, and it provides a two-year term. She noted there
were few structural changes to the terms of the agreement and importantly health insurance is not
a District-paid provided fringe benefit, which limits the bargaining for this unit.
The costs of the contract as calculated by the District, based on the assumed key underlying
assumptions, appears reasonable. The District has not modified the budget or financial plan as
the costs are assumed to be absorbed into what has already been established. The total costs for
this contract as discussed is equal to 0.05% of the four-year financial plan.
The new incentive to assist in filling positions in those schools designated as low fill is
anticipated to cost the District approximately $85,000 annually. In order to assist with future
contract negotiations, we recommend the fill-rates for school identified as low-fill be tracked and
evaluated to determine the effectiveness of this incentive program.
There are terms of this contract that are effective upon Board of Education ratification. We
further recommend that submissions be made to BFSA as soon as possible to avoid future delays
in the implementation of such provisions.
Director Floss asked why the CBA only covers a two-year term and not a usual five-year term.
Mr. Kuzma responded that the District is currently in negotiations with the teachers’ union and
the previous contract with the teachers’ union called for immediate negotiation with the
substitutes’ union. Therefore, a shorter timeframe was covered for the Substitutes contract as a
bridge contract, to allow the District to continue to negotiate with the Buffalo Teachers
Federation (the “BTF”). It is expected that the next contract with the Substitutes would align
itself for the same time-period of the next BTF contract.
Secretary Arthur made a motion to recommend approval of the Successor Agreement to the
Board of Education.
Chair Olsen seconded the motion.
The Board voted 5 to 0 for approval.
Hearing no additional comments, the meeting was adjourned by acclamation at 1:57 PM.
BUFFALO FISCAL STABILITY AUTHORITY
RESOLUTION NO. 20-01
APPROVING MINUTES AND RESOLUTIONS FROM
DECEMBER 12, 2019 and FEBRUARY 25, 2020
BE IT RESOLVED that the Buffalo Fiscal Stability Authority hereby approves the
minutes of its meetings on December 12, 2019 and February 25, 2020.
BE IT FURTHER RESOLVED that the Buffalo Fiscal Stability Authority ratifies and
affirms Resolution Nos. 19-25 through 19-28 which were approved on December 12,
2019.
This resolution shall take effect immediately.
Approved March 18, 2020
___________________________
George K. Arthur,
Secretary
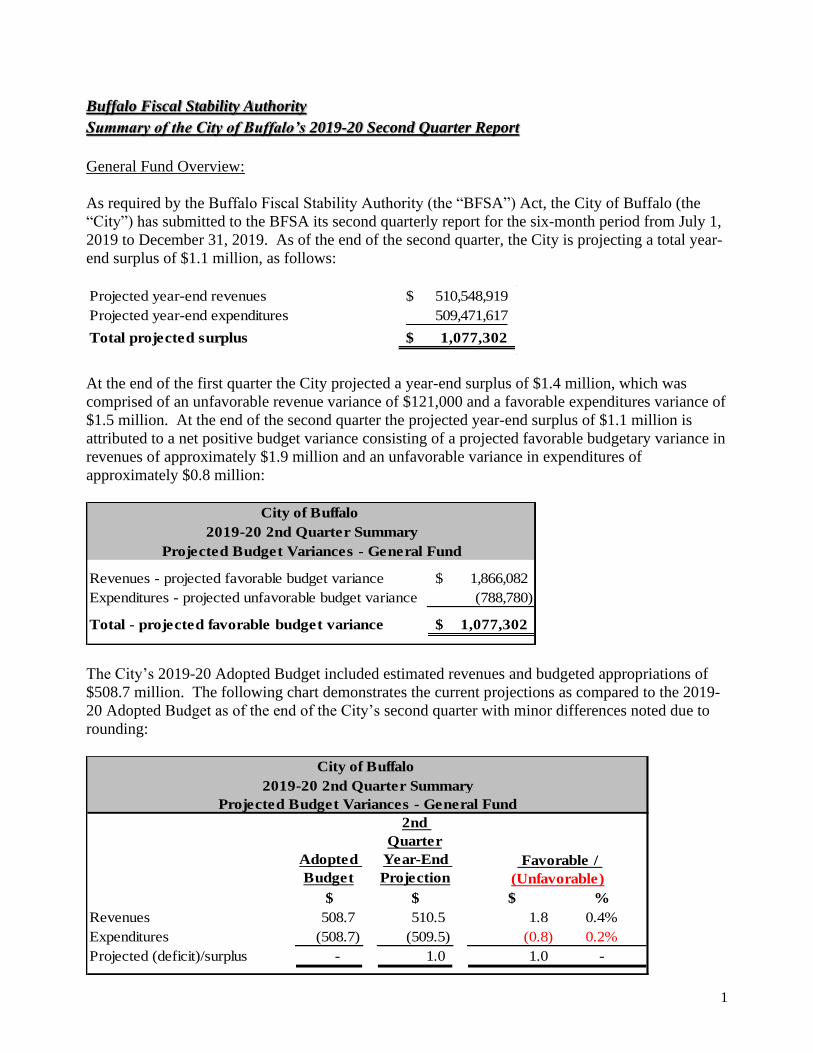
1
Buffalo Fiscal Stability Authority
Summary of the City of Buffalo’s 2019-20 Second Quarter Report
General Fund Overview:
As required by the Buffalo Fiscal Stability Authority (the “BFSA”) Act, the City of Buffalo (the
“City”) has submitted to the BFSA its second quarterly report for the six-month period from July 1,
2019 to December 31, 2019. As of the end of the second quarter, the City is projecting a total year-
end surplus of $1.1 million, as follows:
Projected year-end revenues 510,548,919$
Projected year-end expenditures 509,471,617
Total projected surplus 1,077,302$
At the end of the first quarter the City projected a year-end surplus of $1.4 million, which was
comprised of an unfavorable revenue variance of $121,000 and a favorable expenditures variance of
$1.5 million. At the end of the second quarter the projected year-end surplus of $1.1 million is
attributed to a net positive budget variance consisting of a projected favorable budgetary variance in
revenues of approximately $1.9 million and an unfavorable variance in expenditures of
approximately $0.8 million:
Revenues - projected favorable budget variance 1,866,082$
Expenditures - projected unfavorable budget variance (788,780)
Total - projected favorable budget variance 1,077,302$
City of Buffalo
2019-20 2nd Quarter Summary
Projected Budget Variances - General Fund
The City’s 2019-20 Adopted Budget included estimated revenues and budgeted appropriations of
$508.7 million. The following chart demonstrates the current projections as compared to the 2019-
20 Adopted Budget as of the end of the City’s second quarter with minor differences noted due to
rounding:
2nd
Quarter
Adopted
Budget
Year-End
Projection
$ $ $ %
Revenues 508.7 510.5 1.8 0.4%
Expenditures (508.7) (509.5) (0.8) 0.2%
Projected (deficit)/surplus - 1.0 1.0 -
City of Buffalo
Favorable /
(Unfavorable)
Projected Budget Variances - General Fund
2019-20 2nd Quarter Summary
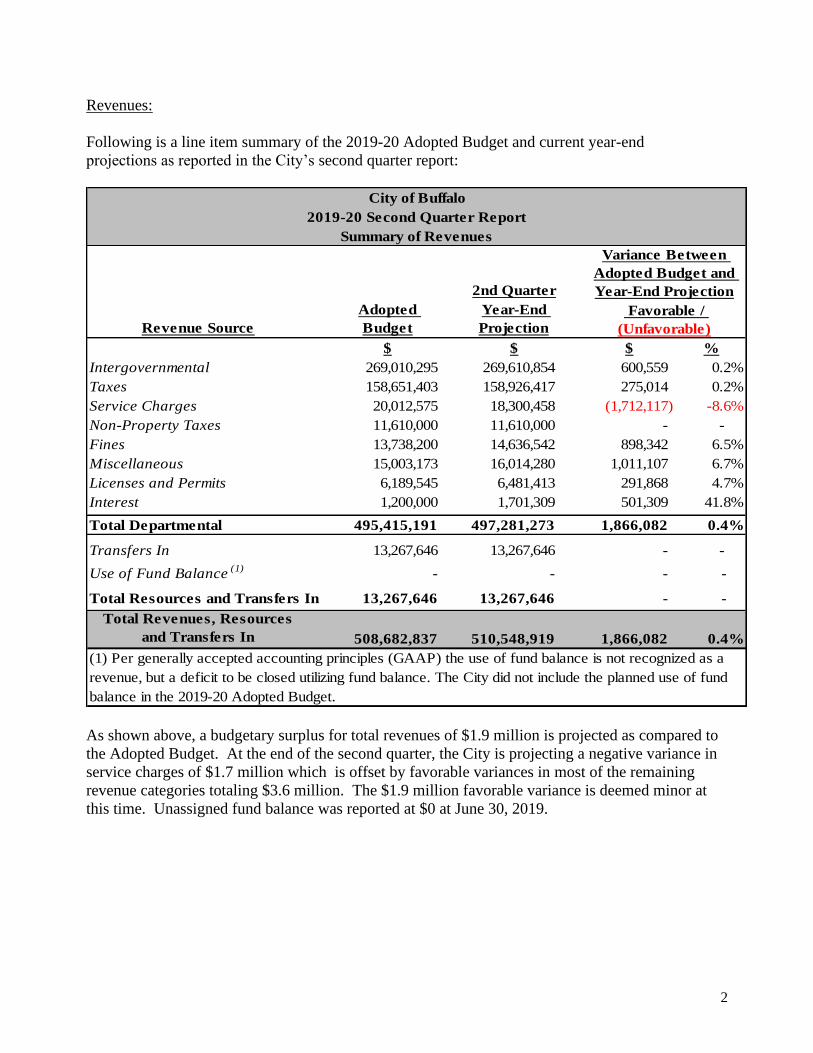
2
Revenues:
Following is a line item summary of the 2019-20 Adopted Budget and current year-end
projections as reported in the City’s second quarter report:
2nd Quarter
Revenue Source
Adopted
Budget
Year-End
Projection
$ $ $ %
Intergovernmental 269,010,295 269,610,854 600,559 0.2%
Taxes 158,651,403 158,926,417 275,014 0.2%
Service Charges 20,012,575 18,300,458 (1,712,117) -8.6%
Non-Property Taxes 11,610,000 11,610,000 - -
Fines 13,738,200 14,636,542 898,342 6.5%
Miscellaneous 15,003,173 16,014,280 1,011,107 6.7%
Licenses and Permits 6,189,545 6,481,413 291,868 4.7%
Interest 1,200,000 1,701,309 501,309 41.8%
Total Departmental 495,415,191 497,281,273 1,866,082 0.4%
Transfers In 13,267,646 13,267,646 - -
Use of Fund Balance(1)
- - - -
Total Resources and Transfers In 13,267,646 13,267,646 - -
Total Revenues, Resources
and Transfers In 508,682,837 510,548,919 1,866,082 0.4%
City of Buffalo
(1) Per generally accepted accounting principles (GAAP) the use of fund balance is not recognized as a
revenue, but a deficit to be closed utilizing fund balance. The City did not include the planned use of fund
balance in the 2019-20 Adopted Budget.
2019-20 Second Quarter Report
Summary of Revenues
Variance Between
Adopted Budget and
Year-End Projection
Favorable /
(Unfavorable)
As shown above, a budgetary surplus for total revenues of $1.9 million is projected as compared to
the Adopted Budget. At the end of the second quarter, the City is projecting a negative variance in
service charges of $1.7 million which is offset by favorable variances in most of the remaining
revenue categories totaling $3.6 million. The $1.9 million favorable variance is deemed minor at
this time. Unassigned fund balance was reported at $0 at June 30, 2019.
3
Notable variations to the Adopted Budget include:
• Service charges are projected to be under budget by $1.7 million. There are multiple
service charges projected to be less than originally estimated based on actual revenue
collected during the first six months of the year. The delayed implementation of the
mortgage default fee has resulted in an unfavorable variance of $1.4 million and $0.2
million for the rental registration fees. The City had initially planned for the mortgage
default fee program to begin in July 2019, but due to implementation delays the program
did not begin until January 2020. A total of $3.2 million was included in the adopted
budget for those two fees, with the year-end projection at $1.6 million, a variance of $1.6
million compared to the adopted budget. All other service charges are projected to result
in a net unfavorable variance of $0.1 million at year-end.
• Intergovernmental revenues are the single largest revenue category with a year-end estimate
of $269.6 million for the current fiscal year, compared to a budgeted amount of $269.0
million. Included within this revenue category is New York State (the “State”) Aid and
Incentive for Municipalities (“AIM”) budgeted at $161.3 million, sales tax in the amount of
$90.4 million, and Tribal State Compact (“TSC”) revenue in the amount of $11.0 million.
All other intergovernmental sources total $6.9 million.
There is no expected budget variance in AIM. It is noted that the State has maintained the
annual AIM revenue allocation at the same amount of $161.3 million since (City Fiscal
Year 2012.
Sales tax collections to date for the City totals $68.6 million compared to $65.6 million, a
$3.0 million or 4.6 percent increase. At the end of the second quarter there is a positive
year-end variance of $0.6 million projected for sales tax revenue. Sales tax revenue was
budgeted to increase by $5.4 million in total over the prior year of which $1.8 million was
budgeted for the expected increase in sales tax collections from internet sales that was
effective for this current fiscal year. In addition during the State fiscal year 2019-20, State
Tax Law required the New York State Comptroller to withhold and pay the towns and
villages in the County from the sales tax remaining, after paying the BFSA, amounts equal
to the base level of grants that these municipalities had received from the State under the
AIM program in the State fiscal year 2018-19 as “AIM-related payments”. Such AIM-
related payments are made from the local, not the State, sales tax portion. The amount
redistributed as AIM-related payments in December 2019 was $379,060 and is estimated at
$75,095 for May 2020; an estimated total of $454,155 will be redistributed from the City in
2019-20 to effectuate such AIM-related payments. There was no fiscal implication as the
City had no right to the sales tax required to be withheld and distributed as AIM-related
payments pursuant to the Sales Tax Law Section 1261(c) (5-a).
The Tribal State Compact (“TSC”) revenue, or casino revenue, is related to the operation of
the Seneca Buffalo Creek gaming facility. The Seneca Gaming Corporation has not made
any TSC payments to New York State since December 2016, with the last cash receipt
received by the City in March 2017. The dispute went before a three-member arbitration
panel in December 2018 and an arbitration decision was made in favor of New York State,
stating that the Seneca Gaming Corporation was to continue making the previously agreed
upon payments. The Seneca Gaming Corporation appealed the decision to the U.S.
4
Department of Interior requesting the decision to be vacated, with the U.S. Department of
Interior ultimately declining to review the request. In June 2019, the Seneca Gaming
Corporation requested the U.S. District Court of Western New York vacate the arbitration
panel’s decision. In November 2019, the U.S. District Court of Western New York upheld
the arbitrators’ ruling noting the Seneca Gaming Corporation had previously agreed to
abide by the arbitration panel’s decision, which translated to the Seneca Gaming
Corporation wrongly withholding at least $255 million in casino revenue payments to New
York State and the host communities. It is expected that the Seneca Gaming Corporation
will resume payments, but it is unknown when the payments would begin again. New York
State provided an advance of $7.5 million in 2019 to the City, representing a portion of the
outstanding amount estimated at $17.0 million due to the City since such casino payments
had been halted.
• At the end of the second quarter there is a projected positive year-end variance in the
amount of $0.9 million for fines. A total of $13.7 million was budgeted under fines and the
year-end projection is estimated at $14.6 million. The positive variance is attributed to the
installation and enforcement of the school zone cameras as well as enhanced enforcement
of traffic laws around schools. This item was budgeted at $400,000 and is currently
projected at $1.2 million for year-end, representing a significant positive budget variance of
$800,000. The City has assumed an average of 500 violations per school day. The City
began enforcement and collection of fines in February 2020, four months after the cameras
were originally planned to go into operational service in November 2019.
All other fines on a net basis have a favorable year-end variance of $0.1 million and consist
of mainly parking fines and tags budgeted in the amount of $7.9 million and traffic
violations budgeted at $3.3 million. The City is not estimating a variance for these fines as
of December 31, 2019, however these revenue lines should continue to be monitored, since
parking fines and tags and traffic violations have historically been reported at less the
budgeted amount, and the school zone camera revenue is a new program with no past
experience to assist in estimating.
• Miscellaneous revenue is projected to have a positive budget variance of $1.0 million at
year-end. The projected variance is due to a $1.2 million Staffing for Adequate Fire and
Emergency Response program (“SAFER”) grant, which was awarded for the purpose of
bringing on and training additional firefighters; this is offset by a $200,000 unfavorable
variance across multiple miscellaneous revenues. This grant was not initially included in
the City’s 2019-20 Adopted Budget, which is creating the positive variance at this time.
There are corresponding expenditures of $1.2 million in the fire department for bringing on
the additional firefighter class. In addition, there remains $0.9 million budgeted for gifts
and donations as included within the miscellaneous revenue category. As of December 31,
2019, approximately $120,000 has been received. The City received approximately $0.8
million in gifts and donations in fiscal year 2018-19.
5
• At the end of the second quarter there is no projected variance in regard to the sale of City
capital assets and an unfavorable variance for the in-rem auction. The sale of capital assets
was $2.4 million as of December 31, 2019, compared to the adopted budget amount of $2.1
million. The in rem sale of properties was conducted in October 2019; the results of this
auction and the amount of proceeds to be retained by the City will be finalized in late
March, but it is estimated to be in the $3.0-$3.5 million range, compared to the budgeted
amount of $4.8 million.
• The remaining revenue categories including Interest, Licenses and Permits and Taxes which
collectively are projected to exceed budget by $1.1 million. Interest revenue at the end of
the second quarter is projected to be favorable at year-end by $0.5 million; this amount was
conservatively budgeted. Licenses and permits have a year-end projected favorable
variance of $0.3 million which is attributed to higher than expected building permits. Taxes
are trending $0.3 million higher than budget at year-end due to a favorable variance in
School Tax Relief (STAR) payments.
The City has determined there is no need to modify its budget at this time as in total there is a
positive budget variance projected for year-end for revenues.
Fiscal Year-End (FYE) 2018-19 Actual Revenues Compared to Fiscal Year (FY) 2019-20
Projected Revenues
Actual General Fund revenues, excluding transfers in, were $477.8 million for the year ended June
30, 2019. General Fund revenues projected for FYE 2019-20 as of the end of the second quarter are
$497.3 million, an increase of $19.5 million, or 4.1 percent, over the prior year.
Intergovernmental revenue is estimated to increase by $6.9 million, or 2.6 percent, due to a
projected increase year-to-year in TSC casino revenue of $3.5 million and approximately a $3.4
million increase in sales tax. The City did not receive any casino revenue in fiscal year 2017-18 and
was advanced $7.5 million out of an estimated $17.0 million due to the City in 2018-19.
On a year-to-year basis fines are increasing by $3.6 million, or 32.6 percent, due to an estimated
increase of $1.2 million attributed to the school zone cameras, estimated increases projected in the
amount of $0.7 million in parking tag fines and penalties, an increase of $0.6 million in fines and
penalties issued by the permits and inspections department, an increase of $0.5 million in court
fines, and an increase of $0.4 million in traffic violation fines.
Service charges revenue is projected to increase by $3.1 million, or 20.0 percent. The increase is
attributed to an expected increase of $1.4 million in increased parking fees due to an increase in the
number of available parking spots across the City, $1.1 million in rental dwelling registration fees,
and $0.3 million in towing and storage fees. All other service charges are projected to increase by
$0.3 million on a net basis.
6
Miscellaneous revenue is projected to increase by $4.7 million, or 41.8 percent. Of this amount,
$2.9 million is due to projected increases in the sale of capital assets, per the new in-rem auction
process, where the City takes ownership of properties prior to the properties going to auction. Once
the properties are auctioned off, the revenue generated is utilized to pay outstanding taxes and fees
on the property, with property owners having an opportunity to claim a portion of the sales proceeds
and the balance being made available to the City as revenue. There is also an increase of $1.2 due
to the new SAFER Grant for the fire department. All other miscellaneous revenue is projected to
increase $0.6 million on a year-to-year.
Taxes are projected to increase by $2.2 million, or 1.4 percent, on a year-to-year basis attributed to
the real property tax levy.
The remaining variances are minor as compared to the budget as a whole and are noted in the
categories of non-property taxes as a decrease of $1.7 million attributed to the class I utility tax, a
decrease of $0.2 million for interest income, and an increase of $0.8 million in licenses and permits.
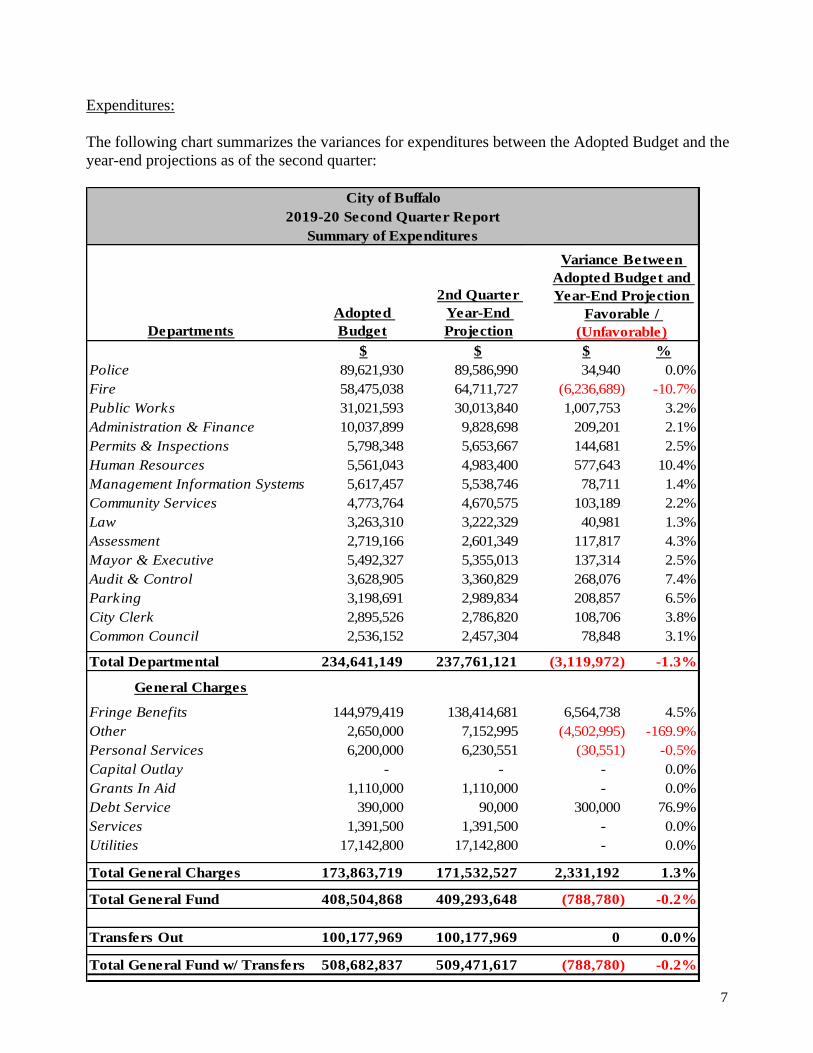
7
Expenditures:
The following chart summarizes the variances for expenditures between the Adopted Budget and the
year-end projections as of the second quarter:
Departments
Adopted
Budget
2nd Quarter
Year-End
Projection
$ $ $ %
Police 89,621,930 89,586,990 34,940 0.0%
Fire 58,475,038 64,711,727 (6,236,689) -10.7%
Public Works 31,021,593 30,013,840 1,007,753 3.2%
Administration & Finance 10,037,899 9,828,698 209,201 2.1%
Permits & Inspections 5,798,348 5,653,667 144,681 2.5%
Human Resources 5,561,043 4,983,400 577,643 10.4%
Management Information Systems 5,617,457 5,538,746 78,711 1.4%
Community Services 4,773,764 4,670,575 103,189 2.2%
Law 3,263,310 3,222,329 40,981 1.3%
Assessment 2,719,166 2,601,349 117,817 4.3%
Mayor & Executive 5,492,327 5,355,013 137,314 2.5%
Audit & Control 3,628,905 3,360,829 268,076 7.4%
Parking 3,198,691 2,989,834 208,857 6.5%
City Clerk 2,895,526 2,786,820 108,706 3.8%
Common Council 2,536,152 2,457,304 78,848 3.1%
Total Departmental 234,641,149 237,761,121 (3,119,972) -1.3%
General Charges
Fringe Benefits 144,979,419 138,414,681 6,564,738 4.5%
Other 2,650,000 7,152,995 (4,502,995) -169.9%
Personal Services 6,200,000 6,230,551 (30,551) -0.5%
Capital Outlay - - - 0.0%
Grants In Aid 1,110,000 1,110,000 - 0.0%
Debt Service 390,000 90,000 300,000 76.9%
Services 1,391,500 1,391,500 - 0.0%
Utilities 17,142,800 17,142,800 - 0.0%
Total General Charges 173,863,719 171,532,527 2,331,192 1.3%
Total General Fund 408,504,868 409,293,648 (788,780) -0.2%
Transfers Out 100,177,969 100,177,969 0 0.0%
Total General Fund w/ Transfers 508,682,837 509,471,617 (788,780) -0.2%
City of Buffalo
2019-20 Second Quarter Report
Summary of Expenditures
Variance Between
Adopted Budget and
Year-End Projection
Favorable /
(Unfavorable)
8
At the end of the second quarter, the City is projecting an unfavorable budgetary variance of $0.8
million based on an unfavorable variance of $3.1 million in departmental expenditures and a
favorable variance of $2.3 million for general charges.
The fire department has a year-end unfavorable variance projection of $6.2 million compared to the
adopted budget. The overage in the fire department expenditures is related to overtime costs due to
department vacancies; at the end of the second-quarter there were 46 vacancies representing 6.2
percent of the budgeted firefighter positions. In addition to those vacancies, the City has
approximately 40 firefighters out on injured-on-duty disability; these individuals represent a filled
budgeted position but as the individuals are unable to work, other firefighters must fill the shifts;
this has an impact of increasing City overtime costs. The City started the most recent fire academy
class of 52 recruits on February 17, 2020. The City assumed an attrition rate of approximately 20
FTE’s by year-end and currently does not expect to have that many retirees. Overtime for the fire
department is $4.1 million as of December 31, 2019, compared to the prior-year second quarter of
$5.2 million, and reflects a year-to-year decrease of $1.1 million. Total overtime expenditures for
the fire department in FY 2019 totaled $8.2 million, and the current year-end projection for
overtime is $8.3 million, representing an increase of $0.1 million on a year-to-year basis.
Compared to the 2019-20 Adopted Budget amount of $4.6 million, this would result in an overage
of $3.7 million in the current fiscal year.
The remaining fourteen departments are projected to be under budget at year-end with a combined
favorable variance of $3.1 million. These budgetary savings are attributed to lower than projected
staffing (i.e., vacancies), and to a lesser degree a decrease in the purchasing of supplies and services
contracts.
The police department is not projecting a variance with the adopted budget at the end of the second
quarter. Both the fire and police departments provide key public health and safety functions and
have minimum manning requirements. The police department is currently at 91.1 percent staffing
capacity with 71 vacancies, and the fire department is at 93.8 percent capacity with 46 vacancies.
Both departments have a sizable number of employees currently eligible for retirement or could be
eligible within the year. Currently in the fire department there are 64 individuals, or 9.2 percent of
the department, that are eligible for retirement by June 30, 2020. In the police department, there are
57 police officers, or 7.8 percent of the police department, who are eligible to retire by June 30,
2020.
Overtime in the police department for the current year is projected to exceed the budgeted amount.
Through the end of the second quarter, overtime for the police department totaled $4.8 million, an
increase of $0.4 million compared to the $4.4 million reported for the same period in the prior year.
The current projection for overtime is $9.6 million, which is $2.1 million over the Adopted Budget
amount of $7.5 million. Total overtime for FY 2019 was $9.5 million; the current year-end
projection represents an increase of $0.1 million on a year-to-year basis.
9
A new hire for a police officer or firefighter is counted towards the City’s total full-time equivalent
(“FTE”) staffing levels, but there is a lag between the time they are officially hired and serving in
the role due to required training. The training for a police officer includes five months of academy
training followed by an additional sixteen weeks of field training for a total of nine months from a
police officer's date of hire to be able to work independently. The fire academy lasts eighteen
weeks, and successful graduates are assigned to a fire company upon completion of the academy.
Staffing levels will be discussed in further detail later in this report.
General Charges are projected to be under the 2019-20 Adopted Budget by $2.3 million, or 1.3%.
Of that amount, $6.6 million is attributed to lower than budgeted fringe benefits, including a
favorable variance of $2.2 million for NYS Employee Retirement System (ERS) pension payments,
$1.8 million favorable variance for NYS Police and Fire retirement System (PFRS) pension
payments, and a positive variance of $1.6 million for health insurance for retirees and active
employees. All other fringe benefit costs project to have a net favorable variance of $1.0 million.
The City’s projection for actual fringe benefits expenditures may be understated at this time as it
does not reflect the vacancies that have been carried for the year or projected for the remainder of
the year.
In addition to fringe benefits, a $0.3 million favorable variance in General Charges is attributed to
lower-than-budgeted expenditures for debt service, due to the fact the City will not be issuing a
revenue anticipation note (“RAN”) this year; the City included $0.3 million for RAN interest in the
budget. These positive variances are offset by a projected unfavorable variance in judgments and
claims of $4.5 million for the settlement of a lawsuit against the City.
FYE 2018-19 Actual Expenditures Compared to FY 2019-20 Projected Expenditures
Actual General Fund expenditures for the year ended June 30, 2019 were $490.8 million. Projected
General Fund expenditures for 2019-20 are $509.5 million, representing an increase of $18.7
million, or 3.8 percent. Departmental costs are estimated to be $237.8 million at year-end, an
increase of $6.7 million, or 2.9 percent over the 2018-19 amount of $231.1 million. General
charges including transfers out are projected to increase by $12.0 million, or 4.6 percent, from
$259.7 million in the prior year 2018-19 to $271.7 million projected for the current year.
The year-to-year increase is comprised of the following:
Departmental Costs are increasing $6.7 million, or 2.9 percent:
• Employee compensation, excluding duty disability payments, is increasing $4.5 million, or
2.3 percent.
• Services are increasing $1.0 million, or 4.0 percent.
• Capital outlay is increasing $0.7 million, or 37.7 percent, and is attributed to the leasing of
27 police vehicles.
• Supplies are increasing $0.3 million, or 3.3 percent, and all other departmental costs are
increasing $148,000.
10
General Charges are currently projected to increase $12.0 million, or 4.6 percent:
• Employee benefits are increasing $5.1 million, 2.0 percent on a year-to-year basis, and
includes duty disability salary and the funds set aside for contract negotiations.
o Significant increases in fringe benefits include: an increase of $0.4 million or 1.1
percent for retiree health insurance, offset by a decrease of $1.5 million or 3.8
percent for active employee health insurance, $1.2 million increase for contributions
towards the police and fire retirement system, and $0.3 million increase for
contributions towards the employee retirement system. Employer payroll taxes are
increasing $1.2 million, or 8.5 percent.
o In addition, personal services are increasing $0.8 million, workers’ compensation
payments are increasing by $0.6 million, and the salary adjustment line for contract
negotiations is increasing $1.7 million. All other fringe benefits are increasing by
$0.4 million on a net basis.
• Interfund transfers out are increasing by $1.0 million, or 1.1 percent
• Other General Charges is increasing by $3.8 million, or 114.1 percent, due to a settlement of
a legal claim of $4.5 million against the city..
• There are additional increases under Grants-in-Aid in the amount of $0.7 million, or 165.5
percent. This variance is driven by prior-year actuals being lower than expected; $0.4
million was expended as compared to the budget of $0.9 million. From a budget-to-budget
comparison the increase is only $0.2 million. Utilities are increasing $1.2 million, or 7.8
percent. All other general charges are increasing by $0.1 million.
While expenditures are projected to increase on a year-to-year basis, actual 2019-20 expenditures
may not increase as much as currently projected at the end of the second quarter. Personnel costs
make up approximately 84 percent of the City’s operating budget and depending on the City’s
management of its workforce and filling of positions, the actual costs associated with employees
may be lower than currently projected when including salary, health insurance, payroll taxes and
pension contributions. When actual expenditures are compared to the adopted budget for 2018-19,
actual expenditures, excluding transfers out, totaled $391.6 million, or 94.5 percent of total
budgeted expenditures.
There are three unions currently out of contract that are expected to settle during the current fiscal
year including the Police Benevolent Association, Local 264 - Blue Collar, and the crossing guards.
The City did include resources for a portion of these additional costs in the adopted budget. Two
additional unions are set to expire at June 30, 2020, including the Building Inspectors and Operating
Engineers.
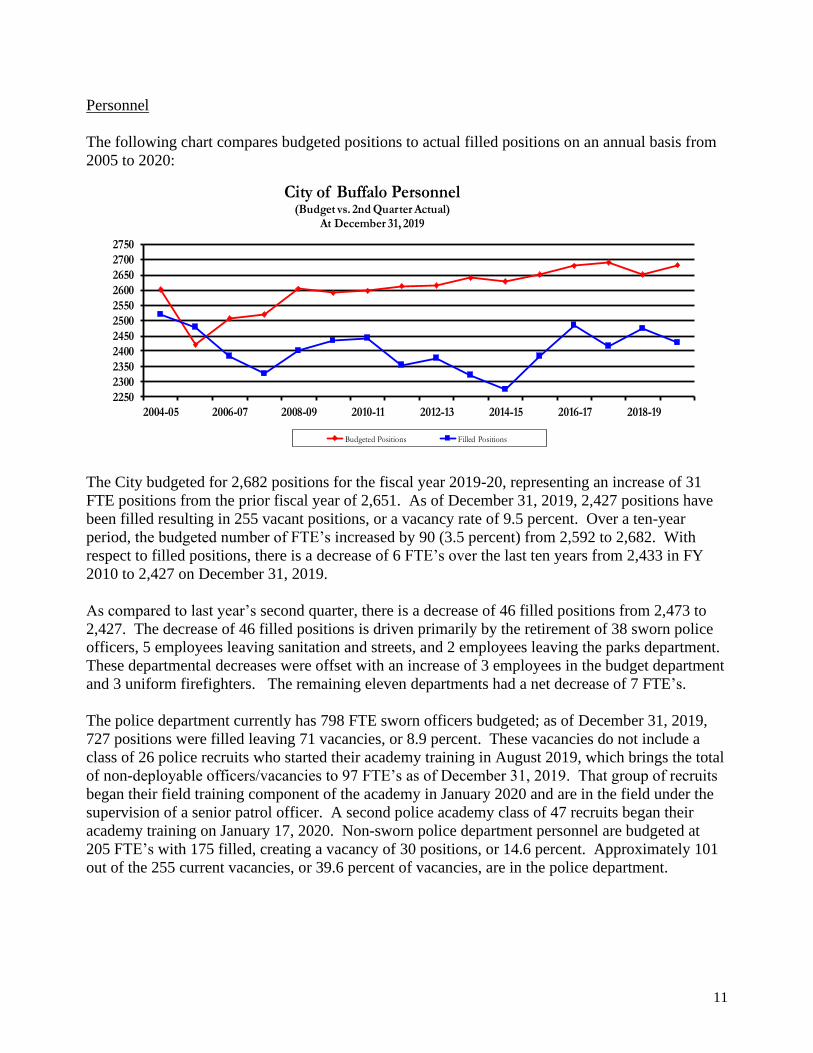
11
Personnel
The following chart compares budgeted positions to actual filled positions on an annual basis from
2005 to 2020:
2250
2300
2350
2400
2450
2500
2550
2600
2650
2700
2750
2004-05 2006-07 2008-09 2010-11 2012-13 2014-15 2016-17 2018-19
City of Buffalo Personnel(Budget vs. 2nd Quarter Actual)
At December 31, 2019
Budgeted Positions Filled Positions
The City budgeted for 2,682 positions for the fiscal year 2019-20, representing an increase of 31
FTE positions from the prior fiscal year of 2,651. As of December 31, 2019, 2,427 positions have
been filled resulting in 255 vacant positions, or a vacancy rate of 9.5 percent. Over a ten-year
period, the budgeted number of FTE’s increased by 90 (3.5 percent) from 2,592 to 2,682. With
respect to filled positions, there is a decrease of 6 FTE’s over the last ten years from 2,433 in FY
2010 to 2,427 on December 31, 2019.
As compared to last year’s second quarter, there is a decrease of 46 filled positions from 2,473 to
2,427. The decrease of 46 filled positions is driven primarily by the retirement of 38 sworn police
officers, 5 employees leaving sanitation and streets, and 2 employees leaving the parks department.
These departmental decreases were offset with an increase of 3 employees in the budget department
and 3 uniform firefighters. The remaining eleven departments had a net decrease of 7 FTE’s.
The police department currently has 798 FTE sworn officers budgeted; as of December 31, 2019,
727 positions were filled leaving 71 vacancies, or 8.9 percent. These vacancies do not include a
class of 26 police recruits who started their academy training in August 2019, which brings the total
of non-deployable officers/vacancies to 97 FTE’s as of December 31, 2019. That group of recruits
began their field training component of the academy in January 2020 and are in the field under the
supervision of a senior patrol officer. A second police academy class of 47 recruits began their
academy training on January 17, 2020. Non-sworn police department personnel are budgeted at
205 FTE’s with 175 filled, creating a vacancy of 30 positions, or 14.6 percent. Approximately 101
out of the 255 current vacancies, or 39.6 percent of vacancies, are in the police department.
12
The fire department has 742 FTE uniformed officers budgeted, and currently 696 of those positions
are filled, representing a vacancy rate of 46 positions, or 6.2 percent. The vacancy rate of 46 is
equivalent to 18.0 percent of total City vacancies as of December 31, 2019. The City increased the
number of budgeted firefighter positions in the 2018-19 budget to 742 FTE’s to provide the
department additional positions so they could bring on additional fire academy classes. Previously
the fire department was budgeted at 717 FTE’s and the increase of 25 positions to 742 FTE’s was to
provide the City with a cushion for hiring purposes. The current fire academy class of 52
firefighters are slated to be assigned to fire houses in June 2020. As of December 31, 2019, there
were 46 uniformed vacancies in the fire department, as well as approximately 40 employees on
long-term injured-on-duty disability, for an effective vacancy of 84 FTE’s or 11.3 percent of the
departments firefighters.
On a year-to-year basis, the City has increased the number of filled firefighter positions from 693
FTE’s at December 31, 2018 to 696 FTE’s at December 31, 2019, an increase of 3 FTE’s, or 0.4
percent, on an annual basis. Police FTE’s have decreased over the same period from 765 FTE’s to
727 FTE’s, a net decrease of 38 FTE’s or 5.0 percent.
Summary and Recommendations:
As of December 31, 2019, the City is projecting operating results will be consistent with the budget;
a minor surplus of $1.1 million is estimated for the year ending June 30, 2020. At the conclusion of
the previous fiscal year ended June 30, 2019, the City reported unrestricted fund balance of
$51,544,337; reported unassigned fund balance was $0. A year-end deficit would result in a
decrease in unrestricted fund balance. It is noted that the Emergency Stabilization Fund, referred to
commonly as the Rainy Day Fund, has been consistently maintained at 30 days of expenditures and
reported a balance of $38,529,527 at June 30, 2019.
The City budgeted for current year estimated casino revenue and excluded the past amount due; this
past amount is estimated at $9.5 million. The receipt of these funds would replenish unrestricted
fund balance. It is not currently known when these funds will be received.
Revenues should continue to be monitored for unusual or significant fluctuations from budgeted
amounts, and the financial plan should be modified as necessary.
Expenditures are currently projected to be unfavorable on a net basis at year-end by $0.8 million.
The projection is conservative as it assumes all vacancies will be filled for the entirety of the last six
months of the fiscal year. The most significant projected budgetary variance is within the fire
department. We recommend the City assess the projected expenditures in the current financial plan
and adjust the upcoming May 2020 financial plan as appropriate.
BUFFALO FISCAL STABILITY AUTHORITY
New York State Governor’s Proposed BudgetState Fiscal Year 2020-2021
City of Buffalo
1
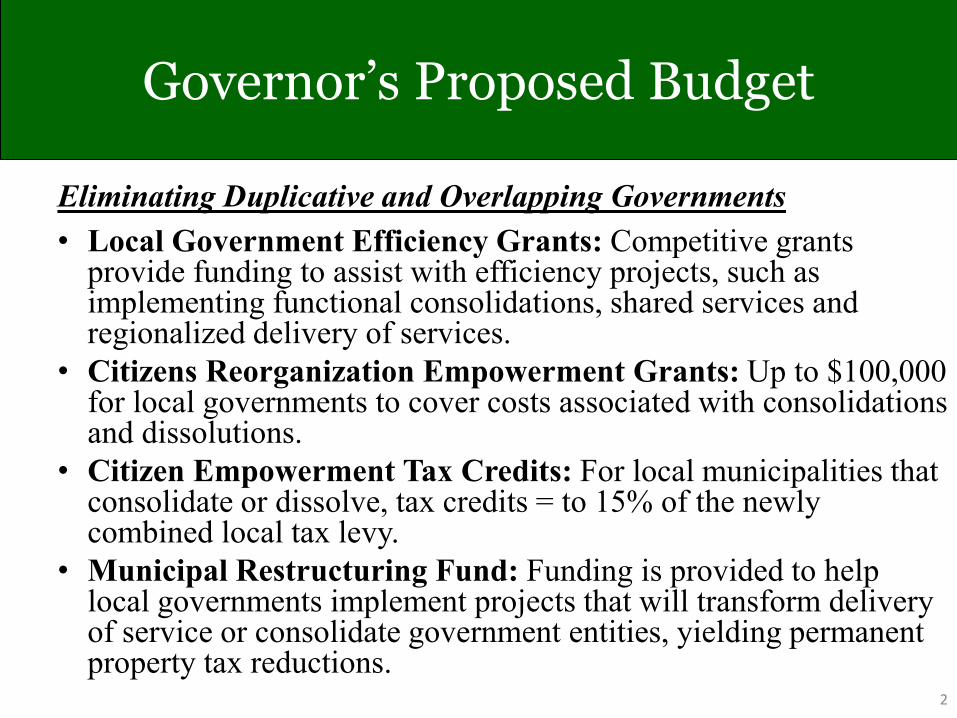
Governor’s Proposed Budget
Eliminating Duplicative and Overlapping Governments
• Local Government Efficiency Grants: Competitive grants provide funding to assist with efficiency projects, such as implementing functional consolidations, shared services and regionalized delivery of services.
• Citizens Reorganization Empowerment Grants: Up to $100,000 for local governments to cover costs associated with consolidations and dissolutions.
• Citizen Empowerment Tax Credits: For local municipalities that consolidate or dissolve, tax credits = to 15% of the newly combined local tax levy.
• Municipal Restructuring Fund: Funding is provided to help local governments implement projects that will transform delivery of service or consolidate government entities, yielding permanent property tax reductions.
2
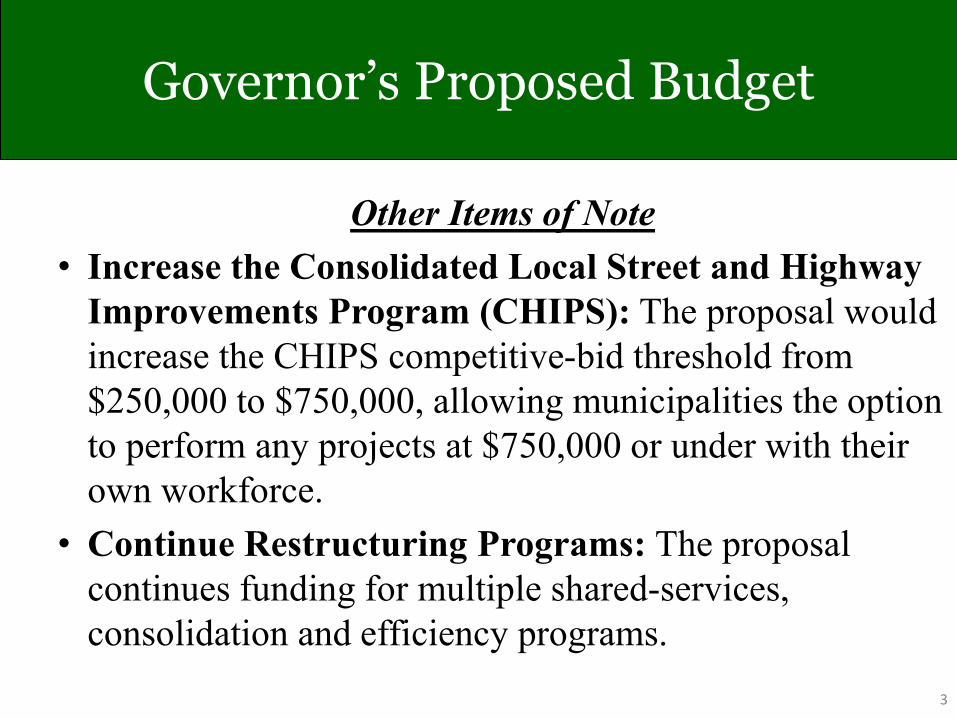
Governor’s Proposed Budget
Other Items of Note
• Increase the Consolidated Local Street and Highway
Improvements Program (CHIPS): The proposal would
increase the CHIPS competitive-bid threshold from
$250,000 to $750,000, allowing municipalities the option
to perform any projects at $750,000 or under with their
own workforce.
• Continue Restructuring Programs: The proposal
continues funding for multiple shared-services,
consolidation and efficiency programs.
3
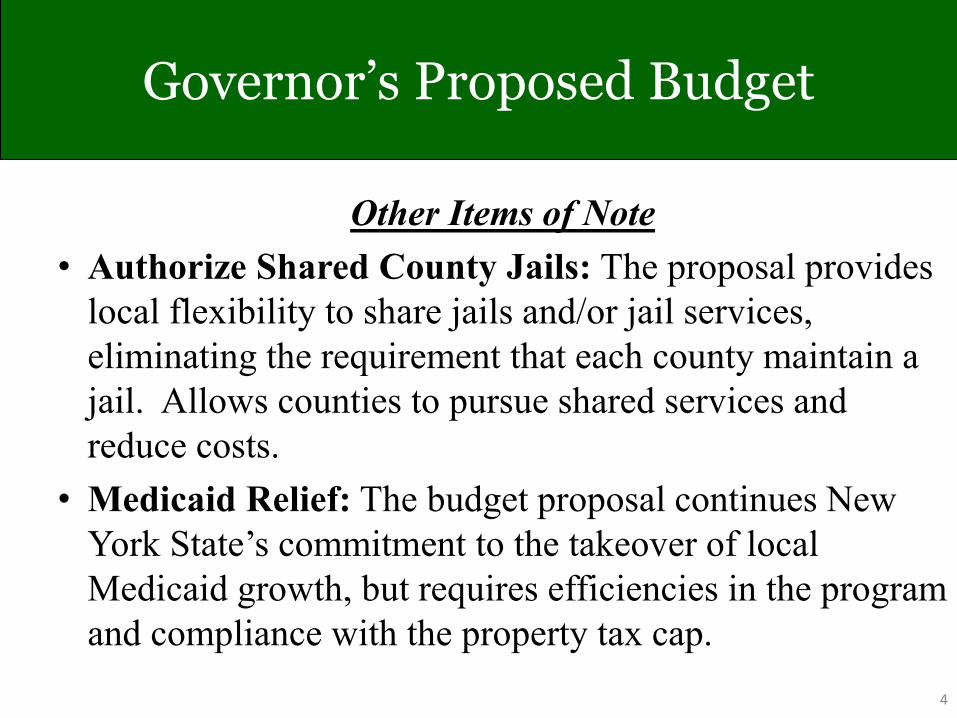
Governor’s Proposed Budget
Other Items of Note
• Authorize Shared County Jails: The proposal provides
local flexibility to share jails and/or jail services,
eliminating the requirement that each county maintain a
jail. Allows counties to pursue shared services and
reduce costs.
• Medicaid Relief: The budget proposal continues New
York State’s commitment to the takeover of local
Medicaid growth, but requires efficiencies in the program
and compliance with the property tax cap.
4
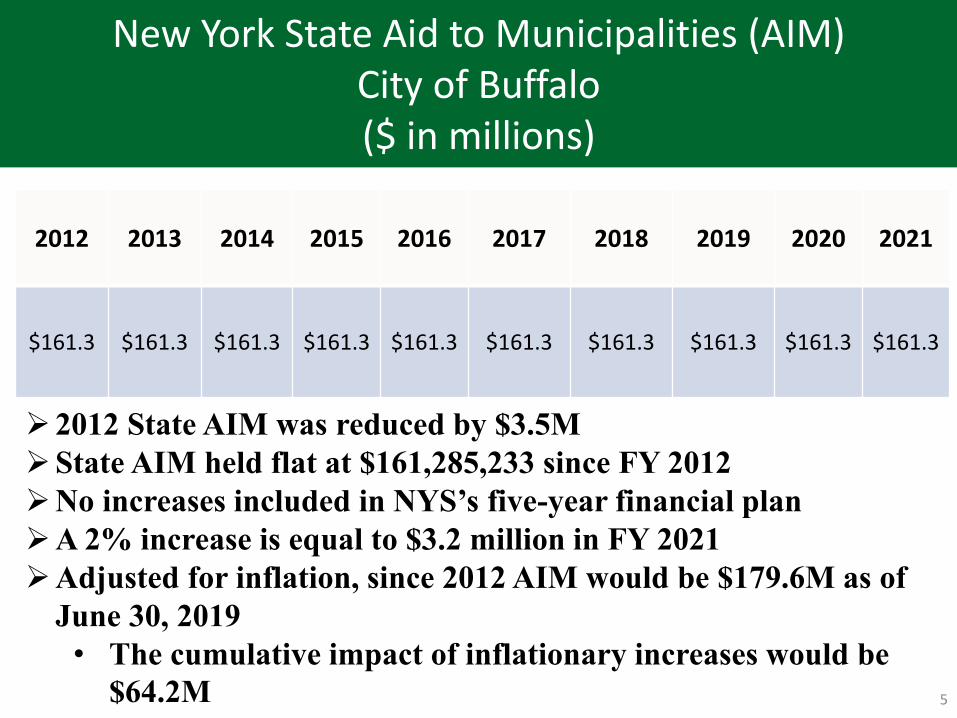
New York State Aid to Municipalities (AIM)City of Buffalo($ in millions)
5
➢2012 State AIM was reduced by $3.5M
➢State AIM held flat at $161,285,233 since FY 2012
➢No increases included in NYS’s five-year financial plan
➢A 2% increase is equal to $3.2 million in FY 2021
➢Adjusted for inflation, since 2012 AIM would be $179.6M as of
June 30, 2019
• The cumulative impact of inflationary increases would be
$64.2M
2012 2013 2014 2015 2016 2017 2018 2019 2020 2021
$161.3 $161.3 $161.3 $161.3 $161.3 $161.3 $161.3 $161.3 $161.3 $161.3
~1~
BUFFALO FISCAL STABILITY AUTHORITY
Analysis of the Buffalo City School District’s FY 2019-20 Second Quarter
The following is the Buffalo Fiscal Stability Authority’s (BFSA’s) analysis of the Buffalo City
School District’s (District’s) fiscal year (FY) 2019-20 second quarter report (Second Quarter
report). The Second Quarter report includes the District’s current fiscal year-end (CFYE)
projections as of January 15, 2020 based on the actual financial results recorded at December 31,
2019.
Summary
The following summarizes the District’s highlights since the start of FY 2019-20:
• The FY 2019-20 Adopted Budget (Adopted Budget) was modified at July 1, 2019 to
include $3.7 million of carryover encumbrances.
• The District and the Professional, Clerical, and Technical Employees’ Association
(PCTEA) agreed to a tentative collective bargaining agreement (CBA). The BFSA
reviewed the CBA on July 29, 2019. The Board of Education ratified the agreement on
August 21, 2019.
• The District and the American Federation of State, County & Municipal Employees,
Local 264, AFL-CIO Cook Managers agreed to a tentative CBA. The BFSA reviewed
the CBA on October 29, 2019. The Board of Education ratified the agreement on
November 30, 2019.
• The District and the Substitutes United/Buffalo – NYSUT union agreed to a successor
agreement on December 12, 2019. The BFSA reviewed the tentative labor agreement on
February 25, 2020. The Board of Education will consider the labor agreement on March
18, 2020.
• The District has forecasted a CFYE $7.4 million budgetary surplus and an actual $2.6
million deficit. The Adopted Budget included a deficit of $10.0 million.
• The FY 2019-20 Modified Budget (Modified Budget) includes 4,879 full-time equivalent
(FTE) positions, an increase of 46 FTEs from the Adopted Budget and includes 46
additional teachers.
General Fund Revenues
General Fund revenues total $917.4 million in the Adopted Budget. Actual General Fund
revenues at December 31, 2019 were $268.6 million. The District is forecasting CFYE revenues
to be less than budgeted with an overall unfavorable budgetary variance of $3.1 million. The
District’s revised forecast for Erie County Sales Tax receipts and the federal Medicaid
reimbursement are favorable by $1.5 million and $0.6 million respectively. Overall New York
State Aid is forecast to be unfavorable by $5.2 million. The CFYE forecasts are based on actual
revenue receipts year-to-date at December 31, 2019 and/or anticipated revenue receipts,
compared to budgeted receipts. BFSA has examined actual Erie County Sales Tax receipts and
believes that a projection of $50.5 million to $52.7 million is reasonable given actual receipts
year-to-date. Recent economic concerns including diminished consumer confidence may inhibit
revenue growth to this level.
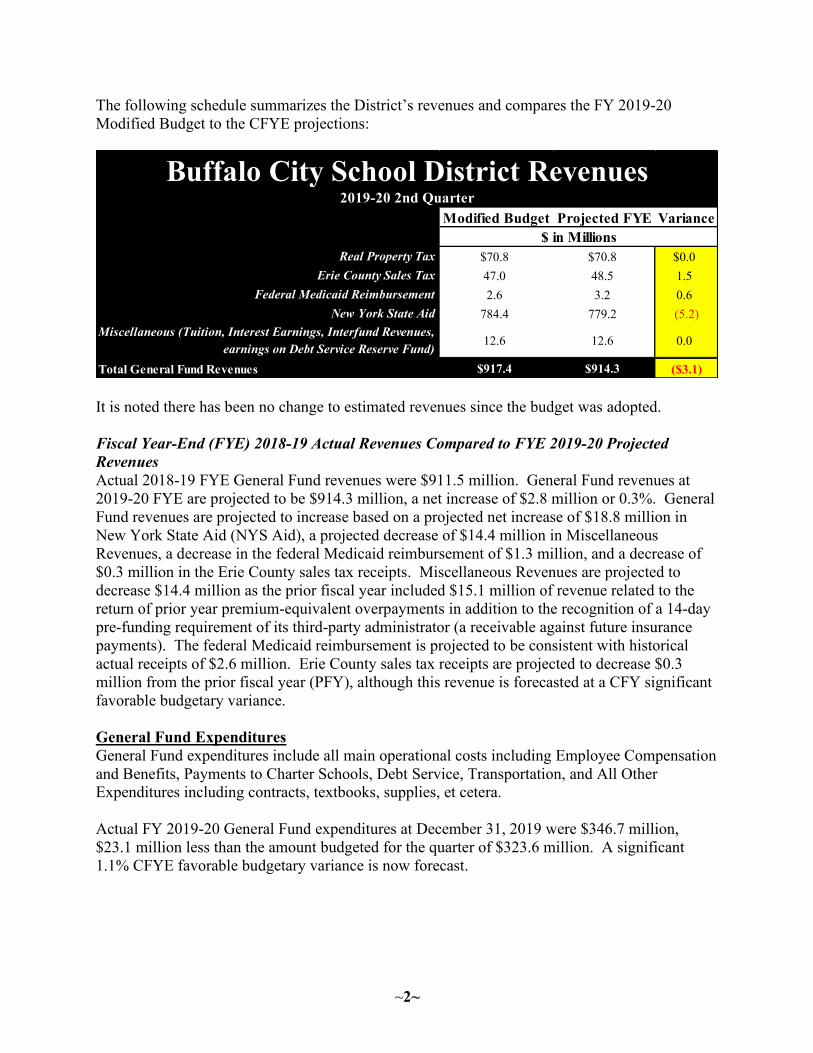
~2~
The following schedule summarizes the District’s revenues and compares the FY 2019-20
Modified Budget to the CFYE projections:
It is noted there has been no change to estimated revenues since the budget was adopted.
Fiscal Year-End (FYE) 2018-19 Actual Revenues Compared to FYE 2019-20 Projected
Revenues
Actual 2018-19 FYE General Fund revenues were $911.5 million. General Fund revenues at
2019-20 FYE are projected to be $914.3 million, a net increase of $2.8 million or 0.3%. General
Fund revenues are projected to increase based on a projected net increase of $18.8 million in
New York State Aid (NYS Aid), a projected decrease of $14.4 million in Miscellaneous
Revenues, a decrease in the federal Medicaid reimbursement of $1.3 million, and a decrease of
$0.3 million in the Erie County sales tax receipts. Miscellaneous Revenues are projected to
decrease $14.4 million as the prior fiscal year included $15.1 million of revenue related to the
return of prior year premium-equivalent overpayments in addition to the recognition of a 14-day
pre-funding requirement of its third-party administrator (a receivable against future insurance
payments). The federal Medicaid reimbursement is projected to be consistent with historical
actual receipts of $2.6 million. Erie County sales tax receipts are projected to decrease $0.3
million from the prior fiscal year (PFY), although this revenue is forecasted at a CFY significant
favorable budgetary variance.
General Fund Expenditures
General Fund expenditures include all main operational costs including Employee Compensation
and Benefits, Payments to Charter Schools, Debt Service, Transportation, and All Other
Expenditures including contracts, textbooks, supplies, et cetera.
Actual FY 2019-20 General Fund expenditures at December 31, 2019 were $346.7 million,
$23.1 million less than the amount budgeted for the quarter of $323.6 million. A significant
1.1% CFYE favorable budgetary variance is now forecast.
Modified Budget Projected FYE Variance
Real Property Tax $70.8 $70.8 $0.0
Erie County Sales Tax 47.0 48.5 1.5
Federal Medicaid Reimbursement 2.6 3.2 0.6
New York State Aid 784.4 779.2 (5.2)
Miscellaneous (Tuition, Interest Earnings, Interfund Revenues,
earnings on Debt Service Reserve Fund)12.6 12.6 0.0
Total General Fund Revenues $917.4 $914.3 ($3.1)
Buffalo City School District Revenues2019-20 2nd Quarter
$ in Millions
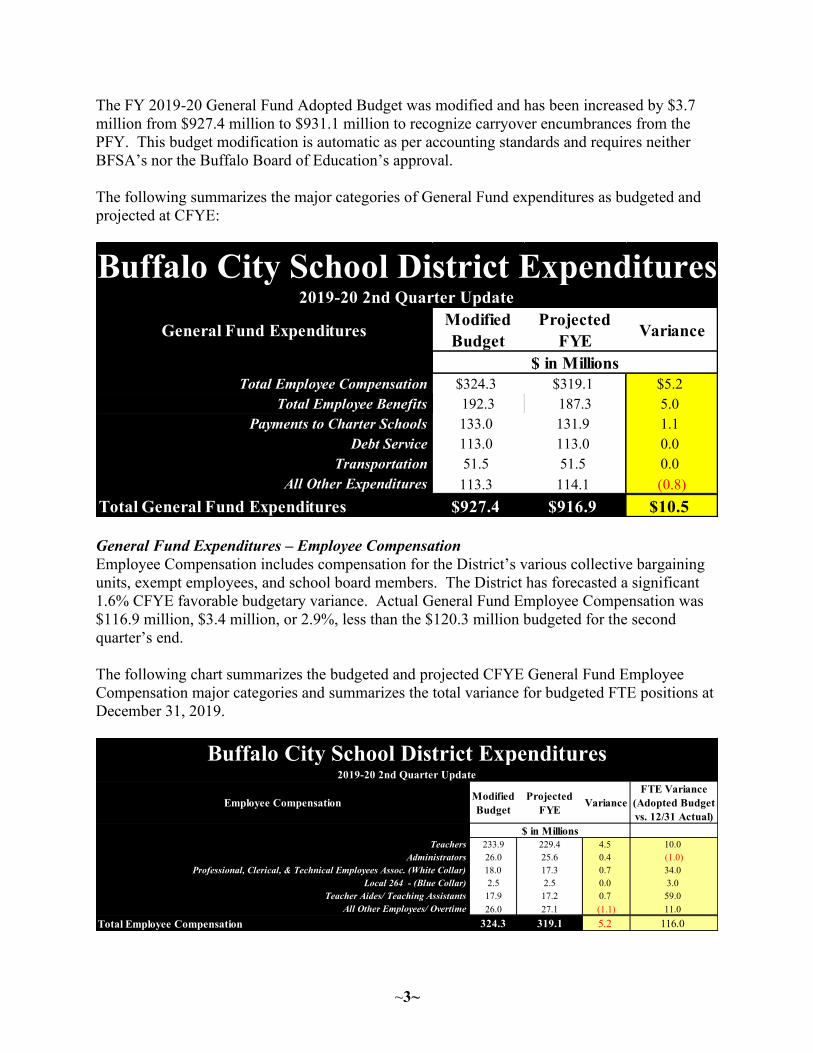
~3~
The FY 2019-20 General Fund Adopted Budget was modified and has been increased by $3.7
million from $927.4 million to $931.1 million to recognize carryover encumbrances from the
PFY. This budget modification is automatic as per accounting standards and requires neither
BFSA’s nor the Buffalo Board of Education’s approval.
The following summarizes the major categories of General Fund expenditures as budgeted and
projected at CFYE:
General Fund Expenditures – Employee Compensation
Employee Compensation includes compensation for the District’s various collective bargaining
units, exempt employees, and school board members. The District has forecasted a significant
1.6% CFYE favorable budgetary variance. Actual General Fund Employee Compensation was
$116.9 million, $3.4 million, or 2.9%, less than the $120.3 million budgeted for the second
quarter’s end.
The following chart summarizes the budgeted and projected CFYE General Fund Employee
Compensation major categories and summarizes the total variance for budgeted FTE positions at
December 31, 2019.
General Fund ExpendituresModified
Budget
Projected
FYEVariance
Total Employee Compensation $324.3 $319.1 $5.2
Total Employee Benefits 192.3 187.3 5.0
Payments to Charter Schools 133.0 131.9 1.1
Debt Service 113.0 113.0 0.0
Transportation 51.5 51.5 0.0
All Other Expenditures 113.3 114.1 (0.8)
Total General Fund Expenditures $927.4 $916.9 $10.5
Buffalo City School District Expenditures2019-20 2nd Quarter Update
$ in Millions
Employee CompensationModified
Budget
Projected
FYEVariance
FTE Variance
(Adopted Budget
vs. 12/31 Actual)
Teachers 233.9 229.4 4.5 10.0
Administrators 26.0 25.6 0.4 (1.0)
Professional, Clerical, & Technical Employees Assoc. (White Collar) 18.0 17.3 0.7 34.0
Local 264 - (Blue Collar) 2.5 2.5 0.0 3.0
Teacher Aides/ Teaching Assistants 17.9 17.2 0.7 59.0
All Other Employees/ Overtime 26.0 27.1 (1.1) 11.0
Total Employee Compensation 324.3 319.1 5.2 116.0
Buffalo City School District Expenditures2019-20 2nd Quarter Update
$ in Millions
~4~
The District has forecasted a CFYE Employee Compensation favorable budgetary variance of
$5.2 million. Buffalo Teachers Federation (Teachers) compensation is forecasted at $229.4
million at CFYE, or a $4.5 million favorable budgetary projection due to the overall level of
vacant positions for the first six months of the year and lower-than-budgeted salaries.
Compensation for the Administrators, PCTEA, and Buffalo Educational Support Team (teacher
aides/teaching assistants) is forecast favorably at CFYE by $1.8 million based on the overall
level of vacancies through December 31, 2019. Substitute teacher compensation is forecast
unfavorably at CFYE by $0.8 based on the actual year-to-date utilization at December 31, 2019.
The Board of Education ratified a CBA with PCTEA on August 21, 2019. The BFSA estimated
that approval of the CBA would have a net current fiscal year (CFY) General Fund cost of $2.0
million and a $8.0 million net cost increase over the General Fund’s Financial Plan.
The Board of Education is expected to ratify a successor agreement with the Substitutes union.
The contract period of the successor agreement is July 1, 2019 to June 30, 2021, covering a two-
year period. The previous labor agreement expired June 30, 2019. The BFSA estimated that this
labor agreement would have a minimal impact of $289,863 in FY 2019-20 and a $2.3 million
estimated cost over the Financial Plan.
Overtime utilization is currently over budget and forecast to be unfavorable by $0.3 million at
CFYE due primarily to overtime needs within the District’s Department of Plant Services.
Personnel
The FY 2019-20 Adopted Budget included 4,833 budgeted FTE positions. At December 31,
2019, the District had 163 vacant FTE positions as compared to the Adopted Budget,
representing a vacancy rate of 3.4%. The vacancies consisted of 51.3 teacher aides and teaching
assistants, 48 PCTEA employees, 41 Teacher positions, 7 Local 264 blue-collar employees, 11
Local 409 operating engineers, and 3.4 exempt employees.
On a District-wide basis the District had 5,465 actual FTEs at December 31, 2019, which was
179 FTEs fewer than budgeted.
General Fund Expenditures – Employee Benefits
Employee Benefits include the cost of non-salary and wage compensation to District employees
including payments to the New York State Employees’ Retirement System, New York State
Teachers’ Retirement System, employer payroll taxes, health insurance costs for both active
employees and retirees, and other miscellaneous fringe benefits.
Actual General Fund Employee Benefits were $82.7 million at December 31, 2019, $4.7 million
less than the $87.4 million budgeted for the second quarter. The District has forecast a CFYE
$5.0 million favorable budgetary variance. Active and retiree health insurance expenditures are
forecast to be $4.3 million less than budget at CFYE, based on actual expenditures at December
31, 2019. Retiree health insurance has been favorably impacted by the reduced cost of Medicare
Advantage plans from a new service provider; the District approved a Group Medicare
Advantage maintenance agreement with Independent Health on October 30, 2019 for calendar
years 2020 through 2023. The calendar year 2020 estimated cost for Independent Health to
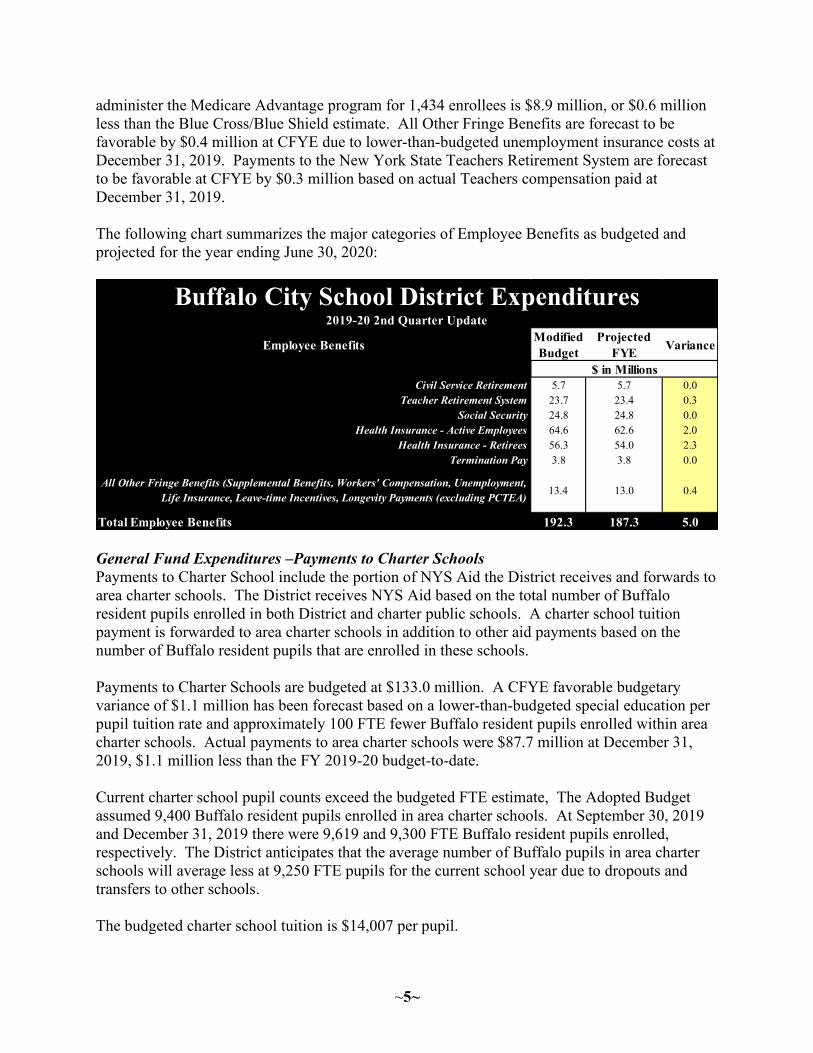
~5~
administer the Medicare Advantage program for 1,434 enrollees is $8.9 million, or $0.6 million
less than the Blue Cross/Blue Shield estimate. All Other Fringe Benefits are forecast to be
favorable by $0.4 million at CFYE due to lower-than-budgeted unemployment insurance costs at
December 31, 2019. Payments to the New York State Teachers Retirement System are forecast
to be favorable at CFYE by $0.3 million based on actual Teachers compensation paid at
December 31, 2019.
The following chart summarizes the major categories of Employee Benefits as budgeted and
projected for the year ending June 30, 2020:
General Fund Expenditures –Payments to Charter Schools
Payments to Charter School include the portion of NYS Aid the District receives and forwards to
area charter schools. The District receives NYS Aid based on the total number of Buffalo
resident pupils enrolled in both District and charter public schools. A charter school tuition
payment is forwarded to area charter schools in addition to other aid payments based on the
number of Buffalo resident pupils that are enrolled in these schools.
Payments to Charter Schools are budgeted at $133.0 million. A CFYE favorable budgetary
variance of $1.1 million has been forecast based on a lower-than-budgeted special education per
pupil tuition rate and approximately 100 FTE fewer Buffalo resident pupils enrolled within area
charter schools. Actual payments to area charter schools were $87.7 million at December 31,
2019, $1.1 million less than the FY 2019-20 budget-to-date.
Current charter school pupil counts exceed the budgeted FTE estimate, The Adopted Budget
assumed 9,400 Buffalo resident pupils enrolled in area charter schools. At September 30, 2019
and December 31, 2019 there were 9,619 and 9,300 FTE Buffalo resident pupils enrolled,
respectively. The District anticipates that the average number of Buffalo pupils in area charter
schools will average less at 9,250 FTE pupils for the current school year due to dropouts and
transfers to other schools.
The budgeted charter school tuition is $14,007 per pupil.
Employee BenefitsModified
Budget
Projected
FYEVariance
Civil Service Retirement 5.7 5.7 0.0
Teacher Retirement System 23.7 23.4 0.3
Social Security 24.8 24.8 0.0
Health Insurance - Active Employees 64.6 62.6 2.0
Health Insurance - Retirees 56.3 54.0 2.3
Termination Pay 3.8 3.8 0.0
All Other Fringe Benefits (Supplemental Benefits, Workers' Compensation, Unemployment,
Life Insurance, Leave-time Incentives, Longevity Payments (excluding PCTEA)13.4 13.0 0.4
Total Employee Benefits 192.3 187.3 5.0
Buffalo City School District Expenditures2019-20 2nd Quarter Update
$ in Millions
~6~
The District’s charter school expenditures can be difficult to budget in that, while seating
capacity is known for these schools, enrollment is open to public school pupils of neighboring
communities. It is therefore somewhat difficult to project the actual number of Buffalo resident
pupils that will ultimately enroll, particularly in charter schools located outside of incorporated
City of Buffalo limits. Additionally, when applications for enrollment in area charter schools
exceeds capacity, admission is based on a random or “blind” lottery that cannot consider any
criteria such as the applicants’ gender, ethnicity, disability, economic status, etc. As such, the
portion of the charter school payment forwarded to area charter schools can be difficult to
project.
General Fund Expenditures – Debt Service
Debt Service payments include the principal and interest the District pays for outstanding debt.
At December 31, 2019, the District is not projecting any CFYE variances in debt service
expenditures. Actual payments were $19.2 million equal to the budget-to-date amount. Debt
service payments have predetermined payment dates and amounts. It is budgeted at $113.0
million for FY 2019-20.
General Fund Expenditures – Transportation
Transportation expenditures include the District’s transportation costs to bus District, area
charter, special education students at agencies, and non-public resident pupils. This includes
transportation to and from schools for regular school days, afterschool programs, and summer
school busing.
Transportation expenditures are budgeted at $51.5 million for FY 2019-20. No budgetary
variance is currently projected for this expenditure. Actual Transportation expenditures were
$8.3 million at December 31, 2019, $8.5 million less than the budget-to-date amount due to the
timing of vendor payments made. The District receives an approximate 90% reimbursement for
eligible transportation-related expenditures in the form of the following year’s New York State
Transportation Aid.
The District utilizes both private and public carriers for pupil transportation. The approved
private carrier contract is with First Student, Inc. The current contract expires at CFYE. First
Student successfully completed a Request For Proposal (RFP) process and will continue as the
District’s private carrier through FY 2025.
The approved public carrier contract is with the Niagara Frontier Transportation Authority
(NFTA). The NFTA provides transit passes for pupils in grades nine through twelve. Both
contracts provide transportation for Buffalo resident pupils in public schools including District
schools and area charter schools, non-public students, and agency and foster students.
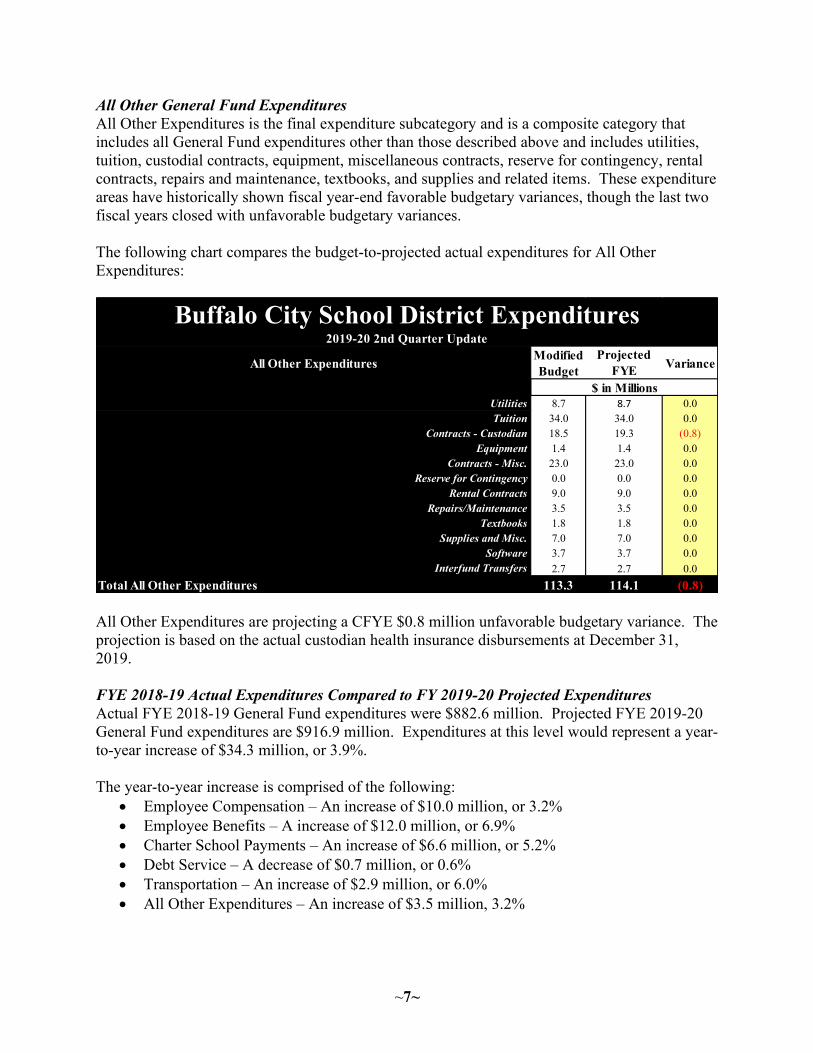
~7~
All Other General Fund Expenditures
All Other Expenditures is the final expenditure subcategory and is a composite category that
includes all General Fund expenditures other than those described above and includes utilities,
tuition, custodial contracts, equipment, miscellaneous contracts, reserve for contingency, rental
contracts, repairs and maintenance, textbooks, and supplies and related items. These expenditure
areas have historically shown fiscal year-end favorable budgetary variances, though the last two
fiscal years closed with unfavorable budgetary variances.
The following chart compares the budget-to-projected actual expenditures for All Other
Expenditures:
All Other Expenditures are projecting a CFYE $0.8 million unfavorable budgetary variance. The
projection is based on the actual custodian health insurance disbursements at December 31,
2019.
FYE 2018-19 Actual Expenditures Compared to FY 2019-20 Projected Expenditures
Actual FYE 2018-19 General Fund expenditures were $882.6 million. Projected FYE 2019-20
General Fund expenditures are $916.9 million. Expenditures at this level would represent a year-
to-year increase of $34.3 million, or 3.9%.
The year-to-year increase is comprised of the following:
• Employee Compensation – An increase of $10.0 million, or 3.2%
• Employee Benefits – A increase of $12.0 million, or 6.9%
• Charter School Payments – An increase of $6.6 million, or 5.2%
• Debt Service – A decrease of $0.7 million, or 0.6%
• Transportation – An increase of $2.9 million, or 6.0%
• All Other Expenditures – An increase of $3.5 million, 3.2%
All Other ExpendituresModified
Budget
Projected
FYEVariance
Utilities 8.7 8.7 0.0
Tuition 34.0 34.0 0.0
Contracts - Custodian 18.5 19.3 (0.8)
Equipment 1.4 1.4 0.0
Contracts - Misc. 23.0 23.0 0.0
Reserve for Contingency 0.0 0.0 0.0
Rental Contracts 9.0 9.0 0.0
Repairs/Maintenance 3.5 3.5 0.0
Textbooks 1.8 1.8 0.0
Supplies and Misc. 7.0 7.0 0.0
Software 3.7 3.7 0.0
Interfund Transfers 2.7 2.7 0.0
Total All Other Expenditures 113.3 114.1 (0.8)
$ in Millions
Buffalo City School District Expenditures2019-20 2nd Quarter Update
~8~
Non-Major Governmental Funds
Food Service Fund
The Food Service fund administers the District’s food service program. The District provides
breakfast, lunch and afterschool snacks to all District students as well as six Buffalo charter
schools, students at the Buffalo Hearing & Speech Center, three non-public schools, and two out-
of-District charter schools. The District administers an additional summer food service program
to provide meals to summer school pupils, various organizations, and parks and community
centers.
The Food Service FY 2019-20 Adopted Budget is as follows:
• Revenues - $36.0 million
• Expenditures - $41.6 million
• Fund balance - $5.6 million
The FY 2019-20 Adopted Budget includes the draw-down of $5.6 million of Assigned fund
balance to close the budgetary gap.
The FY 2019-20 Adopted Budget was automatically modified on July 1, 2019 for $0.3 million in
carryover encumbrances. The District has not made any new FYE revenues or expenditures
projections.
On November 20, 2019, the District approved a collective bargaining agreement (CBA) with the
American Federation of State, County & Municipal Employees, Local 264, AFL-CIO Cook
Managers. The CBA’s contract period covers a five-year period between July 1, 2017 to June
30, 2022. The previous agreement expired June 30, 2017. The BFSA estimated that the CBA
would have a FY 2019-20 net cost of $103,192 and a $652,727 estimated cost over the Financial
Plan. The Financial Plan incorporated an assumption of a settled CBA at $50,125; the net impact
on the Financial Plan was estimated at $602,602.
The District conveyed that fund balance is adequate to absorb the incremental costs of the
tentative CBA and a result, did not modify the Financial Plan. At June 30, 2019 fund balance
was $17.3 million. This reserve may only be used for Food Service expenditures and was
approximately 46% of fiscal year (FY) 2018-19 expenditures.
Special Projects Fund
The Special Projects Fund accounts for grants received from Federal, State, and local sources to
supplement services provided in the General Fund. The FY 2019-20 Special Projects Budget
totaled $102.2 million and was modified to show the award of new grants. The Special Projects
Fund totals $110.5 million.
~9~
Conclusions
The District’s FY 2019-20 budget is currently balanced with the appropriation of $10.0 million
of fund balance. A $7.4 million favorable budgetary surplus is projected as overall revenues are
forecast to be unfavorable by $3.1 million and overall expenditures are forecast to be favorable
by $10.5 million at CFYE.
The District had a substantial vacancy rate of 3.4% at December 31, 2019. The District is now
forecasting significant, favorable budgetary variances within various Employee Compensation
and Employee Benefit lines. The forecast is based on actual employee vacancy levels from July
1, 2019 through December 31, 2019. The Modified Budget assumes 0% vacancy rate for the
remaining two quarters of the fiscal year. The District will likely see a greater favorable
budgetary variance for employee compensation and fringe benefits if a substantial vacancy rate
persists for the remainder of the fiscal year. Additionally, it appears the District is
underestimating sales tax revenue for the year.
Overall, the District’s year-end projections are conservatively made with final operating results
expected to exceed the current projections favorably.
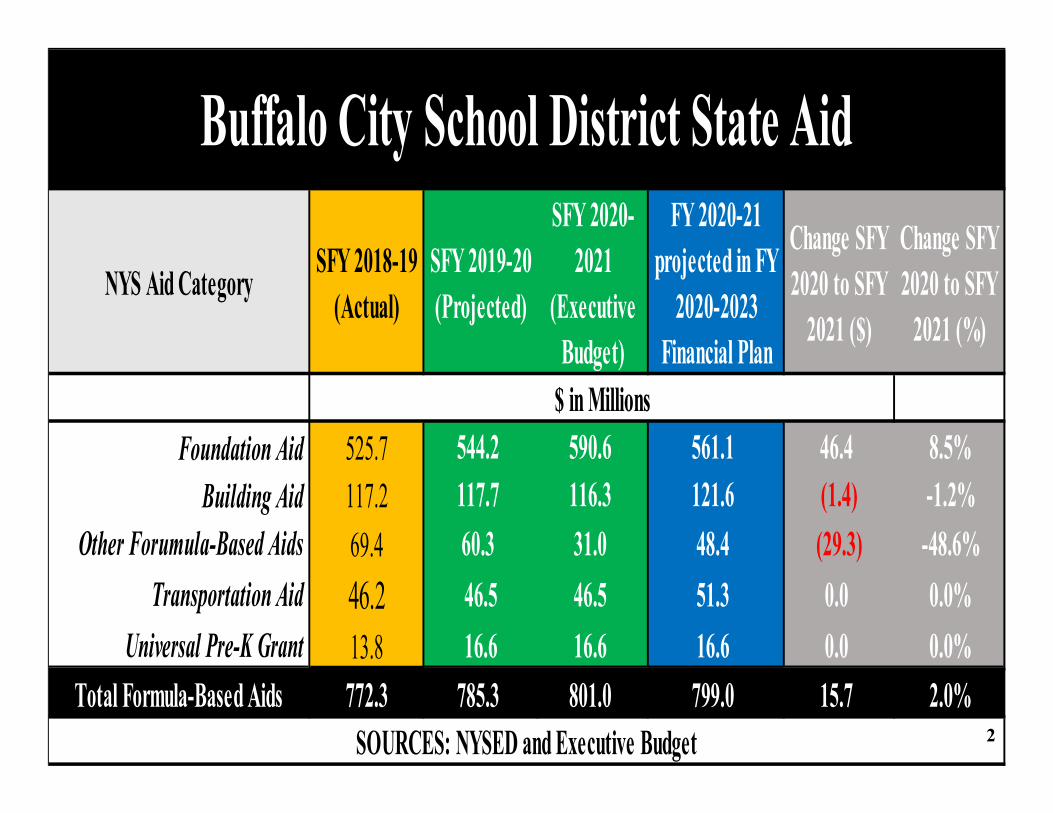
2
NYS Aid CategorySFY 2018-19
(Actual)
SFY 2019-20
(Projected)
SFY 2020-
2021
(Executive
Budget)
FY 2020-21
projected in FY
2020-2023
Financial Plan
Change SFY
2020 to SFY
2021 ($)
Change SFY
2020 to SFY
2021 (%)
Foundation Aid 525.7 544.2 590.6 561.1 46.4 8.5%
Building Aid 117.2 117.7 116.3 121.6 (1.4) -1.2%
Other Forumula-Based Aids 69.4 60.3 31.0 48.4 (29.3) -48.6%
Transportation Aid 46.2 46.5 46.5 51.3 0.0 0.0%
Universal Pre-K Grant 13.8 16.6 16.6 16.6 0.0 0.0%
Total Formula-Based Aids 772.3 785.3 801.0 799.0 15.7 2.0%
SOURCES: NYSED and Executive Budget
Buffalo City School District State Aid
$ in Millions
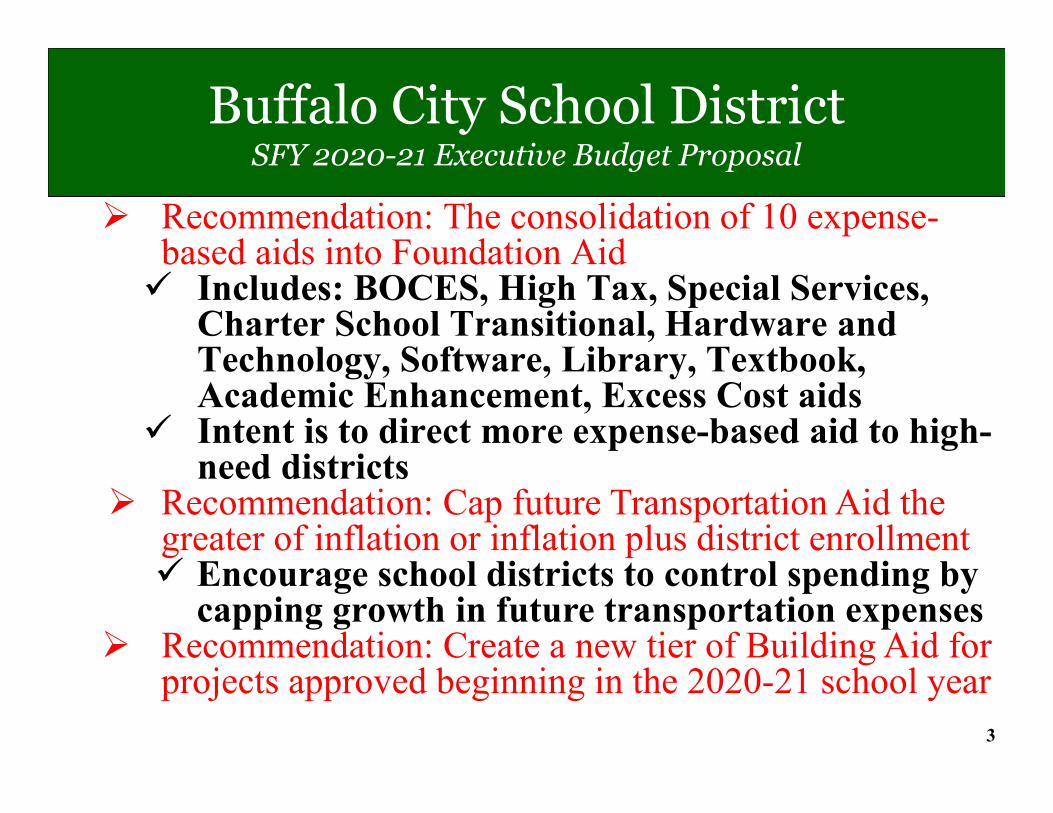
3
� Recommendation: The consolidation of 10 expense-based aids into Foundation Aid� Includes: BOCES, High Tax, Special Services,
Charter School Transitional, Hardware and Technology, Software, Library, Textbook, Academic Enhancement, Excess Cost aids
� Intent is to direct more expense-based aid to high-need districts
� Recommendation: Cap future Transportation Aid the greater of inflation or inflation plus district enrollment� Encourage school districts to control spending by
capping growth in future transportation expenses� Recommendation: Create a new tier of Building Aid for
projects approved beginning in the 2020-21 school year
Buffalo City School DistrictSFY 2020-21 Executive Budget Proposal
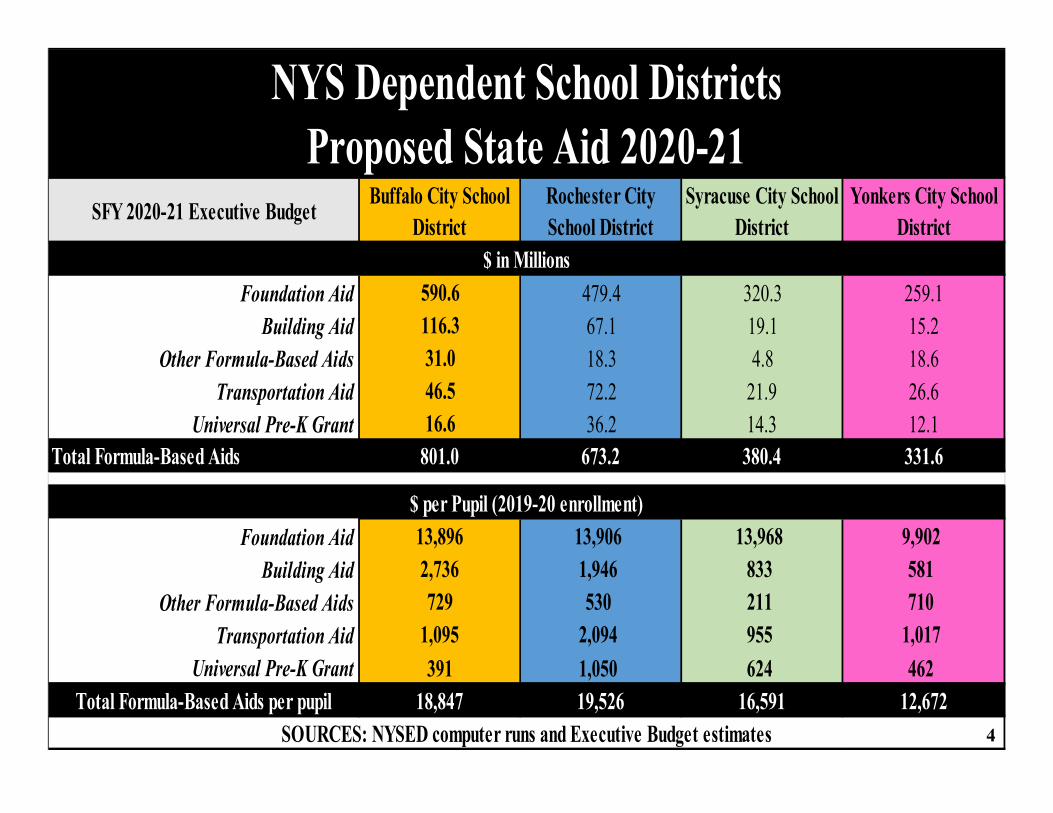
4
SFY 2020-21 Executive BudgetBuffalo City School
District
Rochester City
School District
Syracuse City School
District
Yonkers City School
District
Foundation Aid 590.6 479.4 320.3 259.1
Building Aid 116.3 67.1 19.1 15.2
Other Formula-Based Aids 31.0 18.3 4.8 18.6
Transportation Aid 46.5 72.2 21.9 26.6
Universal Pre-K Grant 16.6 36.2 14.3 12.1
Total Formula-Based Aids 801.0 673.2 380.4 331.6
Foundation Aid 13,896 13,906 13,968 9,902
Building Aid 2,736 1,946 833 581
Other Formula-Based Aids 729 530 211 710
Transportation Aid 1,095 2,094 955 1,017
Universal Pre-K Grant 391 1,050 624 462
Total Formula-Based Aids per pupil 18,847 19,526 16,591 12,672
Proposed State Aid 2020-21
NYS Dependent School Districts
$ per Pupil (2019-20 enrollment)
SOURCES: NYSED computer runs and Executive Budget estimates
$ in Millions
1
BUFFALO FISCAL STABILITY AUTHORITY
Analysis of the Update to the 2020-2023 Financial Plan
INTRODUCTION
The Buffalo City School District (District) submitted the Superintendent’s fiscal year (FY) 2020-2023 Adopted Financial Plan (Financial Plan) to the Buffalo Fiscal Stability Authority (BFSA) on May 1, 2019. The District adopted the FY 2019-20 budget on May 15, 2019 (Adopted Budget). Fiscal year (FY) 2018-19 closed with a General Fund surplus of $28.9 million. Revenues were favorable by $14.1 million and expenditures were favorable by $36.3 million as compared to the budget. Significantly, the District received approximately $15.1 million from returned Prior Fiscal Year (PFY) premium-equivalent overpayments and recorded a fourteen-day pre-fund requirement as a receivable against future insurance payments, resulting from the District converting to a traditional method of self-insurance for employee and retiree healthcare plans. Employee Benefit expenditures were favorable by $17.2 million due to the same reason. The FY 2019-20 Adopted Budget included a deficit of $10.0 million, fully funded with reserves. A budget gap has been projected for each year of the Financial Plan with a cumulative four-year deficit of $57.5 million. At December 31, 2019, the District has forecast a current fiscal year-end (CFYE) deficit of $2.6 million. The cumulative amended four-year deficit is projected at $50.1 million. The Financial Plan includes deficit closing and cost savings initiatives (Gap Closing Plan) to address the cumulative four-year deficit. The Gap Closing Plan includes various areas wherein the District is working to improve operations through efficiency measures, to increase revenues, as well as to demonstrate the potential methods that the District has available to close the projected out-year budgetary gaps in the event additional revenues and/or savings from efficiencies are inadequate to address the budget gaps. The Gap Closing Plan was originally developed in connection with the 2018-2021 Financial Plan; the 2020-2023 Financial Plan was developed using the original gap closing actions revised as necessary. Several actions have been implemented or are slated to be implemented in FY 2019-20; the cost savings associated with these implemented actions have been integrated in the Financial Plan. BFSA has requested that the District provide updates on the implementation of these proposed cost saving initiatives and deficit closing measures. The following report provides the status initiatives and measures as of December 2019.
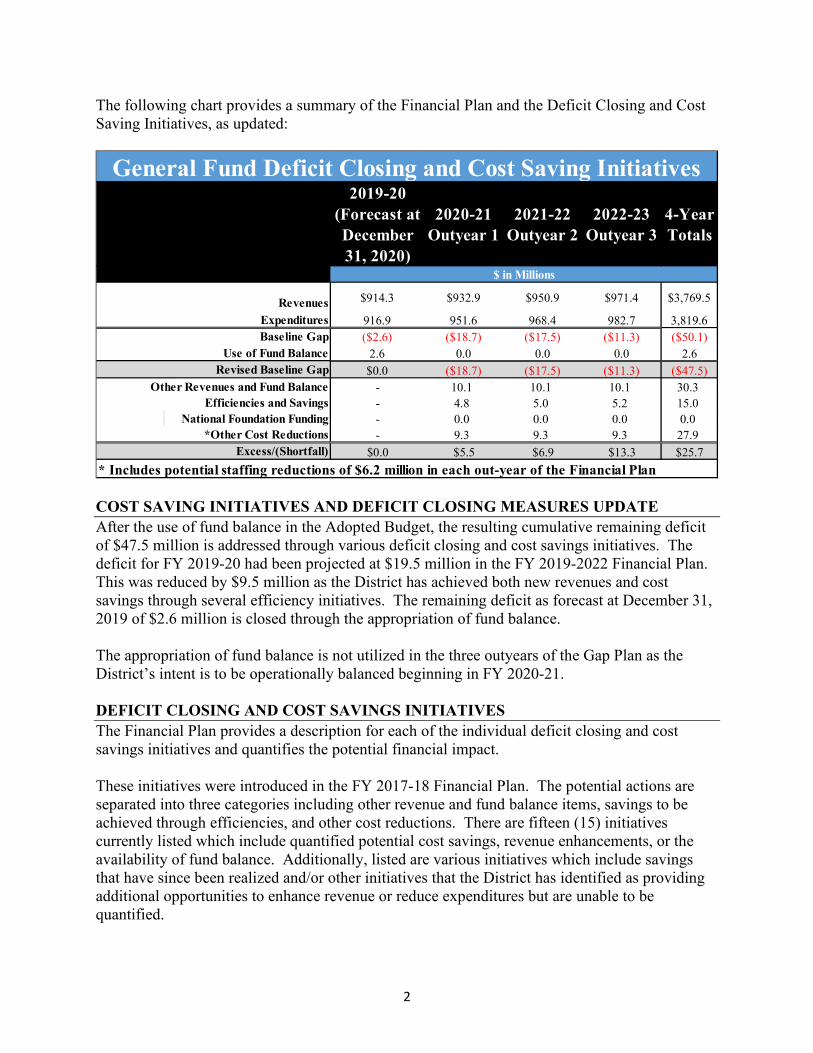
2
The following chart provides a summary of the Financial Plan and the Deficit Closing and Cost Saving Initiatives, as updated:
COST SAVING INITIATIVES AND DEFICIT CLOSING MEASURES UPDATE
After the use of fund balance in the Adopted Budget, the resulting cumulative remaining deficit of $47.5 million is addressed through various deficit closing and cost savings initiatives. The deficit for FY 2019-20 had been projected at $19.5 million in the FY 2019-2022 Financial Plan. This was reduced by $9.5 million as the District has achieved both new revenues and cost savings through several efficiency initiatives. The remaining deficit as forecast at December 31, 2019 of $2.6 million is closed through the appropriation of fund balance. The appropriation of fund balance is not utilized in the three outyears of the Gap Plan as the District’s intent is to be operationally balanced beginning in FY 2020-21. DEFICIT CLOSING AND COST SAVINGS INITIATIVES
The Financial Plan provides a description for each of the individual deficit closing and cost savings initiatives and quantifies the potential financial impact. These initiatives were introduced in the FY 2017-18 Financial Plan. The potential actions are separated into three categories including other revenue and fund balance items, savings to be achieved through efficiencies, and other cost reductions. There are fifteen (15) initiatives currently listed which include quantified potential cost savings, revenue enhancements, or the availability of fund balance. Additionally, listed are various initiatives which include savings that have since been realized and/or other initiatives that the District has identified as providing additional opportunities to enhance revenue or reduce expenditures but are unable to be quantified.
2019-20
(Forecast at
December
31, 2020)
2020-21
Outyear 1
2021-22
Outyear 2
2022-23
Outyear 3
4-Year
Totals
$914.3 $932.9 $950.9 $971.4 $3,769.5
916.9 951.6 968.4 982.7 3,819.6
($2.6) ($18.7) ($17.5) ($11.3) ($50.1)
2.6 0.0 0.0 0.0 2.6
$0.0 ($18.7) ($17.5) ($11.3) ($47.5)
Other Revenues and Fund Balance - 10.1 10.1 10.1 30.3
Efficiencies and Savings - 4.8 5.0 5.2 15.0
National Foundation Funding - 0.0 0.0 0.0 0.0
- 9.3 9.3 9.3 27.9
$0.0 $5.5 $6.9 $13.3 $25.7
*Other Cost Reductions
General Fund Deficit Closing and Cost Saving Initiatives
$ in Millions
Revenues
Expenditures
Baseline Gap
Use of Fund Balance
Revised Baseline Gap
Excess/(Shortfall)
* Includes potential staffing reductions of $6.2 million in each out-year of the Financial Plan
3
The Adopted Budget includes a budgeted deficit of $10.0 million, addressed through the appropriation of fund balance. The forecasted need for reserves is $2.6 million based on the most up-to-date financial data. Approximately $16.7 million of savings from efficiencies has been achieved and incorporated into the 2019-20 budget. Overall, after the use of fund balance in the Adopted Budget, the resulting cumulative remaining deficit of $47.5 million in the Financial Plan is addressed through the continuation of various deficit-closing and cost-savings initiatives. The $16.7 million of prior gap closing actions realized in 2019-20 include both increased revenues and cost-savings through several efficiency initiatives. These include significant reductions in employee and retiree health insurance costs of $10.0 million annually, NYS aid revenue of over $1.1 million, renewed bullet aid for nursing services of $1.2 million, a reduction in occupational and physical therapy costs of $1.0 million, substitute teacher cost reductions of $0.4 million, school nursing cost reductions of $0.6 million, as well savings from reduced leave time for employees out on workers’ compensation and administrative leave. Cost reductions are additionally included as a method by which the District may close deficits through the reduction and/or elimination of programs as well as a reduction of staff. These cost reductions are not planned actions but have been quantified to demonstrate the District’s ability to balance if other initiatives do not provide budgetary relief as projected. Deficit Closing and Cost Savings Initiatives – Other Revenues and Fund Balance Items
(#1-2)
The Financial Plan includes a revenue enhancement item and addresses the ability to use additional fund balance. There is no current intent to use additional reserves. These items are listed at $10.1 million in each outyear of the Closing and Cost Saving Initiatives Plan, for a cumulative amount of $30.3 million and include:
1. Revenue enhancement: A minor amount of $0.1 million in additional annual receipts for a cumulative $0.3 million is included for various revenue enhancements resulting from several current initiatives which are intended to yield greater revenues though better data collection and understanding of the various NYS and federal regulations.
The District has increased New York State (NYS) and Federal revenues from aid maximization programs including enhanced procedures and data collection. The revenue impact for FY 2019-20 is estimated to be $7,047,000, representing the cumulative impact from actions taken in prior years as well as current year actions. The carryforward amount in FY 2020-21 is projected to increase by $270,250, for a total cumulative impact of $7,317,500. These increased revenues are reflected within the District’s forecasts at December 31, 2019. For example, the District is projecting enhanced revenues of $3.5 million in federal Medicaid Reimbursements, resulting from procedural changes relating to parent consent forms. Of the $7,047,000, $5,528,000 is considered to be reoccurring gains through changes in standard procedures as a result of the aid maximization projects. The revenue increases are projected to be $7,317,250 in FY 2020-21.
4
The District budgets NYS aid revenues based on the aid projections released after the NYS budget is adopted. These aid projections will be based on the prior year’s estimated aid amounts. As such, the forthcoming financial plan should reflect increased NYS aid amounts that have resulted from the District’s data collection and enhancement efforts. Additionally, FY 2015-16 through 2019-20 have all yielded greater-than-budget Medicaid reimbursements. The District may consider budgeting the Medicaid reimbursement at a higher level in the forthcoming FY 2020-21 proposed budget given prior fiscal year actual receipts along with the District’s revenue enhancement efforts.
2. Unassigned fund balance: Total fund balance at June 30, 2019 was $223.7 million. It is projected to be $221.1 million at June 30, 2023 including $84.6 million in Unassigned fund balance. Of this $84.6 million, 4% of budgeted expenditures, or $39.3 million, is required to be retained per the District’s fund balance policy. A projected $51.1 million exceeds the Buffalo Board of Education’s 4% of expenditure retention policy and would be available to address budgetary gaps. The projected 2020 fund balance represents an improvement from that projected in the past two years and reflects positive financial results as compared to the budget. The District has previously stated its intent to be operationally balanced beginning in FY 2020-21. Therefore the District has not included the drawdown of fund balance in FY 2020-21 through 2022-23 but notes the ability to use an additional $10.0 million in fund balance annually to potentially close deficits.
Deficit Closing and Cost Savings Initiatives – Savings to be Achieved through Efficiencies
(#3-10)
The Financial Plan includes eight (8) individual actions for cost reductions and savings to be achieved through greater efficiencies providing a cumulative $15.0 million of cost reductions over the three out-years of the Financial Plan. These actions are summarized as follows:
3. Vacancies: The District has included potential additional budgetary savings of up to $2.0 million resulting annually from vacancies based on historical experience; cumulative savings of $6.0 million are included. The District annually has budgetary savings based on budgeted but unfilled full-time equivalent (FTE) positions, particularly within the white-collar and blue-collar employee groups. This item does not represent an action but represents an area where the budgetary savings likely will occur.
4. Reduce substitute teacher costs: The District has included annual savings of $100,000 for
a cumulative $0.3 million in substitute teacher savings resulting from better management of teacher absences. Substitute teachers are often requested in addition to the regular teaching staff to assist with classroom instruction. The District’s Associate Superintendent for Human Resources has implemented approval controls for the use of substitute teachers. This additional use of substitute teachers now requires approval as the process has been centralized from the individual schools to the Department of Human Resources. An additional $0.1 million annually in cost savings have been listed based on the continued implementation and refinement of this initiative.
5
The FY 2020-23 Financial Plan includes $6.9 million annually for a cumulative $27.6 million in total Substitute teacher compensation. Additionally, the District will consider a tentative agreement on a Successor Agreement, the net cost of which was estimated at $259,000 for the 2019-20 fiscal year and a cumulative $1.9 million in the following three fiscal years. At December 31, 2019, the District forecast a CFYE unfavorable budgetary variance of $0.8 million for Substitute teacher expenditures. The CFYE forecast for Substitute expenditures is approximately $1.3 million greater than originally budgeted.
5. Nursing costs: The District received $1.2 million for nursing services in 2019-20 from NYS as additional NYS Aid. This grant is non-competitive and is a reauthorization of a previously awarded grant. The grant awards are recorded as “bullet aid” or “one-shot” as there is no requirement for this aid to be received on an annual basis and is therefore excluded from budgeted revenues. The Gap Closing and Cost Savings Initiative Plan includes the continued reallocation by NYS of $1.2 million annually for a cumulative $3.6 million.
6. Negotiations/Analysis of Top 150 Vendors/Best Practices (formerly Best and Final
Offers): The Deficit Closing and Cost Saving Initiatives Plan includes potential savings related to procurement in the amount of $500,000 in FY 2020-21, which increases annually by $200,000 for a cumulative amount of $2.1 million. On March 20, 2019, the Buffalo Board of Education adopted a revised procurement policy to allow for negotiation with the lowest responsible or best value bidder. In the event negotiations fail, an alternate award may be made. The District intends to perform a full analysis of the top 150 vendors in 2019-20 to ensure the costs are appropriate for the services received, discounts available are taken, and items are bid on an appropriate schedule. At December 31, 2019, this analysis was ongoing. The District has also analyzed several best practices through work with the Council of Great City Schools and other organizations. It is anticipated that some of the best practices identified during this process will yield more cost-efficient procurement. Additionally, the District is examining whether certain functions currently performed by building engineers may be outsourced.
7. Facility closure (PS #86): The District has identified former PS #86 for closure. The
operational cost savings is listed at $150,000 annually for a cumulative three-year impact of $450,000. The ultimate usage of this facility will depend on the recommendations of a long-term capital and facilities plan and a demographic study. As of December 31, 2019, the facility was in use by the District’s Adult Education Department. The operational cost savings from this initiative have not yet materialized.
8. Reduction in overtime: The District scrutinized the use of overtime in FY 2017-18, particularly within trades, transportation, and security. An annual amount of $100,000 is estimated for potential annual savings for a cumulative $0.3 million in savings and reflects tightening of controls over the use of overtime following this review.
6
The Adopted Budget included $1.8 million in overtime expenditures, $0.1 million less than the prior fiscal year-end amount of $1.7 million. The FY 2020-23 Financial Plan includes a gradual reduction in annual Overtime expenditures and a cumulative $6.9 million. At December 31, 2019, overtime expenditures were forecast to exceed budgeted amounts by $0.3 million. The cost savings from this initiative have not yet materialized.
9. Reduced compensated leave time: The District implemented procedural controls over staff’s utilization of workers’ compensation, medical leave and administrative leave in FY 2016-17. An annual savings of $0.5 million and a cumulative savings of $1.5 million is listed as a gap-closing measure by expanding these efforts to curtail the use of compensated leave time to reduce the number of staff on paid leave. Effective July 1, 2019, the District has a new third-party administrator for workers’ compensation administrative services. Savings are anticipated but have not yet been projected. The total number of individuals on paid leave of absence including medical, administrative, and workers compensation is 386, 7 fewer individuals than the prior fiscal year and 26 greater than FY 2017-18. The District employed 5,465 FTEs at December 31, 2019, 10 greater than at FYE 2019. BFSA notes that the year-to-date number of individuals receiving workers’ compensation benefits is 80, greater than in all four prior fiscal years. This initiative has not generated cost savings to date. It will be examined based on the total number of employees receiving paid leave in the current fiscal year.
10. Special Education: The Financial Plan includes $0.2 million annually and $0.6 million cumulatively from continued cost-saving initiatives related to special education. The FY 2018-19 Adopted Budget included programmatic changes in the summer handicapped program to reduce the General Fund expenditures associated with unreimbursed costs by $0.2 million, and it is expected to be realized. This cost-saving initiative is included in the Gap Closing Plan for similar calculations to impact future years.
Deficit Closing and Cost Savings Initiatives – Other Cost Reductions (#11-15)
The District intends to utilize savings from efficiencies to close the budget gap to the extent possible. The District has included five (5) cost reduction actions that could occur if necessary. These actions have an estimated cumulative $27.9 million impact within the Deficit Closing and Cost Savings Initiatives Plan and include more severe measures. At December 31, 2019, the District has not implemented any of the following cost reductions and is not planning on such reductions:
1) the reduction of the general contingency account ($1.36 million annually for a cumulative total of $4.1 million);
2) the reduction or elimination of the contract settlement contingency account ($1.5 million annually for a cumulative $6.0 million);
3) the reduction or elimination of non-mandated programs ($0.25 million annually for a cumulative $0.75 million);
4) the reduction of central office positions ($660,000 annually for a net savings of $2.0 million);
5) the reduction of instructional and support positions ($5.5 million annually for a cumulative $16.5 million).
7
The District has not quantified the number of central office positions or instructional and support positions this would entail. Deficit Closing and Cost Savings Initiatives – Other Opportunities In addition to the Gap Closing Plan discussed above, the District has provided information related to other initiatives that are being pursued that could provide additional revenues, cost savings and/or operational advantages. Many were previously included in the annual gap-closing plan but have subsequently been excluded. These items are summarized as follows:
1. Additional grants: New grants though national foundations continue to be pursued. The Community Foundation for Greater Buffalo administered a $360,000 planning grant from the Ralph C. Wilson Foundation to determine needed improvements at eleven City of Buffalo parks and District athletic sites. This project is continuing and is transitioning to the project and funding implementation phase. During FY 2018-19, the District received a three-year grant award of $1.0 million from the Kellogg Foundation to support children’s success in schools through innovative enrichment curriculum. The District has met its initial first year goals of phasing in teacher training in gifted and talented instructional pedagogy. The District has collaborated with Say Yes to Education Buffalo and is partnering with five local institutes of higher education to support best in class prekindergarten through higher education data systems. The District will receive $350,000 annually in FY 2019-20 and FY 2020-21 from the Gates Foundation to develop and implement a joint data system with local higher educational institutions. It is noted that such revenues are for specific initiatives and unavailable for general operations.
2. Employee healthcare: The District is anticipating issuing a request for proposal (RFP)
for health insurance administration services in early 2020. It is expected to be implemented on January 1, 2021. The District is not able to project savings from this initiative at this time.
3. Facility closure (#187): Former PS #187 has been vacated and will not be utilized within the 2019-20 school year. As this gap-closing measure has been actualized, no potential savings are listed.
4. Master Scheduler: The District continues to intend to hire a master scheduler who will be tasked with ensuring high school schedules are built efficiently and that resources for special education and English as a second language services are efficiently utilized. The position will be responsible for auditing schedules during the year to make sure that, if staffing is excessive, positions are moved or reallocated. The position was posted in April 2018 and has remained unfilled since being posted.
8
Deficit Closing and Cost Savings Initiatives – Results reflected in Financial Plan 1. Reduced healthcare costs: In December 2019, the District issued a Request for Proposals
(RFP) for a Medicare Advantage Plan and is converting voluntary enrollments to Independent Health. A cost savings of $0.9 million is anticipated from this change. It will be reflected within the forthcoming FY 2020-23 Financial Plan as appropriate.
The District expects $500,000 in annual savings from a dependent verification audit in 2019-20. The expectation is that employees or retirees who have dependents listed inappropriately on their healthcare policy will be removed allowing for a cost reduction. The $0.5 million in annual savings anticipated from this initiative are built into the Financial Plan, no additional potential savings are listed. At December 31, 2019, the dependent verification audit had not yet occurred. In FY 2018-19 and 2019-20, the District achieved significant cost reductions related to the health insurance cost for active employees and retirees. The savings for active employee health insurance resulted from the settlement of the BTF and BCSA labor agreements which included health insurance contributions for the first time and increases in co-pays for doctor visits and prescription drugs. Savings in providing retiree health insurance were additionally received as follows: $3.6 million in annual savings from the conversion of over 1,500 retirees and/or their dependents to a Medicare Advantage product, $2.0 million from the near elimination of retiree cosmetic surgery as a result of its inclusion as federally-taxable income to users, $2.0 million in federal drug subsidy savings, and additional savings in negotiated rebates on drug purchases with Blue Cross/Blue Shield.
2. Renegotiate occupational therapy and physical therapy contracts: The District opted to
extend the existing contract based on the cost savings realized in FY 2017-18 and in FY 2018-19. The total estimated savings of $1.0 million has been reflected within budgeted and projected expenditures.
3. Textbook purchases: Savings from purchasing textbooks through a bid process rather than directly from the publisher has been realized and reflected in the Financial Plan. While the District has not quantified the savings, it has noted that the Adopted Budget has been reduced by $1.1 million or 40.7%, compared to the prior year modified budget. The Modified Budget further reduced budgeted Textbook expenditures from $1.9 million to $1.8 million. The District has not projected any budgetary variance related to Textbook expenditures.
9
4. Public carrier transportation: The District utilizes both private and public carriers for pupil transportation. The District reported that the FY 2020-21 two-year contract with the Niagara Frontier Transportation Authority is anticipated to provide $582,000 in additional costs for the District but with a significant increase in the amount of bussing services. These new costs have been included within the Adopted Budget and Financial Plan. The total transportation costs are reimbursable at 87% the following year through NYS Transportation Aid. The approved private carrier contract is with First Student, Inc. The current contract expires at CFYE. First Student successfully completed an RFP process and will continue as the District’s private carrier through FY 2025. The five-year cost is $244.3 million including $46.9 million in FY 2020-21 growing to $50.7 million in FY 2024-25.
The Financial Plan projects deficits in each outyear of the Financial Plan and the Gap Closing Plan provides information as to how the deficits may be closed based on the outcome of various initiatives. The District appropriately excludes unknown financial results from the annual projections for revenues and expenditures. The cumulative deficit for the three outyears of the Financial Plan is $47.5 million. Total efficiencies and savings are estimated at a potential cumulative $15.0 million; the remaining amount of the budget gap would be closed by additional revenues, potentially the use of additional fund balance, and through cost reductions. The Gap Plan lists the availability of $30.0 million in additional fund balance to address the projected deficits. The District is projecting to have $51.1 million in Unassigned fund balance in excess of the retention policy at June 30, 2023. As the amount of efficiency savings realized will be insufficient to close the entire budgetary gap, a determination will need to be made by the Board of Education whether to use additional fund balance or reduce costs in other areas as outlined within the financial plan.
CONCLUSIONS
Fiscal year 2018-19 closed with a surplus of $28.9 million as compared to a budgeted deficit of $19.0 million. This constitutes a significant positive budgetary variance of $47.9 million including $32.3 million in one-time revenue receipts and reductions in expenditures. The availability of fund balance to balance future budgets of $34.1 million in addition to what was available when the Financial Plan was developed provides a safety-net to the District. On a combined basis, the Financial Plan provides for $30.9 million in potential cost reductions if other actions are insufficient to close the budget gap and include actions such as reducing positions, reducing or eliminating nonmandated programs and reducing or eliminating amounts set-aside for settling labor contracts. The availability of additional fund balance could reduce the impact of such actions if the Board of Education determines it is preferable to use reserves. The District plans to be operationally balanced beginning next year for 2020-21. Several of the cost-savings initiatives have been implemented resulting in budgetary savings. The District provided documentation demonstrating a projected net increase of $7.1 million in FY 2019-20 resulting from New York State aid and federal reimbursement maximization programs. Other actions, as discussed, have not either resulted in savings as originally estimated or haven’t progressed enough to estimate at this time.
10
On a combined basis, the deficit-closing and cost-savings initiatives provide $72.7 million of potential additional revenues, savings and cost reductions. There is no intent nor ability to implement all the initiatives to the extent provided for in the plan; the items as listed with the deficit closing and cost savings initiatives plan is intended to demonstrate the multitude of factors facing the District along with various ongoing potential initiatives to demonstrate a viable methodology to close the outstanding projected budget gaps. The ability of the District to balance its Financial Plan is heavily reliant on the District’s ability to generate results based on actions already taken in 2017-18 and 2018-19, as well as actions either being taken or to be taken in 2019-20.
Certified Public Accountants
Drescher & Malecki LLP 3083 William Street, Suite 5 Buffalo, New York 14227 Telephone: 716.565.2299 Fax: 716.565.2201
- 1 -
September 17, 2019
To the Honorable Comptroller of
the City of Buffalo, New York:
In planning and performing our audit of the basic financial statements of the Buffalo Urban Renewal
Agency, New York (the “Agency”) as of and for the year ended June 30, 2019, in accordance with
auditing standards generally accepted in the United States of America and the standards applicable to
financial audits contained in Government Auditing Standards, issued by the Comptroller General of the
United States, we considered the Agency’s internal control over financial reporting (“internal control”)
as a basis for designing audit procedures that are appropriate in the circumstances for the purpose of
expressing our opinions on the financial statements, but not for the purpose of expressing an opinion on
the effectiveness of the entity’s internal control. Accordingly, we do not express an opinion on the
effectiveness of the Agency’s internal control.
A deficiency in internal control exists when the design or operation of a control does not allow
management or employees, in the normal course of performing their assigned functions, to prevent, or
detect and correct, misstatements on a timely basis. A material weakness is a deficiency, or a
combination of deficiencies, in internal control over financial reporting, such that there is a reasonable
possibility that a material misstatement of the entity’s financial statements will not be prevented, or
detected and corrected on a timely basis. A reasonable possibility exists when the likelihood of an event
occurring is either reasonably possible or probable as defined as follows:
Reasonably possible. The chance of the future event or events occurring is more than remote but
less than likely.
Probable. The future event or events are likely to occur.
Our consideration of internal control was for the limited purpose described in the first paragraph and was
not designed to identify all deficiencies in internal control that might be material weaknesses. Given
these limitations, during our audit we did not identify any deficiencies in internal control over financial
reporting that we consider to be material weaknesses. However, material weaknesses may exist that have
not been identified.
During our audit we identified certain matters involving the internal control, other operational matters
and new reporting requirements that are presented for your consideration. This letter does not affect our
report dated September 17, 2019 on the financial statements of the Agency. We will review the status of
these comments during our next audit engagement. Our comments and recommendations, all of which
have been discussed with the appropriate members of management, are intended to improve the internal
control or result in other operating efficiencies. Our comments are summarized in Exhibit I.

- 2 -
The purpose of this communication, which is an integral part of our audit, is to describe, for management
and those charged with governance, the scope of our testing of internal control and the results of that
testing. Accordingly, this communication is not intended to be and should not be used for any other
purpose.
September 17, 2019
Exhibit I
- 3 -
Formalized Loan Write-Off Procedures
The write-off of loans receivable should be performed by an authorized party and with adequate
supporting documentation to demonstrate all conditions were satisfied to terminate a given loan.
The Agency should develop formal loan write-off procedures which cites the individuals
authorized to process and also the conditional requirements that must be met to complete a write-
off. Certain loans administered by the Agency include contract language that provides passage
of time, dwelling occupation and inactive repayment requirements, which need to be considered
during the write-off process. In addition to applicable contract language, the Agency’s
procedures should include a minimum level (measured by either activity or dollar amounts) for
which updates would be provided to the Agency’s Board for transparency and approval purposes.
Further, for those loans with inadequate documentation, the procedures should cite the
appropriate method for writing-off the receivable amounts when they are considered
uncollectible.
Federal Cost Allowability Determination & Cash Management Policy
The Agency lacks written procedures surrounding federal cash management as required by 2
CFR 200.305, as well as procedures for determining allowability of costs in accordance with 2
CFR Subpart E–Cost Principles and 2 CFR 200.302 (b) (7).
We recommend that the Agency create written procedures regarding these matters. Written
procedures surrounding federal cash management should include:
How the entity minimizes the time elapsing between the transfer of funds and
disbursement as a condition for advance payments
Procedures to make timely payment to contractors in accordance with the contract
provisions
Advance payments must be limited to the minimum amounts needed and be timed in
accordance with the actual, immediate cash requirements of the entity
Maintain advance payments in interest bearing accounts unless certain exceptions are
met, also noting that interest over $500 will be returned to the federal agency unless
other specified by the federal awarding agency
Furthermore, cost allowability determination procedures should include:
Role/title of individual responsible for determining whether a cost/activity is allowable
Reference to factors determining allowability
Human Resources
Currently the Agency does not have an updated set of policies and procedures outlining key
human resource functions, such as onboarding, training, continuing education expectations,
background checks and employment separations.
We recommend that the Agency expand and define its formal human resource policies and
procedures to outline the duties and responsibilities for key human resources functions to
encourage consistent practices.
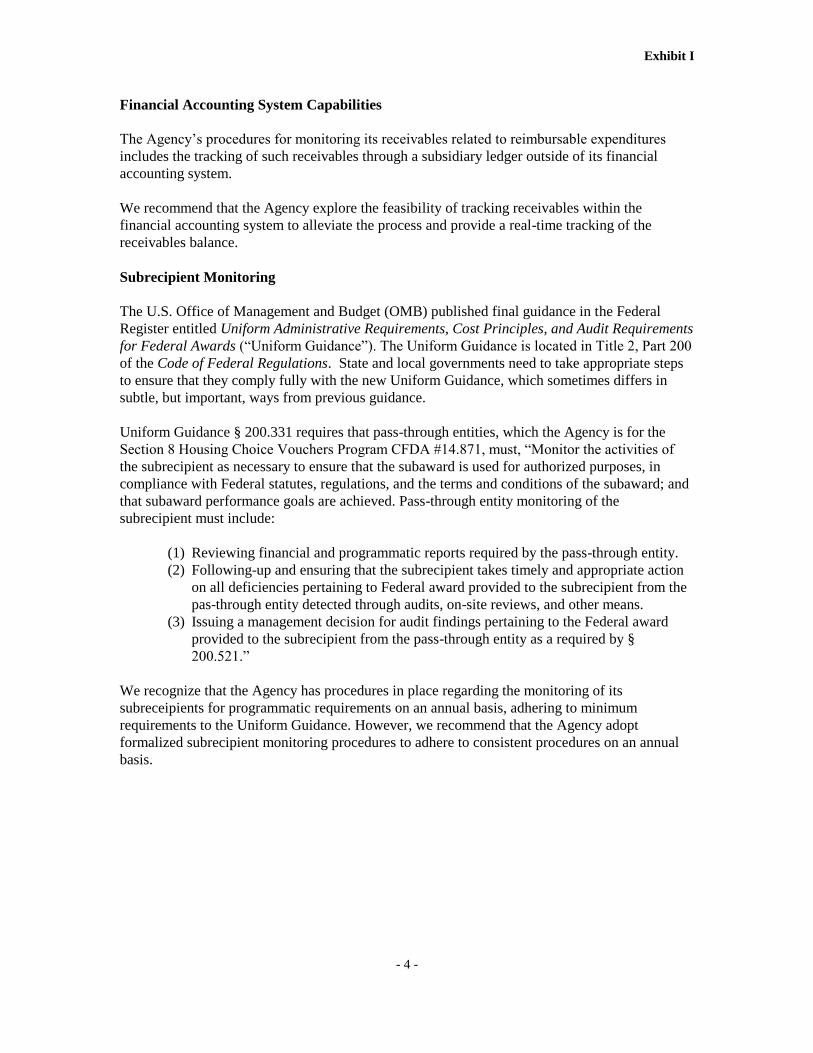
Exhibit I
- 4 -
Financial Accounting System Capabilities
The Agency’s procedures for monitoring its receivables related to reimbursable expenditures
includes the tracking of such receivables through a subsidiary ledger outside of its financial
accounting system.
We recommend that the Agency explore the feasibility of tracking receivables within the
financial accounting system to alleviate the process and provide a real-time tracking of the
receivables balance.
Subrecipient Monitoring
The U.S. Office of Management and Budget (OMB) published final guidance in the Federal
Register entitled Uniform Administrative Requirements, Cost Principles, and Audit Requirements
for Federal Awards (“Uniform Guidance”). The Uniform Guidance is located in Title 2, Part 200
of the Code of Federal Regulations. State and local governments need to take appropriate steps
to ensure that they comply fully with the new Uniform Guidance, which sometimes differs in
subtle, but important, ways from previous guidance.
Uniform Guidance § 200.331 requires that pass-through entities, which the Agency is for the
Section 8 Housing Choice Vouchers Program CFDA #14.871, must, “Monitor the activities of
the subrecipient as necessary to ensure that the subaward is used for authorized purposes, in
compliance with Federal statutes, regulations, and the terms and conditions of the subaward; and
that subaward performance goals are achieved. Pass-through entity monitoring of the
subrecipient must include:
(1) Reviewing financial and programmatic reports required by the pass-through entity.
(2) Following-up and ensuring that the subrecipient takes timely and appropriate action
on all deficiencies pertaining to Federal award provided to the subrecipient from the
pas-through entity detected through audits, on-site reviews, and other means.
(3) Issuing a management decision for audit findings pertaining to the Federal award
provided to the subrecipient from the pass-through entity as a required by §
200.521.”
We recognize that the Agency has procedures in place regarding the monitoring of its
subreceipients for programmatic requirements on an annual basis, adhering to minimum
requirements to the Uniform Guidance. However, we recommend that the Agency adopt
formalized subrecipient monitoring procedures to adhere to consistent procedures on an annual
basis.
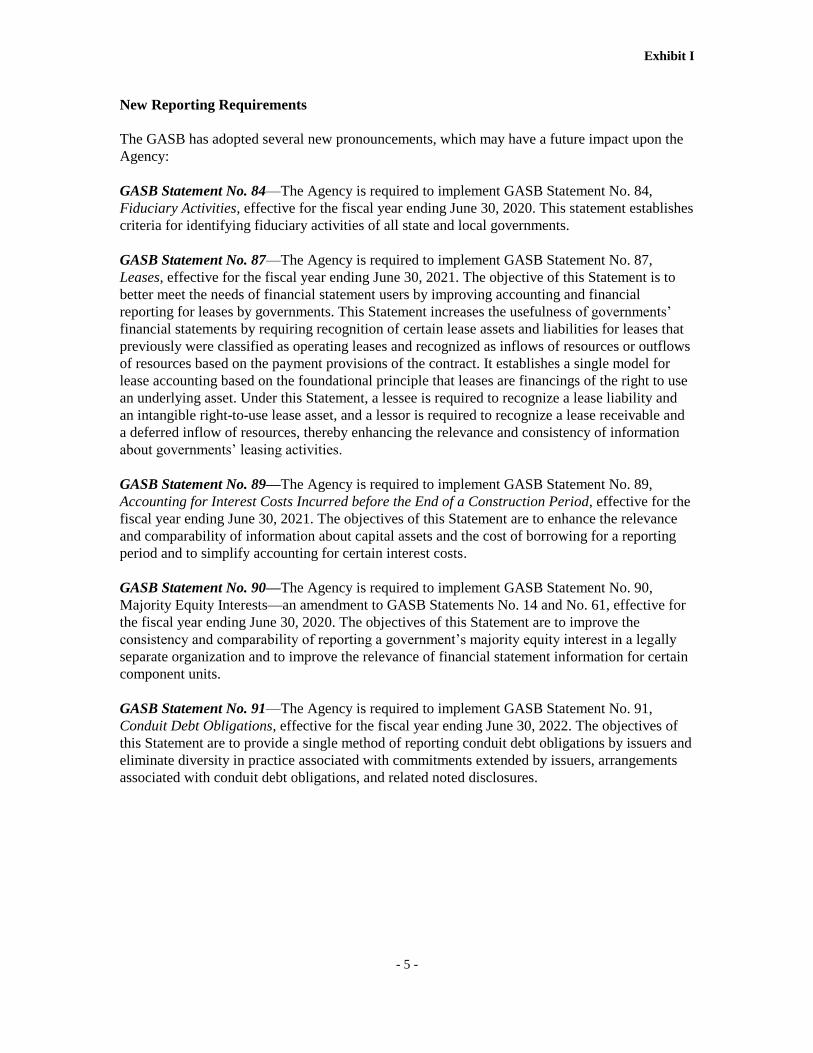
Exhibit I
- 5 -
New Reporting Requirements
The GASB has adopted several new pronouncements, which may have a future impact upon the
Agency:
GASB Statement No. 84—The Agency is required to implement GASB Statement No. 84,
Fiduciary Activities, effective for the fiscal year ending June 30, 2020. This statement establishes
criteria for identifying fiduciary activities of all state and local governments.
GASB Statement No. 87—The Agency is required to implement GASB Statement No. 87,
Leases, effective for the fiscal year ending June 30, 2021. The objective of this Statement is to
better meet the needs of financial statement users by improving accounting and financial
reporting for leases by governments. This Statement increases the usefulness of governments’
financial statements by requiring recognition of certain lease assets and liabilities for leases that
previously were classified as operating leases and recognized as inflows of resources or outflows
of resources based on the payment provisions of the contract. It establishes a single model for
lease accounting based on the foundational principle that leases are financings of the right to use
an underlying asset. Under this Statement, a lessee is required to recognize a lease liability and
an intangible right-to-use lease asset, and a lessor is required to recognize a lease receivable and
a deferred inflow of resources, thereby enhancing the relevance and consistency of information
about governments’ leasing activities.
GASB Statement No. 89—The Agency is required to implement GASB Statement No. 89,
Accounting for Interest Costs Incurred before the End of a Construction Period, effective for the
fiscal year ending June 30, 2021. The objectives of this Statement are to enhance the relevance
and comparability of information about capital assets and the cost of borrowing for a reporting
period and to simplify accounting for certain interest costs.
GASB Statement No. 90—The Agency is required to implement GASB Statement No. 90,
Majority Equity Interests—an amendment to GASB Statements No. 14 and No. 61, effective for
the fiscal year ending June 30, 2020. The objectives of this Statement are to improve the
consistency and comparability of reporting a government’s majority equity interest in a legally
separate organization and to improve the relevance of financial statement information for certain
component units.
GASB Statement No. 91—The Agency is required to implement GASB Statement No. 91,
Conduit Debt Obligations, effective for the fiscal year ending June 30, 2022. The objectives of
this Statement are to provide a single method of reporting conduit debt obligations by issuers and
eliminate diversity in practice associated with commitments extended by issuers, arrangements
associated with conduit debt obligations, and related noted disclosures.
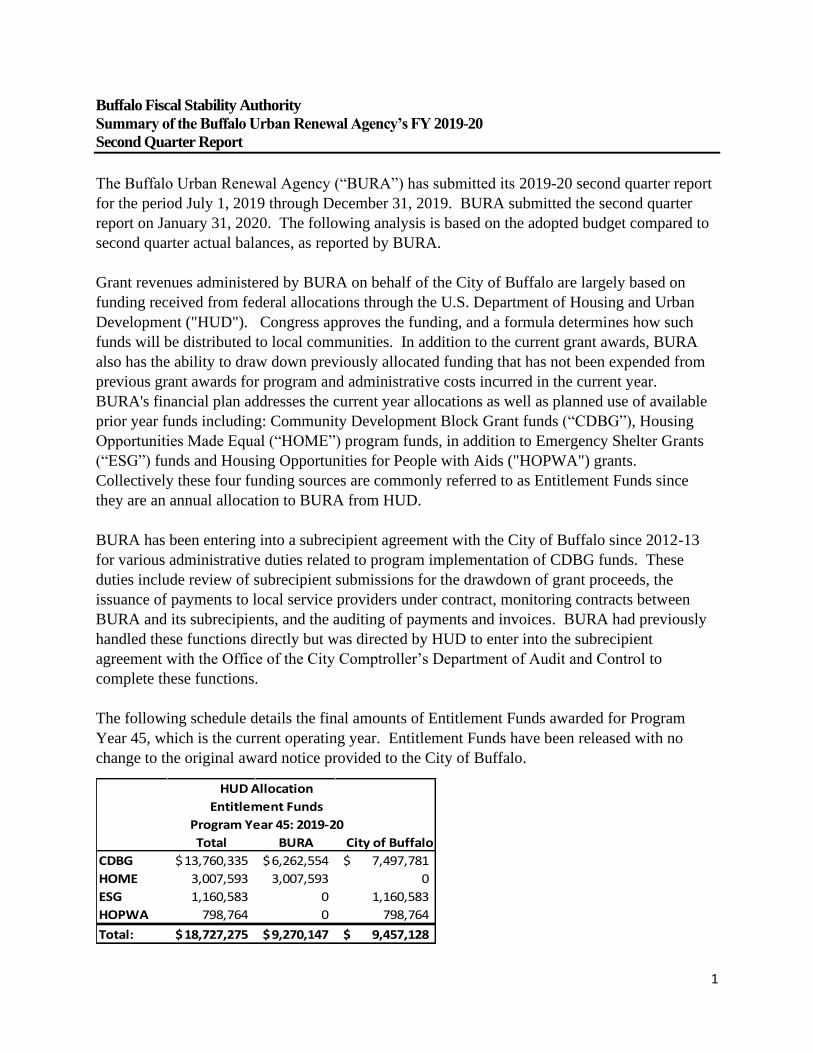
1
Buffalo Fiscal Stability Authority
Summary of the Buffalo Urban Renewal Agency’s FY 2019-20
Second Quarter Report
The Buffalo Urban Renewal Agency (“BURA”) has submitted its 2019-20 second quarter report
for the period July 1, 2019 through December 31, 2019. BURA submitted the second quarter
report on January 31, 2020. The following analysis is based on the adopted budget compared to
second quarter actual balances, as reported by BURA.
Grant revenues administered by BURA on behalf of the City of Buffalo are largely based on
funding received from federal allocations through the U.S. Department of Housing and Urban
Development ("HUD"). Congress approves the funding, and a formula determines how such
funds will be distributed to local communities. In addition to the current grant awards, BURA
also has the ability to draw down previously allocated funding that has not been expended from
previous grant awards for program and administrative costs incurred in the current year.
BURA's financial plan addresses the current year allocations as well as planned use of available
prior year funds including: Community Development Block Grant funds (“CDBG”), Housing
Opportunities Made Equal (“HOME”) program funds, in addition to Emergency Shelter Grants
(“ESG”) funds and Housing Opportunities for People with Aids ("HOPWA") grants.
Collectively these four funding sources are commonly referred to as Entitlement Funds since
they are an annual allocation to BURA from HUD.
BURA has been entering into a subrecipient agreement with the City of Buffalo since 2012-13
for various administrative duties related to program implementation of CDBG funds. These
duties include review of subrecipient submissions for the drawdown of grant proceeds, the
issuance of payments to local service providers under contract, monitoring contracts between
BURA and its subrecipients, and the auditing of payments and invoices. BURA had previously
handled these functions directly but was directed by HUD to enter into the subrecipient
agreement with the Office of the City Comptroller’s Department of Audit and Control to
complete these functions.
The following schedule details the final amounts of Entitlement Funds awarded for Program
Year 45, which is the current operating year. Entitlement Funds have been released with no
change to the original award notice provided to the City of Buffalo.
Total BURA City of Buffalo
CDBG 13,760,335$ 6,262,554$ 7,497,781$
HOME 3,007,593 3,007,593 0
ESG 1,160,583 0 1,160,583
HOPWA 798,764 0 798,764
Total: 18,727,275$ 9,270,147$ 9,457,128$
Program Year 45: 2019-20
HUD Allocation
Entitlement Funds
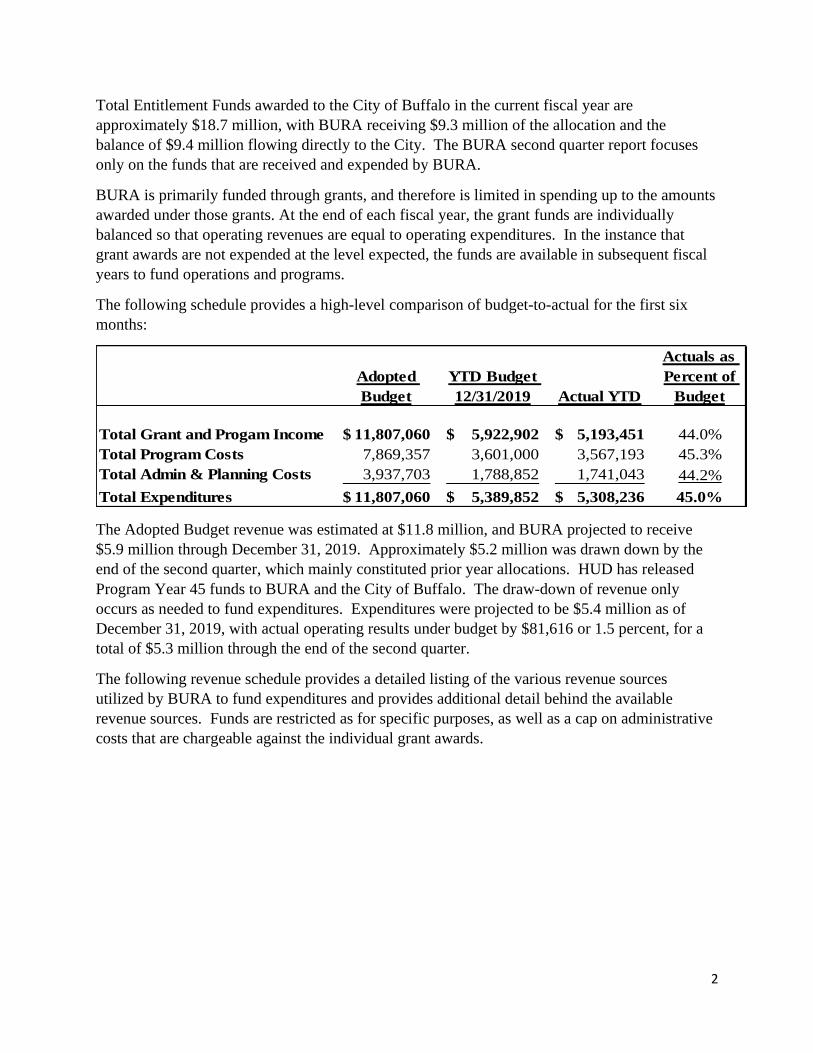
2
Total Entitlement Funds awarded to the City of Buffalo in the current fiscal year are
approximately $18.7 million, with BURA receiving $9.3 million of the allocation and the
balance of $9.4 million flowing directly to the City. The BURA second quarter report focuses
only on the funds that are received and expended by BURA.
BURA is primarily funded through grants, and therefore is limited in spending up to the amounts
awarded under those grants. At the end of each fiscal year, the grant funds are individually
balanced so that operating revenues are equal to operating expenditures. In the instance that
grant awards are not expended at the level expected, the funds are available in subsequent fiscal
years to fund operations and programs.
The following schedule provides a high-level comparison of budget-to-actual for the first six
months:
Adopted
Budget
YTD Budget
12/31/2019 Actual YTD
Actuals as
Percent of
Budget
Total Grant and Progam Income 11,807,060$ 5,922,902$ 5,193,451$ 44.0%
Total Program Costs 7,869,357 3,601,000 3,567,193 45.3%
Total Admin & Planning Costs 3,937,703 1,788,852 1,741,043 44.2%
Total Expenditures 11,807,060$ 5,389,852$ 5,308,236$ 45.0%
The Adopted Budget revenue was estimated at $11.8 million, and BURA projected to receive
$5.9 million through December 31, 2019. Approximately $5.2 million was drawn down by the
end of the second quarter, which mainly constituted prior year allocations. HUD has released
Program Year 45 funds to BURA and the City of Buffalo. The draw-down of revenue only
occurs as needed to fund expenditures. Expenditures were projected to be $5.4 million as of
December 31, 2019, with actual operating results under budget by $81,616 or 1.5 percent, for a
total of $5.3 million through the end of the second quarter.
The following revenue schedule provides a detailed listing of the various revenue sources
utilized by BURA to fund expenditures and provides additional detail behind the available
revenue sources. Funds are restricted as for specific purposes, as well as a cap on administrative
costs that are chargeable against the individual grant awards.
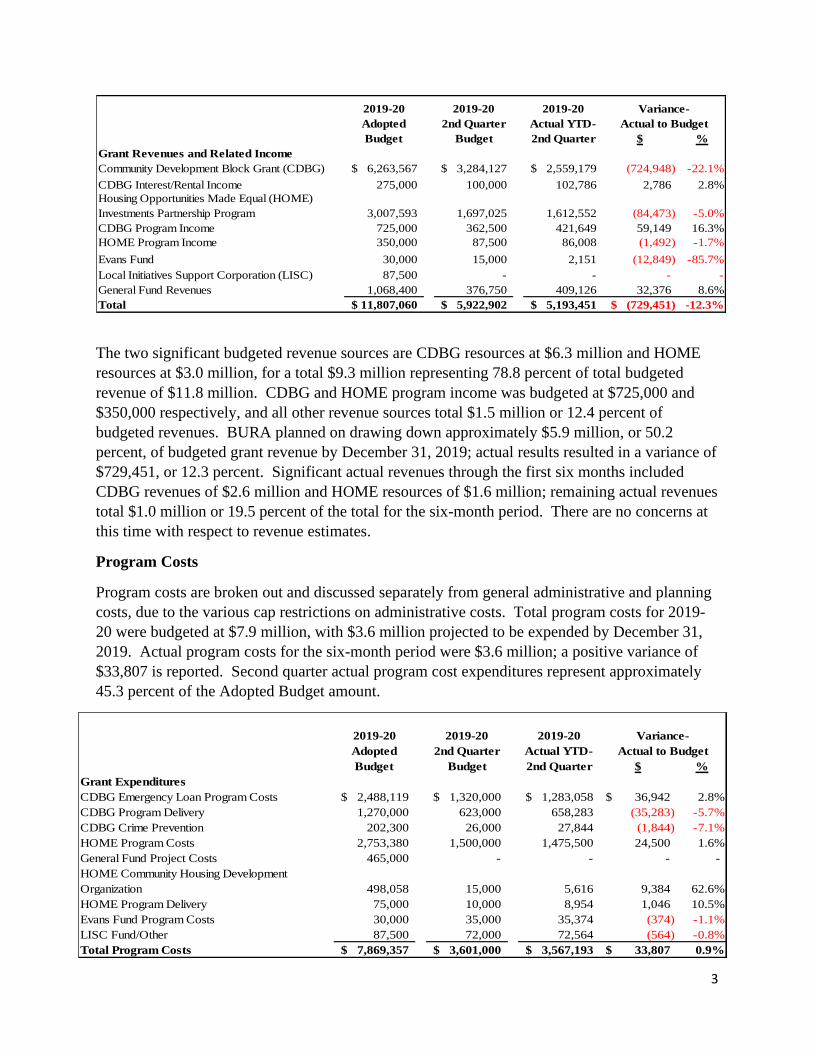
3
2019-20 2019-20 2019-20
$ %
Grant Revenues and Related Income
Community Development Block Grant (CDBG) 6,263,567$ 3,284,127$ 2,559,179$ (724,948) -22.1%
CDBG Interest/Rental Income 275,000 100,000 102,786 2,786 2.8%
Housing Opportunities Made Equal (HOME)
Investments Partnership Program 3,007,593 1,697,025 1,612,552 (84,473) -5.0%
CDBG Program Income 725,000 362,500 421,649 59,149 16.3%
HOME Program Income 350,000 87,500 86,008 (1,492) -1.7%
Evans Fund 30,000 15,000 2,151 (12,849) -85.7%
Local Initiatives Support Corporation (LISC) 87,500 - - - -
General Fund Revenues 1,068,400 376,750 409,126 32,376 8.6%
Total 11,807,060$ 5,922,902$ 5,193,451$ (729,451)$ -12.3%
Variance-
Adopted
Budget
2nd Quarter
Budget
Actual YTD-
2nd Quarter
Actual to Budget
The two significant budgeted revenue sources are CDBG resources at $6.3 million and HOME
resources at $3.0 million, for a total $9.3 million representing 78.8 percent of total budgeted
revenue of $11.8 million. CDBG and HOME program income was budgeted at $725,000 and
$350,000 respectively, and all other revenue sources total $1.5 million or 12.4 percent of
budgeted revenues. BURA planned on drawing down approximately $5.9 million, or 50.2
percent, of budgeted grant revenue by December 31, 2019; actual results resulted in a variance of
$729,451, or 12.3 percent. Significant actual revenues through the first six months included
CDBG revenues of $2.6 million and HOME resources of $1.6 million; remaining actual revenues
total $1.0 million or 19.5 percent of the total for the six-month period. There are no concerns at
this time with respect to revenue estimates.
Program Costs
Program costs are broken out and discussed separately from general administrative and planning
costs, due to the various cap restrictions on administrative costs. Total program costs for 2019-
20 were budgeted at $7.9 million, with $3.6 million projected to be expended by December 31,
2019. Actual program costs for the six-month period were $3.6 million; a positive variance of
$33,807 is reported. Second quarter actual program cost expenditures represent approximately
45.3 percent of the Adopted Budget amount.
2019-20 2019-20 2019-20
$ %
Grant Expenditures
CDBG Emergency Loan Program Costs 2,488,119$ 1,320,000$ 1,283,058$ 36,942$ 2.8%
CDBG Program Delivery 1,270,000 623,000 658,283 (35,283) -5.7%
CDBG Crime Prevention 202,300 26,000 27,844 (1,844) -7.1%
HOME Program Costs 2,753,380 1,500,000 1,475,500 24,500 1.6%
General Fund Project Costs 465,000 - - - -
HOME Community Housing Development
Organization 498,058 15,000 5,616 9,384 62.6%
HOME Program Delivery 75,000 10,000 8,954 1,046 10.5%
Evans Fund Program Costs 30,000 35,000 35,374 (374) -1.1%
LISC Fund/Other 87,500 72,000 72,564 (564) -0.8%
Total Program Costs 7,869,357$ 3,601,000$ 3,567,193$ 33,807$ 0.9%
Variance-
Adopted
Budget
2nd Quarter
Budget
Actual YTD-
2nd Quarter
Actual to Budget
4
Significant expenditures during the second quarter include approximately $1.5 million for
HOME programs funded through prior year allocations and a combined $1.9 million for the
CDBG emergency loan program and program delivery costs. All other program expenditures
totaled $150,000 through the end of the second quarter.
Currently, there are several HOME projects in progress which are difficult to budget on a
quarterly basis as the timing of such payments is dependent on the subrecipient submitting the
required documentation to BURA promptly. Such projects include the continuation of $2.8
million for a Citywide initiative targeting select homes to be rehabilitated and other targeted
investments. Examples of current projects include:
• Jefferson Avenue Apartments – People Inc. is the developer on this mixed-use project.
The project is a $31.1 million investment and includes $500,000 in BURA HOME
Investment Partnerships Program grants. The development consists of new construction
on two brownfield cleanup sites located between Dodge and Northampton Streets. Upon
completion, the project will provide a total of eighty-nine mixed-income apartments
ranging from 30 – 100 percent of area median income, with sixteen units set aside for
tenants with developmental disabilities or other impairments. The development will
include commercial space, a large community room and laundry facilities. Substantial
construction is underway with the north building construction being complete, and
tenants will begin moving in at the end of February 2020. As of February 2020, 65% of
the south building is complete with a tentative final completion date of July 2020.
• Purdy Street – An infill project promoting homeownership with a projected cost of
$582,000 funded solely through the BURA HOME Investment Partnerships Program.
This project consists of assembling five vacant residential parcels into two buildable lots
and the construction of two four-bedroom single family homes on those lots.
Construction of both units has been completed and both properties have sales contracts in
place for sales to eligible purchasers at December 31, 2019; final occupation occurred in
January 2020.
• Elim Townhomes – 129 Holden Street project projected to cost $10.7 million, with
$925,000 provided through the BURA HOME Investment Partnerships Program. The
project consists of the construction of five new townhome-style buildings which will
include thirty affordable units. The project is being constructed on a brownfield
remediated site adjacent to the Highland Park Village development. Upon completion,
there will be thirteen two-bedroom units, thirteen three-bedroom units, and four four-
bedroom units. Five of the new units are reserved for persons with mobility, hearing or
vision impairments. Approximately 95% of the construction is complete, closeout is
pending receipt of Certificate of Occupancy from Division of Permits and Inspections.
5
• Hope House – 243 Sears Street project is projected to be a $11.8 million redaptive reuse
project converting former Buffalo Public School #57 to supportive housing units. Upon
completion the mixed-use project will provide twenty-seven affordable units, with twenty
units designated as permanent supportive housing for homeless women and homeless
women with children. In addition, the building will house the Matt Urban Center
administrative offices and program space. The project began in June 2018 with a
projected completion date between January and June 2022. BURA’s commitment to this
project is $600,000 in HOME funds.
• Westminster Commons – 401 Monroe Street project is a $22.6 million redevelopment of
an 8.5 acre site that will include two buildings with a total of eighty-four units of
affordable housing upon completion. The project consists of the readaptive reuse of the
Westminster Settlement House, which will be rehabilitated and converted to
accommodate commercial and community service facility space that will include a
certified social adult day program, pharmacy and primary health care satellite office. A
second building will be constructed consisting of four-story multi-family residential
building including seventy-six one-bedroom apartments and eight two-bedroom
apartments. Forty of those units will be reserved for seniors with a severe persistent
illness and twenty-six for those with mental illness and who are homeless. Construction
began in November 2019 and is anticipated to be completed by April 2021. BURA’s
commitment to this project is $350,000 in HOME funds.
• Trinity One Apartments – 917-921 East Delavan Avenue project is a $2.3 million project
that consists of the readaptive reuse and conversion of a vacant 17,000 square foot
building into eight units of affordable rental housing. The unit mix consists of two two-
bedroom units and six one-bedroom units. Two units will be fully accessible, and one-
unit will be available for sensory impaired tenants. All units will be available to residents
who have incomes at or below 60 percent of the area median income. Construction
began in November 2019 and is anticipated to be completed between November 2020
and April 2021.
BURA is continuously providing resources for emergency housing repairs and emergency roof
repairs, weatherization programs, down payment assistance and home buyers education
workshops. BURA has expended approximately $1.4 million year-to-date for these programs.
Outside of the non-federal grants, BURA previously received a $475,000 grant from Evans
Bank, referred to as the Evans Fund, with a remaining balance of $30,000 budgeted for various
programs including a target street program, which provides funds for code-related repairs and
lead abatement, an emergency roof program, a weatherization assistance program and a down
payment closing costs assistance program. At the end of the second quarter the full amount of
the remaining balance of $30,000 was committed.
6
In addition, to the Evans Bank grant, BURA was also previously awarded $350,000 from the
Local Initiatives Support Corporation ("LISC"), with $87,500 budgeted in the current year. This
funding is to be used for targeting "zombie properties" in the City. Programs include engaging
with a consultant to prepare the City's Housing Opportunity Strategy, providing outreach and
counseling for those facing foreclosure, and creating a database on vacant and abandoned
properties. At the end of the second quarter, the available balance of these funds was
approximately $15,000, with $72,000 having been committed.
BURA has secured an additional $80,000 in grant funding this year through the Enterprise New
York’s Cities for Responsible Investment and Strategic Enforcement (“Cities RISE”) program.
These grant funds are to be used to target development in neighborhoods through “Love Your
Block” mini-grants, to provide funding for code enforcement officers, and to address abandoned
properties. The Love Your Block mini-grants are to provide funding to block clubs and
community-based organizations to assist in the improvement of their neighborhoods through
creation of community gardens and playgrounds. The initial planning stages of this program
have begun and subsequent to the release of BURA’s second quarter report, BURA was awarded
an additional $958,983 that will carry this work through its conclusion in December 2021.
These projects are examples of some of the targeted investment that BURA is currently making
in the City.
Administration and Planning Costs
The Adopted Budget included $3.9 million for administration and planning costs. BURA’s
second quarter budget was $1.8 million of $3.9 million, or 45.4 percent of the total budget.
Actual expenditures were $1.7 million, or $47,800 lower than the budgeted amount, which is due
to vacancies carried through the second quarter.
Total expenditures for the second quarter ended December 31, 2019, including both program
costs and administration and planning costs, were $5.3 million, or 45.0 percent of annual
budgeted expenditures. At the end of the second quarter, there is a positive variance of $81,600
that will be closed out at the end of the year. The following schedule summarizes administration
and planning costs and total expenditures as of the second quarter.
2019-20 2019-20 2019-20
$ %
Administration & Planning Costs
CDBG Admin @ 20% cap including Program
Income 2,990,254$ 1,315,127$ 1,114,429$ 200,698$ 15.3%
HOME Admin Costs @ 10% cap including
Program Income 344,049 172,025 208,490 (36,465) -21.2%
General Fund Costs 603,400 301,700 418,124 (116,424) -38.6%
Subtotal 3,937,703$ 1,788,852$ 1,741,043$ 47,809$ 2.7%
Total Program Costs 7,869,357$ 3,601,000$ 3,567,193$ 33,807$ 0.9%
Total Expenditures 11,807,060$ 5,389,852$ 5,308,236$ 81,616$ 1.5%
Adopted
Budget
2nd Quarter
Budget
Actual YTD-
2nd Quarter
Actual to Budget
Variance-
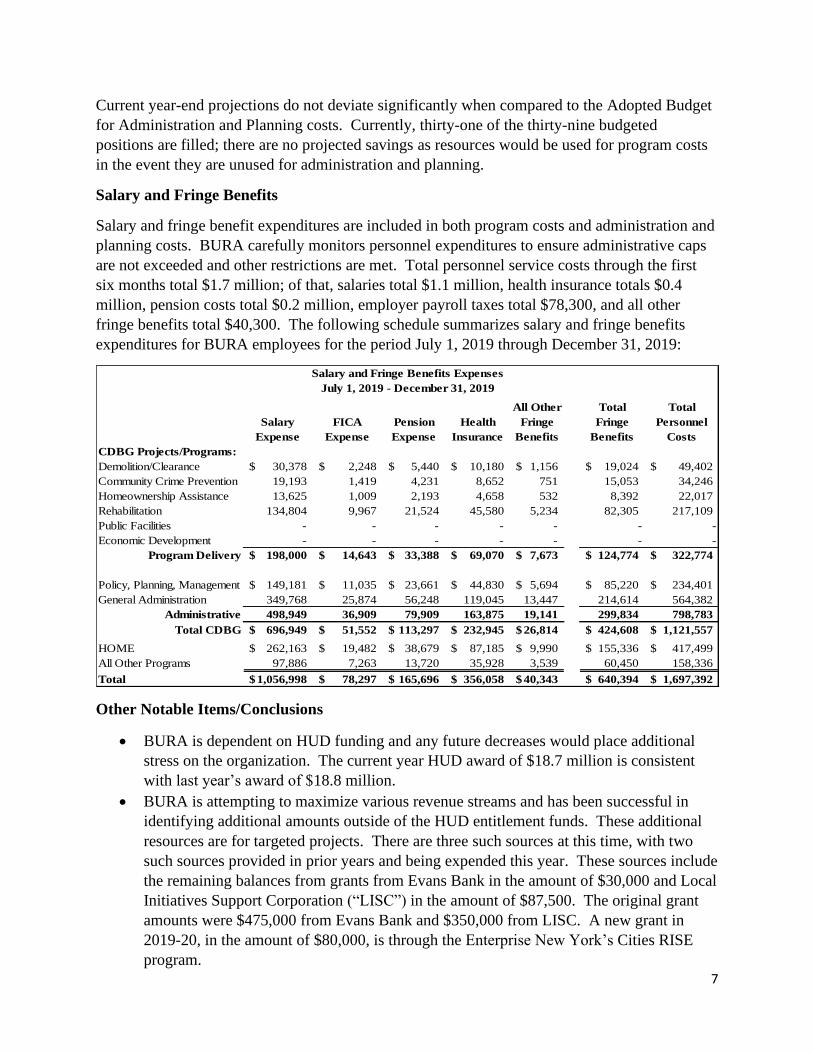
7
Current year-end projections do not deviate significantly when compared to the Adopted Budget
for Administration and Planning costs. Currently, thirty-one of the thirty-nine budgeted
positions are filled; there are no projected savings as resources would be used for program costs
in the event they are unused for administration and planning.
Salary and Fringe Benefits
Salary and fringe benefit expenditures are included in both program costs and administration and
planning costs. BURA carefully monitors personnel expenditures to ensure administrative caps
are not exceeded and other restrictions are met. Total personnel service costs through the first
six months total $1.7 million; of that, salaries total $1.1 million, health insurance totals $0.4
million, pension costs total $0.2 million, employer payroll taxes total $78,300, and all other
fringe benefits total $40,300. The following schedule summarizes salary and fringe benefits
expenditures for BURA employees for the period July 1, 2019 through December 31, 2019:
CDBG Projects/Programs:
Demolition/Clearance 30,378$ 2,248$ 5,440$ 10,180$ 1,156$ 19,024$ 49,402$
Community Crime Prevention 19,193 1,419 4,231 8,652 751 15,053 34,246
Homeownership Assistance 13,625 1,009 2,193 4,658 532 8,392 22,017
Rehabilitation 134,804 9,967 21,524 45,580 5,234 82,305 217,109
Public Facilities - - - - - - -
Economic Development - - - - - - -
Program Delivery 198,000$ 14,643$ 33,388$ 69,070$ 7,673$ 124,774$ 322,774$
Policy, Planning, Management 149,181$ 11,035$ 23,661$ 44,830$ 5,694$ 85,220$ 234,401$
General Administration 349,768 25,874 56,248 119,045 13,447 214,614 564,382
Administrative 498,949 36,909 79,909 163,875 19,141 299,834 798,783
Total CDBG 696,949$ 51,552$ 113,297$ 232,945$ 26,814$ 424,608$ 1,121,557$
HOME 262,163$ 19,482$ 38,679$ 87,185$ 9,990$ 155,336$ 417,499$
All Other Programs 97,886 7,263 13,720 35,928 3,539 60,450 158,336
Total 1,056,998$ 78,297$ 165,696$ 356,058$ 40,343$ 640,394$ 1,697,392$
Salary and Fringe Benefits Expenses
July 1, 2019 - December 31, 2019
Salary
Expense
FICA
Expense
Pension
Expense
Health
Insurance
All Other
Fringe
Benefits
Total
Fringe
Benefits
Total
Personnel
Costs
Other Notable Items/Conclusions
• BURA is dependent on HUD funding and any future decreases would place additional
stress on the organization. The current year HUD award of $18.7 million is consistent
with last year’s award of $18.8 million.
• BURA is attempting to maximize various revenue streams and has been successful in
identifying additional amounts outside of the HUD entitlement funds. These additional
resources are for targeted projects. There are three such sources at this time, with two
such sources provided in prior years and being expended this year. These sources include
the remaining balances from grants from Evans Bank in the amount of $30,000 and Local
Initiatives Support Corporation (“LISC”) in the amount of $87,500. The original grant
amounts were $475,000 from Evans Bank and $350,000 from LISC. A new grant in
2019-20, in the amount of $80,000, is through the Enterprise New York’s Cities RISE
program.
8
• BURA settled a collective bargaining agreement with CSEA Local 815 in 2017 which
expires at the end of the current fiscal-year June 30, 2020.
• Subsequent to the release of the first quarter report, BURA management received a
search-warrant and had their offices raided by the Federal Bureau of Investigation (the
“FBI”), the Internal Revenue Service (the “IRS”), and the Department of Housing and
Urban Development (“HUD”), resulting in numerous records being removed as part of an
ongoing investigation. The focus of the investigation is currently unknown. BURA has
continued to conduct business as usual, receiving its federal entitlement grants from the
Federal government and releasing funds to subrecipients. There were no restrictions
placed on BURA’s operations or ability to draw-down or expend funds, and there is no
update in regards to the search at this time.
1
BUFFALO FISCAL STABILITY AUTHORITY
Analysis of the Buffalo Municipal Housing Authority’s FY 2019-20 Second Quarter
The following is the Buffalo Fiscal Stability Authority’s (BFSA’s) analysis of the Buffalo
Municipal Housing Authority’s (BMHA’s) fiscal year (FY) 2019-20 second quarter report.
Summary
The BMHA issued its FY 2019-20 second quarter report (Second Quarter Report) covering
July 1, 2019 through December 31, 2019. BMHA reported year-to-date revenues of $23.6
million and expenses of $22.8 million representing 50.5% and 49.2%, respectively, of the FY
2019-20 Adopted Budget (Adopted Budget). Revenues exceeded expenses by $0.8 million at
December 31, 2019.
BMHA noted a minor favorable revenue budgetary variance of $0.2 million and a favorable
budgetary variance for expenses of $0.5 million at December 31, 2019, as compared to the Adopted
Budget.
Subsequent Event
On January 30, 2020, the BMHA amended its FY 2019-20 Adopted Budget and FY 2020-
2023 Financial Plan. The FY 2019-20 Adopted Budget as amended (Modified Budget)
includes increased revenues from $46.7 million to $47.6 million including $0.8 million in the
operating subsidy and $0.1 million in additional housing choice voucher income. Budgeted
expenses were increased from $46.2 million to $46.3 million to reflect one additional
executive-level white-collar budgeted and filled position. The adopted staffing plan was
increased by one position from 157 full-time equivalent (FTE) employees to 158 FTEs to
include one additional executive white-collar employee. The Modified Budget includes net
income of $1.3 million, prior to the payment of debt service. Debt service payments are
budgeted at $1.7 million. The budgeted cash impact is $0.6 million after reducing net income
for debt service payments and adding back in the $1.0 million non-cash accrual for Other
Postemployment Benefits (OPEB).
Opportunities (Update)
BMHA’s FY 2019-20 Adopted Budget and FY 2020-2023 Financial Plan included descriptions of
various programs that it is exploring and/or currently utilizing and will continue to utilize to fund
and improve operations.
The Capital Fund Financing Program (CFFP) allows BMHA to borrow the net present value of up
to 33% of the future twenty-year Capital Fund Program allocation to enter into new redevelopment
transactions and perform additional capital improvement work. It is currently estimated at $30.0
million. This program has not been built into the Financial Plan. The BMHA Board of
Commissioners has authorized the executive staff to apply for the CFFP. The BMHA has retained
the services of an outside firm to conduct a BMHA-wide physical needs assessment, which is
currently being conducted. BMHA anticipates the work to be completed by March 31, 2020.
BMHA will then submit the findings to the U.S. Department of Housing and Urban Development
(HUD) for final program authorization. After receiving authorization, BMHA will be in a position
to borrow for the program. The BMHA contracted with the Dominion Due Diligence Group to
perform the physical needs assessment at a cost not to exceed $381,430. The contract’s cost will
be funded through BMHA’s Capital Fund.
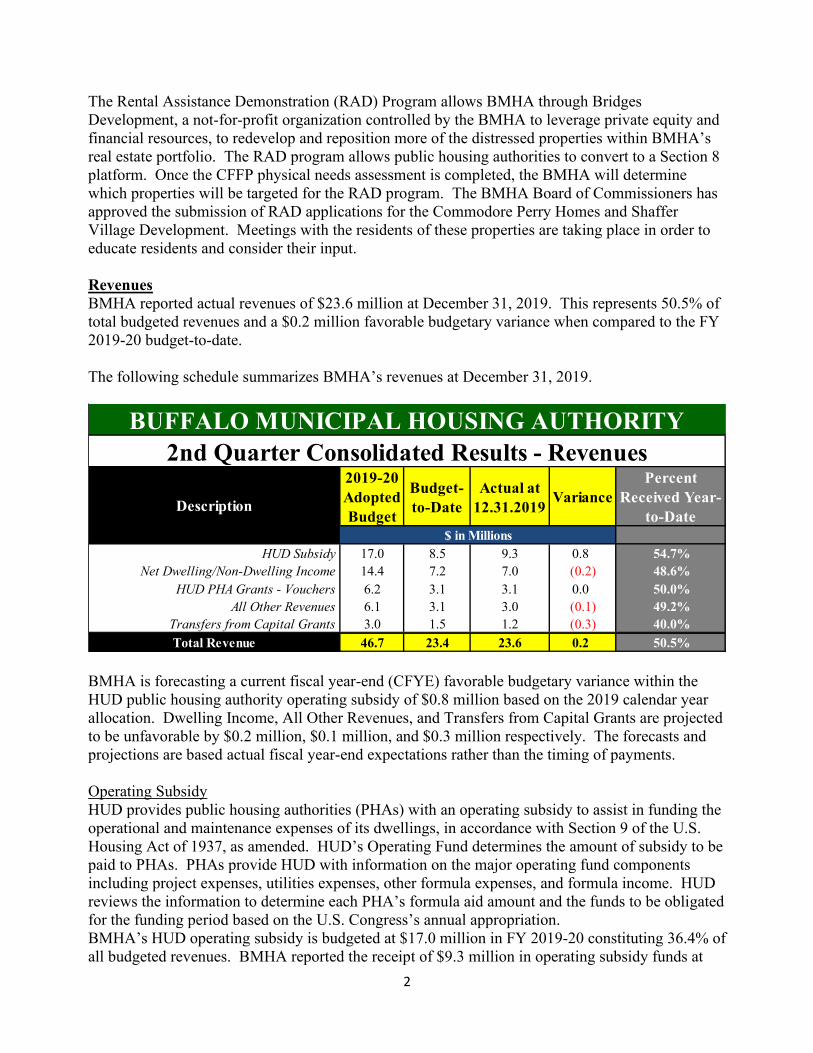
2
The Rental Assistance Demonstration (RAD) Program allows BMHA through Bridges
Development, a not-for-profit organization controlled by the BMHA to leverage private equity and
financial resources, to redevelop and reposition more of the distressed properties within BMHA’s
real estate portfolio. The RAD program allows public housing authorities to convert to a Section 8
platform. Once the CFFP physical needs assessment is completed, the BMHA will determine
which properties will be targeted for the RAD program. The BMHA Board of Commissioners has
approved the submission of RAD applications for the Commodore Perry Homes and Shaffer
Village Development. Meetings with the residents of these properties are taking place in order to
educate residents and consider their input.
Revenues
BMHA reported actual revenues of $23.6 million at December 31, 2019. This represents 50.5% of
total budgeted revenues and a $0.2 million favorable budgetary variance when compared to the FY
2019-20 budget-to-date.
The following schedule summarizes BMHA’s revenues at December 31, 2019.
BMHA is forecasting a current fiscal year-end (CFYE) favorable budgetary variance within the
HUD public housing authority operating subsidy of $0.8 million based on the 2019 calendar year
allocation. Dwelling Income, All Other Revenues, and Transfers from Capital Grants are projected
to be unfavorable by $0.2 million, $0.1 million, and $0.3 million respectively. The forecasts and
projections are based actual fiscal year-end expectations rather than the timing of payments.
Operating Subsidy
HUD provides public housing authorities (PHAs) with an operating subsidy to assist in funding the
operational and maintenance expenses of its dwellings, in accordance with Section 9 of the U.S.
Housing Act of 1937, as amended. HUD’s Operating Fund determines the amount of subsidy to be
paid to PHAs. PHAs provide HUD with information on the major operating fund components
including project expenses, utilities expenses, other formula expenses, and formula income. HUD
reviews the information to determine each PHA’s formula aid amount and the funds to be obligated
for the funding period based on the U.S. Congress’s annual appropriation.
BMHA’s HUD operating subsidy is budgeted at $17.0 million in FY 2019-20 constituting 36.4% of
all budgeted revenues. BMHA reported the receipt of $9.3 million in operating subsidy funds at
2019-20
Adopted
Budget
Budget-
to-Date
Actual at
12.31.2019Variance
Percent
Received Year-
to-Date
HUD Subsidy 17.0 8.5 9.3 0.8 54.7%
Net Dwelling/Non-Dwelling Income 14.4 7.2 7.0 (0.2) 48.6%
HUD PHA Grants - Vouchers 6.2 3.1 3.1 0.0 50.0%
All Other Revenues 6.1 3.1 3.0 (0.1) 49.2%
Transfers from Capital Grants 3.0 1.5 1.2 (0.3) 40.0%
Total Revenue 46.7 23.4 23.6 0.2 50.5%
BUFFALO MUNICIPAL HOUSING AUTHORITY
2nd Quarter Consolidated Results - Revenues
Description
$ in Millions
3
December 31, 2019. This represents a favorable budgetary variance of $0.8 million for the six-
month period ended December 31, 2019. The Adopted Budget includes a 95% proration of eligible
funding in calendar year 2019. The actual calendar year 2019 proration is 96%. The receipt of
revenues is in excess of the budgeted amount as a result of the higher-than-estimated proration
amount.
Dwelling/Non-Dwelling Income
BMHA budgeted $14.4 million in net dwelling/non-dwelling income in FY 2019-20. Dwelling
income includes the rental payments that BMHA receives from tenants while non-dwelling income
consists of rental income received for commercially rented space. BMHA reported the receipt of
$7.0 million for these revenues at December 31, 2019. This represented an unfavorable budgetary
variance of $0.2 million. BMHA has not forecast a CFYE unfavorable budgetary variance. Actual
rental receipts at December 31, 2019 were less than budget. BMHA petitioned the New York State
Homes and Community Renewal Agency to increase rents at the Marine Drive Apartments by
10%. BMHA has received the authorization to implement this increase effective October 1, 2019
and anticipates that the additional unbudgeted dwelling income revenue from the Marine Drive
Apartments will offset the less-than-budgeted receipts at December 31, 2019. The Marine Drive
rental increase is anticipated to generate $0.3 million in additional rental payments on a full year
basis.
BMHA is increasingly more reliant on these revenues for general operations. The HUD operating
subsidy has generally decreased over the past several fiscal years as both a percentage of total
revenues and actual funds received.
Voucher Grants
BMHA receives Public Housing Authority voucher grants (PHA Grants) from HUD. This revenue
source does not impact overall BMHA operations as the BMHA passes the vouchers along to
recipients, less the Housing Choice Voucher Administration Fee earned which is transferred to the
Central Office Cost Center to administer the program. BMHA budgeted $6.2 million in PHA
Grants in FY 2019-20, or 13.3% of total budgeted revenues. This projection is based on the HUD
Housing Choice voucher approved funding which the 2020 Omnibus Bill increased from $20.598
billion to $23.874 billion. Actual voucher revenues received at December 31, 2019 were consistent
with the budget-to-date projection of $3.1 million.
The revenues and expenses of the voucher program reflect BMHA’s continued efforts to fully
utilize the total vouchers available from the program. PHAs that do not spend 100% of available
PHA Grants are considered underutilized and may be subject to either a penalization and/or a
recapture of the underutilized funds. BMHA’s efforts to maximize the grant utilization allows
more voucher grant dollars to be allocated to eligible families.
Transfers from Capital Grants
BMHA budgeted $3.0 million in Transfers from Capital Grants in FY 2019-20. These funds are
used to reimburse BMHA for the administrative and programmatic work performed on grants and
therefore may fund general operations. They consist of two components: one representing the
capital grant program administration cost reimbursements and one for direct personnel costs. This
amount will fluctuate depending on the annual capital grants awarded and expensed. This revenue
represents the transfer of grant funds for the reimbursement of expenses.
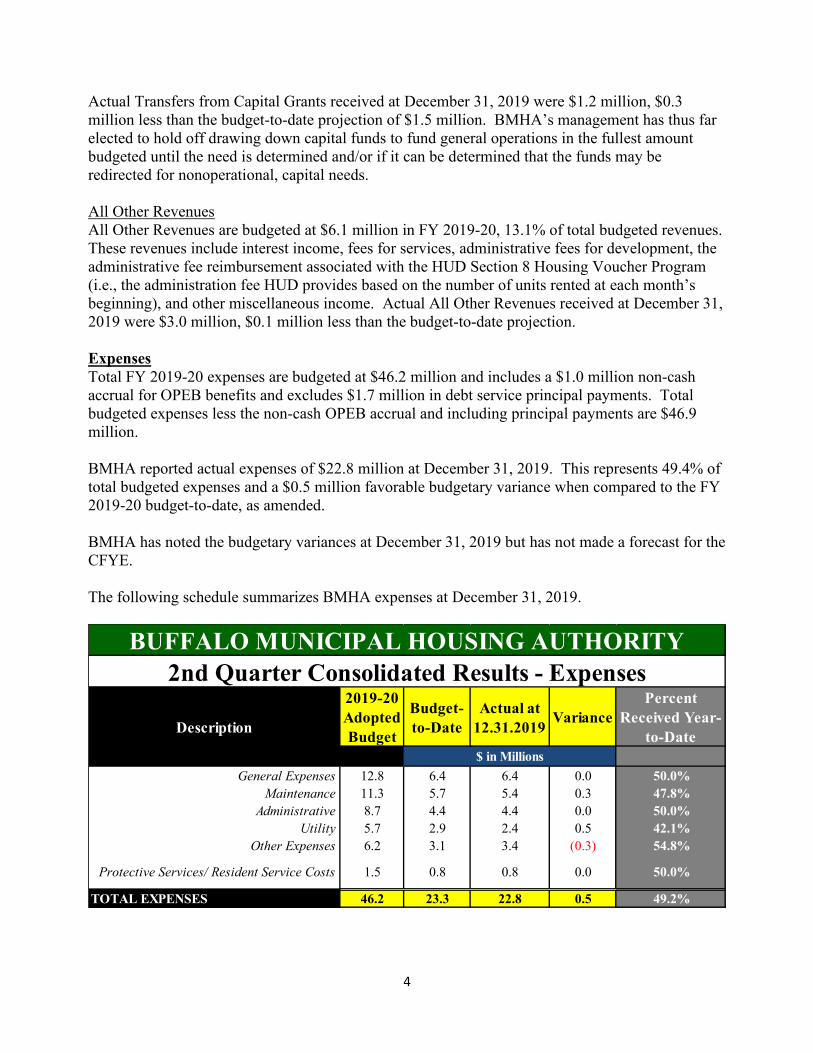
4
Actual Transfers from Capital Grants received at December 31, 2019 were $1.2 million, $0.3
million less than the budget-to-date projection of $1.5 million. BMHA’s management has thus far
elected to hold off drawing down capital funds to fund general operations in the fullest amount
budgeted until the need is determined and/or if it can be determined that the funds may be
redirected for nonoperational, capital needs.
All Other Revenues
All Other Revenues are budgeted at $6.1 million in FY 2019-20, 13.1% of total budgeted revenues.
These revenues include interest income, fees for services, administrative fees for development, the
administrative fee reimbursement associated with the HUD Section 8 Housing Voucher Program
(i.e., the administration fee HUD provides based on the number of units rented at each month’s
beginning), and other miscellaneous income. Actual All Other Revenues received at December 31,
2019 were $3.0 million, $0.1 million less than the budget-to-date projection.
Expenses
Total FY 2019-20 expenses are budgeted at $46.2 million and includes a $1.0 million non-cash
accrual for OPEB benefits and excludes $1.7 million in debt service principal payments. Total
budgeted expenses less the non-cash OPEB accrual and including principal payments are $46.9
million.
BMHA reported actual expenses of $22.8 million at December 31, 2019. This represents 49.4% of
total budgeted expenses and a $0.5 million favorable budgetary variance when compared to the FY
2019-20 budget-to-date, as amended.
BMHA has noted the budgetary variances at December 31, 2019 but has not made a forecast for the
CFYE.
The following schedule summarizes BMHA expenses at December 31, 2019.
2019-20
Adopted
Budget
Budget-
to-Date
Actual at
12.31.2019Variance
Percent
Received Year-
to-Date
General Expenses 12.8 6.4 6.4 0.0 50.0%
Maintenance 11.3 5.7 5.4 0.3 47.8%
Administrative 8.7 4.4 4.4 0.0 50.0%
Utility 5.7 2.9 2.4 0.5 42.1%
Other Expenses 6.2 3.1 3.4 (0.3) 54.8%
Protective Services/ Resident Service Costs 1.5 0.8 0.8 0.0 50.0%
TOTAL EXPENSES 46.2 23.3 22.8 0.5 49.2%
BUFFALO MUNICIPAL HOUSING AUTHORITY
2nd Quarter Consolidated Results - Expenses
Description
$ in Millions
5
General Expenses
BMHA budgeted $12.8 million in General Expenses in FY 2019-20. This represents 27.8% of total
budgeted expenses. These expenses include employee benefits, insurances, the annual accrual for
OPEB, and other miscellaneous expenses. Actual General Expenses were $6.4 million at
December 31, 2019, equivalent to the budget-to-date.
Employee benefits are less than budgeted costs by approximately $140,000 due to vacancies during
the first six-months of 2019-20; positions have subsequently been filled therefore the expenses for
the remaining six months are expected to be consistent with the budget. Retiree health insurance is
reported as favorable compared to the budget by approximately $191,000. Actual Payments-in-
Lieu-of-Taxes (PILOTs) were unfavorable by $0.3 million due to a lower budgetary estimate.
Other General Expenses were unfavorable by $453,511 as BMHA provided funds to Bridges
Development in connection with the Frederick Douglass I transaction.
It is reasonable to assume that some level of favorable budgetary variance will occur at CFYE as
actual employee and retiree health insurance benefits have been favorable while the unfavorable
budgetary variance related to PILOTs is due to the timing of the payments, rather than an
anticipated reduction in the overall amount anticipated to be paid. The payment from BMHA to
Bridges Development was not budgeted and will represent an unfavorable budgetary variance
within Other General Expenses.
Maintenance
BMHA budgeted $11.3 million in Maintenance Expenses in FY 2019-20. This represents 24.5% of
total budgeted expenses. Actual Maintenance Expenses were $5.4 million at December 31, 2019,
$0.3 million less than the budget-to-date. BMHA has noted a favorable budgetary variance of $0.3
million at December 31, 2019 in maintenance employee compensation due to vacant blue-collar
positions and less usage of contracted snow removal services due to the mild winter.
Administrative
BMHA budgeted FY 2019-20 Administrative Expenses at $8.7 million. This represents 18.8% of
total budgeted expenses. Actual Administrative Expenses at December 31, 2019 were $4.4 million,
equivalent to the budget-to-date. Various Administrative Expenses depicted minor favorable and
unfavorable variances at December 31, 2019 with a net zero budgetary variance. Most
significantly, administrative salaries were favorable by $57,000, largely due to a vacant executive
position.
Utilities
BMHA budgeted FY 2019-20 Utility Expenses at $5.7 million. This represents 12.3% of total
budgeted expenses. Actual Utility Expenses were $2.4 million at December 31, 2019, $0.5 million
less than the budget-to-date. This expense is heavily influenced by the severity of the winter
season. As such, both the natural gas and electric expenses were favorable by $452,000 and
$57,000, respectively.
BMHA has noted this significant variance but has not made a CFYE projection relative to Utility
Expenses. Given the substantial favorable budgetary variance related to the natural gas
expenditure, BFSA believes it is reasonable to forecast a CFYE budgetary variance based on the
actual Utility expenses at December 31, 2019.
6
It is noted that BMHA is reimbursed through the HUD Operating Subsidy for utility expenses
based on a three-year rolling average of expenses, adjusted by an inflationary or deflationary factor,
creating a time-lag for reimbursement of increases or decreases.
Protective Services/Resident Services Costs
BMHA budgeted FY 2019-20 Protective and Resident Service Expenses at $1.5 million. This
represents 3.2% of total expenses. The Modified Budget includes one additional Resident Service
employee, as compared to the adopted staffing plan.
Protective Services Expenses are contractually based with $704,960 budgeted for the Buffalo
Police Department’s protective services contract. The remaining expenses are for employee costs.
Protective Services and Resident Service Costs were equivalent to the $0.8 million budget-to-date
amount. No budgetary variances are forecast at CFYE.
Other Expenses
BMHA budgeted FY 2019-20 Other Expenses at $6.2 million. This represents 13.4% of total
expenses. These expenses are mainly pass-through expenses, not operational expenses. Other
Expenses include the housing assistance payment (HAP), the payment a public authority makes to
housing choice voucher program participants.
Actual Other Expenses were $3.4 million at December 31, 2019, or $0.3 million greater than the
budget-to-date amount of $3.1 million. The unfavorable budgetary variance is due to the timing of
HUD funding (i.e., when vouchers are issued and when Housing Authority Payments (HAP) are
made). HAP voucher income is restricted to be used for HAP payments.
Personnel
The BMHA budgeted 157 full-time positions for FY 2019-20. The vacancy rate at December 31,
2019 was 6.4% as ten positions were unfilled. Nine of the ten vacant positions were within the
Asset Management and Capital Improvement departments including three blue-collar employees
and six white-collar employees.
BMHA had lower-than-budget employee compensation and fringe benefit expenses at December
31, 2019 as a result of the overall vacancy rate.
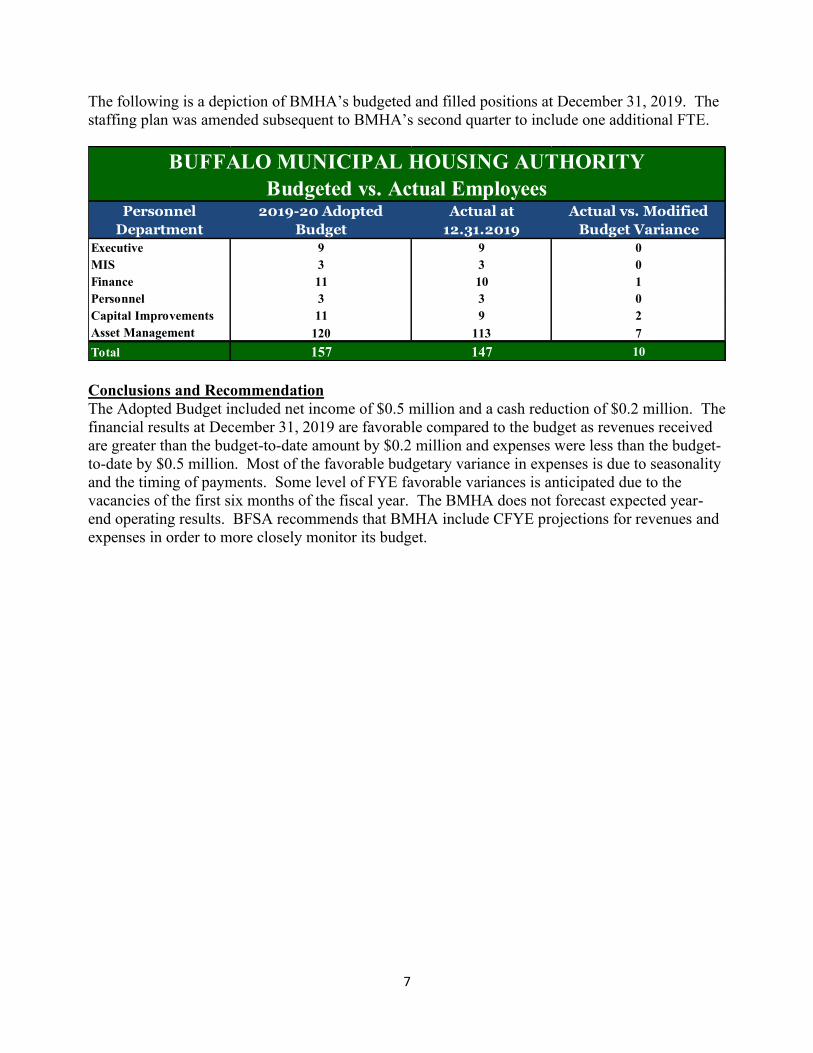
7
The following is a depiction of BMHA’s budgeted and filled positions at December 31, 2019. The
staffing plan was amended subsequent to BMHA’s second quarter to include one additional FTE.
Conclusions and Recommendation
The Adopted Budget included net income of $0.5 million and a cash reduction of $0.2 million. The
financial results at December 31, 2019 are favorable compared to the budget as revenues received
are greater than the budget-to-date amount by $0.2 million and expenses were less than the budget-
to-date by $0.5 million. Most of the favorable budgetary variance in expenses is due to seasonality
and the timing of payments. Some level of FYE favorable variances is anticipated due to the
vacancies of the first six months of the fiscal year. The BMHA does not forecast expected year-
end operating results. BFSA recommends that BMHA include CFYE projections for revenues and
expenses in order to more closely monitor its budget.
Personnel
Department
2019-20 Adopted
Budget
Actual at
12.31.2019
Actual vs. Modified
Budget Variance
Executive 9 9 0
MIS 3 3 0
Finance 11 10 1
Personnel 3 3 0
Capital Improvements 11 9 2
Asset Management 120 113 7
Total 157 147 10
BUFFALO MUNICIPAL HOUSING AUTHORITY
Budgeted vs. Actual Employees
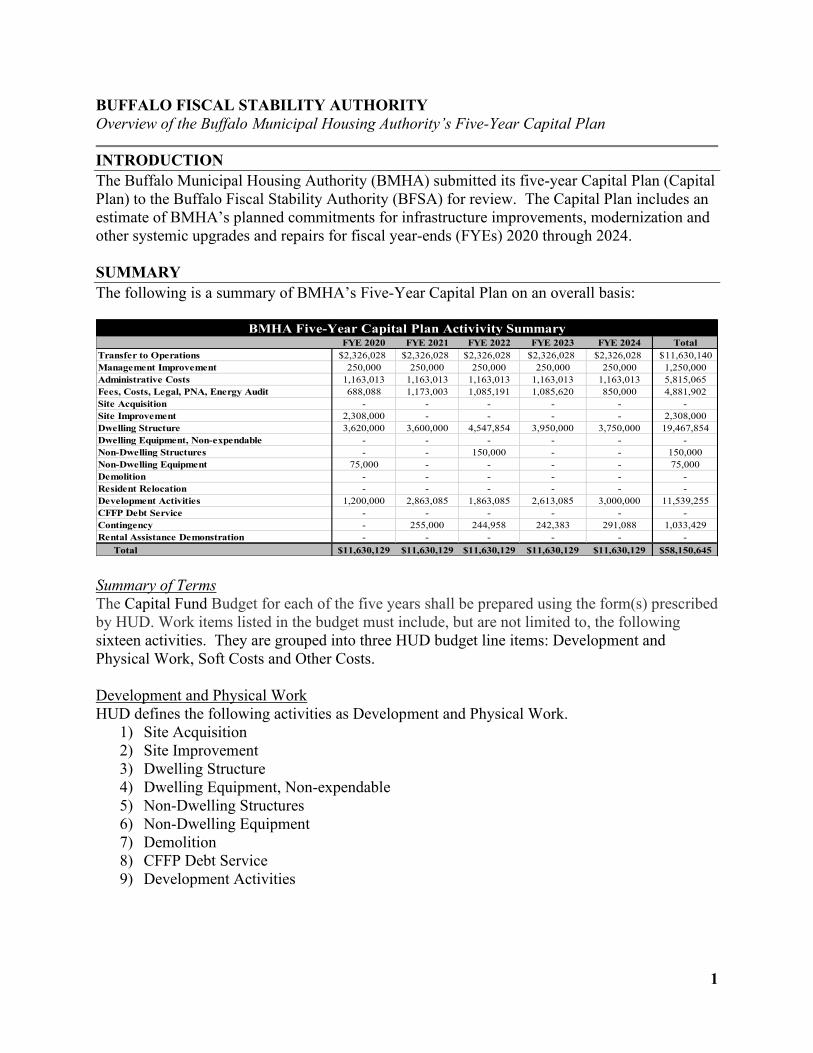
1
BUFFALO FISCAL STABILITY AUTHORITY
Overview of the Buffalo Municipal Housing Authority’s Five-Year Capital Plan
INTRODUCTION
The Buffalo Municipal Housing Authority (BMHA) submitted its five-year Capital Plan (Capital
Plan) to the Buffalo Fiscal Stability Authority (BFSA) for review. The Capital Plan includes an
estimate of BMHA’s planned commitments for infrastructure improvements, modernization and
other systemic upgrades and repairs for fiscal year-ends (FYEs) 2020 through 2024.
SUMMARY
The following is a summary of BMHA’s Five-Year Capital Plan on an overall basis:
Summary of Terms
The Capital Fund Budget for each of the five years shall be prepared using the form(s) prescribed
by HUD. Work items listed in the budget must include, but are not limited to, the following
sixteen activities. They are grouped into three HUD budget line items: Development and
Physical Work, Soft Costs and Other Costs.
Development and Physical Work
HUD defines the following activities as Development and Physical Work.
1) Site Acquisition
2) Site Improvement
3) Dwelling Structure
4) Dwelling Equipment, Non-expendable
5) Non-Dwelling Structures
6) Non-Dwelling Equipment
7) Demolition
8) CFFP Debt Service
9) Development Activities
FYE 2020 FYE 2021 FYE 2022 FYE 2023 FYE 2024 Total
Transfer to Operations $2,326,028 $2,326,028 $2,326,028 $2,326,028 $2,326,028 11,630,140$
Management Improvement 250,000 250,000 250,000 250,000 250,000 1,250,000
Administrative Costs 1,163,013 1,163,013 1,163,013 1,163,013 1,163,013 5,815,065
Fees, Costs, Legal, PNA, Energy Audit 688,088 1,173,003 1,085,191 1,085,620 850,000 4,881,902
Site Acquisition - - - - - -
Site Improvement 2,308,000 - - - - 2,308,000
Dwelling Structure 3,620,000 3,600,000 4,547,854 3,950,000 3,750,000 19,467,854
Dwelling Equipment, Non-expendable - - - - - -
Non-Dwelling Structures - - 150,000 - - 150,000
Non-Dwelling Equipment 75,000 - - - - 75,000
Demolition - - - - - -
Resident Relocation - - - - - -
Development Activities 1,200,000 2,863,085 1,863,085 2,613,085 3,000,000 11,539,255
CFFP Debt Service - - - - - -
Contingency - 255,000 244,958 242,383 291,088 1,033,429
Rental Assistance Demonstration - - - - - -
Total $11,630,129 $11,630,129 $11,630,129 $11,630,129 $11,630,129 $58,150,645
BMHA Five-Year Capital Plan Activivity Summary
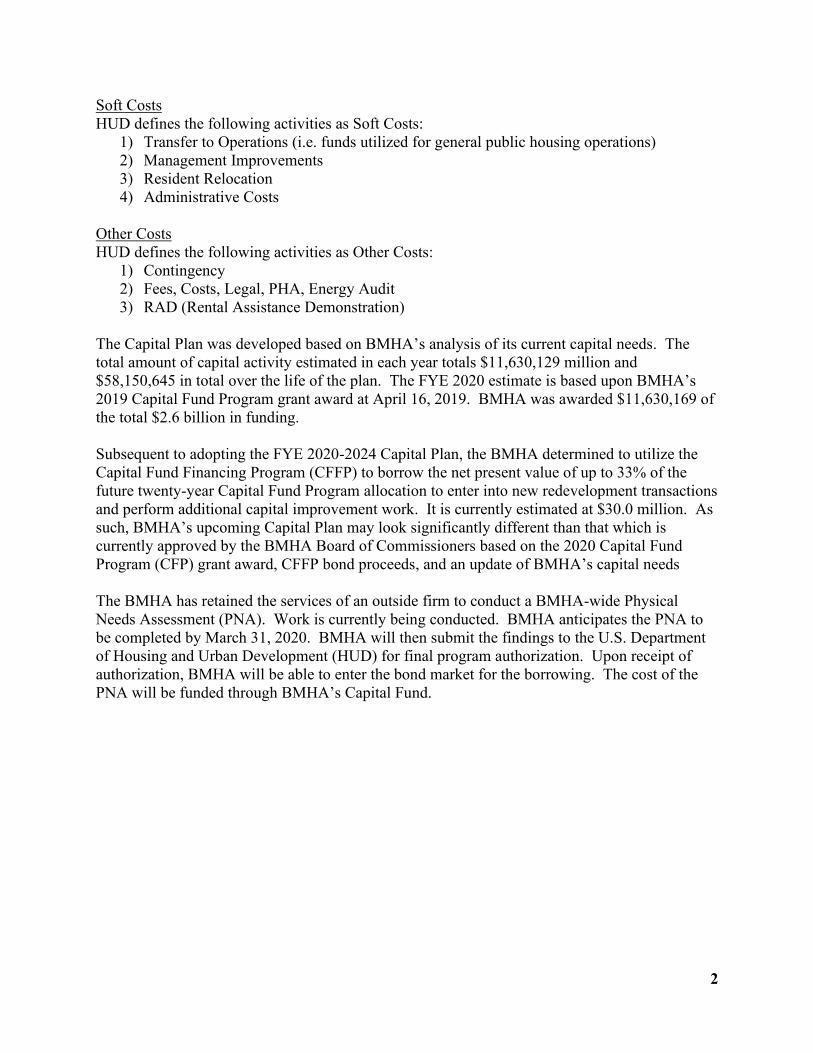
2
Soft Costs
HUD defines the following activities as Soft Costs:
1) Transfer to Operations (i.e. funds utilized for general public housing operations)
2) Management Improvements
3) Resident Relocation
4) Administrative Costs
Other Costs
HUD defines the following activities as Other Costs:
1) Contingency
2) Fees, Costs, Legal, PHA, Energy Audit
3) RAD (Rental Assistance Demonstration)
The Capital Plan was developed based on BMHA’s analysis of its current capital needs. The
total amount of capital activity estimated in each year totals $11,630,129 million and
$58,150,645 in total over the life of the plan. The FYE 2020 estimate is based upon BMHA’s
2019 Capital Fund Program grant award at April 16, 2019. BMHA was awarded $11,630,169 of
the total $2.6 billion in funding.
Subsequent to adopting the FYE 2020-2024 Capital Plan, the BMHA determined to utilize the
Capital Fund Financing Program (CFFP) to borrow the net present value of up to 33% of the
future twenty-year Capital Fund Program allocation to enter into new redevelopment transactions
and perform additional capital improvement work. It is currently estimated at $30.0 million. As
such, BMHA’s upcoming Capital Plan may look significantly different than that which is
currently approved by the BMHA Board of Commissioners based on the 2020 Capital Fund
Program (CFP) grant award, CFFP bond proceeds, and an update of BMHA’s capital needs
The BMHA has retained the services of an outside firm to conduct a BMHA-wide Physical
Needs Assessment (PNA). Work is currently being conducted. BMHA anticipates the PNA to
be completed by March 31, 2020. BMHA will then submit the findings to the U.S. Department
of Housing and Urban Development (HUD) for final program authorization. Upon receipt of
authorization, BMHA will be able to enter the bond market for the borrowing. The cost of the
PNA will be funded through BMHA’s Capital Fund.
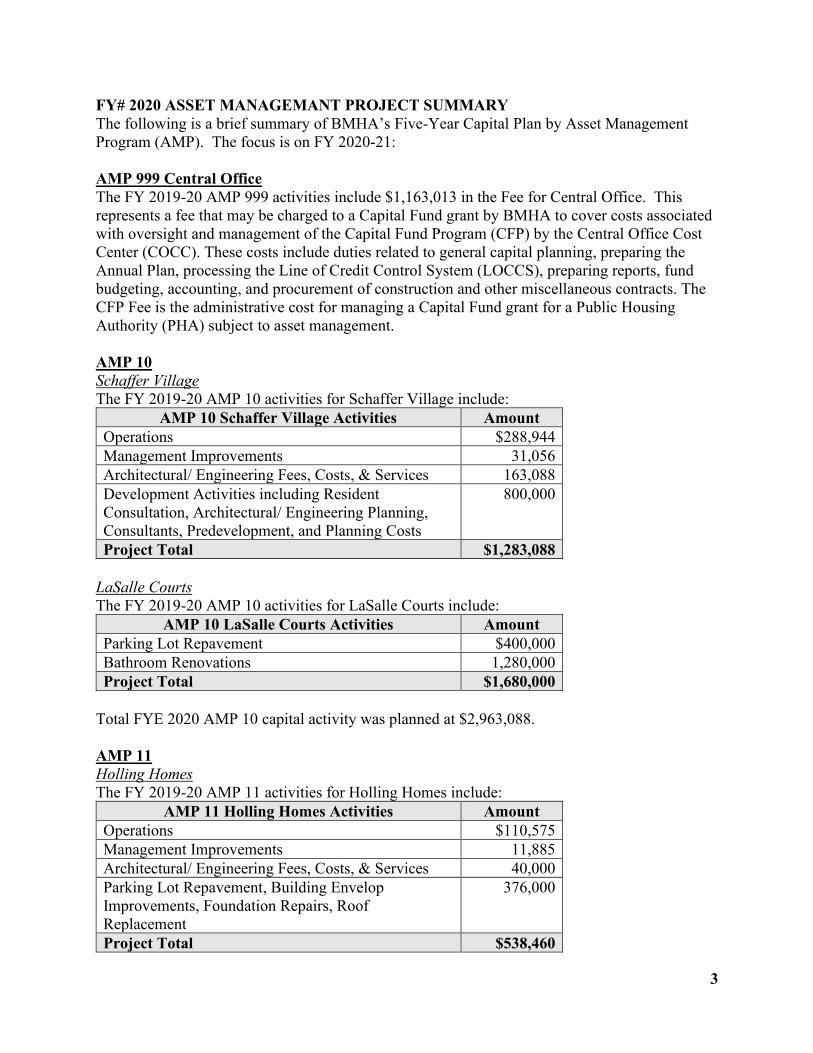
3
FY# 2020 ASSET MANAGEMANT PROJECT SUMMARY
The following is a brief summary of BMHA’s Five-Year Capital Plan by Asset Management
Program (AMP). The focus is on FY 2020-21:
AMP 999 Central Office
The FY 2019-20 AMP 999 activities include $1,163,013 in the Fee for Central Office. This
represents a fee that may be charged to a Capital Fund grant by BMHA to cover costs associated
with oversight and management of the Capital Fund Program (CFP) by the Central Office Cost
Center (COCC). These costs include duties related to general capital planning, preparing the
Annual Plan, processing the Line of Credit Control System (LOCCS), preparing reports, fund
budgeting, accounting, and procurement of construction and other miscellaneous contracts. The
CFP Fee is the administrative cost for managing a Capital Fund grant for a Public Housing
Authority (PHA) subject to asset management.
AMP 10
Schaffer Village
The FY 2019-20 AMP 10 activities for Schaffer Village include:
AMP 10 Schaffer Village Activities Amount
Operations $288,944
Management Improvements 31,056
Architectural/ Engineering Fees, Costs, & Services 163,088
Development Activities including Resident
Consultation, Architectural/ Engineering Planning,
Consultants, Predevelopment, and Planning Costs
800,000
Project Total $1,283,088
LaSalle Courts
The FY 2019-20 AMP 10 activities for LaSalle Courts include:
AMP 10 LaSalle Courts Activities Amount
Parking Lot Repavement $400,000
Bathroom Renovations 1,280,000
Project Total $1,680,000
Total FYE 2020 AMP 10 capital activity was planned at $2,963,088.
AMP 11
Holling Homes
The FY 2019-20 AMP 11 activities for Holling Homes include:
AMP 11 Holling Homes Activities Amount
Operations $110,575
Management Improvements 11,885
Architectural/ Engineering Fees, Costs, & Services 40,000
Parking Lot Repavement, Building Envelop
Improvements, Foundation Repairs, Roof
Replacement
376,000
Project Total $538,460
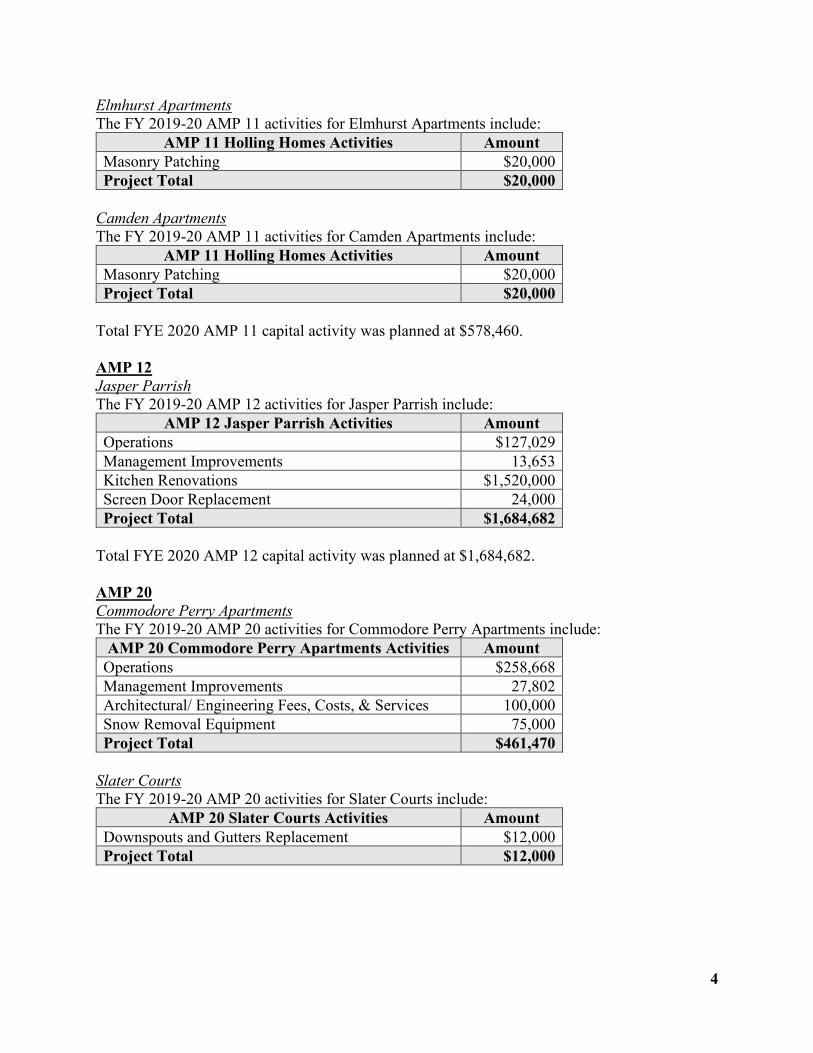
4
Elmhurst Apartments
The FY 2019-20 AMP 11 activities for Elmhurst Apartments include:
AMP 11 Holling Homes Activities Amount
Masonry Patching $20,000
Project Total $20,000
Camden Apartments
The FY 2019-20 AMP 11 activities for Camden Apartments include:
AMP 11 Holling Homes Activities Amount
Masonry Patching $20,000
Project Total $20,000
Total FYE 2020 AMP 11 capital activity was planned at $578,460.
AMP 12
Jasper Parrish
The FY 2019-20 AMP 12 activities for Jasper Parrish include:
AMP 12 Jasper Parrish Activities Amount
Operations $127,029
Management Improvements 13,653
Kitchen Renovations $1,520,000
Screen Door Replacement 24,000
Project Total $1,684,682
Total FYE 2020 AMP 12 capital activity was planned at $1,684,682.
AMP 20
Commodore Perry Apartments
The FY 2019-20 AMP 20 activities for Commodore Perry Apartments include:
AMP 20 Commodore Perry Apartments Activities Amount
Operations $258,668
Management Improvements 27,802
Architectural/ Engineering Fees, Costs, & Services 100,000
Snow Removal Equipment 75,000
Project Total $461,470
Slater Courts
The FY 2019-20 AMP 20 activities for Slater Courts include:
AMP 20 Slater Courts Activities Amount
Downspouts and Gutters Replacement $12,000
Project Total $12,000
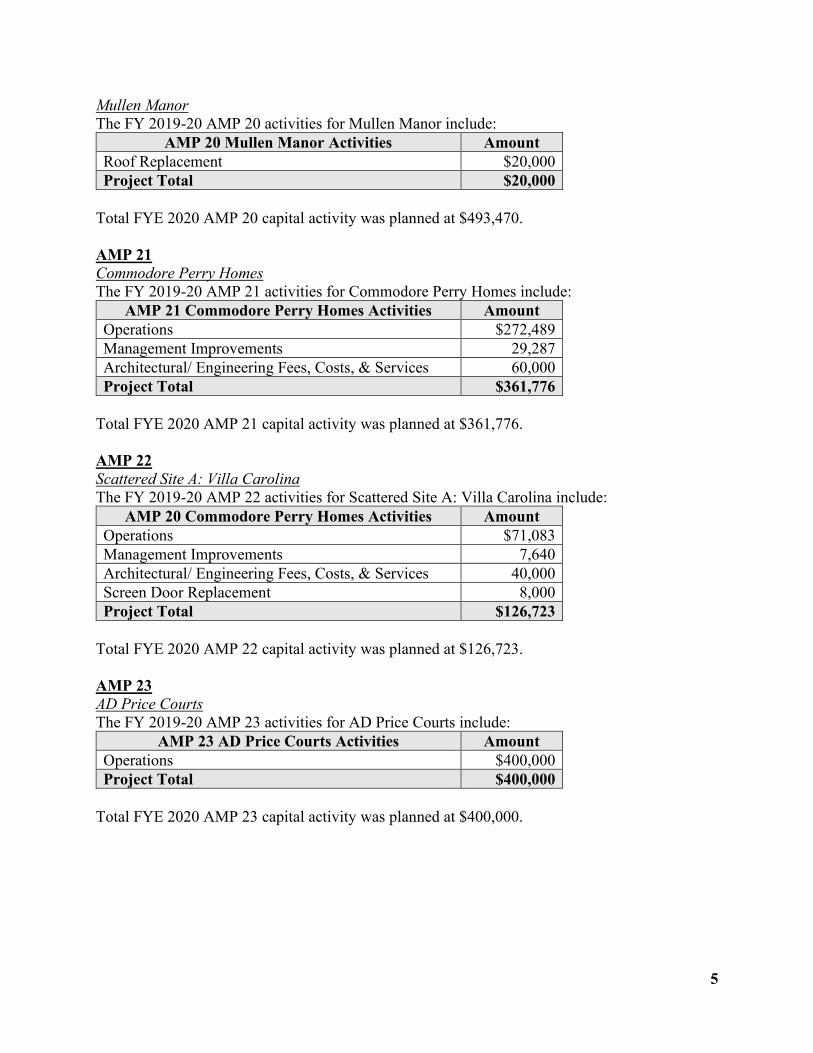
5
Mullen Manor
The FY 2019-20 AMP 20 activities for Mullen Manor include:
AMP 20 Mullen Manor Activities Amount
Roof Replacement $20,000
Project Total $20,000
Total FYE 2020 AMP 20 capital activity was planned at $493,470.
AMP 21
Commodore Perry Homes
The FY 2019-20 AMP 21 activities for Commodore Perry Homes include:
AMP 21 Commodore Perry Homes Activities Amount
Operations $272,489
Management Improvements 29,287
Architectural/ Engineering Fees, Costs, & Services 60,000
Project Total $361,776
Total FYE 2020 AMP 21 capital activity was planned at $361,776.
AMP 22
Scattered Site A: Villa Carolina
The FY 2019-20 AMP 22 activities for Scattered Site A: Villa Carolina include:
AMP 20 Commodore Perry Homes Activities Amount
Operations $71,083
Management Improvements 7,640
Architectural/ Engineering Fees, Costs, & Services 40,000
Screen Door Replacement 8,000
Project Total $126,723
Total FYE 2020 AMP 22 capital activity was planned at $126,723.
AMP 23
AD Price Courts
The FY 2019-20 AMP 23 activities for AD Price Courts include:
AMP 23 AD Price Courts Activities Amount
Operations $400,000
Project Total $400,000
Total FYE 2020 AMP 23 capital activity was planned at $400,000.
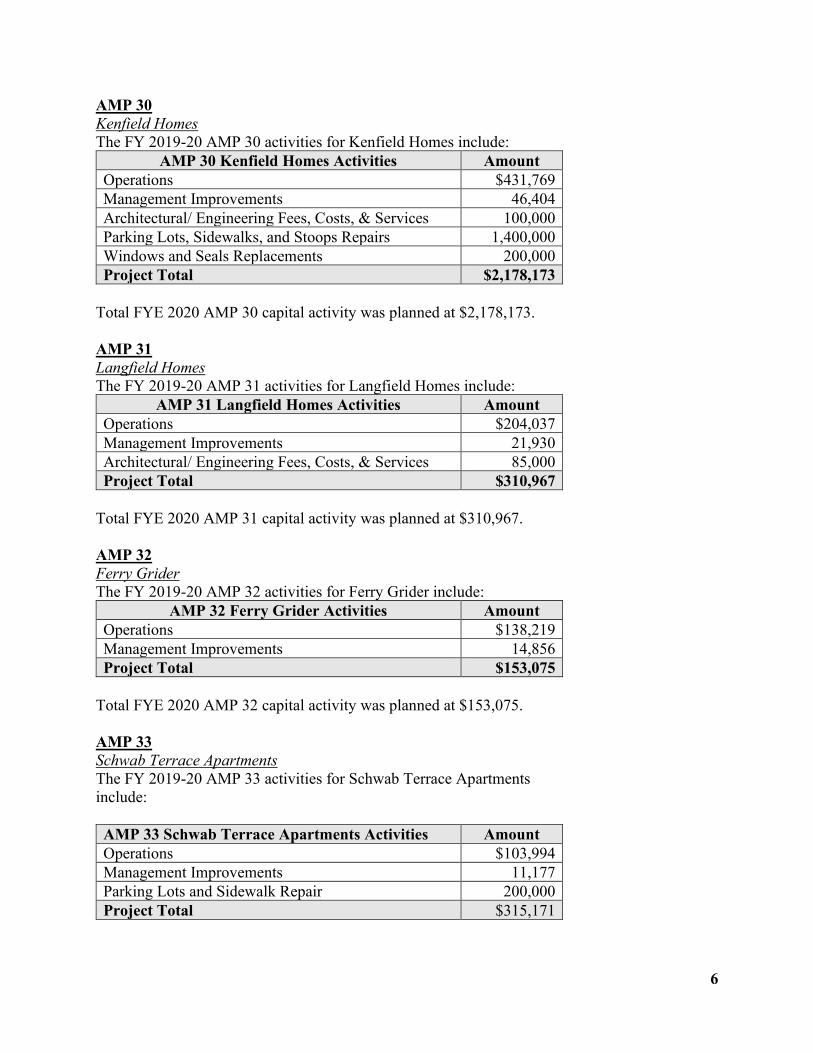
6
AMP 30
Kenfield Homes
The FY 2019-20 AMP 30 activities for Kenfield Homes include:
AMP 30 Kenfield Homes Activities Amount
Operations $431,769
Management Improvements 46,404
Architectural/ Engineering Fees, Costs, & Services 100,000
Parking Lots, Sidewalks, and Stoops Repairs 1,400,000
Windows and Seals Replacements 200,000
Project Total $2,178,173
Total FYE 2020 AMP 30 capital activity was planned at $2,178,173.
AMP 31
Langfield Homes
The FY 2019-20 AMP 31 activities for Langfield Homes include:
AMP 31 Langfield Homes Activities Amount
Operations $204,037
Management Improvements 21,930
Architectural/ Engineering Fees, Costs, & Services 85,000
Project Total $310,967
Total FYE 2020 AMP 31 capital activity was planned at $310,967.
AMP 32
Ferry Grider
The FY 2019-20 AMP 32 activities for Ferry Grider include:
AMP 32 Ferry Grider Activities Amount
Operations $138,219
Management Improvements 14,856
Project Total $153,075
Total FYE 2020 AMP 32 capital activity was planned at $153,075.
AMP 33
Schwab Terrace Apartments
The FY 2019-20 AMP 33 activities for Schwab Terrace Apartments
include:
AMP 33 Schwab Terrace Apartments Activities Amount
Operations $103,994
Management Improvements 11,177
Parking Lots and Sidewalk Repair 200,000
Project Total $315,171
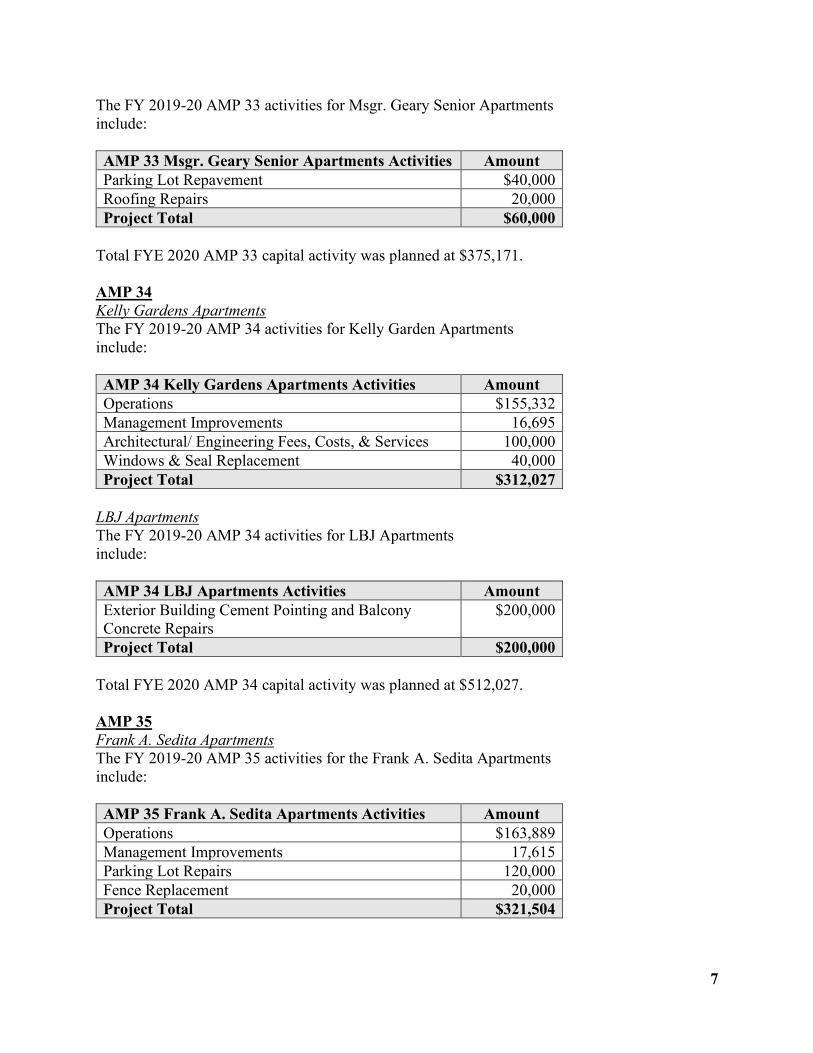
7
The FY 2019-20 AMP 33 activities for Msgr. Geary Senior Apartments
include:
AMP 33 Msgr. Geary Senior Apartments Activities Amount
Parking Lot Repavement $40,000
Roofing Repairs 20,000
Project Total $60,000
Total FYE 2020 AMP 33 capital activity was planned at $375,171.
AMP 34
Kelly Gardens Apartments
The FY 2019-20 AMP 34 activities for Kelly Garden Apartments
include:
AMP 34 Kelly Gardens Apartments Activities Amount
Operations $155,332
Management Improvements 16,695
Architectural/ Engineering Fees, Costs, & Services 100,000
Windows & Seal Replacement 40,000
Project Total $312,027
LBJ Apartments
The FY 2019-20 AMP 34 activities for LBJ Apartments
include:
AMP 34 LBJ Apartments Activities Amount
Exterior Building Cement Pointing and Balcony
Concrete Repairs
$200,000
Project Total $200,000
Total FYE 2020 AMP 34 capital activity was planned at $512,027.
AMP 35
Frank A. Sedita Apartments
The FY 2019-20 AMP 35 activities for the Frank A. Sedita Apartments
include:
AMP 35 Frank A. Sedita Apartments Activities Amount
Operations $163,889
Management Improvements 17,615
Parking Lot Repairs 120,000
Fence Replacement 20,000
Project Total $321,504
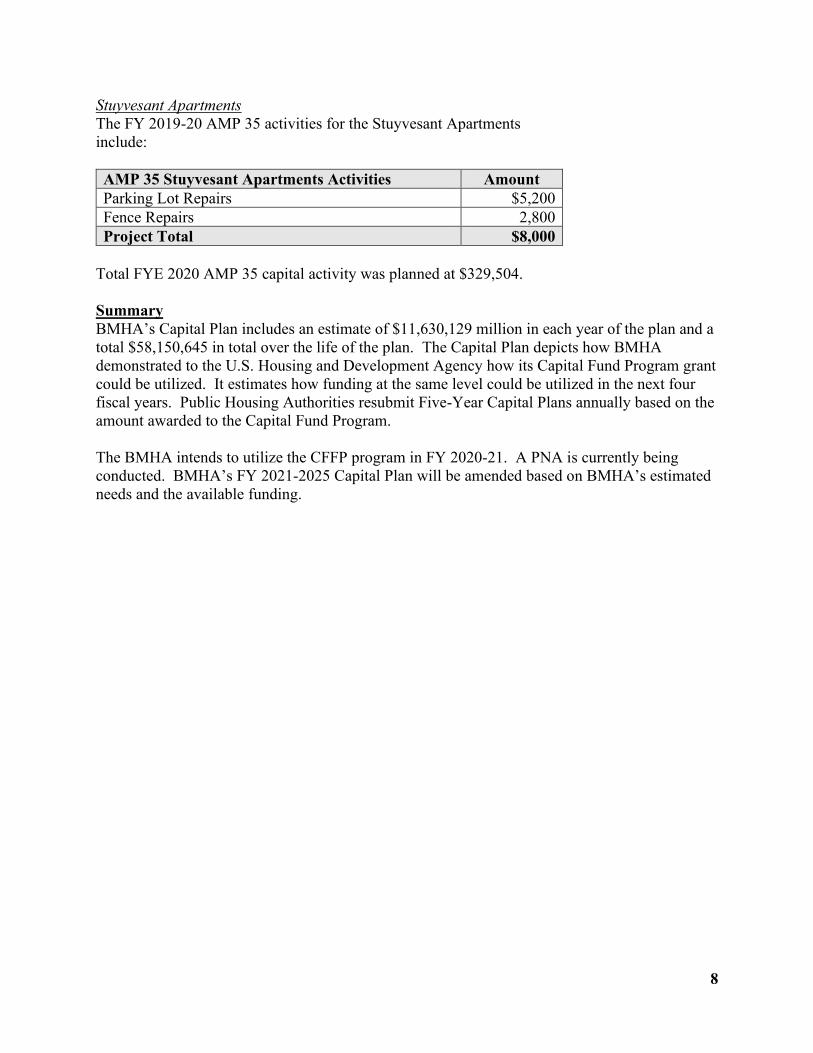
8
Stuyvesant Apartments
The FY 2019-20 AMP 35 activities for the Stuyvesant Apartments
include:
AMP 35 Stuyvesant Apartments Activities Amount
Parking Lot Repairs $5,200
Fence Repairs 2,800
Project Total $8,000
Total FYE 2020 AMP 35 capital activity was planned at $329,504.
Summary
BMHA’s Capital Plan includes an estimate of $11,630,129 million in each year of the plan and a
total $58,150,645 in total over the life of the plan. The Capital Plan depicts how BMHA
demonstrated to the U.S. Housing and Development Agency how its Capital Fund Program grant
could be utilized. It estimates how funding at the same level could be utilized in the next four
fiscal years. Public Housing Authorities resubmit Five-Year Capital Plans annually based on the
amount awarded to the Capital Fund Program.
The BMHA intends to utilize the CFFP program in FY 2020-21. A PNA is currently being
conducted. BMHA’s FY 2021-2025 Capital Plan will be amended based on BMHA’s estimated
needs and the available funding.