Embed Size (px)
Citation preview
MARINE ECOLOGY PROGRESS SERIES Mar Ecol Prog Ser
Published January 18
Distribution, movements and diet of macrocrustaceans on a Scottish sandy beach
with particular reference to predation on juvenile fishes
'Scottish Association for Marine Science and 'Centre for Coastal and Marine Science, Dunstaffnage Marine Laboratory, PO Box 3, Oban, Argyll PA34 4AD, Scotland, UK
ABSTRACT: Shrimp and crabs were sampled by beam trawl over tidal and diel cycles on a sandy beach on the west coast of Scotland in June and August. There were significant positive relationships between depth (0 to 5 m) and numbers of individuals and numbers of species caught. More species and individuals were caught at night than by day, but there was no evidence for the existence of distinct 'day' and 'night' communities. Differences in species composition and numbers caught reflected differ- ences in the mgratory and burying behaviour of individual species. The macrocrustaceans found on this beach are omnivorous predators feeding on a wide range of prey species. Predation by them is one cause of mortality for the populations of juvenile fishes on the beach. Two species, the shrimp Crangon crangon and the shore crab Carcinus maenas, account for most of such predation by macrocrustaceans, which affects both round and flatfish juveniles in varying proportions at different times. In particular, the intensity of predation was generally greatest at night for both species.
KEY WORDS: Crabs - Shrimps. Sandy beach - Die1 movements . Tidal movements - Diet. Fish preda- tion Crangon crangon - Carcjnus maenas
INTRODUCTION
Aspects of the animal communities of intertidal and shallow sublittoral sand communities have been exten- sively studied in many parts of the world. The benthic infauna, the small motile epifauna and the pelagic and demersal fish populations have received much atten- tion (Brown & McLachlan 1991). In contrast, sandy beach macrocrustacean populations have received less attention, and studies have generally concentrated on individual species rather than the complete assem- blage, although several authors have examined the impact of macrocrustacean predators on the infaunal benthos (Hall et al. 1990 and references therein).
Sandy beaches act as important nursery grounds for juvenile fishes, and particularly, in temperate regions,
for juvenile flatfishes (Edwards & Steele 1968, Lock- wood 1974, Gibson et al. 1993 anlong others). Juvenile flatfishes recruit to the beach populations in the spring and early summer, reaching a post-settlement peak of abundance, followed by a decline in numbers. Preda- tion is usually considered to be a major contributing factor to this decline (Beverton & Iles 1992), but until recently there were few studies that established the identity of the main predators.
This paper presents results from a study that was designed to investigate the distribution and diet of potential predators on juvenile fishes among the fish and macrocrustacean populations on a Scottish sandy beach, and to examine changes in their distribution and diet over tidal and diel cycles. The distribution and movements of the fishes, both predator and prey spe- cies, and the role of the larger fishes as predators on juveniles have been described in earlier publications
O Inter-Research 1999 Resale of full article not permitted

116 Mar €c01 Prog Ser 176. 115-130, 1999
(Gibson & Robb 1996, Gibson et al. 1996). Here we pre- sent comparable data for the macrocrustacean popula- tions. Specific objectives of this aspect of the study were to determine (1) whether the species composition and/or relative abundance of members of the macro- crustacean assemblage differ between night and day; (2) how the species are distributed with depth, and how the depth distributions are affected by the state of the tide, the time of day, and the time of year; (3) what is the overall composition of the diets of different spe- cies, and whether juvenile fishes are a significant com- ponent of those diets; and (4) whether feeding intensity changes between day and night, or with depth. This investigation forms part of a wider study of predator- prey interactions in the ecology of sandy beach fish populations (Ansell & Gibson 1990, Gibson et al. 1993, 1996, 1998, Burrows et al. 1994).
MATERIALS AND METHODS
Study area. The study area, Tralee Beach, is situated in Ardmucknish Bay in the Firth of Lorn on the west coast of Scotland (56" 29' N, 5" 25' W) (see Gibson et al. 1993, 1996, Gibson & Robb 1996 for detailed descrip- tions). This beach supports a rich fish community, of which juvenile flatfishes are an important component, and a varied macrocrustacean community (Gibson et al. 1993).
Field methods. The macrocrustaceans for study were collected during a programme of sampling designed to study both fish and macrocrustacean predation on young fishes at times during the night when predation was considered to be most likely (based on literature references to the activity patterns of potential preda- tors), and to compare these samples with others taken during the day. The sampling regime and rationale and the methods used have been described by Gibson et al. (1996) and Gibson & Robb (1996). For this study, sam- ples were collected on 4 dates in June and August 1990, but for logistical reasons ma.crocrustaceans were exam-
ined for only 3 of the 4 groups of samples collected- those of June 14, June 20 and August 6. On the first of these occasions, high water, and on the other 2 occa- sions, low water, occurred during the night. On each occasion, 5 sets of samples were taken at set times rela- tive to sunset and sunrise, namely: 3 h before sunset (SS - 3), 1 h after sunset (SS + l) , midway through the night (MSSSR), at sunrise (SR), and 3 h after sunrise (SR + 3). Seven samples were taken in each set: 5 using a 2 m beam trawl towed for approximately 5 min paral- lel to the shore in depth.s of 0.5, 1, 2 , 3, and 4 m, one us- ing a 3 m beam trawl hauled parallel to shore at 5 m depth, and 1 using a 36 X 1.8 m net beach seine set par- allel to and approximately 50 m from the shore at a depth of 1 to 1.5 m. Only the trawl samples have been used for study of the macrocrustaceans, which, except for the shrimp Crangon crangon, were not well repre- sented in the seine samples.
The 2 m beam trawl used was fitted with 3 tickler chains and had a stretched mesh of 15 mm in the main body of the net and of 3 mm in the cod-end. At 0.5 m, the trawl was hauled by hand by 2 persons. At 1, 2, 3 and 4 m, the trawl was hauled by boat, maintaining depth by frequent use of a plumb line. At 5 m, the trawl was towed by a larger vessel which also served as a floating laboratory for sorting and preservation of specimens. Hauls were approximately standardised by towing for a specified time and at a constant speed as judged from the engine note, by markers on the shore during daylight, or by counting paces. The distance trawled in each case was measured by means of a cyclometer attached to the trawl. Where clogging by weed or other mechanical failure prevented measure- ment, the distance trawled was taken as the mean of the distances measured in other similar hauls. An entire series of trawls from 5 m to 0.5 m usually took approximately 1 h to complete, but time constraints in the face of changing light and tide conditions did not allow replicate hauls to be taken. The actual dates and times of sampling are given in Table 1, together with the state of the tide.
Table 1. Details of sampling dates (1990) and times (British Summer Time) during the investigation. Also shown are the predicted times of high water (HW), and low water (LW): high water height (in m above Chart Datum); and in parentheses, as decimal
hours, the sampling times before (-) or after (+) high water
Date Sample times (h) SS - 3 SS + 1 MSSSR SR SR + 3
Time of HW (h1
Time of He~ght LW (h) of HW (m)
14 to 15 Jun
20 to 21 Jun
6 to 7 Aug

Ansell et al . : Crustacean . predation on juvenile fishes 117
To prevent regurgitation of the gut contents during preservation, the macrocrustaceans were killed by im- mersion in boiling water before being preserved in 8 % formalin. All crabs were preserved, but only shrimps of 30 mm or more in total length were examined since below that size shrimps are unlikely to capture newly settled flatfish (van der Veer & Bergman 1987).
Laboratory methods. The macrocrustaceans col- lected in each haul were counted and measured. The foregut (gastric mill) was removed from each and full- ness (SF) estimated on a subjective scale of 0 to 5, where 0 = empty, 1 = remnants only, 2 = -25 % full, 3 = -50% full, 4 = -750;) full and 5 = -1000/0 full. Prey items were separated under a binocular microscope and identified to the lowest taxonon~ic category possi- ble.
To estimate the percentage of the volume of the total contents ( % V ) accounted for by each individual item, the smallest item was allocated a value of 1, and the volume of all other items related to it, the total being summed and the individual items then expressed as a percentage of the summed total. The volumetric importance of each food type in the diet was then assessed by means of a volume index for each individ- ual calculated by multiplying the foregut fullness (SF) by the percentage volume of each category ( % V ) . Val- ues for this index can range from 0 representing an empty foregut to 500 for a full foregut (SF = 5) contain- ing only 1 category of food ( % V = 100).
Data analysis. Abundance of the macrocrustaceans caught was measured as the number per 100 m2 trawled. This measure does not represent true abun- dance because the efficiency of the trawl is unknown. For juvenile plaice Pleuronectes platessa, efficiency has been estimated as of the order of 30 to 40 % or less (Kuipers 1975, Rogers & Lockwood 1989, Wennhage et al. 1997), and similar values apply to Crangon crangon (Wennhage et al. 1997).
Two questions were asked about the macrocrus- tacean population and variations in its distribution. First, does the structure of the macrocrustacean com- munity, as defined by the overall numbers of individ- uals and species, change spatially and temporally? Second, how do the abundance and distribution of individual species change spatially and ten~porally?
To answer these questions, 2 approaches were used. First, the similarity between the species composition of the combined catches on each sample date was assessed by calculating percent similarity (Krebs 1989). Percent similarity is given by:
P = X minimum (plr,fii)
where p,, = percentage of species i in sample 1 and p2, = percentage of species i in sample 2. Second, analysis of variance (GLM procedure, SAS Institute Inc. 1990)
was used to test the significance of changes in the total number of species, the total number of individuals, and the numbers of individuals of the most abundant spe- cies. Two alternative designs were used in the same way as was employed for fishes from the same study (Gibson et al. 1996). In the first, variance due to the 3 crossed factors of depth, time of day, and sampling date and their 2-way interactions was tested over the residual variation (Model 1 in Table 4). The 3-way interaction was included as part of the error term. In the second, the state of the tide at the time of sampling was included as the time relative to the closest high water, from low water 6 h before high water to low water 6 h after high water. Cosines, and sines, of the angular equivalent of the state of the cycle (2n X [time relative to predicted time of high water/12.43 h]) were included as covariants in the analysis (Model 2 in Table 4). The cosines reflect changes from low water to high water, while sines reflect differences between ebb and flood tide. Regression equations resulting from this analysis were used to predict values for each state of the tide. The loglo of total numbers of species, and numbers of individuals, were used in the analyses of variance. Abundances of individual species were transformed using loglo(l + n) before analysis.
For most analysis of the data on diet, the main items found in the foreguts, including sand, were grouped into 26 major categories (e.g. Crustacea, which in- cludes all materials identifiably as from a crustacean source, including chitin) (see Table 5). The diets of those macrocrustacean species that were collected in sufficient numbers were compared by means of the percentage frequency of occurrence for each food cat- egory, and of a mean volumetric index. The percent- age occurrence was calculated as a percentage of the total number of foreguts examined that contained food. The mean volumetric index was calculated as the per- centage contribution of each constituent to the sum of individual volume indices. Correlation between these 2 methods was examined using Spearman rank corre- lation coefficients. Levins' measure of niche breadth (Krebs 1989) was calculated for each species together with estimates of percentage overlap in the diet between pairs of species (Krebs 1989), using the vol- ume index data.
Three questions were asked concerning possible variations in feeding intensity. First, does the propor- tion of feeding individuals in the population change spatially and temporally? Second, does the intensity of feeding change? Third, does the proportion of individ- uals feeding on juvenile fishes change? Questions 1 and 3 were addressed by examining respectively the proportion of the population that had empty foreguts and the proportion with fish remains in the foregut at different depths and at different sampling times. An

118 Mar Ecol Prog Ser 176: 115-130, 1999
Table 2. Species composition of the total catches as percentages of mean numbers per 100 m2 Species nomenclature follotv~ Hayward & Ryland (1990)
Fam~ly Species 14 Jun 20 Jun 6 Aug No. per 100 m- No per 100 mZ % No, per 100 m2 YO
Crangonidae Crangon crangon 656.46 87.46 330.20 78.36 117.08 68.39 Paguridae Pagurus bernhardus 5.36 0.71 9.30 2.21 3.27 1.91 Majidae Hyas araneus 0.25 0.03 0.17 0.04 0.00 0.00
Macropodia rostrata 0.00 0.00 0.00 0.00 0.18 0.10 Corystidae Corystes cassivela un us 0 59 0.08 1.25 0.30 0.00 0.00 Cancridae Cancerpagurus 0.17 0.02 0.00 0.00 0.00 0.00 Portunidae Liocarcinus depurator 7.97 1.06 5.91 1.40 4.25 2.48
Liocarcinus holsatus 19.61 2.61 18.88 4.48 12.09 7.06 - - Carcinus rnaenas 60.07 8.00 .1~.6? 13.21 34.34 20.06
approach was used which was similar to that employed to test the significance of changes in the numbers of individuals and species but using the maximum-likeli- hood method of the CATMOD procedure (SAS Insti- tute Inc. 1990). CATMOD computes test statistics, known as Wald statistics, for the specified statistical model, which are approximately distributed as chi- square when the null hypothesis is true. Interactions between Depth, Time of Day (TOD) and sampling Date could not be tested, however, because of the presence of zero values. Question 2 was examined using an analysis of the distribution of fullness scores for each sample period (Kruskal-Wallis test). All statistical tests were done using the SAS statistical package (SAS Institute Inc. 1990).
RESULTS
Species composition of the catches
Only 9 species of macrocrustaceans were caught during the study (Table 2). The catches were domi- nated by only 2 species, shrimp Crangon crangon and shore crabs Carcinus rnaenas, but 3 other species, the swimming crabs Liocarcinus holsatus and L. depurator and the hermit crab Pagurus bernhardus, occurred relatively frequently. These 5 species together aiways made up > 90 % of the catch. The species composition
Table 3. Percentage similarities between dates in the specles composition of catches. Values above the diagonal are for crustaceans; those below the diagonal are for fishes in the
same catches from Gibson et al. (1996)
14 Jun 20 Jun 6 Aug
14 Jun 20 Jun 6 Aug
of the catches made at different times of day on each date showed relatively little variation, but in general, similarity was greatest between adjacent tunes. None of the species was caught exclusively during the day or at night. The species composition of the combined catches was very similar among dates (Table 3) with the 2 June samples more closely similar to each other than to the August sample.
Depth, diel, tidal and seasonal influences on catch composition
Total number of species and individuals
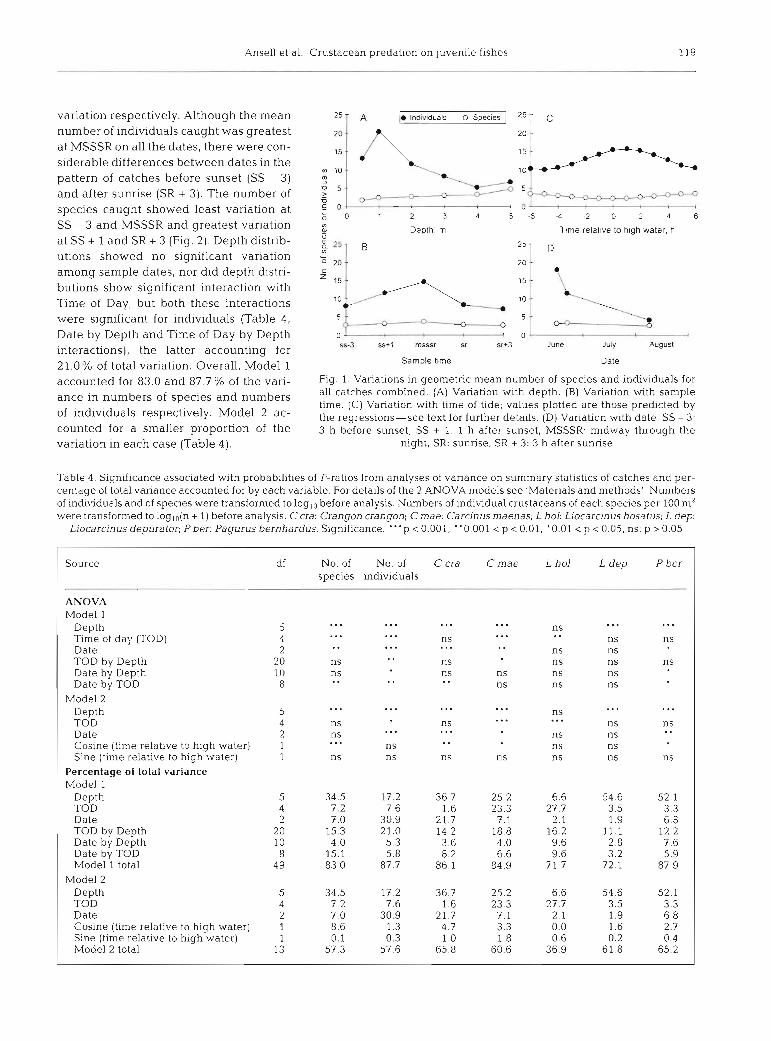
The average number of species caught in the trawls increased from approximately 2 in 0.5 m of water to around 5 in 5 m. The total number of individuals was higher at 1 m depth than at 0.5 m, but then declined markedly to minimum values at 4 and 5 m depths (Fig. 1A). Catches at night contained more Individuals of more species than those taken in daytime, with max- imum numbers of individuals and species caught at MSSSR (Fig. 1B). The mean number of individuals caught showed no significant effect of the state of the tide, but the tidal effect on the number of species caught was significant (Fig. 1C) with higher numbers of species being caught at low water than at high water (Table 4, significant Depth, Time of Day and Cosine effects). For numbers of species, depth of capture accounted for the largest percentage (34.5%) of the total vanation. For individuals, the greatest percentage (30.9%) of the variation was accounted for by date of capture (Table 4). The numbers of individuals in the trawls declined between June and August, but the number of species caught was not affected signifi- cantly (Fig. ID, Table 4 , significant Date effect).
Both the numbers of indviduals and the number of species showed significant Date by Time of Day inter- actions, accounting for 5.8% and 15.1% of the total
Ansell et al.: Crustacean predation on juvenile fishes 119
. -
variation respectively. Although the mean number of individuals caught was greatest at MSSSR on all the dates, there were con- siderable differences between dates in the pattern of catches before sunset (SS - 3) and after sunrise (SR + 3). The number of species caught showed least variation at SS - 3 and MSSSR and greatest variation at SS + 1 and SR + 3 (Fig. 2). Depth distrib- utions showed no significant variation among sample dates, nor did depth distri- butions show significant interaction with Time of Day, but both these interactions were significant for individuals (Table 4, Date by Depth and Time of Day by Depth interactions), the latter accounting for 21.0% of total variation. Overall, Model 1 accounted for 83.0 and 87.7 % of the vari- ance in numbers of species and numbers of individuals respectively. Model 2 ac- counted for a smaller proportion of the variation in each case (Table 4 ) .
Y) Depth, m T ~ m e relat~ve to hlgh water, h
; = l B 2 5 ~ D
0 3 4 0 1 ss-3 ss+1 rnsssr sr sr+3 June July August
Sample t~me Date
Fig. 1. Variations in geometric mean number of species and individuals for all catches combined. (A) Variation with depth. (B) Variation with sample time. (C) Variation with time of tide; values plotted are those prehcted by the regressions-see text for further details. (D) Variation with date. SS - 3: 3 h before sunset, SS + 1 1 h after sunset, MSSSR: midway through the
night, SR: sunrise, SR + 3: 3 h after sunrise
Table 4. Significance associated with probabilities of F-ratios from analyses of variance on summary statistics of catches and per- centage of total variance accounted for by each variable. For details of the 2 ANOVA models see 'Materials and methods' Numbers of individuals and of species were transformed to log,,, before analysis. Numbers of individual crustaceans of each species per 100 m2 were transformed to loglo(n + 1) before analysis. C cra: Crangon crangon; Cmae: Carcinus maenas; L hol: Liocarcinus hosatus; L dep:
Liocarcinus depurator; P ber: Pagurus bernhardus. Significance: "'p < 0.001, "0.001 < p < 0.01, '0.01 < p < 0.05, ns: p > 0.05
Source df No. of No. of species individuals
C cra C mae L dep P ber
- ANOVA Model 1
Depth Time of day (TOD) Date TOD by Depth Date by Depth Date by TOD
Model 2 Depth TOD Date Cosine (time relative to high water) Sine (time relative to high water)
Percentage of total variance Model 1
Depth TOD Date TOD bv D e ~ t h Date by ~ e p t h Date by TOD Model 1 total
Model 2 Depth TOD Date Cosine (time relative to high water) Sine (time relative to high water) Model 2 total

120 Mar Ecol Prog Ser 176. 115-130, 1999
A shallow water, its numbers declining progressively at depths greater than l m. C. rnaenas showed an oppo- site trend, its numbers increasing progressively with depth. L. depurator and Pagurus bernhardus were
0 2.. z caught almost exclusively only in the 5 m depth trawls. 1 -. L. holsatus was most abundant at intermediate depths o i a but its distribution was more even with depth than the
other species, and differences were not significant ? 40 (Fig. 3A, Table 4 ) . ::D\; Carcinus maenas and Liocarcinus holsatus both
showed significant effects of Time of Day, accounting
o for 23.3 and 27.7 % respectively of total variation .-
7 10 (Table 4) . Both were more abundant in catches at night
o than by day (Fig. 3B). Crangon crangon, L. depurator = 0
ss-3 ss+l rnsssr sr and Pagurus bernhardus showed no significant change
sr+3 in numbers with time. C. crangon, C. maenas and P.
Sample time bernhardus showed significant changes in distribution
14 Jun 0 20 Jun 6Aug with the state of the tide (Fig. 3C, Table 4, effect of Fig. 2. Die1 variation in geometric mean numbers of (A) spe- Cosine), although this factor accounted for only a rela- cies and (B) ~ndividuals for all catches combined. Abbrevia- tively small percentage of total variation ( ~ ~ b l ~ 4). C.
tions as in Fig. 1 crangon was more abundant at high water while the latter 2 species were less abundant at high water than
Abundance of dominant species at low water There was a significant decline in C. crangon and C. maenas abundances between June
The pattern of change in the overall catches is the and August (Fig. 3D). resultant of the changing distributions of the dominant Not all these trends were consistent among sampling species. All of the species considered except Lio- occasions, as indicated by the significant interactions carcinus holsatus, showed significant changes in abun- between the main variables (Table 4). For Crangon dance with depth, accounting for between 25.2 (Car- crangon and Pagurus bernhardus the decline in num- cinus maenas) and 54.6% (L, depurator) of total bers from June to August was not consistent at all sam- variation. Crangon crangon was most abundant in pling times, leading to significant Date by Time of Day
interaction (Fig. 4A, B). Carcinus maenas and P. bernhardus showed
12 significant Time of Day by Depth, 10 and Date by Depth interactions re- 8 spectively (Fig. 4C, D, Table 4). For 6 individual species, Model 1 ac-
counted for between 71.7 (Liocarci- 5 nus holsatus) and 87.9% (P. bern-
0 u i o 1 2 3 4 5 - a -4 -2 o 2 4 6 hardus) of total variation, and Model J ?j Depth m Time relat~ve to high water, h 2 between 36.9 and 65.8% (Table 4).
P
ss-3 ss+l msssr sr sr+3 June July August
Sample time Date
I .C cra OC mae .L dep U L hol OP ber)
Fig. 3. Variations in geometric mean numbers of common crustacean species in catches. (A) Variation with depth. (B) Variation wi.th sample time. (C) Variation ~41th time of tide, val.ues plotted are those predicted by the regress~ons-see text for fur- ther details. (D) Variation with date. Note different scale for Crangon crdngon num-
bers. Abbreviations as In Fig. 1 and Table 4
Overall diet analysis
The overall diets of the 5 most abundant species of macrocrusta- ceans, based on analysis of all the in- dividuals examined, are summarised in Table 5 (as percentage occur- rence) and Table 6 (based on volume index). Spearman rank correlation coefficients show that the percent- age frequency of occurrence of each category of food item and the volume

Ansell et al : Crustacean predation on luven~le fishes 121
index of that item in the foreguts were A C crangon
strongly related foi Crangon crangon, Caranus maenas and Pagurus bern- hardus but not for the Liocarcjnus spe- ; 40
cies (Table 6) o 0 20 7
Levins' standardized measure of -- niche breadth ranged from 0 09 for 2 O
1
-
Pagurus bernhardus to 0 31 for Cran- gon crangon when sand was included as a diet item, and from 0 06 to 0 4 1 when sand was excluded (Table 6) Val-
0 2 - ues for the percentage overlap in diet between pairs of species ranged from /
22 5 (P bernhardus and Liocaranus o + o ss 3 ss+l rnsssr sr sr+3 0 1 2 3 4 5
depurator) to 67 4 (L holsatus and L Sample t ~ m e Depth m
depurator) (Table 7) The diets of the 3 species of portunid crabs generally .ss3 n s r
O ss+? sr+3 showed the highest degree of overlap, that of C cranqon showed a shqhtly lowel other of P. crabs
- .
- degree of overlap with all the Fig. 4 Variation in geometric mean numbers of common crustacean species in
species examined; while the catches Seasonal variation in pattern of die1 occurrence for (A) Crangon cran- gon and (B) Pagurus bernhardus. (C) Die1 variation in pattern of depth occur-
bernhardus and of the portunid ~rence for Cdrc,nus nlaenas. (D) Seasonal vanation in pattern of depth occur- showed least overlap. The diet of rence for P bernhardus. Abbreviations as in Fig. 1
P. bernhardus, though, had the greatest proportion of unidentified miscella- neous material. These relationships were similar whether or not sand was included as a component of the diet (Table 7) .
All the species examined showed a broad spectrum of diet items. Crustaceans were among the most impor- tant components for both shrimps and crabs, but often represented predon~inantly of chitin only. Identifiable remains included Crangon crangon, juveniles of the crab Corystes cassivelaunus, the amphipods Bathy- poreia sp, and Pontocrates sp., and the isopod Eurydice sp. Smaller species of crustaceans, such as copepods, ostracods, and the cyprid larvae of barnacles, were found consistently in shrimp and crab foreguts. In crabs these were probably taken in with larger food items; one Carcinus maenas foregut, for example, con- tained a complete juvenile Myxocephalus scorpius which had copepods, osti-acods and an amphipod in its stomach, and most occurrences of such small crus- taceans were in crustacean foreguts that also con- tained fish remains. C. crangon are probably able to prey directly on such small aninlals and here there was no relationship with the presence of fish remains.
Polychaetes and filamentous algae were the next most important food categories for Crangon crangon, the former including the terebellid Lanice conchilega and the arenicolid Arenicola marina, both of which are important members of the shallow water infauna (Gre- gory 1988). During the June 14 sampling it was ob- served that heteronereis stages of nereid polychaetes (probably Nereis longisslma) were swarmlng in the
bay and these were found in a number of shrimp foreguts taken at that time. Remains of nephtyd, spi- onid and polynoid (harmothoid) polychaetes also appeared consistently in the foreguts of shrimps. Poly- chaetes were relatively less important in the diet of the portunid crabs, but included the same taxa. No poly- chaete material was found in the foreguts of Pagurus bernhardus.
Molluscs were generally less important components of the diets. In shrimps, identifiable remains included the bivalves Cardiunl sp. and Tellina sp. and the gas- tropod Retusa obtusa, all <5 mm in length. In crabs, the molluscs identified were predon~inantly bivalves, with Tellina sp. being the most abundant.
Filamentous and thallic algae, in varying proportions and abundance, were found in both shrimps and crabs. Individual Carcinus maenas had sometimes taken large amounts of thallic algae, particularly Lamjnaria sp., and this accounted for the greater importance of this item in the diet when compared with Crangon crangon. Sand was also found in many of the foreguts examined and contributed significantly to the total vol- ume, especially in C. crangon.
Only Crangon crangon and Carcinus maenas were sufficiently numerous to allow temporal and spatial changes in diet composition and feeding intensity to be investigated in detail. There was no evidence of any consistent trend or change in the major constituents of the diet of either species with time or depth of sam- pling. The contribution of the different major con-

122 Mar Ecol Prog Ser 176: 115-130, 1999
stituents was also similar on all 3 sampling dates, al- though there were minor differences in the importance of individual components. Of the individual prey items identified, Eurydice sp. (probably E. pulchra) were
Table 5. Diets of the common species of crustacean in catches Table 6. Diets of the common species of crustaceans in as percentage frequency of occurrence in the foreguts of each catches as % volume based on the volume index-see text for species. The total number of foreguts examined and the nurn- further details. Values of Levins' standardized index of diet ber of foreguts w t h food are also given Species abbreviations breadth based on the volume percentages (a) with sand
Table 7. Values of percentage overlap between the diets of the common crustaceans in catches. Values where sand is included as a diet item are given above the diagonal and those where sand is excluded below it. Species abbreviations as i.n Table 4
as in Table 4
C cra Cmae L h01 L dep P ber
No. examined 2279 582 212 71 72 No. with food 1245 498 169 48 67 Polychaeta
Polynoidae 2.01 0.00 2.37 0.00 0.00 Phyllodocidae 2.97 0.20 0.00 0.00 0.00 Syllidae 1.45 0.20 0 59 2.08 0.00 Nereldae 12.29 9.04 7.69 16.67 0.00 Nephtydae 0.80 1.41 0.00 4.17 0.00 Spion~dae 1.37 0.40 0.59 0.00 0.00 Arenicolidae 0.24 0.20 0.59 0.00 0.00 Terebellidae 2.89 3.01 5.33 6.25 0.00 Ident. Polychaeta 0.24 0.40 0.59 2.08 0.00 Unident. Polychaeta 2.17 1.41 4.73 0.00 0.00
Insecta 1.53 0.20 0.59 0.00 0.00 Crustacea
Isopoda 6.75 0.20 0.00 0.00 0.00 Amphipoda 12.77 2 61 4.73 2.08 1.49 Mysidacea 1.29 0.60 0.00 0.00 0.00 Decapoda 4.66 12 05 12.43 14.58 1.49 Ident. Crustacea 6.75 6.83 5.92 2.08 2.99 Unident. Crustacea 30.04 24.30 43.20 35.42 32.84
Mollusca Gastropoda 1.29 0.00 0.00 0.00 0.00 Bivalvia 4.66 30.72 3.55 20.83 8.96 Ident. Mollusca 0.24 6.43 1.18 10.42 0.00
Echinodermata 0.00 0.00 0.59 2.08 0.00 Teleostei 6.02 54.82 27.81 8.33 4.48 Algae (filamentous) 33.09 16.47 17.16 8.33 31.34 Algae (thallic) 4.98 9.84 2.96 2.08 7.46
Sand 72.53 45 38 54.44 31.25 83.58 Miscellaneous 15.18 14.46 24.85 14.58 79.10
Totals Polychaeta 26.43 16.27 22.49 31.25 0.00 Crustacea 62.25 46.59 66.27 54.17 38.81 Mollusca 6.18 37.15 4.73 31.25 8.96
C cra Cmae L hol L dep P ber
included and (b) without sand and Spearman rank correlation coefficients between percentage occurrence and % volume
are also given. Species abbreviations as in Tab1.e 4
C cra - 53.5 48.1 43.7 53.6 C mae 51.1 - 48.0 54.2 29.1 L h01 58.8 52.8 - 67.4 28.2 L dep 52.7 58.3 67.5 - 22.5 P ber 40.3 22.1 37.1 25.0 -
Ccra Cmae L h01 Ldep Pber
No. examined 2279 582 212 71 72 No. with food 1245 498 169 48 67 Polychaeta
Polynoidae 0.69 0.00 1.07 0.00 0.00 Phyllodocidae 1.33 0.03 0.00 0.00 0.00 Syllidae 0 33 0.00 01.1 0.64 0.00 Nereidae 9.60 8.89 10.64 24.25 0.00 Nephtydae 0.36 0.93 0.00 2.47 0.00 Spionidae 0.97 0.23 0.05 0.00 0.00 Arenicolidae 0.24 0.24 0.77 0.00 0.00 Terebellidae 1.26 2.49 3.94 6.82 0.00 Ident. Polychaeta 0.12 0.12 0.39 0.86 0.00 Unident. Polychaeta 1.13 0.72 0.65 0.00 0.00
Insecta 0.52 0.00 0.92 0.00 0.00 Crustacea
Isopoda 5 60 0.14 0.00 0.00 0 00 Amphipoda 7.89 0.99 2.77 4.29 0 03 Mysidacea 1.68 0.67 0.00 0.00 0 0 0 Decapoda 3.51 9.46 13.46 12.04 0.07 Ident. Crustacea 1.29 0.80 0.28 1.42 0.36 Unident. Crustacea 12.40 7.40 21.50 14.88 14.29
Mollusca Gastropoda 0.31 0.00 0.00 0.00 0.00 Bivalvia 1.80 16.47 2.18 10.55 1.51 Ident. Mollusca 0.04 2.71 0.24 1.40 0.00
Echinoderrnata 0.00 0.00 11.14 6.45 0 00 Teleostei 5.88 24.65 4.72 1.73 0 1.7 Algae (filamentous) 9.26 3.35 1.79 1.07 6 20 Algae (thallic) 2.00 4.53 14.39 7.24 1.13 Sand 26.33 11.20 0.09 0.54 41.66 Miscellaneous 5.48 3 96 8.92 3.36 34.58 Levin's index a 0.31 0.29 0.31 0.30 0.09
b 0.41 0.25 0.31 0.30 0.06 Spearman 0.934 0.958 0.378 0.321 0.985
fou.nd, only in the foreguts of C. crangon caught in the shallowest water (0.5 to 1 m) and not at all in the forey uts of C. maends. Juvenile Corystes cassjvelaunus were found mainly in foreguts of C. crangon and C. maenas from deeper samples but also occurred in the foreguts of some C. crangon taken at shallower depths.
Predation on fishes
Occurrence and relative importance of fishes as prey
Fish remains, including otoliths, scales and skeletal remains, were identified in the stomachs of all of the 5 species examined (Tables 5 & 6). The overall percent-

Ansell et al.: Crustacean predation on juvenile fishes 123
bernhardus.
Identity of fishes eaten
age frequency of occurrence ranged 8 0 - A C crangon C crangon
i D C maenas
from 4 .5% in Pagurus bernhardus to €Q -.
54.8 % in Carcinus maenas. Fish remains
Identifiable fish remains included sand 20LlllL- - eels Ammodytes sp., Gobiidae, pogge Agonus cataphractus, bull-rout Myoxo- o I
June July August June July August cephalus scorpius and Pleuronectidae.
/
The relative frequency of round fish and [aflafflsh rerna~ns . roundflsh remans o unidentified remains I flatfish remains in the foreguts varied between sampling dates and between Fig. 5. Variation in the relative frequency of round fish and flatfish remains in
the foreguts of (A, C) Crangon crangon and (B. D) Carcinusmaenas. (A. B) Per- 'pecies. In both and centage of flatfish remains among all determinable fish remains. (C. D) per- Carcinus mamas the relative Percent- centage of foreguts with round fish, flatfish and unidentifiable fish remains age frequency of mid-guts with flatfish remains, compared with those with round fish remains, fell between June and August showed a consistent temporal trend in the proportion (Fig. 5A, B). In C. crangon this fall in relative propor- with fish in the foregut although with slightly different
accounted for 24.6% of the overall vol- 1 c G / , /
ume of the diet in C. maenas and 5.9 % in 20 -~
Crangon crangon, with smaller propor- - /-" - tions in Liocarcinus depurator and P. 2
tions resulted from an increase in the percentage fre- timing (Fig. 6D); here the proportion was greatest at quency of foreguts with round fish remains, while the MSSSR or at sunrise (SR). The proportion with fish percentage frequency of foreguts with flatfish remains remains increased in August. Both C. crangon and C. stayed constant (Fig. 5C). In C. maenas the fall in rela- rnaenas also showed significant tidal effects (Table 8, tive proportions reflected mainly a decrease in the per- significant Cosine effect); in the former the proportion centage frequency of foreguts with flatfish remains, al- containing fish remains tended to increase at high though the percentage frequency of foreguts with water, whilst the latter showed the opposite trend, with round fish remains also fell slightly (Fig. 5D). In C. the proportion lowest at high water. Generally, in C. crangon the percentage frequency of foreguts with crangon, the proportion with fish remains at all depths unidentifiable fish remains rose between June and Au- was variable and low (0 to 10 %), while in C. maenas it gust (Fig 5C), while in C. maenas the percentage fre- was consistently high (40 to 66.7%). Overall, 54.8% of quency with unidentifiable fish remains fell (Fig. 5D) . C, maenas but only 6.02 % of C. crangon contained fish In Liocaranus holsatus, among foreguts with recogniz- remains (Table 5). able fish remains, there were more with flatfish than ~- ~
with round fish overall, but the numbers were insuffi- Table 8. Significances associated with probabilities of Wald statistics computed in the CATMOD procedure (see 'Materials
cient if there was any change between June and methods') for numbers of foreguts with and without fish and August. remains among all those examined in the common species of
crustaceans in catches. For Liocarcinus depuratorand Pagurus bernhardus the data were ~nsufficient to allow a complete analysls Species abbreviations as in Table 4 . Significance:
Temporal and spatial changes in the proportion of "'p < 0.001, "0.001 < p < 0.01, '0.01 < p c 0.05, ns: p > 0.05 macrocrustaceans with fishes in their diet
The proportion of Crangon crangon that contained fish remains showed significant differences among depths of capture and times of day (Table 8). There was no consistent trend in the differences among depths (Fig. 6A), but the proportion changed consis- tently with time of sampling with the lowest proportion being found before sunset (SS - 3) and the highest after sunrise (SR + 3) (Fig. 6B). Carcinus maenas also
Source df C cra Cmae L h01 L dep P ber
Depth 5 ns ns TOD 4 m ns Date 2 ns ns ns Cosine (Time relative 1 m ns ns ns
to high water) Sine (Time relative 1 ns ns ns ns ns
to high water)

124 Mar Ecol Prog Ser 176: 115-130, 1999
C. crangon
c V1 - 89 B C. mamas
-
C crangon
C. maenas
55-3 ss+l msssr sr sr+3
Depth, m Time of day
14 Jun 0 20 Jun A 6 Aug
Fig. 6. Variation in the proportion of foreguts containing fish remains for (A, C) Crangon crangon and (B, D) Carcinus maenas. Seasonal variation in the pattern of occurrences of fish remains by (A, B) depth and (C, D) time of day.
Abbreviations as in Fig. 1
Temporal and spatial variation in feeding intensity
Proportion of empty foreguts
The proportion of Crangon crangon with empty foreguts showed significant differences among depths of capture (Table 9) but there was no consistent trend in the differences (Fig. 7A). The proportion changed both significantly (Table 9) and consistently with Time of Day; the proportion with empty foreguts was greatest in samples taken at SS+ 1 and declined to a minimum at SR (Fig. 7C). The proportion with empty foreguts de- clined significantly in August. In Carcinus maenas sig- nificant differences among Times of Day showed a sim-
Table 9. Significance associated with probabilities of CVald statistics computed in the CATMOD procedure (see 'Materi- als and methods') comparing numbers of empty foreguts and numbers of foreguts with food among all those examined in the common species of crustaceans in catches. For Liocarci- nus depurator and Pagurus bernhardus the ddtd were insuffi- cient to allow a complete analysis. Species abbreviations as in Tab1.e 4. Significance. "'p < 0.001, "0.001 < p < 0.01,
'0.01 < p i 0.05, ns: p > 0.05
Source df Ccra Cmae L h01 L dep Pber
Depth 5 "' ns TOD 4 "' "' ns ns Date 2 "' ns " ns Cosine (Time relative 1 ns ns ns ns
to high water) Sine (Time relative 1 ns ns ns ns ns
to high water)
ilar trend to C, crangon, but with a slight difference in timing; the proportion with empty foreguts was greatest at SS - 3 and lowest at MSSSR (Fig. ?D). Throughout, the proportion with empty foreguts was consistently greater in C. crangon than in C. rnaenas. In Liocarcznus holsatus, the proportion with empty forguts was great- est at 0.5 and 5 m depths, i.e. at the ex- tremes of the depth distribution, was lower around the time of high water com- pared with low water, and increased in August (Table 9, significant Depth, Date and Cosine effects).
Stomach fullness
Both Crangon crangon and Carcinus maenas generally had significantly fuller foreguts during the hours of darkness (Figs. 8 & 9, Kruskal-Wallis test, p = 0.01 and 0.0004 respectively). Differences
in the distribution of stomach fullness scores in the other 3 species examined were not significant (Kruskal-Wallis test, p = 0.48, 0.57 and 0.12 for Liocarcinus holsatus, L. depurator and Pagurus bernhardus respectively).
DISCUSSION
Species composition
Only 9 species of macrocrustaceans were caught during the study. This compares with a total of 33 spe- cies of fishes caught during the same study (Gibson & Robb 1996, Gibson et al. 1996). In a more extensive 4 yr study in the same area, 15 species of macrocrustaceans were caught, but several of these were of only rare occurrence or occurred in only 1 of the 4 years studied (Gibson et al. 1993). As a consequence of the low num- bers of species overall, the temporal and spatial changes seen in species composition were small com- pared with those of the fishes (Gibson et al. 1996), but were nonetheless significant. Changes in percentage similarity between dates in the species composition of catches were similar for both macrocrustaceans and fishes, but were more marked in the latter (Table 3).
Depth distribution and temporal changes in depth distribution and abundance
There was a clear positive relationship between depth and species richness, while the number of indi-

Ansell et al.: Crustacean predation on juvenile fishes
viduals caught showed a negative rela- C. crangon
tionship with depth. The dominance in numbers of Crangon crangon, and their decreasing abundance with depth be- low 1 m, is mainly responsible for the de- crease in total numbers found at greater depths. These relationships are similar
g to those found for the fish community 5 C rnaenas C rnaenas from the same samples (Gibson et al. S
:, : , , ,
1996) which also show an increase in species richness with depth, and a de- crease in numbers of individuals, mainly reflecting the dominance of 1 species
10 (0-group plaice Pleuronectes platessa) in shallow depths. At 5 m depth, fish num- 0
0 1 2 3 4 5 ss-3 ss+l msssr sr sr+3
bers again increased, mainly because of Depth, m Time of day
the predominance of gadoids. There was no comparable increase in macrocrus- 14 Jun 0 20 Jun A 6Aug
tacean numbers Fig. 7. Variation in the proportion of empty foreguts for (A, C) Crangon cran- species such as Pagurus bernhardus gon and ( B , D ) Carcinus maenas. Seasonal variation in the pattern of occur- are characterlstlcally present mainly at rence of empty foreguts by (A, B) depth and (C, D) time of day. Abbreviations
this depth, they do not appear in large as in Fig. 1
numbers. Gibson et al. (1996), for the fish populations present ferent time-scales, i.e. tidal movements, die1 move-
in the area, distinguish 4 basic patterns of movement ments, longer term movements, and no movement. of individual species into and out of shallow water Similar patterns affect the macrocrustacean popula- that affect the overall patterns of distribution on dif- t ion~ .
C, crangon C maenas
14 Jun 20 Jun 6 Aug 14 Jun 20 Jun 6 Aug
50
0
Fullness score Fullness score
Fig. 8. Variation in the distribution of foregut fullness scores Fig. 9. Variation in the distribution of foregut fullness scores over the 5 sampling periods for each collection date for Cran- over the 5 s a m p h g periods for each collection date for Carcinus
gon crangon maenas. No foreguts were assigned a fullness score of 5

126 Mar Ecol Prog Ser 176: 115-130, 1999
Tidal movements
Of the macrocrustacean species caught, Crangon crangon and Carcinus maenas are known to show movements into the intertidal zone at high water (A1 Adhub & Naylor 1975, Janssen & Kuipers 1980, Dare & Edwards 1981, Hunter & Naylor 1993, Burrows et al. 1994) and these movements may be in part responsible for the significant tidal effect on catches of these 2 species recorded here. They resemble the migration pattern shown by juvenile flatfishes, particularly 0-group plaice, in the same area, although it is not clear whether the macrocrustacean movements are as directed as those of some fishes.
Die1 movements
The greater numbers of individuals and species found in night catches suggest an onshore migration at dusk followed by an offshore migration at dawn, similar to that shown by gadoid fishes in the same area (Gibson et al. 1996). However, it is not possible to entirely dis- tiguish between diel vertical movements and diel varia- tions in activity that do not involve vertical migration. Crangon crangon and Carcinus maenas have both been shown experimentally to be more active noctur- nally (Naylor 1958, Kitching et al. 1959, Hagerman 1970, Dyer & Uglow 1978, van Donk & de Wilde 1981), and, in underwater television observations in the same area as this study, both species were seen more at night than during the daylight (Burrows et al. 1994). In con- trast, on a microtidal beach in Sweden, C. crangon were mostly active during the day while C. maenas were nocturnally active, with neither species showing migration (Gibson et al. 1998). Abello et al. (1991) found that Liocarcinus depurator were most active at night, but, contrary to the present observations, L. holsatus were most active during the day. A second, and per- haps more likely, explanation for the smaller catches of most crabs during the day is that many macrocrus- tacean. individuals are buried and inactive during this period. Underwater television recordings made in the nearby Dunstaffnage Bay (A. D. Ansell unpubl. obs.) have shown individual C. maenas burrowing into the substratum at dawn and remaining buried within the field of view of the camera for periods of up to 14 h in summer. Buried C. crangon show a much reduced ten- dency to respond to mechanical stimulation by tail flip- ping com.pared to individuals on the surface ( K . Smith unpubl. obs). Although the trawl used in this study had tickler chains, it is likely that buried crabs and shrimps show reduced sensitivity to mechanical stimulus, re- sulting in reduced catching efficiency of the trawl, and hence lower catches by day than by night.
Longer term movements
All the main species decreased in abundance be- tween June and August, which parallels changes in abundance of many of the fish species in the same area (Gibson et al. 1996), and results from similar processes of recruitment, mortality and onshore-offshore migra- tlon. It is perhaps surprising that this effect was so marked for the macrocrustaceans; in an earlier study over 4 yr, macrocrustacean abundance reached its peak in July/August, somewhat later than that of the fish populations. Both Crangon crangon and Carcinus rnaenas are known to show similar seasonal migration elsewhere (Lloyd & Yonge 1947, Naylor 1962, Boddeke 1976, Klein Breteler 1976, Henderson et al. 1990).
Diet of epibenthic macrocrustaceans
The analysis of the contents of the foreguts of the 5 macrocrustacean species examined indicates that all are omnivorous feeders with the possible exception of Pagurus bernhardus, for which Levins' niche breadth index was relatively low. Otherwise, there was little or no indication of dietary specialisation, and the diets showed a high degree of overlap. Measures such as Levins' index and percentage overlap between diets are of questionable utility, however, for such species for which only a relatively small proportion of the gut contents are identifiable beyond the highest taxonomic categories. Both benthic and epibenthic invertebrates and fish occur in the diet, and it is likely that the remains found represent the results of both predation and scavenging. In these respects, the compositions of the diets found here resemble those found elsewhere for these and other related species of shrimp and por- tunid crabs (Ebling et al. 1964, Muntz et al. 1965, Crothers 1968. Ropes 1968, Hill 1976, Gonzalez-Gurri- aran 1978, Elner 1981, Paul 1981, Williams 1982, Pihl. & Rosenberg 1984, Pihl 1985, Choy 1986, Matsui et al. 1986, Abello & Cartes 1987, Wear & Haddon 1987, Hall et al. 1990, Norman & Jones 1992). Factors masking potential differences between the species include the possibility that some items found represent the con- tents of the guts of prey ('secondary predation') and the potentially long retention times of remains such as the chitinous skeletons of Crustacea, calcified fish otoliths and bones, and molluscan shells or opercula (Hill 1976). Long retention times for some items will also tend to mask any short-term, tldal or diel changes in diet.
Algae occurred in the diets of all 5 species examined and herbivory is now a well-documented feature of the diet of macrocrustaceans, especially portunid crabs (Gonzalez-Curriaran 1978, Choy 1986, Raffaelli et al.
Ansell et al.: Crustacean predation on juvenile fishes 127
1989, Norman & Jones 1992). Norman & Jones (1990) showed that Necora puber can digest laminann, the principal carbohydrate in brown algae. The habit is not restricted to portunids; algae also contribute in varying degrees to the diet of various spider crabs (Hartnoll 1963) and mud crabs Scylla serrata (Hill 1976) among others. Considerable amounts of sand were also found in the forguts, especially in Crangon crangon and Pagurus bernhardus, suggesting that there is a contri- bution of non-selective microphagy to the diet.
Cyclic variations in feeding intensity of macrocrustaceans
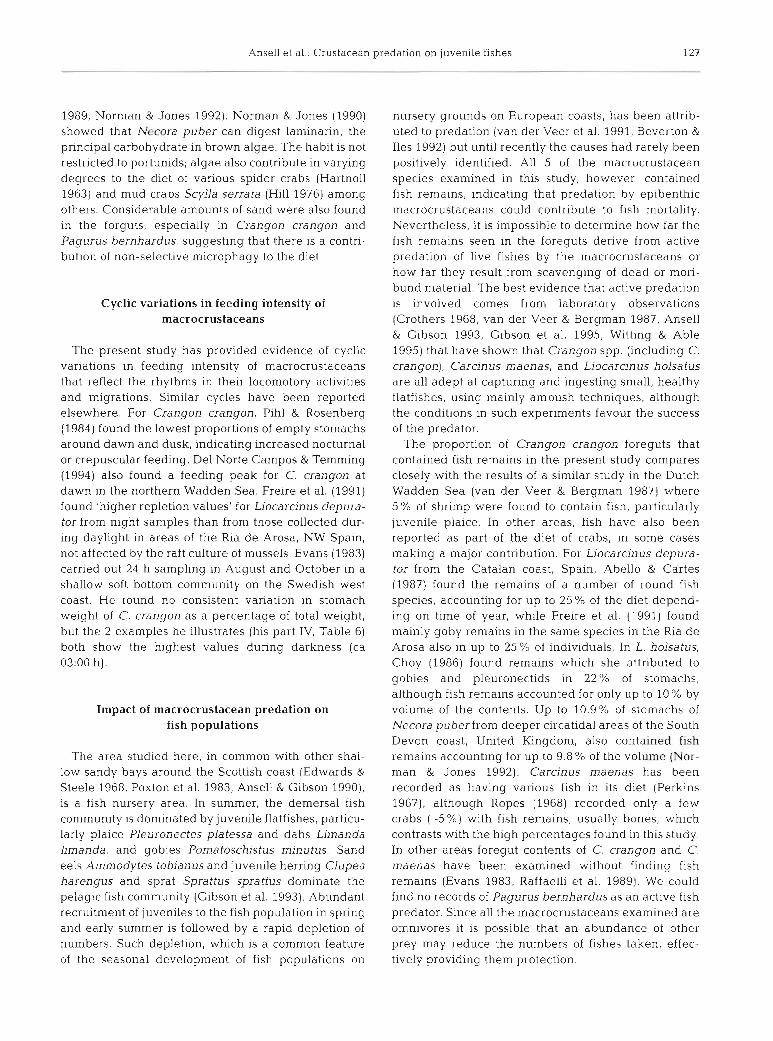
The present study has provided evidence of cyclic variations in feeding intensity of macrocrustaceans that reflect the rhythms in their locomotory activities and migrations. Similar cycles have been reported elsewhere. For Crangon crangon, Pihl & Rosenberg (1984) found the lowest proportions of empty stomachs around dawn and dusk, indicating increased nocturnal or crepuscular feeding. Del Norte Campos & Temming (1994) also found a feeding peak for C. crangon at dawn in the northern Wadden Sea. Freire et al. (1991) found 'higher repletion values' for Liocarcinus depui-a- tor from night samples than from those collected dur- ing daylight in areas of the Ria de Arosa, NW Spain, not affected by the raft culture of mussels. Evans (1983) carried out 24 h sampling in August and October in a shallow soft bottom community on the Swedish west coast. He found no consistent variation in stomach weight of C. crangon as a percentage of total weight, but the 2 examples he illustrates (his part IV, Table 6) both show the highest values during darkness (ca 03:OO h).
Impact of macrocrustacean predation on fish populations
The area studied here, in common with other shal- low sandy bays around the Scottish coast (Edwards & Steele 1968, Poxton et al. 1983, Ansell & Gibson 1990), is a fish nursery area. In summer, the demersal fish community is dominated by juvenile flatfishes, particu- larly plaice Pleuronectes platessa and dabs Limanda limanda, and gobies Pomatoschistus minutus. Sand eels Ammodytes tobianus and juvenile herring Clupea harengus and sprat Sprattus sprattus dominate the pelagic fish community (Gibson et al. 1993). Abundant recruitment of juveniles to the fish population in spring and early summer is followed by a rapid depletion of numbers. Such depletion, which is a common feature of the seasonal development of fish populations on
nursery grounds on European coasts, has been attr.ib- uted to predation (van der Veer et al. 1991, Beverton & Iles 1992) but until recently the causes had rarely been positively identified. All 5 of the macrocrustacean species examined in this study, however, contained fish remains, indicating that predation by epibenthic macrocrustaceans could contribute to fish mortality. Nevertheless, it is impossible to determine how far the fish remains seen in the foreguts derive from active predation of live fishes by the macrocrustaceans or how far they result from scavenging of dead or mori- bund material. The best evidence that active predation is involved comes from laboratory observations (Crothers 1968, van der Veer & Bergman 1987, Ansell & Gibson 1993, Gibson et al. 1995, Witting & Able 1995) that have shown that Crangon spp. (including C. crangon), Carcinus maenas, and Liocarcinus holsatus are all adept at capturing and ingesting small, healthy flatfishes, using mainly ambush techniques, although the conditions in such experiments favour the success of the predator.
The proportion of Crangon crangon foreguts that contained fish remains in the present study compares closely with the results of a similar study in the Dutch Wadden Sea (van der Veer & Bergman 1987) where 5% of shrimp were found to contain fish, particularly juvenile plaice. In other areas, fish have also been reported as part of the diet of crabs, in some cases making a major contribution. For Ljocarcinus depura- tor from the Catalan coast, Spain, Abello & Cartes (1987) found the remains of a number of round fish species, accounting for up to 25 % of the diet depend- ing on time of year, while Freire et al. (1991) found mainly goby remains in the same species in the Ria de Arosa also in up to 25 % of individuals. In L. holsatus, Choy (1986) found remains which she attributed to gobies and pleuronecbds in 22% of stomachs, although fish remains accounted for only up to 10% by volume of the contents. Up to 10.9% of stomachs of Necora puber from deeper circatidal areas of the South Devon coast, United Kngdoni, also contained fish remains accounting for up to 9.8 % of the volume (Nor- man & Jones 1992). Carcinus maenas has been recorded as having various fish in its diet (Perkins 1967), although Ropes (1968) recorded only a few crabs (-5%) with fish remains, usually bones, which contrasts with the high percentages found in this study. In other areas foregut contents of C. crangon and C. maenas have been examined without finding fish remains (Evans 1983, Raffaelli et al. 1989). We could find no records of Pagurus bernhardus as an active fish predator. Since all the macrocrustaceans examined are omnivores it is possible that an abundance of other prey may reduce the numbers of fishes taken, effec- tively providing them protection.

128 Mar Ecol Prog Ser 176: 115-130, 1.999
Although the present data do not allow the estima- tion of the absolute predation rate by macrocrus- taceans on fishes, and particularly juvenlle flatfishes, in this nursery ground, it is possible to assess the rela- tive potential predation impact of shrimps and crabs respectively. During June, Crangon crangon were some 20 times more abundant than Carcinus m a e n a s and other crabs in water depths < 5 m on Tralee Beach. This greater abundance, however, is more than bal- anced by 2 factors: (1) fish remains were found in the foreguts of a much higher proportion of crabs than of shrimps (50 vs 5 %), and (2) crabs have a much greater potential intake of prey than shrimps by virtue of their greater size and consequently much greater foregut volume (15 to 20 times, C. A. Comely & A. D. Ansell unpubl. data). Combining these factors suggests that the impact of crab predation may have been some 30 times greater than that of shrimps in this area in June. A similar comparison for August, by which time the numbers of C. crangon had greatly reduced, suggests that crab predation may then have been relatively even more important. The different distribution of shrimp and crabs, the former in shallower and the lat- ter in deeper water, does imply, however, that their predation impact may affect different components of the overall fish community. 0-group plaice, for exam- ple, are most abundant in shallow water, maintaining their distribution by tidal migration, while 0-group dabs remain predominantly in the area below low water mark at all states of the tide (Gibson 1973). Thus, spatial and temporal overlaps between the fish and macrocrustacean populations would appear to favour predation by shrimps on plaice and by crabs on dabs. Further studies are needed to determine if this is indeed the case.
Macrocrustaceans are not the only predators on juvenile fishes in Tralee Bay or other similar nursery grounds. Juvenile fishes are frequently preyed on by larger fishes (see e.g. Nellen 1986 for examples). Gadoid fishes are commonly cited as predators of juve- nile plaice (Riley & Corlett 1966, Edwards & Steele 1968, Pihl 1982) and Lockwood (1980) suggested that fish predators might be responsible for density-depen- dent mortality of 0-group plaice. Ellis & Gibson (1995) found that 5.5% of 0-group cod (n = 344), 0.8% of 0-group whiting (n = 593) and 29% of l-group poor- cod (n = 7) caught at Tralee contained flatfish remains, of which 84 % were dabs, 2 % flounder and the rest unidentifiable. Gibson & Robb (1996) have recently shown, based on analysis of the stomach contents of the fishes caught during the present study, that preda- tion by larger fishes is a major cause of mortality for the populations of juvenile fishes on Tralee beach. In June, fish predation was concentrated on the most numerous species (0-group plaice) but with the decline in num-
bers and increase in size of this species, the fish preda- tors had changed their diet in August to feed princi- pally on small sand eels. The decline found here between June and August in the proportion of macro- crustacean foreguts that contained flatfish remains compared with those that contained round fish remains suggests that, like fish predation, macrocrus- tacean predation on fishes was concentrated on the most numerous species available within the vulnerable size range. Like the macrocrustaceans, at least one of these larger fish predators (cod G a d u s morhua) is active mainly at night, when they migrate into shallow water (Pihl 1982, Keats & Steele 1992, Burrows et al. 1994, Gibson & Robb 1996, Gibson et al. 1996, 1998). Thus, a considerable component of the predation impact on juvenile fish populations in areas like Tralee Bay appears to take place between dusk and dawn.
Acknowledgements. We greatly appreciate the help given by Robin Gibson, Maggie Watson, John Fitzgerald, Odd-Axe1 Bergstad and Ian Drummond, skipper of the RV 'Seol Mara', in the fieldwork associated with this study, and we thank Mike Burrows for valuable advice and help with the statistical analysis of the results.
LITERATURE CITED
Abello P, Cartes J (1987) Observaciones sobre la alimentacion de Liocarcinus depurator (L.) (Brachyura. Portunidae) en el Mar Catalan. Invest Pesq 5l(suppl 1):413-419
Abello P, Reid DC, Naylor E (1991) Comparative locomotor activity patterns in the portunid crabs Ljocarcinus holsatus and L. depurator J Mar Biol Assoc UK 7 1: 1-10
Al-Adhub AHY, Naylor E (1975) Emergence rhythms and tidal migrations in the brown shrimp Crangon crangon (L.). J Mar Biol Assoc UK 55:801-810
Ansell AD, Gibson RN (1990) Patterns of feeding and move- ment of juvenile flatf~shes on an open sandy beach. In: Barnes M, Gibson RN (eds) Trophic relat~onships in the marine environment. Aberdeen University Press, Aber- deen, p 191-207
Ansell AD, Gibson RN (1993) The effect of sand and light on predation of juvenile plaice (Pleuronectes platessa) by fishes and crustaceans. J Fish Biol43:837-845
Beverton RJH, lles TC (1992) Mortality rates of 0-group plaice (Pleuronectes platessa L.), dab (Limanda l~manda L.) and turbot (Scophrhalmus maximus) in European waters. 11. Comparison of mortality rates and construction of life table for 0-group plaice. Neth J Sea Res 29:49-59
Boddeke R (1976) The seasonal migration of the brown shrimp Crangon crangon. Neth J Sea Res 10:103-130
Brown AC, ~McLachlan A (1991) Ecology of sandy shores. Elsevier, Amsterdam
Burrows MT, Gibson RN, Robb L, Comely CA (1994) Tempo- ral patterns of movement in juvenile flatfishes and their predators: underwater television observations. J Exp Mar Biol Ecol 177.251-268
Choy SC (1986) Natural diet and feeding hab~ts of the crabs Liocarcinus puber and L. holsatus (Decapoda, Brachyura, Portunidae). Mar Ecol Prog Ser 31:87-99
Crothers JH (1968) The biology of the shore crab Carcinusmae- nas (L.) 2. The 11fe of the adult crab. Field Stud 2579-614

Ansell et al.: Crustacean predation on juvenile fishes 129
Dare PJ, Edwards DB (1981) Underwater television observa- tions on the intertidal movements of shore crabs, Circinus maenas, across a mudflat. J h4ar Biol Assoc UK 61 107-116
Del Norte Campos AGC, Temming A (1994) Daily activity and rations in gobies and brown shrimp in the northern Wad- den Sea. Mar Ecol Prog Ser 115141-53
Dyer MF, Uglow RF (1978) Heart and scaphognathite beat behaviour in laboratory-held Crangon crangon (L.). J Exp Mar Biol Ecol 32:209-218
Ebling FJ, Kitching JA, Muntz L, Taylor CM (1964) The ecol- ogy of Lough Ine. XIII. Experimental observations of the destruction of Mytilus edu l~s and Nucella lap~llus by crabs. J Anim Ecol33:73-82
Edwards RRC, Steele J H (1968) The ecology of 0-group plaice and common dabs at Loch Ewe. I. Population and food. J Exp Mar Biol Ecol 2:215-238
Ellis T, Gibson RN (1995) Sizc-selective predation of 0-group flatfishes on a Scottish coastal nursery ground. Mar Ecol Prog Ser 127.27-37
Elner RW (1981) Diet of the green crab Carcinus maenas (L.) From Port Hebert, south-western Nova Scotia. J Shellfish Res 1:89-94
Evans S (1983) Epibenthic communities on shallow soft bot- toms in Gullmar Fjord, Sweden. Doctoral thesis. Uppsala University
Freire J , Fernandez L, Gonzalez-Gurriaran E (1991) Diel feed- ing pattern of Liocarcinus depul-ator (Brachyura. Portu- nidae) in the Ria de Arosa (Galicia, N.W. Spain) Ophel~a 33:165-177
Gibson RN (1973) The intertidal movements and distribution of young fish on a sandy beach with special reference to the plaice (Pleuronectesplatessa). J Exp Mar Biol Ecol 12: 79-102
Gibson RN, Ansell AD, Robb L (1993) Seasonal and annual variations in abundance and species composition of fish and macrocrustacean communities on a Scottish sandy beach. Mar Ecol Prog Ser 98:89105
Gibson RN, Pihl L, Burrows LiT, Modlin J , Wennhage H, Nickel1 LA (1998) Diel movements of juvenile plaice Pleu- ronectes platessa in relation to predators, competitors. food availability and abiotic factors on a microtidal nurs- ery ground. Mar Ecol Prog Ser 165-145-159
Gibson RN, Robb L (1996) Piscine predation on juvenile fishes on a Scottish sandy beach. J Fish Biol 49:120-138
Gibson RN, Robb L, Burrows MT, Ansell AD (1996) Tidal, die1 and longer term changes in the distribution of fishes on a Scottish sandy beach. Mar Ecol Prog Ser 130:l-17
Gibson RN. Yin MC, Robb L (1995) The behavioural basis of predator-prey size relationships between shrimp (Crangon crangon) and juvenile plaice (Pleuronectes platessa). J Mar Biol Assoc UK 75:337-349
Gonzalez-Gurriaran E (1978) lntroduccion a1 estudio de la ali- mentacion en la necora, Macrop~pus puber (L.) (Deca- poda, Brachyura) en la Ria d e Arosa (Galicia-Espana). Boln Inst Esp Oceanogr 4:81-93
Gregory SF (1988) An investigation of the invertebrate macrofauna of a sandy beach near Oban, Argyll, with spe- cific study of mouthpart components of Bathypore~a pilosa Lindstrom and B. pelagica (Bate) (Am.phipoda: Haustori- idae). BSc (Hons) thesis, University of Stirling
Hagerman L (1970) Locomotory achvity patterns of Crangon vul- garis [Fabricius) (Crustacea, Ndtantia). Ophelia 81255-256
Hall SJ, Raffaelli D. Robertson MR, Basford DJ (1990) The role of the predatory crab, Liocarcinus depurator, in a marine food web. J Anim Ecol 59:421-438
Hartnoll RG (1963) The biology of Manx spider crabs Proc Zoo1 Soc Lond 141:423-496
Hayward PJ, Ryland JS (eds) (1990) The marine fauna of the British Isles and north-west Europe. Vol 1 Introduction and protozoans to arthropods. Clarendon Press, Oxford
Henderson PA, Seaby R, Marsh SJ (1990) The populat~on zoo- geography of the common shrimp (Crangon crangon) in British waters. J Mar B101 Assoc UK 70:89-97
Hill BJ (1976) Natural food, foregut clearance rate and activ- ity of the crab Scylla serrata. Mar Biol34:109-116
'Hunter E, Naylor E (1993) Intertidal migration by the shore crab Carcinusmaenas. Mar Ecol Prog Ser 101 131-138
Janssen GM, Kuipers BR (1980) On tidal migration in the shrimp Crangon crangon. Neth J Sea Res 14:339-348
Keats DW, Steele DH (1992) Diurnal feeding of juvenile cod (Gadus morhua) which migrate into shallow water at night in eastern Newfoundland. J Northwest At1 Fish Sci 13: 7-14
Kitching JA, Sloane JF, Ebling FJ (1959) The ecology of Loch Ine VIll. Mussels and their predators. J Anim Ecol 28: 331-341
Klein Breteler WCM (1976) Migration of the shore crab, Carcinus maenas, in the Dutch Wadden Sea. Neth J Sea Res 10:338-353
Krebs CJ (1989) Ecological methodology. Harper & Row, New York
Kuipers B (1975) On the efficiency of a two-metre beam trawl for juvenile plaice (Pleuronectesplatessa). Neth J Sea Res 9.69-85
Lloyd AJ, Yonge CM (1947) The biology of Crangon vulgaris L. in the Bristol Channel and Severn Estuary. J Mar Biol Assoc UK 26526-661
Lockwood SJ (1974) The settlement, distribution and move- ments of 0-group plaice Pleuronectesplatessa (L.) in Filey Bay, Yorkshire. J Fish Biol 6:465-477
Lockwood SJ (1980) Density-dependent mortality in 0-group plaice (Pleuronectes platessa L . ) populations. J Cons Int Explor Mer 39:148-153
Matsui S, Hagiwara Y, Tou H, Tsukahara H (1986) Study on the feeding habits of the Japanese blue crab, Portunus trituberculatus (Miers). Sci Bull Fac Agric Kyushu Univ 40: 175-181
Muntz L, Ebling FJ, Kitching JA (1965) The ecology of Lough Ine. XIV. Predatory activity of large crabs. J Anim Ecol34: 315-329
Naylor E (1958) Tidal and diurnal rhythms of locomotory activity in Carcinus maenas (L.). J Exp Biol 35.602-610
Naylor E (1962) Seasonal changes in a population of Carcinus maenas (L.) in the littoral zone. J Anim Ecol 31:601-609
Nellen Mf (1986) A hypothesis on the fecundity of bony fish. Meeresforsch 31:75-89
Norman CP, Jones MB (1990) Utilization of brown algae in the diet of the velvet swimming crab Liocarcinus puber (Brachyura: Portunidae) In: Barnes M, Gibson RN (eds) Trophic relationships in the marine environment. Aber- deen University Press, Aberdeen, p 491-502
Norman CP. Jones MB (1992) Influence of depth, season and moult stage on the diet of the velvet swimming crab Nec- ora puber (Brachyura. Portunidae). Estuar Coast Shelf Sci 34:71-83
Paul RKG (1981) Natural diet, feeding and predatory activity of the crabs Callinectes arcuatus and C. toxotes (Deca- poda. Brachyura, Portunidae) Mar Ecol Prog Ser 6.91-99
Perkins EJ (1967) Some aspects of the biology of Carcinus maenas (L.). Trans Dumfries Galloway Nat Hist Antiquar Soc Ser 3 44:47-56
Pihl L (1982) Food intake of young cod and flounder in a shal- low bay on the Swedish west coast. Neth J Sea Res 15: 419-432

130 Mar Ecol Prog Ser 176: 115-130, 1999
Pihl L (1985) Food selection and consumption of mobile epibenthic fauna in shallow marine areas. Mar Ecol Prog Ser 22:169-179
Pihl L, Rosenberg R (1984) Food selection and consumption of the shrimp Crangon crangon in some shallow marine areas in western Sweden. Mar Ecol Prog Ser 15: 159-168
Poxton MG, El.eftheriou A, McIntyre AD (1983) The food and growth of 0-group flatfish on nursery grounds in the Clyde Sea area. Estuar Coast Shelf Sci 17:319-337
RaffaelLli D, Conacher A, McLachIan H, Ernes C (1989) The role of epibenthic crustacean predators in an estuarine food web. Estuar Coast Shelf Sci 28:149-160
Riley JD, Corlett J (1966) The numbers of 0-group plaice in Port Erin Bay 1964-66. Rep Mar Biol Stn Port Erin 78: 51-56
Rogers SI, Lockwood SJ (1989) Observations on the capture efficiency of a two-metre beam trawl for juvenile flatfish. Neth J Sea Res 23:34?-352
Ropes JW (1968) The feeding habits of the green crab Carci- nus maenas (L.). Fish Bull US 6?:183-203
SAS Institute Inc (1990) SAS procedures guide, Version 6, 3rd edn. SAS Institute Inc, Cary, NC
van der Veer HW, Bergman MJN (1987) Predation by crus- taceans on a newly settled 0-group plaice Pleuronectes
Editorial responsibility: Otto Kinne (Editor), Oldendorf/Luhe, Germany
platessa population in the western Wadden Sea. Mar Ecol Prog Ser 35:203-215
van der Veer HW, Bergman MJN, Dapper R, Witte JIJ (1991) Population dynamics of an intertidal 0-group flounder Plat~chthys flesus population in the western Dutch Wad- den Sea. Mar Ecol Prog Ser 73:141-148
van Donk E, de CVilde PAWJ (1981) Oxygen consumption and motlle actlvity of the brown shrimp Crangon crangon related to temperature and body size. Neth J Sea Res 15: 54 -64
Wear RG, Haddon M (1987) Natural diet of the crab Ovalipes catharus (Crustacea, Portunidae) around central and northern New Zealand. Mar Ecol Prog Ser 3539-49
Wennhage H, Gibson RN, Robb L (1997) The use of drop traps to estimate the efficiency of two beam trawls commonly used for sampling juvenile flatfishes. J Fish Biol 51: 44 1-445
Williams MJ (1982) Natural food and feeding in the commer- cial sand crab Portunus pelagicus Linnaeus, 1766 (Crus- tacea: Decapoda: Portunidae) in Moreton Bay, Queens- land. J Exp Mar Biol Ecol59:165-176
Witting DA, Able K W (1995) Predation by sevenspine bay shrimp Crangon septemspinosa on winter flounder Pleu- ronectes amencanus during settlement: laboratory obser- vations. Mar Ecol Prog Ser 123:23-31
Submitted: May 22, 1998; Accepted: August 27, 1998 Proofs received from author(s): December 16, 1998