Embed Size (px)
Citation preview
Page 1 sur 52
g+
EDF GROUP
Half-year financial report June 2008
Page 2 sur 52
This Rapport Financier Semestriel contains information relating to the markets in which the EDF Group is present. This information has been taken from surveys carried out by external sources. Considering the very rapid changes that characterize the energy sector in France and in the world, it is possible that this information could prove to be erroneous or no longer be up to date. The Group’s activities could consequently evolve in a manner different from those described in this Rapport Financier Semestriel and the declarations or information appearing in this Rapport Financier Semestriel could prove to be erroneous.
The forward-looking statement within this Rapport Financier Semestriel, notably in section 16 (“Financial Outlook for 2008”), are based on hypotheses and estimates which may evolve or be impacted by risks, uncertainties (in connection with the economic, financial, competitive, regulatory and climate environment) or other factors that may cause the future results, performances and achievements of the Group to differ significantly from the objectives expressed and suggested. These factors may include changes in economic and commercial environment or in regulations as well as to the factors set forth in section 4.2 (“Risk Factors”) of the EDF Group Document de Référence for 2007.
Pursuant to European and French legislation, the entities responsible for the transmission and distribution of electricity within the EDF Group may not communicate certain information they gather within the framework of their activities to the other entities of the Group, including its management. Similarly, certain data specific to generation and marketing activities may not be communicated to the entities responsible for transmission and distribution. This Rapport Financier Semestriel has been prepared by the EDF Group in compliance with these rules.
Page 3 sur 52
Contents
1 - Certification from the person responsible for the half-year financial report 2 - Half-year management report at June 30, 2008 3 - Condensed consolidated half-year financial statements at June 30, 2008 4 - Statutory Auditors’ Review Report on the first half-year financial information for 2008
Page 4 sur 52
Certification from the person responsible for the half-year financial report
« I certify that, to the best of my knowledge, the summary financial statements as of June 30, 2008 are prepared in accordance with accounting standards and that they give a true and fair view of the assets and liabilities, of the financial position and the income of the company and of all the companies included in the consolidation, and that the attached half-year management report presents a true view of the significant events of the first six months of the fiscal year and their impact on the financial statements, the main related party transactions and a description of the main risks and uncertainties for the remaining six months of the fiscal year. »
Pierre Gadonneix
Chairman and CEO of EDF
Page 5 sur 52
g+
EDF GROUP
Half-year Management Report June 2008
Page 6 sur 52
Contents
1 Key figures .......................................................................................................................................... 7 2 Economic Environment and Significant Events .............................................................................. 8 3 Introduction to analysis of results for the first half-year of 2008 ................................................ 18 4 Group accounting principles and methods .................................................................................... 19 5 Segment reporting of financial information................................................................................... 21 6 Analysis of the consolidated income statements for the first half-years of 2008 and 2007 ........ 22 7 Breakdown of EBIT by geographical area..................................................................................... 27 8 Net indebtedness, cash flows and investments ............................................................................... 36 9 Management and control of market risks ...................................................................................... 41 10 Provisions ........................................................................................................................................ 47 11 Contractual obligations.................................................................................................................. 48 12 Subsequent events........................................................................................................................... 49 13 Principal risks and uncertainties for the second half-year of 2008............................................ 50 14 Transactions with related parties.................................................................................................. 50 15 Significant events related to litigation in process ........................................................................ 50 16 Financial outlook for 2008 ............................................................................................................. 51 17 Financial information on EDF ...................................................................................................... 52
Page 7 sur 52
1 Key figures
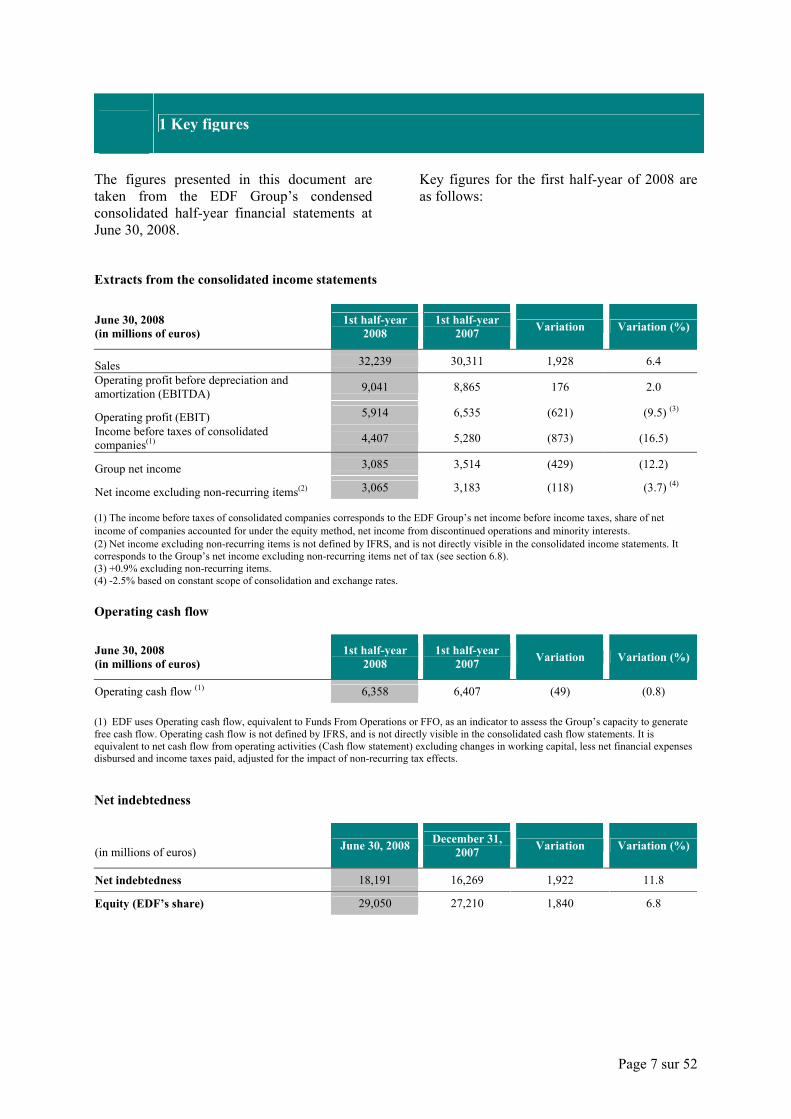
The figures presented in this document are taken from the EDF Group’s condensed consolidated half-year financial statements at June 30, 2008.
Key figures for the first half-year of 2008 are as follows:
Extracts from the consolidated income statements June 30, 2008 (in millions of euros)
1st half-year 2008 1st half-year
2007 Variation Variation (%)
Sales 32,239 30,311 1,928 6.4 Operating profit before depreciation and amortization (EBITDA) 9,041 8,865 176 2.0
Operating profit (EBIT) 5,914 6,535 (621) (9.5) (3) Income before taxes of consolidated companies(1) 4,407 5,280 (873) (16.5)
Group net income 3,085 3,514 (429) (12.2)
Net income excluding non-recurring items(2) 3,065 3,183 (118) (3.7) (4) (1) The income before taxes of consolidated companies corresponds to the EDF Group’s net income before income taxes, share of net income of companies accounted for under the equity method, net income from discontinued operations and minority interests. (2) Net income excluding non-recurring items is not defined by IFRS, and is not directly visible in the consolidated income statements. It corresponds to the Group’s net income excluding non-recurring items net of tax (see section 6.8). (3) +0.9% excluding non-recurring items. (4) -2.5% based on constant scope of consolidation and exchange rates. Operating cash flow
June 30, 2008 (in millions of euros)
1st half-year 2008 1st half-year
2007 Variation Variation (%)
Operating cash flow (1) 6,358 6,407 (49) (0.8) (1) EDF uses Operating cash flow, equivalent to Funds From Operations or FFO, as an indicator to assess the Group’s capacity to generate free cash flow. Operating cash flow is not defined by IFRS, and is not directly visible in the consolidated cash flow statements. It is equivalent to net cash flow from operating activities (Cash flow statement) excluding changes in working capital, less net financial expenses disbursed and income taxes paid, adjusted for the impact of non-recurring tax effects. Net indebtedness
(in millions of euros) June 30, 2008 December 31,
2007 Variation Variation (%)
Net indebtedness 18,191 16,269 1,922 11.8
Equity (EDF’s share) 29,050 27,210 1,840 6.8

Page 8 sur 52
2 Economic Environment and Significant Events
2.1 Economic environment 2.1.1 GDP growth 1 The first half-year of 2008 was marked by the ongoing rise of the Euro against the US dollar and pound sterling, combined with faster-paced inflation sustained by rising commodity and agricultural prices. After a brief recovery in the first quarter, there was an apparent return to the general slowdown observed in the world economy since mid-2007, although trends varied across different geographical areas. In the Euro zone, where the EDF Group does most of its business, growth is expected to continue to level out. GDP growth for this zone is forecast at 1.6% for 2008, compared to 2.6% for 2007. In France, growth to the end of 2008 should remain very moderate. The economy picked up (+0.6%) in the first quarter, but should then slow to +0.2% in the second quarter. In the core scenario developed by France’s national statistics office INSEE, annual growth for 2008 is forecast at +1.6% . In the United Kingdom, the slowdown continued in the first quarter of 2008 (+0.4% after +0.6% in the final quarter of 2007). The forecast for the second quarter should be +0.2% and annual growth for 2008 is expected to stand at +1.7%. In Germany, growth reached +1.5% in the first quarter of 2008. The second quarter is expected to register degrowth of -0.3%, while annual growth should attain +2.1%. In Italy, first-quarter growth was +0.4%. The forecasts for the second quarter and the full year 2008 are +0.1% and +0.3% respectively.
1 Source: Note de conjoncture, INSEE, June 2008 – extracts. Figures for the first half-year and the year 2008 are estimates and supplied by INSEE.
2.1.2 Trends in market prices for electricity and the main energy sources 2.1.2.1 Wholesale electricity prices Spot prices in France, Germany, the United Kingdom and Italy 2 In France, 2008 first-half spot prices for electricity on the Powernext exchange were doubled the previous year’s levels, at an average €65/MWh baseload and €85.60/MWh peakload, respectively 117% and 110% higher than in first-half 2007. The significant rise in electricity spot prices was largely caused by factors inherent to the market: - The high rise in fossil fuel prices, particularly coal and oil, - The high increase in price of CO2 emission quotas resulting from the start of the “Kyoto” phase (2008-2012) of the program to limit CO2 emissions, with more restrictive quota allocation plans, - Application from January 1, 2008 of the European Large Combustion Plant Directive (LCPD) introducing stricter constraints for the use of fossil-fired plants. The situation for the first half-year supply-demand balance was comparable overall in the first-half years 2008 and 2007, although the cold spell of April and the unavailability of plants in France in June were more marked in 2008. In Germany, spot prices averaged €60.9/MWh baseload and €80.6/MWh peakload over the first half of 2008, respectively 93% and 79% higher than in first-half 2007. German spot prices were lower than French prices despite following the same general trend, largely because in Germany, consumption is less sensitive to temperatures and the impact of the LPCD was smaller (since antipollution investments had been made early in the decade). From an average €1.5/MWh (baseload) above French spot prices in first-half 2007, German spot prices were cheaper by an average €4.1/MWh (baseload) in first-half 2008. 2 France: average previous day Powernext price for same-day delivery; Germany: average previous day EEX price for same-day delivery; UK: Average previous day Platts OTC price for same-day delivery; Italy: average previous day GME price for same-day delivery.

01/08/2008 16:14
Page 9 sur 52
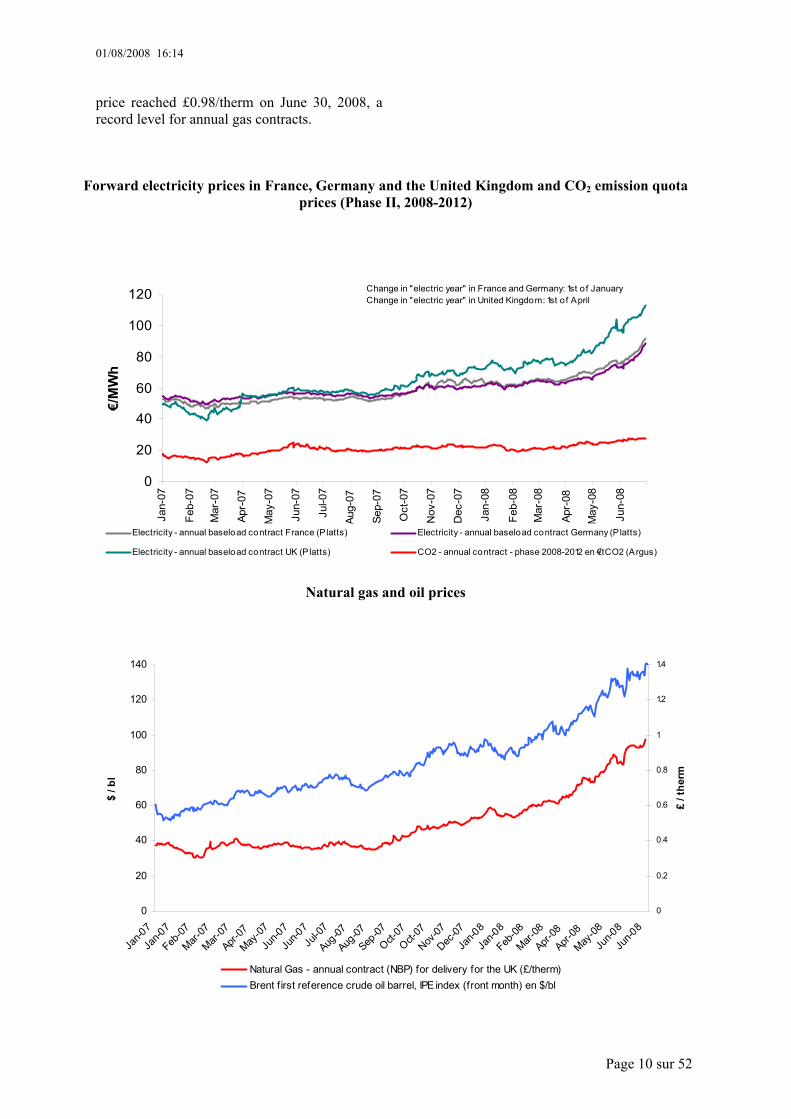
In the United Kingdom, average first half-year spot prices stood at €81.7/MWh baseload and €99.5/MWh peakload in 2008, more than double the corresponding 2007 levels (+154% and +145% respectively). This development resulted from the significant increase in gas prices, and to a lesser extent, the rising price of CO2 emission quotas and the LCPD coming into force. In Italy, average spot prices were higher than in the rest of Europe. They also rose between first-half 2007 and first-half 2008, but to a much smaller degree than in other European countries. This difference is attributable to high hydraulicity in the southern Alps, moderate temperatures and competitive performances from the new gas-fired plants. Average Italian spot prices for the half-year amounted to €80.6/MWh baseload (+23%) and €106.2/MWh peakload (+12%). 2.1.2.2 Forward prices in France, Germany, and the United Kingdom 3 Forward electricity prices progressed sharply in the first half-year of 2008 compared to the same period of 2007. The average price under the 2009 annual contract (baseload) in France was €69/MWh, 35% higher than the 2008 annual contract price quoted in the first half-year of 2007. The 2009 price rose from €62.1/MWh at January 1, 2008 to €91.5/MWh at June 30, a record for this type of contract. In Germany, the 2009 annual baseload contract price stood at an average of €67/MWh (24% above the 2008 annual contract price quoted in the first half-year of 2007). Annual contract price rises in the United Kingdom were even more marked than in France due to the rise in forward gas prices. The April Ahead4 contract price gained €39.9/MWh between January 1 and June 30, 2008, ending the half-year at €112.3/MWh (baseload), compared to €58.3/MWh at June 30, 2007. The increases in the price of coal, oil, gas and CO2 emission quotas for the “Kyoto” phase II
3 France and Germany: Platts average 2009 annual contract price; UK: average annual contract prices from April 2008 then April 2009 (in the UK, annual contract deliveries take place from April 1 to March 31) 4 The British ‘April Ahead 2008’ annual contract runs from April 1, 2008 to March 31, 2009.
(2008-2012) account for the rise in forward electricity prices, which was slightly offset by the US dollar's declining value against the Euro. 2.1.2.3 CO2 emission quota prices The price of CO2 emission quotas for Phase II of the trading scheme (2008-2012) was €23.6/tCO2 on average for the first half-year of 2008, 33% higher than in the first half-year of 2007, reflecting market actors’ expectations that allocation plans would be more restrictive in phase II (2008-2012) than in Phase I (2005-2007), and the general price rises for all fossil fuels. 2.1.2.4 Fossil fuel prices Forward prices for coal5 increased significantly from mid-2007. The annual contract price (delivery in Europe) was $137.7/t on average over the first half-year of 2008, compared to $71.8/t in first-half 2007 (+92%), reaching a record level of $211.5/t on June 30, 2008. This rise is due to high pressure on the international supply-demand balance for coal and higher maritime freight prices. Worldwide consumption grew, boosted by economic growth in China and India, while the main coal-exporting countries (particularly Australia, Indonesia and South Africa) experienced logistical problems and extreme weather conditions that limited their export capacities. Average oil6 (Brent) prices for first-half 2008 were $109.7/barrel, up 73% from the first-half 2007 level of $63.6/barrel. Oil prices have soared since summer 2007, notably as a result of political tensions in the Middle East and the Niger Delta, sustained demand from emerging countries, the low level of oil stocks in developed countries and the falling value of the dollar. Brent prices reached a record level of $140.3/barrel on June 27, 2008. Natural gas7 prices under the United Kingdom’s annual contract rose by 90% compared to the first half-year of 2007 to a half-year average of £0.70/therm in 2008. Boosted by oil prices, this
5 Average Argus annual contract price for delivery in Europe (CIF ARA). 6 Brent first reference crude oil barrel, IPE index (front month). 7 Platts average annual contract price for delivery starting from October of the following year for the UK (NBP).
01/08/2008 16:14
Page 10 sur 52
price reached £0.98/therm on June 30, 2008, a record level for annual gas contracts.
Forward electricity prices in France, Germany and the United Kingdom and CO2 emission quota prices (Phase II, 2008-2012)
0
20
40
60
80
100
120
Jan-
07
Feb-
07
Mar
-07
Apr-
07
May
-07
Jun-
07
Jul-0
7
Aug-
07
Sep-
07
Oct
-07
Nov
-07
Dec
-07
Jan-
08
Feb-
08
Mar
-08
Apr-
08
May
-08
Jun-
08
€/M
Wh
Electricity - annual baseload contract France (Platts) Electricity - annual baseload contract Germany (P latts)
Electricity - annual baseload contract UK (P latts) CO2 - annual contract - phase 2008-2012 en €/tCO2 (Argus)
Change in "electric year" in France and Germany: 1st o f JanuaryChange in "electric year" in United Kingdom: 1st of April
Natural gas and oil prices
0
20
40
60
80
100
120
140
Jan-0
7
Jan-0
7
Feb-07
Mar-07
Mar-07
Apr-07
May-07
Jun-0
7
Jun-0
7Ju
l-07
Aug-07
Aug-07
Sep-07
Oct-07
Oct-07
Nov-07
Dec-07
Jan-0
8
Jan-0
8
Feb-08
Mar-08
Apr-08
Apr-08
May-08
Jun-0
8
Jun-0
8
$ / b
l
0
0.2
0.4
0.6
0.8
1
1.2
1.4
£ / t
herm
Natural Gas - annual contract (NBP) for delivery for the UK (£/therm)Brent f irst reference crude oil barrel, IPE index (front month) en $/bl
01/08/2008 16:14
Page 11 sur 52
2.1.3 Electricity consumption In France, internal electricity consumption for the first quarter of 2008 totaled 253.3 TWh, 5.8% more than for the same period of 20078. After adjustment for the impact of unusual weather conditions9 and the additional day of February 29, 2008, electricity consumption in France in the first half-year was 2.3% higher than in first-half 2007. Domestic electricity consumption for the first half-year of 2008 increased by 3.0% in the United Kingdom and 1.5% in Germany compared to first-half 2007; it declined by 0.1% in Italy10. 2.1.4 Electricity and natural gas sales tariffs Electricity and natural gas sales tariffs returned to upward trends in the first half of 2008 in Germany and the United Kingdom. In Germany, EnBW increased its natural gas prices by 6.9% from January 1, 2008. It also raised its electricity prices by 4.9% from July 1, 2008. In the United Kingdom, EDF Energy’s prices for electricity and natural gas were raised by 7.9% and 12.9% respectively from January 18, 2008.
8 Source: RTE EDF Transport. 9 For the first half-years of 2007 and 2008 10 For countries other than France, estimates are supplied by local EDF subsidiaries.
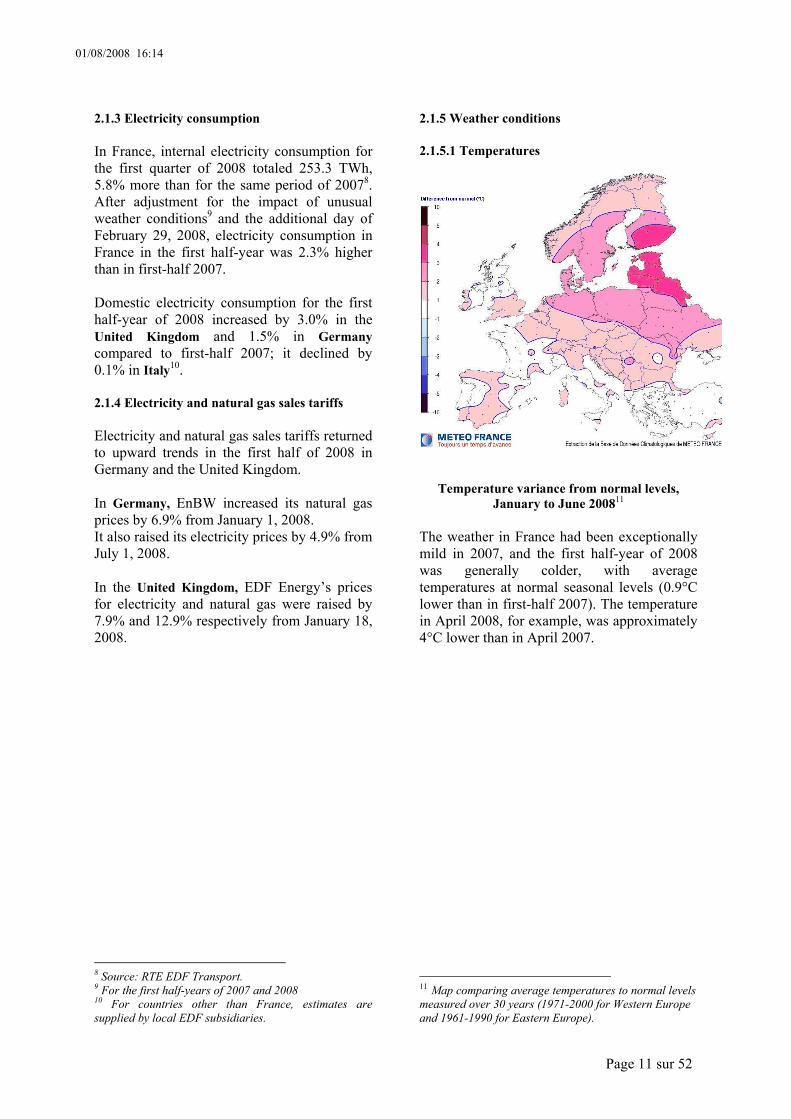
2.1.5 Weather conditions 2.1.5.1 Temperatures
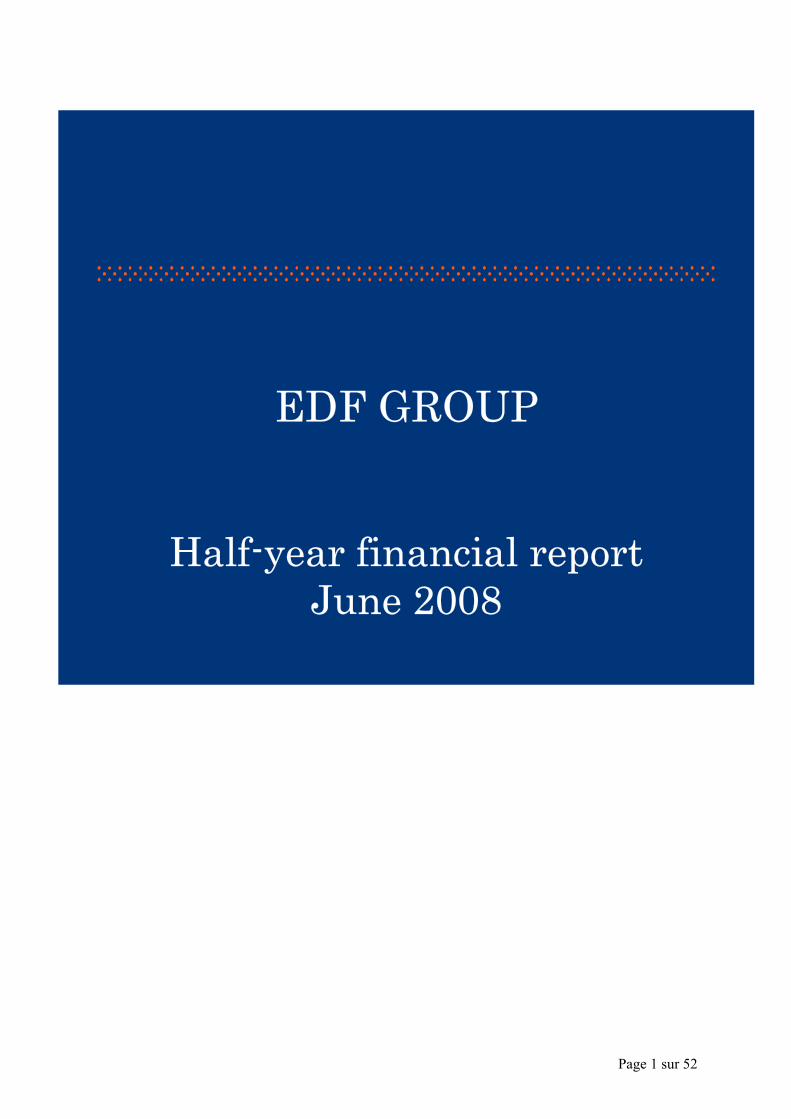
Temperature variance from normal levels, January to June 200811
The weather in France had been exceptionally mild in 2007, and the first half-year of 2008 was generally colder, with average temperatures at normal seasonal levels (0.9°C lower than in first-half 2007). The temperature in April 2008, for example, was approximately 4°C lower than in April 2007.
11 Map comparing average temperatures to normal levels measured over 30 years (1971-2000 for Western Europe and 1961-1990 for Eastern Europe).

01/08/2008 16:14
Page 12 sur 52
2.1.5.2 Rainfall
Rainfall: January 2008 to June 200812
After two particularly dry years, rainfall in France recovered and exceeded normal levels during the first half-year of 2008, particularly from April onward. This situation was especially widespread in south-east France (where many EDF dams are located) and the Massif Central. Hydraulicity was higher than normal over the six-month period for the French hydropower plants. In other European countries: - there was considerable contrast between the situation in north and south Europe during the first quarter of 2008: Scandinavia, Germany, Poland, the Baltic countries and the British Isles had heavy rain while the southern part of the Alpine Arc experienced rain shortages. Rainfall was also high over the Iberian Peninsula. - April and May were very wet in the Iberian Peninsula and Italy, while below-normal rainfall continued in the Balkans.
12 Map comparing average rainfall for the period January to June 2008 with normal levels. Map comparing average rainfall to normal levels measured over 30 years (1971-2000 for Western Europe and 1961-1990 for Eastern Europe). Extracted from the Météo France climatological data base.
2.2 Significant events 13 2.2.1 Strategic developments 2.2.1.1 Strengthening and expanding EDF’s position as the European leader EDF is continuing to consolidate its positions in Europe through its operating investment program. It is attentive to external growth opportunities that meet its three criteria of strategic coherence, financial profitability, and acceptability in the countries concerned. SPE (Belgium) On June 20, 2008, the EDF Group signed an agreement with Gaz de France to acquire its 50% investment in Segebel, which holds 51% of the capital of the Belgian electricity operator SPE. The transaction price was set at €515 million plus a possible supplement after implementation of the commitments made to the Belgian State by Suez Electrabel. This agreement was subject to the potential exercise of the preemption right held by Centrica (the 50% joint shareholder in Segebel). On July 22, 2008, Centrica informed EDF that it intended to exercise its right, and consequently Centrica is now substituted for EDF in all approved commitments with Gaz de France concerning the acquisition of 50% of Segebel. EDF Energy As part of the insolvency administration procedure for Metronet, the decision to transfer the company’s assets to two entities belonging to Transport for London (a local government body reporting to London City Hall) took effect on May 27, 2008 after the Mayor of London had issued his approval. The administrator can now proceed with liquidation of Metronet, which should be complete by the end of the year. Meanwhile, the Metronet consortium was in negotiation with Transport for London (TfL) to settle disputes over certain properties and information systems required for TfL to continue operations. Prior to the transfer of assets, EDF Energy had found alternative
13 Significant events related to litigation are described in chapter 15.
01/08/2008 16:14
Page 13 sur 52
positions for all employees involved in Metronet’s operations. The significant progress made in these different areas reduced the Group’s overall exposure to the risks related to Metronet, which is included in the consolidation under the equity method. EDF Energy began work on a new CCGT (combined cycle gas generation) plant on the West Burton site. The plant is scheduled to come on line in 2011. 2.2.1.2 Developments in the natural gas business The EDF group intends to develop its portfolio of natural gas purchase contracts and its involvement in natural gas reserves such as logistic infrastructures. On February 13, 2008 it entered into an agreement with the Spanish Group Gas Natural for supplies of liquefied natural gas (LNG). The agreement covers a total volume equivalent to four billion cubic meters, to be delivered from April 2009 at a rate of one billion cubic meters each year. This agreement could contribute to supplies for the French market. EDF also signed a cooperation agreement with the Government of Qatar to examine gas partnerships and provide support in Qatar’s discussions on nuclear power generation and renewable energies. Following completion of the public consultation process, EDF confirmed that it would go ahead with studies for the proposed methane terminal at Dunkirk. The final investment decision will be made at the end of 2009. 2.2.1.3 Reinforcing renewable energies EDF Energies Nouvelles A further 291 MW of EDF Energies Nouvelles wind generation capacity came on line during the first half-year of 2008, including the first 152 MW unit of the Ventominho wind farm in Portugal, Europe’s largest onshore wind farm. In the United States, EDF Energies Nouvelles signed two electricity sale contracts for the wind farms under construction at Wapsipinicon (100.5 MW) and Shiloh II
(150 MW), which are both due to be completed by the end of 2008. To support its development plan in the United States, EDF Energies Nouvelles also entered into a new contract with General Electric Energy for the supply of 200 turbines to generate 300 MW, for delivery in 2010. In Canada, Hydro Québec selected the St Laurent Energies consortium, in which EDF Energies Nouvelles holds a 60% share, as constructor for five wind farms with total capacity of 954 MW. In the field of photovoltaic solar power, EDF Energies Nouvelles began construction of a 7 MWp photovoltaic solar plant. This is one of the largest solar plants currently under construction in mainland France and is due to be in operation by the end of 2008. EDF Energies Nouvelles continued to secure supplies of solar panels, most notably by signing a 60 MWp agreement with First Solar, together with a contract granting the company access to some of the output of the US company Nanosolar from 2009. The Group has also acquired an investment in Nanosolar through its subsidiary EDF Energies Nouvelles Réparties. In June 2008, EDF Energies Nouvelles and EDF Energy also entered into an agreement to form a new joint venture to be named EDF Energy Renewables. EnBW In May 2008, EnBW acquired two development companies for offshore wind farm projects in the North Sea and the Baltic Sea. A total 1,200 MW capacity will be constructed over the coming five years. 2.2.1.4 Development of nuclear activities outside France The Group’s ongoing strategy supports its ambition to play a leading role in the international renewal of nuclear power. The following important developments took place during the first half-year of 2008 in the United States: - On June 5, 2008, Unistar Nuclear Energy (a joint venture between EDF and the

01/08/2008 16:14
Page 14 sur 52
US operator Constellation Energy) announced that the NRC (Nuclear Regulatory Commission) had formally accepted the COLA (Combined License Application for plant construction and operations)14 for the proposed Calvert Cliff 3 plant in south Maryland. - On April 21, 2008, EDF and Exelon, the United States’ leading nuclear operator, signed a five-year cooperation agreement, for the purpose of sharing their respective experiences as nuclear operators. 2.2.2 Business in France 2.2.2.1 Performance of nuclear generation facilities In the autumn of 2006, EDF observed that passages for circulation of second circuit water were partly clogged at the Cruas plant. A review carried out by EDF in 2007 assessed the scope of the problem: the clogging potentially affects 15 of the 58 units in the French fleet (eight 1,300 MW units and seven 900 MW units), and chemical cleaning of the steam generators is required. A chemical cleaning process was progressively developed in 2007 during the treatment process applied to the first four of the fifteen units concerned. Remedial treatment of all the other units affected is scheduled for the next few years, including five in 2008 (two have already been cleaned during the first half-year). The overall impact of this generic failure is expected to reduce the Kd by 2 percentage points in 2008 and 2009. Nuclear power generation grew by 3.7 TWh over the half-year to 211 TWh despite the increasing number of anomalies noted in the electrical insulation of alternators at certain 1,300 MW plants. The increase in output compared to first-half 2007 was close to 2%, achieved essentially through better use of the nuclear power plants against generally high consumption. The Group has begun campaigns for progressive improvement of performance by the nuclear fleet, and should attain a coefficient of close to 85% nuclear availability in 2010-2011. 14 Formal acceptance of the COLA means the file is complete and can be examined by the NRC.
2.2.2.2 Tenders for electricity sales: 500 MW of electricity sold to alternative suppliers In a ruling of December 10, 2007, the French competition authorities (Conseil de la concurrence) accepted and made binding EDF’s proposed commitment to tender a significant volume of electricity to alternative suppliers. The first auction took place on March 12, 2008. Twelve companies submitted bids, and the 500 MW put up for tender by EDF were awarded to 5 companies. These tenders concern baseload supply contracts for period of up to fifteen years. 2.2.3 Regulatory environment (France) 2.2.3.1 Hydropower concessions Article 7 of the French Law of December 30, 2006 on water and aquatic environments removed the outgoing operator’s preferential right instituted by the law of October 16, 1919 on the use of hydropower. Article 33 of the Law of December 30, 2006, amending the 2006 finance law, sets out the principle of an indemnity for the outgoing operator in respect of the unamortized portion of investments made during the second half of the agreement (the final 10 years at least), with the exception of investments required to return the assets in good condition at the end of the concession. The implementation decree is due to be published during the second half of 2008. It will amend the decree on the declared public utility of facilities using hydropower, and the decree approving the standard rules of hydropower concessions. This decree should clarify points such as: - the procedure for selection of the concession operator, - the calculation of the fee payable by the selected operator when the new concession is awarded; - the amount of the fee applicable to new concessions, which will be proportional to the income from sales of electricity; - the compensation conditions for work undertaken during the second half of the period of execution of the concession agreement. The decree has not yet been published, and its impacts cannot be estimated at June 30, 2008.
01/08/2008 16:14
Page 15 sur 52
Therefore, the consolidated half-year financial statements have been established under the principles applied in the financial statements at December 31, 2007. 2.2.3.2 French laws on urban solidarity and renewal - town planning and habitat15 The implementation provisions for the sections of the French solidarity and urban renewal law and town planning and habitat law concerning connection to the public electricity distribution network introduce a new system, with the following main features: - Definition of connection operations, separating network extension from connection, with clear identification of the beneficiaries (local authorities in charge of town planning and connected customers), - Establishment of a single invoice price scale for all connection operations, - Direct inclusion of part of the connection price in the delivery tariff, using reduction rates applicable to the basic price scale. At the date of publication of the half-year financial statements, a price scale has been proposed to, and approved by, the French energy regulator (Commission de Régulation de l’Energie). However, the application of this new system, the impact of which is being measured, is suspended pending a decision due to be published during the second half-year of 2008, and expected to take effect from January 1, 2009. 2.2.3.3 Third “energy” European Commission directive On September 19, 2007, the European Commission proposed a third “energy” directive, containing the following measures to accelerate deregulation of the European energy market: - Unbundling of the assets of transmission network operators; in certain cases, the State could remain the owner of those assets but would then have to designate a transmission network operator (the “ISO” (Independent System Operator)” system), - Reinforcement of regulatory powers, - Closer coordination between transmission network operators, 15 « Lois SRU - UH (relative à la solidarité et au renouvellement urbain – urbanisme et habitat) »
- Greater transparency in network management and market operation. In the first quarter of the 2008, eight EU Member States including France and Germany took the view that unbundling the transmission network assets was not necessary for a more open market, and proposed a third way based on three main principles: improving the governance of vertically integrated companies and their relations with transmission network operator subsidiaries, development of the networks (development plan, investment control), and regional cooperation. At the EU Energy Council held on June 6, 2008, European energy ministers reached broad agreement over the general orientations. On the issue of separating the transmission network operator’s activities from generation and supply activities, the idea of a third way was put forward that guarantee the independence of the transmission network operator preserving the financial interests of vertically integrated companies. This third way, called the “ITO (Independent Transmission Operator) option” was proposed for both the gas and electricity sector. Subject to adoption, which is unlikely to take place before 2009, the provisions of the directive should: - Guarantee the independence of the transmission network operator, its management and its governing bodies, - Avoid conflicts of interest, - Guarantee transparency and non-discriminatory access to the network, - Reinforce investments in the network and interconnections. After two years, the Commission may carry out a review of implementation of these measures and their effects on the deregulation of markets, and propose supplementary measures to reinforce independence of the transmission network operator. However, on June 18, 2008 the “third way” proposal for the electricity sector and the ISO system were rejected by the European Parliament at the first reading.
01/08/2008 16:14
Page 16 sur 52
2.2.4 Governance 2.2.4.1 Appointment of Mr Bruno Lafont to the Board of Directors The Shareholders’ meeting of May 20, 2008 took note of Mr Louis Schweitzer’s resignation from his position as director, and appointed Mr Bruno Lafont16 as a director of the EDF Group until November 22, 2009. 2.2.4.2 Appointment of Mr Dominique Lagarde to replace Mr Yann Laroche Mr Dominique Lagarde was appointed Chief Human Resources and Communications Officer with effect from May 20, 2008, replacing Mr Yann Laroche. Mr Yann Laroche did not wish to renew his term of office but remains Chairman of the Supervisory Board of ERDF, the EDF subsidiary in charge of distribution activities. He also acts as special advisor to the Chairman of EDF. 2.2.5 Financing Bond issues in France EDF undertook bond issues during the first half-year of 2008 for a total amount of €3.3 billion and £0.5 billion, in order to finance its business and more specifically its investment program. These issues were placed with French and international institutional investors and reflect the growing centralization of financing for subsidiaries and EDF’s operating investment program. Maturities vary from 6 to 20 years, again as part of the Group's policy to increase the average duration of its debt. In May 2008, RTE EDF Transport also issued a €1.25 billion 7-year bond.
16 Mr Bruno Lafont (born in 1956) is a graduate of Paris business school HEC (1977) and France’s top school for senior civil servants Ecole Nationale d'Administration (1982). He joined the Lafarge group in 1983 and has been its Chairman and CEO since May 2007.
2.2.6 Human resources Publication of the decree on reform of the special electricity and gas sector (IEG) pension system in France and related support measures The main provisions of this decree, published on January 22, 2008, concern: - Prolongation of the employee contribution period; - Reductions and increases in pension rates. The decree came into force on July 1, 2008 and is due to be supplemented by other measures resulting from the relevant laws and regulations. An agreement was signed for the IEG sector on January 29, 2008 as part of this reform, following the principles set forth in the French Pension Guideline Document (Document d’Orientation sur les Retraites). This agreement introduces the following support measures for the changes: - Measures affecting employees’ salaries, - Initial measures related to longer working lives. The impact of these measures is taken into account in the financial statements at June 30, 2008. Negotiations for sector-specific or company-specific agreements will also take place during the second half-year of 2008, particularly covering the way the specificities of different businesses will be taken into consideration. Change in the special electricity and gas sector (IEG) pension system On June 29, 2008, France’s Official Gazette (Journal Officiel) published the decree amending the IEG statutes concerning the special pension system. This decree takes effect from July 1, 2008 and sets out all the rules applicable to pensions and invalidity benefits for IEG sector employees. In addition to extending the contribution period to qualify for a full pension, and introducing reductions and increases applicable to pension rates, it also contains new measures primarily concerning family and conjugal benefits, and defines the timeline for progressive application of the new rules. A new decree introducing a range of modifications to the statutes (age limit, unpaid
01/08/2008 16:14
Page 17 sur 52
leave entitlement to look after a child under eight, seniority clause to qualify for various benefits during retirement) was published in the Official Gazette of July 4, 2008. This decree will also remove age and nationality-based restrictions on hiring. 2.2.7 2008-2010 profit share EDF 2008-2010 voluntary profit share agreement was signed on June 13, 2008. It aims to provide a collective performance incentive for the company’s employees in each area of activity, and is based on three criteria: the company, the area of activity, and the unit. The agreement signed allows for payment of a bonus under a mandatory profit share scheme in 2008, and the company has applied to the authorities to introduce this scheme.
2.3 Changes in the scope of consolidation The main changes in the scope of consolidation during the first half-year of 2008 have no significant impact on the financial statements and result from the following: - In Italy, the sale by Edison in April 2008 of seven thermoelectric plants. - In the Rest of Europe,
• sale of SOPROLIF completed in February 2008, • purchase by EDF of shares in ECW for €54 million after Gaz de France exercised its put option, raising the EDF Group’s ownership interest from 77.52% to 99.66%, • various external growth operations by Dalkia International, including purchase of the Praterm Group in Poland.
01/08/2008 16:14
Page 18 sur 52
3.1 Declaration of conformity and Group accounting policies Pursuant to European regulation 1606/2002 of July 19, 2002 on the adoption of international accounting standards, the EDF Group’s consolidated financial statements are prepared using the presentation, recognition and measurement rules prescribed by IAS/IFRS. The condensed consolidated half-year financial statements comply with standard IAS 34 on interim financial reporting and the IAS/IFRS international accounting standards released at June 30, 2008, in the form in which they should be mandatory at December 31, 2008. These financial statements do not include all the information required for full annual financial statements, and are to be read in conjunction with the consolidated financial statements at December 31, 2007 with reference to the principal accounting and valuation methods described in notes 1, 2 and 3 to those financial statements. 3.2 Accounting methods for the first half-year of 2008 The accounting and valuation methods applied by the Group in the consolidated half-year financial statements are identical to those used in the consolidated financial statements for the year ended December 31, 2007, with the exception of the valuation methods specific to interim financial statements, as described in note 1.3 of the condensed consolidated half-year financial statements at June 30, 2008. Regarding standards endorsed by the European Union but not yet mandatory in 2008, the Group has decided against early application of IFRS 8, “Operating segments”, which replaces IAS 14 and requires the entity’s financial performance and operating segments to be
presented in the form in which they are regularly reviewed by management. Similarly, the Group has not opted for early application of the following standards and amendments likely to be endorsed for application by the EU in 2008 and 2009: - Revised IAS 1, “Presentation of financial statements”; - Amendment to IAS 23, “Borrowing costs”; - Revised IAS 27, “Consolidated and Separate Financial Statements”; - Amendments to IAS 32 and IAS 1 entitled “Puttable financial instruments and obligations arising on liquidation”; - Amendment to IFRS 2 “Vesting conditions and cancellations”; - Revised IFRS 3 “Business combinations”; - IFRIC 13 “Customer loyalty programmes”; - IFRIC 14 “IAS 19 – The limit on a defined benefit asset, minimum funding requirements and their interaction”. The potential impact of all of these standards, amendments and interpretations is currently being evaluated. The European Commission’s endorsement process for interpretation IFRIC 12, “Service Concession Arrangements”, issued by IFRIC in November 2006, is still ongoing at June 30, 2008. The analysis undertaken in 2007 by the Group leads it to consider that IFRIC 12, when applicable, will have only a limited impact on its balance sheet and income statement (see notes 3.1 and 3.2.3 to the consolidated financial statements at December 31, 2007).
3 Introduction to analysis of results for the first half-year of 2008

01/08/2008 16:14
Page 19 sur 52
4 Group accounting principles and methods
4.1 Valuation methods specific to interim financial statements The following valuation methods specific to interim financial statements have been applied: 4.1.1 Employee benefits None of the actuarial assumptions used in calculating the obligation – particularly the discount rate, inflation rate and wage increase rate – has been modified over the period, with some exceptions resulting from the special electricity and gas sector (IEG) pension system reform (see note 2 to the condensed consolidated half-year financial statements at June 30, 2008). The amount of the obligation corresponding to post-employment benefits and other long-term benefits at June 30, 2008 was calculated by projection of the following over one half-year: - the obligation at December 31, 2007 for entities not covered by the special IEG pension system, - the obligation at January 1, 2008 for other entities after the effect of the reform of the special IEG pension system, taking into account the benefits paid out and the changes in fund assets. 4.1.2 Income taxes For interim financial statements, income tax (current and deferred) is generally calculated by applying the last known estimated effective tax rate for the prevailing fiscal year for each entity or tax group to the consolidated companies' pre-tax income. 4.1.3 Transition tariff (Tarif réglementé transitoire d’ajustement de marché or TaRTAM) The assumptions used to assess the contribution payable by the Group for application of the transition tariff (TaRTAM) defined in the French law of December 7, 2006 are based on the best available information and forecasts, particularly regarding the numbers of customers applying to benefit from this tariff, developments in electricity market prices and
the share of the compensation to be financed by the Contribution to the Public Electricity Service (Contribution au Service Public de l’Electricité or CSPE) at each closing date. The value reported at June 30, 2008 does not incorporate the consequences of the French law on economic modernization adopted by Parliament on July 23, 2008, which prolongs the TARTAM transition tariff system to June 30, 2010. This law will be enacted in the second half-year of 2008 (see notes 12 and 32.1.2 to the condensed consolidated half-year financial statements at June 30, 2008). 4.1.4 Greenhouse gas emission quotas When a Group entity’s estimated emissions are higher than the quotas allocated for the period less any spot or forward transactions, a provision is established to cover the excess emissions. For interim financial statements, the amount of the provision is calculated pro rata to the emission output during the half-year. The provision is equivalent to the acquisition cost up to the amount acquired on the spot or forward markets, and based on market prices for the balance. 4.2 Management judgment and estimates The preparation of the financial statements requires the use of judgments, best estimates and assumptions in determining the value of assets and liabilities, income and expenses recorded for the period, and positive and negative contingencies at the closing date. The figures in future financial statements may differ from current estimates due to changes in these assumptions or economic conditions. The estimates and assumptions used in establishing the consolidated half-year financial statements at June 30, 2008 are the same as those used for the consolidated financial statements at December 31, 2007. The measurement of provisions for the back-end nuclear fuel cycle, decommissioning and last cores is sensitive to assumptions concerning costs, inflation rate, long-term

01/08/2008 16:14
Page 20 sur 52
discount rate, and disbursement schedules. A revised estimate is therefore established at each closing date to ensure that the amounts accrued correspond to the best estimate of the costs eventually to be borne by the Group. Any significant differences resulting from these revised estimates could entail changes in the amounts accrued (see note 24.2 to the condensed consolidated half-year financial statements). These provisions amount to € 30,868 million at June 30, 2008 (€30,484 million at December 31, 2007). 4.3 Seasonal nature of the business Interim sales and operating profit before depreciation and amortization are affected by significant seasonal factors in the first half of the calendar year, principally in France. This phenomenon varies according to weather conditions and the tariff structures of the period. Sales and operating profit before depreciation and amortization for the first half-years of 2008 and 2007 and the year 2007 are as follows: (in millions of euros)
1st half-year 2008
1st half-year 2007 2007
Sales 32,239 30,311 59,637
EBITDA 9,041 8,865 15,210
01/08/2008 16:14
Page 21 sur 52
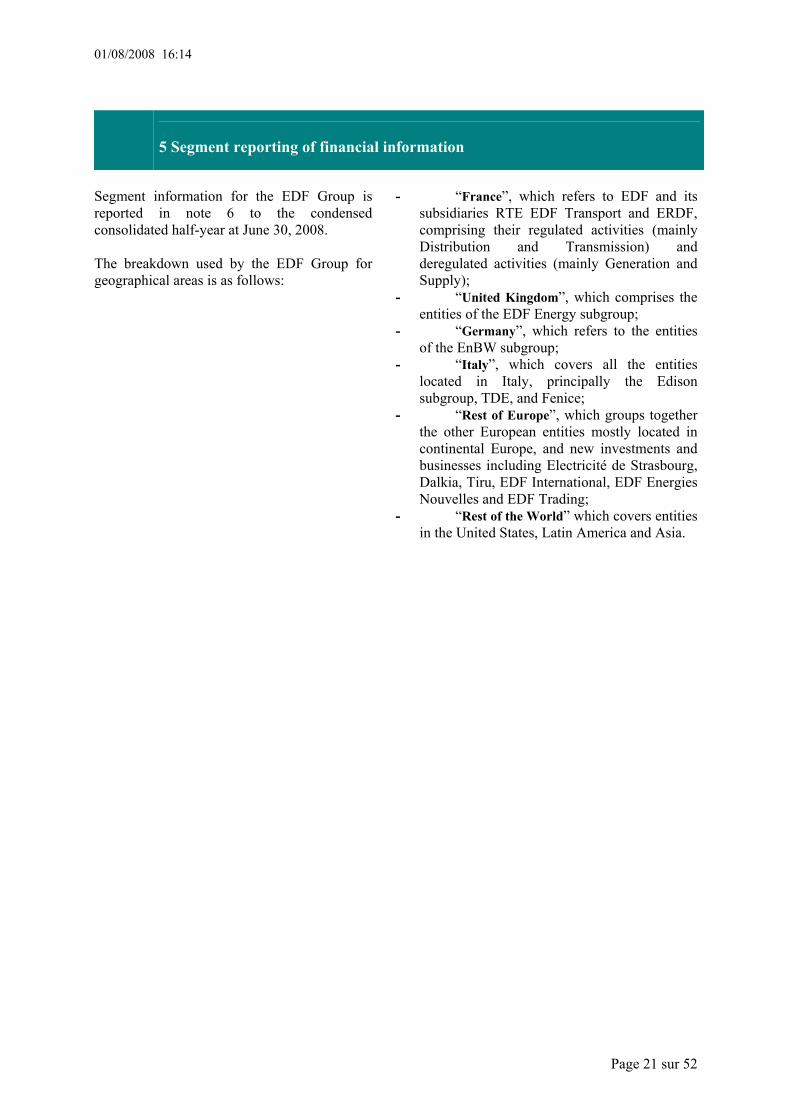
5 Segment reporting of financial information Segment information for the EDF Group is reported in note 6 to the condensed consolidated half-year at June 30, 2008. The breakdown used by the EDF Group for geographical areas is as follows:
- “France”, which refers to EDF and its subsidiaries RTE EDF Transport and ERDF, comprising their regulated activities (mainly Distribution and Transmission) and deregulated activities (mainly Generation and Supply);
- “United Kingdom”, which comprises the entities of the EDF Energy subgroup;
- “Germany”, which refers to the entities of the EnBW subgroup;
- “Italy”, which covers all the entities located in Italy, principally the Edison subgroup, TDE, and Fenice;
- “Rest of Europe”, which groups together the other European entities mostly located in continental Europe, and new investments and businesses including Electricité de Strasbourg, Dalkia, Tiru, EDF International, EDF Energies Nouvelles and EDF Trading;
- “Rest of the World” which covers entities in the United States, Latin America and Asia.
01/08/2008 16:14
Page 22 sur 52
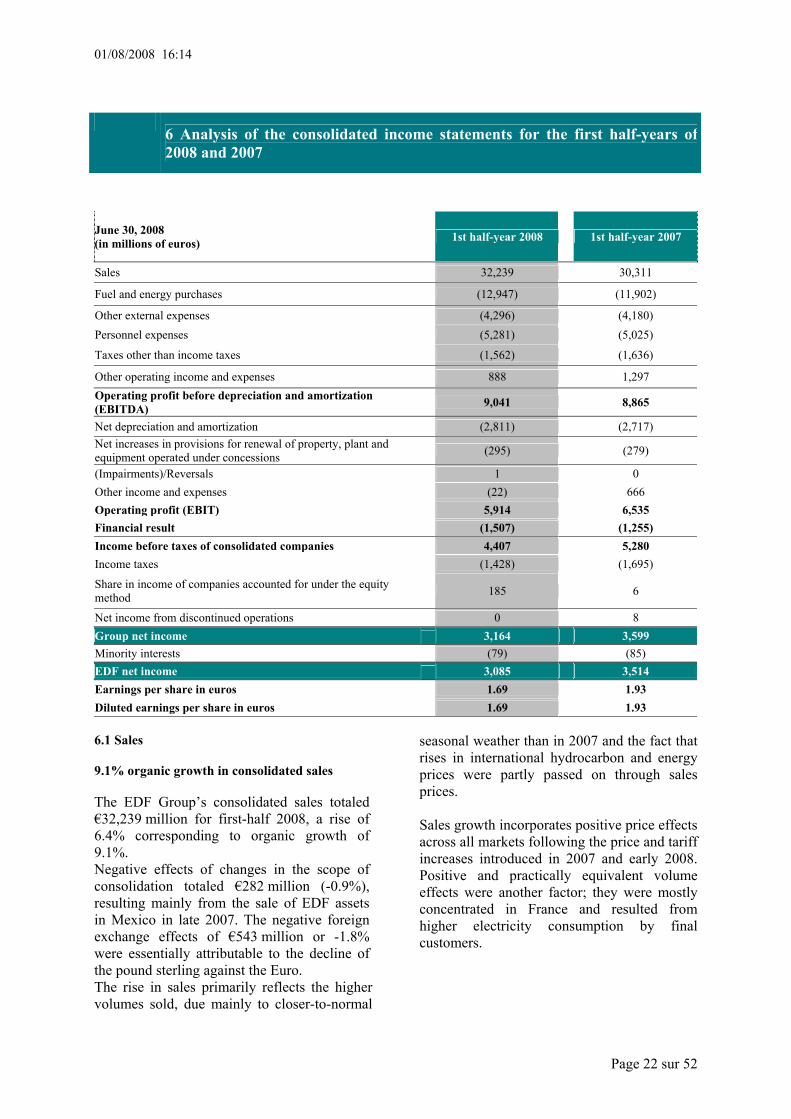
6.1 Sales 9.1% organic growth in consolidated sales The EDF Group’s consolidated sales totaled €32,239 million for first-half 2008, a rise of 6.4% corresponding to organic growth of 9.1%. Negative effects of changes in the scope of consolidation totaled €282 million (-0.9%), resulting mainly from the sale of EDF assets in Mexico in late 2007. The negative foreign exchange effects of €543 million or -1.8% were essentially attributable to the decline of the pound sterling against the Euro. The rise in sales primarily reflects the higher volumes sold, due mainly to closer-to-normal
seasonal weather than in 2007 and the fact that rises in international hydrocarbon and energy prices were partly passed on through sales prices. Sales growth incorporates positive price effects across all markets following the price and tariff increases introduced in 2007 and early 2008. Positive and practically equivalent volume effects were another factor; they were mostly concentrated in France and resulted from higher electricity consumption by final customers.
6 Analysis of the consolidated income statements for the first half-years of 2008 and 2007
June 30, 2008 (in millions of euros)
1st half-year 2008 1st half-year 2007
Sales 32,239 30,311
Fuel and energy purchases (12,947) (11,902)
Other external expenses (4,296) (4,180) Personnel expenses (5,281) (5,025)
Taxes other than income taxes (1,562) (1,636)
Other operating income and expenses 888 1,297 Operating profit before depreciation and amortization (EBITDA) 9,041 8,865
Net depreciation and amortization (2,811) (2,717) Net increases in provisions for renewal of property, plant and equipment operated under concessions (295) (279)
(Impairments)/Reversals 1 0 Other income and expenses (22) 666 Operating profit (EBIT) 5,914 6,535 Financial result (1,507) (1,255) Income before taxes of consolidated companies 4,407 5,280 Income taxes (1,428) (1,695)
Share in income of companies accounted for under the equity method 185 6
Net income from discontinued operations 0 8 Group net income 3,164 3,599 Minority interests (79) (85) EDF net income 3,085 3,514 Earnings per share in euros 1.69 1.93 Diluted earnings per share in euros 1.69 1.93
01/08/2008 16:14
Page 23 sur 52
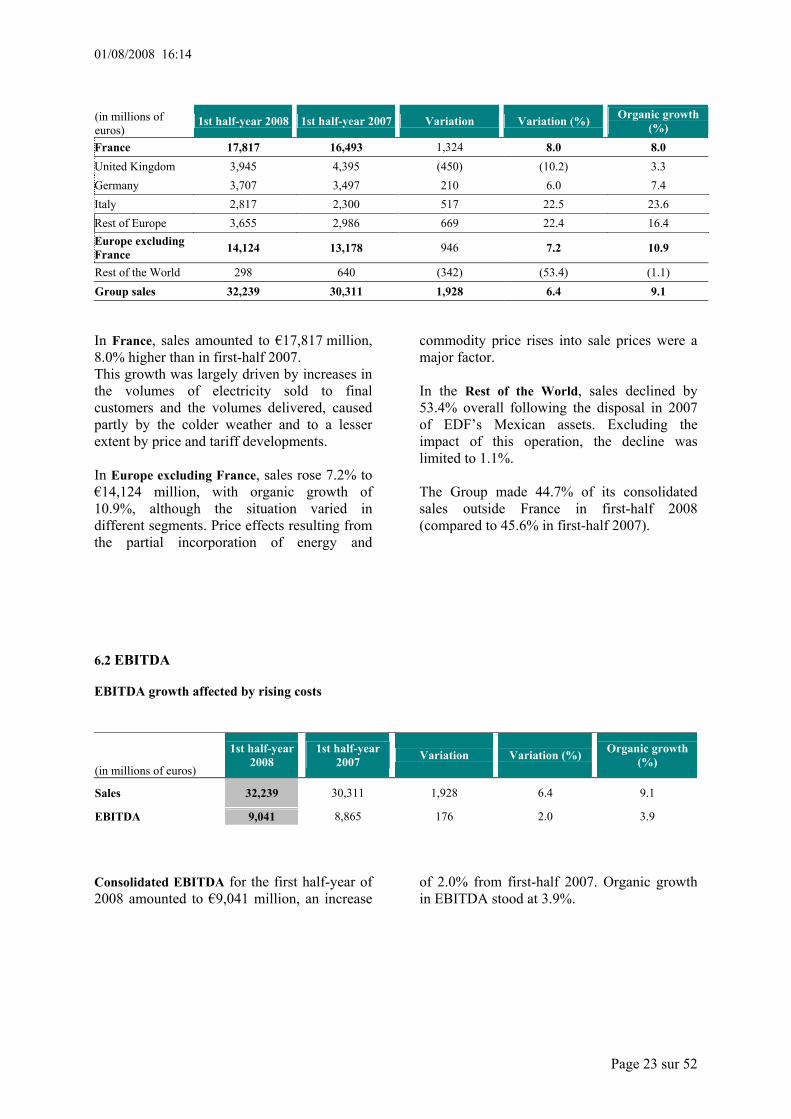
In France, sales amounted to €17,817 million, 8.0% higher than in first-half 2007. This growth was largely driven by increases in the volumes of electricity sold to final customers and the volumes delivered, caused partly by the colder weather and to a lesser extent by price and tariff developments. In Europe excluding France, sales rose 7.2% to €14,124 million, with organic growth of 10.9%, although the situation varied in different segments. Price effects resulting from the partial incorporation of energy and
commodity price rises into sale prices were a major factor. In the Rest of the World, sales declined by 53.4% overall following the disposal in 2007 of EDF’s Mexican assets. Excluding the impact of this operation, the decline was limited to 1.1%. The Group made 44.7% of its consolidated sales outside France in first-half 2008 (compared to 45.6% in first-half 2007).
6.2 EBITDA EBITDA growth affected by rising costs
(in millions of euros)
1st half-year 2008 1st half-year
2007 Variation Variation (%) Organic growth (%)
Sales 32,239 30,311 1,928 6.4 9.1
EBITDA 9,041 8,865 176 2.0 3.9 Consolidated EBITDA for the first half-year of 2008 amounted to €9,041 million, an increase
of 2.0% from first-half 2007. Organic growth in EBITDA stood at 3.9%.
(in millions of euros)
1st half-year 2008 1st half-year 2007 Variation Variation (%) Organic growth (%)
France 17,817 16,493 1,324 8.0 8.0 United Kingdom 3,945 4,395 (450) (10.2) 3.3 Germany 3,707 3,497 210 6.0 7.4 Italy 2,817 2,300 517 22.5 23.6 Rest of Europe 3,655 2,986 669 22.4 16.4 Europe excluding France 14,124 13,178 946 7.2 10.9
Rest of the World 298 640 (342) (53.4) (1.1) Group sales 32,239 30,311 1,928 6.4 9.1
01/08/2008 16:14
Page 24 sur 52
(in millions of euros) 1st half-year
2008 1st half-year 2007 Variation Variation (%) Organic growth (%)
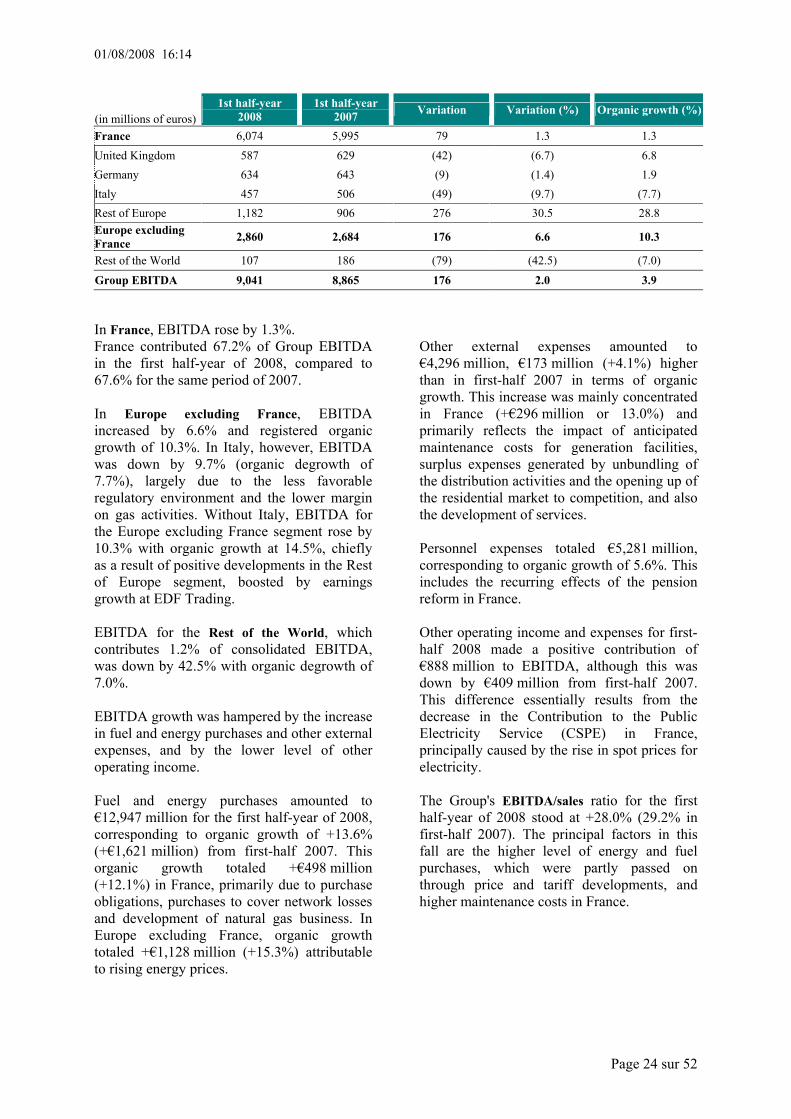
France 6,074 5,995 79 1.3 1.3 United Kingdom 587 629 (42) (6.7) 6.8 Germany 634 643 (9) (1.4) 1.9 Italy 457 506 (49) (9.7) (7.7) Rest of Europe 1,182 906 276 30.5 28.8 Europe excluding France 2,860 2,684 176 6.6 10.3
Rest of the World 107 186 (79) (42.5) (7.0)
Group EBITDA 9,041 8,865 176 2.0 3.9 In France, EBITDA rose by 1.3%. France contributed 67.2% of Group EBITDA in the first half-year of 2008, compared to 67.6% for the same period of 2007. In Europe excluding France, EBITDA increased by 6.6% and registered organic growth of 10.3%. In Italy, however, EBITDA was down by 9.7% (organic degrowth of 7.7%), largely due to the less favorable regulatory environment and the lower margin on gas activities. Without Italy, EBITDA for the Europe excluding France segment rose by 10.3% with organic growth at 14.5%, chiefly as a result of positive developments in the Rest of Europe segment, boosted by earnings growth at EDF Trading. EBITDA for the Rest of the World, which contributes 1.2% of consolidated EBITDA, was down by 42.5% with organic degrowth of 7.0%. EBITDA growth was hampered by the increase in fuel and energy purchases and other external expenses, and by the lower level of other operating income. Fuel and energy purchases amounted to €12,947 million for the first half-year of 2008, corresponding to organic growth of +13.6% (+€1,621 million) from first-half 2007. This organic growth totaled +€498 million (+12.1%) in France, primarily due to purchase obligations, purchases to cover network losses and development of natural gas business. In Europe excluding France, organic growth totaled +€1,128 million (+15.3%) attributable to rising energy prices.
Other external expenses amounted to €4,296 million, €173 million (+4.1%) higher than in first-half 2007 in terms of organic growth. This increase was mainly concentrated in France (+€296 million or 13.0%) and primarily reflects the impact of anticipated maintenance costs for generation facilities, surplus expenses generated by unbundling of the distribution activities and the opening up of the residential market to competition, and also the development of services. Personnel expenses totaled €5,281 million, corresponding to organic growth of 5.6%. This includes the recurring effects of the pension reform in France. Other operating income and expenses for first-half 2008 made a positive contribution of €888 million to EBITDA, although this was down by €409 million from first-half 2007. This difference essentially results from the decrease in the Contribution to the Public Electricity Service (CSPE) in France, principally caused by the rise in spot prices for electricity. The Group's EBITDA/sales ratio for the first half-year of 2008 stood at +28.0% (29.2% in first-half 2007). The principal factors in this fall are the higher level of energy and fuel purchases, which were partly passed on through price and tariff developments, and higher maintenance costs in France.
01/08/2008 16:14
Page 25 sur 52
6.3 EBIT 9.5% decline in EBIT
(in millions of euros) 1st half-year 2008
1st half-year 2007 Variation Variation (%)
EBITDA 9,041 8,865 176 2.0 Net depreciation and amortization (2,811) (2,717) (94) 3.5
Net increases in provisions for renewal of property, plant and equipment operated under concessions
(295) (279) (16) 5.7
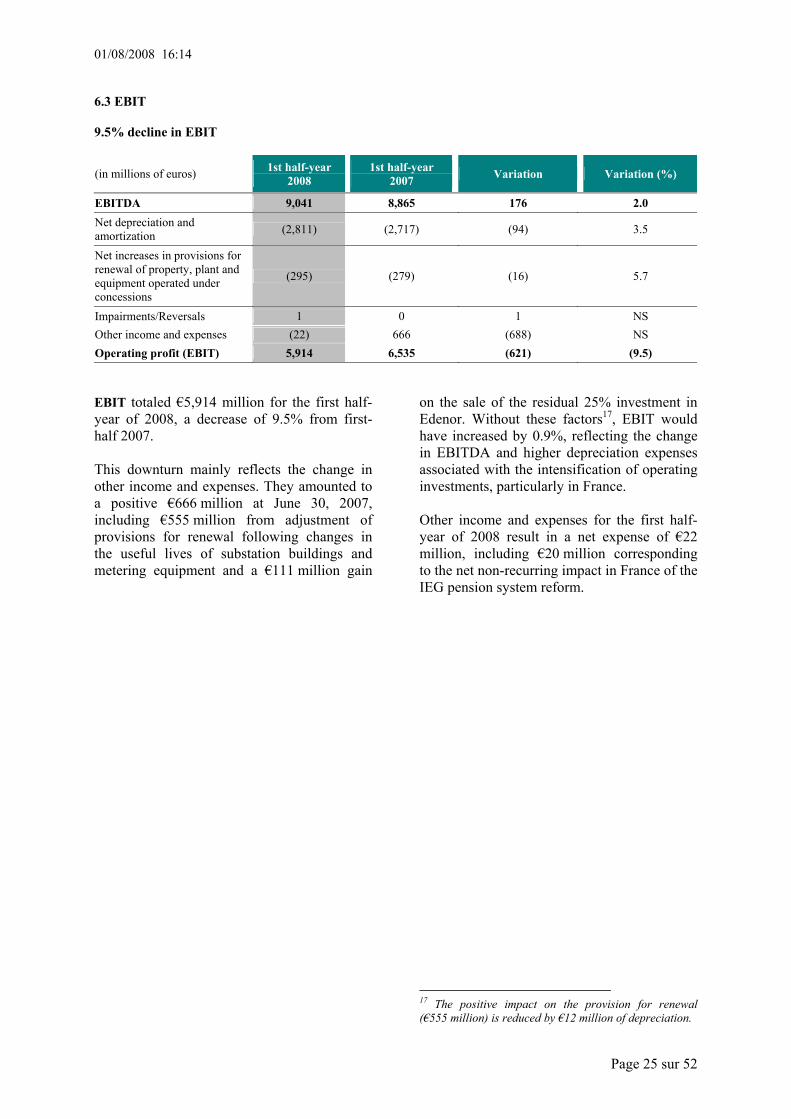
Impairments/Reversals 1 0 1 NS Other income and expenses (22) 666 (688) NS Operating profit (EBIT) 5,914 6,535 (621) (9.5) EBIT totaled €5,914 million for the first half-year of 2008, a decrease of 9.5% from first-half 2007. This downturn mainly reflects the change in other income and expenses. They amounted to a positive €666 million at June 30, 2007, including €555 million from adjustment of provisions for renewal following changes in the useful lives of substation buildings and metering equipment and a €111 million gain
on the sale of the residual 25% investment in Edenor. Without these factors17, EBIT would have increased by 0.9%, reflecting the change in EBITDA and higher depreciation expenses associated with the intensification of operating investments, particularly in France. Other income and expenses for the first half-year of 2008 result in a net expense of €22 million, including €20 million corresponding to the net non-recurring impact in France of the IEG pension system reform.
17 The positive impact on the provision for renewal (€555 million) is reduced by €12 million of depreciation.
01/08/2008 16:14
Page 26 sur 52
6.4 Financial result (in millions of euros) 1st half-year 2008 1st half-year 2007 Variation Variation (%)
Cost of gross financial indebtedness (761) (750) (11) (1.5)
Discount expense (1,420) (1,314) (106) (8.1)
Other financial income and expenses 674 809 (135) (16.7)
Financial result (1,507) (1,255) (252) (20.1)
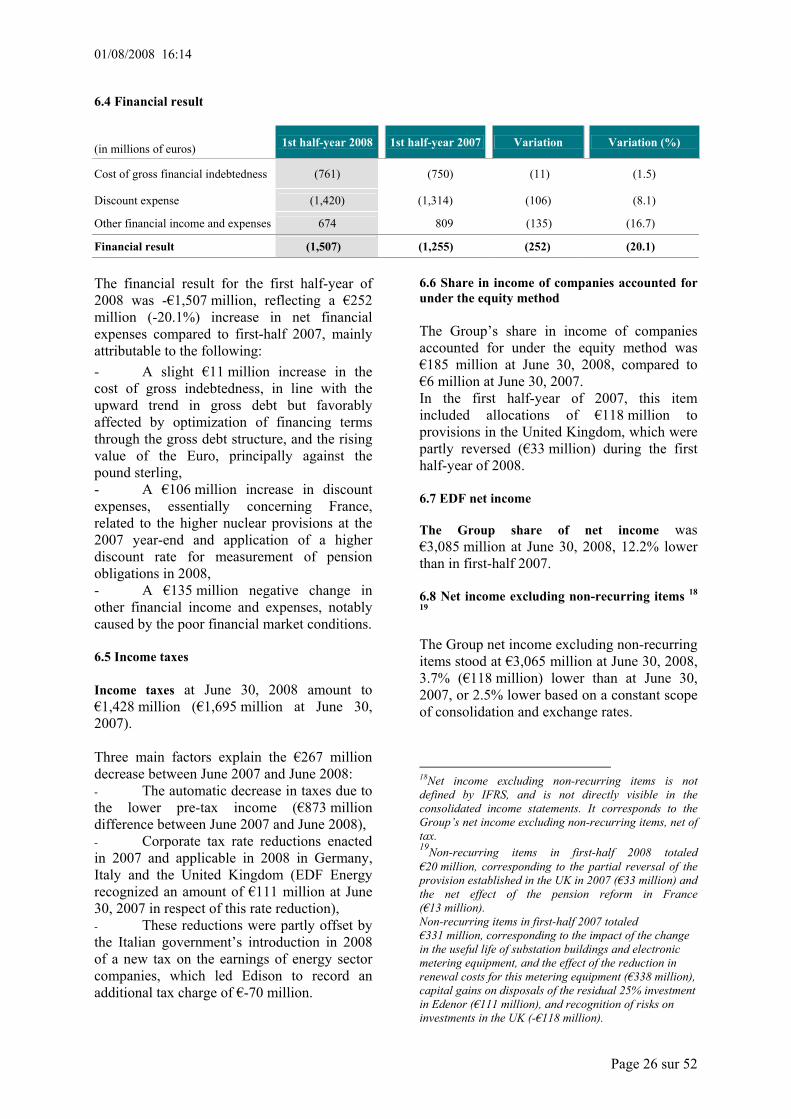
The financial result for the first half-year of 2008 was -€1,507 million, reflecting a €252 million (-20.1%) increase in net financial expenses compared to first-half 2007, mainly attributable to the following: - A slight €11 million increase in the cost of gross indebtedness, in line with the upward trend in gross debt but favorably affected by optimization of financing terms through the gross debt structure, and the rising value of the Euro, principally against the pound sterling, - A €106 million increase in discount expenses, essentially concerning France, related to the higher nuclear provisions at the 2007 year-end and application of a higher discount rate for measurement of pension obligations in 2008, - A €135 million negative change in other financial income and expenses, notably caused by the poor financial market conditions. 6.5 Income taxes Income taxes at June 30, 2008 amount to €1,428 million (€1,695 million at June 30, 2007). Three main factors explain the €267 million decrease between June 2007 and June 2008: - The automatic decrease in taxes due to the lower pre-tax income (€873 million difference between June 2007 and June 2008), - Corporate tax rate reductions enacted in 2007 and applicable in 2008 in Germany, Italy and the United Kingdom (EDF Energy recognized an amount of €111 million at June 30, 2007 in respect of this rate reduction), - These reductions were partly offset by the Italian government’s introduction in 2008 of a new tax on the earnings of energy sector companies, which led Edison to record an additional tax charge of €-70 million.
6.6 Share in income of companies accounted for under the equity method The Group’s share in income of companies accounted for under the equity method was €185 million at June 30, 2008, compared to €6 million at June 30, 2007. In the first half-year of 2007, this item included allocations of €118 million to provisions in the United Kingdom, which were partly reversed (€33 million) during the first half-year of 2008. 6.7 EDF net income The Group share of net income was €3,085 million at June 30, 2008, 12.2% lower than in first-half 2007. 6.8 Net income excluding non-recurring items 18 19 The Group net income excluding non-recurring items stood at €3,065 million at June 30, 2008, 3.7% (€118 million) lower than at June 30, 2007, or 2.5% lower based on a constant scope of consolidation and exchange rates. 18Net income excluding non-recurring items is not defined by IFRS, and is not directly visible in the consolidated income statements. It corresponds to the Group’s net income excluding non-recurring items, net of tax. 19Non-recurring items in first-half 2008 totaled €20 million, corresponding to the partial reversal of the provision established in the UK in 2007 (€33 million) and the net effect of the pension reform in France (€13 million). Non-recurring items in first-half 2007 totaled €331 million, corresponding to the impact of the change in the useful life of substation buildings and electronic metering equipment, and the effect of the reduction in renewal costs for this metering equipment (€338 million), capital gains on disposals of the residual 25% investment in Edenor (€111 million), and recognition of risks on investments in the UK (-€118 million).
01/08/2008 16:14
Page 27 sur 52
7 Breakdown of EBIT by geographical area
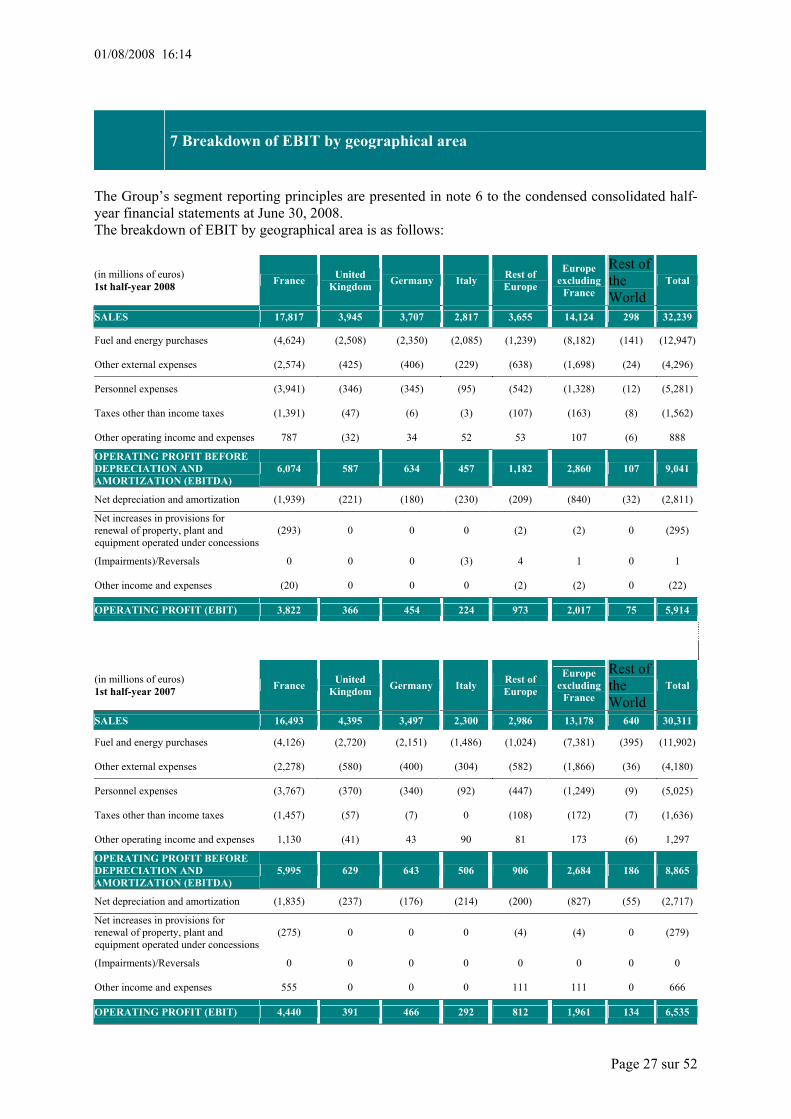
The Group’s segment reporting principles are presented in note 6 to the condensed consolidated half-year financial statements at June 30, 2008. The breakdown of EBIT by geographical area is as follows:
(in millions of euros) 1st half-year 2008 France United
Kingdom Germany Italy Rest of Europe
Europe excluding
France Rest of the World
Total
SALES 17,817 3,945 3,707 2,817 3,655 14,124 298 32,239
Fuel and energy purchases (4,624) (2,508) (2,350) (2,085) (1,239) (8,182) (141) (12,947)
Other external expenses (2,574) (425) (406) (229) (638) (1,698) (24) (4,296)
Personnel expenses (3,941) (346) (345) (95) (542) (1,328) (12) (5,281)
Taxes other than income taxes (1,391) (47) (6) (3) (107) (163) (8) (1,562)
Other operating income and expenses 787 (32) 34 52 53 107 (6) 888
OPERATING PROFIT BEFORE DEPRECIATION AND AMORTIZATION (EBITDA)
6,074 587 634 457 1,182 2,860 107 9,041
Net depreciation and amortization (1,939) (221) (180) (230) (209) (840) (32) (2,811)
Net increases in provisions for renewal of property, plant and equipment operated under concessions
(293) 0 0 0 (2) (2) 0 (295)
(Impairments)/Reversals 0 0 0 (3) 4 1 0 1
Other income and expenses (20) 0 0 0 (2) (2) 0 (22)
OPERATING PROFIT (EBIT) 3,822 366 454 224 973 2,017 75 5,914
(in millions of euros) 1st half-year 2007 France United
Kingdom Germany Italy Rest of Europe
Europe excluding
France Rest of the World
Total
SALES 16,493 , 4,395 , 3,497 , 2,300 , 2,986 , 13,178 , 640 , 30,311
Fuel and energy purchases (4,126) (2,720) (2,151) (1,486) (1,024) (7,381) (395) (11,902)
Other external expenses (2,278) (580) (400) (304) (582) (1,866) (36) (4,180)
Personnel expenses (3,767) (370) (340) (92) (447) (1,249) (9) (5,025)
Taxes other than income taxes (1,457) (57) (7) 0 (108) (172) (7) (1,636)
Other operating income and expenses 1,130 (41) 43 90 81 173 (6) 1,297
OPERATING PROFIT BEFORE DEPRECIATION AND AMORTIZATION (EBITDA)
5,995 , 629 , 643 , 506 , 906 , 2,684 , 186 , 8,865
Net depreciation and amortization (1,835) (237) (176) (214) (200) (827) (55) (2,717)
Net increases in provisions for renewal of property, plant and equipment operated under concessions
(275) 0 0 0 (4) (4) 0 (279)
(Impairments)/Reversals 0 0 0 0 0 0 0 0
Other income and expenses 555 0 0 0 111 111 0 666
OPERATING PROFIT (EBIT) 4,440 , 391 , 466 , 292 , 812 , 1,961 , 134 , 6,535
01/08/2008 16:14
Page 28 sur 52
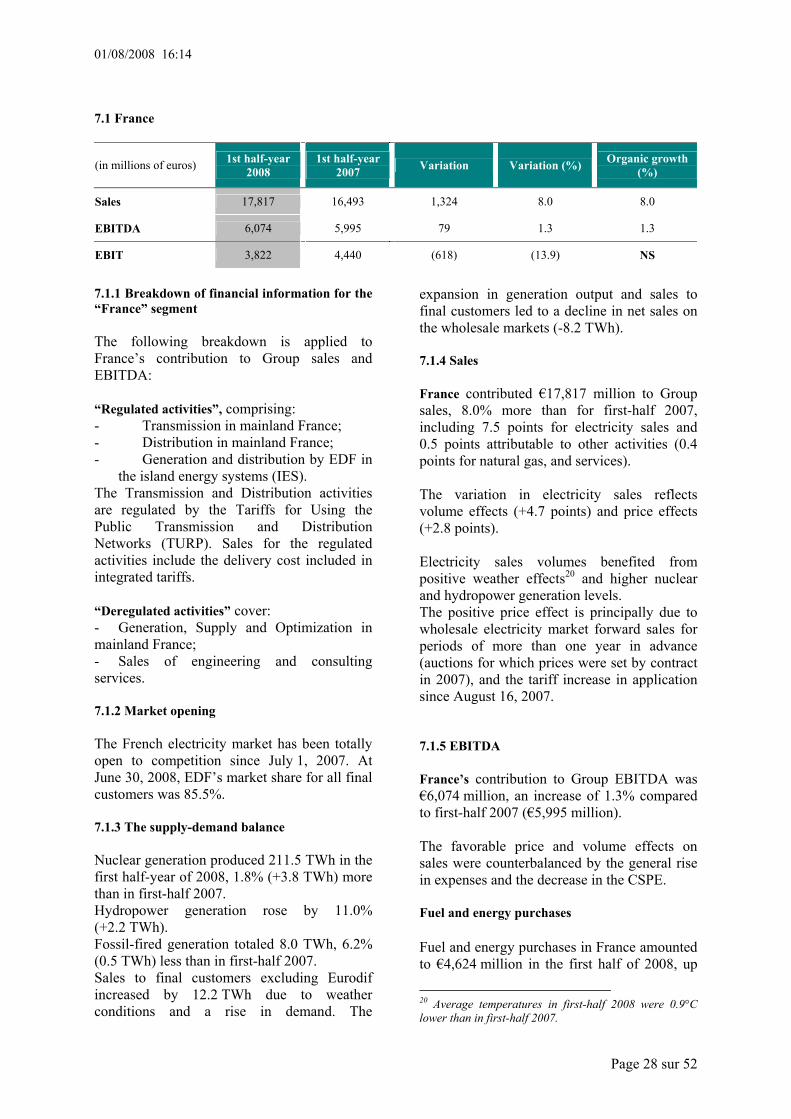
7.1 France
(in millions of euros) 1st half-year 2008 1st half-year
2007 Variation Variation (%) Organic growth (%)
Sales 17,817 16,493 1,324 8.0 8.0
EBITDA 6,074 5,995 79 1.3 1.3
EBIT 3,822 4,440 (618) (13.9) NS
7.1.1 Breakdown of financial information for the “France” segment The following breakdown is applied to France’s contribution to Group sales and EBITDA: “Regulated activities”, comprising: - Transmission in mainland France; - Distribution in mainland France; - Generation and distribution by EDF in
the island energy systems (IES). The Transmission and Distribution activities are regulated by the Tariffs for Using the Public Transmission and Distribution Networks (TURP). Sales for the regulated activities include the delivery cost included in integrated tariffs. “Deregulated activities” cover: - Generation, Supply and Optimization in mainland France; - Sales of engineering and consulting services. 7.1.2 Market opening The French electricity market has been totally open to competition since July 1, 2007. At June 30, 2008, EDF’s market share for all final customers was 85.5%. 7.1.3 The supply-demand balance Nuclear generation produced 211.5 TWh in the first half-year of 2008, 1.8% (+3.8 TWh) more than in first-half 2007. Hydropower generation rose by 11.0% (+2.2 TWh). Fossil-fired generation totaled 8.0 TWh, 6.2% (0.5 TWh) less than in first-half 2007. Sales to final customers excluding Eurodif increased by 12.2 TWh due to weather conditions and a rise in demand. The
expansion in generation output and sales to final customers led to a decline in net sales on the wholesale markets (-8.2 TWh). 7.1.4 Sales France contributed €17,817 million to Group sales, 8.0% more than for first-half 2007, including 7.5 points for electricity sales and 0.5 points attributable to other activities (0.4 points for natural gas, and services). The variation in electricity sales reflects volume effects (+4.7 points) and price effects (+2.8 points). Electricity sales volumes benefited from positive weather effects20 and higher nuclear and hydropower generation levels. The positive price effect is principally due to wholesale electricity market forward sales for periods of more than one year in advance (auctions for which prices were set by contract in 2007), and the tariff increase in application since August 16, 2007. 7.1.5 EBITDA France’s contribution to Group EBITDA was €6,074 million, an increase of 1.3% compared to first-half 2007 (€5,995 million). The favorable price and volume effects on sales were counterbalanced by the general rise in expenses and the decrease in the CSPE. Fuel and energy purchases Fuel and energy purchases in France amounted to €4,624 million in the first half of 2008, up
20 Average temperatures in first-half 2008 were 0.9°C lower than in first-half 2007.

01/08/2008 16:14
Page 29 sur 52
by €498 million (12.1%) compared to the same period of 2007. Most of this increase results from the higher prices and volumes of purchase obligations21 attributable to higher gas prices and development of wind power, the greater cost of energy purchases to compensate for network losses, and an increase in gas purchases associated with expanding sales. Other external expenses and personnel expenses Other external expenses amounted to €2,574 million, 13.0% higher than in first-half 2007. This increase is principally explained by the rise in maintenance costs for the nuclear plants, additional costs generated by the separation of distribution activities and the opening of the residential market to competition, and to a smaller degree, expenses associated with the development of service activities. Personnel expenses totaled €3,941 million, 4.6% higher than in the first half-year of 2007, including 2.8 points attributable to the recurring impact of support measures for the pension reform. Excluding this effect, personnel expenses increased by 1.8%. Productivity gains partly offset the rise in salaries and the impact on workforce numbers of expansion in the new activities (international nuclear business, services, energy savings certificates).
21 EDF’s electricity purchase obligations in application of the Law of February 10, 2000, mostly concerning electricity produced by cogeneration facilities and wind farms.
Taxes other than income taxes These taxes were down by 4.5% (€66 million), principally as a result of new rules for the upper limit on business tax. Other operating income and expenses Other operating income and expenses decreased by €343 million, mainly due to the lower level of compensation receivable for the additional costs generated by electricity purchase obligations in mainland France. These additional costs are based on the differential between spot market prices and the effective cost of EDF’s purchases from producers covered by the CSPE system (Contribution to the public electricity service - Contribution au Service Public de l’Electricité), and declined because of the rise in spot prices (€65/MWh in first-half 2008 compared to €30/MWh for first-half 2007).
01/08/2008 16:14
Page 30 sur 52
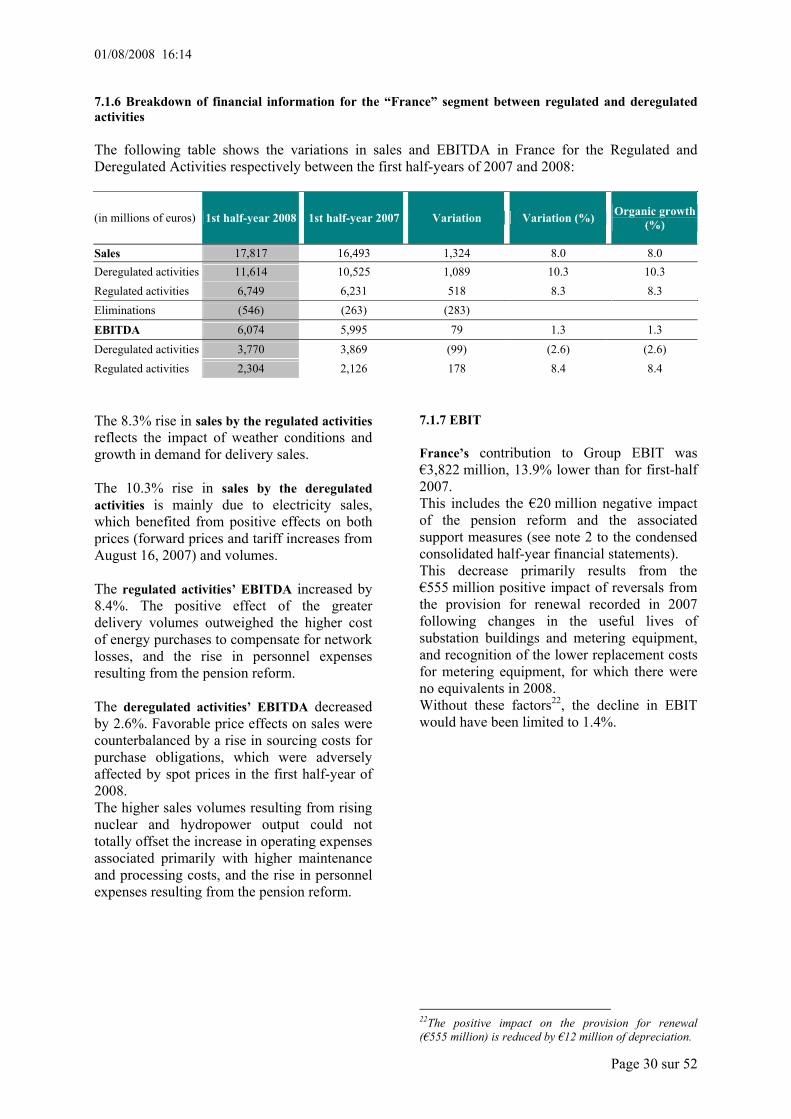
7.1.6 Breakdown of financial information for the “France” segment between regulated and deregulated activities The following table shows the variations in sales and EBITDA in France for the Regulated and Deregulated Activities respectively between the first half-years of 2007 and 2008:
(in millions of euros) 1st half-year 2008 1st half-year 2007 Variation Variation (%) Organic growth (%)
Sales 17,817 16,493 1,324 8.0 8.0 Deregulated activities 11,614 10,525 1,089 10.3 10.3 Regulated activities 6,749 6,231 518 8.3 8.3 Eliminations (546) (263) (283)
EBITDA 6,074 5,995 79 1.3 1.3 Deregulated activities 3,770 3,869 (99) (2.6) (2.6) Regulated activities 2,304 2,126 178 8.4 8.4 The 8.3% rise in sales by the regulated activities reflects the impact of weather conditions and growth in demand for delivery sales. The 10.3% rise in sales by the deregulated activities is mainly due to electricity sales, which benefited from positive effects on both prices (forward prices and tariff increases from August 16, 2007) and volumes. The regulated activities’ EBITDA increased by 8.4%. The positive effect of the greater delivery volumes outweighed the higher cost of energy purchases to compensate for network losses, and the rise in personnel expenses resulting from the pension reform. The deregulated activities’ EBITDA decreased by 2.6%. Favorable price effects on sales were counterbalanced by a rise in sourcing costs for purchase obligations, which were adversely affected by spot prices in the first half-year of 2008. The higher sales volumes resulting from rising nuclear and hydropower output could not totally offset the increase in operating expenses associated primarily with higher maintenance and processing costs, and the rise in personnel expenses resulting from the pension reform.
7.1.7 EBIT France’s contribution to Group EBIT was €3,822 million, 13.9% lower than for first-half 2007. This includes the €20 million negative impact of the pension reform and the associated support measures (see note 2 to the condensed consolidated half-year financial statements). This decrease primarily results from the €555 million positive impact of reversals from the provision for renewal recorded in 2007 following changes in the useful lives of substation buildings and metering equipment, and recognition of the lower replacement costs for metering equipment, for which there were no equivalents in 2008. Without these factors22, the decline in EBIT would have been limited to 1.4%.
22The positive impact on the provision for renewal (€555 million) is reduced by €12 million of depreciation.
01/08/2008 16:14
Page 31 sur 52
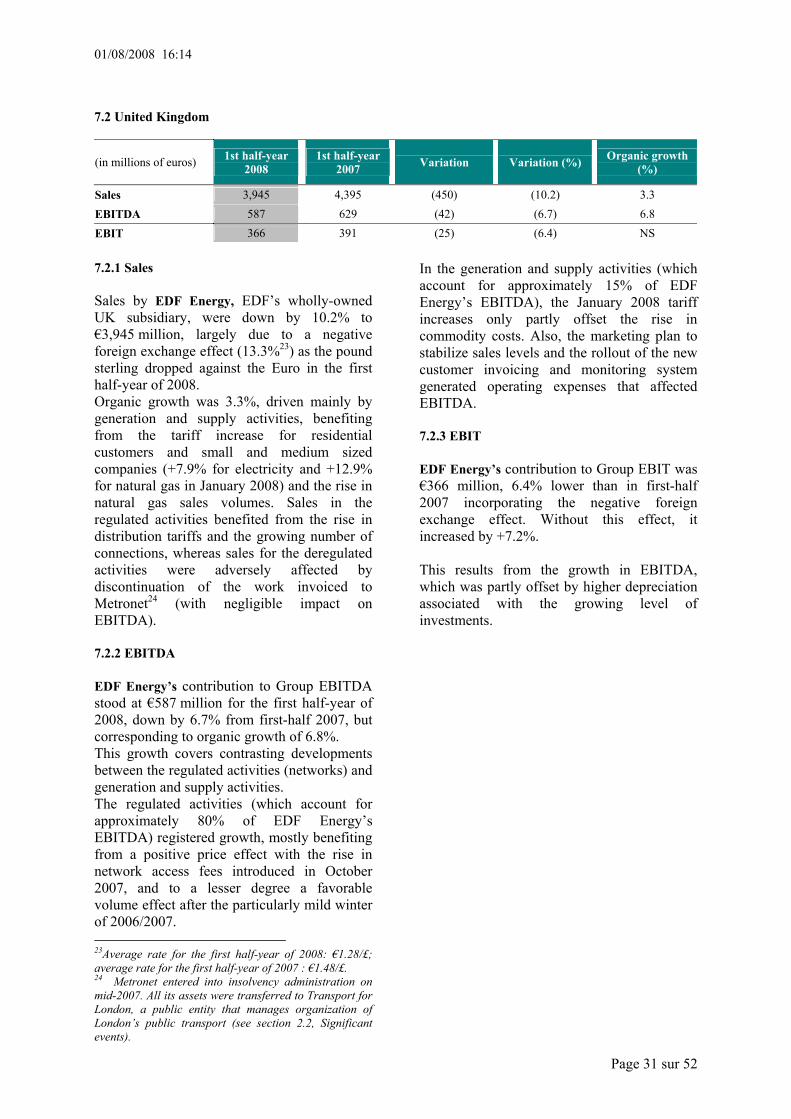
7.2 United Kingdom
(in millions of euros) 1st half-year 2008 1st half-year
2007 Variation Variation (%) Organic growth (%)
Sales 3,945 4,395 (450) (10.2) 3.3 EBITDA 587 629 (42) (6.7) 6.8 EBIT 366 391 (25) (6.4) NS 7.2.1 Sales Sales by EDF Energy, EDF’s wholly-owned UK subsidiary, were down by 10.2% to €3,945 million, largely due to a negative foreign exchange effect (13.3%23) as the pound sterling dropped against the Euro in the first half-year of 2008. Organic growth was 3.3%, driven mainly by generation and supply activities, benefiting from the tariff increase for residential customers and small and medium sized companies (+7.9% for electricity and +12.9% for natural gas in January 2008) and the rise in natural gas sales volumes. Sales in the regulated activities benefited from the rise in distribution tariffs and the growing number of connections, whereas sales for the deregulated activities were adversely affected by discontinuation of the work invoiced to Metronet24 (with negligible impact on EBITDA). 7.2.2 EBITDA EDF Energy’s contribution to Group EBITDA stood at €587 million for the first half-year of 2008, down by 6.7% from first-half 2007, but corresponding to organic growth of 6.8%. This growth covers contrasting developments between the regulated activities (networks) and generation and supply activities. The regulated activities (which account for approximately 80% of EDF Energy’s EBITDA) registered growth, mostly benefiting from a positive price effect with the rise in network access fees introduced in October 2007, and to a lesser degree a favorable volume effect after the particularly mild winter of 2006/2007. 23Average rate for the first half-year of 2008: €1.28/£; average rate for the first half-year of 2007 : €1.48/£. 24 Metronet entered into insolvency administration on mid-2007. All its assets were transferred to Transport for London, a public entity that manages organization of London’s public transport (see section 2.2, Significant events).
In the generation and supply activities (which account for approximately 15% of EDF Energy’s EBITDA), the January 2008 tariff increases only partly offset the rise in commodity costs. Also, the marketing plan to stabilize sales levels and the rollout of the new customer invoicing and monitoring system generated operating expenses that affected EBITDA. 7.2.3 EBIT EDF Energy’s contribution to Group EBIT was €366 million, 6.4% lower than in first-half 2007 incorporating the negative foreign exchange effect. Without this effect, it increased by +7.2%. This results from the growth in EBITDA, which was partly offset by higher depreciation associated with the growing level of investments.
01/08/2008 16:14
Page 32 sur 52
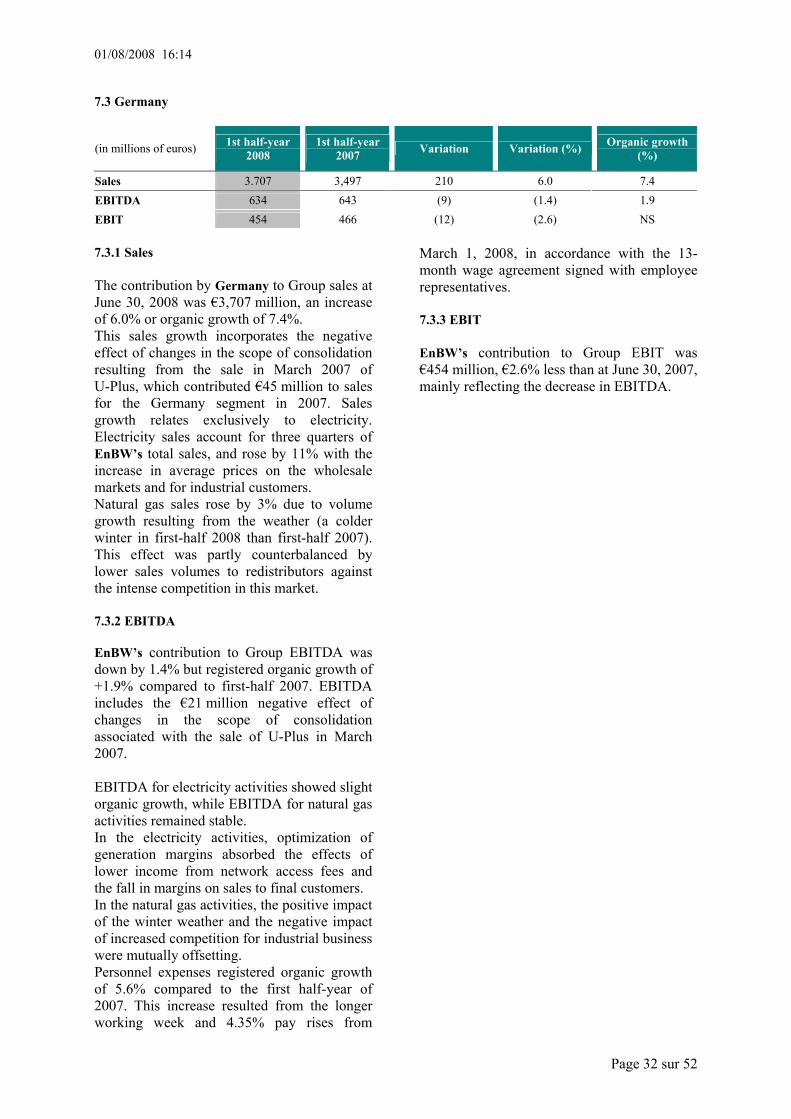
7.3 Germany
(in millions of euros) 1st half-year 2008 1st half-year
2007 Variation Variation (%) Organic growth (%)
Sales 3.707 3,497 210 6.0 7.4 EBITDA 634 643 (9) (1.4) 1.9 EBIT 454 466 (12) (2.6) NS 7.3.1 Sales The contribution by Germany to Group sales at June 30, 2008 was €3,707 million, an increase of 6.0% or organic growth of 7.4%. This sales growth incorporates the negative effect of changes in the scope of consolidation resulting from the sale in March 2007 of U-Plus, which contributed €45 million to sales for the Germany segment in 2007. Sales growth relates exclusively to electricity. Electricity sales account for three quarters of EnBW’s total sales, and rose by 11% with the increase in average prices on the wholesale markets and for industrial customers. Natural gas sales rose by 3% due to volume growth resulting from the weather (a colder winter in first-half 2008 than first-half 2007). This effect was partly counterbalanced by lower sales volumes to redistributors against the intense competition in this market. 7.3.2 EBITDA EnBW’s contribution to Group EBITDA was down by 1.4% but registered organic growth of +1.9% compared to first-half 2007. EBITDA includes the €21 million negative effect of changes in the scope of consolidation associated with the sale of U-Plus in March 2007. EBITDA for electricity activities showed slight organic growth, while EBITDA for natural gas activities remained stable. In the electricity activities, optimization of generation margins absorbed the effects of lower income from network access fees and the fall in margins on sales to final customers. In the natural gas activities, the positive impact of the winter weather and the negative impact of increased competition for industrial business were mutually offsetting. Personnel expenses registered organic growth of 5.6% compared to the first half-year of 2007. This increase resulted from the longer working week and 4.35% pay rises from
March 1, 2008, in accordance with the 13-month wage agreement signed with employee representatives. 7.3.3 EBIT EnBW’s contribution to Group EBIT was €454 million, €2.6% less than at June 30, 2007, mainly reflecting the decrease in EBITDA.

01/08/2008 16:14
Page 33 sur 52
7.4 Italy
(in millions of euros) 1st half-year 2008 1st half-year
2007 Variation Variation (%) Organic growth (%)
Sales 2,817 2,300 517 22.5 23.6 EBITDA 457 506 (49) (9.7) (7.7) EBIT 224 292 (68) (23.3) NS 7.4.1 Sales Italy25 contributed €2,817 million to consolidated sales, a 22.5% increase or organic growth of 23.6% from first-half 2007 against rising energy costs. Sales by Fenice were up by €52 million (19.5%), principally thanks to the new cogeneration plants and new investments that came into operation, but also because the winter in 2008 was colder than in the first half-year of 2007. Edison registered sales growth of €465 million, driven by both electricity and gas activities. Electricity sales growth was essentially attributable to the rise in market prices and the higher quantities sold on the wholesale markets, which were partly offset by the lower quantities sold to final customers. In the gas activities, growth resulted from a significant price effect caused by the sharp rise in hydrocarbon prices, which was partly passed on through sales prices and more than offset a small volume effect. The effect of changes in the scope of consolidation following the sale of 7 thermoelectric plants in April 2008 amounted to -€11 million. 7.4.2 EBITDA The Italy segment contributed €457 million to the Group’s consolidated EBITDA, a decrease of 9.7% compared to the first half-year of 2007. Fenice’s contribution to EBITDA amounted to €65 million at June 30, 2008, €7 million or 12.1% more than the equivalent period of 2007. This increase was mainly due to productivity gains and the start of operation for new projects. 25 Operations of the Italy segment are located in the Edison Group and Fenice.
Edison’s contribution to EBITDA amounted to €393 million compared to €449 million for first-half 2007, a decline of €56 million. The lower margins on gas activities were partly offset by a slight increase in EBITDA for the electricity activities. The contribution by the gas activities registered a decline resulting from both a reversal from provisions in the first half-year of 2007 and the fall in margins in the first half-year of 2008, as commodity price rises were not entirely passed on to final customers. For the electricity activities, good sales performances on the wholesale markets were partly counterbalanced by the scheduled reduction of subsidies for CIP6 plants, the rise in costs related to CO2 emission quotas, and the adverse effects of the AFC (Avoided Fuel Cost) indexing applied to CIP6 tariffs. 7.4.3 EBIT Italy’s contribution to consolidated EBIT stood at €224 million, down by €68 million due to changes in EBITDA and higher depreciation charges.
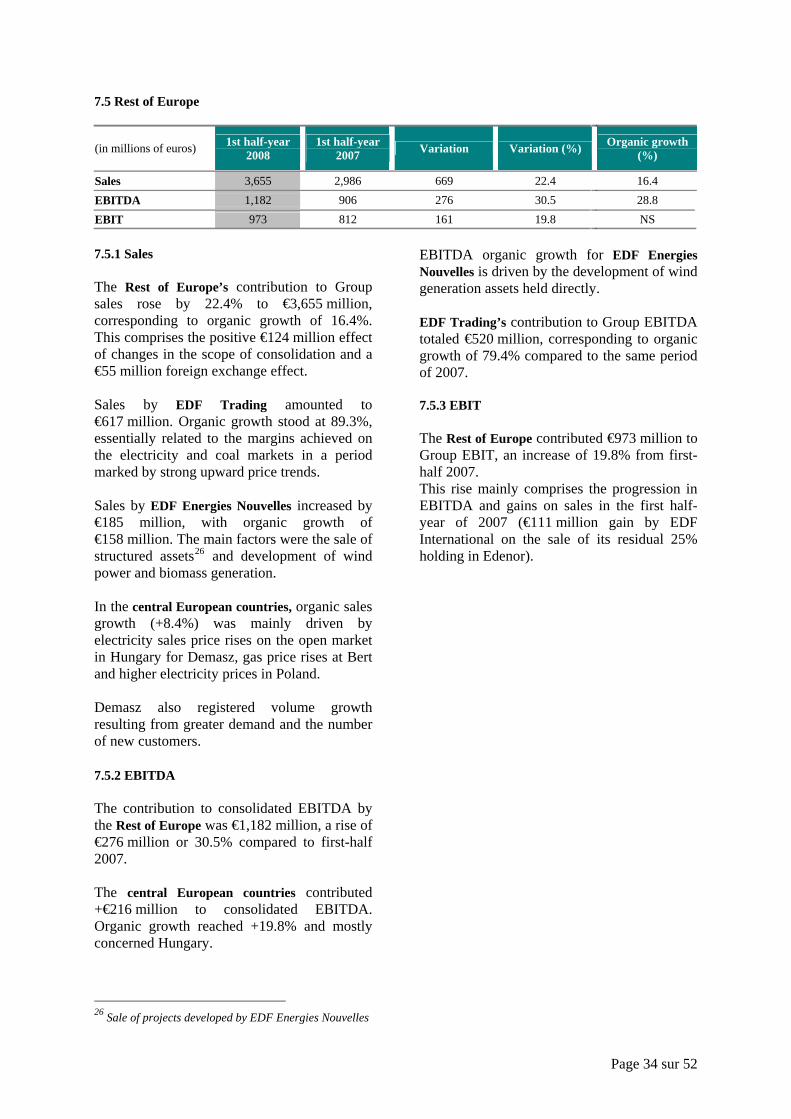
7.5 Rest of Europe
(in millions of euros) 1st half-year 2008 1st half-year
2007 Variation Variation (%) Organic growth (%)
Sales 3,655 2,986 669 22.4 16.4 EBITDA 1,182 906 276 30.5 28.8 EBIT 973 812 161 19.8 NS 7.5.1 Sales The Rest of Europe’s contribution to Group sales rose by 22.4% to €3,655 million, corresponding to organic growth of 16.4%. This comprises the positive €124 million effect of changes in the scope of consolidation and a €55 million foreign exchange effect. Sales by EDF Trading amounted to €617 million. Organic growth stood at 89.3%, essentially related to the margins achieved on the electricity and coal markets in a period marked by strong upward price trends. Sales by EDF Energies Nouvelles increased by €185 million, with organic growth of €158 million. The main factors were the sale of structured assets26 and development of wind power and biomass generation. In the central European countries, organic sales growth (+8.4%) was mainly driven by electricity sales price rises on the open market in Hungary for Demasz, gas price rises at Bert and higher electricity prices in Poland. Demasz also registered volume growth resulting from greater demand and the number of new customers. 7.5.2 EBITDA The contribution to consolidated EBITDA by the Rest of Europe was €1,182 million, a rise of €276 million or 30.5% compared to first-half 2007. The central European countries contributed +€216 million to consolidated EBITDA. Organic growth reached +19.8% and mostly concerned Hungary.
26 Sale of projects developed by EDF Energies Nouvelles
EBITDA organic growth for EDF Energies Nouvelles is driven by the development of wind generation assets held directly. EDF Trading’s contribution to Group EBITDA totaled €520 million, corresponding to organic growth of 79.4% compared to the same period of 2007. 7.5.3 EBIT The Rest of Europe contributed €973 million to Group EBIT, an increase of 19.8% from first-half 2007. This rise mainly comprises the progression in EBITDA and gains on sales in the first half-year of 2007 (€111 million gain by EDF International on the sale of its residual 25% holding in Edenor).
Page 34 sur 52
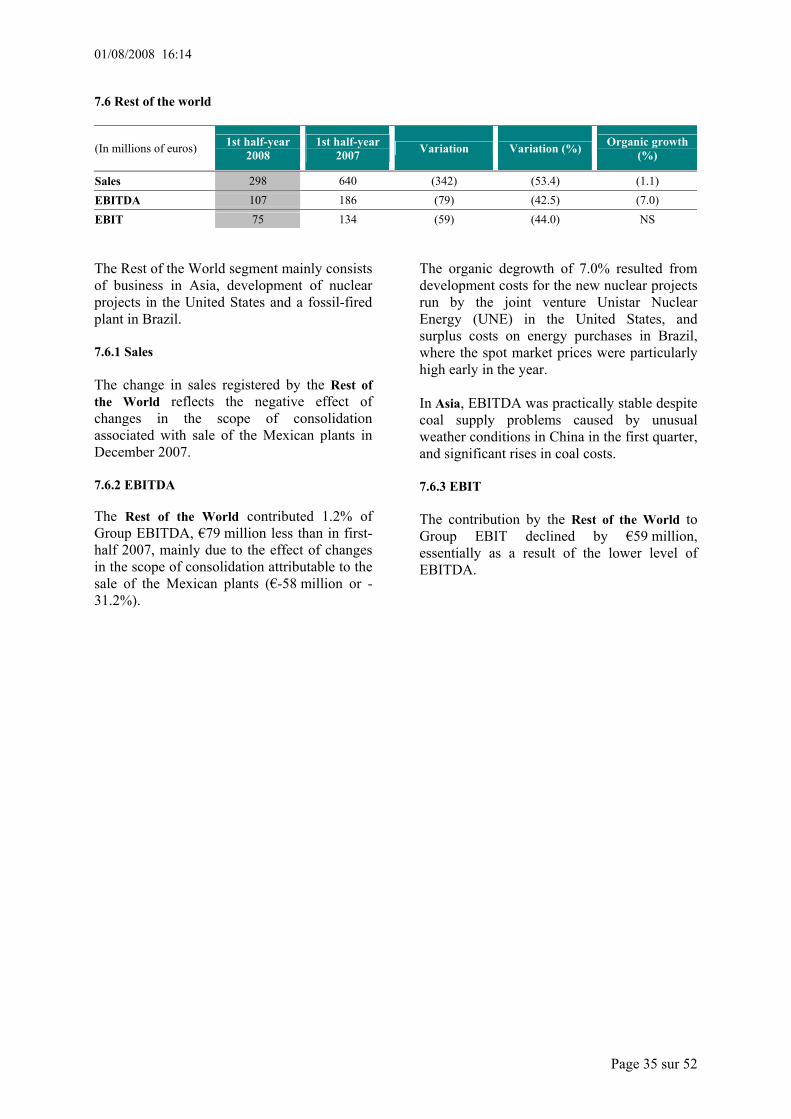
01/08/2008 16:14
Page 35 sur 52
7.6 Rest of the world
(In millions of euros) 1st half-year 2008 1st half-year
2007 Variation Variation (%) Organic growth (%)
Sales 298 640 (342) (53.4) (1.1) EBITDA 107 186 (79) (42.5) (7.0) EBIT 75 134 (59) (44.0) NS The Rest of the World segment mainly consists of business in Asia, development of nuclear projects in the United States and a fossil-fired plant in Brazil. 7.6.1 Sales The change in sales registered by the Rest of the World reflects the negative effect of changes in the scope of consolidation associated with sale of the Mexican plants in December 2007. 7.6.2 EBITDA The Rest of the World contributed 1.2% of Group EBITDA, €79 million less than in first-half 2007, mainly due to the effect of changes in the scope of consolidation attributable to the sale of the Mexican plants (€-58 million or -31.2%).
The organic degrowth of 7.0% resulted from development costs for the new nuclear projects run by the joint venture Unistar Nuclear Energy (UNE) in the United States, and surplus costs on energy purchases in Brazil, where the spot market prices were particularly high early in the year. In Asia, EBITDA was practically stable despite coal supply problems caused by unusual weather conditions in China in the first quarter, and significant rises in coal costs. 7.6.3 EBIT The contribution by the Rest of the World to Group EBIT declined by €59 million, essentially as a result of the lower level of EBITDA.
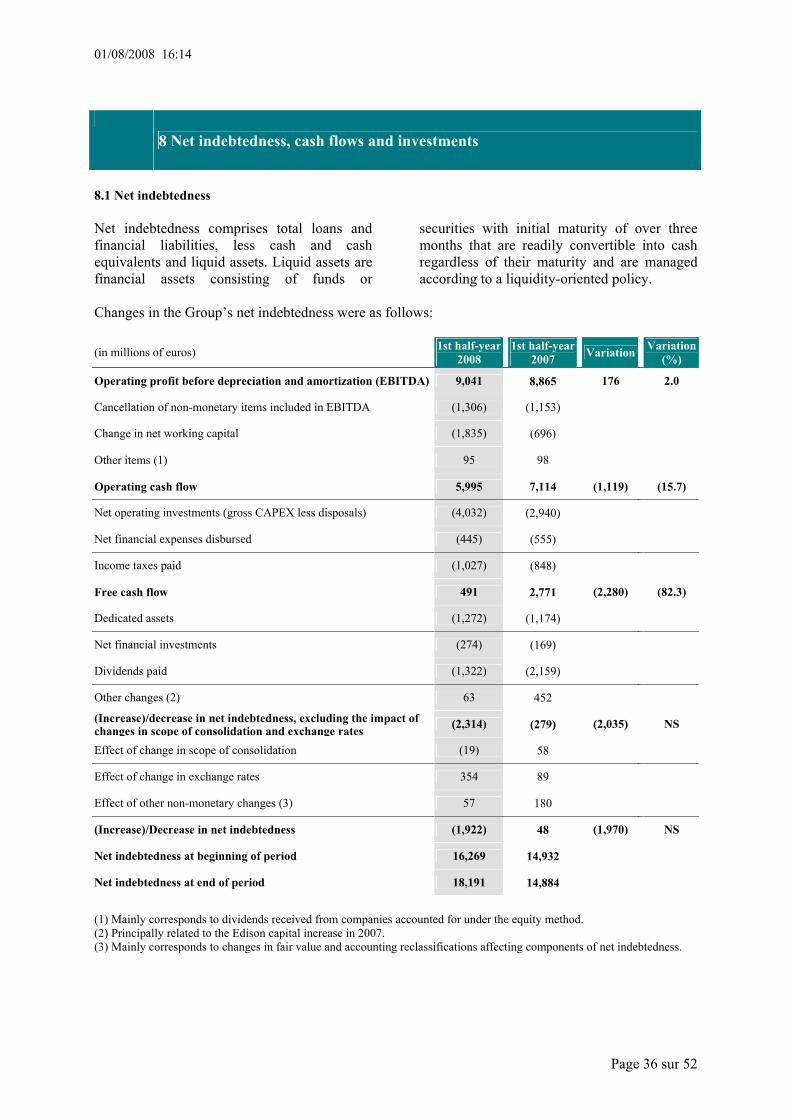
01/08/2008 16:14
Page 36 sur 52
8 Net indebtedness, cash flows and investments
8.1 Net indebtedness Net indebtedness comprises total loans and financial liabilities, less cash and cash equivalents and liquid assets. Liquid assets are financial assets consisting of funds or
securities with initial maturity of over three months that are readily convertible into cash regardless of their maturity and are managed according to a liquidity-oriented policy.
Changes in the Group’s net indebtedness were as follows: (in millions of euros) 1st half-year
2008 1st half-year
2007 Variation Variation (%)
Operating profit before depreciation and amortization (EBITDA) 9,041 8,865 176 2.0
Cancellation of non-monetary items included in EBITDA (1,306) (1,153)
Change in net working capital (1,835) (696)
Other items (1) 95 98
Operating cash flow 5,995 7,114 (1,119) (15.7)
Net operating investments (gross CAPEX less disposals) (4,032) (2,940)
Net financial expenses disbursed (445) (555)
Income taxes paid (1,027) (848)
Free cash flow 491 2,771 (2,280) (82.3)
Dedicated assets (1,272) (1,174)
Net financial investments (274) (169)
Dividends paid (1,322) (2,159)
Other changes (2) 63 452
(Increase)/decrease in net indebtedness, excluding the impact of changes in scope of consolidation and exchange rates (2,314) (279) (2,035) NS
Effect of change in scope of consolidation (19) 58
Effect of change in exchange rates 354 89
Effect of other non-monetary changes (3) 57 180
(Increase)/Decrease in net indebtedness (1,922) 48 (1,970) NS
Net indebtedness at beginning of period 16,269 14,932
Net indebtedness at end of period 18,191 14,884
(1) Mainly corresponds to dividends received from companies accounted for under the equity method. (2) Principally related to the Edison capital increase in 2007. (3) Mainly corresponds to changes in fair value and accounting reclassifications affecting components of net indebtedness.

01/08/2008 16:14
Page 37 sur 52
The Group’s net indebtedness stood at €18,191 million at June 30, 2008, compared to €16,269 million at December 31, 2007. The increase over the first half-year thus totaled €1,922 million. The change in net indebtedness results primarily from the lower level of free cash flow generated (€491 million for the first half-year of 2008, compared to €2,771 million for the first half-year of 2007), which reflects the acceleration in the Group’s investment program (+€1,092 million27 between first-half 2007 and first-half 2008) and the higher working capital in 2007 (+€1,139 million, largely due to rising inventories and margin calls paid by EDF Trading). The cash allocation to dedicated assets amounted to €1,272 million, in line with commitments. Other net financial investments stood at €274 million. The total value of these investments was €203 million higher than in first-half 2007. Dividends paid by EDF after the €1,056 million interim dividend distributed in late 2007 amounted to €1,273 million. The total dividend paid by EDF in respect of 2007 was therefore €2,329 million, compared to the €2,114 million paid out in first-half 2007 in respect of 2006, although dividend payouts during the first half-year were €841 lower in 2008 than 2007. The effect of changes in exchange rates (particularly the pound sterling’s fall against the Euro) helped to reduce the Group’s indebtedness by €354 million.
27 Gross operating investments before disposals.
8.2 Net cash flow from operations and operating cash flow Net cash flow from operations for the first half-year of 2008 totaled €5,995 million, 15.7% lower than in first-half 2007 (€7,114 million). This decline is principally caused by the increase in working capital between the two periods (+€1,139 million), mostly at EDF Trading (+€981 million), attributable to cash calls (related to margins) by financial institutions on hedges of coal transactions after coal prices practically doubled over the first six months of 2008 (with no counterpart in physical purchases). Operating cash flow28 stood at €6,358 million for the first half-year of 2008, down by 0.8% from the €6,407 million registered in the first half-year of 2007. Details are as follows:
28 EDF uses Operating cash flow, equivalent to Funds From Operations or FFO, as an indicator to assess the Group’s capacity to generate free cash flow. Operating cash flow is equivalent to net cash flow from operating activities (Cash flow statement) excluding changes in working capital, less net financial expenses disbursed and income taxes paid, adjusted for the impact of non-recurring tax effect items.
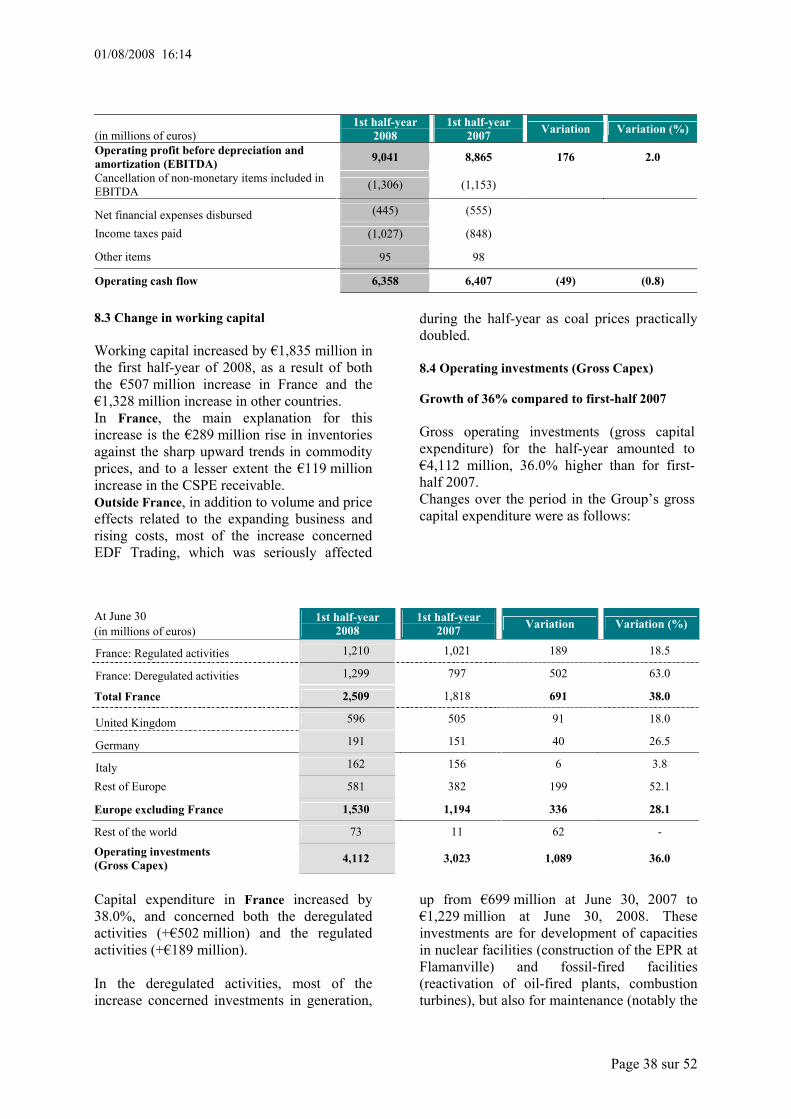
01/08/2008 16:14
Page 38 sur 52
(in millions of euros) 1st half-year
2008 1st half-year
2007 Variation Variation (%)
Operating profit before depreciation and amortization (EBITDA) 9,041 8,865 176 2.0
Cancellation of non-monetary items included in EBITDA (1,306) (1,153)
Net financial expenses disbursed (445) (555)
Income taxes paid (1,027) (848)
Other items 95 98
Operating cash flow 6,358 6,407 (49) (0.8)
8.3 Change in working capital Working capital increased by €1,835 million in the first half-year of 2008, as a result of both the €507 million increase in France and the €1,328 million increase in other countries. In France, the main explanation for this increase is the €289 million rise in inventories against the sharp upward trends in commodity prices, and to a lesser extent the €119 million increase in the CSPE receivable. Outside France, in addition to volume and price effects related to the expanding business and rising costs, most of the increase concerned EDF Trading, which was seriously affected
during the half-year as coal prices practically doubled. 8.4 Operating investments (Gross Capex) Growth of 36% compared to first-half 2007 Gross operating investments (gross capital expenditure) for the half-year amounted to €4,112 million, 36.0% higher than for first-half 2007. Changes over the period in the Group’s gross capital expenditure were as follows:
At June 30 (in millions of euros)
1st half-year 2008
1st half-year 2007 Variation Variation (%)
France: Regulated activities 1,210 1,021 189 18.5
France: Deregulated activities 1,299 797 502 63.0
Total France 2,509 1,818 691 38.0
United Kingdom 596 505 91 18.0
Germany 191 151 40 26.5
Italy 162 156 6 3.8
Rest of Europe 581 382 199 52.1
Europe excluding France 1,530 1,194 336 28.1
Rest of the world 73 11 62 -
Operating investments (Gross Capex) 4,112 3,023 1,089 36.0
Capital expenditure in France increased by 38.0%, and concerned both the deregulated activities (+€502 million) and the regulated activities (+€189 million). In the deregulated activities, most of the increase concerned investments in generation,
up from €699 million at June 30, 2007 to €1,229 million at June 30, 2008. These investments are for development of capacities in nuclear facilities (construction of the EPR at Flamanville) and fossil-fired facilities (reactivation of oil-fired plants, combustion turbines), but also for maintenance (notably the
01/08/2008 16:14
Page 39 sur 52
SuPerHydro program for hydropower assets, and maintenance programs for nuclear assets). Another less important factor was the payments made in completion of asset acquisitions undertaken in late 2007. Investments in the regulated activities rose by 18.5%. In the transmission networks, they principally concerned major transmission channels and interconnections, and development and renewal of regional networks; in distribution, they concerned development, reinforcement and replacement of networks, as well as preventive measures against weather risks. Operating investments in the island energy systems also showed a noticeable rise of 28.9%. Gross capital expenditure also increased in Europe excluding France. In the United Kingdom, gross capital expenditure amounted to €596 million for the first half-year of 2008, up by 18.0% from the first half-year of 2007. In the deregulated sector, the investments were for construction of the new West Burton fossil-fired plant, and in regulated activities, they related to reinforcement of the distribution network as negotiated with the regulator. In Germany, capital expenditure totaled €191 million for the first half-year of 2008, an increase of over 26.5% compared to first-half 2007, resulting from growth in activities related to electricity, environment and services, particularly in generation and networks. In Italy, capital expenditure registered a slight progression despite the expanding capacities for electricity generation and gas storage. In the Rest of Europe, capital expenditure amounted to €581 million, a 52.1% increase from the previous year attributable to the continuing development of several wind farms
in Europe by EDF Energies Nouvelles, and projects in central European countries and the Netherlands. Finally, the higher capital expenditure in the Rest of the World (+€62 million compared to first-half 2007) is related to the greater investments in international nuclear activities. 8.5 Net financial investments Ongoing increase in dedicated assets and development of international nuclear activities In compliance with the French Law of June 28, 2006 on the sustainable management of radioactive materials and waste, EDF is continuing to build up a portfolio of dedicated assets to cover long-term nuclear commitments. The cash allocation for the first half-year of 2008 was €1,272 million. Other net financial investments amounted to €274 million, and mainly comprise: • €580 million for external growth, principally development of international nuclear activities particularly in the United States, and various development projects for energy services, • sales of assets including power plants in Italy and the Compagnie Eolienne du Détroit in Morocco. The combined effect of these operations was a €195 million reduction in net indebtedness. 8.6 Net indebtedness by segment Changes in the contribution to net indebtedness by each segment are shown below:
-
4.3
-

01/08/2008 16:14
Page 40 sur 52
In France, indebtedness remained stable despite the significant increase in capital expenditure (for the EPR and other projects), the higher level of working capital, and the cash contribution to dedicated assets. The United Kingdom saw a slight decline of 1.7% in indebtedness attributable to the rising value of the Euro. After adjustment for this effect (+€450 million), indebtedness increased by close to 6%.
In Germany, indebtedness also decreased thanks to the Free Cash Flow generated and the low investments in external growth. In Italy, indebtedness rose sharply (+77.2%), primarily due to the partial liquidation of Italiaenergia Bis. The increase in indebtedness registered in the Rest of Europe was mostly concentrated in EDF Trading, and resulted from cash (margin) calls on coal-related transactions.
(in millions of euros) June 30, 2008 December 31, 2007 Variation Variation (%)
France 8,161 8,112 49 0.6 United Kingdom 5,792 5,890 (98) (1.7) Germany 1,363 1,476 (113) (7.7) Italy 1,880 1,061 819 77.2 Rest of Europe 579 (730) 1,309 NS Rest of the World 416 426 (10) (2.3)
Total 18,191 16,235 1,956 12.0 Net financial liabilities from companies disclosed in non-current liabilities related to assets classified as held for sale
0 34 (34) NS
Group total 18,191 16,269 1,922 11.8
01/08/2008 16:14
Page 41 sur 52
9 Management and control of market risks
This chapter should be read in conjunction with section 4.1 of the 2007 Document de Référence on risk management and control in the Group, and section 9.10 on management and control of financial risks. 9.1 Management and control of financial risks This chapter sets forth the main changes since December 31, 2007 concerning the Group’s financial risks. 9.1.1 Liquidity position and management of liquidity risks 9.1.1.1 Liquidity position At June 30, 2008, taking into account liquid assets totaling €7,170 million and cash totaling €4,637 million, the Group’s liquidity position was approximately €11,807 million. The Group also has access to financial resources through short-term issues and bond issue programs, and bank credit lines
At June 30, 2008, no Group company was in default on any borrowing. 9.1.1.2 Management of liquidity risks As part of its policy to manage liquidity, finance its operating investment program and reinforce long-term debt, the Group undertook bond issues during the first half-year of 2008 (for details see section 2.2 of this report). These bonds concern EDF (€3,300 million and £500 million) and RTE (€1,250 million). The average maturity of consolidated long-term debt was thus raised to six years and four months, compared to five and a half years at December 31, 2007, and EDF debt now has average maturity of seven years and two months compared to four and a half years at December 31, 2007. At June 30, 2008, the maturities of gross long-term and short-term debt, before hedging as defined by IAS 39 and based on current interest and exchange rates, are as follows:
Against the major liquidity tensions on the financial markets, EDF was able to meet its financing needs by conservative liquidity management, and obtained financing on satisfactory terms. The levers used to manage the Group’s liquidity risk during the first half-year of 2008 are identical to those presented in 2007 (see section 9.10.1 of the 2007 Document de Référence). The investment subsidiary EDF Investissements Groupe (EDF IG) contributes to centralization of the Group’s financing and
continued to grow in the first half-year, primarily by taking over part of the financing for the UK subsidiaries. As part of its liquidity management, EDF has access to diverse sources of financing: short-term resources through programs for French commercial paper (billets de trésorerie), US commercial paper and Euro market commercial paper, EMTN (Euro Medium Term Note) programs, bonds and syndicated loans.
(in millions of euros) Bonds
Loans from financial
institutions
Other financial liabilities
Loans related to finance-
leased assets
Accrued interest Total
Less than one year 3,090 1,728 4,043 22 457 9,340 From one to five years 4,071 1,820 605 171 3 6,670 More than five years 12,455 1,242 330 54 - 14,081 Loans and financial liabilities at 06.30.2008 19,616 4,790 4,978 247 460 30,091
01/08/2008 16:14
Page 42 sur 52
In addition to Group borrowings in amounts of over €750 million as presented in section 9.10.1 of the 2007 Document de Référence,
details of new borrowings contracted during the first half-year of 2008 are as follows:
Type of borrowing in millions of
currency units Entity Issue
date Maturity Amount Rate
(%) Bonds EDF 2008 Feb 5, 2018 1,500 M€ 5.00%
May 30, 2014 600 M€ 5.00% May 29, 2020 1,200 M€ 5.375%Bonds EDF 2008 May 30, 2028 500 M GBP 6.25%
Bonds RTE 2008 May 6, 2015 1,250 M€ 4.88% The table below sets out the various Group entities’ syndicated loans with their main features. They are unchanged since December 31, 2007. Entity Maturity Amount
( en millions) Currency Drawings at June 30, 2008
EDF 2012 6,000 (swingline: 2,000) EUR None
EDF Energy End of 2008 250 GBP None EnBW 2009 (with renewal
option) Tranche A: 1,000 EUR None
EnBW 2010 Tranche B: 58 EUR None EnBW 2012 Tranche B: 1,442 EUR None Edison 2013 1,500 EUR None RTE 2013 1,000
(swingline: 300) EUR None
9.1.2 Credit ratings The financial ratings agencies Standard & Poor’s, Moody’s and Fitch IBCA have attributed the following long-term and short-term ratings to the EDF Group29:
(*) Outlook changed from positive to stable during the first half-year of 2008 29 June 2008
Company Agency Long-term rating Short-term rating
EDF Standard & Poor’s Moody’s Fitch IBCA
AA-, stable outlook Aa1, stable outlook AA-, stable outlook
A-1+ P-1 F1+
RTE EDF Transport
Standard & Poor’s AA-, stable outlook A-1+
EDF Trading Moody’s Standard & Poor’s
A3, stable outlook A, stable outlook
N/A A-1
EDF Energy Moody’s Fitch IBCA Standard & Poor’s
A3, stable outlook A-, stable outlook BBB+, stable outlook (*)
P-2 F2 A-2
Edison SpA Moody’s Fitch
Baa2, stable outlook BBB+, stable outlook
N/A F2
EnBW Standard & Poor’s Moody’s
A-, stable outlook A2, stable outlook
A-2 P-1

01/08/2008 16:14
Page 43 sur 52
9.1.3 Management of foreign exchange rate risk Due to the diversification of its activities and geographical locations, the Group is exposed to the risk of exchange rate fluctuations, which may have an impact on the translation differences affecting balance sheet items, Group financial expenses, equity and net income The principles for foreign exchange management are unchanged from those
presented in section 9.10.3 of the 2007 Document de Référence. After the financing changes described earlier, the Group's gross debt at June 30, 2008 breaks down as follows by currency after hedging as defined by IFRS: 60% in euros, 30% in pounds sterling and 2% in US dollars. The balance of 8% includes the Swiss franc, the Hungarian forint, the Polish zloty and the Brazilian real.
Gross debt structure at June 30, 2008, by currency, before and after hedging
(1) Hedges of liabilities and net assets of foreign subsidiaries, and USD/GBP swaps designated as economic hedges The table below presents the impact of an unfavorable variation in exchange rates on the group’s gross debt at June 30, 2008:
There was no significant change in the foreign exchange position relating to net investments in foreign currency of the Group’s principal subsidiaries during the first half-year of 2008, likely to substantially affect exposure to foreign exchange risks. The foreign exchange position relating to net investments in pounds
sterling, the principal source of exposure for the Group, was £855 million at June 30, 2008 net after hedging, compared to £711 million at December 31, 2007. The percentage of hedged positions in pound sterling was 76% at June 30, 2008 (79% at December 31, 2007).
(in millions of euros) June 30, 2008
Initial debt structure Impact of hedging instruments (1)
Debt structure after hedges % of debt
EUR 22,226 (4,157) 18,069 60
USD 1,956 (1,300) 656 2
GBP 4,380 4,698 9,078 30
Other currencies 1,529 759 2,288 8
Total debt 30,091 0 30,091 100
(in millions of euros)
June 30, 2008
Debt after hedging instruments converted
into euros
Impact of a 10% unfavorable variation in
exchange rates
Debt after a 10% unfavorable variation
in exchange rates
EUR 18,069 - 18,069 USD 656 65 591 GBP 9,078 908 8,170 Other currencies 2,288 229 2,059
Total debt 30,091 1,202 28,889
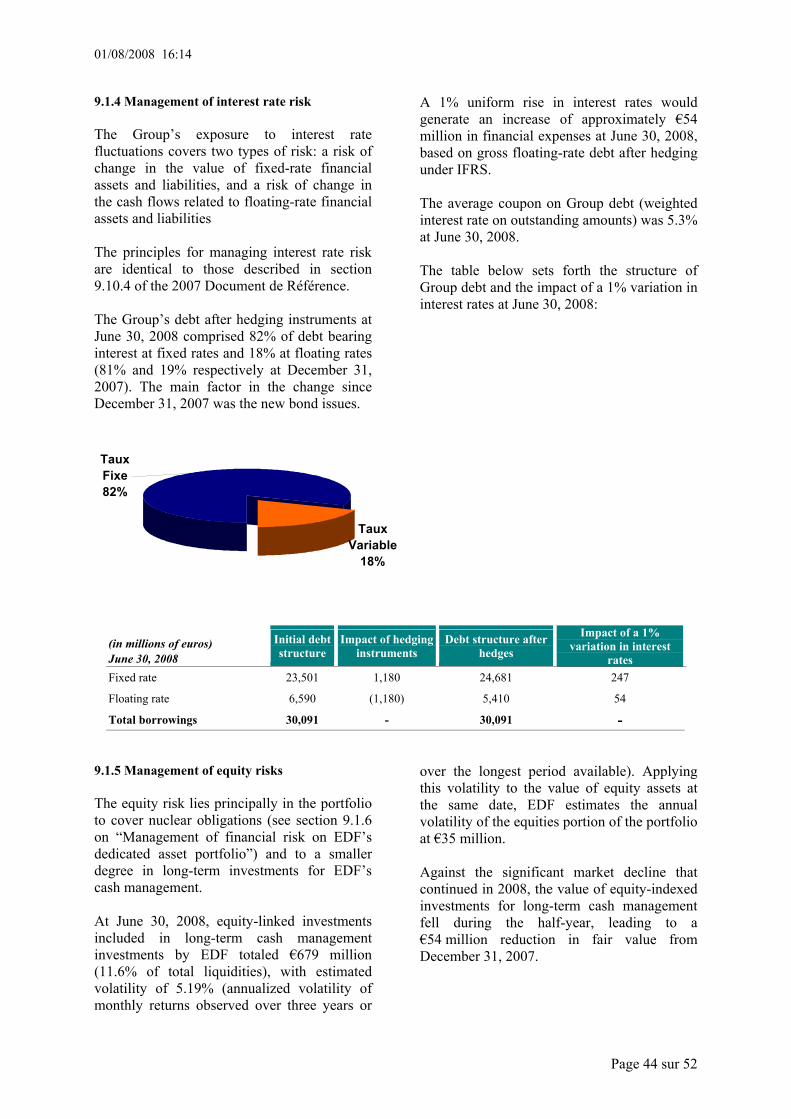
01/08/2008 16:14
Page 44 sur 52
9.1.4 Management of interest rate risk The Group’s exposure to interest rate fluctuations covers two types of risk: a risk of change in the value of fixed-rate financial assets and liabilities, and a risk of change in the cash flows related to floating-rate financial assets and liabilities The principles for managing interest rate risk are identical to those described in section 9.10.4 of the 2007 Document de Référence. The Group’s debt after hedging instruments at June 30, 2008 comprised 82% of debt bearing interest at fixed rates and 18% at floating rates (81% and 19% respectively at December 31, 2007). The main factor in the change since December 31, 2007 was the new bond issues.
Taux Variable
18%
Taux Fixe82%
A 1% uniform rise in interest rates would generate an increase of approximately €54 million in financial expenses at June 30, 2008, based on gross floating-rate debt after hedging under IFRS. The average coupon on Group debt (weighted interest rate on outstanding amounts) was 5.3% at June 30, 2008. The table below sets forth the structure of Group debt and the impact of a 1% variation in interest rates at June 30, 2008:
(in millions of euros) June 30, 2008
Initial debt structure
Impact of hedging instruments
Debt structure after hedges
Impact of a 1% variation in interest
rates Fixed rate 23,501 1,180 24,681 247
Floating rate 6,590 (1,180) 5,410 54
Total borrowings 30,091 - 30,091 - 9.1.5 Management of equity risks The equity risk lies principally in the portfolio to cover nuclear obligations (see section 9.1.6 on “Management of financial risk on EDF’s dedicated asset portfolio”) and to a smaller degree in long-term investments for EDF’s cash management. At June 30, 2008, equity-linked investments included in long-term cash management investments by EDF totaled €679 million (11.6% of total liquidities), with estimated volatility of 5.19% (annualized volatility of monthly returns observed over three years or
over the longest period available). Applying this volatility to the value of equity assets at the same date, EDF estimates the annual volatility of the equities portion of the portfolio at €35 million. Against the significant market decline that continued in 2008, the value of equity-indexed investments for long-term cash management fell during the half-year, leading to a €54 million reduction in fair value from December 31, 2007.
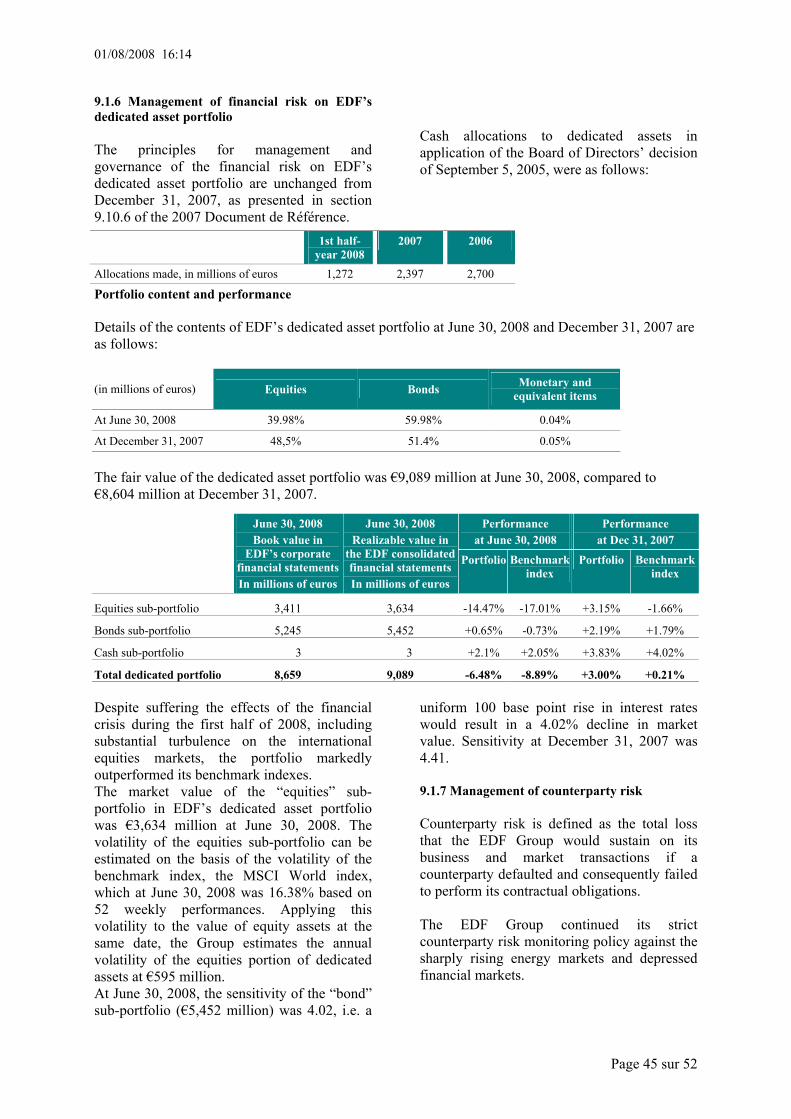
01/08/2008 16:14
Page 45 sur 52
9.1.6 Management of financial risk on EDF’s dedicated asset portfolio The principles for management and governance of the financial risk on EDF’s dedicated asset portfolio are unchanged from December 31, 2007, as presented in section 9.10.6 of the 2007 Document de Référence.
Cash allocations to dedicated assets in application of the Board of Directors’ decision of September 5, 2005, were as follows:
Portfolio content and performance Details of the contents of EDF’s dedicated asset portfolio at June 30, 2008 and December 31, 2007 are as follows: (in millions of euros)
Equities Bonds Monetary and equivalent items
At June 30, 2008 39.98% 59.98% 0.04%
At December 31, 2007 48,5% 51.4% 0.05%
The fair value of the dedicated asset portfolio was €9,089 million at June 30, 2008, compared to €8,604 million at December 31, 2007.
Despite suffering the effects of the financial crisis during the first half of 2008, including substantial turbulence on the international equities markets, the portfolio markedly outperformed its benchmark indexes. The market value of the “equities” sub-portfolio in EDF’s dedicated asset portfolio was €3,634 million at June 30, 2008. The volatility of the equities sub-portfolio can be estimated on the basis of the volatility of the benchmark index, the MSCI World index, which at June 30, 2008 was 16.38% based on 52 weekly performances. Applying this volatility to the value of equity assets at the same date, the Group estimates the annual volatility of the equities portion of dedicated assets at €595 million. At June 30, 2008, the sensitivity of the “bond” sub-portfolio (€5,452 million) was 4.02, i.e. a
uniform 100 base point rise in interest rates would result in a 4.02% decline in market value. Sensitivity at December 31, 2007 was 4.41. 9.1.7 Management of counterparty risk Counterparty risk is defined as the total loss that the EDF Group would sustain on its business and market transactions if a counterparty defaulted and consequently failed to perform its contractual obligations. The EDF Group continued its strict counterparty risk monitoring policy against the sharply rising energy markets and depressed financial markets.
1st half-year 2008
2007 2006
Allocations made, in millions of euros 1,272 2,397 2,700
Performance at June 30, 2008
Performance at Dec 31, 2007
June 30, 2008 Book value in
EDF’s corporate financial statementsIn millions of euros
June 30, 2008 Realizable value in
the EDF consolidated financial statements In millions of euros
Portfolio Benchmark index
Portfolio Benchmark index
Equities sub-portfolio 3,411 3,634 -14.47% -17.01% +3.15% -1.66%
Bonds sub-portfolio 5,245 5,452 +0.65% -0.73% +2.19% +1.79%
Cash sub-portfolio 3 3 +2.1% +2.05% +3.83% +4.02%
Total dedicated portfolio 8,659 9,089 -6.48% -8.89% +3.00% +0.21%
01/08/2008 16:14
Page 46 sur 52
9.2 Management and control of energy market risks This section presents the main changes in the Group’s energy market risks since December 31, 2007. The energy market risk management principles are unchanged since December 31, 2007 as presented in section 4.1.1.2 of the 2007 Document de Référence. Within the Group, positions relating to energy markets are mainly taken by EDF Trading, the Group’s trading entity. EDF Trading is subject to a strict governance and control framework, in line with current practices for trading companies. The table below shows the values for the risk indicators used to monitor EDF Trading’s market commitments for 2007 and the first half-year of 2008:
The stop-loss was not triggered during the first half-year of 2008.
(in millions of euros) 1st half-year 2008 2007
VaR limit (97.5% per day) 32 26
Stop-loss limit 45 35
Min VaR 6,5 4.9
Max VaR 20,4 27.6

01/08/2008 16:14
Page 47 sur 52
10 Provisions
The following table sets forth provisions (current and non-current) at June 30, 2008 and December 31, 2007:
(in millions of euros) June 30, 2008 December 31, 2007
Provisions for burnt fuel management 11,087 11,011
Provisions for long-term radioactive waste management 6,489 6,444
Provisions for back-end nuclear cycle 17,576 17,455
Provisions for decommissioning 12,146 11,933
Provisions for last cores 1,774 1,721
Provisions for decommissioning and last cores 13,920 13,654
Provisions for post-employment benefits 12,385 12,675
Provisions for other long-term employee benefits 1,157 1,088
Provisions for employee benefits 13,542 13,763
Other provisions 3,583 3,862
Total provisions 48,621 48,734
For details of the components of provisions, and changes in these provisions, see note 24 to the condensed consolidated half-year financial statements.

01/08/2008 16:14
Page 48 sur 52
11 Contractual obligations
The following table presents the contractual obligations identified by the Group at June 30, 2008, including obligations not recognized in the balance sheet (off balance sheet commitments):
June 30, 2008
(in millions of euros) Total Maturity within one year
Maturity between one
and five years Maturity after
five years
Long-term debt (1) 30,091 9,340 6,670 14,081
Satisfactory performance, completion and bid guarantees 658 324 294 40
Commitments related to orders for operating items (2) 3,994 2,511 1,119 364
Commitments related to orders for fixed assets 11,091 4,519 6,392 180
Other operating commitments given 3,768 1,258 2,320 190
Contractual obligations related to operations 19,511 8,612 10,125 774
Security interest on assets 2,168 137 1,337 694
Guarantees related to borrowings 414 103 87 224
Other financing commitments given 93 37 40 16
Contractual obligations related to financing (3) 2,675 277 1,464 934
Equity investment commitments 3,480 1,097 2,383 -
Other investment commitments given 242 99 116 27
Contractual obligations related to investments (4) 3,722 1,196 2,499 27
(1) See note 26.2 to the consolidated financial statements at June 30, 2008 (2) Excluding commodities and energy. (3) See note 26.5 to the consolidated financial statements at June 30, 2008 (4) See note 21.3 to the consolidated financial statements at June 30, 2008 This table does not show firm irrevocable purchase commitments, operating lease commitments or finance lease commitments, which were not measured by the Group at June 30, 2008. At December 31, 2007, these commitments amounted to €44,363 million, €2,709 million and €246 million respectively. Firm irrevocable purchase commitments for commodities and energy amounted to €44,363 million at December 31, 2007. The main change since that date concerns new fluoration and enrichment service contracts
subscribed by EDF in 2008, for a total close to €5 billion. Contractual obligations related to operations totaling €19,511 million at June 30, 2008, and comprise satisfactory performance, completion and bid guarantees, commitments related to orders for operating items and fixed assets, and other operating commitments given. These commitments are described in note 10.3 to the consolidated financial statements at June 30, 2008.

01/08/2008 16:14
Page 49 sur 52
Contractual obligations related to financing, totaling €2,675 million, comprise security interests on assets, guarantees related to borrowings and other financing commitments given. For details, see note 26.5 of the notes to the consolidated financial statements at June 30, 2008.
Contractual obligations related to investments include commitments for acquisition of equity investments and other investment commitments given, amounting to €3,722 million. For details, see note 21.3 to the consolidated financial statements at June 30, 2008.
12 Subsequent events
Details of post balance sheet events are described in note 32 to the consolidated financial statements at June 30, 2008. These events include the following: 12.1 Employee Offering In application of French law, following the sale by the French State of 2.5% of the capital of EDF in late 2007, a share offer reserved for employees was announced (the “Employee Offering”). A preferential offer is to be made by the State to current and retired employees of EDF and majority-owned subsidiaries, covering 15% of the total number of shares put on the market. 12.2 Prolongation of the transition tariff (TaRTAM) system On July 23, 2008, the French Parliament adopted the law on economic modernization, prolonging the TaRTAM transition tariff system to June 30, 2010. In addition to the prolongation, this law also extends eligibility for the tariff to all final customers, even those not currently concerned. EDF estimates the additional cost of contribution to the TaRTAM system resulting from its prolongation to June 30, 2010 at approximately €1 billion based on current regulations, volumes and prices. This estimation is highly volatile as the regulations, volumes and prices may change, with a potentially significant effect on the estimated amount of the additional cost. Once the law on economic modernization has been finally enacted, EDF will draw the appropriate accounting conclusions
12.3 Tax reform in the UK: Phasing out of the Industrial Building Allowance The UK Finance Law for 2008 was enacted on July 21, 2008. The phasing out of Industrial Buildings Allowances contained in the law will result in a one-off charge of £40 million, which will be booked in the second half of the year. 12.4 Acquisition de 26% de EWE AG by EnBW On July 10, 2008, EnBW’s bid to acquire a 26% stake in EWE AG Oldenburg was accepted, for a total of approximately €2 billion. The transaction is subject to the approval of the German anti-trust authorities. The impact on EnBW’s 2008 consolidated net income should not be significant, since the authorities’ decision is expected to be issued late in the year. The acquisition will be financed through the capital markets. 12.5 Partnership agreement with Exeltium The European Commission has announced that on July 30, 2008 the industrial partnership agreement between EDF and Exeltium (a consortium of large electricity-intensive customers) complies with competition law. This agreement covers volumes of some 310 TWh spread over 24 years. Its purpose is to make energy supplies more secure for Exeltium, which will have greater visibility over long-term electricity supply prices in return for sharing risks relating to development and operation of EDF nuclear power plants.
01/08/2008 16:14
Page 50 sur 52
13 Principal risks and uncertainties for the second half-year of 2008
The EDF Group policies for risk management and control are described in section 4.1 of the 2007 Document de Référence. The principal risks and uncertainties to which the Group considers itself exposed are also described in section 4.2 of the 2007 Document de Référence.
This description remains valid at the date of publication of this report for assessment of the major risks and uncertainties of second-half 2008, together with the usual risks specific to the Group’s business.
14 Transactions with related parties
There have been no significant changes since December 31, 2007 in the types of transaction undertaken with related parties. In particular, the Group has significant ongoing relationships with public-sector enterprises, primarily the Areva Group for the supply, transmission and reprocessing of nuclear fuel and maintenance of nuclear plants. The Areva Group is also a supplier to the EPR (European Pressurized
Reactor) project, contributing to the formation of commitments on fixed asset orders. Gaz de France exercised its put option on its 22.14% of shares in ECW (see note 5 to the condensed consolidated half-year financial statements).
The litigations in which the EDF Group is involved are described in section 20.5 of the 2007 Document de Référence. This chapter reports on new litigations or those which have seen significant developments. Developments in two litigations since publication of the 2007 Document de Référence are described below: 15.1 Arcelor On December 21, 2007 after ArcelorMittal France took over ArcelorMittal Wire France (AMWF), which itself controls ArcelorMittal Manois (AMM), ArcelorMittal France
requested extension of its master agreement with EDF to include six new sites belonging to AMWF and AMM. Mediation procedures failed to settle the dispute, and ArcelorMittal France, AMWF and AMM served a summons on EDF to appear shortly before the Paris Commercial Court, where it is suing for inclusion of the sites concerned in the master agreement of November 30, 1999.
15 Significant events related to litigation in process

01/08/2008 16:14
Page 51 sur 52
15.2 Hungary: Appeal against the European Commission’s ruling with regard to State aid In November 2005, the European Commission began a formal investigation into long-term electricity purchase agreements (PPA) in Hungary under article 88, paragraph 2 of the EC Treaty. On June 4, 2008, the European Commission issued its decision after completion of the investigation. The Commission concluded that the PPAs constituted illegal State aid, and asked the Hungarian government to terminate the agreements and refund any amounts of aid
provided since May 1, 2004, the date at which Hungary joined the EU. The Hungarian government has not yet indicated whether it intends to appeal against this decision, which could have consequences for BERt that cannot be assessed at this stage. The proceedings against the decision to start a formal investigation, initiated by BERt before the Luxembourg court of first instance on March 3, 2006, are still ongoing.
16 Financial outlook for 2008
In view of a slightly better than expected first half, in particular internationally, EDF has now set an EBITDA organic growth target of around 3% for the full year. As in the first half-year, profit should continue to be marked by the increase in some operating expenses (energy purchases, maintenance and transformation), as well as by the effects of the Group’s substantial investment programme.
Consolidated net income (Group share) excluding non-recurring items may well not increase in 2008 as compared to 2007. All these factors do not include the impact of the extension of TaRTAM until 30 June 2010.

01/08/2008 16:14
Page 52 sur 52
17 Financial information on EDF30
EDF net sales for the first half-year of 2008 amounted to €19,782 million, and EBIT was €3,138 million.
30 Reported under French GAAP.
1/38
CONDENSED CONSOLIDATED HALF-YEAR FINANCIAL STATEMENTS
AT JUNE 30, 2008
EDF GROUP - CONSOLIDATED FINANCIAL STATEMENTS AT JUNE 30, 2008
2/38
Contents Page
CONSOLIDATED INCOME STATEMENTS.........................................................................................................................................................4 CONSOLIDATED BALANCE SHEETS................................................................................................................................................................5 CONSOLIDATED CASH FLOW STATEMENTS .................................................................................................................................................6 CHANGES IN CONSOLIDATED EQUITY............................................................................................................................................................7 NOTES TO THE CONSOLIDATED FINANCIAL STATEMENTS ........................................................................................................................8 NOTE 1 - GROUP ACCOUNTING PRINCIPLES AND METHODS .................................................................................................................8
1.1 DECLARATION OF CONFORMITY AND GROUP ACCOUNTING POLICIES......................................................................................................8 1.2 ACCOUNTING METHODS FOR THE FIRST HALF-YEAR OF 2008 ................................................................................................................8 1.3 VALUATION METHODS SPECIFIC TO INTERIM FINANCIAL STATEMENTS .....................................................................................................9 1.4 MANAGEMENT JUDGMENT AND ESTIMATES ...........................................................................................................................................9 1.5 SEASONAL NATURE OF THE BUSINESS................................................................................................................................................10
NOTE 2 - REFORM OF THE SPECIAL ELECTRICITY AND GAS SECTOR (IEG) PENSION SYSTEM IN FRANCE ................................10 2.1 DESCRIPTION OF THE REFORM...........................................................................................................................................................10 2.2 ACCOUNTING TREATMENT .................................................................................................................................................................11
NOTE 3 - OTHER REGULATORY CHANGES IN FRANCE..........................................................................................................................13 3.1 HYDROPOWER CONCESSIONS............................................................................................................................................................13 3.2 FRENCH LAWS ON URBAN SOLIDARITY AND RENEWAL - TOWN PLANNING AND HABITAT..........................................................................13
NOTE 4 - SIGNIFICANT EVENTS AND TRANSACTIONS OF THE FIRST HALF-YEAR OF 2008.............................................................14 NOTE 5 - CHANGES IN THE SCOPE OF CONSOLIDATION ......................................................................................................................14
5.1 CHANGES IN THE SCOPE OF CONSOLIDATION DURING THE FIRST HALF-YEAR OF 2008 ..........................................................................14 5.2 CHANGES IN THE SCOPE OF CONSOLIDATION IN 2007 .........................................................................................................................14
NOTE 6 - SEGMENT REPORTING................................................................................................................................................................15 6.1 AT JUNE 30, 2008 ............................................................................................................................................................................16 6.2 AT JUNE 30, 2007 ............................................................................................................................................................................16
NOTE 7 - SALES ............................................................................................................................................................................................17 NOTE 8 - FUEL AND ENERGY PURCHASES ..............................................................................................................................................17 NOTE 9 - OTHER EXTERNAL EXPENSES...................................................................................................................................................17 NOTE 10 - CONTRACTUAL OBLIGATIONS AND COMMITMENTS .............................................................................................................17
10.1 ENERGY AND COMMODITY PURCHASE COMMITMENTS .....................................................................................................................17 10.2 ELECTRICITY SUPPLY COMMITMENTS .............................................................................................................................................18 10.3 OPERATING CONTRACT COMMITMENTS AND GUARANTEES ..............................................................................................................18
NOTE 11 - TAXES OTHER THAN INCOME TAXES .......................................................................................................................................18 NOTE 12 - OTHER OPERATING INCOME AND EXPENSES ........................................................................................................................18 NOTE 13 - OTHER INCOME AND EXPENSES...............................................................................................................................................19 NOTE 14 - FINANCIAL RESULT .....................................................................................................................................................................19
14.1 COST OF GROSS FINANCIAL INDEBTEDNESS....................................................................................................................................19 14.2 DISCOUNT EXPENSE......................................................................................................................................................................19 14.3 OTHER FINANCIAL INCOME AND EXPENSES .....................................................................................................................................19
NOTE 15 - INCOME TAXES.............................................................................................................................................................................20 NOTE 16 - GOODWILL ....................................................................................................................................................................................20 NOTE 17 - PROPERTY, PLANT AND EQUIPMENT OPERATED UNDER FRENCH PUBLIC ELECTRICITY DISTRIBUTION
CONCESSIONS..............................................................................................................................................................................21 17.1 NET VALUE OF PROPERTY, PLANT AND EQUIPMENT OPERATED UNDER FRENCH PUBLIC ELECTRICITY DISTRIBUTION CONCESSIONS ....21 17.2 MOVEMENTS IN PROPERTY, PLANT AND EQUIPMENT OPERATED UNDER FRENCH PUBLIC ELECTRICITY DISTRIBUTION CONCESSIONS
(EXCLUDING CONSTRUCTION IN PROGRESS): ..................................................................................................................................21 NOTE 18 - PROPERTY, PLANT AND EQUIPMENT OPERATED UNDER CONCESSIONS FOR OTHER ACTIVITIES..............................22
18.1 NET VALUE OF PROPERTY, PLANT AND EQUIPMENT OPERATED UNDER CONCESSIONS FOR OTHER ACTIVITIES....................................22
EDF GROUP - CONSOLIDATED FINANCIAL STATEMENTS AT JUNE 30, 2008
3/38
18.2 MOVEMENTS IN PROPERTY, PLANT AND EQUIPMENT OPERATED UNDER CONCESSIONS FOR OTHER ACTIVITIES (EXCLUDING CONSTRUCTION IN PROGRESS AND FINANCE-LEASED ASSETS) ........................................................................................................22
NOTE 19 - PROPERTY, PLANT AND EQUIPMENT USED IN GENERATION AND OTHER TANGIBLE ASSETS OWNED BY THE GROUP...........................................................................................................................................................................................23
19.1 NET VALUE OF PROPERTY, PLANT AND EQUIPMENT USED IN GENERATION AND OTHER TANGIBLE ASSETS OWNED BY THE GROUP.......23 19.2 MOVEMENTS IN PROPERTY, PLANT AND EQUIPMENT USED IN GENERATION AND OTHER TANGIBLE ASSETS OWNED BY THE GROUP
(EXCLUDING CONSTRUCTION IN PROGRESS AND FINANCE-LEASED ASSETS) .....................................................................................23 NOTE 20 - INVESTMENTS IN COMPANIES ACCOUNTED FOR UNDER THE EQUITY METHOD .............................................................24 NOTE 21 - CURRENT AND NON-CURRENT FINANCIAL ASSETS ..............................................................................................................24
21.1 BREAKDOWN BETWEEN CURRENT AND NON-CURRENT FINANCIAL ASSETS........................................................................................24 21.2 DETAILS OF FINANCIAL ASSETS ......................................................................................................................................................24 21.3 INVESTMENT COMMITMENTS ..........................................................................................................................................................26
NOTE 22 - HELD-FOR-SALE ASSETS AND LIABILITIES.............................................................................................................................26 NOTE 23 - EQUITY...........................................................................................................................................................................................26
23.1 SHARE CAPITAL.............................................................................................................................................................................26 23.2 TREASURY SHARES.......................................................................................................................................................................26 23.3 DIVIDENDS....................................................................................................................................................................................27 23.4 BASIC EARNINGS PER SHARE AND DILUTED EARNINGS PER SHARE...................................................................................................27
NOTE 24 - PROVISIONS..................................................................................................................................................................................27 24.1 BREAKDOWN BETWEEN CURRENT AND NON-CURRENT PROVISIONS .................................................................................................27 24.2 VALUATION OF PROVISIONS FOR THE BACK-END NUCLEAR CYCLE, DECOMMISSIONING OF NUCLEAR PLANTS AND LAST CORES BOOKED
BY EDF IN FRANCE .......................................................................................................................................................................27 24.3 PROVISIONS FOR THE BACK-END NUCLEAR CYCLE ..........................................................................................................................28 24.4 PROVISIONS FOR DECOMMISSIONING AND LAST CORES...................................................................................................................29 24.5 SECURE FINANCING OF LONG-TERM OBLIGATIONS RELATED TO EDF’S NUCLEAR LIABILITIES.............................................................30 24.6 PROVISIONS FOR EMPLOYEE BENEFITS ..........................................................................................................................................30 24.7 OTHER PROVISIONS AND CONTINGENT LIABILITIES ..........................................................................................................................31
NOTE 25 - SPECIFIC FRENCH PUBLIC ELECTRICITY DISTRIBUTION CONCESSION LIABILITIES FOR EXISTING ASSETS AND ASSETS TO BE REPLACED.........................................................................................................................................................31
NOTE 26 - CURRENT AND NON-CURRENT FINANCIAL LIABILITIES........................................................................................................32 26.1 BREAKDOWN BETWEEN CURRENT AND NON-CURRENT FINANCIAL LIABILITIES ...................................................................................32 26.2 THE INCREASE IN THE FAIR VALUE OF TRADING DERIVATIVES PRIMARILY REFLECTS THE EFFECT OF COMMODITY PRICE RISES ON EDF
TRADING'S POSITIONS. A SIMILAR EFFECT IS OBSERVED IN FINANCIAL ASSETS (SEE NOTE 21.2.1).LOANS AND OTHER FINANCIAL LIABILITIES ....................................................................................................................................................................................32
26.3 NET INDEBTEDNESS ......................................................................................................................................................................33 26.4 CHANGES IN NET INDEBTEDNESS ...................................................................................................................................................34 26.5 GUARANTEES OF BORROWINGS .....................................................................................................................................................34
NOTE 27 - DERIVATIVES AND HEDGE ACCOUNTING ................................................................................................................................35 NOTE 28 - DERIVATIVE INSTRUMENTS NOT RECORDED AS HEDGES ...................................................................................................36 NOTE 29 - OTHER LIABILITIES......................................................................................................................................................................36 NOTE 30 - CONTRIBUTION OF JOINT VENTURES ......................................................................................................................................37 NOTE 31 - RELATED PARTIES.......................................................................................................................................................................37 NOTE 32 - SUBSEQUENT EVENTS................................................................................................................................................................37
32.1 FRANCE........................................................................................................................................................................................37 32.2 GERMANY.....................................................................................................................................................................................38 32.3 UNITED KINGDOM .........................................................................................................................................................................38
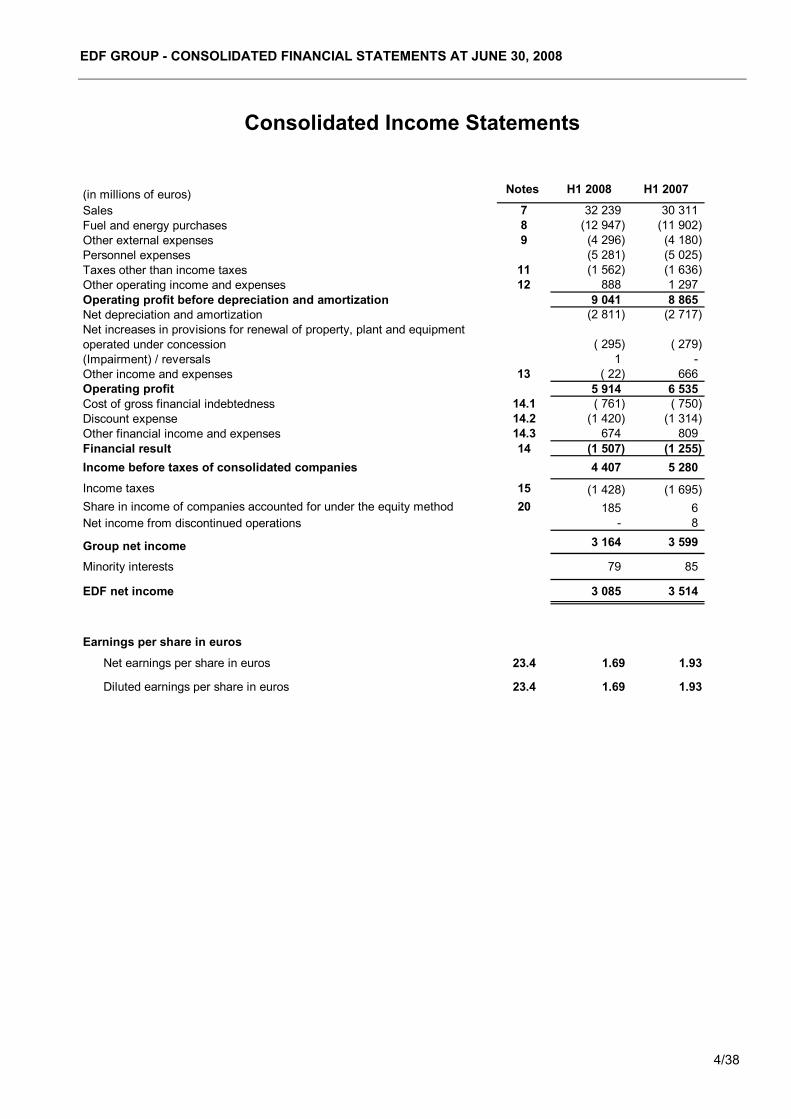
EDF GROUP - CONSOLIDATED FINANCIAL STATEMENTS AT JUNE 30, 2008
4/38
(in millions of euros) Notes H1 2008 H1 2007
Sales 7 32 239 30 311Fuel and energy purchases 8 (12 947) (11 902)Other external expenses 9 (4 296) (4 180)Personnel expenses (5 281) (5 025)Taxes other than income taxes 11 (1 562) (1 636)Other operating income and expenses 12 888 1 297Operating profit before depreciation and amortization 9 041 8 865Net depreciation and amortization (2 811) (2 717)Net increases in provisions for renewal of property, plant and equipment operated under concession ( 295) ( 279)(Impairment) / reversals 1 -Other income and expenses 13 ( 22) 666Operating profit 5 914 6 535Cost of gross financial indebtedness 14.1 ( 761) ( 750)Discount expense 14.2 (1 420) (1 314)Other financial income and expenses 14.3 674 809Financial result 14 (1 507) (1 255)Income before taxes of consolidated companies 4 407 5 280
Income taxes 15 (1 428) (1 695)Share in income of companies accounted for under the equity method 20 185 6Net income from discontinued operations - 8
Group net income 3 164 3 599
Minority interests 79 85
EDF net income 3 085 3 514
Earnings per share in euros
Net earnings per share in euros 23.4 1.69 1.93
Diluted earnings per share in euros 23.4 1.69 1.93
Consolidated Income Statements
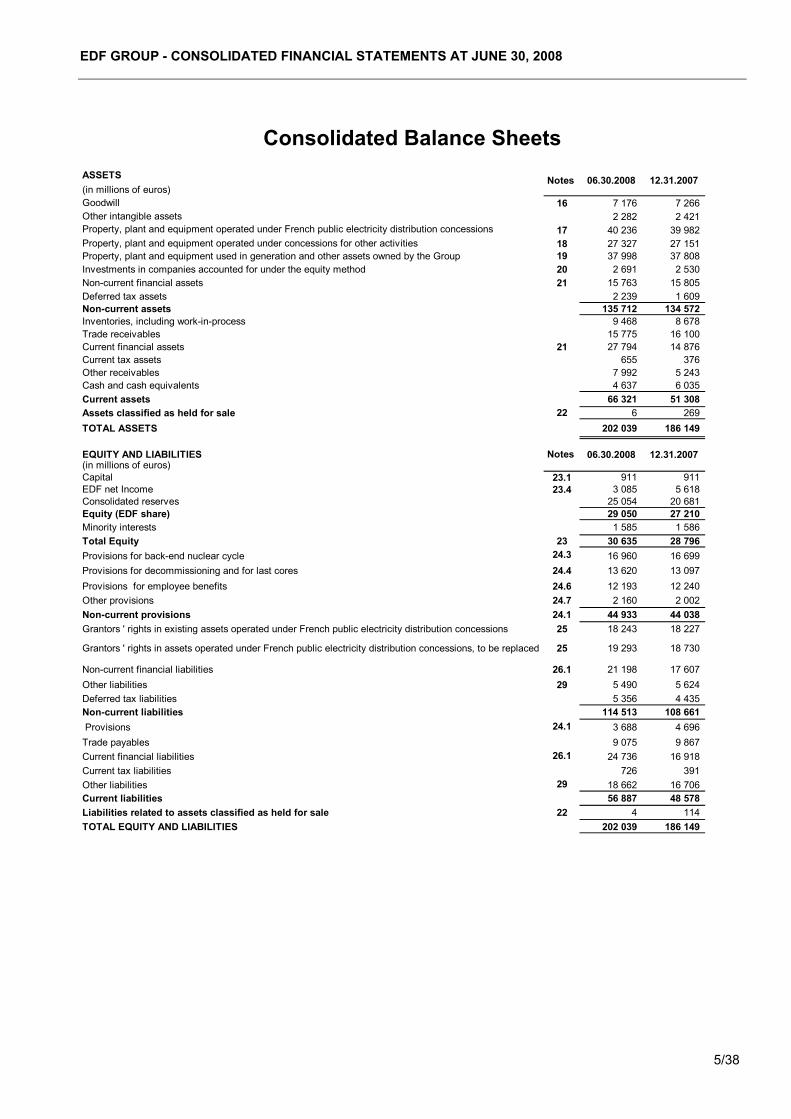
EDF GROUP - CONSOLIDATED FINANCIAL STATEMENTS AT JUNE 30, 2008
5/38
ASSETS(in millions of euros)Goodwill 16 7 176 7 266Other intangible assets 2 282 2 421Property, plant and equipment operated under French public electricity distribution concessions 17 40 236 39 982Property, plant and equipment operated under concessions for other activities 18 27 327 27 151Property, plant and equipment used in generation and other assets owned by the Group 19 37 998 37 808Investments in companies accounted for under the equity method 20 2 691 2 530Non-current financial assets 21 15 763 15 805Deferred tax assets 2 239 1 609Non-current assets 135 712 134 572Inventories, including work-in-process 9 468 8 678Trade receivables 15 775 16 100Current financial assets 21 27 794 14 876Current tax assets 655 376Other receivables 7 992 5 243Cash and cash equivalents 4 637 6 035Current assets 66 321 51 308Assets classified as held for sale 22 6 269TOTAL ASSETS 202 039 186 149
EQUITY AND LIABILITIES(in millions of euros)Capital 23.1 911 911EDF net Income 23.4 3 085 5 618Consolidated reserves 25 054 20 681Equity (EDF share) 29 050 27 210Minority interests 1 585 1 586Total Equity 23 30 635 28 796Provisions for back-end nuclear cycle 24.3 16 960 16 699Provisions for decommissioning and for last cores 24.4 13 620 13 097Provisions for employee benefits 24.6 12 193 12 240Other provisions 24.7 2 160 2 002Non-current provisions 24.1 44 933 44 038Grantors ' rights in existing assets operated under French public electricity distribution concessions 25 18 243 18 227
Grantors ' rights in assets operated under French public electricity distribution concessions, to be replaced 25 19 293 18 730
Non-current financial liabilities 26.1 21 198 17 607Other liabilities 29 5 490 5 624Deferred tax liabilities 5 356 4 435Non-current liabilities 114 513 108 661 Provisions 24.1 3 688 4 696Trade payables 9 075 9 867Current financial liabilities 26.1 24 736 16 918Current tax liabilities 726 391Other liabilities 29 18 662 16 706Current liabilities 56 887 48 578Liabilities related to assets classified as held for sale 22 4 114TOTAL EQUITY AND LIABILITIES 202 039 186 149
Notes 12.31.2007
12.31.2007
06.30.2008
06.30.2008Notes
Consolidated Balance Sheets

EDF GROUP - CONSOLIDATED FINANCIAL STATEMENTS AT JUNE 30, 2008
6/38
(in millions of euros)Notes H1 2008 H1 2007
Operating activities :Income before tax from consolidated companies 4 407 5 280Accumulated depreciation and amortization, provisions and change in fair value 3 220 2 368Financial income and expenses 269 313Dividends received from companies accounted for under the equity method 95 114Capital gains/losses (161) (265)Change in working capital (1 835) (696)Net cash flow from operations 5 995 7 114Net financial expenses disbursed (445) (555)Income taxes paid (1 027) (848)Net cash flow from operating activities 4 523 5 711Investing activities :Acquisition of companies, net of cash acquired (109) (146)Purchases of property, plant and equipment and intangible assets (4 112) (3 023)Net proceeds from sale of property, plant and equipment and intangible assets 80 83Changes in financial assets 21.1 (3 027) (1 299)Net cash flow used in investing activities (7 168) (4 385)Financing activities :Issuance of borrowings 4 and 26.2 8 308 2 631Repayment of borrowings (5 752) (2 368)Dividends paid by parent company 23.3 (1 273) (2 114)Dividends paid to minority interests (49) (45)Capital increase subscribed by minority interests - 255Increase in special concession liabilities 112 71Investment subsidies 20 15Treasury shares 23.2 (172) (1)Net cash flow from financing activities 1 194 (1 556)Net increase/(decrease) in cash and cash equivalents (1 451) (230)Cash and cash equivalents - opening balance 6 035 3 308Effect of currency fluctuations (33) (7)Financial income on cash and cash equivalents 93 42Effect of other reclassifications (7) (14)
Cash and cash equivalents - closing balance 4 637 3 099
Consolidated Cash Flow Statements
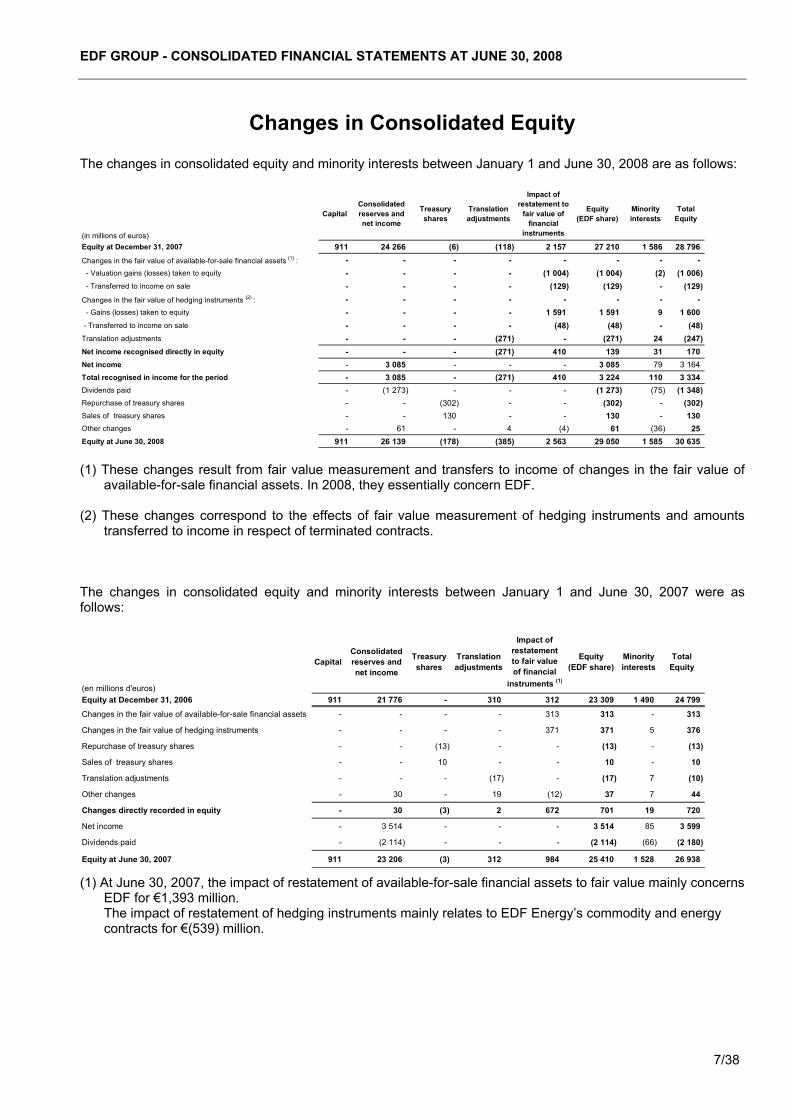
EDF GROUP - CONSOLIDATED FINANCIAL STATEMENTS AT JUNE 30, 2008
7/38
(in millions of euros)
Capital Consolidated reserves and net income
Treasury shares
Translation adjustments
Impact of restatement to
fair value of financial
instruments
Equity (EDF share)
Minority interests
Total Equity
Equity at December 31, 2007 911 24 266 (6) (118) 2 157 27 210 1 586 28 796Changes in the fair value of available-for-sale financial assets (1) : - - - - - - - - - Valuation gains (losses) taken to equity - - - - (1 004) (1 004) (2) (1 006) - Transferred to income on sale - - - - (129) (129) - (129)Changes in the fair value of hedging instruments (2) : - - - - - - - - - Gains (losses) taken to equity - - - - 1 591 1 591 9 1 600 - Transferred to income on sale - - - - (48) (48) - (48)Translation adjustments - - - (271) - (271) 24 (247)Net income recognised directly in equity - - - (271) 410 139 31 170Net income - 3 085 - - - 3 085 79 3 164Total recognised in income for the period - 3 085 - (271) 410 3 224 110 3 334Dividends paid - (1 273) - - - (1 273) (75) (1 348)Repurchase of treasury shares - - (302) - - (302) - (302)Sales of treasury shares - - 130 - - 130 - 130Other changes - 61 - 4 (4) 61 (36) 25Equity at June 30, 2008 911 26 139 (178) (385) 2 563 29 050 1 585 30 635
(en millions d'euros)
Capital Consolidated reserves and net income
Treasury shares
Translation adjustments
Impact of restatement to fair value of financial
instruments (1)
Equity (EDF share)
Minority interests
Total Equity
Equity at December 31, 2006 911 21 776 - 310 312 23 309 1 490 24 799
Changes in the fair value of available-for-sale financial assets - - - - 313 313 - 313
Changes in the fair value of hedging instruments - - - - 371 371 5 376
Repurchase of treasury shares - - (13) - - (13) - (13)
Sales of treasury shares - - 10 - - 10 - 10
Translation adjustments - - - (17) - (17) 7 (10)
Other changes - 30 - 19 (12) 37 7 44
Changes directly recorded in equity - 30 (3) 2 672 701 19 720
Net income - 3 514 - - - 3 514 85 3 599
Dividends paid - (2 114) - - - (2 114) (66) (2 180)
Equity at June 30, 2007 911 23 206 (3) 312 984 25 410 1 528 26 938
Changes in Consolidated Equity
The changes in consolidated equity and minority interests between January 1 and June 30, 2008 are as follows:
(1) These changes result from fair value measurement and transfers to income of changes in the fair value of available-for-sale financial assets. In 2008, they essentially concern EDF.
(2) These changes correspond to the effects of fair value measurement of hedging instruments and amounts
transferred to income in respect of terminated contracts. The changes in consolidated equity and minority interests between January 1 and June 30, 2007 were as follows:
(1) At June 30, 2007, the impact of restatement of available-for-sale financial assets to fair value mainly concerns EDF for €1,393 million. The impact of restatement of hedging instruments mainly relates to EDF Energy’s commodity and energy contracts for €(539) million.
EDF GROUP - CONSOLIDATED FINANCIAL STATEMENTS AT JUNE 30, 2008
8/38
Notes to the consolidated financial statements Electricité de France (EDF or “the Company”) is a French société anonyme governed by French Law, and registered in France. The EDF Group is an integrated energy company operating in all types of electricity businesses: generation, transmission, distribution, supply and trading of energies. The Company’s condensed consolidated half-year financial statements for the six months to June 30, 2008 include the accounts of the Company and its subsidiaries, and the Group’s share in the results of joint ventures and associates (all collectively referred to as “the Group”). The Group’s consolidated financial statements at June 30, 2008 were prepared under the responsibility of the Board of Directors and approved by the Directors at the Board meeting held on July 31, 2008. Note 1 - Group accounting principles and methods
1.1 Declaration of conformity and Group accounting policies Pursuant to European regulation 1606/2002 of July 19, 2002 on the adoption of international accounting standards, the EDF Group’s consolidated financial statements are prepared using the presentation, recognition and measurement rules prescribed by IAS/IFRS. The condensed consolidated half-year financial statements comply with standard IAS 34 on interim financial reporting and the IAS/IFRS international accounting standards released at June 30, 2008, in the form in which they should be mandatory at December 31, 2008. These financial statements do not include all the information required for full annual financial statements, and are to be read in conjunction with the consolidated financial statements at December 31, 2007 with reference to the principal accounting and valuation methods described in notes 1, 2 and 3 to those financial statements.
1.2 Accounting methods for the first half-year of 2008 The accounting and valuation methods applied by the Group in these consolidated half-year financial statements are identical to those used in the consolidated financial statements for the year ended December 31, 2007, with the exception of the valuation methods specific to interim financial statements as described in note 1.3. Regarding standards endorsed by the European Union but not yet mandatory in 2008, the Group has decided against early application of IFRS 8, “Operating segments”, which replaces IAS 14 and requires the entity’s financial performance and operating segments to be presented in the form in which they are regularly reviewed by management. Similarly, the Group has not opted for early application of the following standards and amendments likely to be endorsed for application by the EU in 2008 and 2009:
- Revised IAS 1, “Presentation of financial statements”; - Amendment to IAS 23, “Borrowing costs”, which removes the option allowing immediate expensing of
borrowing costs directly attributable to the acquisition, construction or production of a qualifying asset, and therefore requires such costs to be capitalized as part of the costs of that asset;
- Revised IAS 27, “Consolidated and Separate Financial Statements”; - Amendments to IAS 32 and IAS 1 entitled “Puttable financial instruments and obligations arising on
liquidation”; - Amendment to IFRS 2 “Vesting conditions and cancellations”; - Revised IFRS 3 “Business combinations”; - IFRIC 13 “Customer loyalty programmes”; - IFRIC 14 “IAS 19 – The limit on a defined benefit asset, minimum funding requirements and their
interaction”. The potential impact of all of these standards, amendments and interpretations is currently being evaluated.
EDF GROUP - CONSOLIDATED FINANCIAL STATEMENTS AT JUNE 30, 2008
9/38
The European Commission’s endorsement process for interpretation IFRIC 12, “Service Concession Arrangements”, issued by IFRIC in November 2006, is still ongoing at June 30, 2008. The analysis undertaken in 2007 by the Group leads it to consider that IFRIC 12, when applicable, will have only a limited impact on its balance sheet and income statement (see notes 3.1 and 3.2.3 to the consolidated financial statements at December 31, 2007).
1.3 Valuation methods specific to interim financial statements The following valuation methods specific to interim financial statements have been applied:
1.3.1 Employee benefits None of the actuarial assumptions used in calculating the obligation – particularly the discount rate, inflation rate and wage increase rate – has been modified over the period, with some exceptions resulting from the special electricity and gas sector (IEG) pension system reform (see note 2). The amount of the obligation corresponding to post-employment benefits and other long-term benefits at June 30, 2008 was calculated by projection of the following over one half-year:
- The obligation at December 31, 2007 for entities not covered by the special IEG pension system, - The obligation at January 1, 2008 for other entities after the effect of the reform of the special IEG
pension system, taking into account the benefits paid out and the changes in fund assets.
1.3.2 Income taxes For interim financial statements, income tax (current and deferred) is generally calculated by applying the last known estimated effective tax rate for the prevailing fiscal year for each entity or tax group to the consolidated companies' pre-tax income.
1.3.3 Transition tariff (Tarif réglementé transitoire d’ajustement de marché or TARTAM) The assumptions used to assess the contribution payable by the Group for application of the transition tariff defined in the French law of December 7, 2006 are based on the best available information and forecasts, particularly regarding the numbers of customers applying to benefit from this tariff, developments in electricity market prices and the share of the compensation to be financed by the Contribution to the Public Electricity Service (Contribution au Service Public de l’Electricité or CSPE) at each reporting date. The value reported at June 30, 2008 does not incorporate the consequences of the French law on economic modernization adopted by Parliament on July 23, 2008, which prolongs the TARTAM transition tariff system to June 30, 2010. This law will be enacted in the second half-year of 2008 (see notes 12 and 32.1.2).
1.3.4 Greenhouse gas emission quotas When a Group entity’s estimated emissions are higher than the quotas allocated for the period less any spot or forward transactions, a provision is established to cover the excess emissions. For interim financial statements, the amount of the provision is calculated pro rata to the emission output during the half-year. The provision is equivalent to the acquisition cost up to the amount acquired on the spot or forward markets, and based on market prices for the balance. 1.4 Management judgment and estimates The preparation of the financial statements requires the use of judgments, best estimates and assumptions in determining the value of assets and liabilities, income and expenses recorded for the period, and positive and negative contingencies at the closing date. The figures in future financial statements may differ from current estimates due to changes in these assumptions or economic conditions. The estimates and assumptions used in establishing the consolidated half-year financial statements at June 30, 2008 are the same as those used for the consolidated financial statements at December 31, 2007. The measurement of provisions for the back-end nuclear cycle, decommissioning and last cores is sensitive to assumptions concerning costs, inflation rate, long-term discount rate, and disbursement schedules. A revised
EDF GROUP - CONSOLIDATED FINANCIAL STATEMENTS AT JUNE 30, 2008
10/38
(in millions of euros) H1 2008 H1 2007 2007
Sales 32 239 30 311 59 637Operating profit before depreciation and amortization 9 041 8 865 15 210
estimate is therefore established at each closing date to ensure that the amounts accrued correspond to the best estimate of the costs eventually to be borne by the Group. Any significant differences resulting from these revised estimates could entail changes in the amounts accrued (see note 24.2). These provisions amount to € 30,868 million at June 30, 2008 (€30,484 million at December 31, 2007). 1.5 Seasonal nature of the business Interim sales and operating profit before depreciation and amortization are affected by significant seasonal factors in the first half of the calendar year, principally in France. This phenomenon varies according to weather conditions and the tariff structures of the period. Sales and operating profit before depreciation and amortization for the first half-years of 2008 and 2007 and the year 2007 are as follows:
Note 2 - Reform of the special electricity and gas sector (IEG) pension
system in France
2.1 Description of the reform A decree on the special pension system for electricity and gas sector (IEG) employees published in France’s Official Gazette (Journal Officiel) of January 22, 2008 was issued in accordance with the French Pension Guideline Document (Document d’Orientation sur les Retraites) of October 10, 2007, setting forth the first modifications to the system. The main provisions of this decree concern:
- Prolongation of the employee contribution period to qualify for a full pension, to be raised to 40 years from 2012; subsequent changes will be identical to those applied in the standard public-sector pension system;
- Introduction of reductions and increases in pension rates. The reduction takes the form of a financial penalty applied for employees who have not paid contributions over a sufficient period to qualify for a full pension. Conversely, the increase is a pension supplement applicable subject to certain conditions for employees who continue to work after the age of 60 and have paid contributions for 160 quarters.
- Indexing of pensions to inflation from January 1, 2009 rather than the national minimum wage (Salaire National de Base) as currently.
The decree comes into force at July 1, 2008 and is supplemented by the decrees of June 27, 2008 and July 2, 2008 covering matters such as introduction of a minimum pension, family and conjugal benefits, setting the maximum retirement age at 65, and lifting the "15-year clause" in certain circumstances (before this reform, 15 years’ employment in this sector was the minimum duration to qualify for an IEG pension). These two decrees have modified the status of electricity and gas sector employees. An agreement was signed for the IEG sector on January 29, 2008 as part of this reform, following the principles set forth in the French Pension Guideline Document. This agreement introduces the following main support measures for the changes:
- Measures concerning employees’ salaries: a 4.31% increase at January 1, 2008 in the national minimum wage applicable to current and retired employees, combined in the case of current employees with elimination of the 2.85% pension contribution compensation bonus, and revision of pay scales, including rises in starting salaries for operative staff.
- Initial measures related to longer working lives, such as the definition of additional grades of seniority and changes in the calculation methods for retirement gratuities.
This agreement will be supplemented by sector-specific or company-specific agreements on various points, particularly covering the specificities of different businesses. Negotiations are due to begin during the second half-year of 2008. The corresponding impacts will be reflected in the accounts once the agreements are concluded.

EDF GROUP - CONSOLIDATED FINANCIAL STATEMENTS AT JUNE 30, 2008
11/38
2.2 Accounting treatment The accounting treatment applied considers that:
- the pension reform laws and regulations and the support measures introduced form a coherent whole, and their impact on the Group’s obligations should therefore, in application of IAS 19, “Employee Benefits”, be recognized as a single change to the regime for both long-term and post-employment employee benefit obligations, including those indirectly affected by the measures,
- the effective date of all these measures can be set at January 1, 2008.
For post-employment benefits, the impacts of the reform and the support measures are recorded in the income statement as follows:
- the impact on obligations related to vested benefits is recorded in a one-off entry, because it corresponds to a change in the past service cost,
- the impact on obligations related to non-vested benefits is spread over the residual vesting period, - the impact on benefits that will vest after the date of the reform is included in the current service cost.
For long-term benefits, which are indirectly affected by the support measures, the impact of the changes is included directly in income for the period.
2.2.1 Impact on pension obligations at January 1, 2008 The impacts are different for the regulated and deregulated activities, and depends on the vesting period for pension rights. Specific benefits in the regulated activities (transmission and distribution) vested before January 1, 2005: in principle, the CTA levy (Contribution Tarifaire d’Acheminement) finances these benefits, including the impacts of the reform and the support measures, however it does not cover the impact of the two newly-introduced additional grades, which the Group considers a surplus cost as defined in article 18 of the Law of August 9, 2004. As this surplus cost is to be borne by the companies concerned, the Group has established a €253 million provision, with a corresponding charge against “Other income and expenses” in the income statement. Specific benefits in the deregulated activities (supply and generation) vested until December 31, 2007 and specific benefits in the regulated activities vested between January 1, 2005 and December 31, 2007: the impact of the reform is recorded at January 1, 2008, the effective date of the reform, in a one-off item of income amounting to €369 million excluding the provision for surplus costs, under “Other income and expenses” . Specific benefits vested from January 1, 2008 (in both the regulated and deregulated activities): the annual amounts recognized as the current service cost are modified from January 1, 2008 and booked under personnel expenses.
2.2.2 Impact on other employee benefit obligations at January 1, 2008 The accounting treatment of other employee benefit obligations follows the treatment used for pension obligations. When the financial effects of the measures result in a change in vested benefits, they are booked through a one-off entry in 2008 under “Other income and expenses” in the income statement. The pension reform and support measures generated a negative impact of €55 million on non-pension employee benefit obligations.
2.2.3 Changes in employee benefit’ obligations between January 1 and June 30, 2008 The new estimations for pension obligations and other “mutualized obligations” at January 1, 2008 for IEG companies were measured by the pension administration body CNIEG (Caisse Nationale des Industries Electriques et Gazières). For the purposes of the calculations, the EDF Group has considered that IEG status employees will change their behavior, extending their working life up to the duration necessary to qualify for a full pension subject to no reduction. However, no pension increase for additional periods worked in excess of the new legal requirement of 40 years has been taken into account. Any variance between these assumptions and actual employee behavior could have an impact on the financial statements.
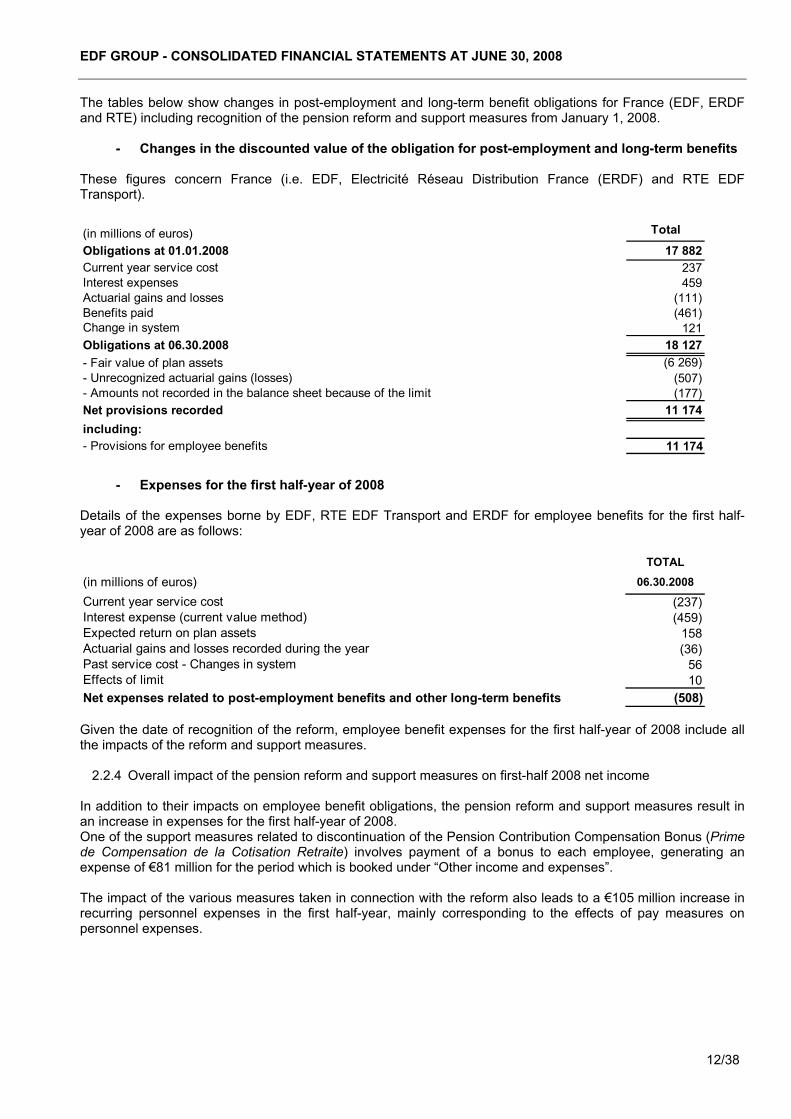
EDF GROUP - CONSOLIDATED FINANCIAL STATEMENTS AT JUNE 30, 2008
12/38
TOTAL
(in millions of euros) 06.30.2008
Current year service cost (237)Interest expense (current value method) (459)Expected return on plan assets 158Actuarial gains and losses recorded during the year (36)Past service cost - Changes in system 56Effects of limit 10Net expenses related to post-employment benefits and other long-term benefits (508)
(in millions of euros) Total
Obligations at 01.01.2008 17 882Current year service cost 237Interest expenses 459Actuarial gains and losses (111)Benefits paid (461)Change in system 121Obligations at 06.30.2008 18 127- Fair value of plan assets (6 269)- Unrecognized actuarial gains (losses) (507)- Amounts not recorded in the balance sheet because of the limit (177)Net provisions recorded 11 174including:- Provisions for employee benefits 11 174
The tables below show changes in post-employment and long-term benefit obligations for France (EDF, ERDF and RTE) including recognition of the pension reform and support measures from January 1, 2008.
- Changes in the discounted value of the obligation for post-employment and long-term benefits These figures concern France (i.e. EDF, Electricité Réseau Distribution France (ERDF) and RTE EDF Transport).
- Expenses for the first half-year of 2008
Details of the expenses borne by EDF, RTE EDF Transport and ERDF for employee benefits for the first half-year of 2008 are as follows:
Given the date of recognition of the reform, employee benefit expenses for the first half-year of 2008 include all the impacts of the reform and support measures.
2.2.4 Overall impact of the pension reform and support measures on first-half 2008 net income In addition to their impacts on employee benefit obligations, the pension reform and support measures result in an increase in expenses for the first half-year of 2008. One of the support measures related to discontinuation of the Pension Contribution Compensation Bonus (Prime de Compensation de la Cotisation Retraite) involves payment of a bonus to each employee, generating an expense of €81 million for the period which is booked under “Other income and expenses”. The impact of the various measures taken in connection with the reform also leads to a €105 million increase in recurring personnel expenses in the first half-year, mainly corresponding to the effects of pay measures on personnel expenses.
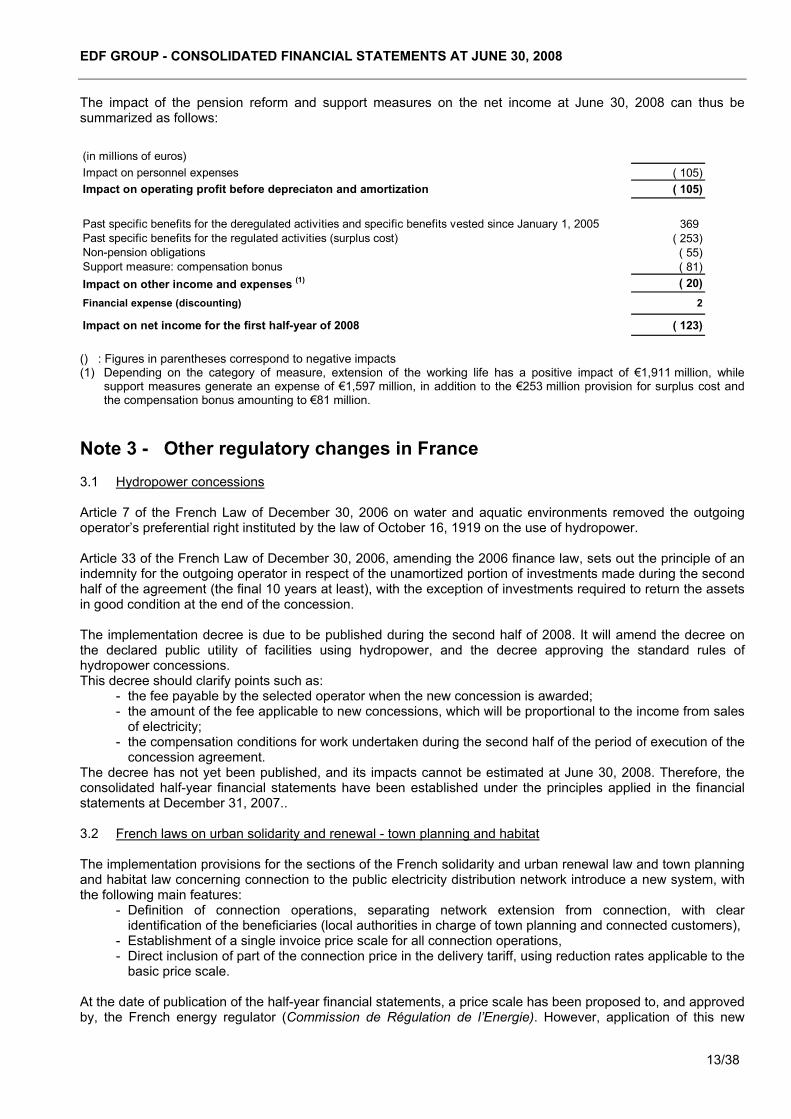
EDF GROUP - CONSOLIDATED FINANCIAL STATEMENTS AT JUNE 30, 2008
13/38
(in millions of euros)Impact on personnel expenses ( 105)Impact on operating profit before depreciaton and amortization ( 105)
Past specific benefits for the deregulated activities and specific benefits vested since January 1, 2005 369Past specific benefits for the regulated activities (surplus cost) ( 253)Non-pension obligations ( 55)Support measure: compensation bonus ( 81)Impact on other income and expenses (1) ( 20)Financial expense (discounting) 2
Impact on net income for the first half-year of 2008 ( 123)
The impact of the pension reform and support measures on the net income at June 30, 2008 can thus be summarized as follows:
() : Figures in parentheses correspond to negative impacts (1) Depending on the category of measure, extension of the working life has a positive impact of €1,911 million, while
support measures generate an expense of €1,597 million, in addition to the €253 million provision for surplus cost and the compensation bonus amounting to €81 million.
Note 3 - Other regulatory changes in France 3.1 Hydropower concessions Article 7 of the French Law of December 30, 2006 on water and aquatic environments removed the outgoing operator’s preferential right instituted by the law of October 16, 1919 on the use of hydropower. Article 33 of the French Law of December 30, 2006, amending the 2006 finance law, sets out the principle of an indemnity for the outgoing operator in respect of the unamortized portion of investments made during the second half of the agreement (the final 10 years at least), with the exception of investments required to return the assets in good condition at the end of the concession. The implementation decree is due to be published during the second half of 2008. It will amend the decree on the declared public utility of facilities using hydropower, and the decree approving the standard rules of hydropower concessions. This decree should clarify points such as:
- the fee payable by the selected operator when the new concession is awarded; - the amount of the fee applicable to new concessions, which will be proportional to the income from sales
of electricity; - the compensation conditions for work undertaken during the second half of the period of execution of the
concession agreement. The decree has not yet been published, and its impacts cannot be estimated at June 30, 2008. Therefore, the consolidated half-year financial statements have been established under the principles applied in the financial statements at December 31, 2007.. 3.2 French laws on urban solidarity and renewal - town planning and habitat The implementation provisions for the sections of the French solidarity and urban renewal law and town planning and habitat law concerning connection to the public electricity distribution network introduce a new system, with the following main features:
- Definition of connection operations, separating network extension from connection, with clear identification of the beneficiaries (local authorities in charge of town planning and connected customers),
- Establishment of a single invoice price scale for all connection operations, - Direct inclusion of part of the connection price in the delivery tariff, using reduction rates applicable to the
basic price scale. At the date of publication of the half-year financial statements, a price scale has been proposed to, and approved by, the French energy regulator (Commission de Régulation de l’Energie). However, application of this new
EDF GROUP - CONSOLIDATED FINANCIAL STATEMENTS AT JUNE 30, 2008
14/38
system, the impact of which is being measured, is suspended pending a decision due to be published during the second half-year of 2008, and expected to take effect from January 1, 2009. Note 4 - Significant events and transactions of the first half-year of 2008 In addition to the reform of the special IEG pension system described in note 2, EDF undertook bond issues during the first half-year of 2008 for a total amount of €3.3 billion and £0.5 billion (€0.6 billion). These issues were placed with French and international institutional investors and reflect the growing centralization of financing for subsidiaries and EDF’s operating investment program. Maturities vary from 6 to 20 years, as part of the Group's policy to increase the average duration of its debt. In May 2008, RTE EDF Transport also issued a €1.25 billion 7-year bond. The economy of the first half-year of 2008 was marked by rising prices on the energy markets, particularly for fossil fuels, and a noticeable deterioration of the situation on the financial markets. Note 5 - Changes in the scope of consolidation 5.1 Changes in the scope of consolidation during the first half-year of 2008 The main changes in the scope of consolidation during the first half-year of 2008 have no significant impact on the financial statements and result from the following:
• "Italy”: - Sale by Edison in April 2008 of seven thermoelectric plants.
• “Rest of Europe”: - Sale of SOPROLIF completed in February 2008.
- Purchase by EDF of shares in ECW for €54 million after Gaz de France exercised its put option, raising
the EDF Group’s ownership interest from 77.52% to 99.66%.
- Various external growth operations by Dalkia International, including acquisition of the Praterm Group in Poland.
5.2 Changes in the scope of consolidation in 2007
The main changes in the scope of consolidation during 2007 are described below:
• “Germany”:
- Sale by EnBW of its subsidiary U plus, a specialized waste processor, for a price of €35 million, generating a net-of-tax gain of €15 million;
- Changes in the EnBW consolidation:
- application of the equity method for seven companies, including the 35%-owned Drewag, - full consolidation of ESW and GSW following acquisitions of additional investments.
• “Italy”:
- Exercise of Edison warrants reducing the EDF Group’s ownership interest to 48.96%;
- Sale by Edison in February 2007 of its 66.32% investment in Serene, after approval was issued by the
competent competition authorities, for €98 million;
- Full consolidation of Thisvi Power Generation Plant in the Edison Group, following acquisition of 65% of its capital in early 2007.
EDF GROUP - CONSOLIDATED FINANCIAL STATEMENTS AT JUNE 30, 2008
15/38
• Other areas:
- Change in consolidation method applied for SSE, which has been proportionally consolidated since
January 1, 2007; - Acquisition by Edev of a further 13.77% in Electricité de Strasbourg in September 2007, for €150 million.
The resulting goodwill, based on the value of assets and liabilities included in the Group’s financial statements, is €126 million;
- Full consolidation of Supra and Fahrenheit, proportional consolidation of Sloe, EDF Investissement
Groupe and Domofinance, and external growth operations in the Dalkia and EDF Energies Nouvelles Groups in the "Rest of Europe";
- Formation in July 2007 of the Unistar Nuclear Energy group, jointly held 50/50 with the US electricity
Group Constellation Energy, to develop EPR-type nuclear power plants in the United States; EDF’s initial investment was $350 million. Unistar Nuclear Energy is proportionally consolidated;
- Sale by EDF International on May 4, 2007 of its residual investment in Edenor for $171 million (€125
million), generating a gain of €111 million. - Sale by EDF International on December 27, 2007 of its activities in Mexico for €951 million, after
repayment of the debt reported in the companies’ balance sheets. This sale generated a net-of-tax gain of €376 million; the impact on the Group’s net indebtedness is €970 million.
Note 6 - Segment reporting Segment reporting corresponds to the Group’s internal organization, reflecting the various risks and rates of return to which the Group is exposed. Segment reporting is primarily by geographical area based on the location of assets, with the “country” risk taking priority over the “business” risk in view of the differences in economic, regulatory and technical environments between the various areas in which the Group operates. Segment reporting is determined before inter-segment consolidation adjustments and inter-segment eliminations. Inter-segment transactions take place at market prices The breakdown used by the EDF Group for geographical areas is as follows:
- “France”, which refers to EDF and its subsidiaries RTE EDF Transport and ERDF, comprising their regulated activities (mainly Distribution and Transmission) and deregulated activities (mainly Generation and Supply);
- “United Kingdom”, which comprises the entities of the EDF Energy subgroup; - “Germany”, which refers to the entities of the EnBW subgroup; - “Italy”, which covers all the entities located in Italy, principally the Edison subgroup, TDE, and Fenice; - “Rest of Europe”, which groups together the other European entities mostly located in continental
Europe, and new investments and businesses including Electricité de Strasbourg, Dalkia, Tiru, EDF International, EDF Energies Nouvelles and EDF Trading;
- “Rest of the World” which covers entities in the United States, Latin America and Asia.
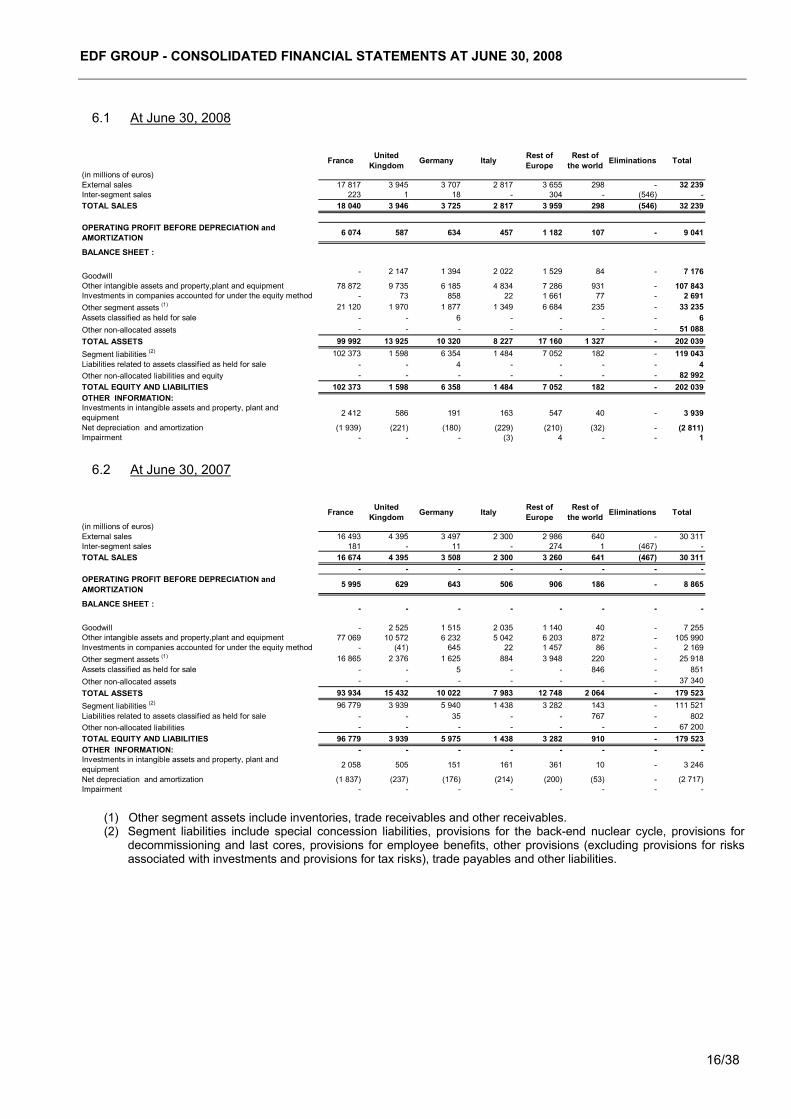
EDF GROUP - CONSOLIDATED FINANCIAL STATEMENTS AT JUNE 30, 2008
16/38
(in millions of euros)
France United Kingdom Germany Italy Rest of
EuropeRest of
the world Eliminations Total
External sales 17 817 3 945 3 707 2 817 3 655 298 - 32 239Inter-segment sales 223 1 18 - 304 - (546) -TOTAL SALES 18 040 3 946 3 725 2 817 3 959 298 (546) 32 239
OPERATING PROFIT BEFORE DEPRECIATION and AMORTIZATION 6 074 587 634 457 1 182 107 - 9 041
BALANCE SHEET :
Goodwill - 2 147 1 394 2 022 1 529 84 - 7 176
Other intangible assets and property,plant and equipment 78 872 9 735 6 185 4 834 7 286 931 - 107 843Investments in companies accounted for under the equity method - 73 858 22 1 661 77 - 2 691Other segment assets (1) 21 120 1 970 1 877 1 349 6 684 235 - 33 235Assets classified as held for sale - - 6 - - - - 6Other non-allocated assets - - - - - - - 51 088TOTAL ASSETS 99 992 13 925 10 320 8 227 17 160 1 327 - 202 039Segment liabilities (2) 102 373 1 598 6 354 1 484 7 052 182 - 119 043Liabilities related to assets classified as held for sale - - 4 - - - - 4Other non-allocated liabilities and equity - - - - - - - 82 992TOTAL EQUITY AND LIABILITIES 102 373 1 598 6 358 1 484 7 052 182 - 202 039OTHER INFORMATION: Investments in intangible assets and property, plant and equipment 2 412 586 191 163 547 40 - 3 939
Net depreciation and amortization (1 939) (221) (180) (229) (210) (32) - (2 811)Impairment - - - (3) 4 - - 1
(in millions of euros)
France United Kingdom Germany Italy Rest of
EuropeRest of
the world Eliminations Total
External sales 16 493 4 395 3 497 2 300 2 986 640 - 30 311Inter-segment sales 181 - 11 - 274 1 (467) -TOTAL SALES 16 674 4 395 3 508 2 300 3 260 641 (467) 30 311
- - - - - - - -OPERATING PROFIT BEFORE DEPRECIATION and AMORTIZATION 5 995 629 643 506 906 186 - 8 865
BALANCE SHEET : - - - - - - - -
Goodwill - 2 525 1 515 2 035 1 140 40 - 7 255Other intangible assets and property,plant and equipment 77 069 10 572 6 232 5 042 6 203 872 - 105 990Investments in companies accounted for under the equity method - (41) 645 22 1 457 86 - 2 169Other segment assets (1) 16 865 2 376 1 625 884 3 948 220 - 25 918Assets classified as held for sale - - 5 - - 846 - 851Other non-allocated assets - - - - - - - 37 340TOTAL ASSETS 93 934 15 432 10 022 7 983 12 748 2 064 - 179 523Segment liabilities (2) 96 779 3 939 5 940 1 438 3 282 143 - 111 521Liabilities related to assets classified as held for sale - - 35 - - 767 - 802Other non-allocated liabilities - - - - - - - 67 200TOTAL EQUITY AND LIABILITIES 96 779 3 939 5 975 1 438 3 282 910 - 179 523OTHER INFORMATION: - - - - - - - -Investments in intangible assets and property, plant and equipment 2 058 505 151 161 361 10 - 3 246
Net depreciation and amortization (1 837) (237) (176) (214) (200) (53) - (2 717)Impairment - - - - - - - -
6.1 At June 30, 2008
6.2 At June 30, 2007
(1) Other segment assets include inventories, trade receivables and other receivables. (2) Segment liabilities include special concession liabilities, provisions for the back-end nuclear cycle, provisions for
decommissioning and last cores, provisions for employee benefits, other provisions (excluding provisions for risks associated with investments and provisions for tax risks), trade payables and other liabilities.
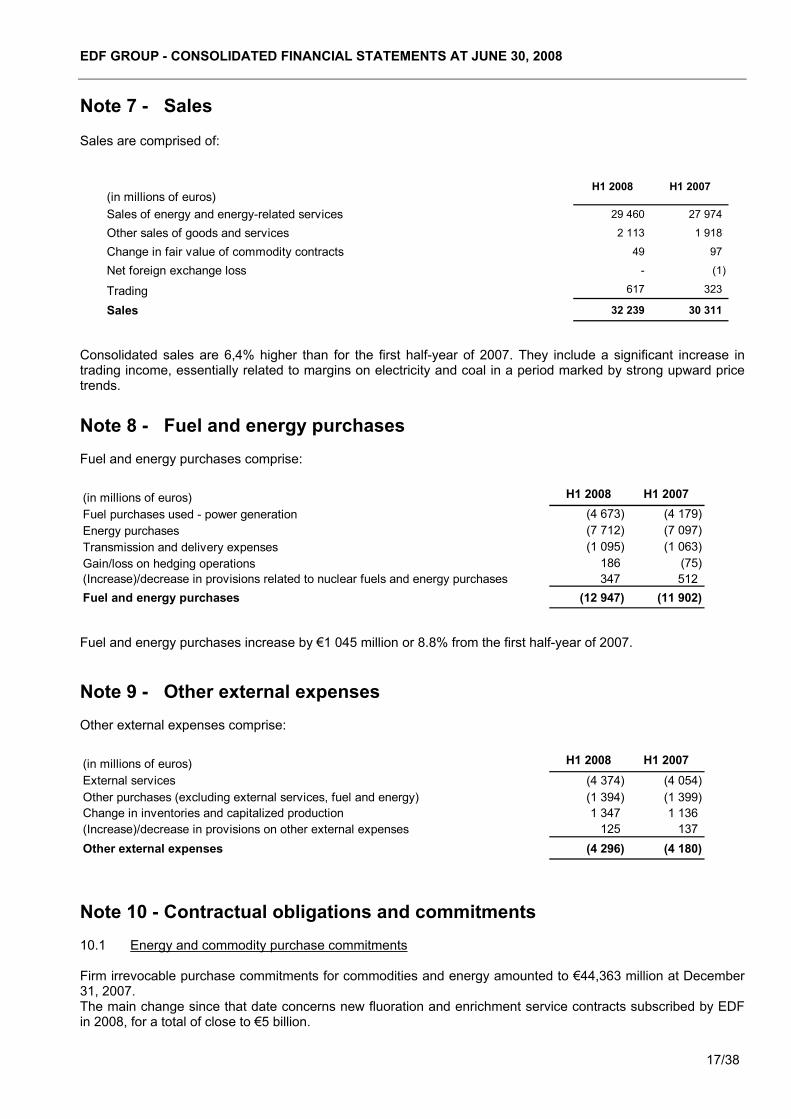
EDF GROUP - CONSOLIDATED FINANCIAL STATEMENTS AT JUNE 30, 2008
17/38
(in millions of euros)H1 2008 H1 2007
Sales of energy and energy-related services 29 460 27 974
Other sales of goods and services 2 113 1 918
Change in fair value of commodity contracts 49 97
Net foreign exchange loss - (1)
Trading 617 323
Sales 32 239 30 311
(in millions of euros) H1 2008 H1 2007Fuel purchases used - power generation (4 673) (4 179)Energy purchases (7 712) (7 097)Transmission and delivery expenses (1 095) (1 063)Gain/loss on hedging operations 186 (75)(Increase)/decrease in provisions related to nuclear fuels and energy purchases 347 512Fuel and energy purchases (12 947) (11 902)
(in millions of euros) H1 2008 H1 2007External services (4 374) (4 054)Other purchases (excluding external services, fuel and energy) (1 394) (1 399)Change in inventories and capitalized production 1 347 1 136(Increase)/decrease in provisions on other external expenses 125 137Other external expenses (4 296) (4 180)
Note 7 - Sales Sales are comprised of:
Consolidated sales are 6,4% higher than for the first half-year of 2007. They include a significant increase in trading income, essentially related to margins on electricity and coal in a period marked by strong upward price trends. Note 8 - Fuel and energy purchases Fuel and energy purchases comprise:
Fuel and energy purchases increase by €1 045 million or 8.8% from the first half-year of 2007. Note 9 - Other external expenses Other external expenses comprise:
Note 10 - Contractual obligations and commitments 10.1 Energy and commodity purchase commitments Firm irrevocable purchase commitments for commodities and energy amounted to €44,363 million at December 31, 2007. The main change since that date concerns new fluoration and enrichment service contracts subscribed by EDF in 2008, for a total of close to €5 billion.
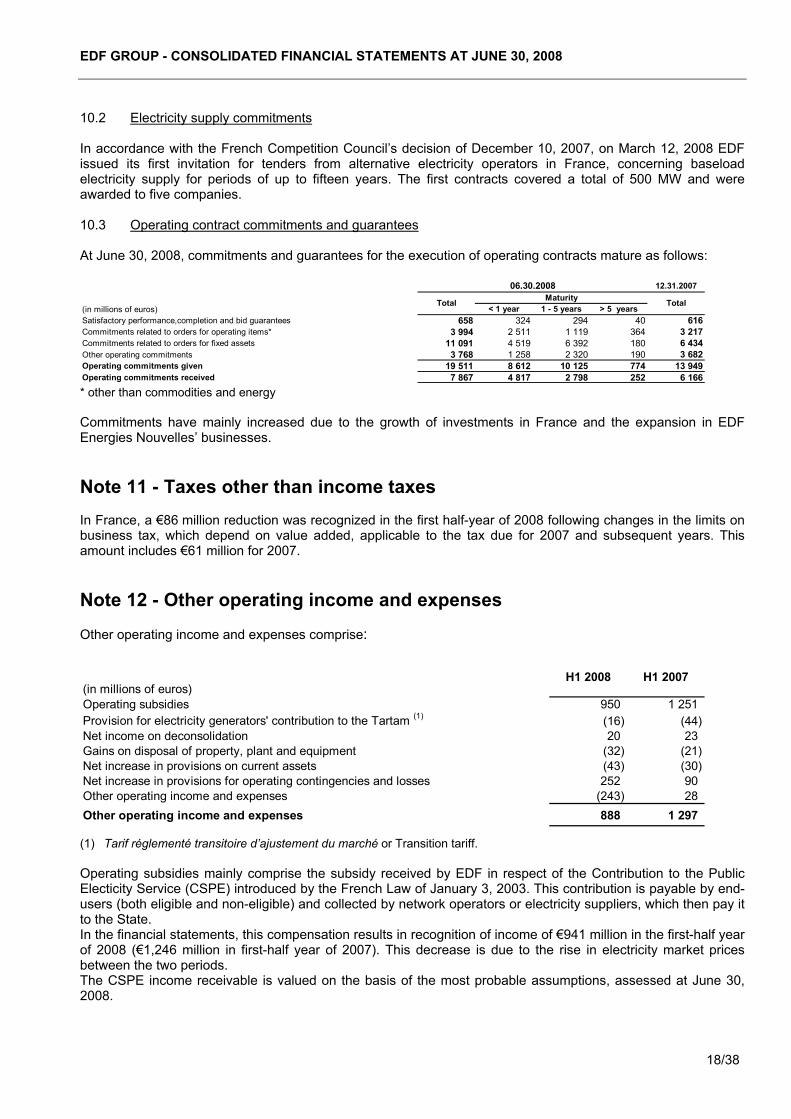
EDF GROUP - CONSOLIDATED FINANCIAL STATEMENTS AT JUNE 30, 2008
18/38
12.31.2007
(in millions of euros) < 1 year 1 - 5 years > 5 yearsSatisfactory performance,completion and bid guarantees 658 324 294 40 616Commitments related to orders for operating items* 3 994 2 511 1 119 364 3 217Commitments related to orders for fixed assets 11 091 4 519 6 392 180 6 434Other operating commitments 3 768 1 258 2 320 190 3 682Operating commitments given 19 511 8 612 10 125 774 13 949Operating commitments received 7 867 4 817 2 798 252 6 166
06.30.2008
Total Maturity Total
(in millions of euros)H1 2008 H1 2007
Operating subsidies 950 1 251Provision for electricity generators' contribution to the Tartam (1) (16) (44)Net income on deconsolidation 20 23Gains on disposal of property, plant and equipment (32) (21)Net increase in provisions on current assets (43) (30)Net increase in provisions for operating contingencies and losses 252 90Other operating income and expenses (243) 28Other operating income and expenses 888 1 297
10.2 Electricity supply commitments In accordance with the French Competition Council’s decision of December 10, 2007, on March 12, 2008 EDF issued its first invitation for tenders from alternative electricity operators in France, concerning baseload electricity supply for periods of up to fifteen years. The first contracts covered a total of 500 MW and were awarded to five companies. 10.3 Operating contract commitments and guarantees At June 30, 2008, commitments and guarantees for the execution of operating contracts mature as follows:
* other than commodities and energy Commitments have mainly increased due to the growth of investments in France and the expansion in EDF Energies Nouvelles’ businesses. Note 11 - Taxes other than income taxes In France, a €86 million reduction was recognized in the first half-year of 2008 following changes in the limits on business tax, which depend on value added, applicable to the tax due for 2007 and subsequent years. This amount includes €61 million for 2007. Note 12 - Other operating income and expenses Other operating income and expenses comprise:
(1) Tarif réglementé transitoire d’ajustement du marché or Transition tariff. Operating subsidies mainly comprise the subsidy received by EDF in respect of the Contribution to the Public Electicity Service (CSPE) introduced by the French Law of January 3, 2003. This contribution is payable by end-users (both eligible and non-eligible) and collected by network operators or electricity suppliers, which then pay it to the State. In the financial statements, this compensation results in recognition of income of €941 million in the first-half year of 2008 (€1,246 million in first-half year of 2007). This decrease is due to the rise in electricity market prices between the two periods. The CSPE income receivable is valued on the basis of the most probable assumptions, assessed at June 30, 2008.
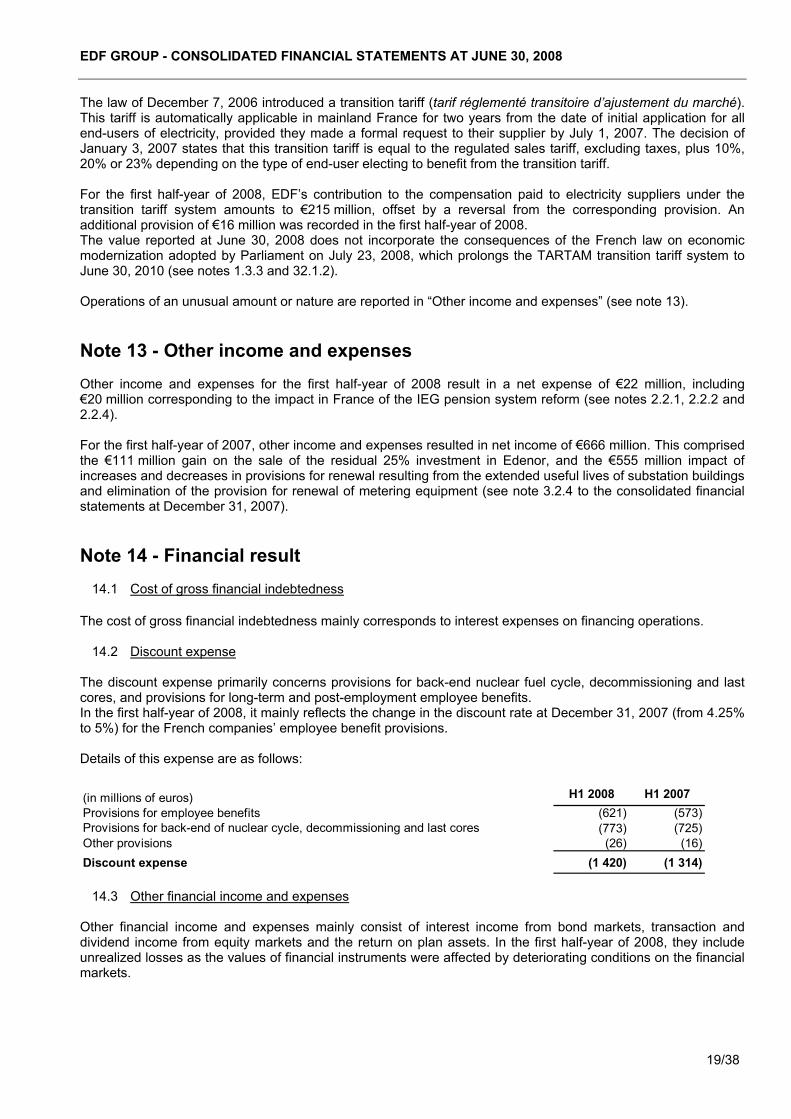
EDF GROUP - CONSOLIDATED FINANCIAL STATEMENTS AT JUNE 30, 2008
19/38
(in millions of euros) H1 2008 H1 2007Provisions for employee benefits (621) (573)Provisions for back-end of nuclear cycle, decommissioning and last cores (773) (725)Other provisions (26) (16)Discount expense (1 420) (1 314)
The law of December 7, 2006 introduced a transition tariff (tarif réglementé transitoire d’ajustement du marché). This tariff is automatically applicable in mainland France for two years from the date of initial application for all end-users of electricity, provided they made a formal request to their supplier by July 1, 2007. The decision of January 3, 2007 states that this transition tariff is equal to the regulated sales tariff, excluding taxes, plus 10%, 20% or 23% depending on the type of end-user electing to benefit from the transition tariff. For the first half-year of 2008, EDF’s contribution to the compensation paid to electricity suppliers under the transition tariff system amounts to €215 million, offset by a reversal from the corresponding provision. An additional provision of €16 million was recorded in the first half-year of 2008. The value reported at June 30, 2008 does not incorporate the consequences of the French law on economic modernization adopted by Parliament on July 23, 2008, which prolongs the TARTAM transition tariff system to June 30, 2010 (see notes 1.3.3 and 32.1.2). Operations of an unusual amount or nature are reported in “Other income and expenses” (see note 13). Note 13 - Other income and expenses Other income and expenses for the first half-year of 2008 result in a net expense of €22 million, including €20 million corresponding to the impact in France of the IEG pension system reform (see notes 2.2.1, 2.2.2 and 2.2.4). For the first half-year of 2007, other income and expenses resulted in net income of €666 million. This comprised the €111 million gain on the sale of the residual 25% investment in Edenor, and the €555 million impact of increases and decreases in provisions for renewal resulting from the extended useful lives of substation buildings and elimination of the provision for renewal of metering equipment (see note 3.2.4 to the consolidated financial statements at December 31, 2007). Note 14 - Financial result
14.1 Cost of gross financial indebtedness The cost of gross financial indebtedness mainly corresponds to interest expenses on financing operations.
14.2 Discount expense The discount expense primarily concerns provisions for back-end nuclear fuel cycle, decommissioning and last cores, and provisions for long-term and post-employment employee benefits. In the first half-year of 2008, it mainly reflects the change in the discount rate at December 31, 2007 (from 4.25% to 5%) for the French companies’ employee benefit provisions. Details of this expense are as follows:
14.3 Other financial income and expenses Other financial income and expenses mainly consist of interest income from bond markets, transaction and dividend income from equity markets and the return on plan assets. In the first half-year of 2008, they include unrealized losses as the values of financial instruments were affected by deteriorating conditions on the financial markets.
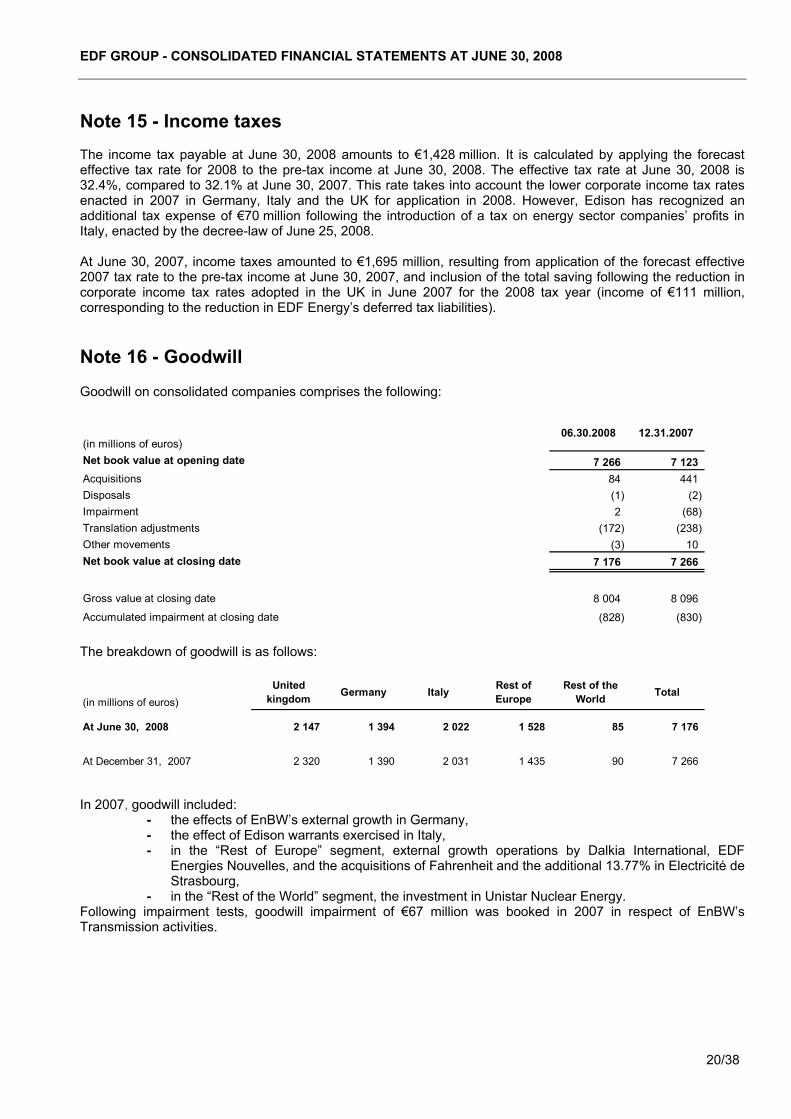
EDF GROUP - CONSOLIDATED FINANCIAL STATEMENTS AT JUNE 30, 2008
20/38
(in millions of euros)06.30.2008 12.31.2007
Net book value at opening date 7 266 7 123Acquisitions 84 441Disposals (1) (2)Impairment 2 (68)Translation adjustments (172) (238)Other movements (3) 10Net book value at closing date 7 176 7 266
Gross value at closing date 8 004 8 096
Accumulated impairment at closing date (828) (830)
(in millions of euros)United
kingdom Germany Italy Rest of Europe
Rest of the World Total
At June 30, 2008 2 147 1 394 2 022 1 528 85 7 176
At December 31, 2007 2 320 1 390 2 031 1 435 90 7 266
Note 15 - Income taxes The income tax payable at June 30, 2008 amounts to €1,428 million. It is calculated by applying the forecast effective tax rate for 2008 to the pre-tax income at June 30, 2008. The effective tax rate at June 30, 2008 is 32.4%, compared to 32.1% at June 30, 2007. This rate takes into account the lower corporate income tax rates enacted in 2007 in Germany, Italy and the UK for application in 2008. However, Edison has recognized an additional tax expense of €70 million following the introduction of a tax on energy sector companies’ profits in Italy, enacted by the decree-law of June 25, 2008. At June 30, 2007, income taxes amounted to €1,695 million, resulting from application of the forecast effective 2007 tax rate to the pre-tax income at June 30, 2007, and inclusion of the total saving following the reduction in corporate income tax rates adopted in the UK in June 2007 for the 2008 tax year (income of €111 million, corresponding to the reduction in EDF Energy’s deferred tax liabilities). Note 16 - Goodwill Goodwill on consolidated companies comprises the following:
The breakdown of goodwill is as follows:
In 2007, goodwill included:
- the effects of EnBW’s external growth in Germany, - the effect of Edison warrants exercised in Italy, - in the “Rest of Europe” segment, external growth operations by Dalkia International, EDF
Energies Nouvelles, and the acquisitions of Fahrenheit and the additional 13.77% in Electricité de Strasbourg,
- in the “Rest of the World” segment, the investment in Unistar Nuclear Energy. Following impairment tests, goodwill impairment of €67 million was booked in 2007 in respect of EnBW’s Transmission activities.

EDF GROUP - CONSOLIDATED FINANCIAL STATEMENTS AT JUNE 30, 2008
21/38
(in millions of euros)06.30.2008 12.31.2007
Property, plant and equipment 38 480 38 691Property, plant and equipment in progress 1 756 1 291Property, plant and equipment operated under French public electricity distribution concessions 40 236 39 982
(in millions of euros)
Land & Buildings
Fossil-fired & hydropower
plantsNetworks
Other installations,
plant, machinery & equipment &
other
Total
Gross values at 12.31.2007 2 060 11 61 145 2 770 65 986
Increases (1) 7 - 686 52 745Decreases (22) - (223) (78) (323)Changes in the scope of consolidation (1) - - - (1)Other movements 7 - 12 - 19
Gross values at 06.30.2008 2 051 11 61 620 2 744 66 426
Depreciation and impairment at 12.31.2007 (1 137) (2) (24 149) (2 007) (27 295)
Net depreciation (15) - (75) (50) (140)Disposals 22 - 194 78 294
Changes in the scope of consolidation 1 - - - 1
Other movements (2) (12) - (764) (30) (806)Depreciation and impairment at 06.30.2008 (1 141) (2) (24 794) (2 009) (27 946)
Net values at 12.31.2007 923 9 36 996 763 38 691
Net values at 06.30.2008 910 9 36 826 735 38 480
Note 17 - Property, plant and equipment operated under French public
electricity distribution concessions
17.1 Net value of property, plant and equipment operated under French public electricity distribution concessions
The net value of property, plant and equipment operated under French public electricity distribution concessions breaks down as follows:
17.2 Movements in property, plant and equipment operated under French public electricity distribution
concessions (excluding construction in progress):
(1) Increases also include assets contributed for nil consideration. (2) Other movements mainly concern depreciation of assets operated under concession, booked against depreciation
recorded in the special concession liabilities.
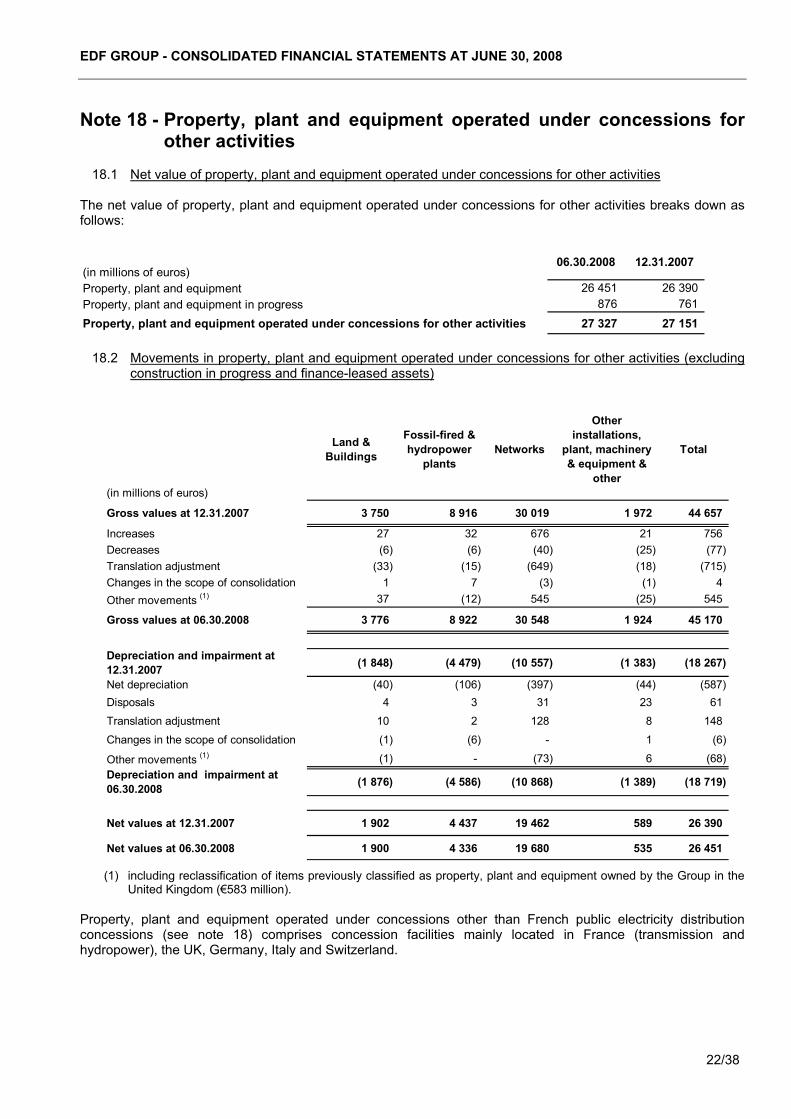
EDF GROUP - CONSOLIDATED FINANCIAL STATEMENTS AT JUNE 30, 2008
22/38
(in millions of euros)06.30.2008 12.31.2007
Property, plant and equipment 26 451 26 390Property, plant and equipment in progress 876 761Property, plant and equipment operated under concessions for other activities 27 327 27 151
(in millions of euros)
Land & Buildings
Fossil-fired & hydropower
plantsNetworks
Other installations,
plant, machinery & equipment &
other
Total
Gross values at 12.31.2007 3 750 8 916 30 019 1 972 44 657
Increases 27 32 676 21 756Decreases (6) (6) (40) (25) (77)Translation adjustment (33) (15) (649) (18) (715)Changes in the scope of consolidation 1 7 (3) (1) 4Other movements (1) 37 (12) 545 (25) 545
Gross values at 06.30.2008 3 776 8 922 30 548 1 924 45 170
Depreciation and impairment at 12.31.2007 (1 848) (4 479) (10 557) (1 383) (18 267)
Net depreciation (40) (106) (397) (44) (587)Disposals 4 3 31 23 61Translation adjustment 10 2 128 8 148
Changes in the scope of consolidation (1) (6) - 1 (6)
Other movements (1) (1) - (73) 6 (68)Depreciation and impairment at 06.30.2008 (1 876) (4 586) (10 868) (1 389) (18 719)
Net values at 12.31.2007 1 902 4 437 19 462 589 26 390
Net values at 06.30.2008 1 900 4 336 19 680 535 26 451
Note 18 - Property, plant and equipment operated under concessions for other activities
18.1 Net value of property, plant and equipment operated under concessions for other activities
The net value of property, plant and equipment operated under concessions for other activities breaks down as follows:
18.2 Movements in property, plant and equipment operated under concessions for other activities (excluding
construction in progress and finance-leased assets)
(1) including reclassification of items previously classified as property, plant and equipment owned by the Group in the United Kingdom (€583 million).
Property, plant and equipment operated under concessions other than French public electricity distribution concessions (see note 18) comprises concession facilities mainly located in France (transmission and hydropower), the UK, Germany, Italy and Switzerland.
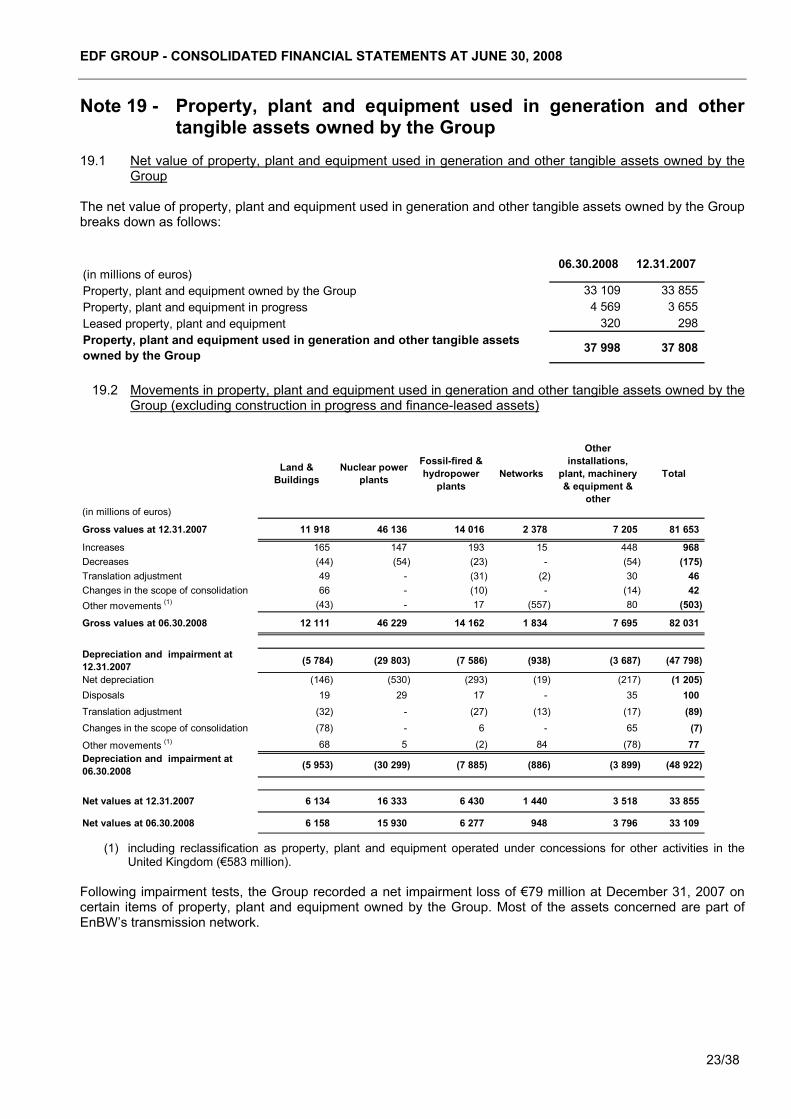
EDF GROUP - CONSOLIDATED FINANCIAL STATEMENTS AT JUNE 30, 2008
23/38
(in millions of euros)06.30.2008 12.31.2007
Property, plant and equipment owned by the Group 33 109 33 855Property, plant and equipment in progress 4 569 3 655Leased property, plant and equipment 320 298Property, plant and equipment used in generation and other tangible assets owned by the Group 37 998 37 808
(in millions of euros)
Land & Buildings
Nuclear power plants
Fossil-fired & hydropower
plantsNetworks
Other installations,
plant, machinery & equipment &
other
Total
Gross values at 12.31.2007 11 918 46 136 14 016 2 378 7 205 81 653
Increases 165 147 193 15 448 968Decreases (44) (54) (23) - (54) (175)Translation adjustment 49 - (31) (2) 30 46Changes in the scope of consolidation 66 - (10) - (14) 42Other movements (1) (43) - 17 (557) 80 (503)
Gross values at 06.30.2008 12 111 46 229 14 162 1 834 7 695 82 031
Depreciation and impairment at 12.31.2007 (5 784) (29 803) (7 586) (938) (3 687) (47 798)
Net depreciation (146) (530) (293) (19) (217) (1 205)Disposals 19 29 17 - 35 100Translation adjustment (32) - (27) (13) (17) (89)Changes in the scope of consolidation (78) - 6 - 65 (7)
Other movements (1) 68 5 (2) 84 (78) 77Depreciation and impairment at 06.30.2008 (5 953) (30 299) (7 885) (886) (3 899) (48 922)
Net values at 12.31.2007 6 134 16 333 6 430 1 440 3 518 33 855
Net values at 06.30.2008 6 158 15 930 6 277 948 3 796 33 109
Note 19 - Property, plant and equipment used in generation and other tangible assets owned by the Group
19.1 Net value of property, plant and equipment used in generation and other tangible assets owned by the
Group The net value of property, plant and equipment used in generation and other tangible assets owned by the Group breaks down as follows:
19.2 Movements in property, plant and equipment used in generation and other tangible assets owned by the
Group (excluding construction in progress and finance-leased assets)
(1) including reclassification as property, plant and equipment operated under concessions for other activities in the United Kingdom (€583 million).
Following impairment tests, the Group recorded a net impairment loss of €79 million at December 31, 2007 on certain items of property, plant and equipment owned by the Group. Most of the assets concerned are part of EnBW’s transmission network.
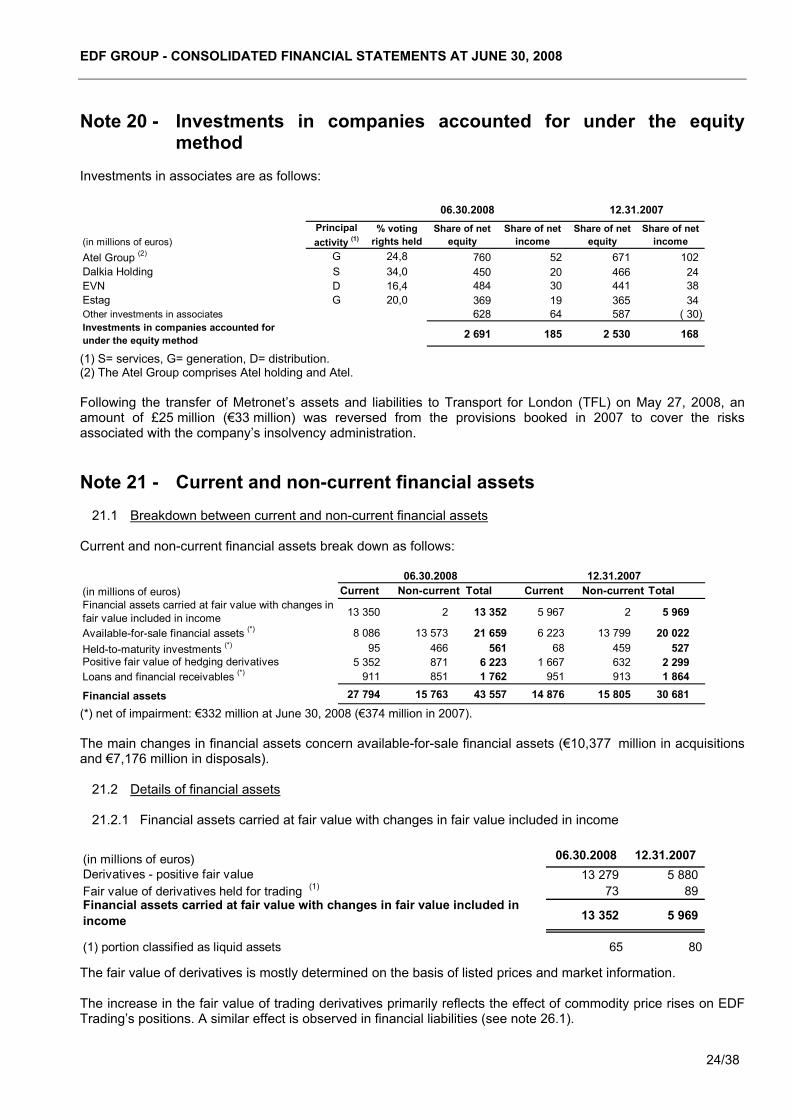
EDF GROUP - CONSOLIDATED FINANCIAL STATEMENTS AT JUNE 30, 2008
24/38
(in millions of euros) Current Non-current Total Current Non-current TotalFinancial assets carried at fair value with changes in fair value included in income 13 350 2 13 352 5 967 2 5 969
Available-for-sale financial assets (*) 8 086 13 573 21 659 6 223 13 799 20 022 Held-to-maturity investments (*) 95 466 561 68 459 527 Positive fair value of hedging derivatives 5 352 871 6 223 1 667 632 2 299 Loans and financial receivables (*) 911 851 1 762 951 913 1 864
Financial assets 27 794 15 763 43 557 14 876 15 805 30 681
06.30.2008 12.31.2007
(in millions of euros) 06.30.2008 12.31.2007Derivatives - positive fair value 13 279 5 880 Fair value of derivatives held for trading (1) 73 89 Financial assets carried at fair value with changes in fair value included in income 13 352 5 969
(1) portion classified as liquid assets 65 80
(in millions of euros)Principal activity (1)
% voting rights held
Share of net equity
Share of net income
Share of net equity
Share of net income
Atel Group (2) G 24,8 760 52 671 102Dalkia Holding S 34,0 450 20 466 24EVN D 16,4 484 30 441 38Estag G 20,0 369 19 365 34Other investments in associates 628 64 587 ( 30)Investments in companies accounted for under the equity method 2 691 185 2 530 168
06.30.2008 12.31.2007
Note 20 - Investments in companies accounted for under the equity
method Investments in associates are as follows:
(1) S= services, G= generation, D= distribution. (2) The Atel Group comprises Atel holding and Atel. Following the transfer of Metronet’s assets and liabilities to Transport for London (TFL) on May 27, 2008, an amount of £25 million (€33 million) was reversed from the provisions booked in 2007 to cover the risks associated with the company’s insolvency administration. Note 21 - Current and non-current financial assets
21.1 Breakdown between current and non-current financial assets Current and non-current financial assets break down as follows:
(*) net of impairment: €332 million at June 30, 2008 (€374 million in 2007). The main changes in financial assets concern available-for-sale financial assets (€10,377 million in acquisitions and €7,176 million in disposals).
21.2 Details of financial assets
21.2.1 Financial assets carried at fair value with changes in fair value included in income
The fair value of derivatives is mostly determined on the basis of listed prices and market information. The increase in the fair value of trading derivatives primarily reflects the effect of commodity price rises on EDF Trading’s positions. A similar effect is observed in financial liabilities (see note 26.1).
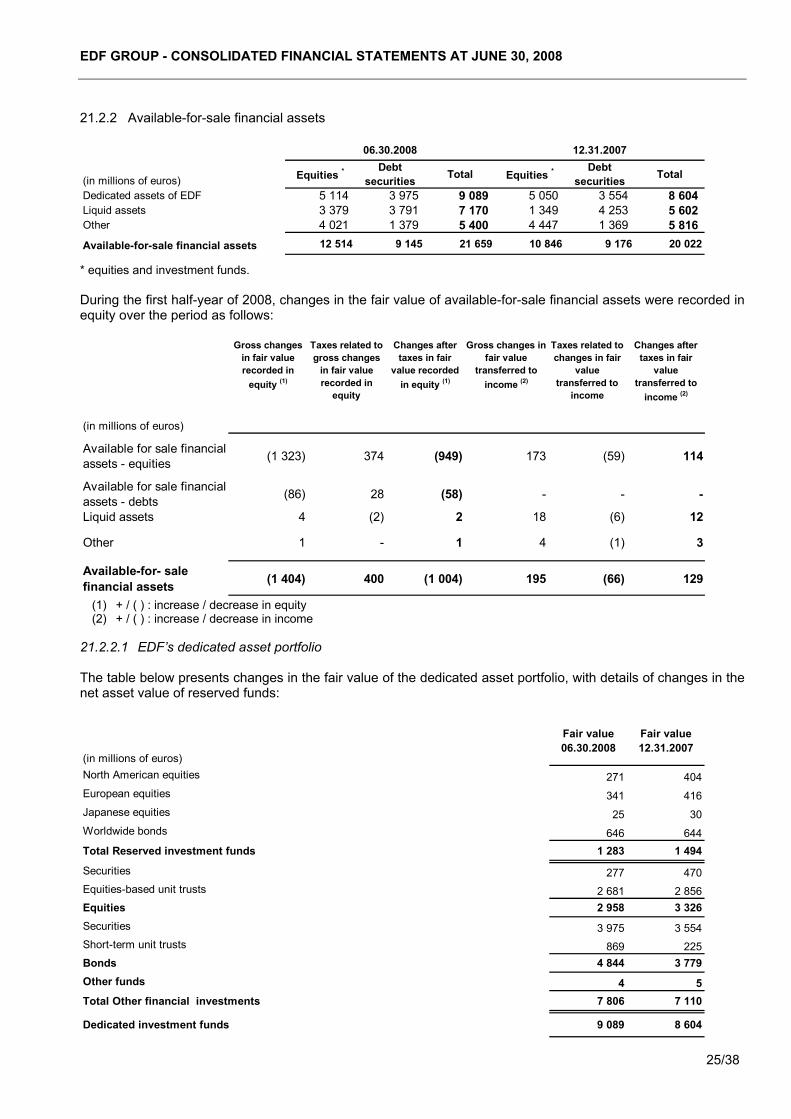
EDF GROUP - CONSOLIDATED FINANCIAL STATEMENTS AT JUNE 30, 2008
25/38
(in millions of euros)
Gross changes in fair value recorded in
equity (1)
Taxes related to gross changes
in fair value recorded in
equity
Changes after taxes in fair
value recorded in equity (1)
Gross changes in fair value
transferred to income (2)
Taxes related to changes in fair
value transferred to
income
Changes after taxes in fair
value transferred to
income (2)
Available for sale financial assets - equities (1 323) 374 (949) 173 (59) 114
Available for sale financial assets - debts (86) 28 (58) - - -
Liquid assets 4 (2) 2 18 (6) 12
Other 1 - 1 4 (1) 3
Available-for- sale financial assets (1 404) 400 (1 004) 195 (66) 129
(in millions of euros)
Fair value06.30.2008
Fair value12.31.2007
North American equities 271 404European equities 341 416Japanese equities 25 30Worldwide bonds 646 644Total Reserved investment funds 1 283 1 494
Securities 277 470Equities-based unit trusts 2 681 2 856Equities 2 958 3 326Securities 3 975 3 554Short-term unit trusts 869 225Bonds 4 844 3 779Other funds 4 5Total Other financial investments 7 806 7 110
Dedicated investment funds 9 089 8 604
(in millions of euros) Equities *Debt
securities Total Equities *Debt
securities Total
Dedicated assets of EDF 5 114 3 975 9 089 5 050 3 554 8 604 Liquid assets 3 379 3 791 7 170 1 349 4 253 5 602 Other 4 021 1 379 5 400 4 447 1 369 5 816 Available-for-sale financial assets 12 514 9 145 21 659 10 846 9 176 20 022
06.30.2008 12.31.2007
21.2.2 Available-for-sale financial assets
* equities and investment funds. During the first half-year of 2008, changes in the fair value of available-for-sale financial assets were recorded in equity over the period as follows:
(1) + / ( ) : increase / decrease in equity (2) + / ( ) : increase / decrease in income
21.2.2.1 EDF’s dedicated asset portfolio The table below presents changes in the fair value of the dedicated asset portfolio, with details of changes in the net asset value of reserved funds:
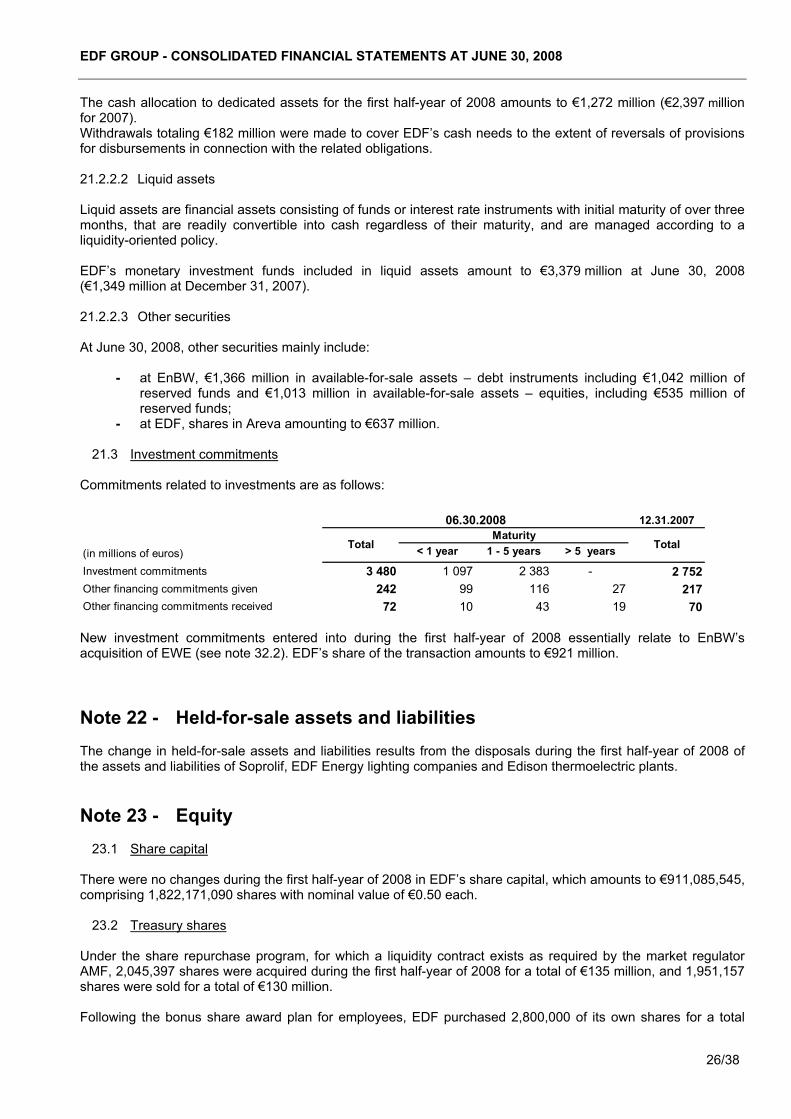
EDF GROUP - CONSOLIDATED FINANCIAL STATEMENTS AT JUNE 30, 2008
26/38
12.31.2007
(in millions of euros) < 1 year 1 - 5 years > 5 years
Investment commitments 3 480 1 097 2 383 - 2 752Other financing commitments given 242 99 116 27 217Other financing commitments received 72 10 43 19 70
06.30.2008
TotalMaturity
Total
The cash allocation to dedicated assets for the first half-year of 2008 amounts to €1,272 million (€2,397 million for 2007). Withdrawals totaling €182 million were made to cover EDF’s cash needs to the extent of reversals of provisions for disbursements in connection with the related obligations. 21.2.2.2 Liquid assets Liquid assets are financial assets consisting of funds or interest rate instruments with initial maturity of over three months, that are readily convertible into cash regardless of their maturity, and are managed according to a liquidity-oriented policy. EDF’s monetary investment funds included in liquid assets amount to €3,379 million at June 30, 2008 (€1,349 million at December 31, 2007). 21.2.2.3 Other securities At June 30, 2008, other securities mainly include:
- at EnBW, €1,366 million in available-for-sale assets – debt instruments including €1,042 million of reserved funds and €1,013 million in available-for-sale assets – equities, including €535 million of reserved funds;
- at EDF, shares in Areva amounting to €637 million.
21.3 Investment commitments Commitments related to investments are as follows:
New investment commitments entered into during the first half-year of 2008 essentially relate to EnBW’s acquisition of EWE (see note 32.2). EDF’s share of the transaction amounts to €921 million. Note 22 - Held-for-sale assets and liabilities The change in held-for-sale assets and liabilities results from the disposals during the first half-year of 2008 of the assets and liabilities of Soprolif, EDF Energy lighting companies and Edison thermoelectric plants. Note 23 - Equity
23.1 Share capital There were no changes during the first half-year of 2008 in EDF’s share capital, which amounts to €911,085,545, comprising 1,822,171,090 shares with nominal value of €0.50 each.
23.2 Treasury shares Under the share repurchase program, for which a liquidity contract exists as required by the market regulator AMF, 2,045,397 shares were acquired during the first half-year of 2008 for a total of €135 million, and 1,951,157 shares were sold for a total of €130 million. Following the bonus share award plan for employees, EDF purchased 2,800,000 of its own shares for a total
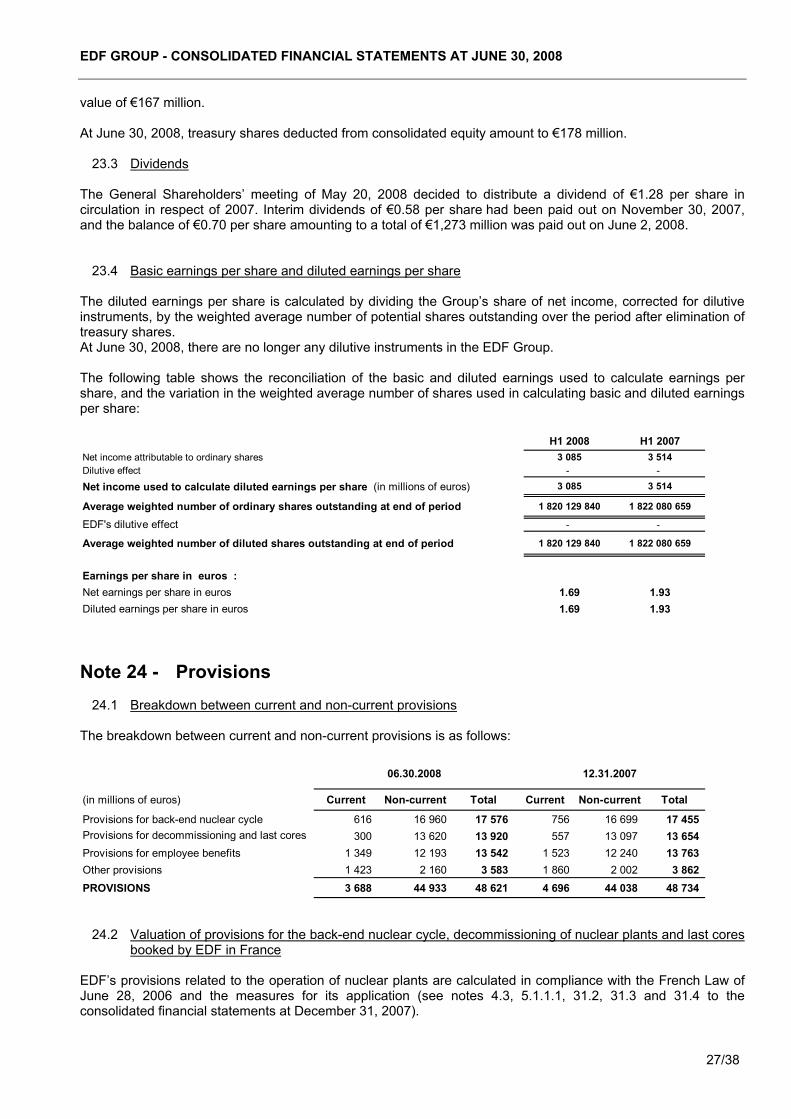
EDF GROUP - CONSOLIDATED FINANCIAL STATEMENTS AT JUNE 30, 2008
27/38
(in millions of euros) Current Non-current Total Current Non-current Total
Provisions for back-end nuclear cycle 616 16 960 17 576 756 16 699 17 455Provisions for decommissioning and last cores 300 13 620 13 920 557 13 097 13 654Provisions for employee benefits 1 349 12 193 13 542 1 523 12 240 13 763Other provisions 1 423 2 160 3 583 1 860 2 002 3 862PROVISIONS 3 688 44 933 48 621 4 696 44 038 48 734
06.30.2008 12.31.2007
H1 2008 H1 2007Net income attributable to ordinary shares 3 085 3 514Dilutive effect - -
Net income used to calculate diluted earnings per share (in millions of euros) 3 085 3 514
Average weighted number of ordinary shares outstanding at end of period 1 820 129 840 1 822 080 659
EDF's dilutive effect - -
Average weighted number of diluted shares outstanding at end of period 1 820 129 840 1 822 080 659
Earnings per share in euros :Net earnings per share in euros 1.69 1.93Diluted earnings per share in euros 1.69 1.93
value of €167 million. At June 30, 2008, treasury shares deducted from consolidated equity amount to €178 million.
23.3 Dividends The General Shareholders’ meeting of May 20, 2008 decided to distribute a dividend of €1.28 per share in circulation in respect of 2007. Interim dividends of €0.58 per share had been paid out on November 30, 2007, and the balance of €0.70 per share amounting to a total of €1,273 million was paid out on June 2, 2008.
23.4 Basic earnings per share and diluted earnings per share The diluted earnings per share is calculated by dividing the Group’s share of net income, corrected for dilutive instruments, by the weighted average number of potential shares outstanding over the period after elimination of treasury shares. At June 30, 2008, there are no longer any dilutive instruments in the EDF Group. The following table shows the reconciliation of the basic and diluted earnings used to calculate earnings per share, and the variation in the weighted average number of shares used in calculating basic and diluted earnings per share:
Note 24 - Provisions
24.1 Breakdown between current and non-current provisions The breakdown between current and non-current provisions is as follows:
24.2 Valuation of provisions for the back-end nuclear cycle, decommissioning of nuclear plants and last cores
booked by EDF in France EDF’s provisions related to the operation of nuclear plants are calculated in compliance with the French Law of June 28, 2006 and the measures for its application (see notes 4.3, 5.1.1.1, 31.2, 31.3 and 31.4 to the consolidated financial statements at December 31, 2007).
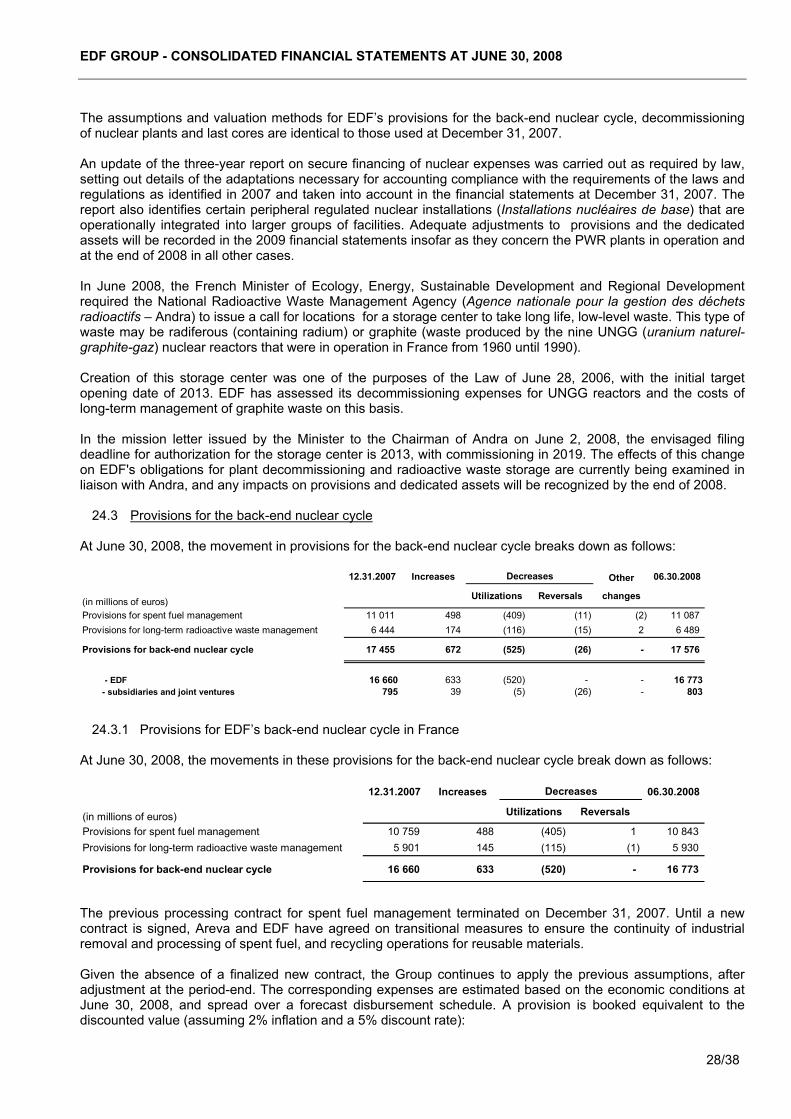
EDF GROUP - CONSOLIDATED FINANCIAL STATEMENTS AT JUNE 30, 2008
28/38
12.31.2007 Increases 06.30.2008
(in millions of euros) Utilizations Reversals
Provisions for spent fuel management 10 759 488 (405) 1 10 843Provisions for long-term radioactive waste management 5 901 145 (115) (1) 5 930
Provisions for back-end nuclear cycle 16 660 633 (520) - 16 773
Decreases
12.31.2007 Increases Other 06.30.2008
(in millions of euros) Utilizations Reversals changes
Provisions for spent fuel management 11 011 498 (409) (11) (2) 11 087Provisions for long-term radioactive waste management 6 444 174 (116) (15) 2 6 489
Provisions for back-end nuclear cycle 17 455 672 (525) (26) - 17 576
- EDF 16 660 633 (520) - - 16 773 - subsidiaries and joint ventures 795 39 (5) (26) - 803
Decreases
The assumptions and valuation methods for EDF’s provisions for the back-end nuclear cycle, decommissioning of nuclear plants and last cores are identical to those used at December 31, 2007.
An update of the three-year report on secure financing of nuclear expenses was carried out as required by law, setting out details of the adaptations necessary for accounting compliance with the requirements of the laws and regulations as identified in 2007 and taken into account in the financial statements at December 31, 2007. The report also identifies certain peripheral regulated nuclear installations (Installations nucléaires de base) that are operationally integrated into larger groups of facilities. Adequate adjustments to provisions and the dedicated assets will be recorded in the 2009 financial statements insofar as they concern the PWR plants in operation and at the end of 2008 in all other cases. In June 2008, the French Minister of Ecology, Energy, Sustainable Development and Regional Development required the National Radioactive Waste Management Agency (Agence nationale pour la gestion des déchets radioactifs – Andra) to issue a call for locations for a storage center to take long life, low-level waste. This type of waste may be radiferous (containing radium) or graphite (waste produced by the nine UNGG (uranium naturel-graphite-gaz) nuclear reactors that were in operation in France from 1960 until 1990). Creation of this storage center was one of the purposes of the Law of June 28, 2006, with the initial target opening date of 2013. EDF has assessed its decommissioning expenses for UNGG reactors and the costs of long-term management of graphite waste on this basis. In the mission letter issued by the Minister to the Chairman of Andra on June 2, 2008, the envisaged filing deadline for authorization for the storage center is 2013, with commissioning in 2019. The effects of this change on EDF's obligations for plant decommissioning and radioactive waste storage are currently being examined in liaison with Andra, and any impacts on provisions and dedicated assets will be recognized by the end of 2008.
24.3 Provisions for the back-end nuclear cycle At June 30, 2008, the movement in provisions for the back-end nuclear cycle breaks down as follows:
24.3.1 Provisions for EDF’s back-end nuclear cycle in France
At June 30, 2008, the movements in these provisions for the back-end nuclear cycle break down as follows:
The previous processing contract for spent fuel management terminated on December 31, 2007. Until a new contract is signed, Areva and EDF have agreed on transitional measures to ensure the continuity of industrial removal and processing of spent fuel, and recycling operations for reusable materials. Given the absence of a finalized new contract, the Group continues to apply the previous assumptions, after adjustment at the period-end. The corresponding expenses are estimated based on the economic conditions at June 30, 2008, and spread over a forecast disbursement schedule. A provision is booked equivalent to the discounted value (assuming 2% inflation and a 5% discount rate):

EDF GROUP - CONSOLIDATED FINANCIAL STATEMENTS AT JUNE 30, 2008
29/38
(in millions of euros)
Costs based on economic
conditions at end of period
Provisions based on
present value
Costs based on economic
conditions at end of period
Provisions based on
present value
Decommissioning provisions for fossil-fired power plants 600 421 602 420Decommissioning provisions for nuclear power plants 19 927 10 161 19 792 9 974Provisions for last cores 3 655 1 754 3 594 1 701Provisions for decommissioning and last cores 24 182 12 336 23 988 12 095
12.31.200706.30.2008
12.31.2007 Increases Other 06.30.2007
(in millions of euros) Utilizations Reversals changes
Provisions for decommisioning 11 933 300 (81) - (6) 12 146Provisions for last cores 1 721 53 - - - 1 774
Provisions for decommissioning and last cores 13 654 353 (81) - (6) 13 920of which : - EDF (corporate financial statements) 12 095 312 (71) - - 12 336 - subsidiaries and joint ventures 1 559 41 (10) - (6) 1 584
Decreases
12.31.2007 Increases 06.30.2008
(in millions of euros) Utilizations Reversals
Decommissioning provisions for fossil-fired power plants 420 10 (9) - 421Decommissioning provisions for nuclear power plants 9 974 249 (62) - 10 161Provisions for last cores 1 701 53 - - 1 754
Provisions for decommissioning and last cores 12 095 312 (71) - 12 336
Decreases
(in millions of euros)
Costs based on economic
conditions at end of period
Provisions based on
present value
Costs based on economic
conditions at end of period
Provisions based on present value
For spent fuel management 16 405 10 843 16 209 10 759For long-term radioactive waste management 20 167 5 930 20 048 5 901Back-end nuclear cycle 36 572 16 773 36 257 16 660
12.31.200706.30.2008
24.3.2 Provisions for the subsidiaries and joint ventures' back-end nuclear cycle
These provisions, amounting to €803 million at June 30, 2008 (€795 million at December 31, 2007), mainly cover the cost of eliminating the EnBW Group’s spent fuel and radioactive waste.
24.4 Provisions for decommissioning and last cores At June 30, 2008, the change in decommissioning and last core provisions breaks down as follows:
24.4.1 Provisions for EDF’s decommissioning and last cores in France
The change in EDF’s decommissioning and last core provisions in France breaks down as follows:
The corresponding expenses are estimated based on the economic conditions at June 30, 2008, and spread over a forecast disbursement schedule. A provision is booked equivalent to the discounted value (assuming 2% inflation and a 5% discount rate):
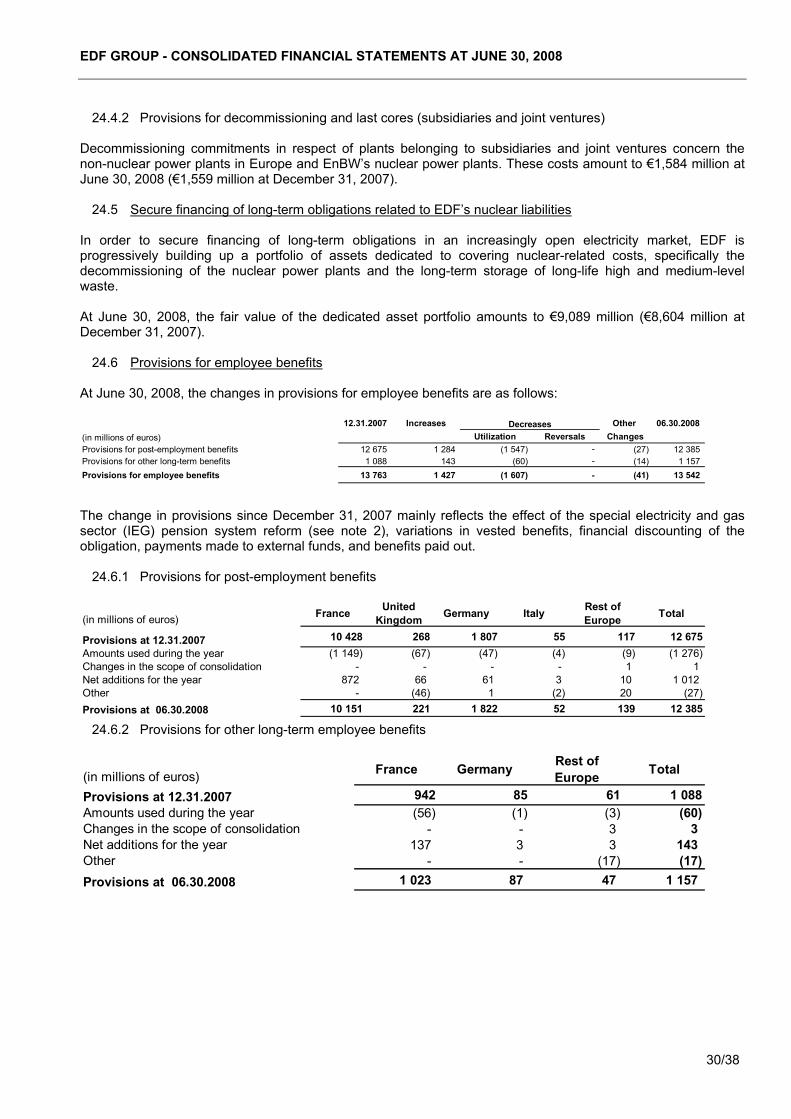
EDF GROUP - CONSOLIDATED FINANCIAL STATEMENTS AT JUNE 30, 2008
30/38
12.31.2007 Increases Other 06.30.2008(in millions of euros) Utilization Reversals ChangesProvisions for post-employment benefits 12 675 1 284 (1 547) - (27) 12 385Provisions for other long-term benefits 1 088 143 (60) - (14) 1 157Provisions for employee benefits 13 763 1 427 (1 607) - (41) 13 542
Decreases
(in millions of euros) France Germany Rest of Europe Total
Provisions at 12.31.2007 942 85 61 1 088Amounts used during the year (56) (1) (3) (60) Changes in the scope of consolidation - - 3 3 Net additions for the year 137 3 3 143 Other - - (17) (17) Provisions at 06.30.2008 1 023 87 47 1 157
(in millions of euros) France United Kingdom Germany Italy Rest of
Europe Total
Provisions at 12.31.2007 10 428 268 1 807 55 117 12 675Amounts used during the year (1 149) (67) (47) (4) (9) (1 276) Changes in the scope of consolidation - - - - 1 1 Net additions for the year 872 66 61 3 10 1 012 Other - (46) 1 (2) 20 (27) Provisions at 06.30.2008 10 151 221 1 822 52 139 12 385
24.4.2 Provisions for decommissioning and last cores (subsidiaries and joint ventures)
Decommissioning commitments in respect of plants belonging to subsidiaries and joint ventures concern the non-nuclear power plants in Europe and EnBW’s nuclear power plants. These costs amount to €1,584 million at June 30, 2008 (€1,559 million at December 31, 2007).
24.5 Secure financing of long-term obligations related to EDF’s nuclear liabilities In order to secure financing of long-term obligations in an increasingly open electricity market, EDF is progressively building up a portfolio of assets dedicated to covering nuclear-related costs, specifically the decommissioning of the nuclear power plants and the long-term storage of long-life high and medium-level waste. At June 30, 2008, the fair value of the dedicated asset portfolio amounts to €9,089 million (€8,604 million at December 31, 2007).
24.6 Provisions for employee benefits At June 30, 2008, the changes in provisions for employee benefits are as follows:
The change in provisions since December 31, 2007 mainly reflects the effect of the special electricity and gas sector (IEG) pension system reform (see note 2), variations in vested benefits, financial discounting of the obligation, payments made to external funds, and benefits paid out.
24.6.1 Provisions for post-employment benefits
24.6.2 Provisions for other long-term employee benefits
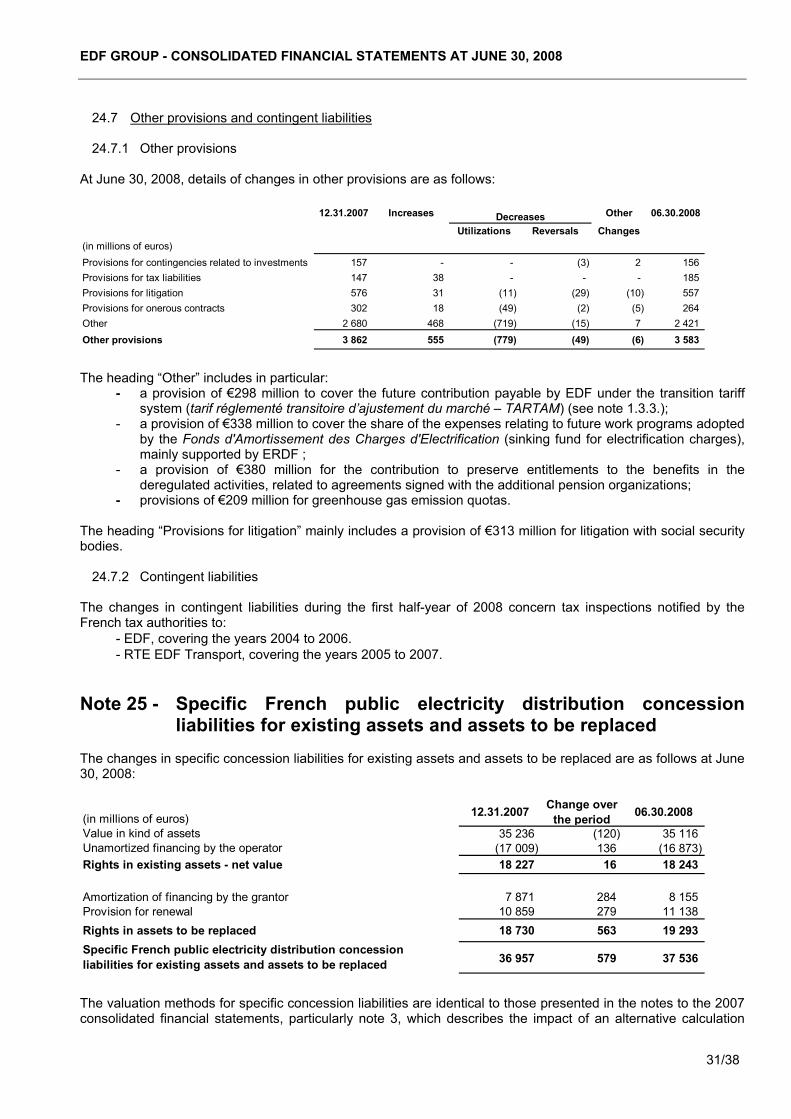
EDF GROUP - CONSOLIDATED FINANCIAL STATEMENTS AT JUNE 30, 2008
31/38
(in millions of euros) 12.31.2007 Change over the period 06.30.2008
Value in kind of assets 35 236 (120) 35 116Unamortized financing by the operator (17 009) 136 (16 873)Rights in existing assets - net value 18 227 16 18 243
Amortization of financing by the grantor 7 871 284 8 155Provision for renewal 10 859 279 11 138Rights in assets to be replaced 18 730 563 19 293Specific French public electricity distribution concession liabilities for existing assets and assets to be replaced 36 957 579 37 536
12.31.2007 Increases Other 06.30.2008
Utilizations Reversals Changes(in millions of euros)Provisions for contingencies related to investments 157 - - (3) 2 156 Provisions for tax liabilities 147 38 - - - 185 Provisions for litigation 576 31 (11) (29) (10) 557 Provisions for onerous contracts 302 18 (49) (2) (5) 264 Other 2 680 468 (719) (15) 7 2 421 Other provisions 3 862 555 (779) (49) (6) 3 583
Decreases
24.7 Other provisions and contingent liabilities
24.7.1 Other provisions
At June 30, 2008, details of changes in other provisions are as follows:
The heading “Other” includes in particular:
- a provision of €298 million to cover the future contribution payable by EDF under the transition tariff system (tarif réglementé transitoire d’ajustement du marché – TARTAM) (see note 1.3.3.);
- a provision of €338 million to cover the share of the expenses relating to future work programs adopted by the Fonds d'Amortissement des Charges d'Electrification (sinking fund for electrification charges), mainly supported by ERDF ;
- a provision of €380 million for the contribution to preserve entitlements to the benefits in the deregulated activities, related to agreements signed with the additional pension organizations;
- provisions of €209 million for greenhouse gas emission quotas. The heading “Provisions for litigation” mainly includes a provision of €313 million for litigation with social security bodies.
24.7.2 Contingent liabilities The changes in contingent liabilities during the first half-year of 2008 concern tax inspections notified by the French tax authorities to:
- EDF, covering the years 2004 to 2006. - RTE EDF Transport, covering the years 2005 to 2007.
Note 25 - Specific French public electricity distribution concession
liabilities for existing assets and assets to be replaced The changes in specific concession liabilities for existing assets and assets to be replaced are as follows at June 30, 2008:
The valuation methods for specific concession liabilities are identical to those presented in the notes to the 2007 consolidated financial statements, particularly note 3, which describes the impact of an alternative calculation
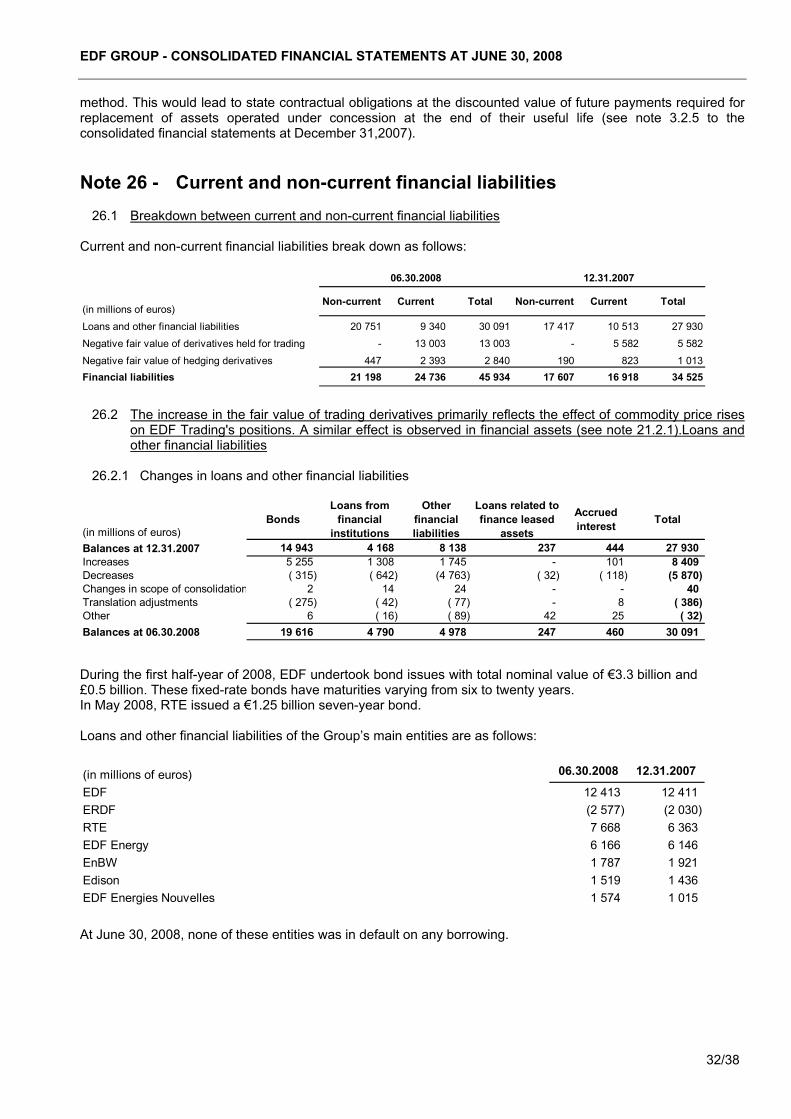
EDF GROUP - CONSOLIDATED FINANCIAL STATEMENTS AT JUNE 30, 2008
32/38
(in millions of euros)Non-current Current Total Non-current Current Total
Loans and other financial liabilities 20 751 9 340 30 091 17 417 10 513 27 930
Negative fair value of derivatives held for trading - 13 003 13 003 - 5 582 5 582
Negative fair value of hedging derivatives 447 2 393 2 840 190 823 1 013Financial liabilities 21 198 24 736 45 934 17 607 16 918 34 525
06.30.2008 12.31.2007
(in millions of euros)Bonds
Loans from financial
institutions
Other financial liabilities
Loans related to finance leased
assets
Accrued interest Total
Balances at 12.31.2007 14 943 4 168 8 138 237 444 27 930Increases 5 255 1 308 1 745 - 101 8 409Decreases ( 315) ( 642) (4 763) ( 32) ( 118) (5 870)Changes in scope of consolidation 2 14 24 - - 40Translation adjustments ( 275) ( 42) ( 77) - 8 ( 386)Other 6 ( 16) ( 89) 42 25 ( 32)Balances at 06.30.2008 19 616 4 790 4 978 247 460 30 091
(in millions of euros) 06.30.2008 12.31.2007
EDF 12 413 12 411ERDF (2 577) (2 030)RTE 7 668 6 363EDF Energy 6 166 6 146EnBW 1 787 1 921Edison 1 519 1 436EDF Energies Nouvelles 1 574 1 015
method. This would lead to state contractual obligations at the discounted value of future payments required for replacement of assets operated under concession at the end of their useful life (see note 3.2.5 to the consolidated financial statements at December 31,2007). Note 26 - Current and non-current financial liabilities
26.1 Breakdown between current and non-current financial liabilities Current and non-current financial liabilities break down as follows:
26.2 The increase in the fair value of trading derivatives primarily reflects the effect of commodity price rises
on EDF Trading's positions. A similar effect is observed in financial assets (see note 21.2.1).Loans and other financial liabilities
26.2.1 Changes in loans and other financial liabilities
During the first half-year of 2008, EDF undertook bond issues with total nominal value of €3.3 billion and £0.5 billion. These fixed-rate bonds have maturities varying from six to twenty years. In May 2008, RTE issued a €1.25 billion seven-year bond. Loans and other financial liabilities of the Group’s main entities are as follows:
At June 30, 2008, none of these entities was in default on any borrowing.
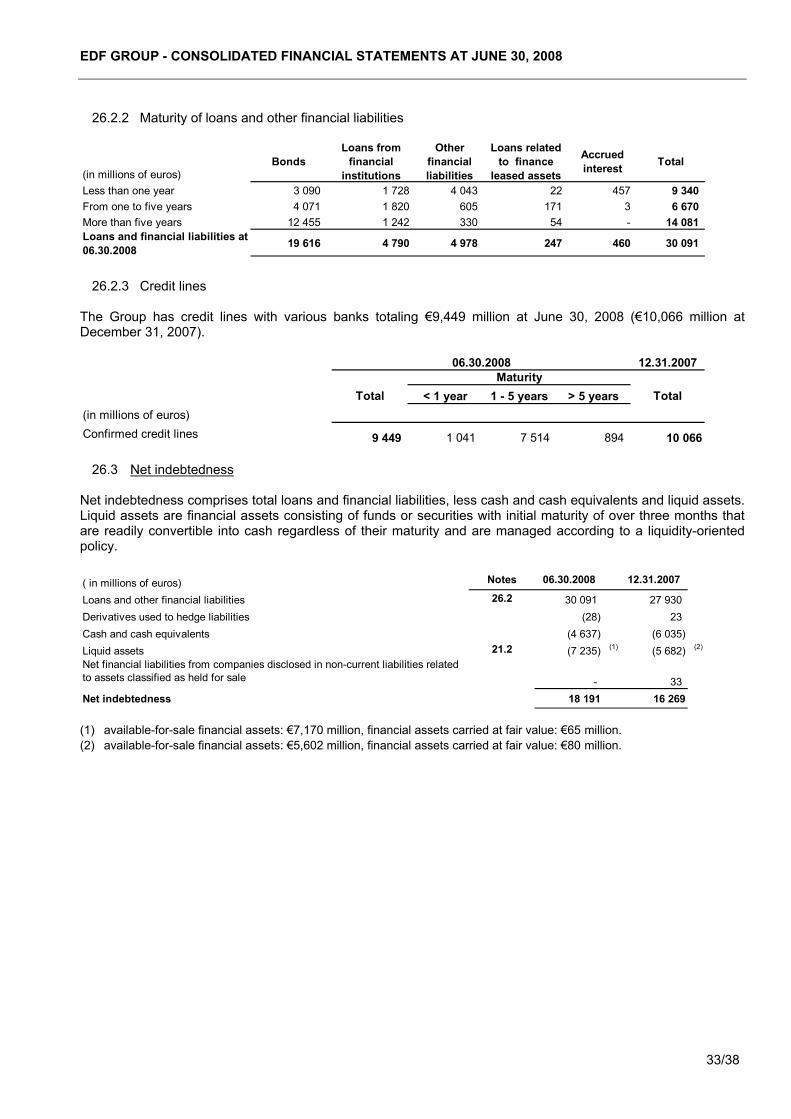
EDF GROUP - CONSOLIDATED FINANCIAL STATEMENTS AT JUNE 30, 2008
33/38
12.31.2007
< 1 year 1 - 5 years > 5 years(in millions of euros)Confirmed credit lines 9 449 1 041 7 514 894 10 066
MaturityTotal
06.30.2008
Total
(in millions of euros)Bonds
Loans from financial
institutions
Other financial liabilities
Loans related to finance
leased assets
Accrued interest Total
Less than one year 3 090 1 728 4 043 22 457 9 340From one to five years 4 071 1 820 605 171 3 6 670More than five years 12 455 1 242 330 54 - 14 081Loans and financial liabilities at 06.30.2008 19 616 4 790 4 978 247 460 30 091
( in millions of euros) Notes 06.30.2008 12.31.2007
Loans and other financial liabilities 26.2 30 091 27 930Derivatives used to hedge liabilities (28) 23Cash and cash equivalents (4 637) (6 035)Liquid assets 21.2 (7 235) (1) (5 682) (2)
Net financial liabilities from companies disclosed in non-current liabilities related to assets classified as held for sale - 33Net indebtedness 18 191 16 269
26.2.2 Maturity of loans and other financial liabilities
26.2.3 Credit lines
The Group has credit lines with various banks totaling €9,449 million at June 30, 2008 (€10,066 million at December 31, 2007).
26.3 Net indebtedness
Net indebtedness comprises total loans and financial liabilities, less cash and cash equivalents and liquid assets. Liquid assets are financial assets consisting of funds or securities with initial maturity of over three months that are readily convertible into cash regardless of their maturity and are managed according to a liquidity-oriented policy.
(1) available-for-sale financial assets: €7,170 million, financial assets carried at fair value: €65 million. (2) available-for-sale financial assets: €5,602 million, financial assets carried at fair value: €80 million.
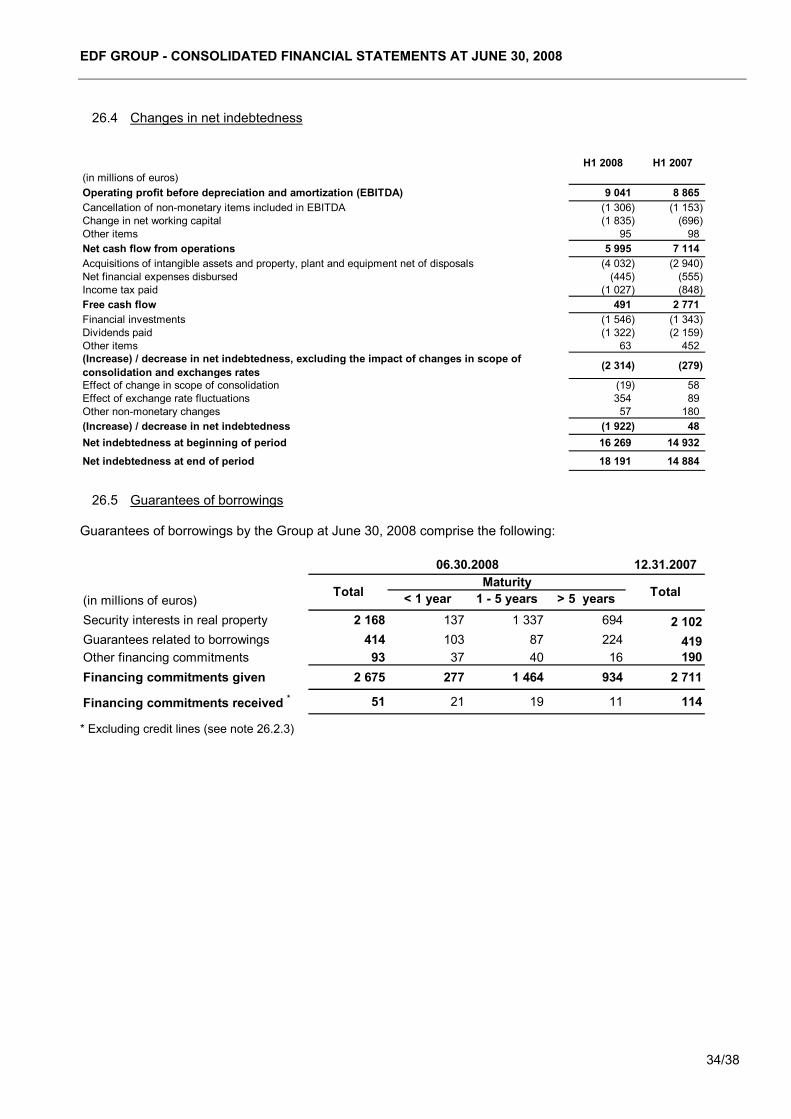
EDF GROUP - CONSOLIDATED FINANCIAL STATEMENTS AT JUNE 30, 2008
34/38
12.31.2007
(in millions of euros) < 1 year 1 - 5 years > 5 yearsSecurity interests in real property 2 168 137 1 337 694 2 102Guarantees related to borrowings 414 103 87 224 419Other financing commitments 93 37 40 16 190Financing commitments given 2 675 277 1 464 934 2 711
Financing commitments received * 51 21 19 11 114
06.30.2008
TotalMaturity
Total
(in millions of euros)H1 2008 H1 2007
Operating profit before depreciation and amortization (EBITDA) 9 041 8 865Cancellation of non-monetary items included in EBITDA (1 306) (1 153)Change in net working capital (1 835) (696)Other items 95 98Net cash flow from operations 5 995 7 114Acquisitions of intangible assets and property, plant and equipment net of disposals (4 032) (2 940)Net financial expenses disbursed (445) (555)Income tax paid (1 027) (848)Free cash flow 491 2 771Financial investments (1 546) (1 343)Dividends paid (1 322) (2 159)Other items 63 452(Increase) / decrease in net indebtedness, excluding the impact of changes in scope of consolidation and exchanges rates (2 314) (279)
Effect of change in scope of consolidation (19) 58Effect of exchange rate fluctuations 354 89Other non-monetary changes 57 180(Increase) / decrease in net indebtedness (1 922) 48Net indebtedness at beginning of period 16 269 14 932
Net indebtedness at end of period 18 191 14 884
26.4 Changes in net indebtedness
26.5 Guarantees of borrowings
Guarantees of borrowings by the Group at June 30, 2008 comprise the following:
* Excluding credit lines (see note 26.2.3)

EDF GROUP - CONSOLIDATED FINANCIAL STATEMENTS AT JUNE 30, 2008
35/38
(in millions of euros)
Gross changes in fair value recorded in
equity (1)
Taxes related to gross changes
in fair value recorded in
equity
Changes after taxes in fair
value recorded in equity (1)
Ineffectiveness Gross changes in fair value
transferred to income (2)
Taxes related to changes in fair
value transferred to
income
Changes after taxes in fair
value transferred to
income (2)
Interest rate hedging derivatives 8 (3) 5 - - - -
Exchange rate hedging derivatives (44) 15 (29) (2) (32) 11 (21)
Net foreign exchange hedging derivatives 255 (88) 167 - - - -
Commodities hedging derivatives 2 058 (610) 1 448 (6) 108 (39) 69
Hedging derivatives 2 277 (686) 1 591 (8) 76 (28) 48
12.31.2007 06.30.2008 12.31.2007
(in millions of euros)
Units of measure
Net notionnals Fair value Fair value
< 1 year From 1 to 5 years Total Total
Swaps (1) - (1) - (1) 1Forwards/futures 6 (2) 4 14 (104) 254
Power TWh 5 (2) 3 14 (105) 255
Forwards/futures 232 1 747 1 979 2 233 1 103 52
GasMillions of
therms 232 1 747 1 979 2 233 1 103 52
Swaps 3 590 3 929 7 519 6 522 166 63
Oil productsThousands of barrels 3 590 3 929 7 519 6 522 166 63
Swaps 9 12 21 21 1 558 523
CoalMillions of
tonnes 9 12 21 21 1 558 523
Forwards/futures 20 928 4 853 25 781 15 061 180 49
CO2Thousands of tonnes 20 928 4 853 25 781 15 061 180 49
Cash flow hedge commodity derivatives 2 902 942
Net notionnals
06.30.2008
Note 27 - Derivatives and hedge accounting Changes in the fair value of hedging derivatives recorded in equity during the first half-year of 2008 break down as follows:
(1)+ / ( ): increase / decrease in equity. (2) + / ( ): increase / decrease in income.
Commodity-related cash flow hedges break down as follows:

EDF GROUP - CONSOLIDATED FINANCIAL STATEMENTS AT JUNE 30, 2008
36/38
(in millions of euros) 06.30.2008 12.31.2007
Advances received 4 971 4 279Liabilities related to property, plant and equipment 1 001 1 133Tax and social charges 6 485 5 735Deferred income 8 327 7 988Other 3 368 3 195Other liabilities 24 152 22 330
Non current 5 490 5 624Current 18 662 16 706
06.30.2008 12.31.2007 06.30.2008 12.31.2007
(in millions of euros)
Units of measure
Net notionnals
Net notionnals Fair value Fair value
Swaps 1 - 62 (50)Options 13 18 177 (162)Forwards/futures (7) (8) (521) (55)
Power TWh 7 10 (282) (267)
Swaps (2) (7) (461) (177)Options 85 580 81 407 526 363Forwards/futures (466) (510) 107 12
Gas Millions of therms 85 112 80 890 172 198
Swaps (17 297) (19 273) 94 97Options 300 (1 814) 60 6Forwards/futures 2 148 2 087 52 19
Oil products Thousands of barrels
(14 849) (19 000) 206 122
Swaps (58) (48) (3 726) (761)Options - 1 31 7Forwards/futures 59 56 4 233 983Freight 20 17 (249) (196)
CoalMillions of
tonnes 21 26 289 33
Swaps - - (77) -
Options 1 700 1 540 2 1
Forwards/futures (13 579) (7 871) (54) 127
CO2Thousands of tonnes (11 879) (6 331) (129) 128
Swaps 6 -
Other 6 -
Embedded commodity derivatives 6 4
Non hedging commodity derivatives 268 218
Note 28 - Derivative instruments not recorded as hedges Details of commodity derivatives not classified as hedges are as follows:
These mainly include contracts held through EDF Trading’s portfolio. Note 29 - Other liabilities Details of other liabilities are as follows:

EDF GROUP - CONSOLIDATED FINANCIAL STATEMENTS AT JUNE 30, 2008
37/38
(in millions of euros)
% owned Current Assets
Non Current Assets
Current liabilities
Non current liabilities Sales
Operating profit before
depreciation and amortization
EnBW 46,07% 4 865 11 262 4 223 7 200 3 707 634 Edison 48,96% 1 421 6 378 1 410 2 078 2 498 393 Other 2 207 5 352 2 027 438 1 288 200 Total 8 493 22 992 7 660 9 716 7 493 1 227
At June 30, 2008, deferred income includes €2,394 million of partner advances to EDF under the nuclear plant financing plans, and €2,481 million of connection fees. “Other liabilities” includes €170 million of borrowings by Domofinance, a credit institution that makes loans to finance work and installations contributing to energy control. The Group also paid €68 million in the first half-year of 2008 in connection with the transfer of Edipower shares after put options were exercised. Note 30 - Contribution of joint ventures The Group holds investments in joint ventures. These investments are proportionally consolidated. The joint ventures’ contributions to the balance sheet and income statement are as follows at June 30, 2008:
“Other” mainly concerns Dalkia.
Note 31 - Related parties There have been no significant changes since December 31, 2007 in the types of transaction undertaken with related parties. In particular, the Group has significant ongoing relationships with public-sector enterprises, primarily the Areva Group for the supply, transmission and reprocessing of nuclear fuel and maintenance of nuclear plants. The Areva Group is also a supplier to the EPR (European Pressurized Reactor) project, contributing to the formation of commitments on fixed asset orders. Gaz de France exercised its put option on 22.14% of shares in ECW (see note 5).
Note 32 - Subsequent events
32.1 France
32.1.1 Launch of the Employee Offering On December 3, 2007, the French State sold 2.5% of the capital of EDF to French and international institutional investors. In application of article 11 of the Law of August 6, 1986 and article 26 of the Law of August 9, 2004, following this sale by the State, a preferential offer will be made to current and retired employees of EDF and certain French and foreign subsidiaries. This offer will concern 7.9 million existing shares representing 15% of the total number of shares put on the market, i.e. 0.4% of the capital. The proposed operation will comprise two offers including the benefits of free shares, extended payment terms and in one case an additional employer’s contribution to supplement the employee’s contribution. Under the current schedule for this employee offering, which should begin in September 2008, the subscription price offered to employees and the final terms of the offers will be set by the State by the end of August 2008, in view of the share’s market price. In practice, Group employees will be able to adjust their share application until the last day of subscription. Settlement and delivery of shares should take place in October 2008 in application of this schedule.
32.1.2 Prolongation of the transition tariff (Tartam) system On July 23, 2008, the French Parliament adopted the law on economic modernization, prolonging the Tartam system to June 30, 2010. In addition to the prolongation, this law also extends eligibility for the tariff to all final customers, even those who
EDF GROUP - CONSOLIDATED FINANCIAL STATEMENTS AT JUNE 30, 2008
38/38
were previously eligible but did not opt into the system.. The effect of prolongation of the transition tariff cannot be accurately estimated at June 30, 2008, as not all the details of the system are known. Once the law on economic modernization has been finally enacted, EDF will draw the appropriate accounting conclusions.
32.1.3 Partnership agreement with Exeltium The European Commission has announced that on July 30, 2008 the industrial partnership agreement between EDF and Exeltium (a consortium of large electricity-intensive customers) complies with competition law. This agreement covers volumes of some 310 TWh spread over 24 years. Its purpose is to make energy supplies more secure for Exeltium, which will have greater visibility over long-term electricity supply prices in return for sharing risks relating to development and operation of EDF nuclear power plants. 32.2 Germany On July 10, 2008, EnBW’s bid to acquire a 26% stake in EWE AG Oldenburg was accepted, for a total of around €2 billion. The transaction is subject to the approval of the German anti-trust authorities. The impact on EnBW’s 2008 consolidated net income should not be significant, since these authorities’ decision is expected to be issued late in the year. The acquisition will be financed through the capital markets. 32.3 United Kingdom The UK Finance Law for 2008 was enacted on July 21, 2008. The phasing out of Industrial Buildings Allowances contained in the law will result in a one-off charge of £40 million, which will be booked in the second half of the year.
Electricité de France S.A.
Statutory Auditors’ Review Report on the first half-year financial information
for 2008 (free translation of the French original)
For the six month period ended June 30, 2008 Electricité de France S.A.
22 – 30, avenue de Wagram – 75008 Paris
Six month period ended June 30, 2006
Electricité de France S.A. 22 – 30, avenue de Wagram – 75008 Paris Statutory Auditors’ Review Report on the first half-year financial information for 2008
This is a free translation into English of the statutory auditors’ review report issued in the French language and is provided solely for the convenience of English speaking readers. This report should be read in conjunction with, and is construed in accordance with, French law and professional auditing standards applicable in France To the shareholders, Following our appointment as statutory auditors by the Annual General Meeting and in accordance with the requirements of articles L. 232-7 of the French Commercial Law (Code de commerce) and L.451-1-2 III of the French Monetary and Financial Code (Code Monétaire et Financier), we hereby report to you on:
• the limited review of the accompanying condensed half-year consolidated financial statements of Electricité de France S.A. for the 6-month period ended June 30, 2008;
• the verification of information contained in the half-year management report.
These condensed half-year consolidated financial statements are the responsibility of the Board of Directors. Our role is to express a conclusion on these financial statements based on our limited review.
I. Conclusion on the financial statements We conducted our limited review in accordance with professional standards applicable in France. A limited review of interim financial information consists of making inquiries, primarily of persons responsible for financial and accounting matters, and applying analytical and other review procedures. A limited review is substantially less in scope than an audit conducted in accordance with professional standards applicable in France and consequently does not enable us to obtain assurance that we would become aware of all significant matters that might be identified in an audit. Accordingly, we do not express an audit opinion. Based on our limited review, nothing has come to our attention that causes us to believe that the accompanying condensed half-year consolidated financial statements are not prepared, in all material respects, in accordance with IAS 34 - standards of the IFRSs as adopted by the European Union applicable to interim financial information.
Six month period ended June 30, 2007 3
Electricité de France S.A.
Statutory Auditors’ Review Report on the first half-year financial information for 2008
(free translation of the French original)
Without qualifying the conclusion expressed above, we draw your attention to the following points described in the notes to the condensed half-year consolidated financial statements: • the valuation of long-term provisions relating to nuclear electricity production, as
described in notes 24.2 to 24.5, results as indicated in note 1.4 from Management best estimates. This valuation is sensitive to the assumptions made concerning costs, inflation rates, long-term discount rates, and forecast cash outflows as well as the results of current negotiations with Areva. Change in these parameters could lead to a material revision of the level of provisioning.
• the approach adopted by EDF to present in the balance sheet its obligation to renew
property plant and equipments used for the French public distribution of electricity is based on the specific characteristics of concession contracts. The amount of contractual obligations as calculated and disclosed to the grantors in reports is used for evaluating the obligation. As described in note 25, an alternative approach based on the discounted value of future payments necessary for replacement of these assets at the end of their industrial useful life would result in a different representation of the obligation towards grantors. Measurement of the concession liability concerning assets to be replaced is notably subject to uncertainty in terms of costs and disbursement dates.
II. Specific verification We have also verified the information given in the half-year management report commenting the condensed half-year consolidated financial statements subject of our limited review. We have no matters to report as to its fair presentation and consistency with the condensed half-year consolidated financial statements. Paris La Défense and Neuilly-sur-Seine, July 31, 2008
The Statutory Auditors
KPMG Audit
Department of KPMG S.A. Deloitte & Associés
Jean-Luc Decornoy Michel Piette Amadou Raimi Tristan Guerlain