Embed Size (px)
Citation preview
Criterion 1
Maintenance and appropriate enhancement of forest resources and their contribution to global carbon cycles
11
12
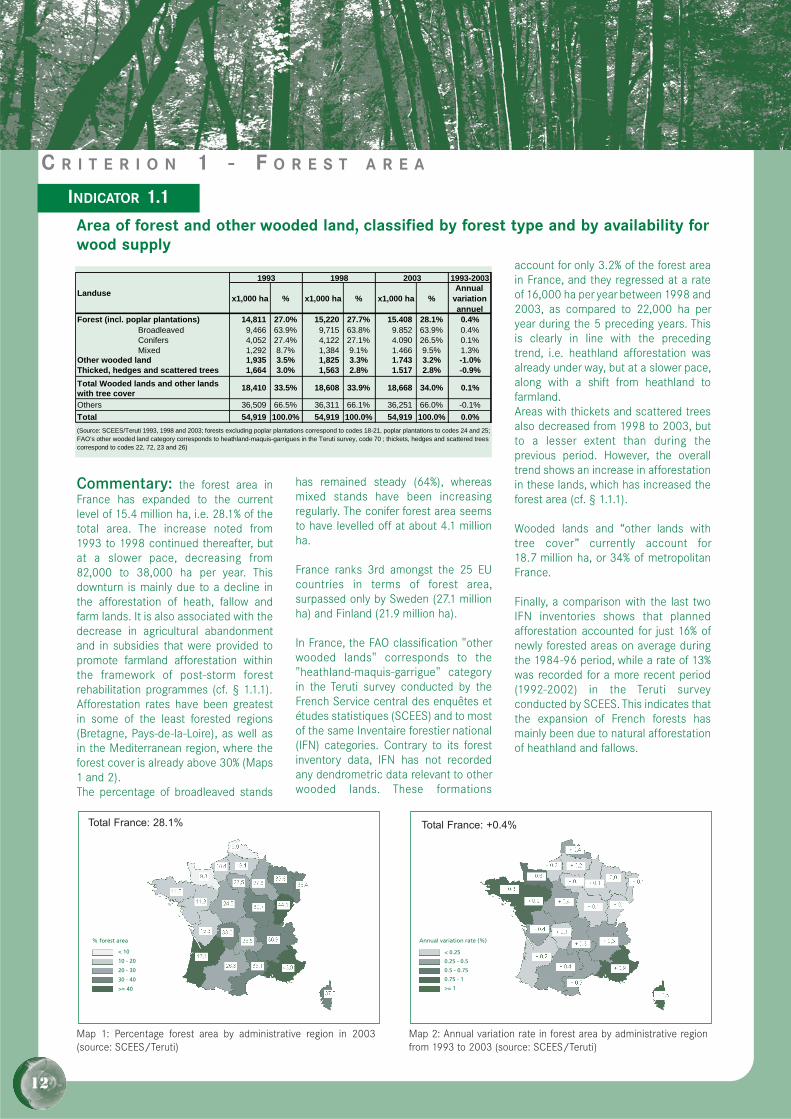
Commentary: the forest area inFrance has expanded to the currentlevel of 15.4 million ha, i.e. 28.1% of thetotal area. The increase noted from1993 to 1998 continued thereafter, butat a slower pace, decreasing from82,000 to 38,000 ha per year. Thisdownturn is mainly due to a decline inthe afforestation of heath, fallow andfarm lands. It is also associated with thedecrease in agricultural abandonmentand in subsidies that were provided topromote farmland afforestation withinthe framework of post-storm forestrehabilitation programmes (cf. § 1.1.1).Afforestation rates have been greatestin some of the least forested regions(Bretagne, Pays-de-la-Loire), as well asin the Mediterranean region, where theforest cover is already above 30% (Maps1 and 2).The percentage of broadleaved stands
has remained steady (64%), whereasmixed stands have been increasingregularly. The conifer forest area seemsto have levelled off at about 4.1 millionha.
France ranks 3rd amongst the 25 EUcountries in terms of forest area,surpassed only by Sweden (27.1 millionha) and Finland (21.9 million ha).
In France, the FAO classification "otherwooded lands" corresponds to the"heathland-maquis-garrigue" categoryin the Teruti survey conducted by theFrench Service central des enquêtes etétudes statistiques (SCEES) and to mostof the same Inventaire forestier national(IFN) categories. Contrary to its forestinventory data, IFN has not recordedany dendrometric data relevant to otherwooded lands. These formations
account for only 3.2% of the forest areain France, and they regressed at a rateof 16,000 ha per year between 1998 and2003, as compared to 22,000 ha peryear during the 5 preceding years. Thisis clearly in line with the precedingtrend, i.e. heathland afforestation wasalready under way, but at a slower pace,along with a shift from heathland tofarmland.Areas with thickets and scattered treesalso decreased from 1998 to 2003, butto a lesser extent than during theprevious period. However, the overalltrend shows an increase in afforestationin these lands, which has increased theforest area (cf. § 1.1.1).
Wooded lands and “other lands withtree cover” currently account for18.7 million ha, or 34% of metropolitanFrance.
Finally, a comparison with the last twoIFN inventories shows that plannedafforestation accounted for just 16% ofnewly forested areas on average duringthe 1984-96 period, while a rate of 13%was recorded for a more recent period(1992-2002) in the Teruti surveyconducted by SCEES. This indicates thatthe expansion of French forests hasmainly been due to natural afforestationof heathland and fallows.
.
Map 1: Percentage forest area by administrative region in 2003(source: SCEES/Teruti)
Area of forest and other wooded land, classified by forest type and by availability forwood supply
1993-2003
x1,000 ha % x1,000 ha % x1,000 ha %Annual
variation annuel
Forest (incl. poplar plantations) 14,811 27.0% 15,220 27.7% 15.408 28.1% 0.4%Broadleaved 9,466 63.9% 9,715 63.8% 9.852 63.9% 0.4%Conifers 4,052 27.4% 4,122 27.1% 4.090 26.5% 0.1%Mixed 1,292 8.7% 1,384 9.1% 1.466 9.5% 1.3%
Other wooded land 1,935 3.5% 1,825 3.3% 1.743 3.2% -1.0%Thicked, hedges and scattered trees 1,664 3.0% 1,563 2.8% 1.517 2.8% -0.9%Total Wooded lands and other lands with tree cover
18,410 33.5% 18,608 33.9% 18,668 34.0% 0.1%
Others 36,509 66.5% 36,311 66.1% 36,251 66.0% -0.1%Total 54,919 100.0% 54,919 100.0% 54,919 100.0% 0.0%(Source: SCEES/Teruti 1993, 1998 and 2003; forests excluding poplar plantations correspond to codes 18-21, poplar plantations to codes 24 and 25; FAO’s other wooded land category corresponds to heathland-maquis-garrigues in the Teruti survey, code 70 ; thickets, hedges and scattered treescorrespond to codes 22, 72, 23 and 26)
Landuse
1993 1998 2003
INDICATOR 1.1
C R I T E R I O N 1 - F O R E S T A R E A
INDICATEUR 1.1
.
Map 2: Annual variation rate in forest area by administrative regionfrom 1993 to 2003 (source: SCEES/Teruti)
% forest area
Total France : 28.1%
< 10
10 - 20
20 - 30
30 - 40
>= 40
.
..
. ..
.
. ...
.
.
.
.
.
.
. .
. .
.
Annual variation rate (%)
Total France : + 0.4%
< 0.25
0.25 - 0.5
0.5 - 0.75
0.75 - 1
>= 1
.
..
. .
..
. ...
.
.
.
.
.
.
..
.
.
.
Total France: 28.1% Total France: +0.4%
13
Commentary: IFN considers thatforest stands available for wood supplyinclude all production forests that canbe accessed for wood supply, along withpoplar plantations. This is currently
estimated to represent 95% of the totalwooded area, or 14.6 million ha. Thispercentage applies equally to broad -leaved, conifer and mixed forests. Itdecreases slightly over time because
the forest area not available for woodsupply is expanding at a faster pacethan production forests (2.6% versus0.3% per year).
0
2
4
6
8
10
12
14
16
1825 1845 1865 1885 1905 1925 1945 1965 1985 2005
années
mill
ions
d'h
a
years
mill
ion
s o
f h
a
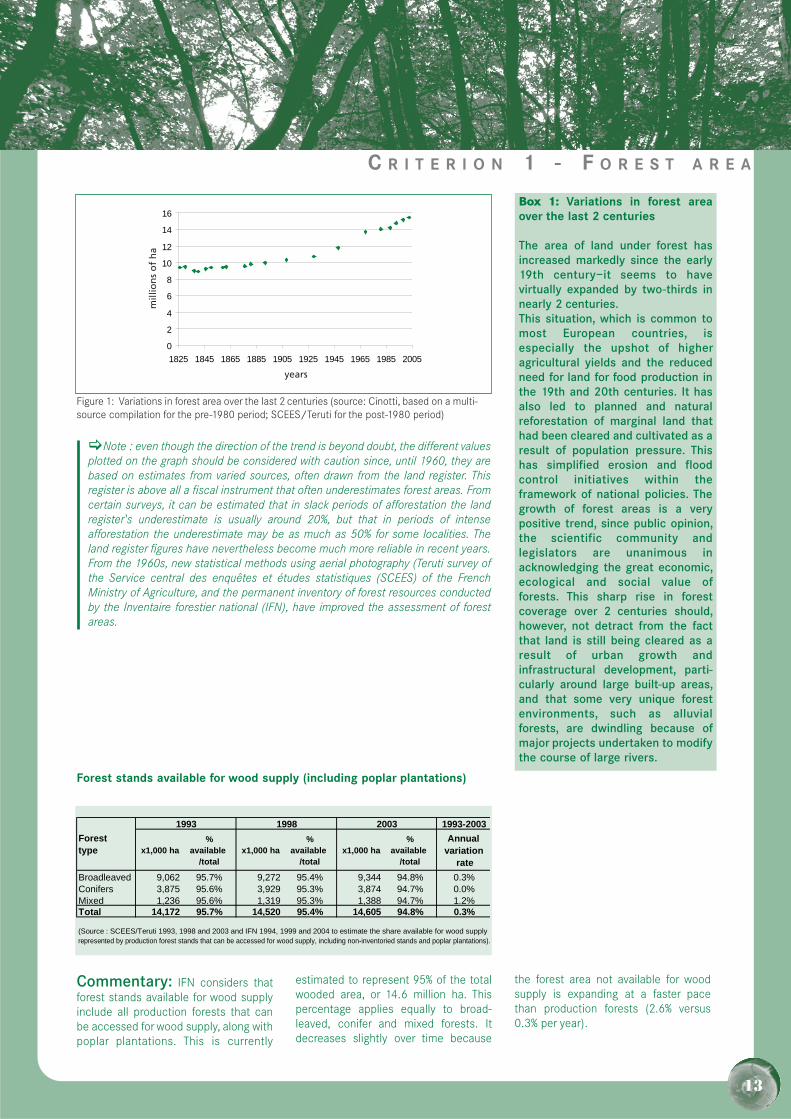
Figure 1: Variations in forest area over the last 2 centuries (source: Cinotti, based on a multi-source compilation for the pre-1980 period; SCEES/Teruti for the post-1980 period)
1993-2003
x1,000 ha%
available/total
x1,000 ha%
available/total
x1,000 ha%
available/total
Annualvariation
rateBroadleaved 9,062 95.7% 9,272 95.4% 9,344 94.8% 0.3%Conifers 3,875 95.6% 3,929 95.3% 3,874 94.7% 0.0%Mixed 1,236 95.6% 1,319 95.3% 1,388 94.7% 1.2%Total 14,172 95.7% 14,520 95.4% 14,605 94.8% 0.3%
(Source : SCEES/Teruti 1993, 1998 and 2003 and IFN 1994, 1999 and 2004 to estimate the share available for wood supply represented by production forest stands that can be accessed for wood supply, including non-inventoried stands and poplar plantations).
Forest type
1993 1998 2003
C R I T E R I O N 1 - F O R E S T A R E A
Box 1: Variations in forest areaover the last 2 centuries
The area of land under forest hasincreased markedly since the early19th century—it seems to havevirtually expanded by two-thirds innearly 2 centuries.This situation, which is common tomost European countries, isespecially the upshot of higheragricultural yields and the reducedneed for land for food production inthe 19th and 20th centuries. It hasalso led to planned and naturalreforestation of marginal land thathad been cleared and cultivated as aresult of population pressure. Thishas simplified erosion and floodcontrol initiatives within theframework of national policies. Thegrowth of forest areas is a verypositive trend, since public opinion,the scientific community andlegislators are unanimous inacknowledging the great economic,ecological and social value offorests. This sharp rise in forestcoverage over 2 centuries should,however, not detract from the factthat land is still being cleared as aresult of urban growth andinfrastructural development, parti -cularly around large built-up areas,and that some very unique forestenvironments, such as alluvialforests, are dwindling because ofmajor projects undertaken to modifythe course of large rivers.
�Note : even though the direction of the trend is beyond doubt, the different valuesplotted on the graph should be considered with caution since, until 1960, they arebased on estimates from varied sources, often drawn from the land register. Thisregister is above all a fiscal instrument that often underestimates forest areas. Fromcertain surveys, it can be estimated that in slack periods of afforestation the landregister's underestimate is usually around 20%, but that in periods of intenseafforestation the underestimate may be as much as 50% for some localities. Theland register figures have nevertheless become much more reliable in recent years.From the 1960s, new statistical methods using aerial photography (Teruti survey ofthe Service central des enquêtes et études statistiques (SCEES) of the FrenchMinistry of Agriculture, and the permanent inventory of forest resources conductedby the Inventaire forestier national (IFN), have improved the assessment of forestareas.
Forest stands available for wood supply (including poplar plantations)
14
Commentary: the transitionmatrix obtained in the Teruti surveyconducted by the Service central desenquêtes et études statistiques (SCEES)enables a detailed analysis of thedifferent patterns leading to theobserved expansion of forest area. Thismatrix covers the 1997-2003 period,which overlaps the periods discussed in§ 1.1, thus explaining the slightdifferences in the data presented.Over the 1997-2003 period, the forestarea increased by +40,200 ha per yearon average as the result of twocontrasting trends—a gain in forest areaof 84,700 ha per year and a loss of44 500 ha per year.
These gains in forest coverageconcerned heathland and fallows (46%),farmland (28%) and thickets andscattered trees (18%). Forest losses alsoconcerned these three categories, butthe balance is largely in favour of forests(estimated at +42,700 ha/year). Themain negative category is man-madeareas—infrastructures and urban areas—with an estimated balance of – 3,200 haper year.
An in-depth analysis of the 1997-2003transition matrix sheds greater light onthese trends (cf. Appendix 11):
� the variations in heathland andfallows are in line with typical transitions
that occur in periods ofagriculturalabandonment: farmland � fallows �heathland � forest. The result of thesetransitions is that farmlands turn intoheathlands and fallow lands at a rate of+10,900 ha/year and heathlands andfallows are transformed into forest at+25,300 ha/year. The rates estimatedfor the 1993-98 period are +26,600 and+47,600 ha/year, respectively, thusconfirming the hypothesed correlationbetween diminishing agriculturalabandonment and forest expansion.
� there is a positive shift fromthickets and scattered trees to forest(+6 300 ha/year), which is due to twocontrasting trends—thickets graduallybecome denser and expand to more
than 50 ares, i.e. the threshold of theforest classification, at a rate of13,600 ha/year, while forests arefragmenting into thickets at a rate of7,300 ha/year.
� the situation differs markedly forhedges as the balance relative to forestsis virtually null. Hedges have increasedby +800 ha/year but this is offset bysubstantial reverse trends. The increasemainly involves thickets and scatteredtrees, which is hard to explain andpossibly related to a confusion in thedefinition. The loss of hedges is mainlyto the benefit of agriculture(–900 ha/year), but this rate is betterthan that estimated for the 1993-98period (–3,200 ha/year).
INDICATOR 1.1.1Forest area gains and losses
Origin and allocation of forested area Forested areagains
Forested arealosses Balance
water and wetlands 1,100 -1,100 0soil with outcropping parent rock 2,900 -1,200 1,700farmland in use 23,300 -12,200 11,100thickets and scattered trees 13,600 -7,300 6,300hedges 1,300 -1,500 -200hathland-maquis-garrigues and fallows 38,800 -13,500 25,300grassland, trails and ornamental gardens 1,200 -2,000 -800man-made areas +/- structures, prohibited areas 2,600 -5,800 -3,200total 84,700 -44,500 40,200% of total in France 0.15% -0.08% 0.07%
Changes in forested area from 1997 to 2003 (ha/year)
(Source : SCEES/Teruti, see transition matrix for 1997/2003 in appendix ; forested area encompasses woodlands and forests (18 to 21) and poplar plantations (24, 25))
C R I T E R I O N 1 - F O R E S T A R E A
INDICATOR 1.1.2Forest area by biogeographical area and elevation class
1994-2004
x1,000 ha % x1,000 ha % x1,000 ha % x1,000 ha % Annual
variation rate
Lowland and hill forests 8,924 63.1% 8,989 62.4% 9,152 62.0% 9,338 61.8% 0.4%Mountain forests 4,040 28.6% 4,171 29.0% 4,274 29.0% 4,403 29.2% 0.5%Mediterranean forests 1,175 8.3% 1,234 8.6% 1,327 9.0% 1,357 9.0% 1.0%Total 14,139 100.0% 14,394 100.0% 14,753 100.0% 15,098 100.0% 0.5%
2004
(Source : IFN, for all forests including poplar plantations; the three biogeographical areas together form a series of IFN forest regions corresponding to the boundaries featured in the Atlas des forêts de France - Published by de Monza - 1991, p. 39)
Biogeographical area
1989 1994 1999
Forests (including poplar plantations)
15
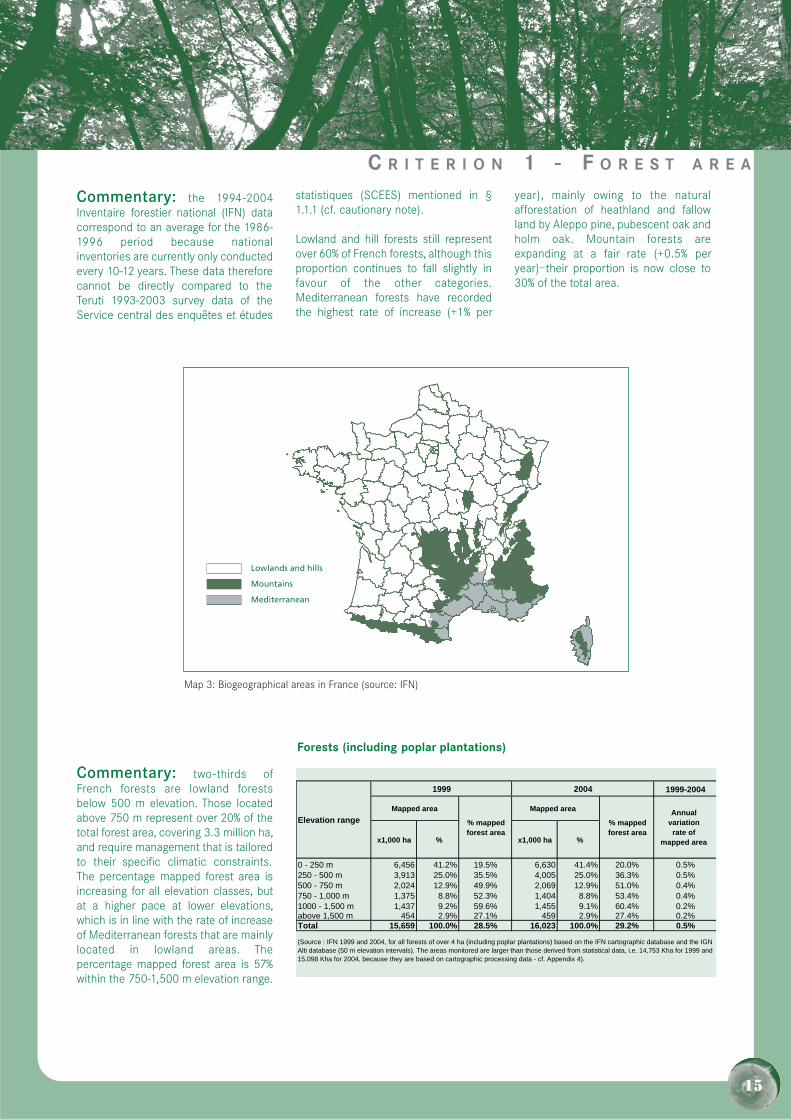
Commentary: the 1994-2004Inventaire forestier national (IFN) datacorrespond to an average for the 1986-1996 period because nationalinventories are currently only conductedevery 10-12 years. These data thereforecannot be directly compared to theTeruti 1993-2003 survey data of theService central des enquêtes et études
statistiques (SCEES) mentioned in §1.1.1 (cf. cautionary note).
Lowland and hill forests still representover 60% of French forests, although thisproportion continues to fall slightly infavour of the other categories.Mediterranean forests have recordedthe highest rate of increase (+1% per
year), mainly owing to the naturalafforestation of heathland and fallowland by Aleppo pine, pubescent oak andholm oak. Mountain forests areexpanding at a fair rate (+0.5% peryear)—their proportion is now close to30% of the total area.
C R I T E R I O N 1 - F O R E S T A R E A
Lowlands and hills
Mountains
Mediterranean
Map 3: Biogeographical areas in France (source: IFN)
Forests (including poplar plantations)
Commentary: two-thirds ofFrench forests are lowland forestsbelow 500 m elevation. Those locatedabove 750 m represent over 20% of thetotal forest area, covering 3.3 million ha,and require management that is tailoredto their specific climatic constraints.The percentage mapped forest area isincreasing for all elevation classes, butat a higher pace at lower elevations,which is in line with the rate of increaseof Mediterranean forests that are mainlylocated in lowland areas. Thepercentage mapped forest area is 57%within the 750-1,500 m elevation range.
1999-2004
x1,000 ha % x1,000 ha %
0 - 250 m 6,456 41.2% 19.5% 6,630 41.4% 20.0% 0.5%250 - 500 m 3,913 25.0% 35.5% 4,005 25.0% 36.3% 0.5%500 - 750 m 2,024 12.9% 49.9% 2,069 12.9% 51.0% 0.4%750 - 1,000 m 1,375 8.8% 52.3% 1,404 8.8% 53.4% 0.4%1000 - 1,500 m 1,437 9.2% 59.6% 1,455 9.1% 60.4% 0.2%above 1,500 m 454 2.9% 27.1% 459 2.9% 27.4% 0.2%Total 15,659 100.0% 28.5% 16,023 100.0% 29.2% 0.5%
% mapped forest area
Annualvariationrate of
mapped area
(Source : IFN 1999 and 2004, for all forests of over 4 ha (including poplar plantations) based on the IFN cartographic database and the IGN Alti database (50 m elevation intervals). The areas monitored are larger than those derived from statistical data, i.e. 14,753 Kha for 1999 and15,098 Kha for 2004, because they are based on cartographic processing data - cf. Appendix 4).
Elevation range
1999 2004
Mapped area
% mappedforest area
Mapped area
C R I T E R I O N 1 - F O R E S T A R E A
16
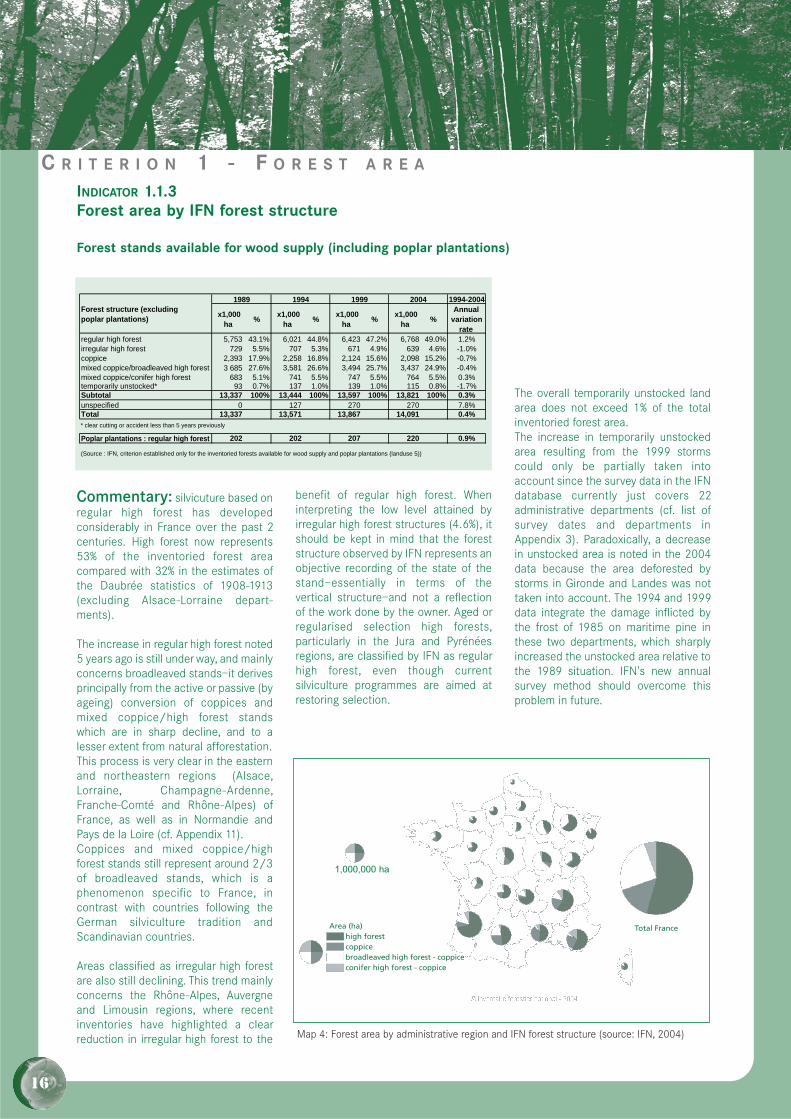
Commentary: silvicuture based onregular high forest has developedconsiderably in France over the past 2centuries. High forest now represents53% of the inventoried forest areacompared with 32% in the estimates ofthe Daubrée statistics of 1908-1913(excluding Alsace-Lorraine depart -ments).
The increase in regular high forest noted5 years ago is still under way, and mainlyconcerns broadleaved stands—it derivesprincipally from the active or passive (byageing) conversion of coppices andmixed coppice/high forest standswhich are in sharp decline, and to alesser extent from natural afforestation.This process is very clear in the easternand northeastern regions (Alsace,Lorraine, Champagne-Ardenne,Franche - Comté and Rhône-Alpes) ofFrance, as well as in Normandie andPays de la Loire (cf. Appendix 11).Coppices and mixed coppice/highforest stands still represent around 2/3of broadleaved stands, which is aphenomenon specific to France, incontrast with countries following theGerman silviculture tradition andScandinavian countries.
Areas classified as irregular high forestare also still declining. This trend mainlyconcerns the Rhône-Alpes, Auvergneand Limousin regions, where recentinventories have highlighted a clearreduction in irregular high forest to the
benefit of regular high forest. Wheninterpreting the low level attained byirregular high forest structures (4.6%), itshould be kept in mind that the foreststructure observed by IFN represents anobjective recording of the state of thestand—essentially in terms of thevertical structure—and not a reflectionof the work done by the owner. Aged orregularised selection high forests,particularly in the Jura and Pyrénéesregions, are classified by IFN as regularhigh forest, even though currentsilviculture programmes are aimed atrestoring selection.
The overall temporarily unstocked landarea does not exceed 1% of the totalinventoried forest area.The increase in temporarily unstockedarea resulting from the 1999 stormscould only be partially taken intoaccount since the survey data in the IFNdatabase currently just covers 22administrative departments (cf. list ofsurvey dates and departments inAppendix 3). Paradoxically, a decreasein unstocked area is noted in the 2004data because the area deforested bystorms in Gironde and Landes was nottaken into account. The 1994 and 1999data integrate the damage inflicted bythe frost of 1985 on maritime pine inthese two departments, which sharplyincreased the unstocked area relative tothe 1989 situation. IFN's new annualsurvey method should overcome thisproblem in future.
INDICATOR 1.1.3Forest area by IFN forest structure
Forest stands available for wood supply (including poplar plantations)
1994-2004
x1,000 ha % x1,000
ha % x1,000 ha % x1,000
ha % Annual
variation rate
regular high forest 5,753 43.1% 6,021 44.8% 6,423 47.2% 6,768 49.0% 1.2%irregular high forest 729 5.5% 707 5.3% 671 4.9% 639 4.6% -1.0%coppice 2,393 17.9% 2,258 16.8% 2,124 15.6% 2,098 15.2% -0.7%mixed coppice/broadleaved high forest 3 685 27.6% 3,581 26.6% 3,494 25.7% 3,437 24.9% -0.4%mixed coppice/conifer high forest 683 5.1% 741 5.5% 747 5.5% 764 5.5% 0.3%temporarily unstocked* 93 0.7% 137 1.0% 139 1.0% 115 0.8% -1.7%Subtotal 13,337 100% 13,444 100% 13,597 100% 13,821 100% 0.3%unspecified 0 127 270 270 7.8%Total 13,337 13,571 13,867 14,091 0.4%* clear cutting or accident less than 5 years previously
Poplar plantations : regular high forest 202 202 207 220 0.9%
(Source : IFN, criterion established only for the inventoried forests available for wood supply and poplar plantations (landuse 5))
1989 1994 1999 2004Forest structure (excludingpoplar plantations)
Map 4: Forest area by administrative region and IFN forest structure (source: IFN, 2004)
Area (ha) high forest coppice broadleaved high forest - coppice conifer high forest - coppice
Total France
1,000,000 ha
INDICATOR X.X
Commentary: French forests arevery diversified, with 136 speciesrepresented, including l76 broadleavedand 60 conifer species. Amongst these,65 species or groups of species aresufficiently represented for theInventaire forestier national (IFN) toinclude them in its forest dendrometricsurveys (cf. Appendices 5 and 6).
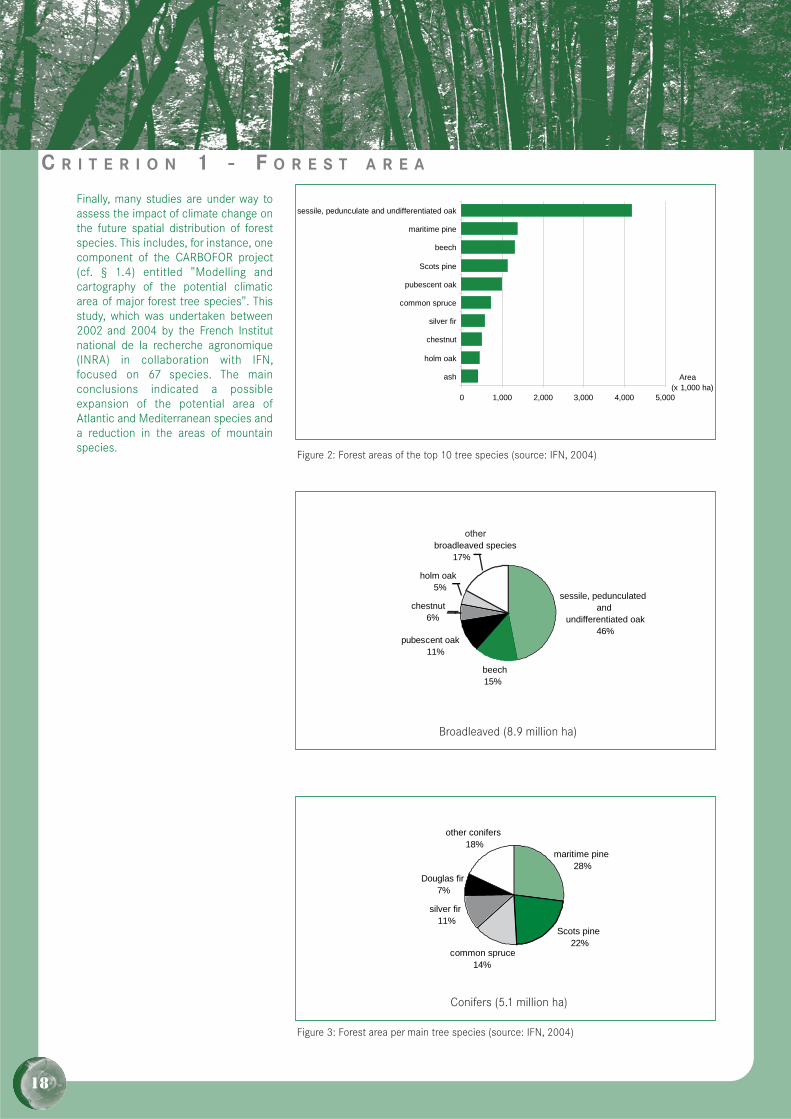
Predominantly broadleaved stands arestill in the majority, covering 64% of theforest area, or 8.9 million ha (Figure 3).Their annual rate of increase is nowabove that of conifer stands (+0.4%versus +0.2%). The different species ofoak now represent more than 40% of the
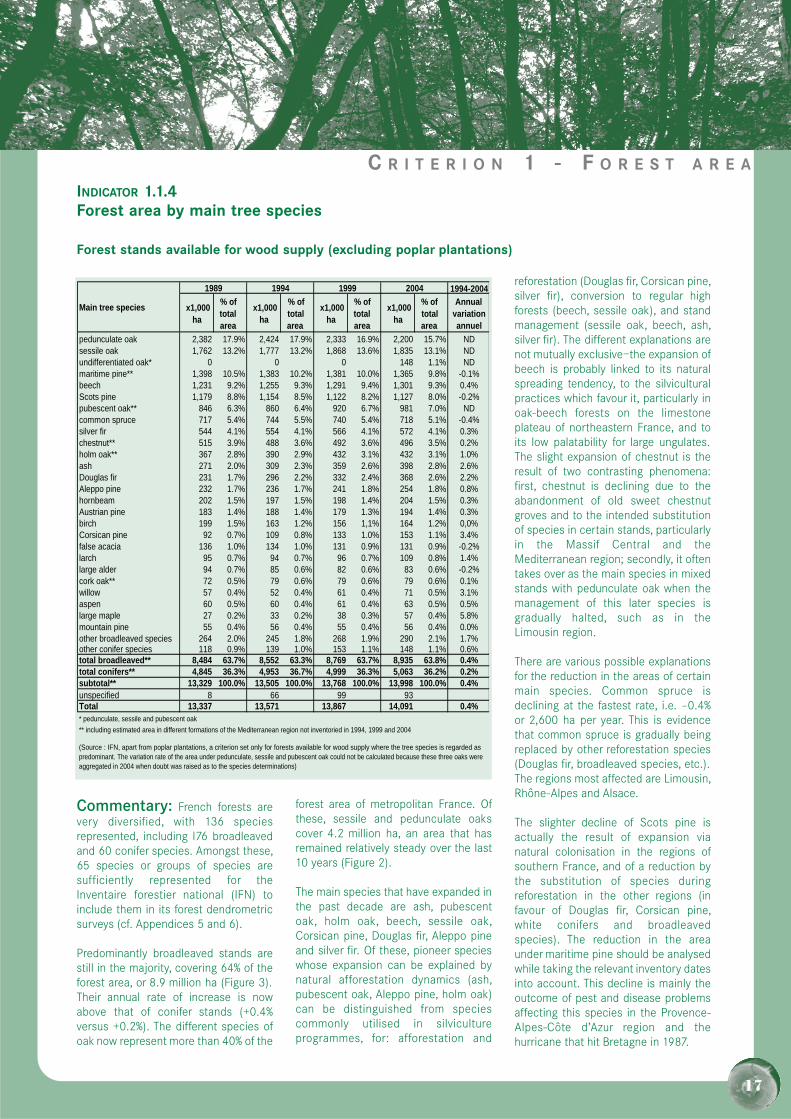
forest area of metropolitan France. Ofthese, sessile and pedunculate oakscover 4.2 million ha, an area that hasremained relatively steady over the last10 years (Figure 2).
The main species that have expanded inthe past decade are ash, pubescentoak, holm oak, beech, sessile oak,Corsican pine, Douglas fir, Aleppo pineand silver fir. Of these, pioneer specieswhose expansion can be explained bynatural afforestation dynamics (ash,pubescent oak, Aleppo pine, holm oak)can be distinguished from speciescommonly utilised in silvicultureprogrammes, for: afforestation and
reforestation (Douglas fir, Corsican pine,silver fir), conversion to regular highforests (beech, sessile oak), and standmanagement (sessile oak, beech, ash,silver fir). The different explanations arenot mutually exclusive—the expansion ofbeech is probably linked to its naturalspreading tendency, to the silviculturalpractices which favour it, particularly inoak-beech forests on the limestoneplateau of northeastern France, and toits low palatability for large ungulates.The slight expansion of chestnut is theresult of two contrasting phenomena:first, chestnut is declining due to theabandonment of old sweet chestnutgroves and to the intended substitutionof species in certain stands, particularlyin the Massif Central and theMediterranean region; secondly, it oftentakes over as the main species in mixedstands with pedunculate oak when themanagement of this later species isgradually halted, such as in theLimousin region.
There are various possible explanationsfor the reduction in the areas of certainmain species. Common spruce isdeclining at the fastest rate, i.e. –0.4%or 2,600 ha per year. This is evidencethat common spruce is gradually beingreplaced by other reforestation species(Douglas fir, broadleaved species, etc.).The regions most affected are Limousin,Rhône-Alpes and Alsace.
The slighter decline of Scots pine isactually the result of expansion vianatural colonisation in the regions ofsouthern France, and of a reduction bythe substitution of species duringreforestation in the other regions (infavour of Douglas fir, Corsican pine,white conifers and broadleavedspecies). The reduction in the areaunder maritime pine should be analysedwhile taking the relevant inventory datesinto account. This decline is mainly theoutcome of pest and disease problemsaffecting this species in the Provence-Alpes-Côte d’Azur region and thehurricane that hit Bretagne in 1987.
C R I T E R I O N 1 - F O R E S T A R E A
1994-2004
x1,000 ha
% oftotalarea
x1,000 ha
% oftotalarea
x1,000 ha
% of totalarea
x1,000 ha
% of totalarea
Annualvariation annuel
pedunculate oak 2,382 17.9% 2,424 17.9% 2,333 16.9% 2,200 15.7% NDsessile oak 1,762 13.2% 1,777 13.2% 1,868 13.6% 1,835 13.1% NDundifferentiated oak* 0 0 0 148 1.1% NDmaritime pine** 1,398 10.5% 1,383 10.2% 1,381 10.0% 1,365 9.8% -0.1%beech 1,231 9.2% 1,255 9.3% 1,291 9.4% 1,301 9.3% 0.4%Scots pine 1,179 8.8% 1,154 8.5% 1,122 8.2% 1,127 8.0% -0.2%pubescent oak** 846 6.3% 860 6.4% 920 6.7% 981 7.0% NDcommon spruce 717 5.4% 744 5.5% 740 5.4% 718 5.1% -0.4%silver fir 544 4.1% 554 4.1% 566 4.1% 572 4.1% 0.3%chestnut** 515 3.9% 488 3.6% 492 3.6% 496 3.5% 0.2%holm oak** 367 2.8% 390 2.9% 432 3.1% 432 3.1% 1.0%ash 271 2.0% 309 2.3% 359 2.6% 398 2.8% 2.6%Douglas fir 231 1.7% 296 2.2% 332 2.4% 368 2.6% 2.2%Aleppo pine 232 1.7% 236 1.7% 241 1.8% 254 1.8% 0.8%hornbeam 202 1.5% 197 1.5% 198 1.4% 204 1.5% 0.3%Austrian pine 183 1.4% 188 1.4% 179 1.3% 194 1.4% 0.3%birch 199 1.5% 163 1.2% 156 1,1% 164 1.2% 0,0%Corsican pine 92 0.7% 109 0.8% 133 1.0% 153 1.1% 3.4%false acacia 136 1.0% 134 1.0% 131 0.9% 131 0.9% -0.2%larch 95 0.7% 94 0.7% 96 0.7% 109 0.8% 1.4%large alder 94 0.7% 85 0.6% 82 0.6% 83 0.6% -0.2%cork oak** 72 0.5% 79 0.6% 79 0.6% 79 0.6% 0.1%willow 57 0.4% 52 0.4% 61 0.4% 71 0.5% 3.1%aspen 60 0.5% 60 0.4% 61 0.4% 63 0.5% 0.5%large maple 27 0.2% 33 0.2% 38 0.3% 57 0.4% 5.8%mountain pine 55 0.4% 56 0.4% 55 0.4% 56 0.4% 0.0%other broadleaved species 264 2.0% 245 1.8% 268 1.9% 290 2.1% 1.7%other conifer species 118 0.9% 139 1.0% 153 1.1% 148 1.1% 0.6%total broadleaved** 8,484 63.7% 8,552 63.3% 8,769 63.7% 8,935 63.8% 0.4%total conifers** 4,845 36.3% 4,953 36.7% 4,999 36.3% 5,063 36.2% 0.2%subtotal** 13,329 100.0% 13,505 100.0% 13,768 100.0% 13,998 100.0% 0.4%unspecified 8 66 99 93Total 13,337 13,571 13,867 14,091 0.4%* pedunculate, sessile and pubescent oak
(Source : IFN, apart from poplar plantations, a criterion set only for forests available for wood supply where the tree species is regarded aspredominant. The variation rate of the area under pedunculate, sessile and pubescent oak could not be calculated because these three oaks were aggregated in 2004 when doubt was raised as to the species determinations)
1989 1994 1999 2004
Main tree species
** including estimated area in different formations of the Mediterranean region not inventoried in 1994, 1999 and 2004
INDICATOR 1.1.4Forest area by main tree species
Forest stands available for wood supply (excluding poplar plantations)
17
Finally, many studies are under way toassess the impact of climate change onthe future spatial distribution of forestspecies. This includes, for instance, onecomponent of the CARBOFOR project(cf. § 1.4) entitled "Modelling andcartography of the potential climaticarea of major forest tree species". Thisstudy, which was undertaken between2002 and 2004 by the French Institutnational de la recherche agronomique(INRA) in collaboration with IFN,focused on 67 species. The mainconclusions indicated a possibleexpansion of the potential area ofAtlantic and Mediterranean species anda reduction in the areas of mountainspecies.
C R I T E R I O N 1 - F O R E S T A R E A
18
0 1,000 2,000 3,000 4,000 5,000
ash
holm oak
chestnut
silver fir
common spruce
pubescent oak
Scots pine
beech
maritime pine
sessile, pedunculate and undifferentiated oak
Area(x 1,000 ha)
Figure 2: Forest areas of the top 10 tree species (source: IFN, 2004)
beech15%
pubescent oak11%
chestnut6%
holm oak5%
broadleaved species17%
sessile, pedunculated and
undifferentiated oak46%
maritime pine28%
Scots pine22%
common spruce14%
silver fir11%
Douglas fir7%
other conifers18%
Figure 3: Forest area per main tree species (source: IFN, 2004)
Broadleaved (8.9 million ha)
Conifers (5.1 million ha)
other
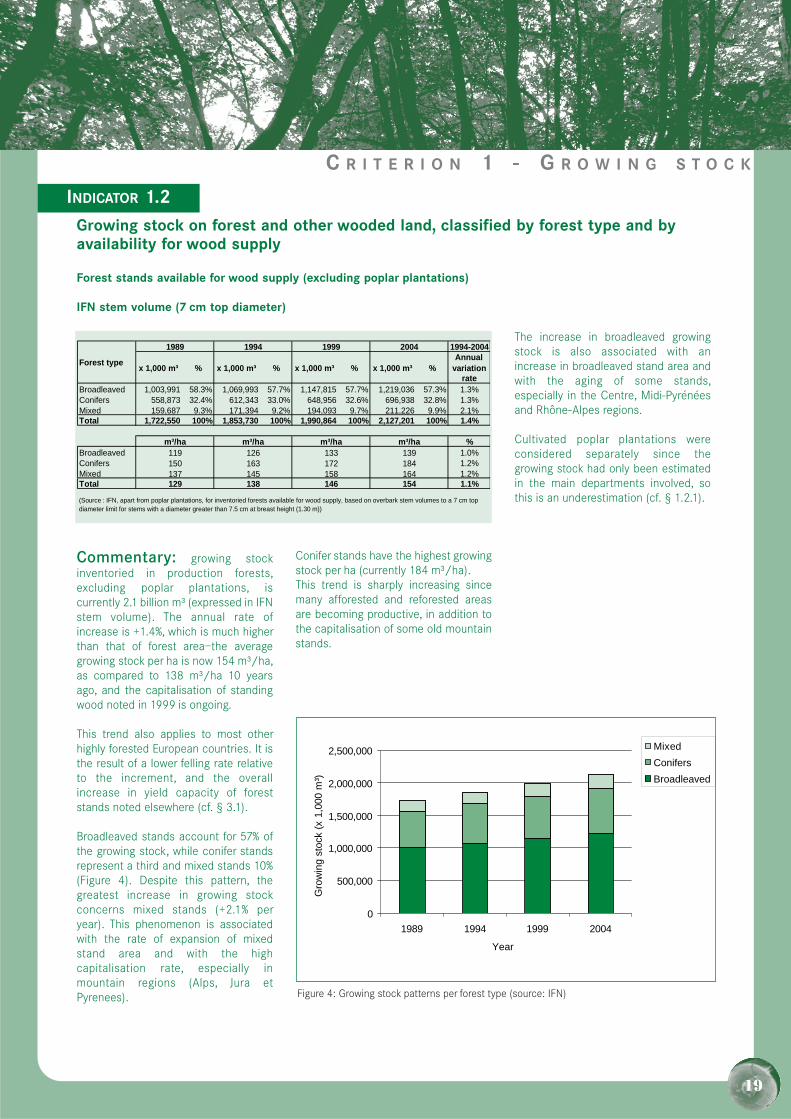
Commentary: growing stockinventoried in production forests,excluding poplar plantations, iscurrently 2.1 billion m³ (expressed in IFNstem volume). The annual rate ofincrease is +1.4%, which is much higherthan that of forest area—the averagegrowing stock per ha is now 154 m³/ha,as compared to 138 m³/ha 10 yearsago, and the capitalisation of standingwood noted in 1999 is ongoing.
This trend also applies to most otherhighly forested European countries. It isthe result of a lower felling rate relativeto the increment, and the overallincrease in yield capacity of foreststands noted elsewhere (cf. § 3.1).
Broadleaved stands account for 57% ofthe growing stock, while conifer standsrepresent a third and mixed stands 10%(Figure 4). Despite this pattern, thegreatest increase in growing stockconcerns mixed stands (+2.1% peryear). This phenomenon is associatedwith the rate of expansion of mixedstand area and with the highcapitalisation rate, especially inmountain regions (Alps, Jura etPyrenees).
Conifer stands have the highest growingstock per ha (currently 184 m³/ha).This trend is sharply increasing sincemany afforested and reforested areasare becoming productive, in addition tothe capitalisation of some old mountainstands.
The increase in broadleaved growingstock is also associated with anincrease in broadleaved stand area andwith the aging of some stands,especially in the Centre, Midi-Pyrénéesand Rhône-Alpes regions.
Cultivated poplar plantations wereconsidered separately since thegrowing stock had only been estimatedin the main departments involved, sothis is an underestimation (cf. § 1.2.1).
Growing stock on forest and other wooded land, classified by forest type and byavailability for wood supply
INDICATEUR 1.1
Forest stands available for wood supply (excluding poplar plantations)
IFN stem volume (7 cm top diameter)
C R I T E R I O N 1 - G R O W I N G S T O C K
INDICATOR 1.2
1994-2004
x 1,000 m³ % x 1,000 m³ % x 1,000 m³ % x 1,000 m³ %Annual
variation rate
Broadleaved 1,003,991 58.3% 1,069,993 57.7% 1,147,815 57.7% 1,219,036 57.3% 1.3%Conifers 558,873 32.4% 612,343 33.0% 648,956 32.6% 696,938 32.8% 1.3%Mixed 159,687 9.3% 171,394 9.2% 194,093 9.7% 211,226 9.9% 2.1%Total 1,722,550 100% 1,853,730 100% 1,990,864 100% 2,127,201 100% 1.4%
%Broadleaved 1.0%Conifers 1.2%Mixed 1.2%Total 1.1%
2004
(Source : IFN, apart from poplar plantations, for inventoried forests available for wood supply, based on overbark stem volumes to a 7 cm top diameter limit for stems with a diameter greater than 7.5 cm at breast height (1.30 m))
Forest type
1989 1994 1999
m³/ha119150137129
126163145138
184164154
133172158146
m³/ham³/ham³/ha139
Figure 4: Growing stock patterns per forest type (source: IFN)
0
500,000
1,000,000
1,500,000
2,000,000
2,500,000
1989 1994 1999 2004
Year
Gro
win
g st
ock
(x 1
,000
m³)
MixedConifersBroadleaved
19
20
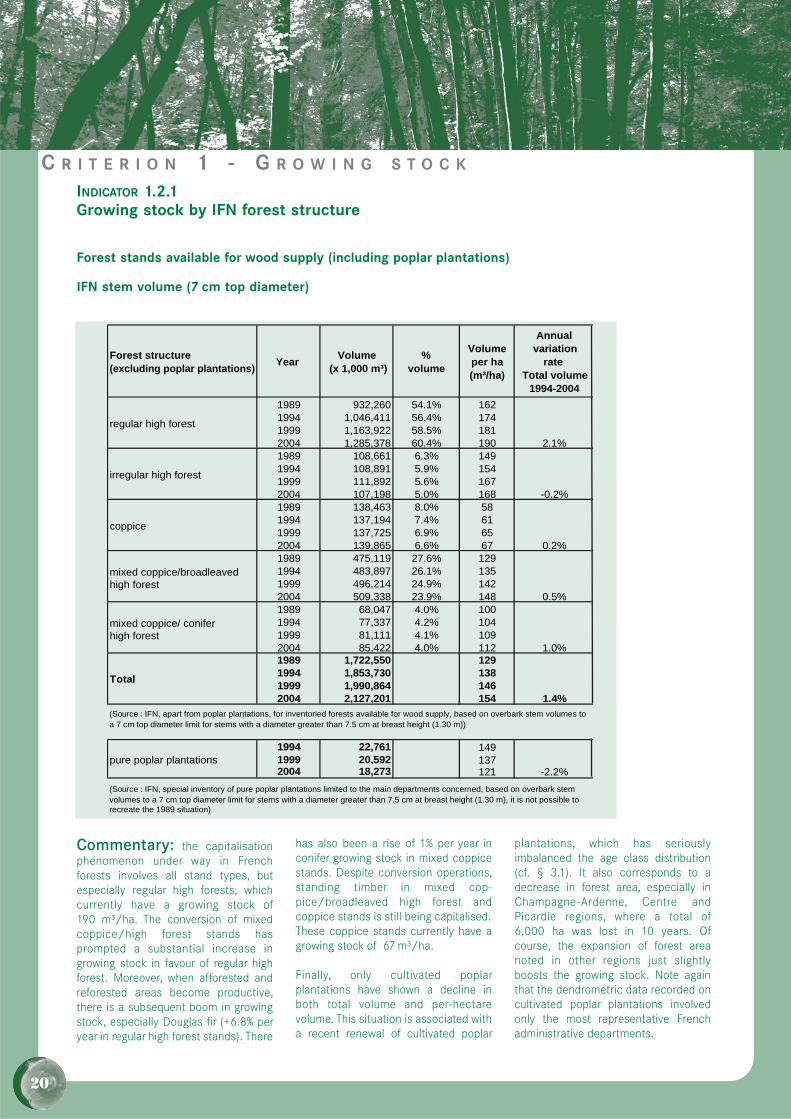
Commentary: the capitalisationphenomenon under way in Frenchforests involves all stand types, butespecially regular high forests, whichcurrently have a growing stock of190 m³/ha. The conversion of mixedcoppice/high forest stands hasprompted a substantial increase ingrowing stock in favour of regular highforest. Moreover, when afforested andreforested areas become productive,there is a subsequent boom in growingstock, especially Douglas fir (+6.8% peryear in regular high forest stands). There
has also been a rise of 1% per year inconifer growing stock in mixed coppicestands. Despite conversion operations,standing timber in mixed cop -pice/broadleaved high forest andcoppice stands is still being capitalised.These coppice stands currently have agrowing stock of 67 m³/ha.
Finally, only cultivated poplarplantations have shown a decline inboth total volume and per-hectarevolume. This situation is associated witha recent renewal of cultivated poplar
plantations, which has seriouslyimbalanced the age class distribution(cf. § 3.1). It also corresponds to adecrease in forest area, especially inChampagne-Ardenne, Centre andPicardie regions, where a total of6,000 ha was lost in 10 years. Ofcourse, the expansion of forest areanoted in other regions just slightlyboosts the growing stock. Note againthat the dendrometric data recorded oncultivated poplar plantations involvedonly the most representative Frenchadministrative departments.
INDICATOR 1.2.1Growing stock by IFN forest structure
Forest structure (excluding poplar plantations) Year Volume
(x 1,000 m³)%
volume
Volume per ha (m³/ha)
Annualvariation
rateTotal volume
1994-20041989 932,260 54.1% 1621994 1,046,411 56.4% 1741999 1,163,922 58.5% 1812004 1,285,378 60.4% 190 2.1%1989 108,661 6.3% 1491994 108,891 5.9% 1541999 111,892 5.6% 1672004 107,198 5.0% 168 -0.2%1989 138,463 8.0% 581994 137,194 7.4% 611999 137,725 6.9% 652004 139,865 6.6% 67 0.2%1989 475,119 27.6% 1291994 483,897 26.1% 1351999 496,214 24.9% 1422004 509,338 23.9% 148 0.5%1989 68,047 4.0% 1001994 77,337 4.2% 1041999 81,111 4.1% 1092004 85,422 4.0% 112 1.0%1989 1,722,550 1291994 1,853,730 1381999 1,990,864 1462004 2,127,201 154 1.4%
1994 22,761 1491999 20,592 1372004 18,273 121 -2.2%
regular high forest
irregular high forest
coppice
mixed coppice/broadleaved high forest
(Source : IFN, special inventory of pure poplar plantations limited to the main departments concerned, based on overbark stemvolumes to a 7 cm top diameter limit for stems with a diameter greater than 7.5 cm at breast height (1.30 m), it is not possible torecreate the 1989 situation)
mixed coppice/ conifer high forest
Total
(Source : IFN, apart from poplar plantations, for inventoried forests available for wood supply, based on overbark stem volumes toa 7 cm top diameter limit for stems with a diameter greater than 7.5 cm at breast height (1.30 m))
pure poplar plantations
C R I T E R I O N 1 - G R O W I N G S T O C K
Forest stands available for wood supply (including poplar plantations)
IFN stem volume (7 cm top diameter)
21
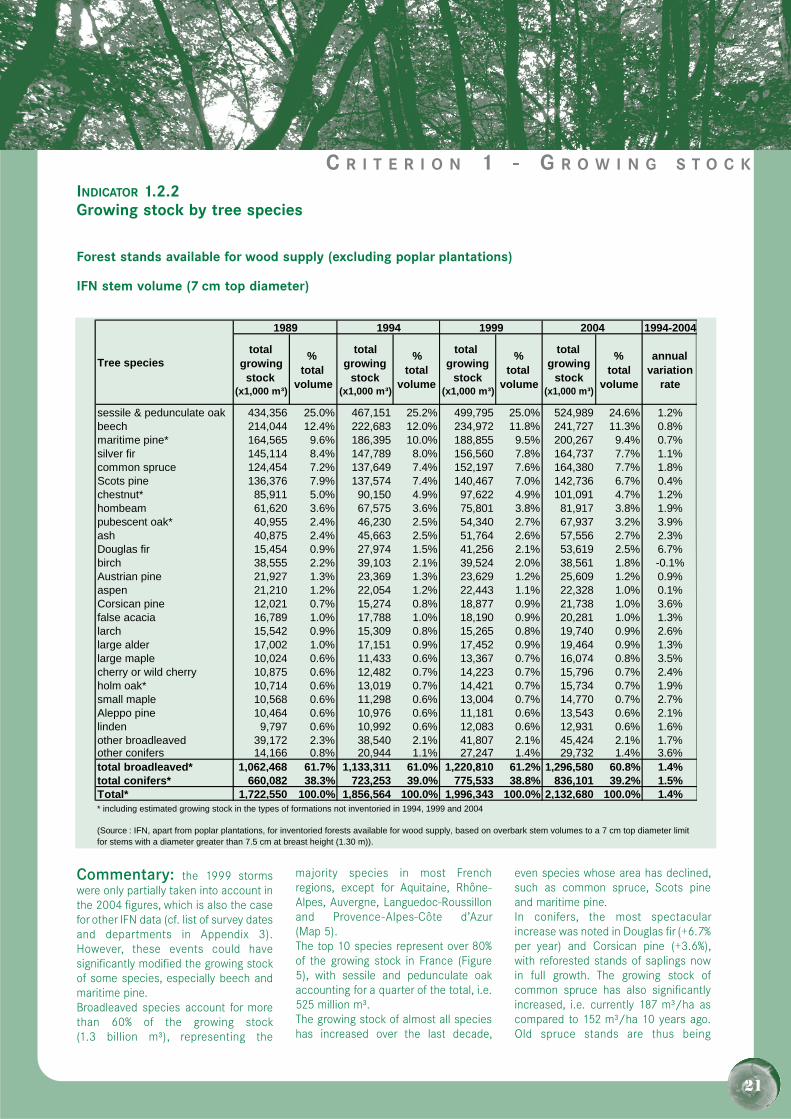
Commentary: the 1999 stormswere only partially taken into account inthe 2004 figures, which is also the casefor other IFN data (cf. list of survey datesand departments in Appendix 3).However, these events could havesignificantly modified the growing stockof some species, especially beech andmaritime pine.Broadleaved species account for morethan 60% of the growing stock(1.3 billion m³), representing the
majority species in most Frenchregions, except for Aquitaine, Rhône-Alpes, Auvergne, Languedoc-Roussillonand Provence-Alpes-Côte d’Azur(Map 5).The top 10 species represent over 80%of the growing stock in France (Figure5), with sessile and pedunculate oakaccounting for a quarter of the total, i.e.525 million m³.The growing stock of almost all specieshas increased over the last decade,
even species whose area has declined,such as common spruce, Scots pineand maritime pine.In conifers, the most spectacularincrease was noted in Douglas fir (+6.7%per year) and Corsican pine (+3.6%),with reforested stands of saplings nowin full growth. The growing stock ofcommon spruce has also significantlyincreased, i.e. currently 187 m³/ha ascompared to 152 m³/ha 10 years ago.Old spruce stands are thus being
INDICATOR 1.2.2Growing stock by tree species
1994-2004
totalgrowingstock
(x1,000 m³)
% total
volume
totalgrowing
stock(x1,000 m³)
% total
volume
totalgrowing
stock(x1,000 m³)
% total
volume
totalgrowing
stock(x1,000 m³)
% total
volume
annualvariation
rate
sessile & pedunculate oak 434,356 25.0% 467,151 25.2% 499,795 25.0% 524,989 24.6% 1.2%beech 214,044 12.4% 222,683 12.0% 234,972 11.8% 241,727 11.3% 0.8%maritime pine* 164,565 9.6% 186,395 10.0% 188,855 9.5% 200,267 9.4% 0.7%silver fir 145,114 8.4% 147,789 8.0% 156,560 7.8% 164,737 7.7% 1.1%common spruce 124,454 7.2% 137,649 7.4% 152,197 7.6% 164,380 7.7% 1.8%Scots pine 136,376 7.9% 137,574 7.4% 140,467 7.0% 142,736 6.7% 0.4%chestnut* 85,911 5.0% 90,150 4.9% 97,622 4.9% 101,091 4.7% 1.2%hombeam 61,620 3.6% 67,575 3.6% 75,801 3.8% 81,917 3.8% 1.9%pubescent oak* 40,955 2.4% 46,230 2.5% 54,340 2.7% 67,937 3.2% 3.9%ash 40,875 2.4% 45,663 2.5% 51,764 2.6% 57,556 2.7% 2.3%Douglas fir 15,454 0.9% 27,974 1.5% 41,256 2.1% 53,619 2.5% 6.7%birch 38,555 2.2% 39,103 2.1% 39,524 2.0% 38,561 1.8% -0.1%Austrian pine 21,927 1.3% 23,369 1.3% 23,629 1.2% 25,609 1.2% 0.9%aspen 21,210 1.2% 22,054 1.2% 22,443 1.1% 22,328 1.0% 0.1%Corsican pine 12,021 0.7% 15,274 0.8% 18,877 0.9% 21,738 1.0% 3.6%false acacia 16,789 1.0% 17,788 1.0% 18,190 0.9% 20,281 1.0% 1.3%larch 15,542 0.9% 15,309 0.8% 15,265 0.8% 19,740 0.9% 2.6%large alder 17,002 1.0% 17,151 0.9% 17,452 0.9% 19,464 0.9% 1.3%large maple 10,024 0.6% 11,433 0.6% 13,367 0.7% 16,074 0.8% 3.5%cherry or wild cherry 10,875 0.6% 12,482 0.7% 14,223 0.7% 15,796 0.7% 2.4%holm oak* 10,714 0.6% 13,019 0.7% 14,421 0.7% 15,734 0.7% 1.9%small maple 10,568 0.6% 11,298 0.6% 13,004 0.7% 14,770 0.7% 2.7%Aleppo pine 10,464 0.6% 10,976 0.6% 11,181 0.6% 13,543 0.6% 2.1%linden 9,797 0.6% 10,992 0.6% 12,083 0.6% 12,931 0.6% 1.6%other broadleaved 39,172 2.3% 38,540 2.1% 41,807 2.1% 45,424 2.1% 1.7%other conifers 14,166 0.8% 20,944 1.1% 27,247 1.4% 29,732 1.4% 3.6%total broadleaved* 1,062,468 61.7% 1,133,311 61.0% 1,220,810 61.2% 1,296,580 60.8% 1.4%total conifers* 660,082 38.3% 723,253 39.0% 775,533 38.8% 836,101 39.2% 1.5%Total* 1,722,550 100.0% 1,856,564 100.0% 1,996,343 100.0% 2,132,680 100.0% 1.4%* including estimated growing stock in the types of formations not inventoried in 1994, 1999 and 2004
(Source : IFN, apart from poplar plantations, for inventoried forests available for wood supply, based on overbark stem volumes to a 7 cm top diameter limitfor stems with a diameter greater than 7.5 cm at breast height (1.30 m)).
1989 1994 1999 2004
Tree species
C R I T E R I O N 1 - G R O W I N G S T O C K
Forest stands available for wood supply (excluding poplar plantations)
IFN stem volume (7 cm top diameter)
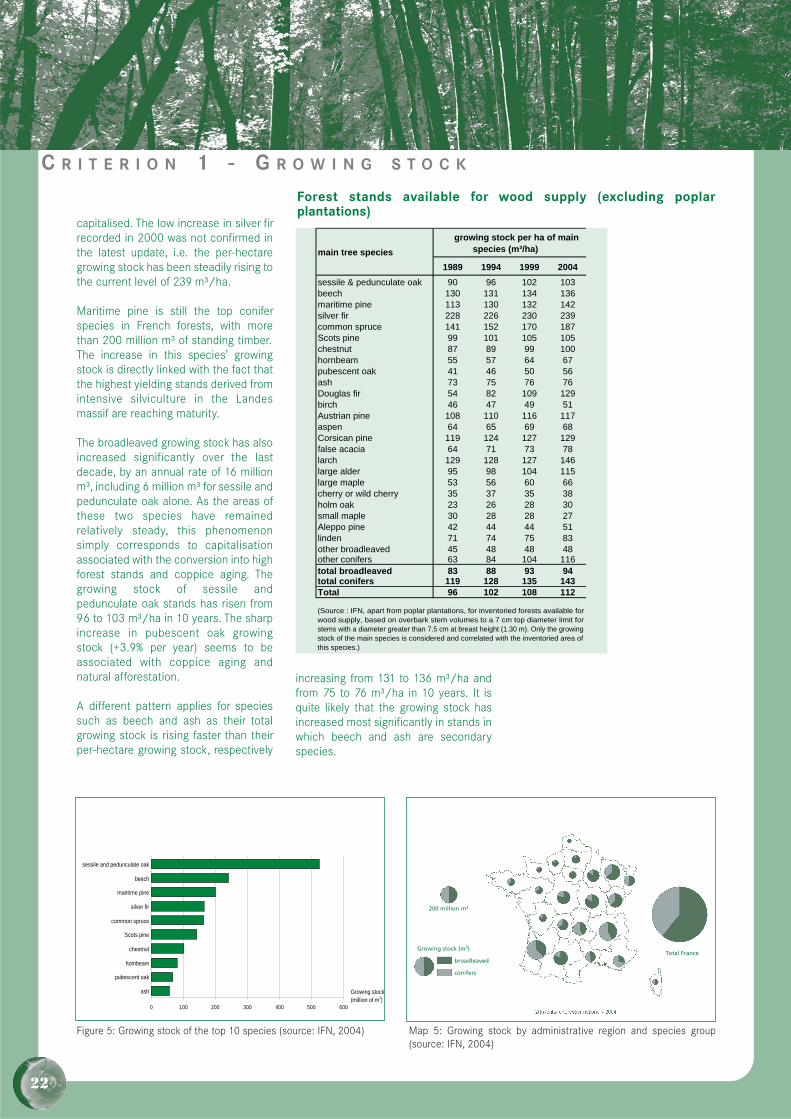
capitalised. The low increase in silver firrecorded in 2000 was not confirmed inthe latest update, i.e. the per-hectaregrowing stock has been steadily rising tothe current level of 239 m³/ha.
Maritime pine is still the top coniferspecies in French forests, with morethan 200 million m³ of standing timber.The increase in this species' growingstock is directly linked with the fact thatthe highest yielding stands derived fromintensive silviculture in the Landesmassif are reaching maturity.
The broadleaved growing stock has alsoincreased significantly over the lastdecade, by an annual rate of 16 millionm³, including 6 million m³ for sessile andpedunculate oak alone. As the areas ofthese two species have remainedrelatively steady, this phenomenonsimply corresponds to capitalisationassociated with the conversion into highforest stands and coppice aging. Thegrowing stock of sessile andpedunculate oak stands has risen from96 to 103 m³/ha in 10 years. The sharpincrease in pubescent oak growingstock (+3.9% per year) seems to beassociated with coppice aging andnatural afforestation.
A different pattern applies for speciessuch as beech and ash as their totalgrowing stock is rising faster than theirper-hectare growing stock, respectively
increasing from 131 to 136 m³/ha andfrom 75 to 76 m³/ha in 10 years. It isquite likely that the growing stock hasincreased most significantly in stands inwhich beech and ash are secondaryspecies.
Forest stands available for wood supply (excluding poplarplantations)
C R I T E R I O N 1 - G R O W I N G S T O C K
22
1989 1994 1999 2004sessile & pedunculate oak 90 96 102 103beech 130 131 134 136maritime pine 113 130 132 142silver fir 228 226 230 239common spruce 141 152 170 187Scots pine 99 101 105 105chestnut 87 89 99 100hornbeam 55 57 64 67pubescent oak 41 46 50 56ash 73 75 76 76Douglas fir 54 82 109 129birch 46 47 49 51Austrian pine 108 110 116 117aspen 64 65 69 68Corsican pine 119 124 127 129false acacia 64 71 73 78larch 129 128 127 146large alder 95 98 104 115large maple 53 56 60 66cherry or wild cherry 35 37 35 38holm oak 23 26 28 30small maple 30 28 28 27Aleppo pine 42 44 44 51linden 71 74 75 83other broadleaved 45 48 48 48other conifers 63 84 104 116total broadleaved 83 88 93 94total conifers 119 128 135 143Total 96 102 108 112
main tree speciesgrowing stock per ha of main
species (m³/ha)
(Source : IFN, apart from poplar plantations, for inventoried forests available forwood supply, based on overbark stem volumes to a 7 cm top diameter limit forstems with a diameter greater than 7.5 cm at breast height (1.30 m). Only the growingstock of the main species is considered and correlated with the inventoried area ofthis species.)
Map 5: Growing stock by administrative region and species group(source: IFN, 2004)
Figure 5: Growing stock of the top 10 species (source: IFN, 2004)
0 100 200 300 400 500 600
ash
pubescent oak
hombeam
chestnut
Scots pine
common spruce
silver fir
maritime pine
beech
sessile and pedunculate oak
Growing stock (million of m3)
Growing stock (m3)
broadleaved
conifers
Total France
200 million m3
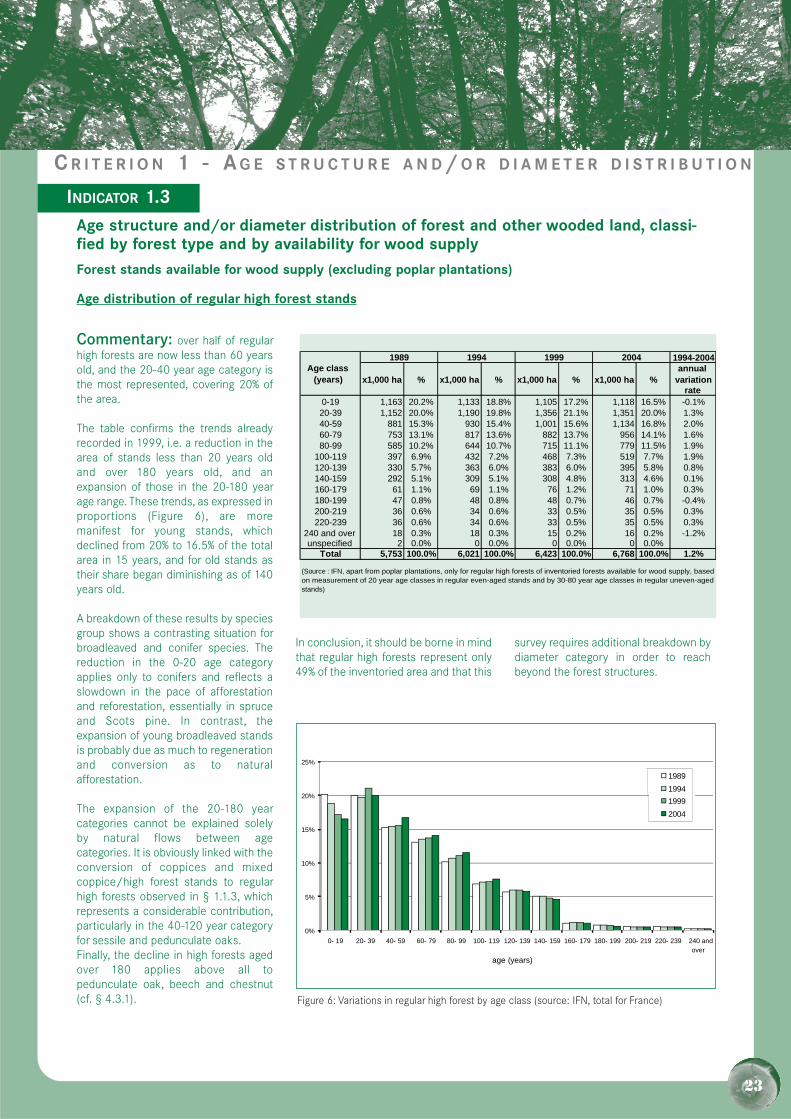
Commentary: over half of regularhigh forests are now less than 60 yearsold, and the 20-40 year age category isthe most represented, covering 20% ofthe area.
The table confirms the trends alreadyrecorded in 1999, i.e. a reduction in thearea of stands less than 20 years oldand over 180 years old, and anexpansion of those in the 20-180 yearage range. These trends, as expressed inproportions (Figure 6), are moremanifest for young stands, whichdeclined from 20% to 16.5% of the totalarea in 15 years, and for old stands astheir share began diminishing as of 140years old.
A breakdown of these results by speciesgroup shows a contrasting situation forbroadleaved and conifer species. Thereduction in the 0-20 age categoryapplies only to conifers and reflects aslowdown in the pace of afforestationand reforestation, essentially in spruceand Scots pine. In contrast, theexpansion of young broadleaved standsis probably due as much to regenerationand conversion as to naturalafforestation.
The expansion of the 20-180 yearcategories cannot be explained solelyby natural flows between agecategories. It is obviously linked with theconversion of coppices and mixedcoppice/high forest stands to regularhigh forests observed in § 1.1.3, whichrepresents a considerable contribution,particularly in the 40-120 year categoryfor sessile and pedunculate oaks.Finally, the decline in high forests agedover 180 applies above all topedunculate oak, beech and chestnut(cf. § 4.3.1).
In conclusion, it should be borne in mindthat regular high forests represent only49% of the inventoried area and that this
survey requires additional breakdown bydiameter category in order to reachbeyond the forest structures.
Age structure and/or diameter distribution of forest and other wooded land, classi-fied by forest type and by availability for wood supply
INDICATEUR 1.1
Forest stands available for wood supply (excluding poplar plantations)
Age distribution of regular high forest stands
C R I T E R I O N 1 - A G E S T R U C T U R E A N D / O R D I A M E T E R D I S T R I B U T I O N
INDICATOR 1.3
1994-2004
x1,000 ha % x1,000 ha % x1,000 ha % x1,000 ha %annual
variation rate
0-19 1,163 20.2% 1,133 18.8% 1,105 17.2% 1,118 16.5% -0.1%20-39 1,152 20.0% 1,190 19.8% 1,356 21.1% 1,351 20.0% 1.3%40-59 881 15.3% 930 15.4% 1,001 15.6% 1,134 16.8% 2.0%60-79 753 13.1% 817 13.6% 882 13.7% 956 14.1% 1.6%80-99 585 10.2% 644 10.7% 715 11.1% 779 11.5% 1.9%
100-119 397 6.9% 432 7.2% 468 7.3% 519 7.7% 1.9%120-139 330 5.7% 363 6.0% 383 6.0% 395 5.8% 0.8%140-159 292 5.1% 309 5.1% 308 4.8% 313 4.6% 0.1%160-179 61 1.1% 69 1.1% 76 1.2% 71 1.0% 0.3%180-199 47 0.8% 48 0.8% 48 0.7% 46 0.7% -0.4%200-219 36 0.6% 34 0.6% 33 0.5% 35 0.5% 0.3%220-239 36 0.6% 34 0.6% 33 0.5% 35 0.5% 0.3%
240 and over 18 0.3% 18 0.3% 15 0.2% 16 0.2% -1.2%unspecified 2 0.0% 0 0.0% 0 0.0% 0 0.0%
Total 5,753 100.0% 6,021 100.0% 6,423 100.0% 6,768 100.0% 1.2%
2004
(Source : IFN, apart from poplar plantations, only for regular high forests of inventoried forests available for wood supply, basedon measurement of 20 year age classes in regular even-aged stands and by 30-80 year age classes in regular uneven-agedstands)
Age class(years)
1989 1994 1999
Figure 6: Variations in regular high forest by age class (source: IFN, total for France)
0%
5%
10%
15%
20%
25%
0- 19 20- 39 40- 59 60- 79 80- 99 100- 119 120- 139 140- 159 160- 179 180- 199 200- 219 220- 239 240 andover
1989199419992004
age (years)
23
C R I T E R I O N 1 - A G E S T R U C T U R E A N D / O R D I A M E T E R D I S T R I B U T I O N
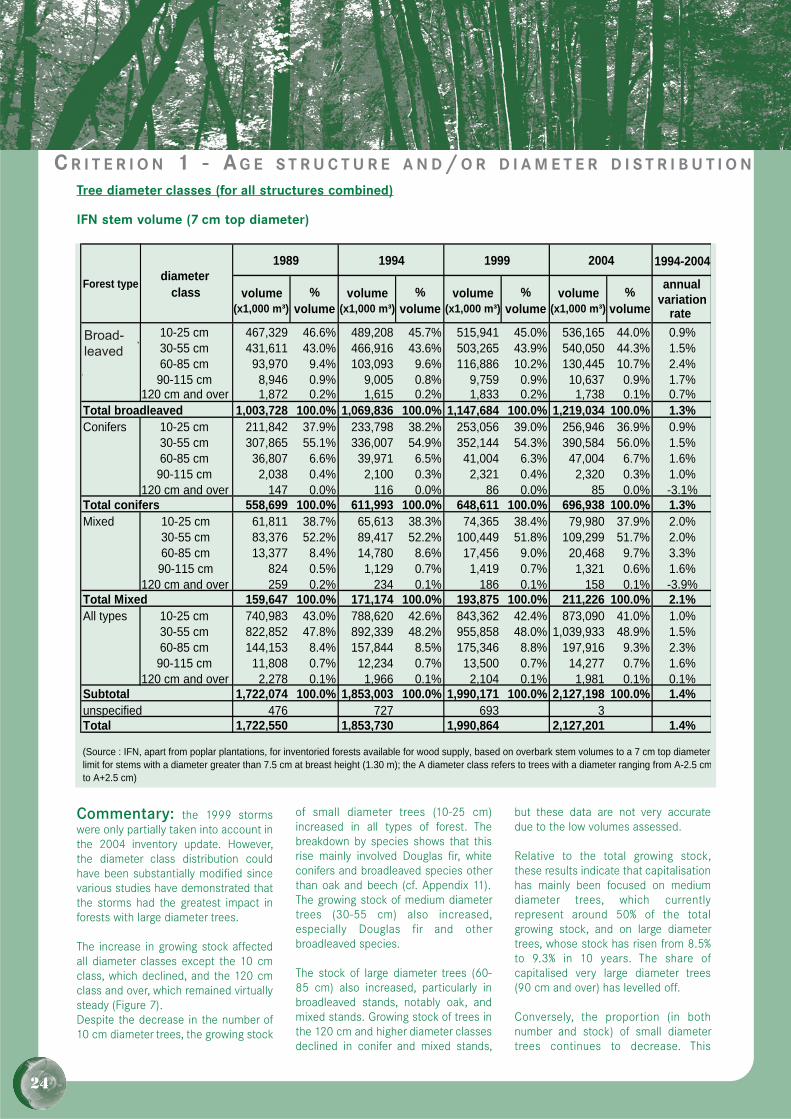
Commentary: the 1999 stormswere only partially taken into account inthe 2004 inventory update. However,the diameter class distribution couldhave been substantially modified sincevarious studies have demonstrated thatthe storms had the greatest impact inforests with large diameter trees.
The increase in growing stock affectedall diameter classes except the 10 cmclass, which declined, and the 120 cmclass and over, which remained virtuallysteady (Figure 7).Despite the decrease in the number of10 cm diameter trees, the growing stock
of small diameter trees (10-25 cm)increased in all types of forest. Thebreakdown by species shows that thisrise mainly involved Douglas fir, whiteconifers and broadleaved species otherthan oak and beech (cf. Appendix 11).The growing stock of medium diametertrees (30-55 cm) also increased,especially Douglas fir and otherbroadleaved species.
The stock of large diameter trees (60-85 cm) also increased, particularly inbroadleaved stands, notably oak, andmixed stands. Growing stock of trees inthe 120 cm and higher diameter classesdeclined in conifer and mixed stands,
but these data are not very accuratedue to the low volumes assessed.
Relative to the total growing stock,these results indicate that capitalisationhas mainly been focused on mediumdiameter trees, which currentlyrepresent around 50% of the totalgrowing stock, and on large diametertrees, whose stock has risen from 8.5%to 9.3% in 10 years. The share ofcapitalised very large diameter trees(90 cm and over) has levelled off.
Conversely, the proportion (in bothnumber and stock) of small diametertrees continues to decrease. This
1994-2004
volume (x1,000 m³)
% volume
volume (x1,000 m³)
% volume
volume (x1,000 m³)
% volume
volume (x1,000 m³)
% volume
annual variation
rate
Broadleaved10-25 cm 467,329 46.6% 489,208 45.7% 515,941 45.0% 536,165 44.0% 0.9%30-55 cm 431,611 43.0% 466,916 43.6% 503,265 43.9% 540,050 44.3% 1.5%60-85 cm 93,970 9.4% 103,093 9.6% 116,886 10.2% 130,445 10.7% 2.4%90-115 cm 8,946 0.9% 9,005 0.8% 9,759 0.9% 10,637 0.9% 1.7%
120 cm and over 1,872 0.2% 1,615 0.2% 1,833 0.2% 1,738 0.1% 0.7%Total broadleaved 1,003,728 100.0% 1,069,836 100.0% 1,147,684 100.0% 1,219,034 100.0% 1.3%Conifers 10-25 cm 211,842 37.9% 233,798 38.2% 253,056 39.0% 256,946 36.9% 0.9%
30-55 cm 307,865 55.1% 336,007 54.9% 352,144 54.3% 390,584 56.0% 1.5%60-85 cm 36,807 6.6% 39,971 6.5% 41,004 6.3% 47,004 6.7% 1.6%90-115 cm 2,038 0.4% 2,100 0.3% 2,321 0.4% 2,320 0.3% 1.0%
120 cm and over 147 0.0% 116 0.0% 86 0.0% 85 0.0% -3.1%Total conifers 558,699 100.0% 611,993 100.0% 648,611 100.0% 696,938 100.0% 1.3%Mixed 10-25 cm 61,811 38.7% 65,613 38.3% 74,365 38.4% 79,980 37.9% 2.0%
30-55 cm 83,376 52.2% 89,417 52.2% 100,449 51.8% 109,299 51.7% 2.0%60-85 cm 13,377 8.4% 14,780 8.6% 17,456 9.0% 20,468 9.7% 3.3%90-115 cm 824 0.5% 1,129 0.7% 1,419 0.7% 1,321 0.6% 1.6%
120 cm and over 259 0.2% 234 0.1% 186 0.1% 158 0.1% -3.9%Total Mixed 159,647 100.0% 171,174 100.0% 193,875 100.0% 211,226 100.0% 2.1%All types 10-25 cm 740,983 43.0% 788,620 42.6% 843,362 42.4% 873,090 41.0% 1.0%
30-55 cm 822,852 47.8% 892,339 48.2% 955,858 48.0% 1,039,933 48.9% 1.5%60-85 cm 144,153 8.4% 157,844 8.5% 175,346 8.8% 197,916 9.3% 2.3%90-115 cm 11,808 0.7% 12,234 0.7% 13,500 0.7% 14,277 0.7% 1.6%
120 cm and over 2,278 0.1% 1,966 0.1% 2,104 0.1% 1,981 0.1% 0.1%Subtotal 1,722,074 100.0% 1,853,003 100.0% 1,990,171 100.0% 2,127,198 100.0% 1.4%unspecified 476 727 693 3Total 1,722,550 1,853,730 1,990,864 2,127,201 1.4%
(Source : IFN, apart from poplar plantations, for inventoried forests available for wood supply, based on overbark stem volumes to a 7 cm top diameterlimit for stems with a diameter greater than 7.5 cm at breast height (1.30 m); the A diameter class refers to trees with a diameter ranging from A-2.5 cmto A+2.5 cm)
1989 1994 1999 2004
Forest type diameterclass
24
Tree diameter classes (for all structures combined)
IFN stem volume (7 cm top diameter)
Broad-
leaved
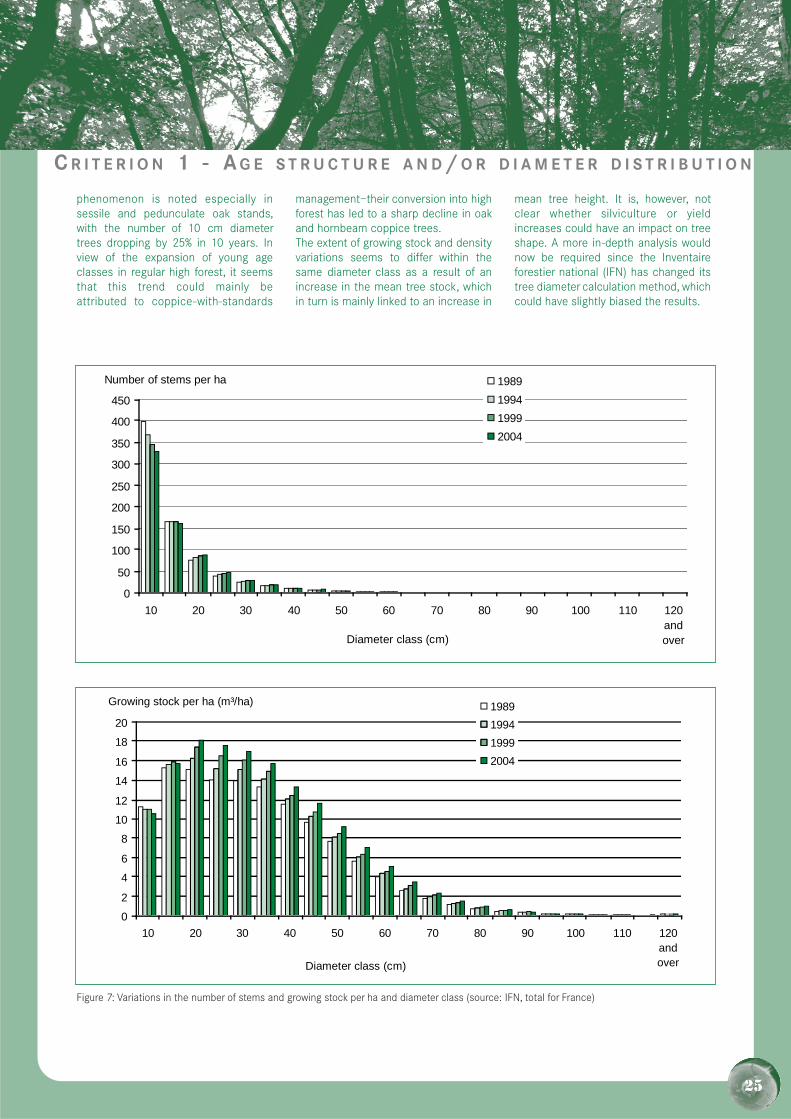
phenomenon is noted especially insessile and pedunculate oak stands,with the number of 10 cm diametertrees dropping by 25% in 10 years. Inview of the expansion of young ageclasses in regular high forest, it seemsthat this trend could mainly beattributed to coppice-with-standards
management—their conversion into highforest has led to a sharp decline in oakand hornbeam coppice trees.The extent of growing stock and densityvariations seems to differ within thesame diameter class as a result of anincrease in the mean tree stock, whichin turn is mainly linked to an increase in
mean tree height. It is, however, notclear whether silviculture or yieldincreases could have an impact on treeshape. A more in-depth analysis wouldnow be required since the Inventaireforestier national (IFN) has changed itstree diameter calculation method, whichcould have slightly biased the results.
0
50
100
150
200
250
300
350
400
450
10 20 30 40 50 60 70 80 90 100 110 120andover
1989199419992004
Diameter class (cm)
Number of stems per ha
C R I T E R I O N 1 - A G E S T R U C T U R E A N D / O R D I A M E T E R D I S T R I B U T I O N
Figure 7: Variations in the number of stems and growing stock per ha and diameter class (source: IFN, total for France)
0
2
4
6
8
10
12
14
16
18
20
10 20 30 40 50 60 70 80 90 100 110 120andover
1989199419992004
Diameter class (cm)
Growing stock per ha (m³/ha)
25
C R I T E R I O N 1 - C A R B O N S T O C K
26
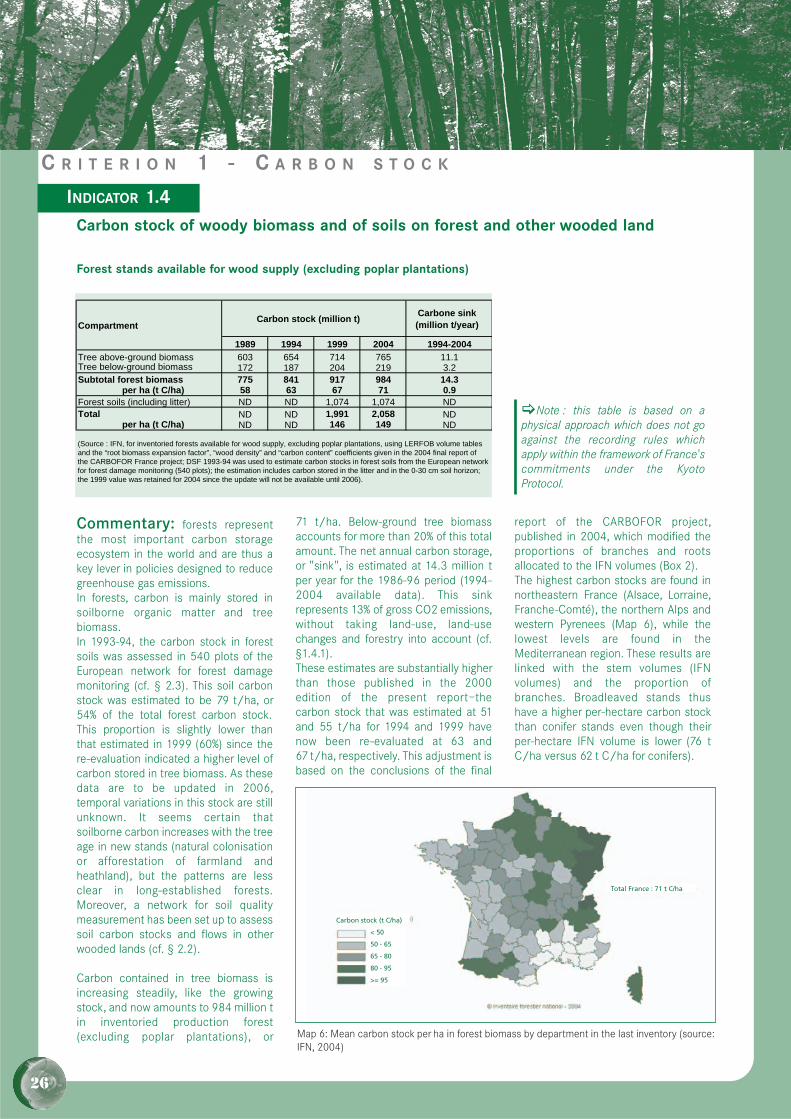
Commentary: forests representthe most important carbon storageecosystem in the world and are thus akey lever in policies designed to reducegreenhouse gas emissions.In forests, carbon is mainly stored insoilborne organic matter and treebiomass.In 1993-94, the carbon stock in forestsoils was assessed in 540 plots of theEuropean network for forest damagemonitoring (cf. § 2.3). This soil carbonstock was estimated to be 79 t/ha, or54% of the total forest carbon stock.This proportion is slightly lower thanthat estimated in 1999 (60%) since there-evaluation indicated a higher level ofcarbon stored in tree biomass. As thesedata are to be updated in 2006,temporal variations in this stock are stillunknown. It seems certain thatsoilborne carbon increases with the treeage in new stands (natural colonisationor afforestation of farmland andheathland), but the patterns are lessclear in long-established forests.Moreover, a network for soil qualitymeasurement has been set up to assesssoil carbon stocks and flows in otherwooded lands (cf. § 2.2).
Carbon contained in tree biomass isincreasing steadily, like the growingstock, and now amounts to 984 million tin inventoried production forest(excluding poplar plantations), or
71 t/ha. Below-ground tree biomassaccounts for more than 20% of this totalamount. The net annual carbon storage,or "sink", is estimated at 14.3 million tper year for the 1986-96 period (1994-2004 available data). This sinkrepresents 13% of gross CO2 emissions,without taking land-use, land-usechanges and forestry into account (cf.§1.4.1).These estimates are substantially higherthan those published in the 2000edition of the present report—thecarbon stock that was estimated at 51and 55 t/ha for 1994 and 1999 havenow been re-evaluated at 63 and67 t/ha, respectively. This adjustment isbased on the conclusions of the final
report of the CARBOFOR project,published in 2004, which modified theproportions of branches and rootsallocated to the IFN volumes (Box 2).The highest carbon stocks are found innortheastern France (Alsace, Lorraine,Franche-Comté), the northern Alps andwestern Pyrenees (Map 6), while thelowest levels are found in theMediterranean region. These results arelinked with the stem volumes (IFNvolumes) and the proportion ofbranches. Broadleaved stands thushave a higher per-hectare carbon stockthan conifer stands even though theirper-hectare IFN volume is lower (76 tC/ha versus 62 t C/ha for conifers).
Carbon stock of woody biomass and of soils on forest and other wooded land
INDICATEUR 1.1INDICATOR 1.4
Forest stands available for wood supply (excluding poplar plantations)
Map 6: Mean carbon stock per ha in forest biomass by department in the last inventory (source:IFN, 2004)
Carbon stock (t C/ha)
< 50
50 - 65
65 - 80
80 - 95
>= 95
Total France : 71 t C/ha
Carbone sink (million t/year)
1989 1994 1999 2004 1994-2004Tree above-ground biomass 603 654 714 765 11.1Tree below-ground biomass 172 187 204 219 3.2Subtotal forest biomass 775 841 917 984 14.3
per ha (t C/ha) 58 63 67 71 0.9Forest soils (including litter) ND ND 1,074 1,074 NDTotal ND ND 1,991 2,058 ND
per ha (t C/ha) ND ND 146 149 ND
CompartmentCarbon stock (million t)
(Source : IFN, for inventoried forests available for wood supply, excluding poplar plantations, using LERFOB volume tablesand the “root biomass expansion factor”, “wood density” and “carbon content” coefficients given in the 2004 final report ofthe CARBOFOR France project; DSF 1993-94 was used to estimate carbon stocks in forest soils from the European networkfor forest damage monitoring (540 plots); the estimation includes carbon stored in the litter and in the 0-30 cm soil horizon;the 1999 value was retained for 2004 since the update will not be available until 2006).
�Note : this table is based on aphysical approach which does not goagainst the recording rules whichapply within the framework of France'scommitments under the KyotoProtocol.
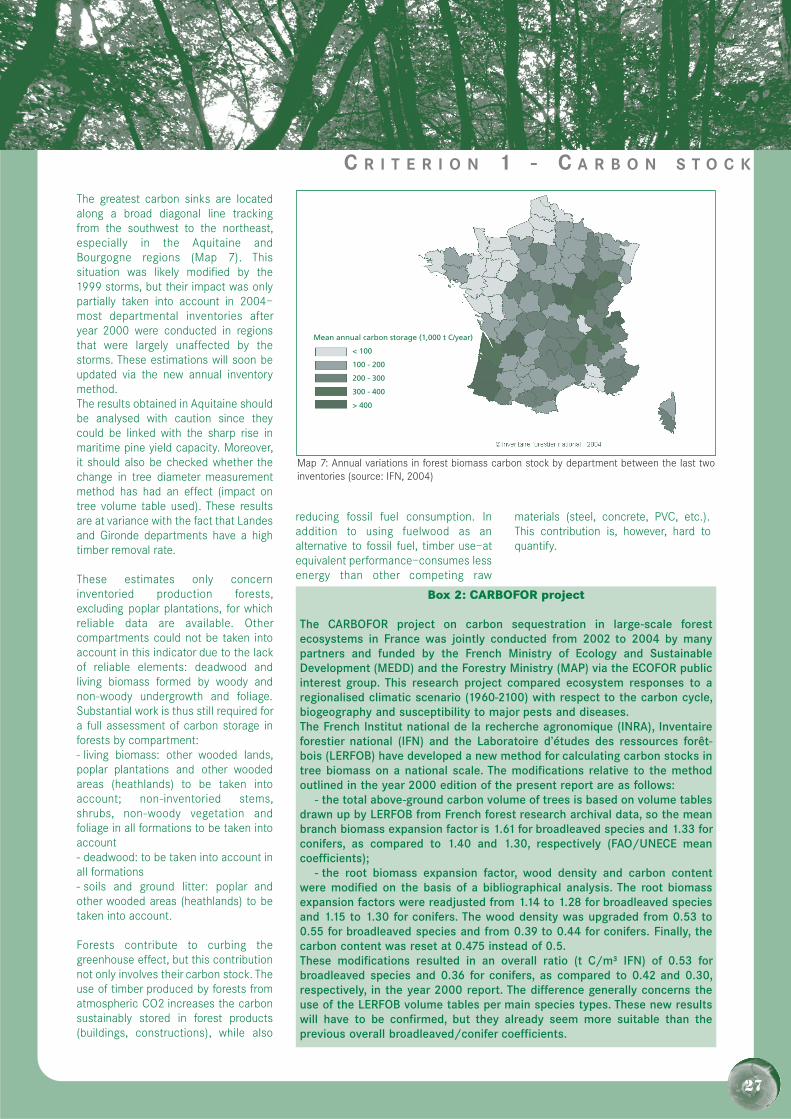
The greatest carbon sinks are locatedalong a broad diagonal line trackingfrom the southwest to the northeast,especially in the Aquitaine andBourgogne regions (Map 7). Thissituation was likely modified by the1999 storms, but their impact was onlypartially taken into account in 2004—most departmental inventories afteryear 2000 were conducted in regionsthat were largely unaffected by thestorms. These estimations will soon beupdated via the new annual inventorymethod. The results obtained in Aquitaine shouldbe analysed with caution since theycould be linked with the sharp rise inmaritime pine yield capacity. Moreover,it should also be checked whether thechange in tree diameter measurementmethod has had an effect (impact ontree volume table used). These resultsare at variance with the fact that Landesand Gironde departments have a hightimber removal rate.
These estimates only concerninventoried production forests,excluding poplar plantations, for whichreliable data are available. Othercompartments could not be taken intoaccount in this indicator due to the lackof reliable elements: deadwood andliving biomass formed by woody andnon-woody undergrowth and foliage.Substantial work is thus still required fora full assessment of carbon storage inforests by compartment:- living biomass: other wooded lands,poplar plantations and other woodedareas (heathlands) to be taken intoaccount; non-inventoried stems,shrubs, non-woody vegetation andfoliage in all formations to be taken intoaccount- deadwood: to be taken into account inall formations- soils and ground litter: poplar andother wooded areas (heathlands) to betaken into account.
Forests contribute to curbing thegreenhouse effect, but this contributionnot only involves their carbon stock. Theuse of timber produced by forests fromatmospheric CO2 increases the carbonsustainably stored in forest products(buildings, constructions), while also
reducing fossil fuel consumption. Inaddition to using fuelwood as analternative to fossil fuel, timber use—atequivalent performance—consumes lessenergy than other competing raw
materials (steel, concrete, PVC, etc.).This contribution is, however, hard toquantify.
Box 2: CARBOFOR project
The CARBOFOR project on carbon sequestration in large-scale forestecosystems in France was jointly conducted from 2002 to 2004 by manypartners and funded by the French Ministry of Ecology and SustainableDevelopment (MEDD) and the Forestry Ministry (MAP) via the ECOFOR publicinterest group. This research project compared ecosystem responses to aregionalised climatic scenario (1960-2100) with respect to the carbon cycle,biogeography and susceptibility to major pests and diseases.The French Institut national de la recherche agronomique (INRA), Inventaireforestier national (IFN) and the Laboratoire d’études des ressources forêt-bois (LERFOB) have developed a new method for calculating carbon stocks intree biomass on a national scale. The modifications relative to the methodoutlined in the year 2000 edition of the present report are as follows:
- the total above-ground carbon volume of trees is based on volume tablesdrawn up by LERFOB from French forest research archival data, so the meanbranch biomass expansion factor is 1.61 for broadleaved species and 1.33 forconifers, as compared to 1.40 and 1.30, respectively (FAO/UNECE meancoefficients);
- the root biomass expansion factor, wood density and carbon contentwere modified on the basis of a bibliographical analysis. The root biomassexpansion factors were readjusted from 1.14 to 1.28 for broadleaved speciesand 1.15 to 1.30 for conifers. The wood density was upgraded from 0.53 to0.55 for broadleaved species and from 0.39 to 0.44 for conifers. Finally, thecarbon content was reset at 0.475 instead of 0.5.These modifications resulted in an overall ratio (t C/m³ IFN) of 0.53 forbroadleaved species and 0.36 for conifers, as compared to 0.42 and 0.30,respectively, in the year 2000 report. The difference generally concerns theuse of the LERFOB volume tables per main species types. These new resultswill have to be confirmed, but they already seem more suitable than theprevious overall broadleaved/conifer coefficients.
C R I T E R I O N 1 - C A R B O N S T O C K
Map 7: Annual variations in forest biomass carbon stock by department between the last twoinventories (source: IFN, 2004)
Mean annual carbon storage (1,000 t C/year)
< 100
100 - 200
200 - 300
300 - 400
> 400
27
28
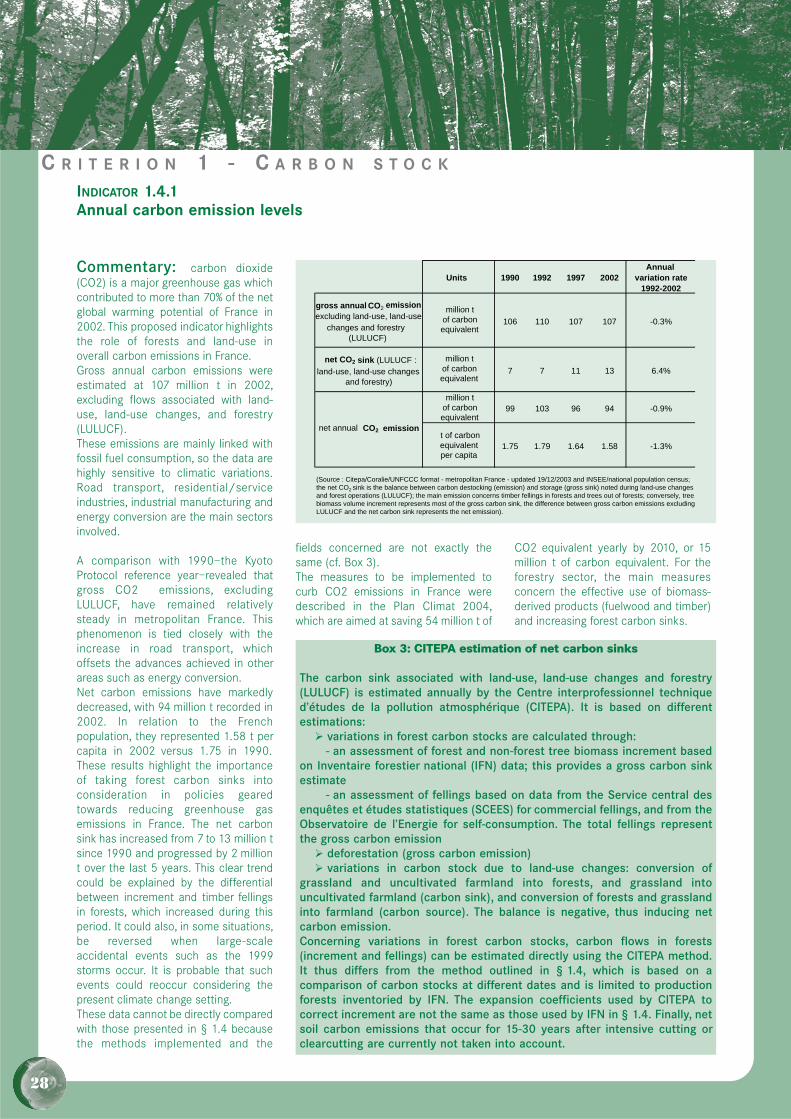
Commentary: carbon dioxide(CO2) is a major greenhouse gas whichcontributed to more than 70% of the netglobal warming potential of France in2002. This proposed indicator highlightsthe role of forests and land-use inoverall carbon emissions in France.Gross annual carbon emissions wereestimated at 107 million t in 2002,excluding flows associated with land-use, land-use changes, and forestry(LULUCF).These emissions are mainly linked withfossil fuel consumption, so the data arehighly sensitive to climatic variations.Road transport, residential/serviceindustries, industrial manufacturing andenergy conversion are the main sectorsinvolved.
A comparison with 1990—the KyotoProtocol reference year—revealed thatgross CO2 emissions, excludingLULUCF, have remained relativelysteady in metropolitan France. Thisphenomenon is tied closely with theincrease in road transport, whichoffsets the advances achieved in otherareas such as energy conversion.Net carbon emissions have markedlydecreased, with 94 million t recorded in2002. In relation to the Frenchpopulation, they represented 1.58 t percapita in 2002 versus 1.75 in 1990.These results highlight the importanceof taking forest carbon sinks intoconsideration in policies gearedtowards reducing greenhouse gasemissions in France. The net carbonsink has increased from 7 to 13 million tsince 1990 and progressed by 2 milliont over the last 5 years. This clear trendcould be explained by the differentialbetween increment and timber fellingsin forests, which increased during thisperiod. It could also, in some situations,be reversed when large-scaleaccidental events such as the 1999storms occur. It is probable that suchevents could reoccur considering thepresent climate change setting.These data cannot be directly comparedwith those presented in § 1.4 becausethe methods implemented and the
fields concerned are not exactly thesame (cf. Box 3).The measures to be implemented tocurb CO2 emissions in France weredescribed in the Plan Climat 2004,which are aimed at saving 54 million t of
CO2 equivalent yearly by 2010, or 15million t of carbon equivalent. For theforestry sector, the main measuresconcern the effective use of biomass-derived products (fuelwood and timber)and increasing forest carbon sinks.
INDICATOR 1.4.1Annual carbon emission levels
Units 1990 1992 1997 2002Annual
variation rate1992-2002
gross annual emissionexcluding land-use, land-use
CO2
changes and forestry (LULUCF)
million t of carbon equivalent
106 110 107 107 -0.3%
net CO2 sink (LULUCF : land-use, land-use changes
and forestry)7 7 11 13 6.4%
99 103 96 94 -0.9%
1.75 1.79 1.64 1.58 -1.3%
net annual emissionCO2
(Source : Citepa/Coralie/UNFCCC format - metropolitan France - updated 19/12/2003 and INSEE/national population census;the net CO sink is the balance between carbon destocking (emission) and storage (gross sink) noted during land-use changesand forest operations (LULUCF); the main emission concerns timber fellings in forests and trees out of forests; conversely, treebiomass volume increment represents most of the gross carbon sink, the difference between gross carbon emissions excludingLULUCF and the net carbon sink represents the net emission).
2
million t of carbon equivalent
million t of carbon equivalent
t of carbonequivalent per capita
C R I T E R I O N 1 - C A R B O N S T O C K
Box 3: CITEPA estimation of net carbon sinks
The carbon sink associated with land-use, land-use changes and forestry(LULUCF) is estimated annually by the Centre interprofessionnel techniqued’études de la pollution atmosphérique (CITEPA). It is based on differentestimations:
� variations in forest carbon stocks are calculated through:- an assessment of forest and non-forest tree biomass increment based
on Inventaire forestier national (IFN) data; this provides a gross carbon sinkestimate
- an assessment of fellings based on data from the Service central desenquêtes et études statistiques (SCEES) for commercial fellings, and from theObservatoire de l’Energie for self-consumption. The total fellings representthe gross carbon emission
� deforestation (gross carbon emission)� variations in carbon stock due to land-use changes: conversion of
grassland and uncultivated farmland into forests, and grassland intouncultivated farmland (carbon sink), and conversion of forests and grasslandinto farmland (carbon source). The balance is negative, thus inducing netcarbon emission.Concerning variations in forest carbon stocks, carbon flows in forests(increment and fellings) can be estimated directly using the CITEPA method.It thus differs from the method outlined in § 1.4, which is based on acomparison of carbon stocks at different dates and is limited to productionforests inventoried by IFN. The expansion coefficients used by CITEPA tocorrect increment are not the same as those used by IFN in § 1.4. Finally, netsoil carbon emissions that occur for 15-30 years after intensive cutting orclearcutting are currently not taken into account.