Embed Size (px)
Citation preview
MapScore:
Probability Map Evaluation for Search & Rescue
Eric Cawi, Nathan Jones, Dr. Charles Twardy
Funded by an NSF “Research Experience for Undergraduates” grant to
colleagues at Brigham Young University. Many thanks to NSF and BYU
Probability map by Lanny Lin
Agenda
• Introduction / Context
• Website Walkthrough
• ESRI models using Koester’s stats
• Tabletop Exercise
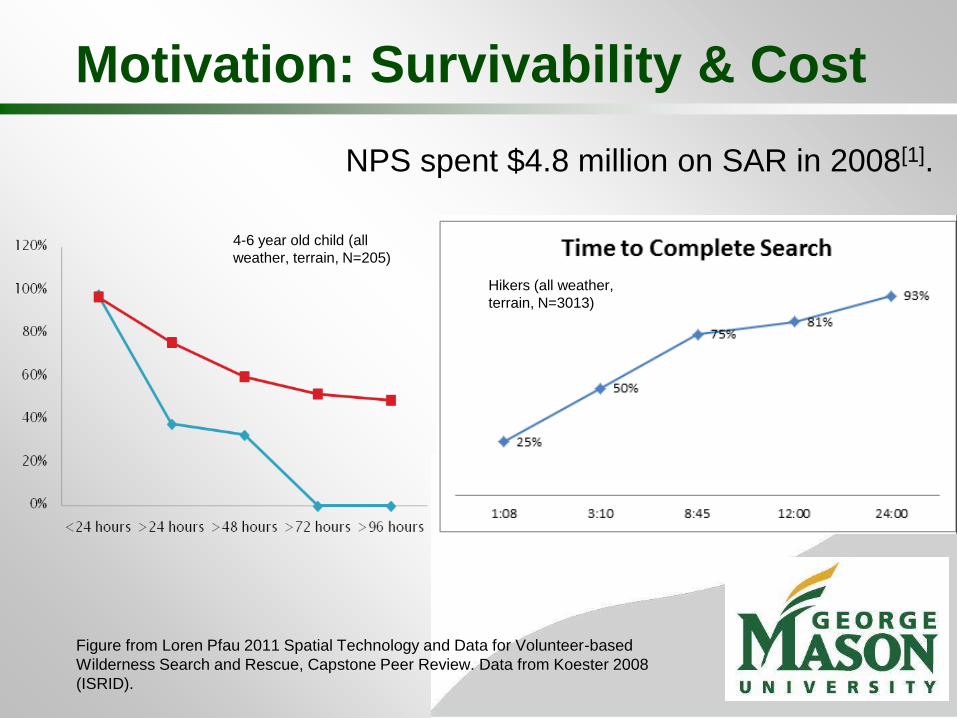
Motivation: Survivability & Cost
Figure from Loren Pfau 2011 Spatial Technology and Data for Volunteer-based
Wilderness Search and Rescue, Capstone Peer Review. Data from Koester 2008
(ISRID).
4-6 year old child (all
weather, terrain, N=205)
Hikers (all weather,
terrain, N=3013)
NPS spent $4.8 million on SAR in 2008[1].
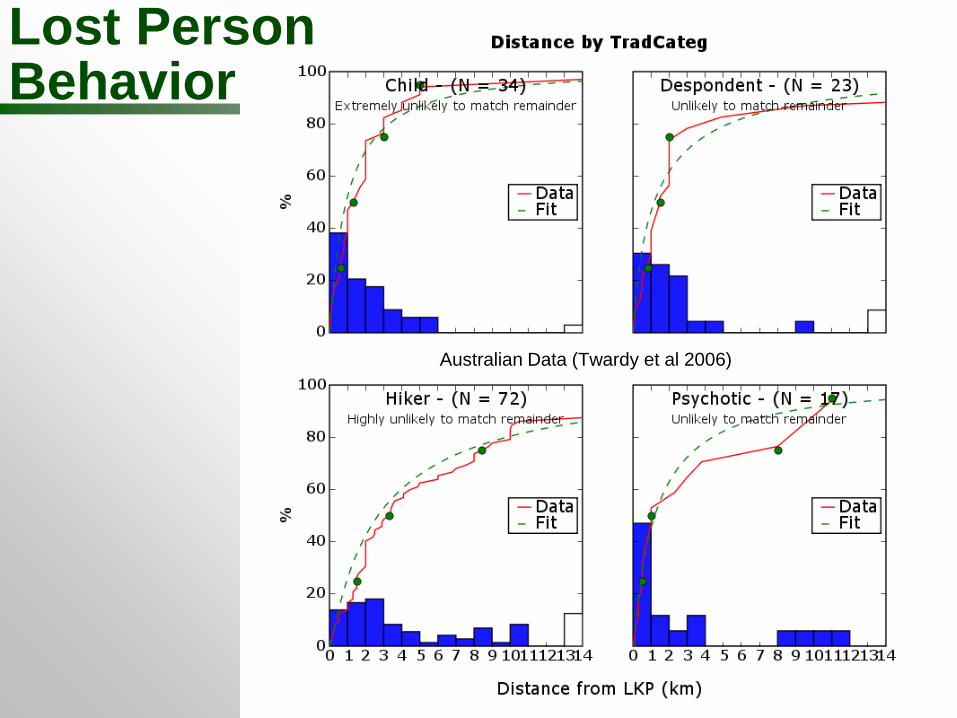
Lost Person Behavior
Australian Data (Twardy et al 2006)
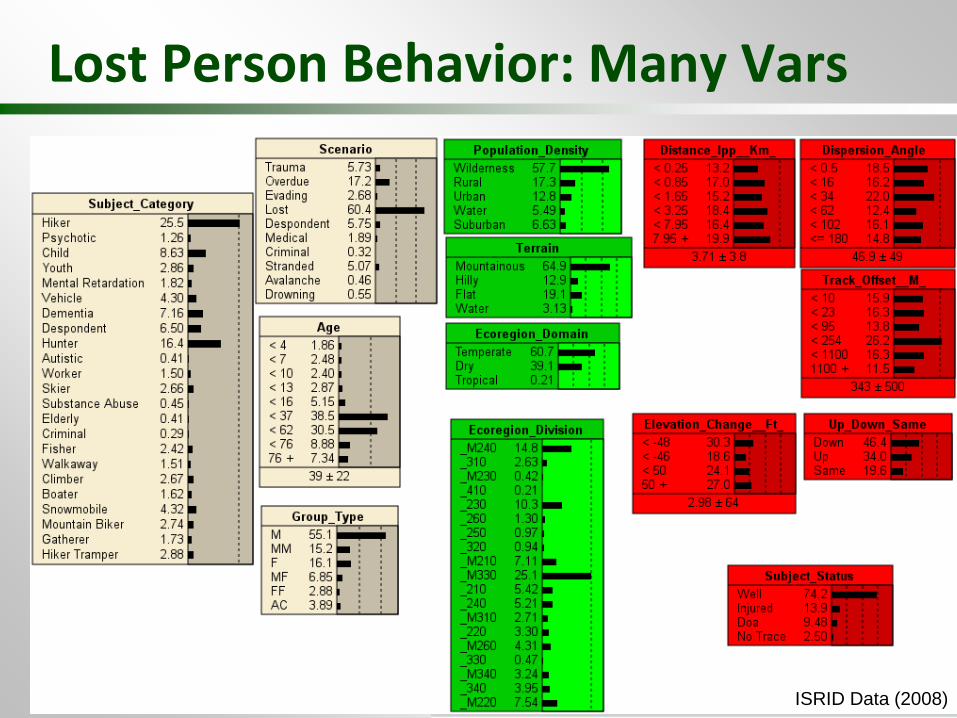
Lost Person Behavior: Many Vars
ISRID Data (2008)
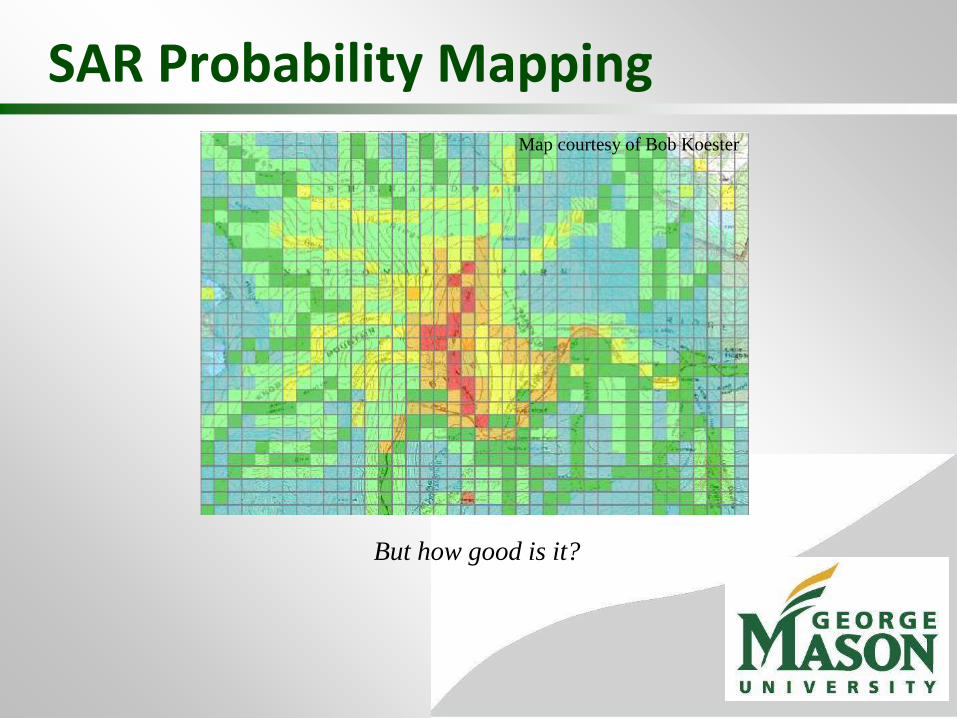
SAR Probability Mapping
But how good is it?
Map courtesy of Bob Koester
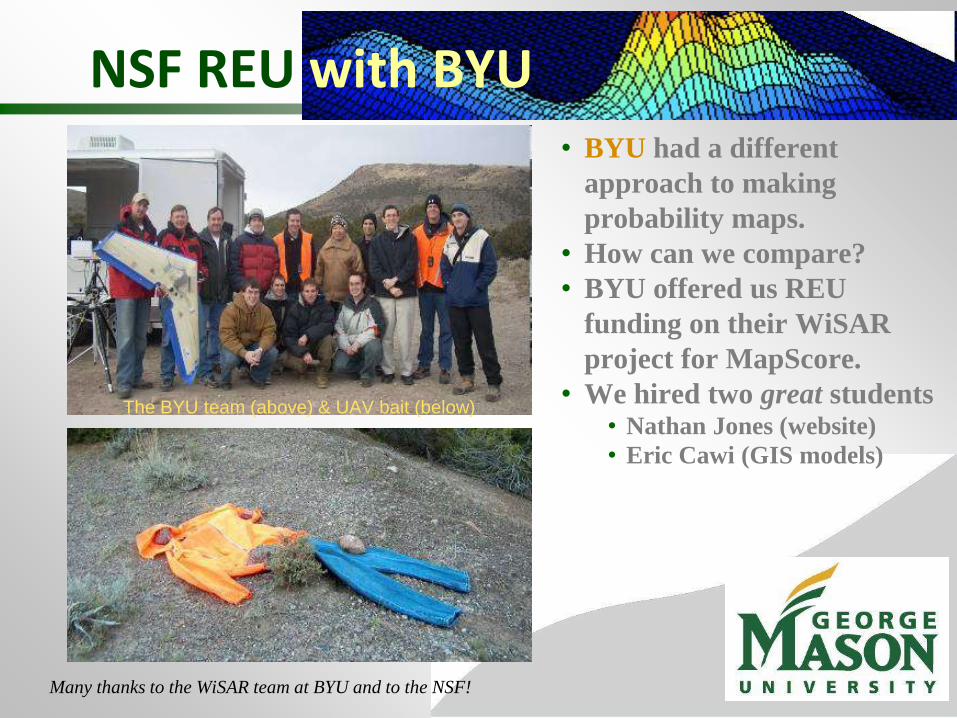
NSF REU with BYU • BYU had a different
approach to making
probability maps.
• How can we compare?
• BYU offered us REU
funding on their WiSAR
project for MapScore.
• We hired two great students • Nathan Jones (website)
• Eric Cawi (GIS models)
Many thanks to the WiSAR team at BYU and to the NSF!
The BYU team (above) & UAV bait (below)
MapScore Functional Goals
• Provide researchers with an environment
to test probability maps based on actual
lost person scenarios.
• Establish competition among research
groups to create the most accurate
models.
Agenda
• Introduction / Context
• Website Walkthrough
• ESRI models using Koester’s stats
• Tabletop Exercise
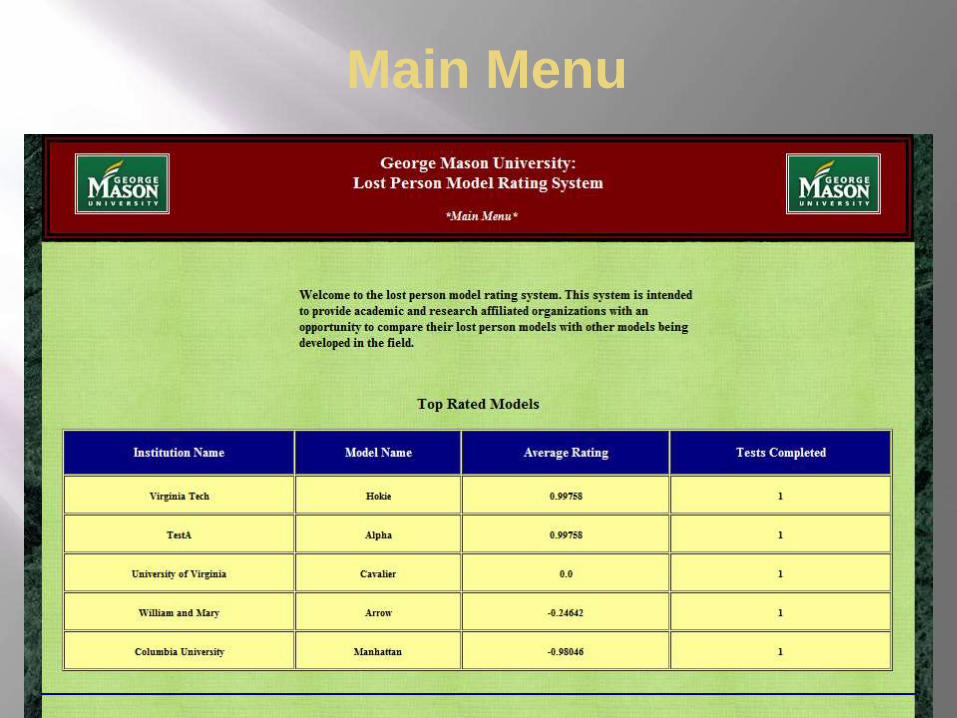
Main Menu

Account Menu
Nathan Jones, MapScore Webslinger

Account Menu
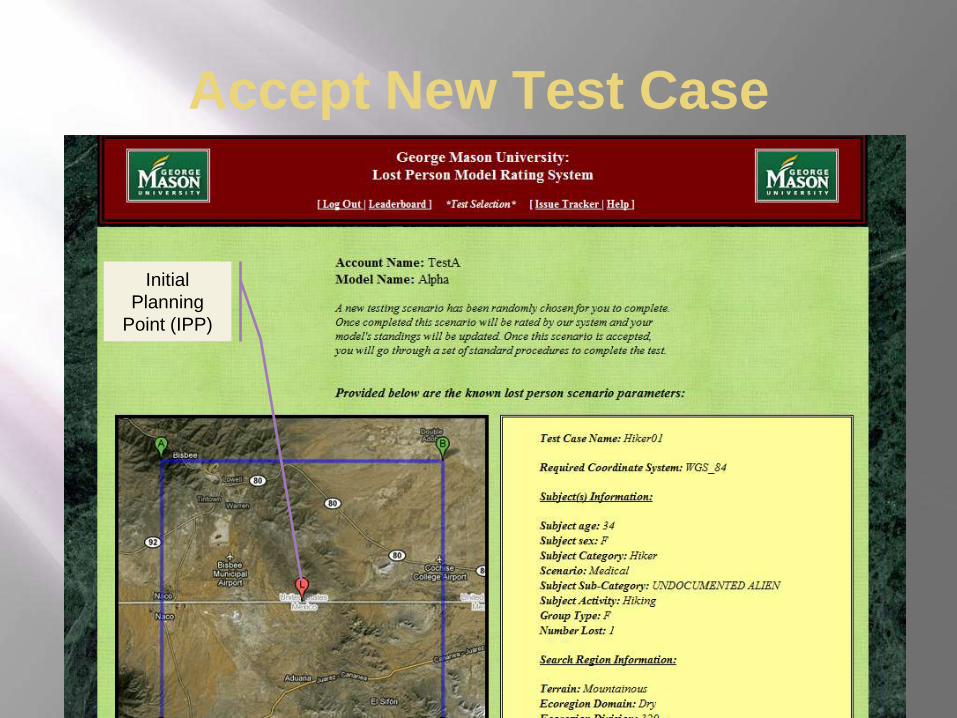
Accept New Test Case
Initial
Planning
Point (IPP)
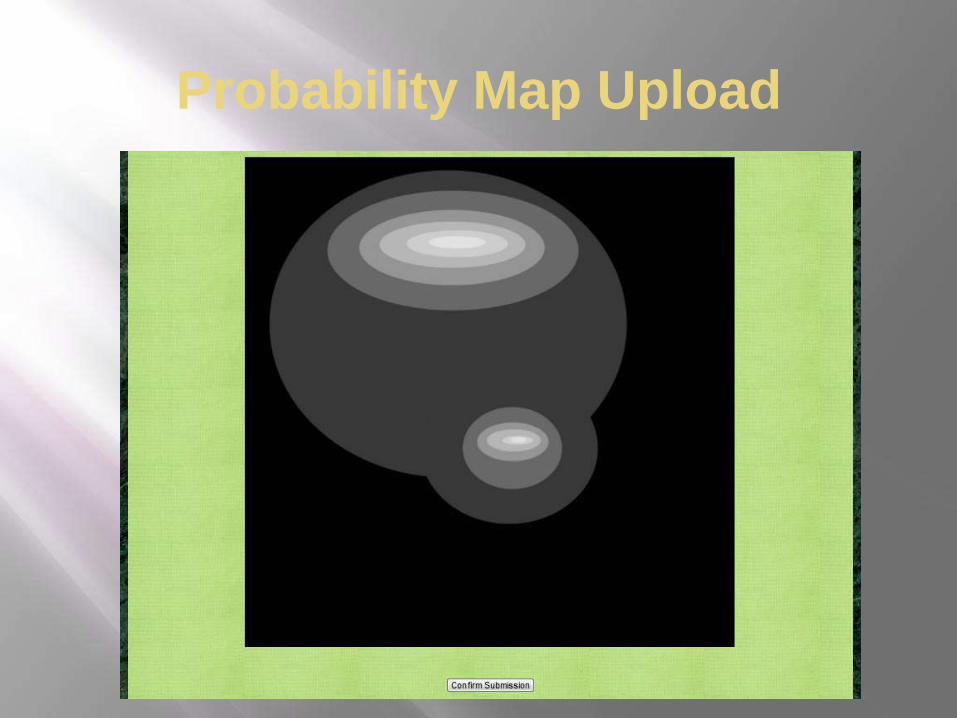
Probability Map Upload
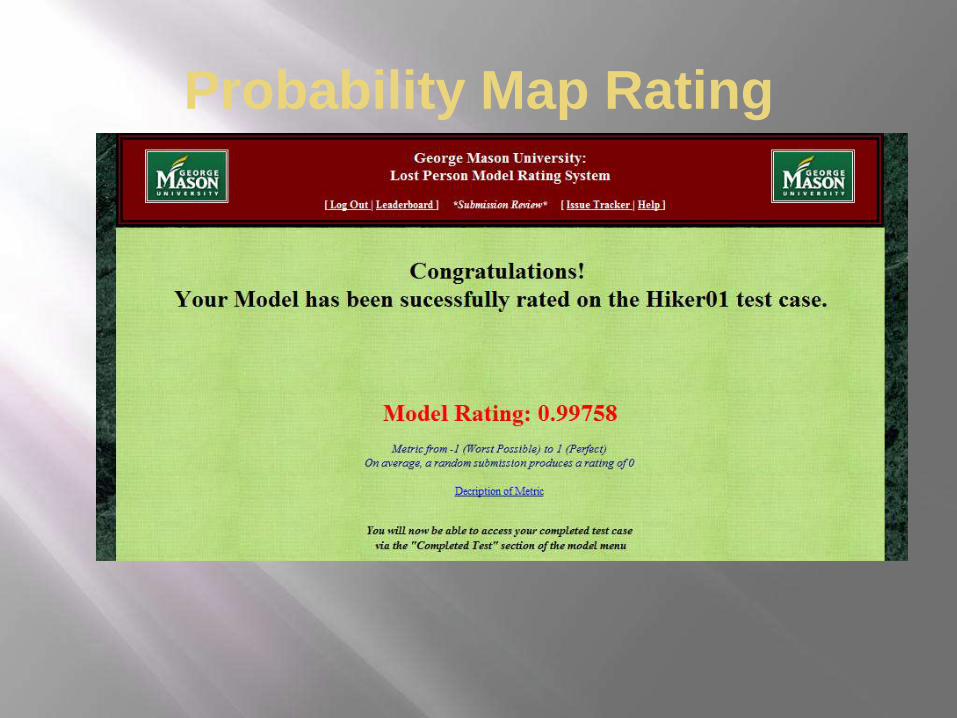
Probability Map Rating
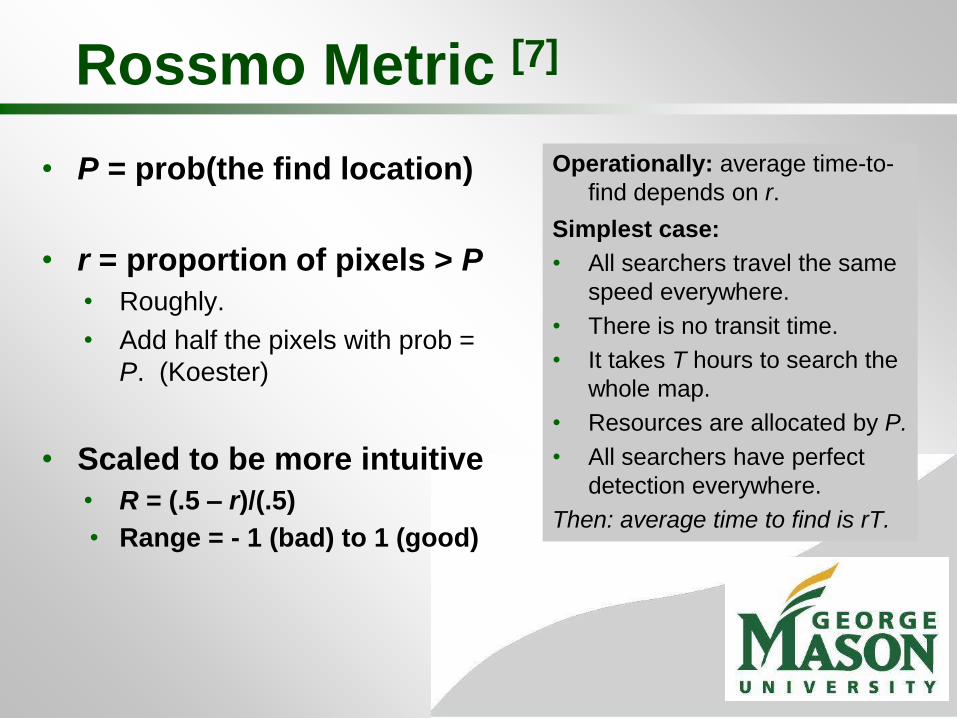
Rossmo Metric [7]
• P = prob(the find location)
• r = proportion of pixels > P
• Roughly.
• Add half the pixels with prob =
P. (Koester)
• Scaled to be more intuitive
• R = (.5 – r)/(.5)
• Range = - 1 (bad) to 1 (good)
Operationally: average time-to-
find depends on r.
Simplest case:
• All searchers travel the same
speed everywhere.
• There is no transit time.
• It takes T hours to search the
whole map.
• Resources are allocated by P.
• All searchers have perfect
detection everywhere.
Then: average time to find is rT.
Agenda
• Introduction / Context
• Website Walkthrough
• ESRI models using Koester’s stats
• Tabletop Exercise
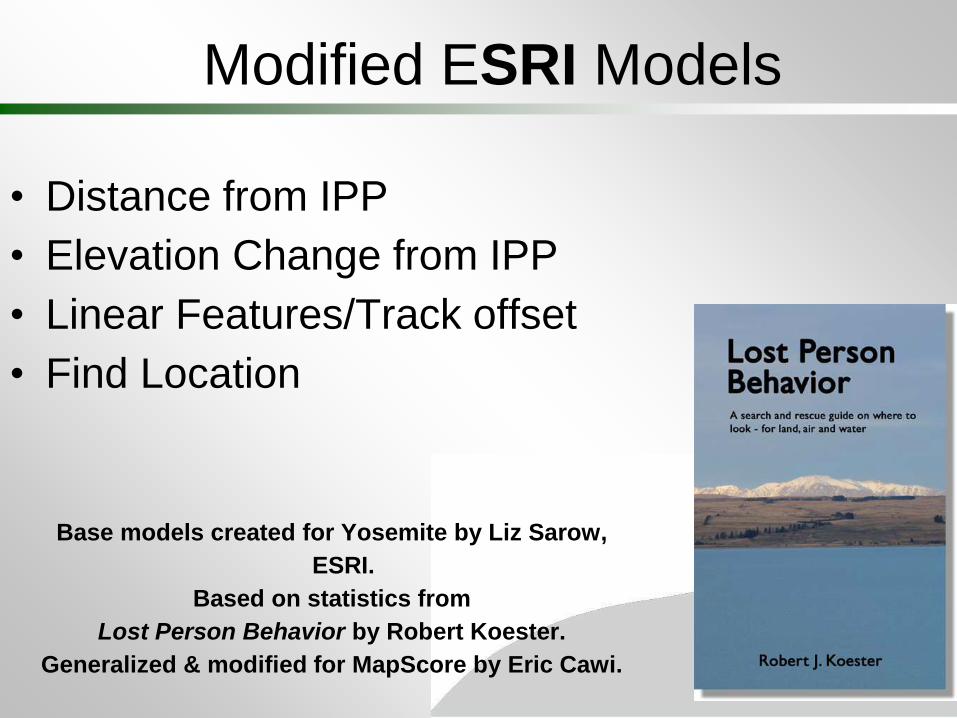
Modified ESRI Models
• Distance from IPP
• Elevation Change from IPP
• Linear Features/Track offset
• Find Location
Base models created for Yosemite by Liz Sarow,
ESRI.
Based on statistics from
Lost Person Behavior by Robert Koester.
Generalized & modified for MapScore by Eric Cawi.
Distance
• Creates a 4 level buffer ring with 25, 50,
75, and 95 percent rings
• Calculates probability per cell based on
the area of each ring.
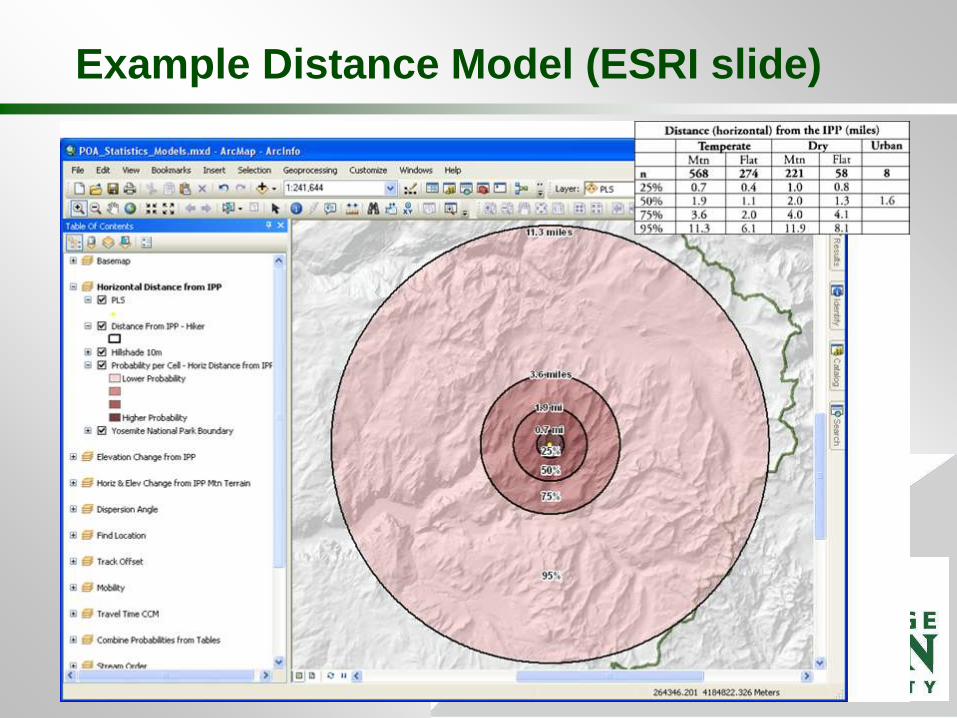
Example Distance Model (ESRI slide)
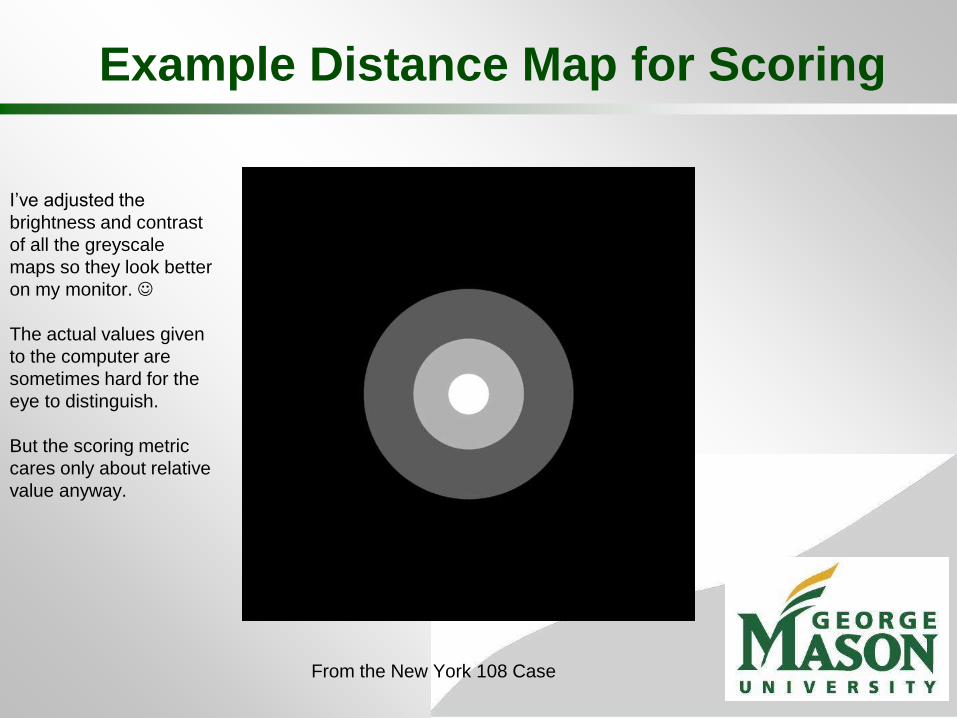
Example Distance Map for Scoring
From the New York 108 Case
I’ve adjusted the
brightness and contrast
of all the greyscale
maps so they look better
on my monitor.
The actual values given
to the computer are
sometimes hard for the
eye to distinguish.
But the scoring metric
cares only about relative
value anyway.
Elevation
• Calculates the elevation change from the last
known point for every cell
• The “downhill”, “uphill”, and the “same”
elevation cells are assigned different
probabilities
• The hiker model calculates probability per cell
based on both distance from LKP and
elevation change.
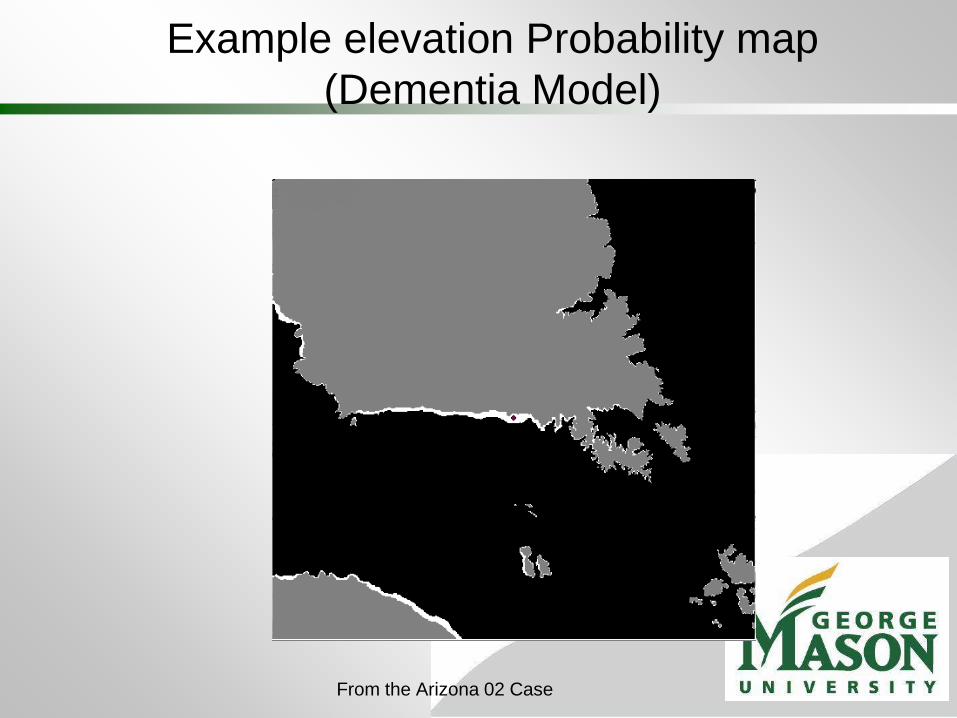
Example elevation Probability map
(Dementia Model)
From the Arizona 02 Case

Example Elevation Probability Map
(Hiker Model)
From the New York 108 Case
Linear Features/Track Offset
• Linear features used: roads and rivers,
trails (when available)
• Calculates distance from linear features
and classifies based on probability areas
• Calculates probability per cell based on
area of each ring
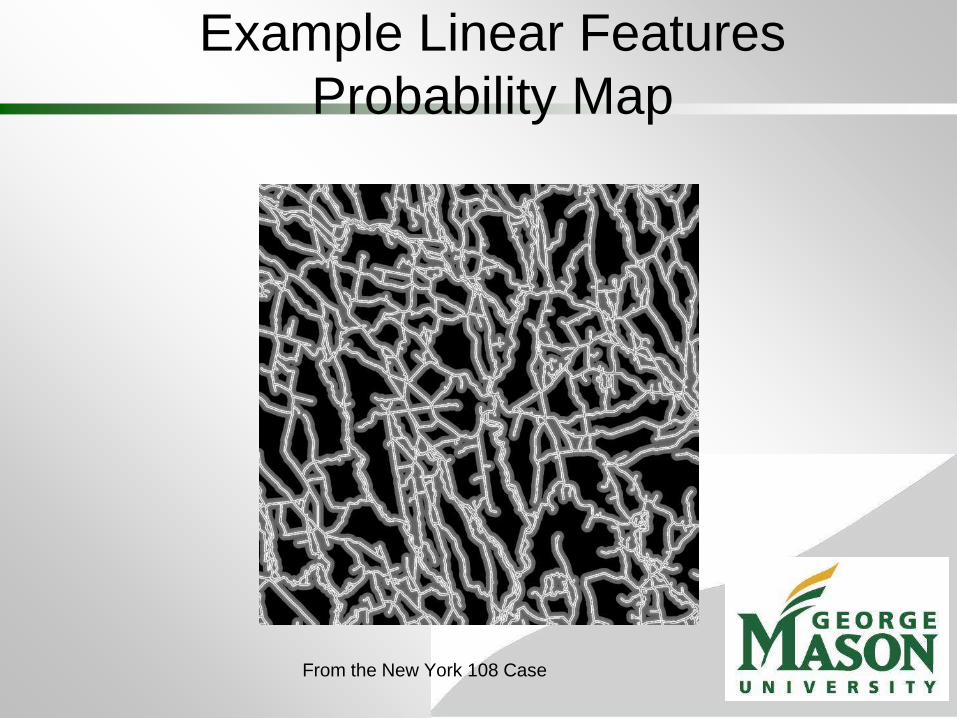
Example Linear Features
Probability Map
From the New York 108 Case
Land Classification/Find
Location
• Assigns different probabilities to different
types of land cover
• e.g. forests, rivers, meadows, etc.
• Calculates probability per cell based on
area of each classification
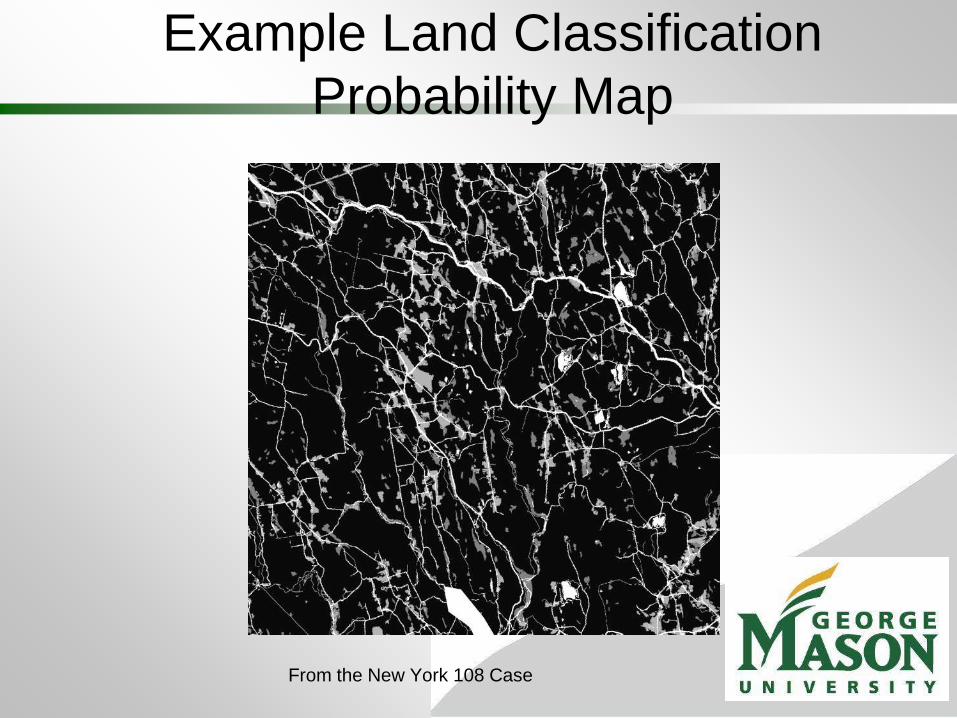
Example Land Classification
Probability Map
From the New York 108 Case
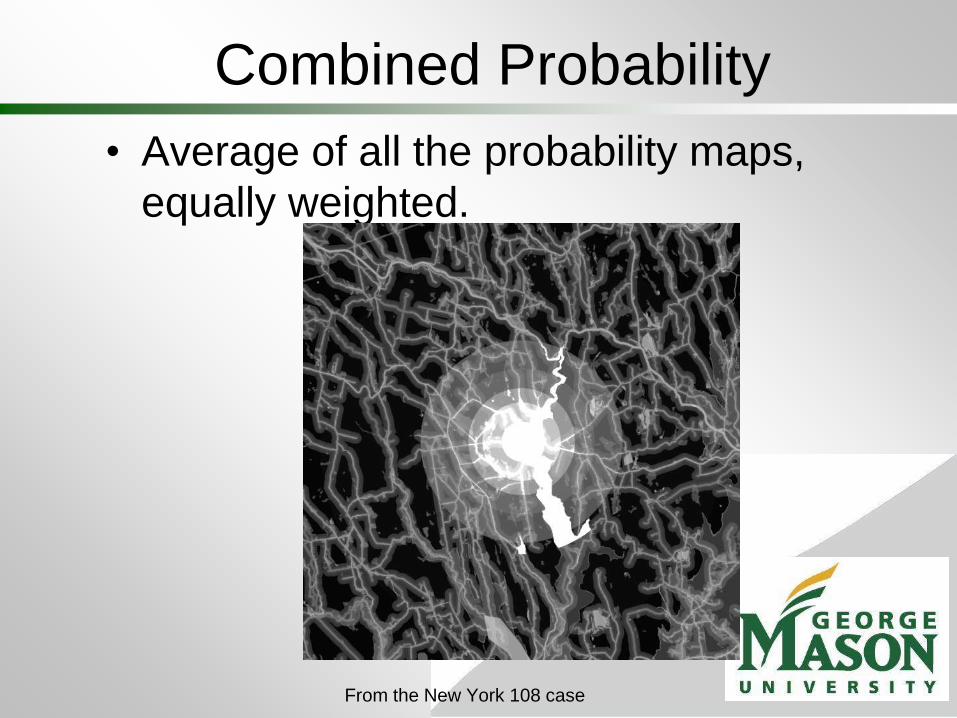
Combined Probability
• Average of all the probability maps,
equally weighted.
From the New York 108 case
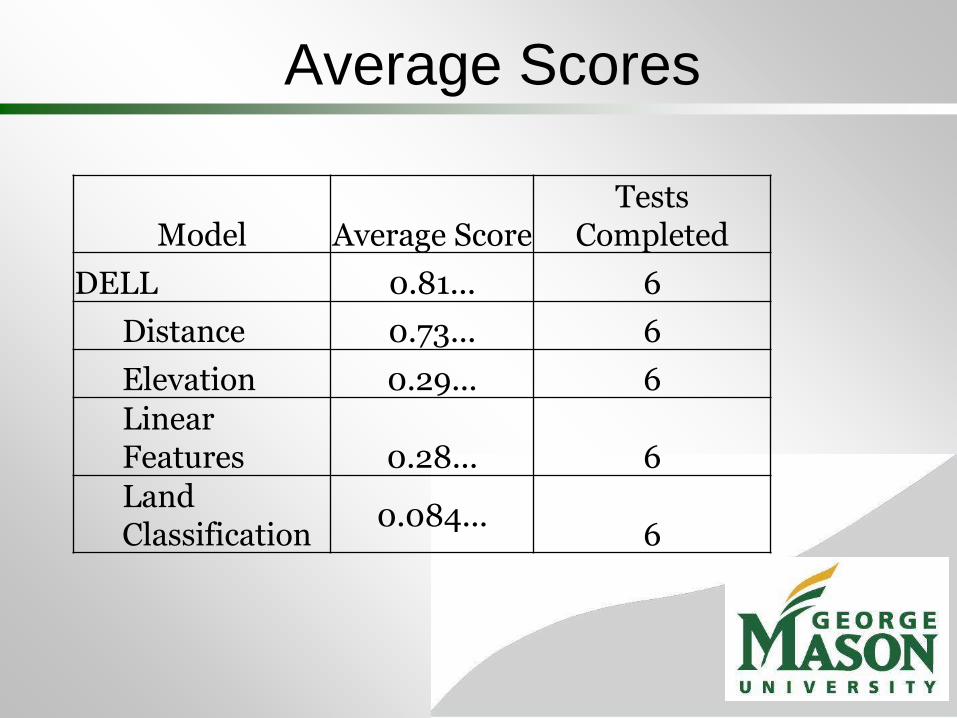
Average Scores
Model Average Score Tests
Completed
DELL 0.81... 6
Distance 0.73... 6
Elevation 0.29... 6
Linear Features 0.28... 6
Land Classification
0.084... 6
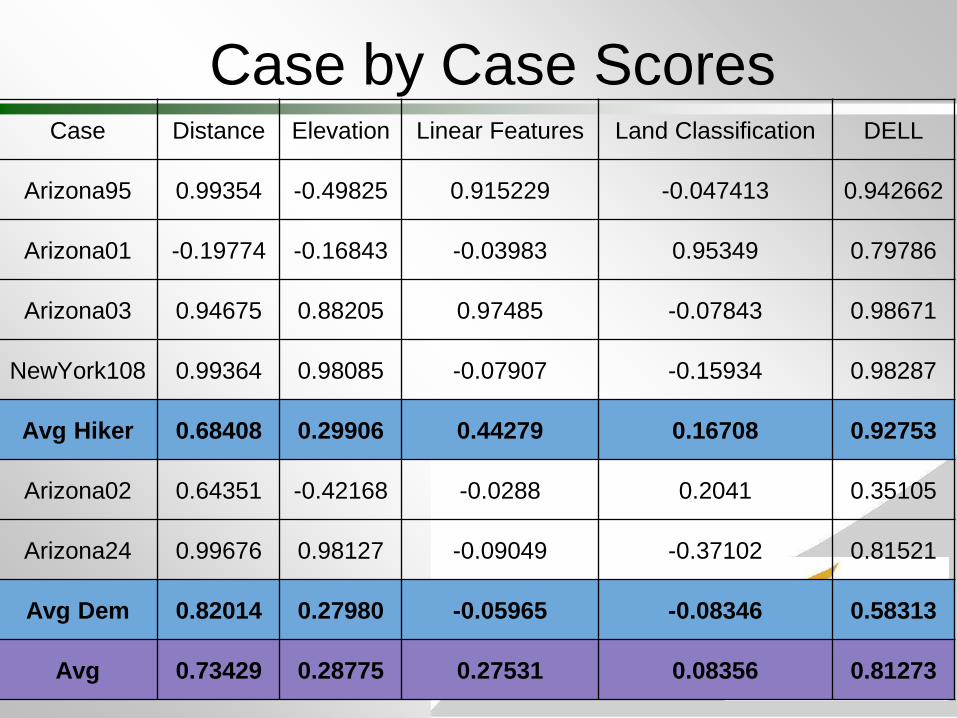
Case by Case Scores Case Distance Elevation Linear Features Land Classification DELL
Arizona95 0.99354 -0.49825 0.915229 -0.047413 0.942662
Arizona01 -0.19774 -0.16843 -0.03983 0.95349 0.79786
Arizona03 0.94675 0.88205 0.97485 -0.07843 0.98671
NewYork108 0.99364 0.98085 -0.07907 -0.15934 0.98287
Avg Hiker 0.68408 0.29906 0.44279 0.16708 0.92753
Arizona02 0.64351 -0.42168 -0.0288 0.2041 0.35105
Arizona24 0.99676 0.98127 -0.09049 -0.37102 0.81521
Avg Dem 0.82014 0.27980 -0.05965 -0.08346 0.58313
Avg 0.73429 0.28775 0.27531 0.08356 0.81273
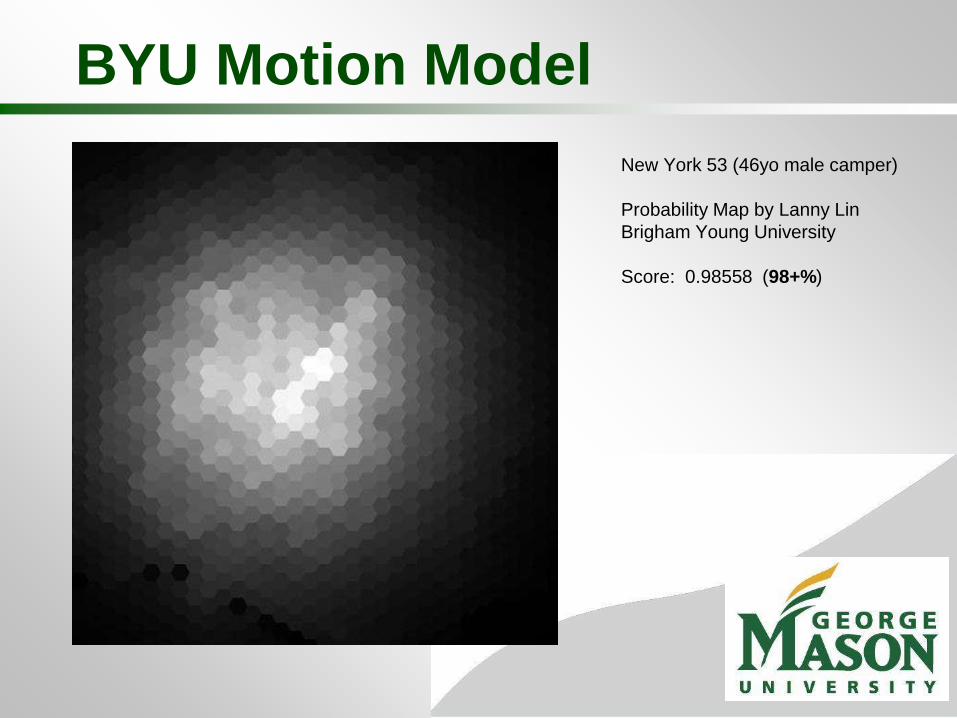
BYU Motion Model
New York 53 (46yo male camper)
Probability Map by Lanny Lin
Brigham Young University
Score: 0.98558 (98+%)

So far
• On average, combining the models does
better than any of our individual models
• Distance is the most accurate of our
individual models.
• The BYU motion model did well so far.
:-)
Agenda
• Introduction / Context
• Website Walkthrough
• ESRI models using Koester’s stats
• Tabletop Exercise
Mt. Rogers Tabletop Exercise
• The search area has been divided
into segments
• Estimate the probability for each
segment. Two rounds:
o "Anonymous" estimates
recorded, averaged, and
displayed.
o Discussion.
o 2nd round of anonymous
estimates.
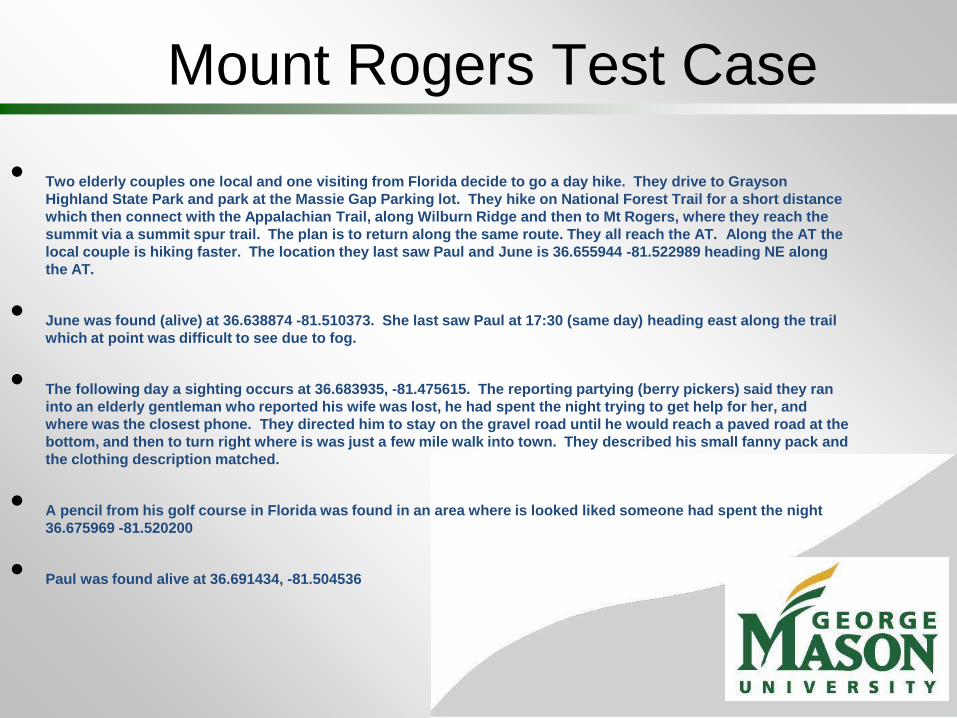
Mount Rogers Test Case
• Two elderly couples one local and one visiting from Florida decide to go a day hike. They drive to Grayson
Highland State Park and park at the Massie Gap Parking lot. They hike on National Forest Trail for a short distance
which then connect with the Appalachian Trail, along Wilburn Ridge and then to Mt Rogers, where they reach the
summit via a summit spur trail. The plan is to return along the same route. They all reach the AT. Along the AT the
local couple is hiking faster. The location they last saw Paul and June is 36.655944 -81.522989 heading NE along
the AT.
• June was found (alive) at 36.638874 -81.510373. She last saw Paul at 17:30 (same day) heading east along the trail
which at point was difficult to see due to fog.
• The following day a sighting occurs at 36.683935, -81.475615. The reporting partying (berry pickers) said they ran
into an elderly gentleman who reported his wife was lost, he had spent the night trying to get help for her, and
where was the closest phone. They directed him to stay on the gravel road until he would reach a paved road at the
bottom, and then to turn right where is was just a few mile walk into town. They described his small fanny pack and
the clothing description matched.
• A pencil from his golf course in Florida was found in an area where is looked liked someone had spent the night
36.675969 -81.520200
• Paul was found alive at 36.691434, -81.504536

DELL probability Map (1st IPP)
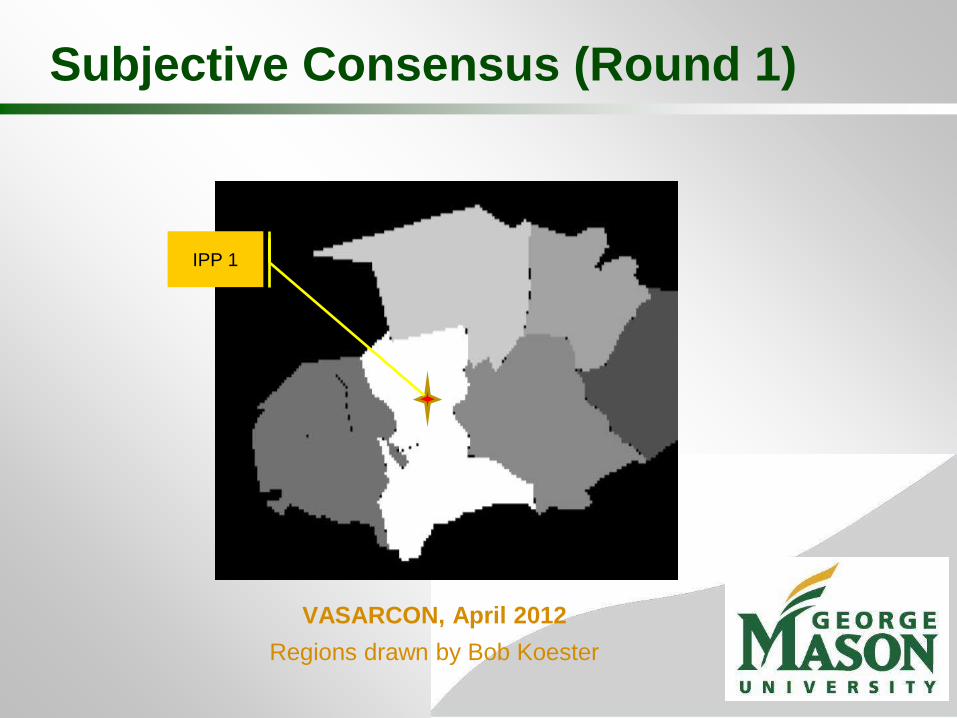
Subjective Consensus (Round 1)
VASARCON, April 2012
Regions drawn by Bob Koester
IPP 1
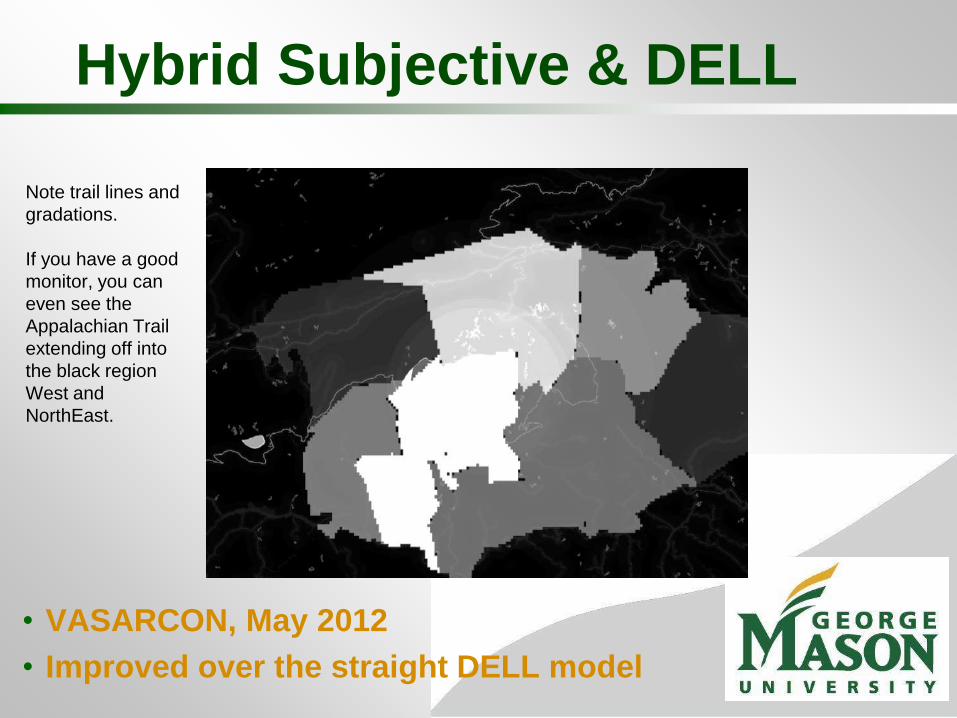
Hybrid Subjective & DELL
• VASARCON, May 2012
• Improved over the straight DELL model
Note trail lines and
gradations.
If you have a good
monitor, you can
even see the
Appalachian Trail
extending off into
the black region
West and
NorthEast.
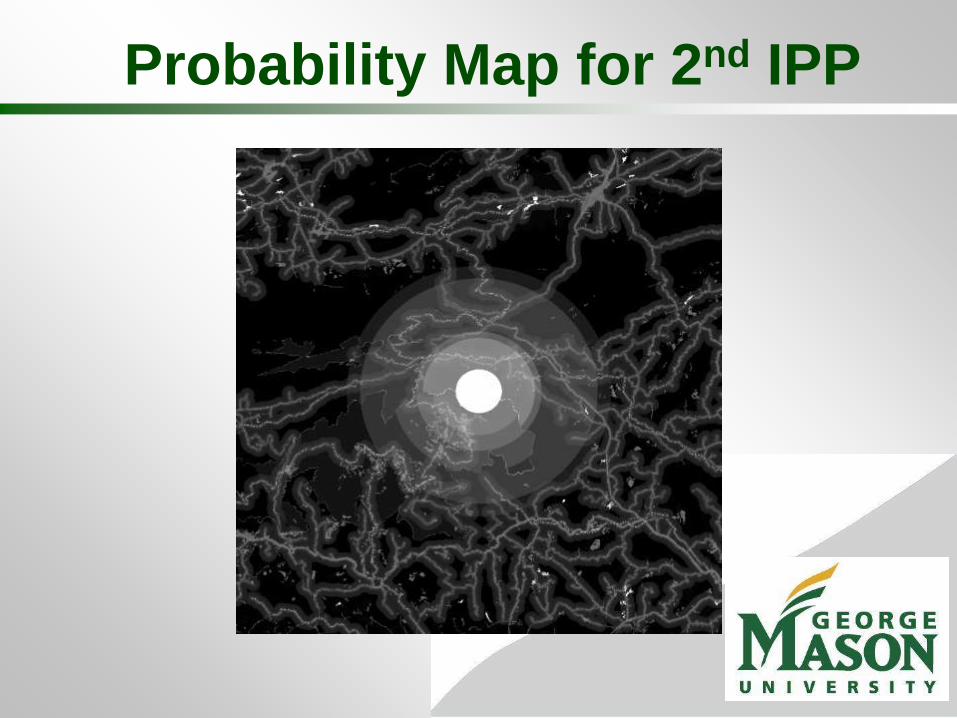
Probability Map for 2nd IPP
Future Work
• Providing GIS Layers for test cases.
• Run more test cases.
• Automated baseline models.
• Scripting support.
Citations
[1] http://www.nationalparkstraveler.com/2010/08/search-and-rescue-ops-cost-national-
park-service-48-million-20086495
[2] http://www.odt.co.nz/news/national/38500/search-and-rescue-operations-cost-
400000?page=0%2C1
[3] http://faculty.cs.byu.edu/~mike/mikeg/papers/LinGoodrichIROS2009.pdf
[4] Robert J. Koester 2008. Lost Person Behavior
[5] Elizabeth Sarow 2011. Determining Probability of Area for Search and Rescue
using Spatial Analysis in ArcGIS 10. ESRI slides.
[6] Proportional Consensus spreadsheet. http://www.sarblog.info/proportional-
consensus-method/.
[7] Rossmo, D. K. (1999). Geographic Profiling (1st ed.). CRC Press.
SARBayes: http://sarbayes.org
MapScore: http://mapscore.sarbayes.org
BYU WiSAR: https://facwiki.cs.byu.edu/WiSAR/index.php/Main_Page
Further Reading
• Some cool BYU articles
• L. Lin and M. A. Goodrich. A Bayesian Approach to Modeling Lost Person Behaviors
Based on Terrain Features in Wilderness Search and Rescue. To appear in
Computational and Mathematical Organization Theory.
• M. A. Goodrich, B. S. Morse, C. Engh, J. L. Cooper, and J. A. Adams. Towards using
Unmanned Aerial Vehicles (UAVs) in Wilderness Search and Rescue: Lessons from
field trials. Interaction Studies , 10(3), pp455-481, 2009. Copy available on request.
• M. A. Goodrich, B. S. Morse, Damon Gerhardt, J. L. Cooper, M. Quigley, J. A. Adams,
and C. Humphrey. Supporting Wilderness Search and Rescue using a Camera-
Equipped Mini UAV. Journal of Field Robotics, 25 (1-2), pp89-110, 2008. The paper is
available for free from Wiley InterScience.
• L. Lin and M. A. Goodrich. A Bayesian Approach to Modeling Lost Person Behaviors
Based on Terrain Features in Wilderness Search and Rescue. Proceedings of the 18th
Conference on Behavior Representation in Modeling and Simulation. Sundance, UT,
USA. March 31-April 2, 2009. pp. 49-56.