Embed Size (px)
Citation preview
GEOLOGICAL SURVEY CIRCULAR 724
In Search of a Statistical Probability Model
for Petroleum-Resource Assessment


In Search of a Statistical Probability Mo':lel
for Petroleum-Resource Assessme.nt
By Bernardo F. Grossling
GEOLOGICAL SURVEY
A critique of the probabilistic significance of certain concepts and methods used in petroleum-resource assessment. To that end, a probabilistic model is sketched
1975
C I R C U l A R 724

United States Department of the Interior STAN,LEY K. HATHAWAY, Secretary
Geological Survey V. E. McKelvey, Director
Library of Congress catalog-card No. 75-600065
free on application fo the U.S. Geological Survey, National Center, Reston, Va. 22092

CONTEN'DS
Page
Definition of symbols ----------------------------------------------------- III
Abstract ---------------------------------------------------------------- 1 Introduction ------------------------------------------------------------- 1 Concepts and premises --------------------------------------------------- 4
Fundamental concepts of resources and reserves ------------------------- 4 Assessment of the petroleum-resource base ------------------------------ 6 Objective and bias in resource assessment -------------------------------- 9
Problems with historical projection models ---------------------------------- 11 Linear "drilling input-petroleum output" model -------------------------- 11 Drilling finding rate ------------------------------------------------- 14 Economic role of the finding rate --------------------------------------- 15 Note on the logistic method of projection -------------------------------- 15 Note on random search ----------------------------------------------- 16
Sketch of a probabilistic model of petroleum-resource assessment -------------- 17 References cited -------------------------------------------------------- 18
ILLUSTRATION
Page
FIGURE 1. Diagram showing span of the various resource and reserve terms
for oil ------------------------------------------------------ 5
TABLES
TABLE 1. 2.
Stages in petroleum-resource development -----------------------New oil in place added per foot of exploratory drilling -------------
SYMBOLS
Basic Resource and Reserve Quantities
B _____________ Resource base. EVRD _________ Cumulative production + R2 OIP ___________ Initial oil in place. p ______________ Probability of discovery of a resource element. pd _____________ Probability of locating a resource element. Pe _____________ Probability of existence of a resource element.. R ______________ Recoverable resource amount Rt _____________ Proven reserves. R2 _____________ Expanded proven reserves. R3 _____________ Undiscovered recoverable resources. III
Page
9 15
Statistical Quantities
f(z) ___________ Probability function. L ___________ · __ Lower bound. p(x~O) ________ Probability that x~O. q ______________ Marginal risk. W ____________ Upper bound.
x --------------Variate.
Quantities in Production Forecasting Model
Dn _____________ Exploratory drilling footage during yearn. e _____________ _ReVision to prior computations of t::,.R', t::,.R", and t::,.R"'. f ______________ Fraction of the current reserves to be produced each year. >.. ______________ Lead time in years.
m _____________ Finding rate in barrels of oil or thousand cubic feet of gas per eJ~-
ploratory foot drilled. ILl _____________ Primary recovery factor. P.2 _____________ Secondary recovery factor.
/La -------------Tertiary recovery factor. Pn _____________ Production in yearn. Rn ____________ Recoverable proven reserve at end of yearn. t::,.Rn ___________ Increment of recoverable proven reserve established during yearn. t::,.R'n __________ Revisions and extensions of earlier primary proven reserves in year n. !::,. R" n __________ Actual increment to secondary proven reserves in year n. t::,.R"'n _________ Actual increment to tertiary proven reserves in yearn.
Quantities in Financial Model
a ______________ Ad valorem tax. {3 ______________ Royalty rate.
t::,.Pn ( r) _______ Annual production for year r of ann-project. Ea _____________ Expensed items.
Eb -------------Tax credits. ET _____________ Cash expenditures in year r.
Eo _____________ Initial cash expenditures. F ______________ Present value of discounted cash flows. 'Y ______________ Corporation tax rate. mo _____________ Initial finding rate. 7J ______________ Effective depletion as a fraction of the net revenue. p ______________ Unit price of oil or gas. Q ______________ Cumulative exploratory drilling. Q1 _____________ Cutoff of cumulative exploratory drilling. r ______________ Annual discount rate.
S ______________ Cumulative supply of oil or gas. Sn _____________ Oil or gas supply in yearn. T1 _____________ Production decay constant.
r --------------Time counted from initial year of n-project. o ______________ Depreciation for year r.
U _____________ Unit price expectation.
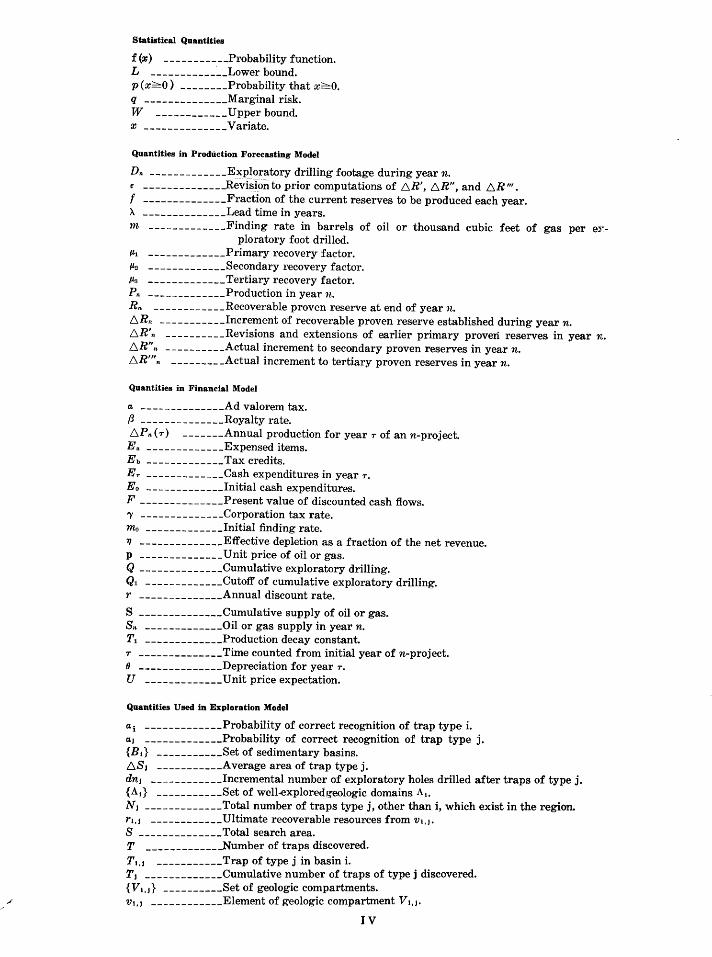
Quantities Used in Exploration Model
ai _____________ Probability of correct recognition of trap type i. a1 _____________ Probability of correct recognition of trap type j. {B.} ___________ Set of sedimentary basins. t::,.S1 ___________ Average area of trap type j. dn1 ____________ Incremental number of exploratory holes drilled after traps of type j. {At} ___________ Set of well..exploredgeologic domains At.
N 1 -------------Total number of traps type j, other than i, which exist in the region. rt,J ____________ Ultimate recoverable resources from Vt, 1•
S --------------Total search area. T ____________ _Number of traps discovered. T 1,1 ___________ Trap of type j in basin i. T1 _____________ Cumulative number of traps of type j discovered. {V1, 1} __________ Set of geologic compartments.
. .-· v1, 1 ____________ Element of geologic compartment Vt,J •
IV

In Search of a Statistical Probability Model for Petroleum-Resource Assessment
By Bernardo F. Grossling
ABSTRACT Exploratory drilling is !till in incipient or youthful
stages in those areas of the world where the bulk of the potential petroleum resources is yet to be discovered. Methods of assessing resources from projections based on historical production and reserve data are limited to mature areas. For most of the world's petroleum-prospective areas, a more speculative situation calls for a critical review of resource-assessment methodology. The language of mathematical statistics is required to define more rigorously the appraisal of petroleum resources.
Basically, two approaches have been used to appraise the amounts of undiscovered mineral resources in a geologic province: ( 1) projection models, which use statistical data on the past outcome of exploration and development in the province; and (2) estimation models of the overall resources of the province, which use certain known parameters of the province together with the outcome of exploration and development in analogous provinces. These two approaches often lead to widely different estimates. Some of the controversy that arises results from a confusion of the probabilistic significance of the quantities yielded by each of the two approaches. Also, inherent limitations of analytic projection modelssuch as those using the logistic and Gompertz functions -have often been ignored.
The resource-assessment problem should be recast in terms that provide for consideration of the probability of existence of the resource and of the probability of discovery of a deposit. Then the two above-mentioned models occupy the two ends of the probability range. The new approach accounts for (1) what can be expected with reasonably high certainty by mere projections of what has been accomplished in the past; (2) the inherent biases of decisionmakers and resource estimators; (8) upper bounds that can be set up as goals for exploration; and ( 4) the uncertainties in geologic conditions in a search for minerals. Actual outcomes can then be viewed as phenomena subject to statistical uncertainty and responsive to changes in economic and technologic factors.
INTRODUCTION
Petroleum at present provides the major energy for driving the economies of nations. The foreseen worldwide depletion of petroleum
1
resources in a few decades at a time of· transition to new energy technologies will impose hardships on many nations but will enhance the economic opportunities of those having a petroleum potential.
The petroleum-prospective areas of the world consist of sedimentary basins and ge.osynclines that ,are not too intensely deformed te.~tonically, including the continental shelves down to the 200-m depth--a total area under vr"'rious national jurisdictions of about 26.1 mill ion square miles. Certain oceanic areas beyond the continental shelves-the continental slop~ and continental rise-also have petroleum prospects, but their eventual development ma;r be some 10-20 years away.
Traditionally, the favorable geolog:~~ environment for petroleum has been consid~red to be the geosynclinal belt. Cratonic areas have been reluctantly accepted by many geolo~ists. The French first discovered the importart accumulations in Africa, actually in Algeria. in a cratonic area previously deemed inadoouat~ The occurrence of giant gas accumulations in1 ,the western Siberian platform also did some violence to some traditional views about areas in which petroleum should occur. Largn tracts of cratonic areas now believed to be c0vered by not-too-thick sedimentary columns ought to be considered another frontier in petroleum geology. The continental margins--'Shelf, slope, and rise-are yet another petroleum frontier.
The major areas that should be considered for petroleum exploration appear t'"' have already been outlined in the world, yet appraisals of the extent of these areas are cautious and often underestimate what subsequert exploratory work reveals. For example, est.imates of the extent of the Great Artesian Basin of

Australia have been greatly increased in the course of just a decade. Similarly, I expect that the current picture of the extent of prospective areas in Africa and South America is also conservative.
The extent of prospective areas is very significant even though experience in many basins shows that only a small percentage of the total prospective area is probably actually underlain by commercial petroleum accumulations.
The larger the tract of undrilled prospective area, the greater are the chances that thick sedimentary pods may occur here and there. Even when a few scattered pieces of evidence may indicate a thin sedimentary cover, prospects for generation and primary migration of petroleum may be enhanced by the large size of a prospective area-as they are in prospective areas in the interior of Africa and in the Amazon basin. Of the total world petroleumprospective areas, the non-OPEC, noncommunist developing countries control 48 percent; the developed countries, excluding the USSR, 30.5 percent; the USSR, 13 percent; the Middle East, 4.6 percent; and China 3.5 percent.
Next to be considered, after the extent of sedimentary areas, should be the total sedimentary volume in each region. Information on this factor either is not readily available or has not been released as yet by companies or governments that have explored certain areas. Moreover, m,any other geologic factors should be considered in a realistic comprehensive 3.tssessment of the world's petroleum potential.
The examination of the distribution of petroleum occurrences throughout the world, in basins that have had a significant amount of exploratory drilling, indicates that roughly half
the prospective basins and geosynclines do not yield any or much petroleum; in tl'ose areas having petroleum deposits, the manner of distribution, size of deposits, and geok~ic conditions that control the petroleum accumulations vary greatly. The situation could be described as a two-stake sequential decision game played by Nature. First, it is decided, with probability roughly :lf2, whether a particular basin or province will contain commercial 3.tCcumnlations or not. In the .second stage is decided, ·with an underlying probability distribution, the magnitude of ·the petroleum resources of tra. basin or geosycline.
Before exploratory drilling, it would be difficult to ascertain which basins contain petroleum. Of the many prospective basins and geosynclines in developing countries, for example, roughly about half will prove disappointing and have minor petroleum accumulations or none at all. The uncertainty of the outcon1e at this stage is something that has to be accE:'~Jted; only actual exploratory work, including drilling, can resolve the question.
Another ,source of surprise C'an be the size of the petroleum accumulations. This is especially important because of the large contribution to petroleum resources of a relative}~~ few but very large fields. One can only speculate, before drilling, that certain geologic conditions may prevail in a given basin or geosyncline that could lead to large accumulatio:-ts.
Giant oil fields discovered so far F.re mainly concentrated in the Middle East, and giant gas fields, in the USSR. The number of rdants, per million square miles of prospective areas so far discovered, are :
Oil
Middle East ------------------------------- 45 G(I,IJ
3.3 11.8
7.9 .6
0
USSR --------------------------------------Conterminous United States ------------------Africa and Madagascar ---------------------Latin America -----------------------------South and Southeast Asia, mainland ---------
6 3.2 3.2 2 0 0
About two-thirds of all the past drilling in the world for petroleum took place in the United States. Most of the petroleum-prospective areas of the developing nations are gross-
ly underexplored. Estimates of the t.otal number of wells drilled per square mile cf prospective area in major regions are:
2

Wella'J}er aquat'emile
Contenninous United States --------------------------- 1.17 USSR ---------------------------------------------- .16 Argentina, Mexico, and Venezuela --------------------- .06 Middle East ----------------------------------------- .01 Latin America, except as mentioned above -------------- .01 South and Southeast Asia and Indonesia ---------------- .01 Africa and Madagascar ------------------------------ .003
About the same relative values are obtained if either the number of exploration wells or the total footage drilled are considered instead of the total number of wells.
The projected drilling density in the conterminous United States provides an upper bound for the desirable drilling density. In the early development of the U.S. petroleum industry, much unnecessary drilling took place. Even ·allowing for this factor, however, the drilling density would be roughly about 0.5 wells per square mile of prospective area. In the Middle East, drilling density is exceptionally low because of the giant dimensions of the fields, and
I it cannot be considered representative of desirable drilling density elsewhere. In the USSR, petroleum exploration is intense, but the exploration is f·ar from passing the midpoint in overall development.
For areas on the order of 1 million square miles or more, a desirable ultimate density of 0.3 wells per square mile of prospective area seems to be a reasonable target. Then the drilling density should eventually increase by a factor of about 100 in Africa and Madagascar and about 30 in South and Southeast Asia and also in Latin America, except for Argentina, Mexico, and Venezuela. Even in the last three countries, drilling density should eventually increase by a factor of about six.
The final exhaustion of worldwide petroleum resources can be foreseen to occur within a few decades. At the moment, the petroleum scene is dominated by one cartel. Looking beyond
Region
areas containing proven reserves, however, one finds a substantial amount of completely unexplored or insufficiently explorea lands successful development of which could wrest the control of the petroleum scene from the cartel.
Most of the prospective acreage available belongs to some developing nations. Tro. more important opportunities for petroleum development in developing countries that are not already playing a major role appear to be found in : Mexico, Colombia, Brazil. Peru, and Argentina in Latin America and Mali, Nig·er, Egypt, Mauritania, Chad, Tanzania, S01nalia, and Mozambique in Africa.
Vigorous exploration in many of the promising areas should result in the discovery of substantial amounts of petroleum, whicl' could ease the pressures for price escalation. However, whether the present petroleum seller's market will go away will depend on who C9ntrols the new petroleum provinces.
The recoverable petroleum that can be said with certainty to have been found so far in a given country is the sum of the cumul·ative production plus the proven reserves. M<'reover, the expected value in a statistical sense from discovered fields is somewhat larger. For this purpose, I have introduced the concept of EVRD (Expected Value of Recoverable Discoveries, as defined on p. 6.
For the major regions that may be considered, the EVRD per square mile of prospective area is:
Go.e (108 cu ft)
Middle East ------------------------------Contenninous United States ------------------
Oil (bbl)
496,000 101,600
610 656 453 207
USSR -------------------------------------Western Europe ---------------------------Africa and Madagascar ---------------------Latin America -----------------------------South and Southeast Asia, mainland -----------
3
49,600 27,000 30,700 24,200
2,600
92 52 60

The amount of petroleum initially in the ground in a given country or region and considered to be recoverable within foreseen technological and economic limits is the Estimated Ultimate Recovery (EUR) of that country or region.
By considering certain best explored areas, excluding the Middle East, as benchmarks, I have selected the following average figures for the total EUR from continental-size regions: 100,000 to 250,000 barrels of oil and 500 million to 1.300 million cubic feet of gas per square mile of prospective area. The above figures do not include the eventual occurrence of Middle East-size accumulations.
The above figures provide another upperbound estimate for the world's EUR, namely
2,600 billion to 6,500 billion barrels of oil, and
13,000 trillion to 34,000 trillion cubic feet of gas.
In addition, some further allowance should be m·ade for the eventual occurrence of clusters of giant accumulations, as in the Middle East. The extended reserves of the Middle East are 595 billion barrels of oil and 612 trillion cubic feet of gas. The Middle East EUR's are probably, at most, equal to a few times these amounts; that is, less than an order of magnitude larger.
Several petroleum companies are known to have pursued the seareh for "another Middle East." A consideration of the broad tectonic framework of various Earth regions suggests certain likely places. Some of the places that I would choose are : the north slope of the USSR, the north slope of Canada, the Gulf of Mexico, the Argentine Continental Shelf, the shelf between Mozambique and Malagasy, and the shelf between Australia and New Guinea. Of these six possibilities, four are in or near developing regions, namely: the Gulf of Mexico, the Argentine Continental Shelf, the shelf between Mozambique and Madagascar. and the shelf between Australia and New Guinea.
I propose the following upper-bound EUR's for Latin America :
490 billion to 1,225 billion barrels of oil, and
2,450 trillion to 6,370 trillion cubic feet of gas;
4
for Africa and Madagascar: 470 billion to 1,200 billion l'qrrels of
oil, and 2,400 trillion to 6,100 trillion cubic
feet of gas; and for South and Southeast Asia:
130 billion to 325 billion l'~.rrels of oil, and
650 trillion to 1,700 trillion cubic fMtof gas.
Because of the very limited petroleurr development in these prospective lands, the b,dk of the above EUR's still remains in the gro,:tnd to be discovered. •
The above remarks show that there probably are large potential petroleum resour~es to be sought in the world. For most areas, rlrilling is only beginning. Methods of foreca~ting resources from projections based on historical production and reserve data (for instance, by using Gompertz and logistic functi4lns) are limited to mature areas ·such as the conterminous United States and the Maraeaih<J basin· in Venezuela. For the overwhelming mt'.iority of the world's petroleum-prospective s.Teas, we have a more speculative situation w~:\ich calls for a critical review of · resource-aASeSSment methodology.
The estimates of dimensions of pr'lSpective areas and of upper-bound EUR's in this "Introduction" have been taken from unpublished data that I submitted to the International Bank for Reconstruction and Development, Washington, D.C.; they provide an indicatk"'l of the size of the exploratory tasks ahead an ci provide an estimate of the maximum amounts of oil and gas which would be obtained if the most favorable conditions prevail.
CONCEPTS AND PREMISEf
FUNDAMENTAL CONCEPTS OF RESOURCES AND RESERVES
The span of the various resource ard reserve terms for oil are shown in figure 1. The situation for gas is similar.
First we have the initial Oil In Plar~ (OIP) , that is, the amount prior to any exploitation that is to be found in undiscovered and discovered fields. Obviously, the OIP is difficult to estimate. As for the undiscovered (unknown) fields, an estimate has to be made on the basis

Initial Oil In Place
(OIP) Recoverable oil
Estimated Ultimate Recovery
(EUR)
Expected Value of Recoverable
Discoveries (EVRD)
Undiscovered recoverable oil
( R 3)
t
Expanded proven reserves
( R 2)
FIGURE 1.-Span of the various resource and reserve terms for oil.
5
f Cumulative production
Proven res~rves
( R 1)
J

of the discovered (known) fields in relation to the geologic setting. This estimate would not be too difficult to make if the unknown fields belong to the same geologic groups as the known fields or if both known and unknown fields belong to a well-defined statistical population. Actual exploration, however, shows that often a certain discovery alters the concept of the petroleum accumulations to be found in a given area. Projections from an old model can thus become obsolete. This logic·al difficulty is hard to overcome. Perhaps the best we can hope for with respect to the OIP value is to establish lower bounds for it and to raise the lower bound whenever wider knowledge about the petroleum geology of a region being considered justifies it.
Second comes the concept of recoverable resources; that i.s, the amount of oil that can be recovered, within technological and economic limits, from both undiscovered and discovered fields-often denoted as the Estimated Ultimate Recoyery (EUR). The relative amount of oil that is recoverable varies greatly and has not been well established on a worldwide basis. As a result of modern production practiceS, primary and secondary methods have become well integrated, and a sharp distinction between them is not justifiable. At the moment, 40 percent probably represents a realistic target figure for these two integrated phases of recovery. How much oil .still remains in the ground, even after the best production practices, is not really known. Perhaps the actual recovery can be as high as 80 percent. Economic limits constitute another factor that conditions the estimation of the amount of recoverable resources. These limits will change with time, so a forecast of the recoverable resources should vary with the time span of the forecast.
Third comes the concept of cumulative past production, that is, the total oil that has been produced from the discovered fields. This is the figure that can be ascertained most readily.
Fourth comes the concept of proven reserves R1. Proven reserves, designated here as R1, are defined as the amounts of petroleum that can be considered certain to be producible from explored acreage within present economic and technological limits. To convey a qualitative sense to the above definition, I woulP. say that
6
in known fields, the amounts of petrol~mm that can be obtained with certainty, say with a higher than 90 percent probability, ~n be estimated within +25 percent or so. The main uncertainty in this estimation process would be covered by the ,span of the error ( +25 percent). The increments of oil to be expected from known fields would fall off rapidly b~low a 90 percent probability. Essentially then, we would have a rather narrow estimation distribution function for the proved reserves-the estimation of the magnitude of a quantity that is known to exist.
Fifth comes the concept of expanded proven reserves R2, which represents the expected amounts, in a statistical sense, of oil from revisions and extensions of discovered fields. We deal here with a different kind of uncertaintythe speculation that some petroleum may exist beyond the known parts of fields ·and as extensions of them. For most countries, t1' e following generalization can be made : An additional quantity equal to the proven reserves can be obtained with probability of 80 percent, and another equal additional quantity, with probability of 50 percent. Hence, the expected value of the expanded proven reserves, desigiJ a ted here ·as R2, would be (1+0.8+0.5) Rt=2.S R1.
The recoverable petroleum that with certainty can be said to have been found so far in a given country is the sum of the cumulative production plus the proven reserves. The expected value from discovered fields is somewrat larger. For this purpose, I have introduced tl'~ concept of EVRD (Expected Value of Recove:-:"able Discoveries) , defined as
EVRD cumulative production+ex~anded proven reserves R2.
Finally, the difference between the recoverable resources and the sum ( cumulatiye production+expanded proven reserves) is the undiscovered recoverable resources R3. JT ence, an estimation of Ra involves an estimation of recoverable resources.
ASSESSMENT OF THE PETROLEUM-REf"lURCE B,ASE
The main issue underlying the S'tdden increase in oil prices is a wide, sudden r'-".alization that world petroleum resources will b~ depleted within a few decades. How to appraise the ex-

tent of the remaining petroleum resources is a source of confusion. For long-range economic planning, it would be useful to have rather accurate estimates of the total amount of recoverable oil in a given country. However, because of the high degree of unpredictability of the actual location of petroleum deposits and because of technological limitations in the search techniques, it is not economically viable or technically possible to discover, ahead of development, all the fields containing the remaining world petroleum resources.
Therefore, to appraise the long-range supply of oil ·and gas, we need to go beyond mere projections made from present trends. First, one should estimate the m~agnitude of the resource base. regardless of economics and uncertainty of discovery. And then one should subdivide the resource base according to various intervals of unit costs, in increasing order starting from present levels. Future technological developments or changed market conditions probably will permit the exploitation of certain resources that currently are uneconomical. Second, the resource base should be ~subdivided according to certainty of occurrence. Improvement of exploration techniques and increasing knowledge of actual geologic conditions would allow some resources whose existence now is considered uncertain to be incorporated into the available supply. Such a conceptual framework for the long-range appraisal of resources has already been proposed by McKelvey (1972). It provides a much more meaningful basis for long-range forecasts than before.
The recoverable reserves for one fully developed oil field can be estimated with relatively great accuracy (say within +25 percent), but the estimation for a new field, a petroleum district, a sedimentary basin, a nation, or the Earth constitutes a series of exercises that are increasingly difficult and that have correspondingly wider ranges of uncertainty. A few basically original estimates have been made of the world petroleum resources, but a vast amount of published data in fact amounts to "regurgitations" of someone else's data, or someone else's "regurgitations" of someone else's, etc. The language of mathematical statistics is required to define more rigorously the problem of appraisal of petroleum resources.
7
To carry the analysis a step fartr~r, one can pose the question of whether the amount of recoverable oil and gas of a given part of a region could be of a given magnitude. The answer can be given only in probabilistic term~s. That is, we are faced here with the a priori prob ~.bility density function of the recoverable amount of petroleum for an undrilled area. Such a prob.ability density function is really not known, for example, for many undrilled areas in developing nations, and for most of the continental shelves, and it can only be conjectur~.
Conceptually, at a given time, one could first classify the remaining resources F-- according to the probability of being found as exploration continues. This probability p can bE: considered to be the product of the probability of existence -of a field Pe -and of the probability of actually locating the undiscovered field Pd· T1'" resources that at a given time we know with certainty to exist are a certain amount. One c<J llld conceptually proceed to dassify the undif~overed resources as incremental quantities .6.R corresponding to ranges of the probability p down to ·some low value of the probability. T'1e resource base B could be defined as the exr~ted value of the resources, that is, the summation of the incremental resource amounts multiplied by the probability of finding them; that is
B= ~ p.6.R. (1) for all ~R
Upon this first dassification sche1ne, we have now to impose the constraints that result from economics. Only a fraction of the segment of resources within a certain probal,ility range can be considered to be economically recoverable and discoverable, correspondin~ to the conditions at the time when the as~essment is made. In the future, the economic limits may widen (although not necessarily so), thus permitting a larger proportion of each segment to be exploitable. ·
Moreover, it would seem that the a priori probability density function is not narrow and would definitely become small only beyond the largest conceivable size of the recoverable amount of petroleum. Furthermor~~, the probability density corresponding to a very small size of the recoverable oil, or gas, is significant and different from zero. Moreover, the prob-

ability density for, let us say, an amount of recoverable oil comparable on a unit ·area basis with a given known oil basin is significant ·and different from zero. As we do not know the shape of this probability density function for undrilled ·basins and as it appears to be quite broad, it is not proper to give only one value for the amount of recoverable oil or gas or to expect that its standard deviation is a small fraction of the m·agnitude of the recoverable amount. As a first approximation, a uniform, or flat, probability density function could be taken for the petroleum estimates of an unexplored area. To give one figure for the petroleum resources of an unexplored area would be a futile undertaking.
Although this scheme might appear to be conceptually clear, operationally it is very difficult. Below a given probability, say 60 percent, the situation becomes highly speculative. There is very little basis on which to construct the actual scheme, and yet the largest expected contributions to the resource base B should come from resources having low probabilities of eventually being found. However, one could strive to perfect such a picture gradually, considering the past record of discovery ·as a basis for estimating parameters for theoretical statistical models.
Perhaps one of the most perverse effects of the conceptual difficulties of petroleum-resource assessment is what I call the accuracy delusion. By that I mean the misconception that published figures for undiscovered resources have a somewhat narrow distribution function; that is, that the possible values form a Gaussian distribution about the published figure and have not too great a standard deviation, say 20 percent. For new undrilled tracts of territory, as exemplified by the continental shelves, such a Gaussian distribution c.annot yet be provided. A team of company specialists might agree among themselves on a "most probable" value, but from team to team the "most probable value'' will be found to vary substantially. The wide scatter observed in bids for offshore petroleum leases could well be attributed to these variations.
A better approximation to the underlying uncertainty function of resource estimates than the Gaussian curve that leads to the accuracy
8
delusion is a modified uniform distribution function. It would extend, with uniform probability, from zero up to a figure somewhat greater than that for the richest known similar tract elsewhere and then would dr'l-p rapidly back to zero probability for great~ amounts. By analogy with other tracts and fP>m knowledge of adjoining areas, one might ju~tify modifying the uniform distribution on tl' o. low side also; that is, to drop quickly to zero probability for resource amounts smaller than a certain -amount.
The estimated magnitude of the resource base, and its subdivi·sion according tc economics and degree of uncertainty in finding, sets the targets for long-range petroleum exploration. In this selection of targets we are not. restricted by the high degree of certainty r·~uired by short-range considerations because, in the exploration of large unknown areas, the uncerbainties diminish as the exploration proceeds.
To apprai~ the petroleum-·resourc.~ potential of new tracts of territory, one should consider the basic scheme (table 1) that underlies petroleum-resource exploration and de"relopment. After the sedimentary basins have been identified, a predrilling estimate of Jl otential is made on the basis of factors such as the area, the maximum thickness of sediments, the type of sediments, the existence of structural traps, the existence of stratigraphic traps, the reconstruction of geologic history, the occurrence of oil and gas seeps, the adjoining petroleum provinces, and so on.
An exploratory well is ~aimed at r. very specific target which has been identified from similar previously undrilled, unrecogniT~d targets on the basis of (1) the prior data obtained in a region plus (2) the specific geological and geophysical surveys in the particular prospect. The various targets that exist in the ba,qin may be categorized in various groups such as foreland anticlines, hinge-belt anticlines, platform anticlines, fault traps, reefs, pinnacle r~fs, domes over salt domes, regional pinchouts, shoestring sands, etc. Moreover, the geologic definition of the targets in each group could be quite specific.
When the petroleum industry in a given basin is pursuing a given "play" it is in f~et running after targets in one of these groups. The actual existence of petroleum in one of th ~e targets

---
TABLE 1.-Stages in petroleum-resource development
Geological and geophysical exploration Existence of sedimentary basins Predrilling information :
Area of the basins Maximum thicknesses of the sediments Type of sediments Existence of structural traps Existence of stratigraphic traps Reconstruction of the geologic history Oil or gas seeps
YES NO: OU':':'
Adjoining petroleum provinces Predrilling potential? (end of first phase of appraisal) Exploratory drilling campaign Postdrilling estimate of petroleum potential ? (end of second phase of appraisal) Further geological and geophysical work Further drilling Development of oil potential (subsequent phases of appraisal)
can only be ascertained with a given statistical probability even after consideration of all the information that can be gathered before drilling. One could say, for example, that one out of four structures of a certain type in a certain part of a basin would contain oil. Moreover, the magnitude of the accumulation would be essentially determined by the group type1 the actual size being almost unpredictable.
In this manner, the statistical success of drilling would be about the same almost to the very end of the play, except for the effect of the enhancement of knowledge because of interaction with previously obtained data. One could thus describe the outcome, in barrels of oil or thousand cubic feet of gas found per foot drilled, as a random sample from a normal distribution, having a certain mean and a certain variance that characterize the play. When seve~al plays are being pursued, the outcome would consist of random samplings from the various normal distributions corresponding to each group.
In none of these models would there be a decreasing finding rate as a normal situation. The exploration would reach the limits of the resource with few warning signals from the finding rate, and the bottom would be hit rather unexpectedly.
An analogy here may help to visualize the problem. Let us suppose that an experienced hunter with a shotgun is hunting rabbits in a large enclosed field. Let us further assume that 20 rabbits are in the field and that the hunter requires three shots per rabbit, on the basis of earlier experiences in similar fields. One would expect that on the average he will require three shots per rabbit from the first one he downs
9
until the very last rabbit. Moreover, when a series of exploratory wells is drilled in a given region, the aim could actually impr0ve because, as the data from an increasing nun1ber of wells and exploration surveys become available, the geologic picture i~s clarified.
OBJECTIVE AND BIAS IN RESOURCE ASSESSMENT
When faced with the problem of estimating the magnitude of undiscovered p~~troleum resources, one needs to analyze the objectives of making such estimates. In situati~ns that involve uncertainty, one can rely he~.vily on the tools of mathematical statistics as long as the .g1Jatistical properties of the quantities involved are well defined. But such is not the case for most of the petroleum-prospective areas of the world. We are not dealing with a single statistically well defined population of petJ~oleum fields. As exploration enc.roaches upon the undrilled areas, one needs to introduce ne·w· statistical categories of fields, and, because of this, statistical methods have to be used with caution, and their limitations must be understo')d.
Of course, situations vary from the statistically well-defined-as to size of rccumulation and location-to the very fuzzy. UPfortunately, for most of the undrilled areas, the situation is very fuzzy. For each petroleum pr->vince there is a certain histogram of petroleu'11 accumulation ranked according to .a sequence of size intervals which range from zero t<' the largest conceivable value. This histogram--or its conceptual limit, the probability denrity distribution----can be estimated for certain limited regions, but we have at present ver:" little to go on in constructing one for a sedirn entary basin in the interior of Africa, for exa:rrple.

We are forced then to a blend of objective and subjective judgments. This situation has to be kept in mind because the mere fact that a probability density function is formulated mathematically does not necessarily mean that subjective elements have been removed. Ignoring these underlying logical difficulties, and also ignoring the various points of view that can legitimately be used in re~ource appraisal, has given rise to much confusion and argument. Petroleum-resource data have been misused by being taken out of context.
The amount of recoverable resources in a certain geologic domain can be viewed as a variate x, which could conceivably attain any value within a certain range LLxLW. By analysis of the outcomes of the same estimation process as applied to a suite of well-explored geologic domains { Ai}, one could construct a probability function f (x) so that
p(x:::::...O)= Lx f(x)dx. 0
Alternatively, one could estimate f(x) by using a model that involves subjective probabilities.
Another way of looking at the problem is to aim at the estimation of limits for x and for the range of x, within assigned probabilities. In practice, it would be more meaningful, as we have explained, to target on certain limits of x, rather than ori f(x).
What use is to be made of a petroleumresource assessment is one of the crucial questions. Some of the possibilities are that: 1. A bank is to decide on the financing of an
exploration and development project. 2. An oil company is to decide on beginning an
exploration project. 3. An oil company is to decide on continuing an
exploration project. 4. A government is to define a short-term na
tional energy policy. 5. A government is to define a mid-term na
tional energy policy. 6. A government is to define a long-term na
tional energy policy. Each application involves: (1) a decision
maker who will use the resource estimate and (2) a specific decision that must be made and that hinges on the resource estimate. Both are
10
important in defining the nature of the petroleum-resource assessment reqp.ired.
For certain decision, one needs a floor, or lower bound, for the resource estimate that has a high probability of being either fulfilled or overpassed. A bank, for example, w~n require almost a 100 percent certainty. By using the language of mathematics, this can be explained as follows: For deciding on the financing of a E"pecific investment for resource exploration anti development, the bank needs to know the am"lunt xL of the resource so that the relationship
LLxLxL will be fulfilled with a low probability q.. This probability q determines the marginal risk of losing the investment. ConV'OOtional financing, moreover, would require (1) that tl~~ bulk of the investment be recoverable on the lH'.sis of an amount of resources that .is almost certain to exist and (2) that only a marginal fraction of the investment be risked. Such an estimation problem could be described by a probability density distribution such that
p(x:::::...L)=1, and
tt p (LLxLu) = £ fL(x) dx.
L A government, as another example, when
analyzing the various outcomes of r.lternative energy postures will need an indication of the minimum amount that with reasonable certainty can be counted on to be available from the domestic sources.
An economic forecaster may want to focus his discussion on a most likely value of the recoverable resources. Here, a word of caution is in order. The "most likely" value should be sought in most resource assessrr.ents, but seldom is it really available. What we often find is an intermediate value that has been termed "the most likely value."
For other decisions, one needs a roof, or upper bound, for the recoverable resources characterized by a low probability of being surpassed. When appraising, for examph,- the possible impact of a new energy resource, one may want to know how large its contribution to the total energy supply could be. It may be enough to know that the upper bound is at the most a

few percent of the total energy supply; however, if the calculated percentage turns out to be substantial, then a subsequent estimation aimed at the midpoint of the likely outcomes may be in order.
An important bias arises out of competitive considerations. For instance, when appraising the petroleum prospects of specific undrilled potential areas throughout the world, an oil company may not want to encourage its competitors by aiming its appraisal at the upper range of the possible outcomes; rather, it may want to aim at the lower range while still staying within the range of what the company considers viable.
Now that there is widespread recognition of the energy crisis, national economic planners have been asking how much oil is left in their country. They want to know this with precision, in order to m·ake firm policy decisions. We meet here several problems, one of which is to make the planners understand that counting barrels of undiscovered recoverable oil in the ground i:s not as simple as counting sheep gra.zing on the land. Let us examine what kinds of answers are both viable and useful to economic planners.
One needs to distinguish the various types of countries as to their initial petroleum posture, namely: (a) no exploration and no development; (b) unsuccessful exploration; (c) incipient exploration and incipient development; (d) limited exploration and limited development; and (e) intensive exploration and intensive development.
For countries groups (a) , (b) , and (c) , the first legitimate question for the planner is whether to act so as to permit exploration to proceed. In this decision problem, one has to compare the two alternatives :
Go : that is, proceed with exploration, and
No Go: that is, no exploration allowed. This is not an unlikely situation. In fact it is the type of decision confronting national planners in some developing nations having a petroleum potential. What they must weigh here is the (1) economic prize that might be obtained if exploration turns ()Ut to be successful against (2) the costs of exploring plus possible indirect economic losses incurred because of having proceeded with the exploration. For those coun-
11
tries, estimates at the center of the range and at the upper bound would be most useful to them in making, their decision.
For countries in group (d), howev~r, further limited exploration and developme:"t may be discouraged by an estimate that is aimed at the lower end of the range.
A country in group (e) that has had intensive exploration and development may want, in the first place, an estimate of the w.inimum of recoverable resources that are left in order to proceed cautiously. For comprehenfive contingency planning beyond this minimum, they would need also the most likely outcome and the upper bound.
The requirements on which resource-appraisal methods should be judged r:re several: (1) the consistency with observations; (2) the degrees of objectivity and, its courterpart, of subjective judgment; (8) the stabil~ty of forecast; (4) reproducibility; and (5) the adequacy, as to the true answer.
Often, forecasting methods haVf~ been adv·anced because they satisfy ·some of these criteria, but they fail to demonstrate adequacy. Objectivity and reproducibility,. for instance, are not enough. The finl:ll criterion is adequacy, which is difficult to achieve and eve11 more difficult to demonstrate.
PROBLEMS WITH HISTORICAL PROJECTION MODELS
LINEAR. "DR.ll..LING INPUT-PETROLEUr·-r OUTPUT" MODEL
A linear input-output model of pe+roleum exploration and development may be used to gage the economic impact of the finding rate.
The input into the model is a schedule of exploratory drilling per year, and the main output is the .amount of oil or gas discovered per year. Such a model has been used in the United States, for example, by the N a tiona' Petroleum Council (1973) and the U.S. Federal Energy Administration (1974).
One ·assumption in this model is that the amount discovered per year is simply proportional to the drilling per year. The amount of oil or gas discovered per foot drrled can be taken to be a parameter that is a function of the cumulative drilling and that var:~~ from re-

gion to region. Another basic assumption made i-s that the production per year is a constant fraction of the proven reserves.
The calculation starts with the reserves at the beginning of the period of projection and updates them year by year as the result of the drilling discoveries and the yearly production withdrawals. A separate tally is kept of primary, secondary, and tertiary reserves.
The ba·sic equations for this model would be as follows:
aRn=p.lmD,_"A. +aR' n+ aR" ,+aR" I,+£, (2)
P,+l = /R, (S) and
where aR,. === (recoverable) proven reserve estab
lished during the n-th year in a region,
Dn-"A. = explomtory drilling footage undertaken during then-,\ year,
m == finding rate in barrels of oil or thousand cubic feet of gas per foot drilled, where m is a function of lDn,
P.1 = primary recovery factor, A == lead time in years,
aR' = revisions and extensions of earlier pri-, mary proven reserves on n-th year,
aR" = actual increment to secondary proven " reserves on the n-th year, P.2 = sec
ondary recovery factor, aR"' = actual increment to tertiary proven re-
, serves on the n-th year, p.a ==tertiary recovery factor,
£ = revisions to prior computations of aR', ~R", and aR"',
P, =production in n-th year, I = fraction of the current reserves to be
produced each year, and R,. = recoverable proven reserve as of the
end of the n-th year. The starting conditions are the set of the
Ro values as of the beginning of the period of projection. The parameters P.1t p.2, p.a, m, /, and A are assumed to be known in the model and would be estimated by studying the historical data for the region. The ·schedule_ of primary, secondary, and tertiary recovery factors is also assumed for the model.
Then an exploratory drilling schf\~ule is assumed for the region ; that is, the fo'ltage Dn to be drilled in each region in each ye.1.r.
Equations (2), (3), and (4) expr~s the aproaches used by the National Petrol~um Council (1973) for oil and gas calculatio:'ls. For the oil model it is assumed that a cert:'.in proportion orf associated and dissolved gas will be found per barrel of oil reserve discovered, and this gas will be passed to the gas me iel. A constant fraction of the amount of all ~xploratory drilling is assumed to be allocated to gas exploration.
Up to this point the big uncertainty is the role of the market price in t\le assumed drfiling schedule. Actual economic costs of various oils vary widely, and because some producers would lose money at the average price, they would not have undertaken the assumed scheduled exploration and development. ~,he market price required to yield the assum ~d drilling schedule should be higher than tl~ ·average cost, or, said another way, the actual drilling schedule and petroleum outcome would be sm·aller than indicated by the above model if the market price is the same as the average cost.
What is needed, then, is a way to p,-ee8timate the supply curves for oil and for ge.s--that is, the amounts of oil and gas that wo~dd become available ·as a function of their market price. This preestimate thus requires consideration of the variety of the individual development projects ranked as to their p·rofitability.
The exploratory effort Dn in a givE''l province on a given yearn can be viewed as the initial point of an investinent decision. Let us define this as ·an "n-project." The exploratory effort Dn would result in the discovery of a proven reserve AR, +"A where A is an exploration lead time, but only if the industry actuslly decides to make the necessary investments. An entrepreneur would decide whether to undertake the project, depending on his assessm~nt of the project's financial outcome. For this decision, the discounted cash-flow method, having an assumed discount rate, r, can be used. This is the procedure adopted, for example, in Project Independence (U .is: Federal Energ7" Admin., 1974), which can be used to develo11 a mathematical formulation.
12

Let 11Pn(,.) be the annual production to be obtained from an n-project, ,. being the time counted from its initial year n. For a given discount rate r, there would be a minimum unit price Pn ( r) of the oil, or gas, that the entrepreneur would require for deciding to make the investment on then-project. This unit price is a function of the discount rate r and also of the specific n-project considered. As a basic characteristic of an n-proj ect, we can take the finding rate m. Hence, we can write
Pn (r) =P (m,r). (5)
That is, given the finding rate m and the discount rate r, the minimum required price can be calculated.
Consider now the supply situation in a given yearn as being the result of all prior n-projects undertaken. For a unit market price U we can ask what would be the supply P ~ o.f oil, or gas, that would be available. The supply P,.,, would be the sum of the productions for the year n of all prior n-proj ects that would be undertaken. The supply for a given year would thus consist of the addition of the contributions drawn various years after discovery from a set of n-proj ects, that, is of several "vintages." The question, therefore, is which n-projects would have been undertaken.
If the future-price expectation of all entrepreneurs prior to year n had been U, then all those n-projects for which
U(m,r)LU (6)
would have been carried out, and the supply would be
T=L Sn= ~ 8m,p11Pn(n-T), (7)
T=n where the operator, Sm. P' is equal to 1 if (6) is satisfied, and equal to 0 if it is not.
The finding rate is defined as the ratio
&Rn+'A. m
Dn (8)
For a given region, this finding rate may ~ary in some manner as a function of the cumulative drilling, that is m=/(SDn).
Now I would like to discuss whether the value Sn above, as a function of U, would provide an estimate of the supply curve. The most critical input data to the calculation of this estimate of
the supply curve appears to be the finding rate. We have
&Rn+x=mDn. (9) First, the future-price expectation in the past
may be different from the actual pric~ at a later time. If the future-price expectation in the past would have been higher than the actual current price, then the actual current supply would be higher than indicated by the eq'lation (7) because more entrepreneurs would have decided, some mistakenly, to carry out their nprojects. On the other hand, if the f'lture-price expectation in the past would have been lower than the actual current price at a later time, then the actual supply would be lower than indicated by (7) because less n-projects would have been carried out. If however, it is as·sumed that the future-price exJ)E'~tation of entrepreneurs is correct, then the above difficulty disappears.
Second, ann-project would generally encompass several petroleum fields of various degrees of profitability, yet all of them are linked in this simple model as one project. This naturally tends to blur the significance of the supply curve as calculated above.
Now we assume that the producthn rate obtained from tilln+>. decreases exponertially with time and that the decay constant is T 1, so that
&Pn(T)=(&Rn+>./Tt)e-r!f'l_ (10)
Hence &Pn(T)=m(D,JTt)e-r/Tt, (11)
The development and exploitatio:'l of an nproject gives origin to a sequence of annual investments, expenditures, and i n c o m e s throughout the life of the project. In the discounted cash-flow method, the cas:'l proceeds and cash outlays are discounted to the initial time. If the discount rate is assumei, then the unit required price to make the prt~sent value of the proceeds equal to the present value of the outlays can be calculated.
For the discounted cash flow of a given nproject, and taking the U.S. type of taxation as an example, we can use the expre~,~ion F=(1-a) (1-p) USAPre-rr
'T +r (Ea+Eb)-Ilo-lE,.e-r,. 'T
-Sy{ (1-a) (1-p)paP.,. 'T
13

where F = present value of the discounted cash
flows, U = unit price of oil (or gas),
P.,. = production per year on .,. year of project,
a = ad valorem tax, {3 = royalty rate,
E a = expensed items : dry holes + 8 o/o of successful wells + lease rentals + overhead,
Eb =tax credits: £% of successful wells + environment and safety + gas plant + lease equipment}
y = corporation tax rate, Eo= initial cash expenditures, E.,. = cash expenses on .,. year of project,
., = effective depletion rate for .,. year of project, as a fraction of the net revenue,
o =depreciation for.,. year of project, and r = annual discount rate.
The first term in the summation of expression (12) corresponds to the present value of the net revenues ; the second term, to tax credits; the third, to the initial expenditure; the fourth, to the present value of the annual expenses; and the last, to the present value of the income taxes.
u
Equation (12) is to be solved for U, namely
Eo+Y~ (E.,----q--8) e-r-r_y (Ea+Eb) ,. y(1-a) (1-,B)~~P.,e-r.,.
(13)
'I'
Some of the quantities in the numerator of (13) correlate strongly with D, and others, with aR, but the predominant effect appears to be a linear dependence of Eo on D. Moreover
~P.,=m(D/T1 ) e-r/Tl (14)
because of equation (11), and thus ~P., is also proportional to D. Therefore, the factor D tends to cancel out in ( 13) , and the price U would turn out to be inversely proportional to the finding rate m, namely
c U=-, (15)
m where c is a constant which depends on the investment and opel"'ating expense coefficients, tax rates} and production decay constant T 1 •
14
DRILLING FINDING RATE
The density of drilling, that is, t:'le number of exploratory wells drilled per squr.re mile of prospective area, is a useful indicat1r of what needs to be done in young petroleum provinees, as, for instance, in most developing countries. Because of this, it is necessary to review the relationship between wells drilled and petroleum found. Total footage is a mearure of the amount of drilling.
A common assumption is that t1'~ average amount of proven reserve found each year is proportional to the amount of explorr'""tory drilling in that year. Moreover, it has be~n assumed that this finding rate, in barrels of oil or thousand cubic feet of gas per foot, decre<:~.ses as the cumulative drilling increases. Offhard, this appears to be a reasonable assumption.
Why should the finding rate decrer;se steadily as the cumulative drilling increases? It cannot be simply because the oil resources in a region are being depleted as the exploratory drilling increases because the finding rate could remain constant or even increase during n10st of the exploratory phase of a region and then drop rapidly to zero as the limits of the resource base are finally approached.
It has been claimed that the finding rate should decrease because the larger fi,~lds will be discovered first. Of course, this is what one would like to have happen, but thr. record of exploration in basin after basin reveals that this is not so. The discovery of giant fields typically occurs some 30 years after exphration begins in a region. There does not arpear to be a dominating "pickle-barrel effect-" to thus justify a decrease of the finding rate.
Maximum depth of drilling has be~n increasing worldwide. For given basins and time lapses of 10-20 years, the average drilling depth may show a trend of increase that would introduce a decreasing trend of the finding rate with time. The year-to-year fluctuations of the finding rate, however, can be considerably larger than the effect per year of the basic trend due to drilling depth.
As an example, let us examine how the finding rate behaves for the National Petroleum Council (U.S.) regions (table 2). For the period 1956-70, the finding rates for regions 1, 2> 2A, 6, 6A, 7, 8, 9, 10, and 11 vary rather

randomly from year to year and do not demonstrate any trend of decreasing values as drilling footage increases. On the contrary, for regions 1, 2A, the aggregate of 8, 9, and 10, and
11, the basic trends indicate that the finding rate increases as cumulative drilling footage increases. Only for regions 3, 4, and 5 is a declining trend indicated.
TABLE 2.-New oil in place (bbl/ ft) added per foot of exploratory drilling [From Natl. Petroleum Council, 1973, p. 212-222]
U.S. region
Year 1 2 2A 3 4
1956 0 191 33 93 94 1957 0 163 13 188 115 1958 0 186 38 227 107 1959 214 143 34 113 86 1960 3,968 222 522 159 100
1961 2,178 151 774 138 99 1962 0 545 365 69 54 1963 43 263 1,206 71 42 1964 366 1,360 163 56 52 1965 2,975 226 1,063 40 71
1966 2,256 40 1,262 80 40 1967 4,492 93 1,867 112 69 1968 11,233 411 640 68 75 1969 128 43 1,695 45 25 1970 463 77 0 44 41
ECONOMIC ROLE OF THE FINDING RATE
To gage the quantitative importance of the finding-rate function on the supply curve, let us assume a linearly decreasing function, namely
m=mo-hQ, (16) where mo is the finding rate at the initial point considered, Q is the cumulative exploratory drilling measured from the initial point, and h is a constant.
The supply S is obtained by integrating the outcome of the drilli,ng effort, namely
Ql Ql
S=J mdQ=j (mo-hQ)dQ, (17) 0 0
or
(18)
The cutoff point of the drilling, namely the Ql value, would depend on the economics. The cumulative amount of drilling Q determines m by (16), and m determines the minimum required price from equation (15). Thus
(19)
and
(20)
15
5 6 6A 7 8,9,10 11
201 86 1,239 97 106 (]
254 92 1,027 79 90 0 274 80 4,037 61 90 (]
329 103 17,451 65 132 (]
314 87 75 112 (]
273 146 76 68 (J
249 135 751 92 75 22. 213 81 460 72 84 (J
149 102 323 76 82 138 184 93 257 83 69 569
134 62 487 55 81 (J
136 71 282 46 106 (J
95 41 391 41 144 16 87 59 415 51 149 129
121 77 1,423 78 175 72
So that the supply S is mo2 c2
8=- (21) 2h 2hU12
Equation (21) demonstrates that the supply functionS has an asymptote. No tnatter how large the price ul the quantity s V10Uld be no larger than m 0
2 /2h. As U 1 increases. S increases at a IS'lower and slower P'ace to its ultimate asymptotic value. The asymptotic value of S varies with the square of the initial finding rate and also is inversely proportional to the downward slope of the finding-rate line.
A quantitative assessment of the role of the finding-rate function, which I have made briefly here, reveals that the finding rate plays a major role in defining the supply curve for petroleum. A decreasing finding rate, even a mild linear decrease as cumulative drilling increases, imposes a definite roof (asymptotic v2lue) to the supply curve. No m~atter how high the price goes, the supply does not go above it. As the price increases, the supply increases at a more and more sluggish pace.
NOTE ON THE LOGISTIC METHOD OF PROJECTION
Application of the logistic function to the estimation of petroleum resourcE*' has been made by M. K. Hubbert in an extensive series

of papers since 1956 or so (see, for example, Hubbert, 1969). A similar approach is the use of the Gompertz curve (Moore, 1965). These methods have the advantage of their simplicity and of being based on published statistical data. They are intended to be used in areas where exploratory drilling has reached a mature stage.
Thes·e methods have been called "mathematical" because they use a formula to fit the cumulative-production and proven-reserve data. In fact they ·are empirical booause no theory justifies the use of either the logistic function or the Gompertz curve.
When these methods are used, it is difficult to recognize when the final maximum has been reached. The hi·storical oil-production curves of several countries show well-defined maxima. Had the logistic, or Gompertz, projection method been used, there would have been a gross underestimation of the undiscovered oil resources. For example, the annual oil-production curve for Mexico in the period 1918-32 has a maximum in 1921; for Austria in the period 1946-61, a ·single m·aximum in 1955; for France in the period 1946-73, a maximum in 1965; for Rumania in the period 1918-47, a maximum in 1936; and for the USSR in the period 1918-45, a maximum in 1941.
These methods provide a firm estimate of the minimum amount of petroleum that ought to be found if the industry continues doing what it has been doing in the past-what is already in the bag, so to speak. They cannot) however, predict new plays in a basin.
The application of these method's is limited to mature petroleum regions and thus cannot be used in most of the partially explored and unexplored petroleum-p·rospective ·areas of the world.
NOTE ON RANDOM SEARCH
In petroleum resource appraisal, two basic questions are to be answered: (1) How much petroleum is there? and (2) where is it? If we assume the answer to the fi~st of these questions, we have a problem of search only.
Some random-drilling models purport to ·show that the outcome of past exploration is to be explained by random drilling. But even a ·superficial acquaintance with the history of
16
petroleum exploration reveals that such is not the case. The overwhelming majority of exploratory drilling decisions are made on the basis of all information ava.Hable to the decisionmaker, and the choices of· exploratory ·sites are those that currently appear to be mo.qt promising. The aggregate nature of the dabl used and the naivete of some decision models u~P.d might explain why this exercise seems to p:':"osper.
A major logical difficulty in the mc<ielling of past exploration is the introduction of a Sunday morning quarterback or post-morteir point of view. When exploration begins in a new province, it does so with no assurance that commercial accumulations exist and with no ~ s,surances as to the ·size of such accumulations. Tf, in fact, there ·are, let us say, 100 fields in a province at the beginning of the exploration, a search strategy cannot alSSUtne this but must assume the variety of possible ultimate out.comes : 0 field, 1 field, 2 fields ... n fields. On the other hand, if we assume that at the beginning of the exploration, we are provided with a statement s·aying that somewhere in the basin are 100 basins and that we ought to find them, the situation would be different. Then we could engage in a systematic campaign of grid drilling, using closer and closer grids, until the: fields are found. Thus, a model of random or gr~d drilling loses meaning when examined against the exploration that has to unfold the plot.
In order to explain the outcome o:t: exploratory efforts, one must take into consideration both the search str:ategy of predrilling surveys (geology and geophysics) and the e:r:plor·atory drilling st~ategy. By trying different composite strategies the petroleum industry ha~ come to settle on quite different strategies for the above two phases of exploration.
Predrilling surveys, not being so 1nuch hindered by logistic limitations as drilling, can systematically co~er wide-ranging areas. The purpose of this predrilling phase i.s to find likely traps. A probability of trap recognition could be associ,ated with the outcom~ of each predrilling exploratory method. Whether the behavior of predrilHng surveys could be simulated by a random search is not clea.r.
Explo~atory drilling, on the other 1' and, cannot roam freely over the prospect.ive area. Logistic considerations of the explo1·atory ac-

tivity itself constrain its freedom of movement. Moreover, logistic cons.ide~ations of the petroleum industry itself ·also modify and restrict the choice of the areas for more intensive exploratory drilling. As soon as a discovery is made, a rea.s,sessment has to be m:ade about the exploratory I development drilling strategy. Because of the above considerations, it would be uneconomic.al to assume a random exploratory drilling strategy. Explorntory drilling is focused on specific traps; as soon as a discovery is made, the drilling is concentrated on trap's that belong to the same geologic family, or what is called a play. While a systematic search is being made for a given type of trap, unforeseen conditions may be met which m~ay lead to a random disturbance, which in turn may trigger another .sequel of exploratory drilling.
The result of this dual strategy can be gaged by a simple model. Let us assume that a number dn1 of exploratory holes ·are drilled after traps of type i; then the number dT of traps discovered is
ASj dT=aidni+~(l-aj) (Nj-Tj)--dnj, (22)
j s where
ai=probability of correct recognition of trap type i,
aj=probability of correct recognition of trap type j,
ASj=average area of trap type j, S=total search area,
dnj=number of exploTatory holes drilled after traps of type j,
Nj=total number of traps type j, other than i, which exist in the regions, and
Tj=Cumulative number of traps of type j discovered.
If n1 and nj are independent variables, then the solution of equation (22) is
ASj(l-aj) T=a1n1+l[Nj-k exp {- nj}]+c,
j s (23)
where c and k are constants of integration. The above formula reveals the two elements
of the explomtory drilling outcome namely, a hit with constant probability a1 represented by the first term on the right side, plus a term with a negative exponential represented by the second term.
If we were to focus only on the rate of discovery of traps type j, accidentall~r while running after type i, one gets
dT kAS(l-a) AS(l-a)n =----exp { }. (24)
dnj S S H. W. Menard and George Sharrr.an (written
com.mun., 1975) have proposed a model of search ·which in effect takes into ~<·eount only the second term of 'equation (22). ~hat is, they assume a purely random search.
SKETCH OF A PROBABILISTIC MODEL OF PETROLEUM-RESOURCE ASSESSMENT
The petroleum-prospective regjons of the world consist of a ·set of sedimerta.ry basins {Bi}. Each basin may be segmented in geologic compartments {Vu}, characterized by a homogeneous probability space as to ,size and location of 'a given type of petroleum trnp TLj· The Vi,J may overlap in part with each other, and the union of the { V1,j} may be sm,aller than the space occupied by B1.
The exploration strategy aims at. identifying these geologic compartments, wll ich provide lanes for further discoveries. The probability of discovery of a field is enhanoed whr"l the definition of a geologic compartment is established. Exploration then can move to a l'igher probability p·ath.
Some of the ·statistical distribution functions of the T1,j may be correlated or fun~tionally dependent on those of other Ti,kJ brt many are totally independent. Therefore, tll e statistical properties of some Ti,j may be inferred statisr tically from thos.e of known Ti,j, but there are others for which the known Ti,j will provide no information.
For .a given Bb the domains of some of the vi,j may have been defined in pa~ or in total by the exploration effort. That is, an element vu of Vi,j would be known. The ultimate recoveflable resources 1·i,j from vi.j 1nay be estimated from field-production data, success ratios, and even logistic or Gompertz type of projections.
17
For those already identified Vu having a known element vi.j, an estimate of the recoverable resources r 1,j in Vi,j may be made : 1. By sealing 1·i.j in terms of the significant
dimensional parameters of Vi.j and Vi.j, Or

2. By an econometric analysis based on the dimensional parameters, which would allow expression of the results in terms of their statistical significance, or
3. By formulating a field of probability occurrences over Vi,j based on an extension of what may be known in vu.
For those Vi,j that are already identified but that have no known element, an estim,ate of the recoverable resources would have to be made by comparison with other Vi.j and by the introduction of a subjective judgment of the field of trap occurrences throughout Vi,j·
For the remaining parts of Bi where no Vi,j
have been identified a broader range of estimates would have to be made based on more subjective judgments as to the likelihood of
18
occurrence of fields and the statistical properties of their ,size and locational parameters.
REFERENCES CITED
Hubbert, M. K., 1969, Energy resources, Chap. 8 of Resources and man: San Francisco, W. H. Freeman, and Co., p. 157-242.
McKelvey, V. E., 1972, Mineral resource ertimates and public policy: Am. Scientist, v. 60, no. 1, p. 32-40.
National Petroleum Council, 1973, U.S. energy outlookOil and gas availability: [Washington, D.C.], 768 p.
Moore, d. L., 1965, Analysis and projection of the historic pattern of supply of exhaustible natural resources: Operations Research Soc. America, 27th Natl. Mtg., Boston, Mass., 29 p.
U.S. Federal Energy Administration, 197 4, Oil: Possible levels of future production-Project Independence Blueprint, Final, Task Force Report: Washington, D.C., U.S. Govt. Print. Off.~ variously paged.
i:r U.S. GOVERNMENT PRINTING OFFICE: 1975 0-211-317/1