Embed Size (px)
Citation preview

LETTER
Mapping the shadow of experience of extreme weatherevents
Peter D. Howe & Hilary Boudet & Anthony Leiserowitz &
Edward W. Maibach
Received: 30 June 2014 /Accepted: 10 September 2014 /Published online: 13 October 2014# Springer Science+Business Media Dordrecht 2014
Abstract Climate change will increase the frequency and/or intensity of certain extremeweather events, and perceived experience with extreme weather may influence climate changebeliefs, attitudes, and behaviors. However, the aspects of extreme events that influencewhether or not people perceive that they have personally experienced them remain unclear.We investigate (1) the correspondence of reported experience of extreme weather events withdocumented events, and (2) how characteristics of different extreme events shape the geo-graphic area within which people are likely to report they have experienced it—the event’sperceived “shadow of experience.”We overlay geocoded survey responses indicating personalexperience with hurricanes, tornadoes, and drought—from a 2012 nationally representativesurvey (N=1,008) of U.S. residents—on maps of recorded event impacts. We find thatreported experiences correspond well with recorded event impacts, particularly for hurricanesand tornadoes. Reported experiences were related to event type, proximity, magnitude andduration. The results suggest locations where disaster preparedness efforts and climate changeeducation campaigns could be most effective after an extreme weather event.
1 Introduction
Extreme weather events—events that are rare for a particular place and time of year—canserve as teachable moments about climate change (Marx et al. 2007; Spence et al. 2011; Myers
Climatic Change (2014) 127:381–389DOI 10.1007/s10584-014-1253-6
P. D. Howe (*)Department of Environment and Society, Quinney College of Natural Resources, Utah State University,5215 Old Main Hill, Logan 84322 UT, USAe-mail: [email protected]
H. BoudetDepartment of Sociology, School of Public Policy, Oregon State University, Corvallis, OR, USAe-mail: [email protected]
A. LeiserowitzSchool of Forestry and Environmental Studies, Yale University, New Haven, CT, USAe-mail: [email protected]
E. W. MaibachCenter for Climate Change Communication, George Mason University, Fairfax, VA, USAe-mail: [email protected]

et al. 2013; Rudman et al. 2013). But what types and scales of events are the best teachers?And how near must a person be relative to the event for it to create a teaching opportunity? Asclimate change increases the frequency and/or intensity of certain extreme weather events(Coumou and Rahmstorf 2012; Peterson et al. 2012), these are important questions not onlyfor climate educators trying to understand where to devote limited time and resources, but alsofor risk managers hoping to encourage disaster preparedness.
Personal experience plays an important role in individual risk perceptions of future eventsas well as preparedness and mitigation behaviors, although the effect of experience is likely tobe contingent on situation-specific aspects of the event (e.g., type, magnitude, distance),individual factors (e.g., knowledge, values, attitudes, emotions) and social context (e.g., mediareports, peer influences, culture) (McGee et al. 2009; Zaalberg et al. 2009; Wachinger et al.2013; Silver and Andrey 2014). Moreover, the effect of experience on perceptions andattitudes can create “windows of opportunity” for policy change (Tierney 2007; McGeeet al. 2009).
These findings from natural hazards research are similar to findings about the influence ofweather experience on beliefs and actions related to climate change. Perceptions of changes inlocal weather (e.g., rising temperatures, flood experience) play an important role in beliefs,attitudes and behaviors related to climate change (Spence et al. 2011; Hamilton and Stampone2013; Akerlof et al. 2013; Zaval et al. 2014) and vice versa (Goebbert et al. 2012; Howe andLeiserowitz 2013). Using direct measures of weather changes, studies have linked localweather and climate fluctuations to beliefs and attitudes, particularly for those with lessentrenched beliefs (Egan and Mullin 2012; Goebbert et al. 2012; Howe et al. 2013; Howeand Leiserowitz 2013; Hamilton and Stampone 2013; Akerlof et al. 2013; Zaval et al. 2014).Recent research, however, has focused on variations in temperature and precipitation asopposed to extreme weather events, yet extreme weather events, particularly when they resultin fatalities, may have a larger and longer term impact on climate change attitudes (Brody et al.2008). Indeed, recent research has shown that personal experience with Hurricanes Irene andSandy increased both pro-environmental beliefs and support for politicians who supportclimate change mitigation (Rudman et al. 2013).
We analyze an important aspect of the relationship between exposure to extreme weatherand people’s beliefs that they have personally experienced climate change: the characteristicsof extreme weather events that influence how members of the public perceive that they havepersonally experienced extreme weather. To date, there has been limited research on howdifferent extreme event types, magnitudes, durations or proximity influence public perceptionsof extreme weather experience.
Our goal is to investigate the geographic correspondence of subjective personal experienceof extreme weather events with the recorded locations of events. In so doing, we will examinethe effect of proximity on personal experience to characterize the events’ “shadows ofexperience.” While the concept of a risk perception shadow was originally created to maprisk perceptions of technological hazards associated with siting hazardous facilities, we believeit useful in the context of extreme weather risk. Adapting a definition offered by Stone (2001),we define a shadow of experience as the geographic area within which a population perceivesitself to have experienced an extreme weather event. This area may extend beyond the locationwhere the event actually occurred, for example via indirect experience from friends orrelatives, or social and environmental cues. Based on previous research (Stoffle et al. 1991)that has outlined the factors that may be important in mapping risk perception shadows, weanalyze the type of event, proximity or directness of impacts, significance or magnitude ofimpacts, and duration of impacts on people’s tendency to report personal experience with theextreme weather event. Moreover, this analysis represents a novel application of spatial
382 Climatic Change (2014) 127:381–389

relative risk mapping—a technique adapted from spatial epidemiology—and statistical modelsto characterize the relationship between extreme weather events and individual perceptions.
2 Methods
Data on extreme weather perceptions were obtained from a national survey of U.S. adults (ages18 or older) conducted in April 2012 using an online panel recruited by Knowledge Networks(N=1,008; completion rate=54.1 %; cumulative response rate=5.2 %). Response rate metricsfor online panel surveys are still under development, and do not compare directly to telephoneor mail surveys. A cumulative response rate may be calculated as the product of the panel’srecruitment rate, profile rate (the proportion of respondents who completed the initial profilesurvey to become panel members) and completion rate (Callegaro and DiSogra 2008). Whilethe cumulative response rate appears low compared to telephone surveys, studies show that theaccuracy of probability-based Internet surveys meets or exceeds that of telephone interviews,with the optimal combination of both sample composition and response accuracy (Chang andKrosnick 2009). Knowledge Networks recruits participants using random digit dialing andprovides small incentives as well as a free netbook and Internet service to those withoutcomputers to ensure they are represented in the panel. Survey responses were based on a seriesof yes/no questions which asked the respondent: “In the past year have you personallyexperienced each of the extreme weather events or natural disasters listed below?” andincluded eleven types of extreme weather events (extreme snow storm, extreme cold temper-ature, extreme high winds, extreme rain storm, extreme heat wave, flood, wildfire, hurricane,drought, tornado, other unusual weather). Only those who provided an answer are included inthe analysis. We focused our analysis on perceptions of tornadoes, hurricanes and droughts asexamples of hazards with varying spatial extents, magnitudes, and rates of onset.
We mapped the spatial pattern of perceived experience of each hazard by creating a relativerisk surface for each survey item, depicting the probability density of each response relative toother responses and accounting for spatial inhomogeneity in the underlying population. Kerneldensity estimation was performed in R using the spatstat (Baddeley and Turner 2005) andsparr (Davies et al. 2011) packages, which use an isotropic kernel smoother with bandwidthsselected by cross-validation. Positive concentrations of responses were identified after calcu-lating asymptotic p-value surfaces, with positive concentrations at the 95 and 99 % confidencelevel represented as contours superimposed on the relative risk surface.
We conducted a spatial nearest neighbor analysis to characterize the relationship betweenproximity to recorded extreme events and the probability that respondents would reportpersonal experience with the event. We calculated the great-circle distance between eachrespondent and: (1) the nearest recorded tornado track of each category on the EnhancedFujita scale between January 2011 and March 2012 and (2) the nearest record of propertydamage, injuries, or fatalities due to a hurricane between January 2011 and March 2012.Tornado tracks were obtained from the NOAA Storm Prediction Center (SPC 2013) andhurricane records were obtained from the National Climatic Data Center Storm EventsDatabase (NCDC 2013). Records were included if they were categorized as a hurricane/tropical storm event, or if they were categorized as a coastal flood, storm surge, or flood eventrelated to a hurricane/tropical storm. We included events beginning in January 2011 becauseour survey question asked about events “in the past year,” which may have been interpreted asreferring to events either within the last 12-month period or within the previous calendar year.The Storm Events Database georeferences hydro-meteorological events to the point, county, orweather forecast zone. In the case of events referenced only to a county or weather forecast
Climatic Change (2014) 127:381–389 383
zone, the events were assigned to the centroid of the county or zone. This method generatessome locational uncertainty at the lower bound of the nearest-neighbor analysis.
We counted the number of respondents within successive 1-km distance bands from thenearest event and calculated the proportion of respondents who reported experiencing aparticular type of event within each distance band. Using a chi-square test we then testedthe difference between the proportion of respondents reporting personal experiencewithin each distance band and the national baseline proportion of respondentsreporting personal experience with each type of event. To examine the relationshipbetween perceptions and experiences of drought, we calculated the duration of severedrought (Category 2 or higher) at the county level during the 15 months prior to thesurvey. We then extracted these county-level data based on respondent locations foruse in logistic regression analysis.
3 Results
In a nationally representative survey conducted in April 2012, a large majority of Americans(82 %) said they had personally experienced one or more types of extreme weather or naturaldisasters in the past year (Leiserowitz et al. 2012). Here we focus on three hazards that differ inspatial scale, rate of onset, magnitude, and relationship to climate change: tropical cyclones/hurricanes, tornadoes, and drought. Hurricanes are moderate-onset events (with a typicaladvance warning of days) that affect large areas and are projected to increase in severity asthe climate changes, but possibly decrease in frequency (IPCC 2012). Tornadoes are fast-onsetevents (with a typical advance warning of minutes) that affect relatively small areas, but itremains unclear whether climate change will affect the frequency or severity of tornadoes(IPCC 2012). Droughts are slow-developing events, but affect large areas, are often long-lasting, and are projected to increase in frequency and severity in the Western U.S. as a resultof climate change (IPCC 2012). In April 2012, 16 % of Americans reported experiencing ahurricane, 21 % reported experiencing a tornado, and 34 % reported experiencing a drought inthe prior year.
The spatial distribution of recorded tropical cyclone activity, tornado tracks, and droughtcorresponded with the distribution of people’s reports of personal experience with each event(see Fig. 1). The analysis of hurricane experience was limited to one event, since Irene was theonly hurricane to affect the contiguous U.S. during the study period, making landfall in NorthCarolina in August 2011 as a Category 1 hurricane and later making a second landfall in NewJersey as a tropical storm. Mapping the relative distribution of reported hurricane experienceshowed that respondents from eastern North Carolina through northern New Englandwere significantly more likely than respondents elsewhere in the country to reportexperiencing a hurricane, with a rate ranging from 20 to 35 % (as compared to lessthan 5 % in the West). This region corresponds to the area affected by HurricaneIrene. Although rainfall from Tropical Storm Lee caused flooding in the Southeastthrough Mid-Atlantic regions in 2011, respondents in those areas did not show anelevated probability of reporting hurricane experience—possibly because the stormwas never classified as a hurricane.
The study period was an abnormally active tornado year in the U.S., with seven majortornado outbreaks, 1,691 confirmed tornadoes, 551 deaths, and over one billion dollars indamages (NCDC 2012). In contrast to the analysis of hurricane experience, the analysis oftornadoes includes many events with different characteristics. Mapping the relative distributionof reported tornado experience showed that respondents in the southern Midwest and
384 Climatic Change (2014) 127:381–389

Southeast were significantly more likely than the national average to report that they hadexperienced a tornado, ranging from 25 to 35 % (as compared to less than 5 % in the PacificNorthwest). The region of reported experience of tornadoes corresponds with theregion that suffered the highest rate of deaths and property damage from tornadoesin 2011.
Drought also affected large areas of the U.S. in 2011 through spring 2012, with 56 % of theU.S. in abnormally dry conditions and 19 % of the U.S. in severe drought as of March 27,2012. Drought was concentrated in the Southwest, Southern Plains, and Southeast. Theseregions corresponded with areas where respondents were significantly more likely than thenational average to report that they had experienced a drought. For example, 75 % ofrespondents in southern Texas reported that they had experienced a drought, compared to lessthan 20 % of respondents in the Northeast.
We compared the distances among respondents and the nearest recorded impacts of thedifferent types of extreme weather events to identify the spatial extent of the shadow ofexperience—the area in which people are more likely to report experiencing an event.Figure 2a shows the probability that a respondent reported experiencing a hurricane versustheir distance from locations affected by Hurricane/Tropical Storm Irene, as compared to the
Personally experienced tornado (n=187)
0
0.2
0.4
0.6
0.8
1
Pr(to
rnad
o ex
perie
nce)
p < 0.05 p < 0.01
0
0.2
0.4
0.6
0.8
1Personally experienced hurricane (n=128)
Pr(h
urric
ane
expe
rienc
e)
p < 0.05 p < 0.01
Personally experienced drought (n=316)
0
0.2
0.4
0.6
0.8
1
Pr(d
roug
ht e
xper
ienc
e)p < 0.05 p < 0.01
No
Yes
Pres
iden
tial d
isas
ter d
ecla
ratio
n
Tornado-related disaster declarations
Tornado track
1
0
13
26
39
52
65
Wee
ks
Severe drought duration
No
Yes
Pres
iden
tial d
isas
ter d
ecla
ratio
n
Hurricane-related disaster declarations
Track of Hurricane (Tropical Storm) Irene
Fig. 1 Spatial distribution of recorded extreme weather events (left) and reported personal experience (right)
Climatic Change (2014) 127:381–389 385

unweighted national baseline. The shadow of experience for Irene extended beyond the areadirectly affected by the storm: respondents within 820 km of locations with recorded impactswere significantly more likely (up to 3.3 times greater than the national baseline) to report thatthey had experienced a hurricane (p<0.05). However, even within areas directly affected byIrene, no more than 45 % of respondents reported that they had experienced a hurricane,possibly due to the fact that it weakened from a hurricane to a tropical storm just prior to itssecond landfall.
Figure 2b–f depict the probability that a respondent reported experiencing a tornado as afunction of their distance from the nearest tornado track for varying sets of tornadoes ofincreasing magnitude, as compared to the unweighted national baseline. For tornadoes, theshadow of experience grows with the magnitude of the event. For example, respondents within71 km of an EF 0–5 tornado track were significantly more likely to report (p<0.05) that theyhad experienced a tornado, whereas the distance band increased to 121 km for an EF1-5tornado track, 207 km for an EF 2–5 tornado track, 504 km for an EF 3–5 tornado track, and1,150 km for an EF 4–5 tornado.
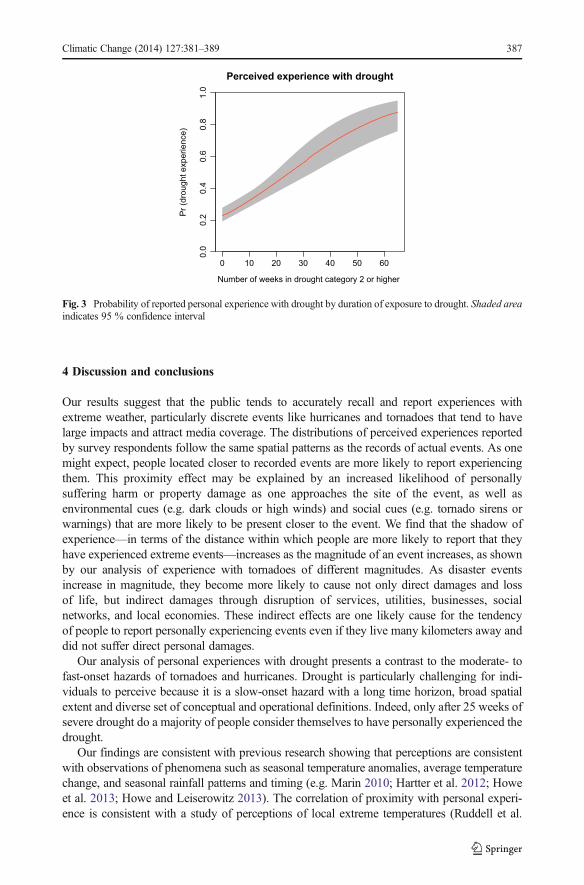
To examine the effects of drought duration on perceived experience, we fit a logit modelpredicting perceived drought experience as a function of the duration of severe drought at thecounty level during the 15 months prior to the survey. As shown in Fig. 3, the probability ofreported experience increases with the duration of exposure to drought (β=0.05, std. error=0.01, p<0.001). On average, each week of severe drought increases the chance of perceiveddrought experience by about 1 %. However, only in areas exposed to at least 25 weeks ofsevere drought conditions were the majority of people (>50 %) likely to report that they hadexperienced a drought.
0 50 100 150 200 250
0.0
0.2
0.4
0.6
0.8
1.0
Nearest tornado track, EF0-EF5 (km)Pr
(tor
nado
exp
erie
nce)
Tornado (EF0-5)
0 50 100 150 200 250
0.0
0.2
0.4
0.6
0.8
1.0
Nearest tornado track, EF1-EF5 (km)
Pr (t
orna
do e
xper
ienc
e)0 50 100 150 200 250
0.0
0.2
0.4
0.6
0.8
1.0
Nearest tornado track, EF2-EF5 (km)
Pr (t
orna
do e
xper
ienc
e)
0 50 100 150 200 250
0.0
0.2
0.4
0.6
0.8
1.0
Nearest tornado track, EF3-EF5 (km)
Pr (t
orna
do e
xper
ienc
e)
0 50 100 150 200 250
0.0
0.2
0.4
0.6
0.8
1.0
Nearest tornado track, EF4-EF5 (km)Pr
(tor
nado
exp
erie
nce)
0 200 400 600 800
0.0
0.2
0.4
0.6
0.8
1.0
Nearest tropical cyclone record (km)
Pr (h
urric
ane
expe
rienc
e)
Hurricane
Local probability (95% CI) Baseline probability
Tornado (EF1-5)
Tornado (EF2-5) Tornado (EF3-5) Tornado (EF4-5)
Probability of reported personal experience by event type, distance to nearest event, & magnitude
a b c
d e f
Fig. 2 Probability of reported personal experience by distance to nearest event record, as compared to nationalbaseline, for hurricanes (a) and tornadoes of magnitude EF0-5 (b), EF 1–5 (c), EF 2–5 (d), EF 3–5, and EF 4–5(f). Note the difference in the x-axis between (a) and (b–e). Shaded areas represent 95 % confidence intervals ofthe proportion of respondents who reported personal within each distance band
386 Climatic Change (2014) 127:381–389
4 Discussion and conclusions
Our results suggest that the public tends to accurately recall and report experiences withextreme weather, particularly discrete events like hurricanes and tornadoes that tend to havelarge impacts and attract media coverage. The distributions of perceived experiences reportedby survey respondents follow the same spatial patterns as the records of actual events. As onemight expect, people located closer to recorded events are more likely to report experiencingthem. This proximity effect may be explained by an increased likelihood of personallysuffering harm or property damage as one approaches the site of the event, as well asenvironmental cues (e.g. dark clouds or high winds) and social cues (e.g. tornado sirens orwarnings) that are more likely to be present closer to the event. We find that the shadow ofexperience—in terms of the distance within which people are more likely to report that theyhave experienced extreme events—increases as the magnitude of an event increases, as shownby our analysis of experience with tornadoes of different magnitudes. As disaster eventsincrease in magnitude, they become more likely to cause not only direct damages and lossof life, but indirect damages through disruption of services, utilities, businesses, socialnetworks, and local economies. These indirect effects are one likely cause for the tendencyof people to report personally experiencing events even if they live many kilometers away anddid not suffer direct personal damages.
Our analysis of personal experiences with drought presents a contrast to the moderate- tofast-onset hazards of tornadoes and hurricanes. Drought is particularly challenging for indi-viduals to perceive because it is a slow-onset hazard with a long time horizon, broad spatialextent and diverse set of conceptual and operational definitions. Indeed, only after 25 weeks ofsevere drought do a majority of people consider themselves to have personally experienced thedrought.
Our findings are consistent with previous research showing that perceptions are consistentwith observations of phenomena such as seasonal temperature anomalies, average temperaturechange, and seasonal rainfall patterns and timing (e.g. Marin 2010; Hartter et al. 2012; Howeet al. 2013; Howe and Leiserowitz 2013). The correlation of proximity with personal experi-ence is consistent with a study of perceptions of local extreme temperatures (Ruddell et al.
0 10 20 30 40 50 60
0.0
0.2
0.4
0.6
0.8
1.0
Perceived experience with drought
Number of weeks in drought category 2 or higher
Pr (d
roug
ht e
xper
ienc
e)
Fig. 3 Probability of reported personal experience with drought by duration of exposure to drought. Shaded areaindicates 95 % confidence interval
Climatic Change (2014) 127:381–389 387

2012), which found that perceptions were related to local rather than distant environmentalfactors.
These findings have important implications for disaster preparedness efforts and efforts toeducate people about climate change in the context of extreme weather events. By mapping theshadows of experience of extremeweather, we highlight where disaster preparedness and climateeducation efforts could be the most effective after an event, since people who did not previouslyaccept the reality of climate change sometimes change their minds when they are personallyaffected by extreme events (Rudman et al. 2013). TV weathercasters, for example, can provideimportant climate change context for extreme weather events; many are interested in doing so(Maibach et al. 2011), andwhen they do, their viewers learn important climate information (Zhaoet al. 2014). For slow-onset events like drought, communication efforts may need to focus onencouraging public recognition of the phenomenon as well as preparedness behaviors.
We note that our data are limited to retrospective assessments of personal experiences overone year for several extreme weather events, and our findings depict only a rough map of theshadow of experience for these extreme weather events (Stone 2001). We used a simplifiedyes/no measure of personal experience, and future research should address the different waysin which people may experience extreme events. For example, the effect of proximity onpersonal experience may be due to a combination of different types of experience suchenvironmental cues, social cues, indirect experience via social networks and media coverage,affective responses, and direct impacts. Future research should also investigate the contours ofthese shadows of experience in more detail, analyze their durability over time, explore howthey aggregate across multiple events, and examine different types of hazards with differentspatial and temporal characteristics to better understand the mechanisms that convert any oneevent into a memorable experience that shapes subsequent perceptions and behavior.
References
Akerlof K, Maibach EW, Fitzgerald D et al (2013) Do people “personally experience” global warming, and if sohow, and does it matter? Glob Environ Chang 21:81–91. doi:10.1016/j.gloenvcha.2012.07.006
Baddeley A, Turner R (2005) Spatstat: an R package for analyzing spatial point patterns. J Stat Softw 12:1–42Brody SD, Zahran S, Vedlitz A, Grover H (2008) Examining the relationship between physical vulnerability and
public perceptions of global climate change in the United States. Environ Behav 40:72–95Callegaro M, DiSogra C (2008) Computing response metrics for online panels. Public Opin Q 72:1008–1032.
doi:10.1093/poq/nfn065Chang L, Krosnick JA (2009) National surveys via RDD telephone interviewing versus the internet: comparing
sample representativeness and response quality. Public Opin Q 73:641–678. doi:10.1093/poq/nfp075Coumou D, Rahmstorf S (2012) A decade of weather extremes. Nat Clim Chang 2:491–496. doi:10.1038/
nclimate1452Davies TM, Hazelton ML, Marshall JC (2011) Sparr: analyzing spatial relative risk using fixed and adaptive
kernel density estimation in R. J Stat Softw 39:1–14Egan PJ, Mullin M (2012) Turning personal experience into political attitudes: the effect of local weather on
Americans’ perceptions about global warming. J Polit 74:796–809. doi:10.1017/S0022381612000448Goebbert K, Jenkins-Smith HC, Klockow K et al (2012) Weather, climate and worldviews: the sources and
consequences of public perceptions of changes in local weather patterns. Weather Clim Soc 4:132–144. doi:10.1175/WCAS-D-11-00044.1
Hamilton LC, Stampone MD (2013) Blowin’ in the wind: short-term weather and belief in anthropogenic climatechange. Weather Clim Soc 5:112–119. doi:10.1175/WCAS-D-12-00048.1
Hartter J, Stampone MD, Ryan SJ et al (2012) Patterns and perceptions of climate change in a biodiversityconservation hotspot. PLoS ONE 7:e32408. doi:10.1371/journal.pone.0032408
Howe PD, Leiserowitz A (2013) Who remembers a hot summer or a cold winter? The asymmetric effect ofbeliefs about global warming on perceptions of local climate conditions in the U.S. Glob Environ Chang 23:1488–1500. doi:10.1016/j.gloenvcha.2013.09.014
388 Climatic Change (2014) 127:381–389

Howe PD, Markowitz EM, Lee TM et al (2013) Global perceptions of local temperature change. Nat Clim Chang3:352–356. doi:10.1038/nclimate1768
IPCC (2012) Managing the risks of extreme events and disasters to advance climate change adaptation.Cambridge University Press, Cambridge
Leiserowitz A, Maibach E, Roser-Renouf C, Hmielowski JD (2012) Extreme weather, climate & preparedness inthe American mind. Yale University and George Mason University, Yale Project on Climate ChangeCommunication, New Haven, CT
Maibach EW, Cobb S, Leiserowitz A et al (2011) A national survey of television meteorologists about climatechange: education. George Mason University Center for Climate Change Communication, Fairfax
Marin A (2010) Riders under storms: contributions of nomadic herders’ observations to analysing climate changein Mongolia. Glob Environ Chang 20:162–176. doi:10.1016/j.gloenvcha.2009.10.004
Marx SM, Weber EU, Orlove BS et al (2007) Communication and mental processes: experiential and analyticprocessing of uncertain climate information. Glob Environ Chang 17:47–58
McGee TK, McFarlane BL, Varghese J (2009) An examination of the influence of hazard experience on wildfirerisk perceptions and adoption of mitigation measures. Soc Nat Resour 22:308. doi:10.1080/08941920801910765
Myers TA, Maibach EW, Roser-Renouf C et al (2013) The relationship between personal experience and belief inthe reality of global warming. Nat Clim Chang 3:343–347. doi:10.1038/nclimate1754
NCDC (2013) Storm Events Database | National Climatic Data Center. In: Natl Ocean Atmospheric Adm. http://www.ncdc.noaa.gov/stormevents/. Accessed 17 Sept 2013
NCDC (2012) State of the climate: annual 2011. National Climatic Data Center, National Oceanic andAtmospheric Administration
Peterson TC, Stott PA, Herring S (2012) Explaining extreme events of 2011 from a climate perspective. Bull AmMeteorol Soc 93:1041–1067. doi:10.1175/BAMS-D-12-00021.1
Ruddell D, Harlan SL, Grossman-Clarke S, Chowell G (2012) Scales of perception: public awareness of regionaland neighborhood climates. Clim Chang 111:581–607. doi:10.1007/s10584-011-0165-y
Rudman LA, McLean MC, Bunzl M (2013) When truth is personally inconvenient, attitudes change: the impactof extreme weather on implicit support for green politicians and explicit climate-change beliefs. Psychol Sci24:2290–2296. doi:10.1177/0956797613492775
Silver A, Andrey J (2014) The influence of previous disaster experience and sociodemographics on protectivebehaviors during two successive tornado events. Weather Clim Soc 6:91–103. doi:10.1175/WCAS-D-13-00026.1
SPC (2013) Storm Prediction Center severe weather GIS (SVRGIS). In: Natl Ocean Atmospheric Adm NatlWeather Serv. http://www.spc.noaa.gov/gis/svrgis/. Accessed 17 Sept 2013
Spence A, Poortinga W, Butler C, Pidgeon NF (2011) Perceptions of climate change and willingness to saveenergy related to flood experience. Nat Clim Chang 1:46–49. doi:10.1038/nclimate1059
Stoffle RW, Traugott MW, Stone JV et al (1991) Risk perception mapping: using ethnography to define thelocally affected population for a low-level radioactive waste storage facility in Michigan. Am Anthropol 93:611–635. doi:10.1525/aa.1991.93.3.02a00050
Stone JV (2001) Risk perception mapping and the Fermi II nuclear power plant: toward an ethnography of socialaccess to public participation in Great Lakes environmental management. Environ Sci Pol 4:205–217
Tierney KJ (2007) From the margins to the mainstream? Disaster research at the crossroads. Annu Rev Sociol 33:503–525. doi:10.1146/annurev.soc.33.040406.131743
Wachinger G, Renn O, Begg C, Kuhlicke C (2013) The risk perception paradox—implications for governanceand communication of natural hazards. Risk Anal 33:1049–1065. doi:10.1111/j.1539-6924.2012.01942.x
Zaalberg R, Midden C, Meijnders A, McCalley T (2009) Prevention, adaptation, and threat denial: floodingexperiences in the Netherlands. Risk Anal 29:1759–1778
Zaval L, Keenan EA, Johnson EJ, Weber EU (2014) How warm days increase belief in global warming. NatClim Chang 4:143–147. doi:10.1038/nclimate2093
Zhao X, Maibach E, Gandy J et al (2014) Climate change education through TV weathercasts: results of a fieldexperiment. Bull Am Meteorol Soc 95:117–130. doi:10.1175/BAMS-D-12-00144.1
Climatic Change (2014) 127:381–389 389