Embed Size (px)
Citation preview
1
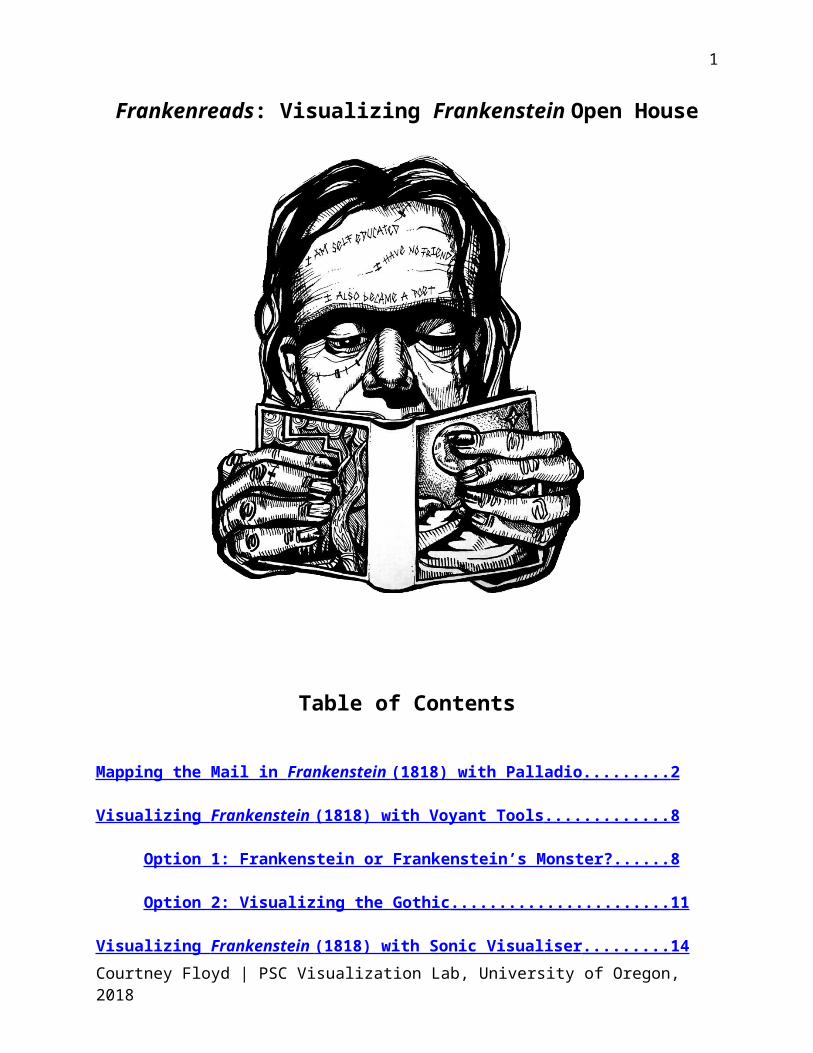
Frankenreads: Visualizing Frankenstein Open House
Table of Contents
Mapping the Mail in Frankenstein (1818) with Palladio .................................................. 2
Visualizing Frankenstein (1818) with Voyant Tools ......................................................... 8
Option 1: Frankenstein or Frankenstein’s Monster? ........................................... 8
Option 2: Visualizing the Gothic ............................................................................ 11
Visualizing Frankenstein (1818) with Sonic Visualiser .................................................... 14
Instructions for accessing and using SAGE2 in the PSC Visualization Lab .................. 16
Courtney Floyd | PSC Visualization Lab, University of Oregon, 2018
2
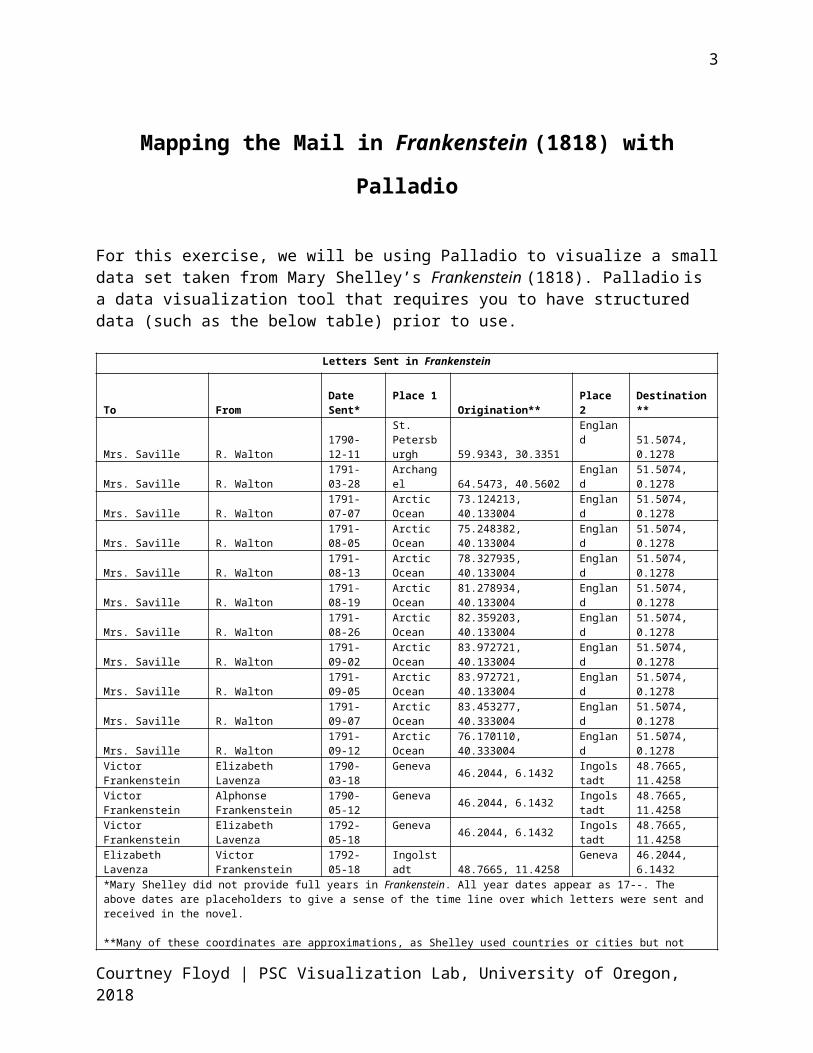
Mapping the Mail in Frankenstein (1818) with Palladio
For this exercise, we will be using Palladio to visualize a small data set taken from Mary Shelley’s Frankenstein (1818). Palladio is a data visualization tool that requires you to have structured data (such as the below table) prior to use.
Letters Sent in Frankenstein
To From Date Sent* Place 1 Origination** Place 2 Destination**
Mrs. Saville R. Walton 1790-12-11St. Petersburgh 59.9343, 30.3351
England51.5074, 0.1278
Mrs. Saville R. Walton 1791-03-28Archangel
64.5473, 40.5602England
51.5074, 0.1278
Mrs. Saville R. Walton 1791-07-07Arctic Ocean 73.124213, 40.133004
England51.5074, 0.1278
Mrs. Saville R. Walton 1791-08-05Arctic Ocean 75.248382, 40.133004
England51.5074, 0.1278
Mrs. Saville R. Walton 1791-08-13Arctic Ocean 78.327935, 40.133004
England51.5074, 0.1278
Mrs. Saville R. Walton 1791-08-19Arctic Ocean 81.278934, 40.133004
England51.5074, 0.1278
Mrs. Saville R. Walton 1791-08-26Arctic Ocean 82.359203, 40.133004
England51.5074, 0.1278
Mrs. Saville R. Walton 1791-09-02Arctic Ocean 83.972721, 40.133004
England51.5074, 0.1278
Mrs. Saville R. Walton 1791-09-05Arctic Ocean 83.972721, 40.133004
England51.5074, 0.1278
Mrs. Saville R. Walton 1791-09-07Arctic Ocean 83.453277, 40.333004
England51.5074, 0.1278
Mrs. Saville R. Walton 1791-09-12Arctic Ocean 76.170110, 40.333004
England51.5074, 0.1278
Victor Frankenstein Elizabeth Lavenza 1790-03-18Geneva 46.2044, 6.1432 Ingolstad
t 48.7665, 11.4258
Victor Frankenstein Alphonse Frankenstein 1790-05-12Geneva 46.2044, 6.1432 Ingolstad
t 48.7665, 11.4258
Victor Frankenstein Elizabeth Lavenza 1792-05-18Geneva 46.2044, 6.1432 Ingolstad
t 48.7665, 11.4258
Elizabeth Lavenza Victor Frankenstein 1792-05-18Ingolstadt
48.7665, 11.4258Geneva 46.2044, 6.1432
*Mary Shelley did not provide full years in Frankenstein. All year dates appear as 17--. The above dates are placeholders to give a sense of the time line over which letters were sent and received in the novel.
**Many of these coordinates are approximations, as Shelley used countries or cities but not addresses.
Although the above data set is necessarily incomplete (the sending and receipt of letters are mentioned 49 times in the novel, but not always with specified dates or senders), using digital tools to work with it provides an interesting sense of the scale of letter writing in the novel.
Time: 10 minutes
Tools: Palladio (free digital tool), spreadsheet populated with data (.csv file)
Takeaways: using tools like Palladio in the Viz Lab to process data you’ve already gathered can help you showcase the strengths of your research, approach your data from a new perspective, and engage others.
Courtney Floyd | PSC Visualization Lab, University of Oregon, 2018
3
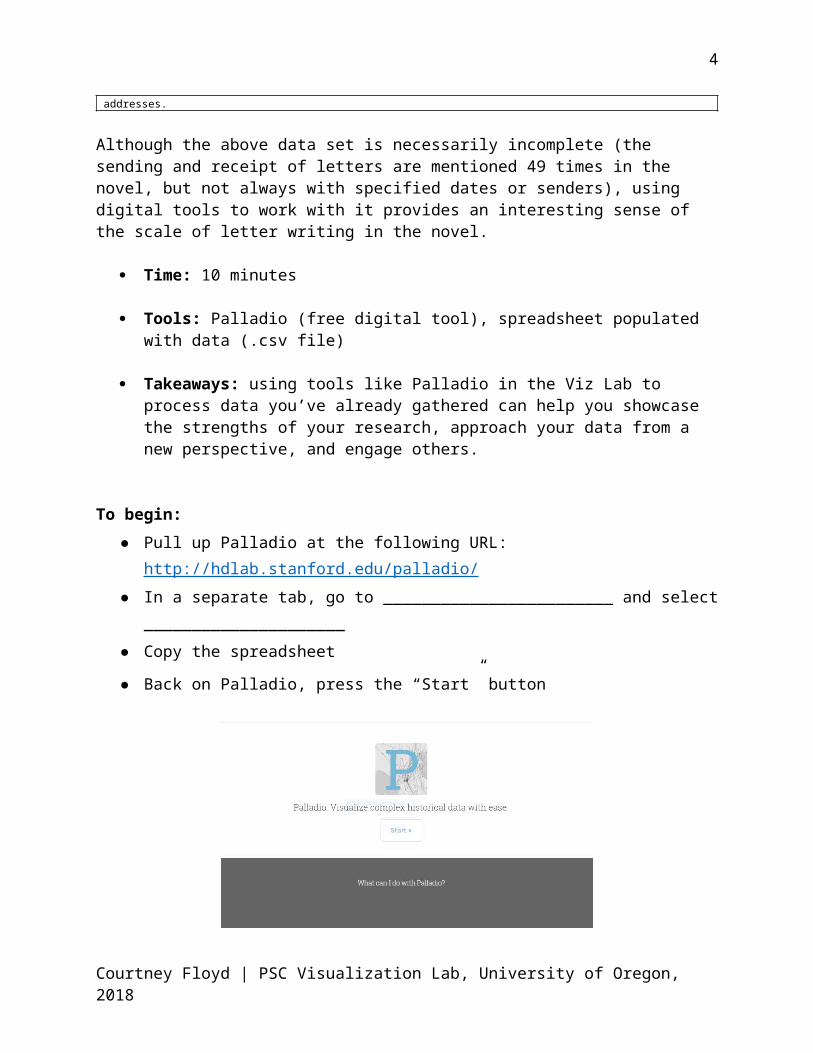
To begin:
● Pull up Palladio at the following URL: http://hdlab.stanford.edu/palladio/
● In a separate tab, go to ________________________ and select _____________________
● Copy the spreadsheet
● Back on Palladio, press the “Start” button
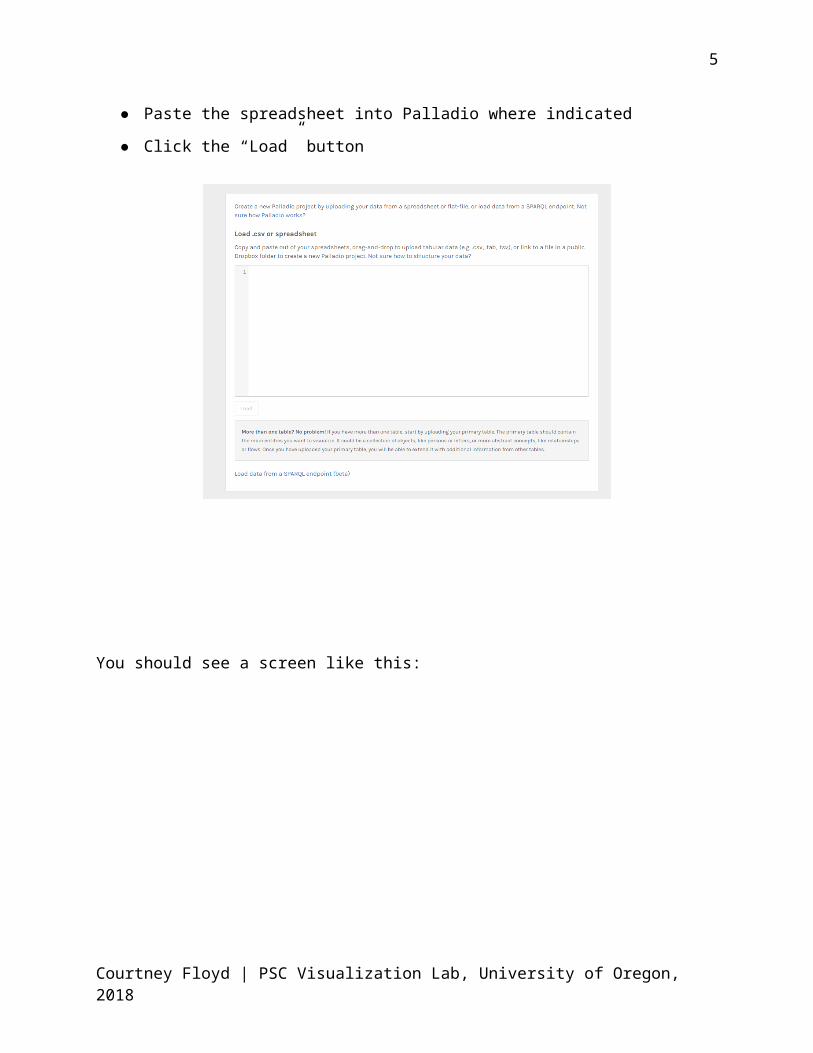
● Paste the spreadsheet into Palladio where indicated
● Click the “Load” button
Courtney Floyd | PSC Visualization Lab, University of Oregon, 2018
4
You should see a screen like this:
● At the top of the page, select “Map”
● On the right of the page, press the “New layer” button
Courtney Floyd | PSC Visualization Lab, University of Oregon, 2018
5
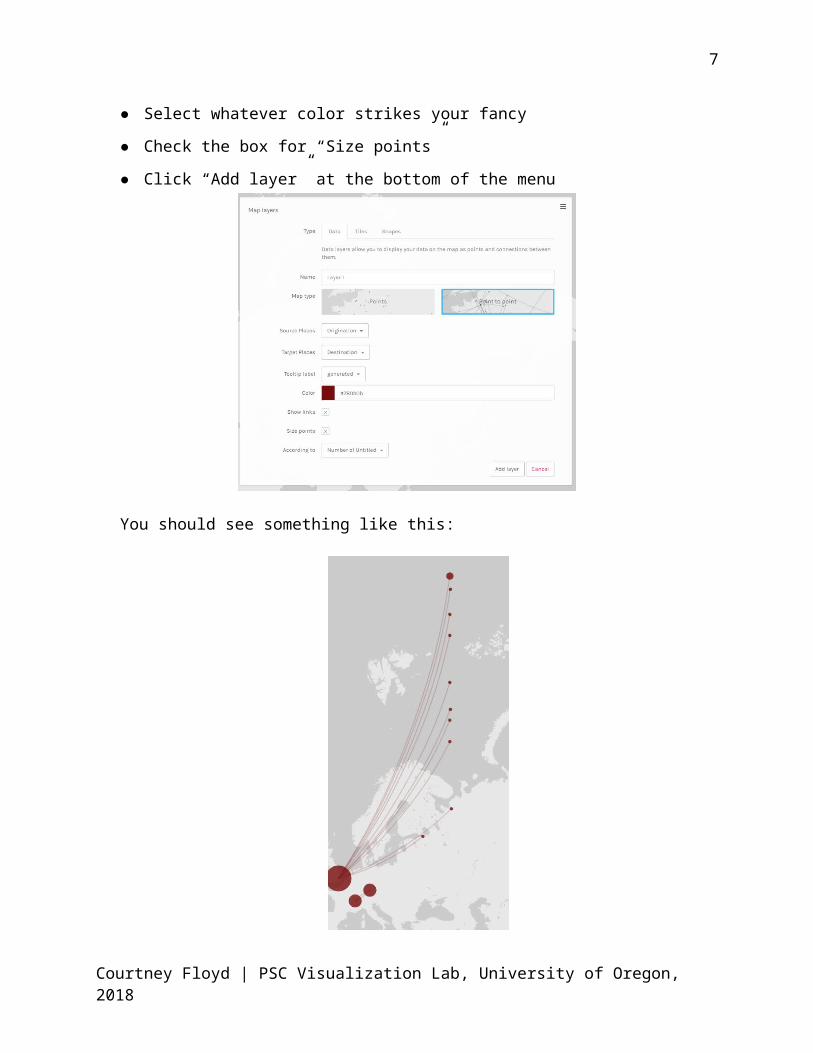
● On the resulting menu, select “Point to Point” for “Map type”
● For “Source Places” select “Origination”
● For “Target Places” select “Destination”
● Select whatever color strikes your fancy
● Check the box for “Size points”
● Click “Add layer” at the bottom of the menu
You should see something like this:
Courtney Floyd | PSC Visualization Lab, University of Oregon, 2018

6
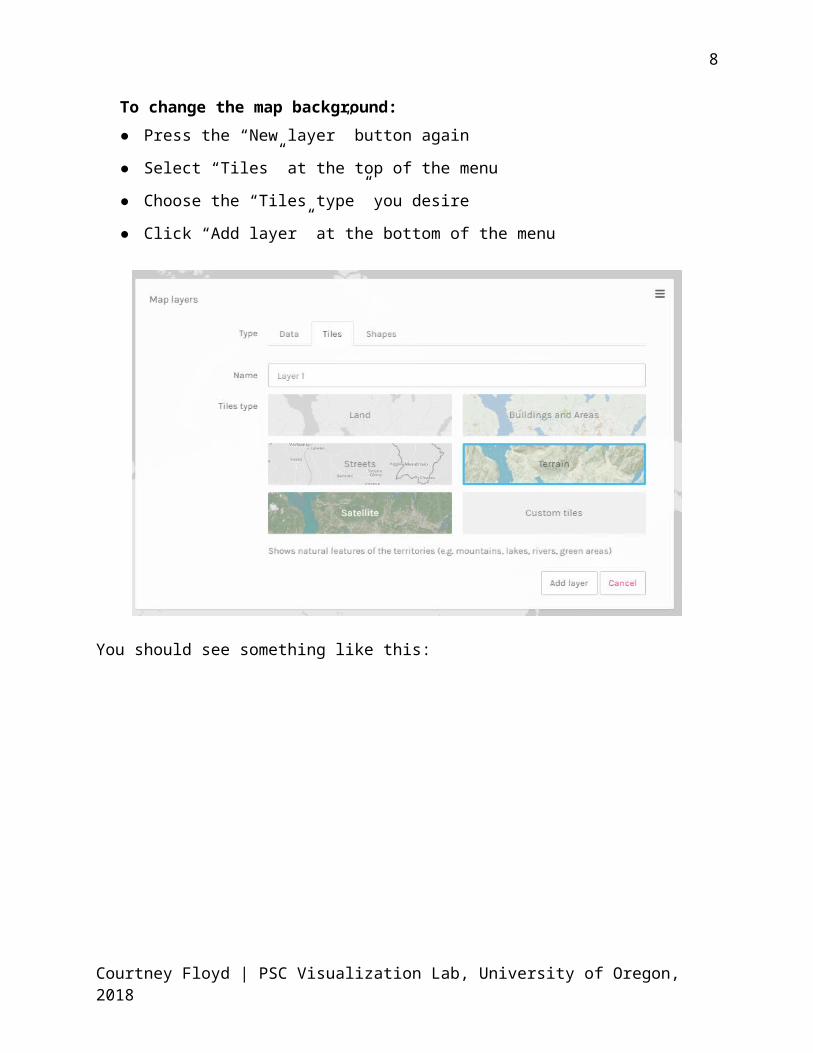
To change the map background:
● Press the “New layer” button again
● Select “Tiles” at the top of the menu
● Choose the “Tiles type” you desire
● Click “Add layer” at the bottom of the menu
Courtney Floyd | PSC Visualization Lab, University of Oregon, 2018
7
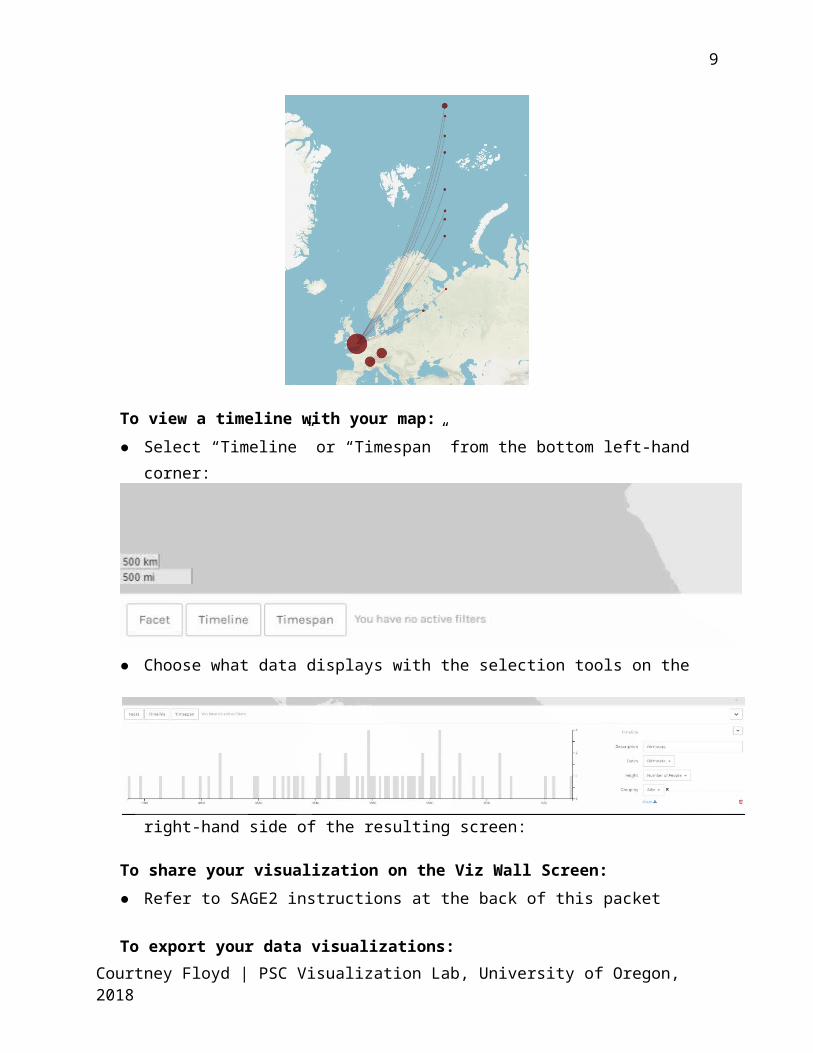
You should see something like this:
To view a timeline with your map:
● Select “Timeline” or “Timespan” from the bottom left-hand corner:
Courtney Floyd | PSC Visualization Lab, University of Oregon, 2018
8
● Choose what data displays with the selection tools on the right-hand side of the resulting
screen:
To share your visualization on the Viz Wall Screen:
● Refer to SAGE2 instructions at the back of this packet
To export your data visualizations:
● Currently, the only way to do this is to use your device’s screenshot or screengrab feature
To learn about Palladio’s other features:
● http://hdlab.stanford.edu/palladio/help
USE DIFFERENT COORDINATES TO CHANGE THE SHIP’S DIRECTORY,
OR TRY WITH ANOTHER DATA SET!
Courtney Floyd | PSC Visualization Lab, University of Oregon, 2018
9
Visualizing Frankenstein (1818) with Voyant Tools
For this exercise, we will be using Voyant Tools to analyze the entire text of Frankenstein (and, optionally, a corpus of other nineteenth-century gothic novels). Voyant Tools is a suite of digital tools that allows you to analyze individual texts and corpuses (groups of texts) in a variety of ways. This document will walk you through two different examples.
Time: ~10 minutes
Tools: Voyant Tools, plain text file or text URL
Takeaways: Text analysis and visualization can reveal patterns in texts or corpuses which clarify research questions you have and generate new questions. In the Viz Lab, these patterns are even clearer because you can see more detail in dense word clouds and other visualizations.
Option 1: Frankenstein or Frankenstein’s Monster? In this version of the exercise, we will be using Voyant Tools “Cirrus” and “Links” features to analyze the text of the novel in order to answer this question: what term should we use to refer to the monster? Frankenstein? Frankenstein’s monster? Or something else entirely?
1. To begin, go to www.gutenberg.org2. Search for Frankenstein3. Select the first result4. Copy the text of the novel5. In another window, open https://voyant-tools.org6. Paste the text of the novel into the box you see there, and click the blue rectangle
“Reveal” button
Courtney Floyd | PSC Visualization Lab, University of Oregon, 2018
10
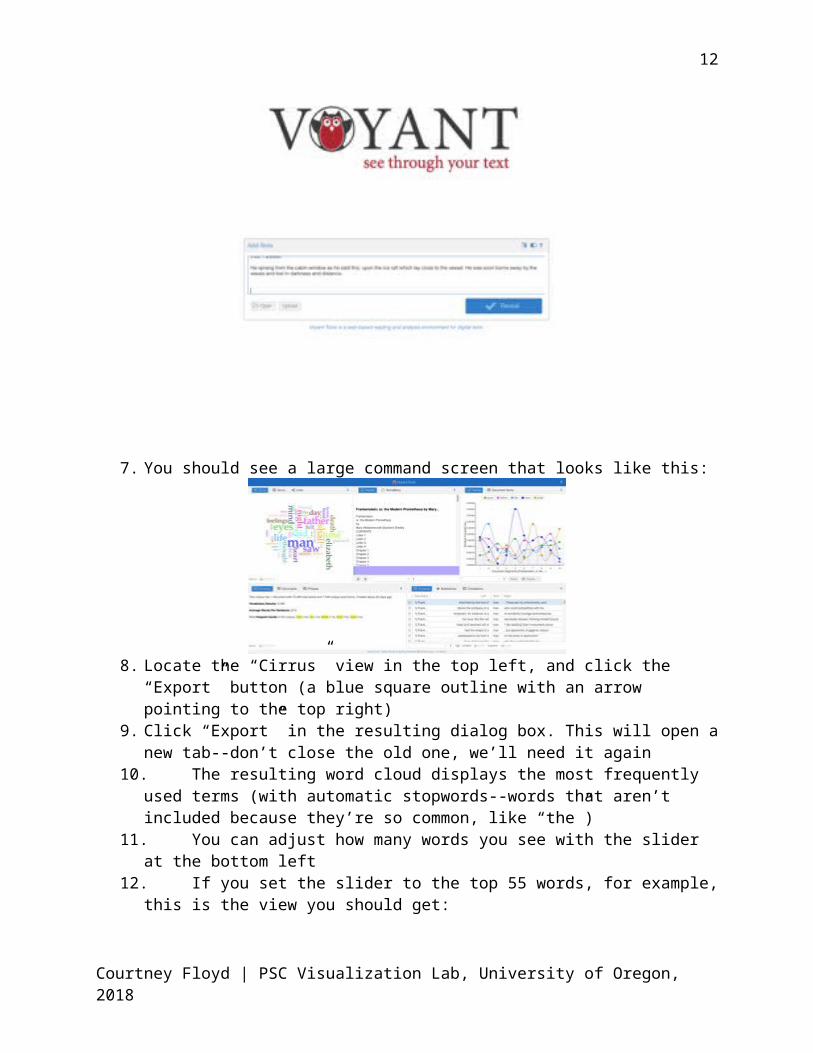
7. You should see a large command screen that looks like this:
8. Locate the “Cirrus” view in the top left, and click the “Export” button (a blue square outline with an arrow pointing to the top right)
9. Click “Export” in the resulting dialog box. This will open a new tab--don’t close the old one, we’ll need it again
10. The resulting word cloud displays the most frequently used terms (with automatic stopwords--words that aren’t included because they’re so common, like “the”)
11. You can adjust how many words you see with the slider at the bottom left12. If you set the slider to the top 55 words, for example, this is the view you should get:
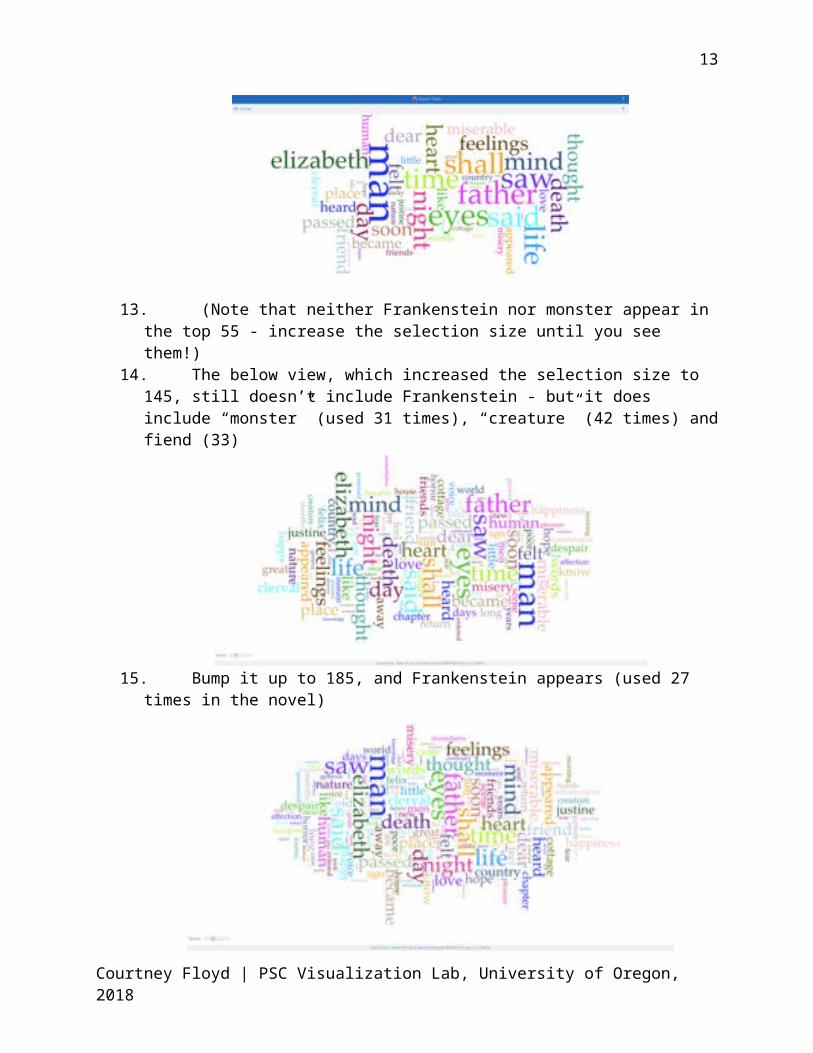
13. (Note that neither Frankenstein nor monster appear in the top 55 - increase the selection size until you see them!)
14. The below view, which increased the selection size to 145, still doesn’t include Frankenstein - but it does include “monster” (used 31 times), “creature” (42 times) and fiend (33)
Courtney Floyd | PSC Visualization Lab, University of Oregon, 2018
11
15. Bump it up to 185, and Frankenstein appears (used 27 times in the novel)
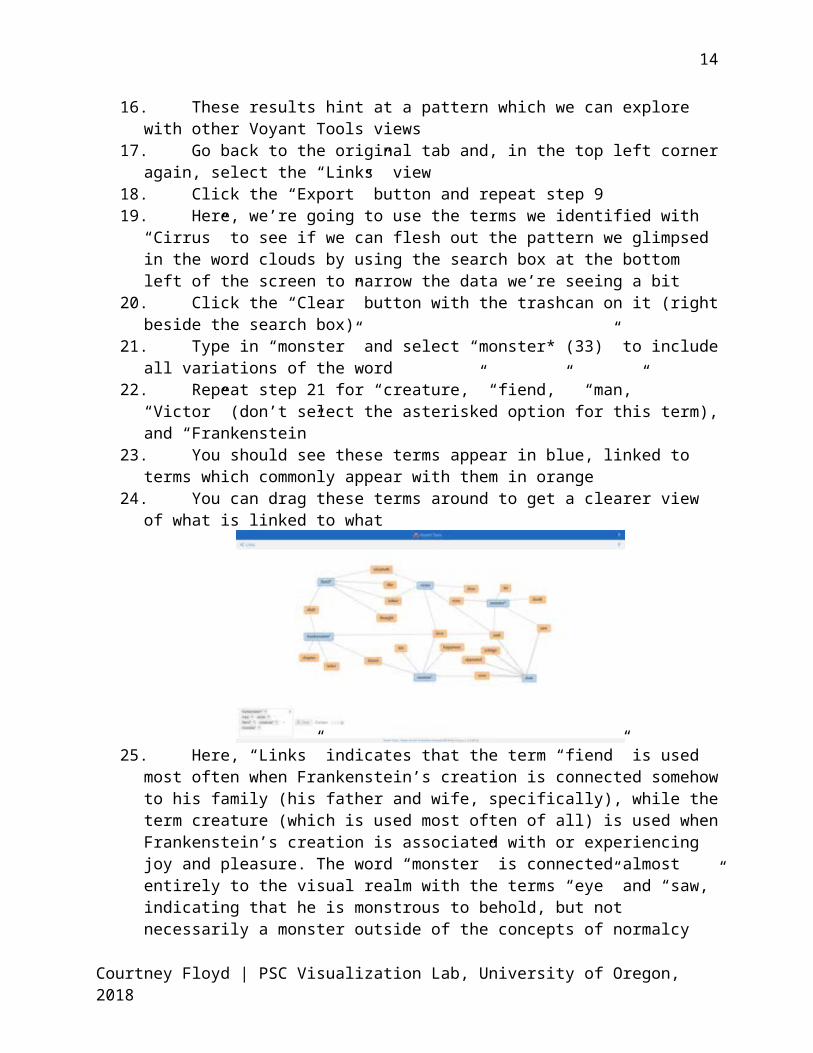
16. These results hint at a pattern which we can explore with other Voyant Tools views17. Go back to the original tab and, in the top left corner again, select the “Links” view18. Click the “Export” button and repeat step 919. Here, we’re going to use the terms we identified with “Cirrus” to see if we can flesh out
the pattern we glimpsed in the word clouds by using the search box at the bottom left of the screen to narrow the data we’re seeing a bit
20. Click the “Clear” button with the trashcan on it (right beside the search box)21. Type in “monster” and select “monster* (33)” to include all variations of the word22. Repeat step 21 for “creature,” “fiend,” “man,” “Victor” (don’t select the asterisked
option for this term), and “Frankenstein”23. You should see these terms appear in blue, linked to terms which commonly appear with
them in orange24. You can drag these terms around to get a clearer view of what is linked to what
Courtney Floyd | PSC Visualization Lab, University of Oregon, 2018
12
25. Here, “Links” indicates that the term “fiend” is used most often when Frankenstein’s creation is connected somehow to his family (his father and wife, specifically), while the term creature (which is used most often of all) is used when Frankenstein’s creation is associated with or experiencing joy and pleasure. The word “monster” is connected almost entirely to the visual realm with the terms “eye” and “saw,” indicating that he is monstrous to behold, but not necessarily a monster outside of the concepts of normalcy and beauty… (the term “Frankenstein” is never used to refer to the creature, but more text analysis could reveal that it is oftener connected to monstrousness--try it for yourself and see!)
26. To save a copy of your visualizations, take a screenshot or screen grab (easiest), or, click the “Export” button, select the “Export View” dropdown, and choose HTML snippet
To share your visualization on the Viz Wall Screen:
● Refer to SAGE2 instructions at the back of this packet
So, next time someone corrects you for calling Frankenstein’s creature Frankenstein (or next time you correct someone else), refer back to this and have a more nuanced discussion!
Option 2: Visualizing the GothicIn this exercise, we’ll take a more open-ended approach to a corpus of eighteenth- and nineteenth-century Gothic novels (Frankenstein, Wuthering Heights, Dracula, The Sorrows of Satan, and The Mysteries of Udolpho) to see what patterns we can identify by defining stopwords, and using the “Cirrus,” “StreamGraph,” and “Trends” tools.
1. Because we’re dealing with a large corpus, I’ve preloaded it into Voyant Tools for you: https://voyant-tools.org/?corpus=5529c2bd927a84ab74adc351973c5bda&panels=corpusterms,reader,contexts,summary,correlations&lang=en
2. Voyant Tools doesn’t like to remember stopwords, so you’ll need to add your own to filter out some of the more common words (like character’s names). To do so, click the above link and when it has loaded, hover over the menu bar near the “Cirrus” tool until you see a little toggle switch and click it
Courtney Floyd | PSC Visualization Lab, University of Oregon, 2018
13
3. In the resulting dialog box, the first item is “Stopwords.” Click the dropdown menu beside it and select “English” from the list. Then, click the “Edit List” button beside the dropdown menu to add custom stopwords. I’d recommend inserting the character’s names here as well as “said” and “like.” One line at a time, enter: Frankenstein, Elizabeth, Clerval, Catherine, Heathcliff, Cathy, Hareton, Nelly, Hindley, Sibyl, Lucio, Rimanez, Lucy, Mina, Jonathan, Harker, Murray, Godalming, Arthur, Jack, Seward, Van Helsing, Justine, Felix, Emily, Morano, Valancourt, St, Aubert, and Dracula
4. Press the “Confirm” button5. Locate the “Cirrus” view in the top left, and click the “Export” button (a blue square
outline with an arrow pointing to the top right)6. Click “Export” in the resulting dialog box. This will open a new tab--don’t close the old
one, we’ll need it again7. The resulting word cloud displays the most frequently used terms (with automatic
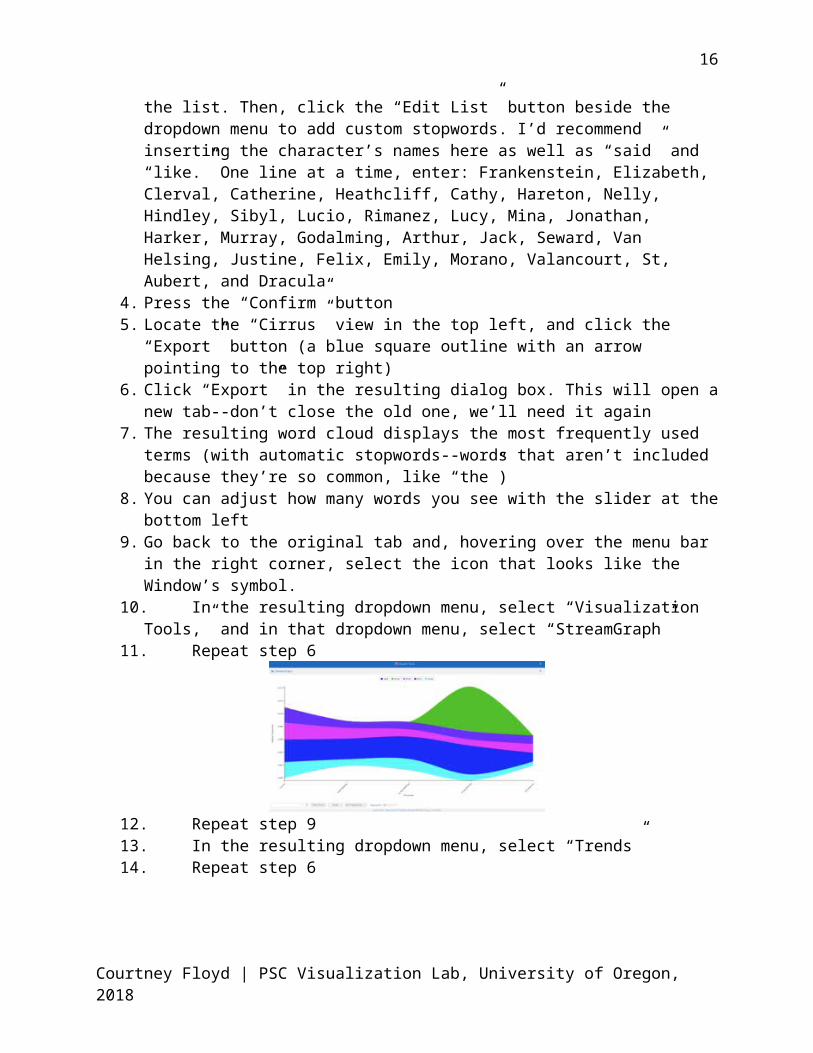
stopwords--words that aren’t included because they’re so common, like “the”)8. You can adjust how many words you see with the slider at the bottom left9. Go back to the original tab and, hovering over the menu bar in the right corner, select the
icon that looks like the Window’s symbol. 10. In the resulting dropdown menu, select “Visualization Tools,” and in that dropdown
menu, select “StreamGraph”11. Repeat step 6
12. Repeat step 913. In the resulting dropdown menu, select “Trends”14. Repeat step 6
15. Manipulate the data you’re seeing by adding or removing terms16. Right click on words to remove them from the visualization
Courtney Floyd | PSC Visualization Lab, University of Oregon, 2018
14
17. Use the search menu at the bottom of each visualization to add terms (you might refer to the Cirrus visualization to identify the most commonly appearing terms that you’re interested in adding to the other visualizations)
18. Explore the results – what patterns can you identify based on these visualizations? What questions do these visualizations raise for you about Gothic literature and / or the novels in question?
To share your visualization on the Viz Wall Screen:
● Refer to SAGE2 instructions at the back of this packet
Courtney Floyd | PSC Visualization Lab, University of Oregon, 2018

15
Visualizing Frankenstein (1818) with Sonic Visualiser
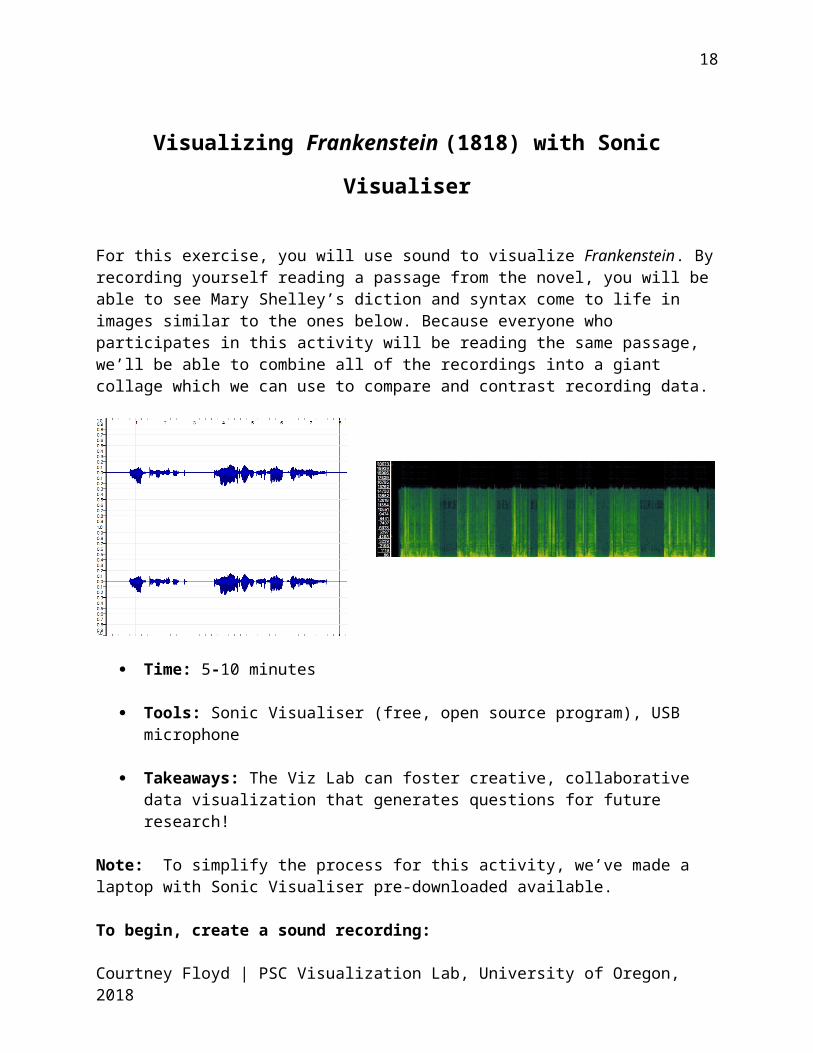
For this exercise, you will use sound to visualize Frankenstein. By recording yourself reading a passage from the novel, you will be able to see Mary Shelley’s diction and syntax come to life in images similar to the ones below. Because everyone who participates in this activity will be reading the same passage, we’ll be able to combine all of the recordings into a giant collage which we can use to compare and contrast recording data.
Time: 5-10 minutes
Tools: Sonic Visualiser (free, open source program), USB microphone
Takeaways: The Viz Lab can foster creative, collaborative data visualization that generates questions for future research!
Note: To simplify the process for this activity, we’ve made a laptop with Sonic Visualiser pre-downloaded available.
To begin, create a sound recording:
● Open Audacity
● Locate the reading prompt on the next page of this packet
● Click the red circle “record” button to begin recording your audio
● Wait 2-3 seconds to capture the room’s ambient noise
● Read the passage on the prompt
● Press the black square “stop” button to end the recording
Courtney Floyd | PSC Visualization Lab, University of Oregon, 2018
16
● Clean up your audio by taking the following steps:o Click and drag over the 2-3 second portion of the recording at the beginning of
the tracko Select the “Effect” menu at the top of the screeno Select “Noise Reduction” from the resulting dropdown menuo Click the “Get Noise Profile” button.o Select your entire recording by clicking on the audio tracko Open the “Effect” menu againo Select “Noise Reduction” againo Click “Ok”
● Export your file by selecting “File” from the menu at the top of the page and choosing “Export,” then “Export as WAV”
● Give the file a non-identifying name such as “frankenreads1” or, if that’s taken, “frankenreads2” and so on
To create a visualization of the recording you just made:
● Open Sonic Visualiser
● Click the folder icon in the menu bar to import your sound file
● Before you manipulate the resulting visualization, save the recording via the following steps:
o Select “File” from the menu at the top of the pageo Select “Save Session As” from the resulting dropdown menu
▪ Please don’t overwrite any previously saved files!!!
● To manipulate the audio visualization:o To change the color of the linear visualization the program automatically
generated, click button 3 on the menu panel on the right side of the screen and select the color you would like from the dropdown list there.
o To change the scale of the visualization (what’s being charted), use the same menu, but select “Meter” or “dB” in the dropdown list labeled “Scale”
o You can experiment with other visual outputs by selecting the “Layer” menu at the top of the page. (Try “Add Spectrogram” and select “all channels mixed,” for example)
o To see two (or more) different visualizations at once, select the “Pane” menu at the top of the page and choose an option from the resulting dropdown list.
● Please save your visualization by:o Selecting “File” from the menu at the top of the pageo Selecting “Export Image File” from the resulting dropdown menu
Courtney Floyd | PSC Visualization Lab, University of Oregon, 2018

17
o Saving the image with the same name you gave the recording itself (i.e., “frankenreads1”)
● From here, you can throw your visualization up onto the big screen using the SAGE2 instructions at the back of this packet!
Reading Prompt:“Are you to be happy while I grovel in the intensity of my wretchedness? You can blast my other passions, but revenge remains—revenge, henceforth dearer than light or food! I may die, but first you, my tyrant and tormentor, shall curse the sun that gazes on your misery. Beware, for I am fearless and therefore powerful.”
Instructions for accessing and using SAGE2 in the PSC
Visualization Lab
Before Arriving
● Step 1 Download the Google Chrome browser: https://www.google.com/chrome/(If you already have Chrome installed, then skip to the next step.)
● Step 2Add the SAGE2 Screen Capture extension to your Chrome browser: https://chrome.google.com/webstore/detail/sage2-screen-capture/mbkfcmpjbkmmdcfocaclghbobhnjfpkk?hl=en
Accessing SAGE2
● Step 1Touch the Viz Wall control panel to “wake” the wall
● Step 2Select “SAGE2” from the menu
● Step 3On your own device, go to the following URL: https://lib-sage2.uoregon.edu/
● Step 4Ask the Visualization Lab Specialist for the password of the day
Using SAGE2 on your own device
Courtney Floyd | PSC Visualization Lab, University of Oregon, 2018
18
● Step 1Click on the cursor button to create a personalized cursor (hit ESC to use another tool!)
● Step 2Add items to the Viz Wall by using the Media Browser (folder button) or Screen Sharing (screen button) functions
Note: in order to interact with these items on the Viz Wall, you will need to click the cursor button again. To manipulate items from your own laptop or device, hit the escape button (esc) and use your mouse or track pad as you normally would.
● Step 3You can resize items you’ve placed on the Viz Wall by clicking the box icon in the top right corner of the item, or by hovering over the bottom right corner until a lighter colored square appears and dragging the item larger or smaller using the square
● Step 4Close items you added to the wall by clicking on the hand icon in the top right corner of the item
Simply close your browser when you are done with your session!Please close all items on the Viz Wall and delete all added media from the Media Browser
at the close of your session in the Viz Lab!
Courtney Floyd | PSC Visualization Lab, University of Oregon, 2018