Embed Size (px)
Citation preview
AC 2012-4615: MAPPING THE BEHAVIORS, MOTIVES, AND PROFES-SIONAL COMPETENCIES OF ENTREPRENEURIALLY MINDED EN-GINEERS IN THEORY AND PRACTICE: AN EMPIRICAL INVESTIGA-TION
Dr. David Pistrui, Acumen Dynamics, LLC
David Pistrui serves as the Managing Director of Acumen Dynamics, LLC, a strategy-based education,training, and research firm that focuses on practical knowledge and skills that help organizations align vi-sion and strategy with execution and performance. Working as an independent scholar, thought leader andadvisor to corporations, family foundations, academic institutions, government agencies and global thinktanks, Pistrui’s activities include strategy development, business succession, assessment modeling, tech-nology transfer, executive education, and social science research. This includes programs and activities inthe United States, Europe, the Middle East, and Asia. Pistrui has held several scholarly appointments inthe U.S. and Europe, including the Coleman Foundation Chair in Entrepreneurship at the Illinois Instituteof Technology, Chicago. Pistrui is a member of the Kern Family Foundation’s Kern EntrepreneurshipEducation Network Advisory Board. In 2009, he was appointed as a Senior Fellow at the Austrian Eco-nomics Center in Vienna.
Dr. John K. Layer, University of EvansvilleMs. Sandra L. Dietrich, Eastern Michigan University
Sandy Dietrich is currently a Ph.D. candidate at Eastern Michigan University. Her dissertation research isfocused on engineering education. She has over twenty years of experience in automotive manufacturingas an Engineer and Manager. She has worked directly at every phase of the design process from conceptto manufacture to service. She has a B.S. in industrial engineering from Kettering University and an M.S.in applied statistics from Oakland University. Dietrich taught statistics at the University of Phoenix whereshe was awarded Outstanding Faculty. She is also a member of the Phi Kappa Phi and Epsilon Pi Tauhonor societies.
c©American Society for Engineering Education, 2012
Page 25.913.1
Mapping the Behaviors, Motives and Professional Competencies of Entrepreneurially Minded Engineers in Theory and Practice:
An Empirical Investigation
American Society for Engineering Education 2012 Annual Conference
June 10 - 13, 2012 San Antonio, Texas
By
David Pistrui, Ph.D. Managing Director
Acumen Dynamics, LLC Assessment Fellow
Kern Family Foundation [email protected]
John K. Layer, Ph.D., P.E.
Director and Assistant Professor, Mechanical Engineering University of Evansville
and
Sandy Dietrich, MS Doctoral Candidate
Eastern Michigan University Engineer, Ford Motor Company
Page 25.913.2

Abstract In many engineering programs in the United States and around the world, it is no longer sufficient to adequately train engineers with excellent left-brain skills – analysis, logical thinking, and quantitative thought. In fact, the right-brain skills, which include competitive differentiation, business adaptability, innovation and the development of a growth culture, and strategic thinking, are the “key competencies” required to differentiate decision-making in this rapidly changing marketplace. Today’s environment calls for a new breed of engineer, one who combines their passion for math and science, with a complementary set of skills such as business acumen, customer awareness and sensitivity to societal needs. This new emergent class of engineers that industry is seeking needs to have an opportunity orientation, leadership skills and an entrepreneurial mindset. Entrepreneurially minded engineers (EMEs) are characterized as this emergent class of engineers and act as the drivers of U.S. innovation and competitiveness. EMEs have not necessarily started a new business (although they may have), they are, most often, working in established small- and medium-sized firms, many work in Fortune 1000 firms [1]. The Kern Entrepreneurship Education Network (KEEN), a collection of twenty-one private engineering schools across the US, in partnership with Target Training International (TTI), a worldwide leader in personal and professional assessments, is undertaking the KEEN – TTI Performance DNA Assessment Project. Three well-known and vetted assessments are being used to identify current students’ skills, behaviors and motivators to integrate the entrepreneurial mindset into undergraduate engineering education. This project includes benchmarking practicing EMEs and mapping these insights with respect to engineering undergraduate students as they matriculate through their education, as freshmen, mid-classmen and seniors. The goal of this research was to study the hypothesized relationships between EME behavior, motivation, and exhibited skills, and seek to identify key EME attributes that may be interwoven into the current undergraduate engineering pedagogy in order to equip tomorrow’s engineer. Drawing from a data sample of 4,965 undergraduate students, and 313 EMEs, this paper will employ a combination of descriptive and multivariate methods and techniques to address the following opportunities: 1 – Mapping the behavioral styles, motivators, and personal and professional skills of practicing EMEs to establish an industry benchmark, 2 – Creating a series of undergraduate maps that profile the behavioral styles, motivators, and personal and professional skills of engineering students participating in KEEN programs, and 3 – Mapping, analyzing and comparing the behavioral styles, motivators, and personal and professional skills of EMEs, engineers and undergraduate engineering students. Introduction It is no longer sufficient to adequately train engineers with excellent left-brain skills: analysis, logical thinking, and quantitative thought. Solving problems is not enough; there is no prize for solving correctly what may turn out to be the incorrect problem [2]. It is important to acquire the skills to solve the correct problem behind the perceived problem, and this entails more than left-brain thinking alone” [3]. In fact, these right-brain skills, which include competitive P
age 25.913.3
differentiation, business adaptability, innovation and the development of a growth culture, and strategic thinking, are the key competencies required to differentiate business [4]. Zhang and Probst (2009) set forth the notion that engineering education has traditionally overemphasized the left brain, and that to be more effective, a balanced approach is called for in curriculum design and course instruction [5]. In their study of what skills employers are looking for in undergraduates, Crawford et al. (2011) identified seven soft skill clusters associated with right brain thinking:
1. Experiences 2. Team Skills 3. Communication Skills 4. Leadership Skills 5. Decision Making/Problem Solving Skills 6. Self-Management Skills 7. Professionalism Skills
This comprehensive study based on 31 US universities and 282 employers representing all 50 states found that employers and alum ranked soft skills as the most important in terms of job effectiveness and career development [6]. The uncertainty and complexity in today’s global marketplace are dramatically changing the world of work, especially engineering. In this emerging marketplace there is neither enough nor the right kind of data for traditional analysis. Instead of black and white we find shades of gray, and learning takes place through exploration rather than handed down knowledge [7]. To operate in such a world we need softer skills, leadership, creativity, and team work that support decision-making in uncertain and ambiguous circumstances [8] [9]. Traditional engineering skills have become redundant, and are no longer enough to succeed. The marketplace is demanding a new breed of engineer, one who has a set of personal and professional competencies to complement their passion for science. As engineering programs strive to meet the challenge of education reform, we must acknowledge that the next several decades will offer more opportunities for engineers, and as educators, we must make a shift in our thinking. Instead of permitting engineering education to lag technology and society, engineering educators and practitioners should anticipate needed advances and prepare for a future by blending engineering with economics and social science [10]. ABET has recognized this as well, by integrating skills such as the ability to work on multi-disciplinary teams, communication skills and lifelong learning into their student learning outcomes. To address the need to transform engineering education KEEN aspires to create a pipeline of a new class of engineers. KEEN was created with the goal to expose all undergraduate engineering students in participating schools to new combinations of curricular, co-curricular and extra-curricular activities and experiences that will foster entrepreneurial thinking in all engineers. This thinking is grounded in complementing technical competence with business
Page 25.913.4
acumen, customer awareness, ethics and an entrepreneurial spirit.
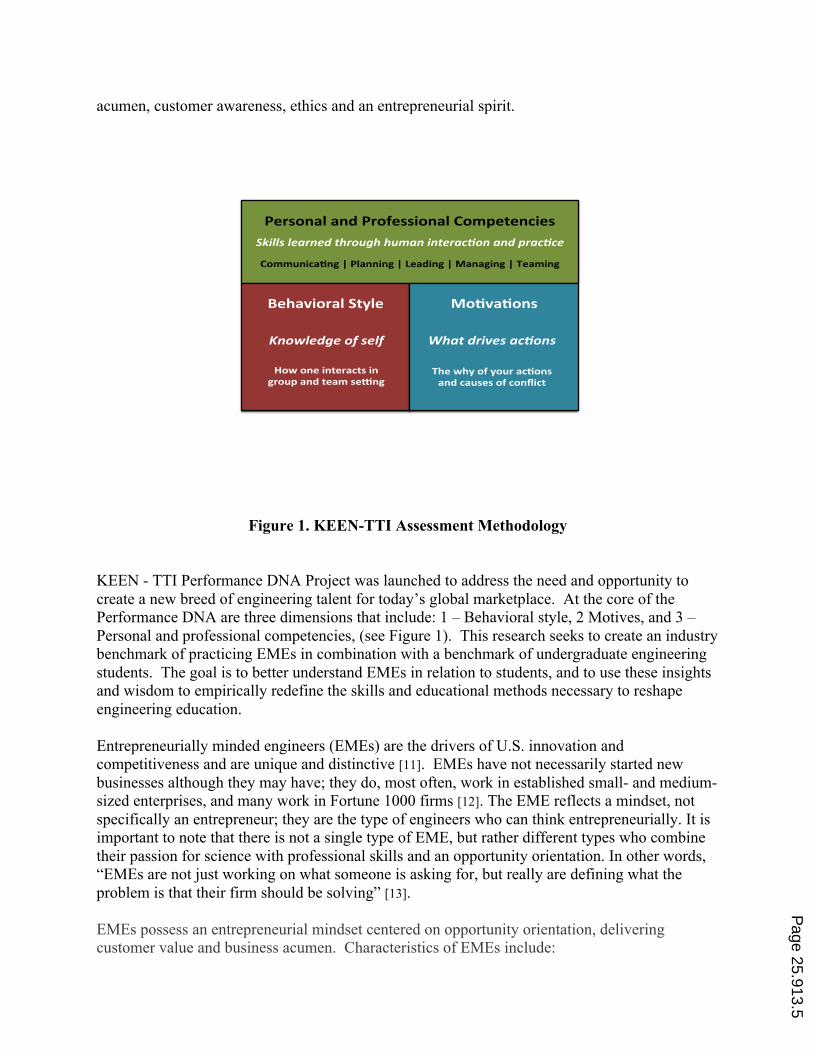
Figure 1. KEEN-TTI Assessment Methodology KEEN - TTI Performance DNA Project was launched to address the need and opportunity to create a new breed of engineering talent for today’s global marketplace. At the core of the Performance DNA are three dimensions that include: 1 – Behavioral style, 2 Motives, and 3 – Personal and professional competencies, (see Figure 1). This research seeks to create an industry benchmark of practicing EMEs in combination with a benchmark of undergraduate engineering students. The goal is to better understand EMEs in relation to students, and to use these insights and wisdom to empirically redefine the skills and educational methods necessary to reshape engineering education. Entrepreneurially minded engineers (EMEs) are the drivers of U.S. innovation and competitiveness and are unique and distinctive [11]. EMEs have not necessarily started new businesses although they may have; they do, most often, work in established small- and medium-sized enterprises, and many work in Fortune 1000 firms [12]. The EME reflects a mindset, not specifically an entrepreneur; they are the type of engineers who can think entrepreneurially. It is important to note that there is not a single type of EME, but rather different types who combine their passion for science with professional skills and an opportunity orientation. In other words, “EMEs are not just working on what someone is asking for, but really are defining what the problem is that their firm should be solving” [13]. EMEs possess an entrepreneurial mindset centered on opportunity orientation, delivering customer value and business acumen. Characteristics of EMEs include:
Personal)and)Professional)Competencies)Skills&learned&through&human&interac3on&and&prac3ce&
Communica3ng)|)Planning)|)Leading)|)Managing)|)Teaming)
Behavioral)Style)
Knowledge&of&self&
How)one)interacts)in)group)and)team)se@ng)
Mo3va3ons)
What&drives&ac3ons&
The)why)of)your)ac3ons)and)causes)of)conflict)
Page 25.913.5
1. Opportunity Orientation - searching to identify and solve real world problems that improve people’s lives through value creation
2. Technical Empowerment - view technology as an enabler used to solve problems and create value for customers in a dynamic and changing global marketplace
3. Business Fundamentals - understanding the business and industry the firm is in and support the advancement of the corporate agenda
4. Interpersonal Dynamics - clear understanding of given situations and providing projects with leadership and teamwork through good communication
5. Forward Thinking - intellectual and personal curiosity in the form of looking for “what’s next” and effectively and economically applying new methods
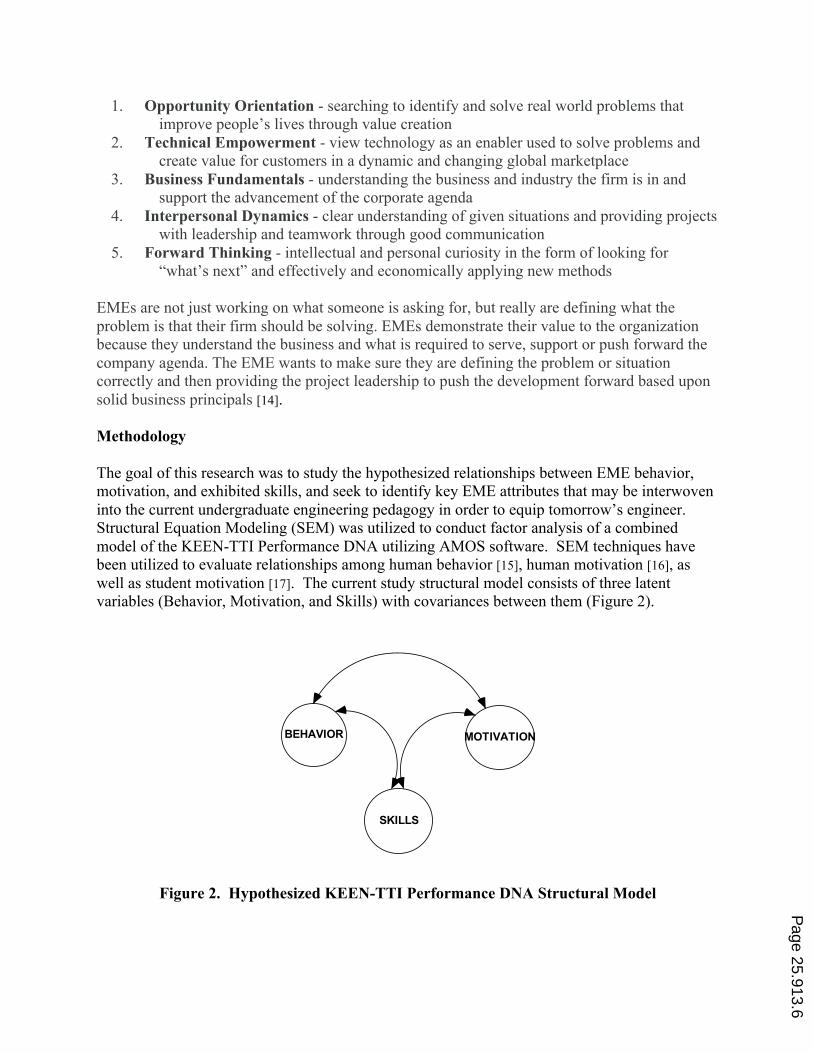
EMEs are not just working on what someone is asking for, but really are defining what the problem is that their firm should be solving. EMEs demonstrate their value to the organization because they understand the business and what is required to serve, support or push forward the company agenda. The EME wants to make sure they are defining the problem or situation correctly and then providing the project leadership to push the development forward based upon solid business principals [14]. Methodology The goal of this research was to study the hypothesized relationships between EME behavior, motivation, and exhibited skills, and seek to identify key EME attributes that may be interwoven into the current undergraduate engineering pedagogy in order to equip tomorrow’s engineer. Structural Equation Modeling (SEM) was utilized to conduct factor analysis of a combined model of the KEEN-TTI Performance DNA utilizing AMOS software. SEM techniques have been utilized to evaluate relationships among human behavior [15], human motivation [16], as well as student motivation [17]. The current study structural model consists of three latent variables (Behavior, Motivation, and Skills) with covariances between them (Figure 2).
Figure 2. Hypothesized KEEN-TTI Performance DNA Structural Model
BEHAVIOR MOTIVATION
SKILLS
Page 25.913.6

Each latent variable is described by observed manifest variables developed from questionnaire items. The Behavior latent variable is defined by the DISC instrument as a measurement model, where the four manifest variables Dominance (D), Influence (I), Steadiness (S), and Compliance (C) are depicted in Figure 3 [18] [19].
Figure 3. Hypothesized KEEN-TTI DISC Measurement Model In a similar fashion the Motivation and Skills latent variables are described by specific manifest variables derived from TTI questionnaire items. The Motivation latent model is described by six manifest variables: Theoretical (TH), Aesthetic (AE), Traditional (TR), Individualistic (IN), Social (SO), and Utilitarian (UT), ea. The Skills latent variable is described by the 23 manifest variables: Skill Competency Code Analytical Problem Solving (AN) Conflict Management (CO) Continuous Learning (CL) Creativity/Innovation (CR) Customer Service (CU) Decision Making (DE) Diplomacy (DI), Empathy (EP) Employee Development (EM) Flexibility (FL) Futuristic Thinking (FU) Goal Orientation (GO) Interpersonal Skills (IN) Leadership (LE) Management (MA) Negotiation (NE) Personal Effectiveness (PE) Persuasion (Per) Planning/Organizing (PL) Presenting (PR)
BEHAVIOR
C
S
D
I
Page 25.913.7
Self-Management (SE) Teamwork (TE) Written Communication (WR) The original hypothesized SEM included a total of 33 manifest indexed variables describing the three latent variables. The TTI manifest variables associated with the Behavior and Motivation latent variables where coded as indexed variables with a 0 – 100 scale, indicating an increasing level of exhibited variable representation in the questionnaire responses. The manifest variables associated with the Skills latent variable where coded with a 0 – 10 scale, similarly indicating increasing levels of exhibited variable representation. The data collected included four different sample populations: 313 EMEs, 41 engineers, 1,717 undergraduate freshman engineering students, and 287 undergraduate senior engineering students. This data was evaluated for reliability by assessing the Cronbach’s Alpha utilizing software prior to the factor analysis process. Cronbach’s Alpha is an accepted measure of internal consistency or reliability of a test. In 1951, Cronbach examined the use of Kuder and Richarson’s coefficient alpha as an overall measure of internal consistency [20]. Nunnally (1978) established a standard of reliability using Cronbach’s alpha for basic research “for which purpose reliabilities of 0.70 or higher will suffice.” [21] Maxim (1999) has proposed that a value of α = 0.8 be considered the minimum value of “reasonably reliable” data in this application [22]. Therefore, the use of 0.8 will be considered for this research.
SEM factor analysis models for the four sample populations were optimized to achieve the best fitting SEM possible according to established reasonable fitting criteria. To evaluate statistical differences between the four population’s SEMs, invariance testing techniques were employed. The SEM differences that exist between EME, engineers, and students provide needed information to improve the relevant engineering pedagogy to equip this generation of engineering students for what the engineering marketplace requires. Sampling Frame and Data Collection The TTI Performance DNA survey is an on-line survey that takes approximately thirty minutes to take. Data collection and sampling frames included course driven student data from 17 KEEN network schools, a LinkedIn database and nominated sampling techniques. The KEEN – TTI Performance DNA survey was administered to a subset of students from seventeen KEEN schools during the 2010-2011 academic year. The KEEN network schools are using this instrument to assess their ability to instill a set of skills associated with an entrepreneurial mindset in all of their students. The methodology being employed is to benchmark freshmen, and to resurvey them at a mid point (sophomore/junior), and at the end of their education (senior) to determine if they have developed these skills over the course of their education. The KEEN – TTI Performance DNA survey was administered to freshmen, mid classmen and seniors as part of their course assignments. Students were given the opportunity to opt out as
Page 25.913.8

required in the IRB in place at each institution. There were no reports of students opting out. Students absent from class were given an opportunity to take the survey outside of class. Students viewed a five minute introductory web clip developed specifically for the project, followed by short debrief clip, and then signed a consent form. The invitation to complete the KEEN – TTI Performance DNA survey, the same one completed by the students, was sent to over three-hundred professionals that have attained an engineering degree. These prospective participants were invited based on over five-hundred professional contacts of the researcher’s network using LinkedIn which is the largest online professional networking site in the world [23]. The participants were also invited to share the link to their engineering colleagues. At the end of the TTI survey, a link was provided to a group of demographic questions using the online program Survey Monkey and included the question: What is your current job title? The job title was used to discriminate the group of engineers. Those practitioners with an engineering degree that remain working as an engineer are categorized as "engineer." This is in contrast to professionals that have an engineering degree but are working in a leadership role or a title other than engineer. The participants who elected to take the survey, whose self-reported job category of "engineer," totaled 41.
The EME data set is a combination of elected individuals who exemplify the Kern Foundation's definition of an EME. This emergent class of engineers has an opportunity orientation, leadership skills and an entrepreneurial mindset, they are not have necessarily started a business, yet, rather work in established firms. The KEEN school representatives nominated these EME's and invited them to take the survey. These nominated individuals' results were combined with the self-reported engineering leadership group, resulting in 313 total EME results.
The KEEN schools provided the student participants for the 1,717 undergraduate freshman engineering students, and 287 undergraduate senior engineering students. Freshmen data were gathered typically by using a first-year class that would include all of the incoming engineering students. Students accessed the online survey and completed the questions either during the class period or on their own time. Data for the senior students were collected in a similar manner.
Observed Manifest Data Reliability Overall reliability of the observed TTI Performance DNA data (EME, practicing engineer, freshmen, and senior) was evaluated by assessing Cronbach’s alpha (α) which is a single indexed function of the sample covariance matrix and the number of observed variables. The evaluation of the hypothesized 33 variable freshmen sample population (n = 1,717) Cronbach’s alpha yielded a standardized α = 0.747 which was reasonably close to the α = 0.8 minimum level, although the base PASW Cronbach’s alpha was calculated as a negative value which is not admissible. This negative value was due to the average negative covariance between the 33 variables. To evaluate the 33 variable negative freshmen Cronbach’s alpha issue, a verification evaluation was undertaken. The valence was changed in the variables Dominance (D), Influence (I), Theoretical (TH), Utilitarian (UT), and Individualistic (IN) and the 23 variables of the Skill latent variable was recoded to a 0 – 100 scale to have a consistent magnitude with the other
Page 25.913.9
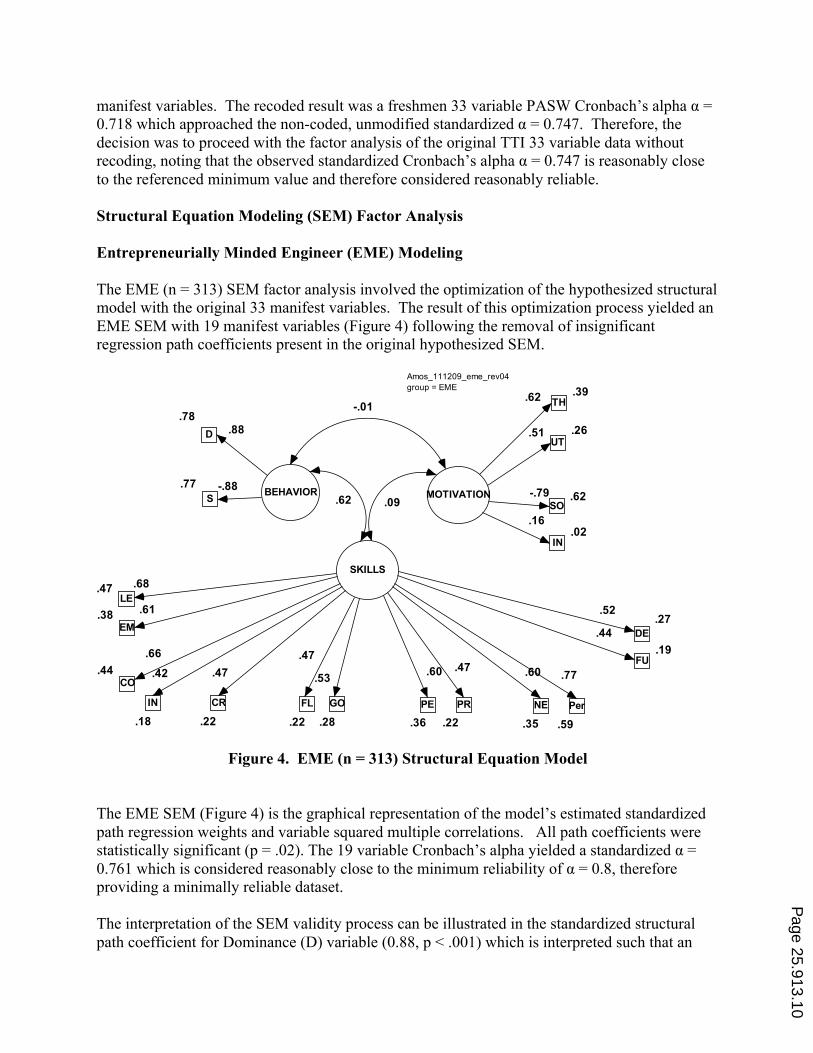
manifest variables. The recoded result was a freshmen 33 variable PASW Cronbach’s alpha α = 0.718 which approached the non-coded, unmodified standardized α = 0.747. Therefore, the decision was to proceed with the factor analysis of the original TTI 33 variable data without recoding, noting that the observed standardized Cronbach’s alpha α = 0.747 is reasonably close to the referenced minimum value and therefore considered reasonably reliable. Structural Equation Modeling (SEM) Factor Analysis Entrepreneurially Minded Engineer (EME) Modeling The EME (n = 313) SEM factor analysis involved the optimization of the hypothesized structural model with the original 33 manifest variables. The result of this optimization process yielded an EME SEM with 19 manifest variables (Figure 4) following the removal of insignificant regression path coefficients present in the original hypothesized SEM.
Figure 4. EME (n = 313) Structural Equation Model The EME SEM (Figure 4) is the graphical representation of the model’s estimated standardized path regression weights and variable squared multiple correlations. All path coefficients were statistically significant (p = .02). The 19 variable Cronbach’s alpha yielded a standardized α = 0.761 which is considered reasonably close to the minimum reliability of α = 0.8, therefore providing a minimally reliable dataset. The interpretation of the SEM validity process can be illustrated in the standardized structural path coefficient for Dominance (D) variable (0.88, p < .001) which is interpreted such that an
Amos_111209_eme_rev04group = EME
BEHAVIOR.77
S
.78D
MOTIVATION
.39TH
.26UT
.62SO
.02IN
SKILLS
.27DE
.19FU
.59Per
.35NE
.22PR
.36PE
.22CR
.18IN
.44CO
.38EM
.47LE
-.01
.09.62
.88
.62
.60
.16
.51
-.88 -.79
.68
.66
.61
.42 .47
.22FL
.28GO
.52
.44
.77.60 .47.47
.53
Page 25.913.10
increase in the Dominance attributes of the EME results in a direct effect (0.88 multiplier) on the improvement in the Behavior latent variable. Similarly, the standardized structural path coefficient for the Steadiness (S) (-0.88, p < .001) is interpreted as any increase in the Steadiness attributes experienced by the EME results in a direct effect (-0.88 multiplier) on the decrease in the Behavior latent variable. The review of the squared multiple correlations indicate that 78% of the Dominance (D) variance is attributed to the specific latent variable measurement model, as is 77% of the Steadiness (S) variance. Further interpretation of this EME SEM factor analysis indicates that the standardized correlation coefficient (ρ = -0.01) between the Behavior and Motivation latent variables indicated no correlation between these two attributes, implying latent variable independence. A future consideration may be the incorporation of an “industry identifier” discriminating variable in the Motivation latent variable measurement model, which may effect the Behavior and Motivation correlation. The standardized correlation between the Behavior and Skills latent variables on the other hand, indicated a relative strong correlation (ρ = 0.62), where an increase in the Behavior attributes was associated with a substantial increase in the Skills attributes. The Skills latent variable indicated substantial attributes contained in the manifest variables of Leadership (LE), Employee Development/Coaching (EM), Conflict Management (CM), Personal Effectiveness (PE), Negotiation (NE), and Persuasion (Per) by virtue of the respective standardized path coefficients and squared multiple correlations. The EME SEM factor analysis can only be considered substantive or directional, but not statistically significant with the goodness of fit indices presented in Table 1, including reasonable fit criteria applicable for use with the maximum-likelihood approximation [24]. The root mean square error of approximation (RMSEA = 0.12) was slightly larger than what was suggested as a reasonable error of approximation (RMSEA <0.08). Similarly, the goodness of fit index (GFI = 0.77) was lower than the reasonable fit criteria (GFI > 0.90) which also indicates a less than reasonable model fit. The reasonable fit criteria presented in Table 1 consistently point to the model not being statistical significant. The underlying EME dataset reliability was previously described as minimally reliable therefore; the Figure 4 EME SEM significance is bounded by the underlying dataset strength. In light of the evaluation of all Table 1 goodness of fit indices and the minimally reliable underlying dataset, the EME SEM factor analysis is considered sufficiently substantive and directional for this study.
Page 25.913.11
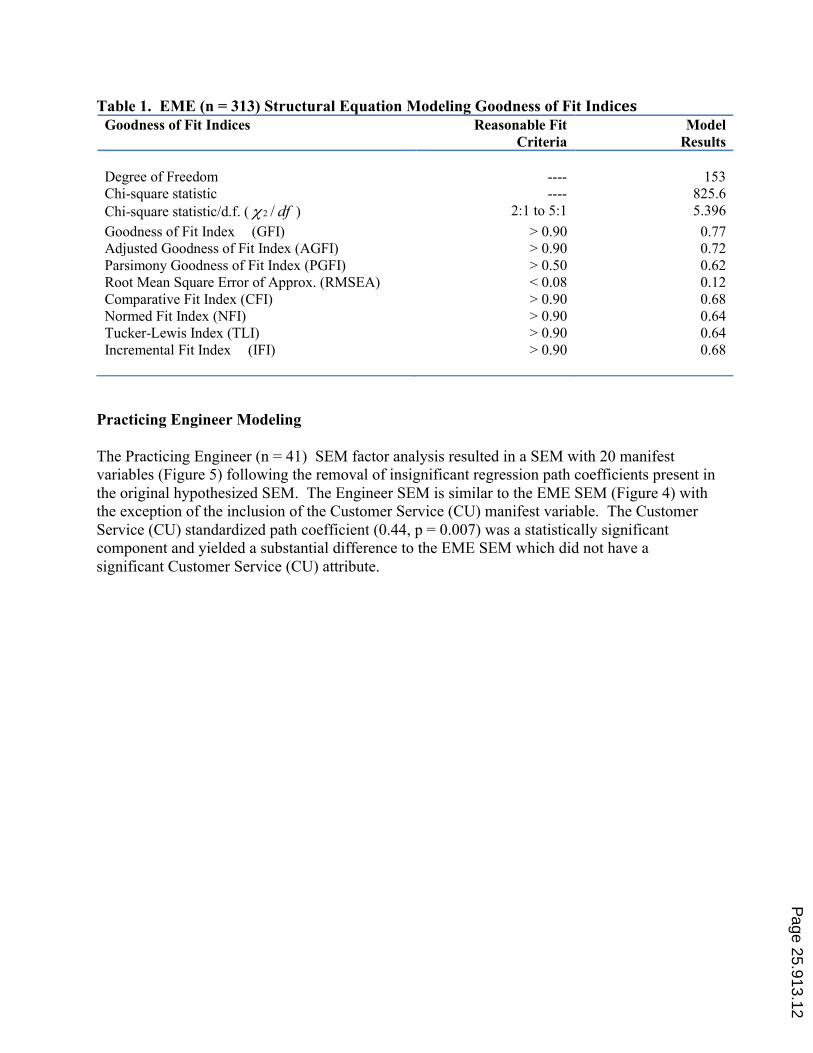
Table 1. EME (n = 313) Structural Equation Modeling Goodness of Fit Indices Goodness of Fit Indices Reasonable Fit
Criteria Model
Results Degree of Freedom ---- 153 Chi-square statistic ---- 825.6 Chi-square statistic/d.f. ( df/2χ ) 2:1 to 5:1 5.396 Goodness of Fit Index (GFI) > 0.90 0.77 Adjusted Goodness of Fit Index (AGFI) > 0.90 0.72 Parsimony Goodness of Fit Index (PGFI) > 0.50 0.62 Root Mean Square Error of Approx. (RMSEA) < 0.08 0.12 Comparative Fit Index (CFI) > 0.90 0.68 Normed Fit Index (NFI) > 0.90 0.64 Tucker-Lewis Index (TLI) > 0.90 0.64 Incremental Fit Index (IFI) > 0.90 0.68
Practicing Engineer Modeling The Practicing Engineer (n = 41) SEM factor analysis resulted in a SEM with 20 manifest variables (Figure 5) following the removal of insignificant regression path coefficients present in the original hypothesized SEM. The Engineer SEM is similar to the EME SEM (Figure 4) with the exception of the inclusion of the Customer Service (CU) manifest variable. The Customer Service (CU) standardized path coefficient (0.44, p = 0.007) was a statistically significant component and yielded a substantial difference to the EME SEM which did not have a significant Customer Service (CU) attribute.
Page 25.913.12
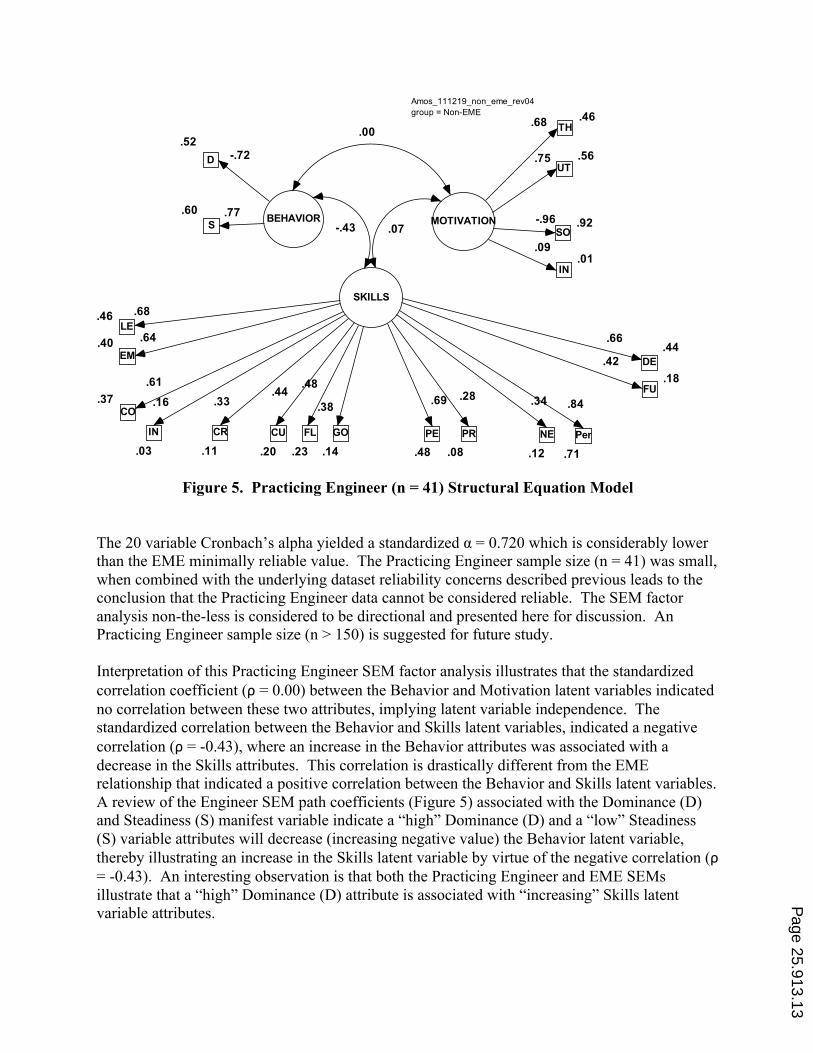
Figure 5. Practicing Engineer (n = 41) Structural Equation Model The 20 variable Cronbach’s alpha yielded a standardized α = 0.720 which is considerably lower than the EME minimally reliable value. The Practicing Engineer sample size (n = 41) was small, when combined with the underlying dataset reliability concerns described previous leads to the conclusion that the Practicing Engineer data cannot be considered reliable. The SEM factor analysis non-the-less is considered to be directional and presented here for discussion. An Practicing Engineer sample size (n > 150) is suggested for future study. Interpretation of this Practicing Engineer SEM factor analysis illustrates that the standardized correlation coefficient (ρ = 0.00) between the Behavior and Motivation latent variables indicated no correlation between these two attributes, implying latent variable independence. The standardized correlation between the Behavior and Skills latent variables, indicated a negative correlation (ρ = -0.43), where an increase in the Behavior attributes was associated with a decrease in the Skills attributes. This correlation is drastically different from the EME relationship that indicated a positive correlation between the Behavior and Skills latent variables. A review of the Engineer SEM path coefficients (Figure 5) associated with the Dominance (D) and Steadiness (S) manifest variable indicate a “high” Dominance (D) and a “low” Steadiness (S) variable attributes will decrease (increasing negative value) the Behavior latent variable, thereby illustrating an increase in the Skills latent variable by virtue of the negative correlation (ρ = -0.43). An interesting observation is that both the Practicing Engineer and EME SEMs illustrate that a “high” Dominance (D) attribute is associated with “increasing” Skills latent variable attributes.
Amos_111219_non_eme_rev04group = Non-EME
BEHAVIOR.60
S
.52D
MOTIVATION
.46TH
.56UT
.92SO
.01IN
SKILLS
.44DE
.18FU
.71Per
.12NE
.08PR
.48PE
.11CR
.03IN
.37CO
.40EM
.46LE
.00
.07-.43
-.72
.68
.34
.09
.75
.77 -.96
.68
.61
.64
.16 .33
.20CU
.23FL
.14GO
.66
.42
.84.69 .28.44 .48
.38
Page 25.913.13
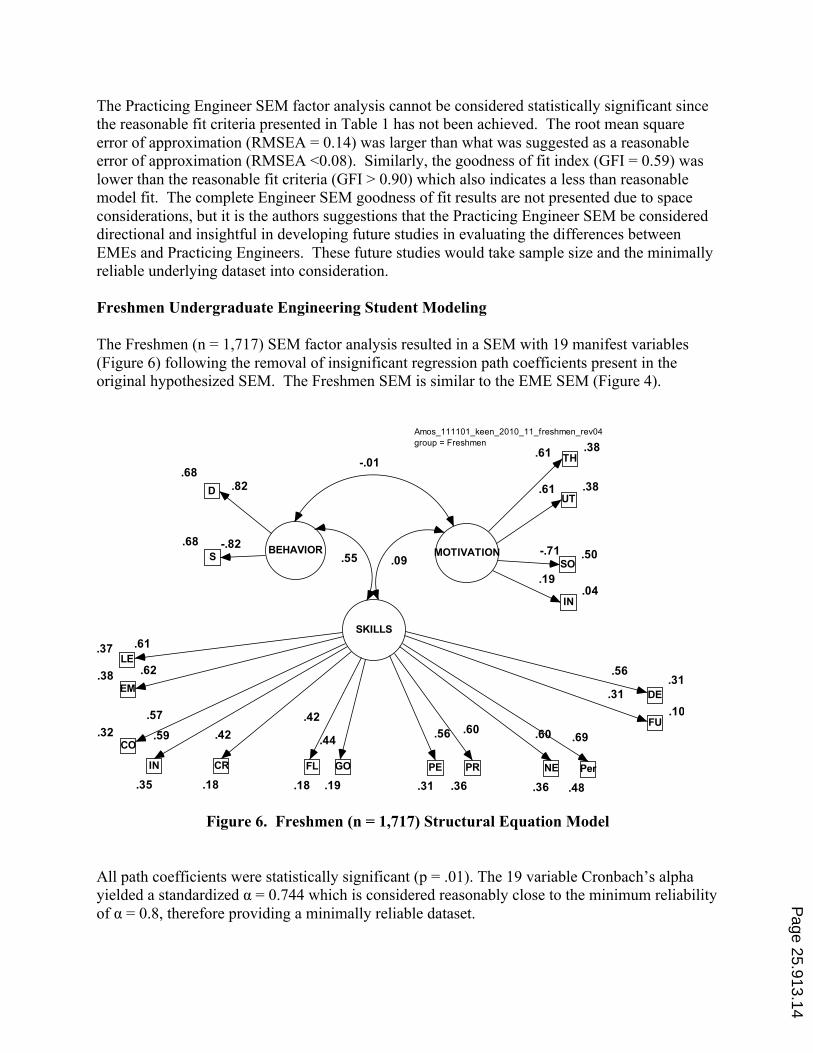
The Practicing Engineer SEM factor analysis cannot be considered statistically significant since the reasonable fit criteria presented in Table 1 has not been achieved. The root mean square error of approximation (RMSEA = 0.14) was larger than what was suggested as a reasonable error of approximation (RMSEA <0.08). Similarly, the goodness of fit index (GFI = 0.59) was lower than the reasonable fit criteria (GFI > 0.90) which also indicates a less than reasonable model fit. The complete Engineer SEM goodness of fit results are not presented due to space considerations, but it is the authors suggestions that the Practicing Engineer SEM be considered directional and insightful in developing future studies in evaluating the differences between EMEs and Practicing Engineers. These future studies would take sample size and the minimally reliable underlying dataset into consideration. Freshmen Undergraduate Engineering Student Modeling The Freshmen (n = 1,717) SEM factor analysis resulted in a SEM with 19 manifest variables (Figure 6) following the removal of insignificant regression path coefficients present in the original hypothesized SEM. The Freshmen SEM is similar to the EME SEM (Figure 4).
Figure 6. Freshmen (n = 1,717) Structural Equation Model All path coefficients were statistically significant (p = .01). The 19 variable Cronbach’s alpha yielded a standardized α = 0.744 which is considered reasonably close to the minimum reliability of α = 0.8, therefore providing a minimally reliable dataset.
Amos_111101_keen_2010_11_freshmen_rev04group = Freshmen
BEHAVIOR.68
S
.68D
MOTIVATION
.38TH
.38UT
.50SO
.04IN
SKILLS
.31DE
.10FU
.48Per
.36NE
.36PR
.31PE
.18CR
.35IN
.32CO
.38EM
.37LE
-.01
.09.55
.82
.61
.60
.19
.61
-.82 -.71
.61
.57
.62
.59 .42
.18FL
.19GO
.56
.31
.69.56 .60.42
.44
Page 25.913.14
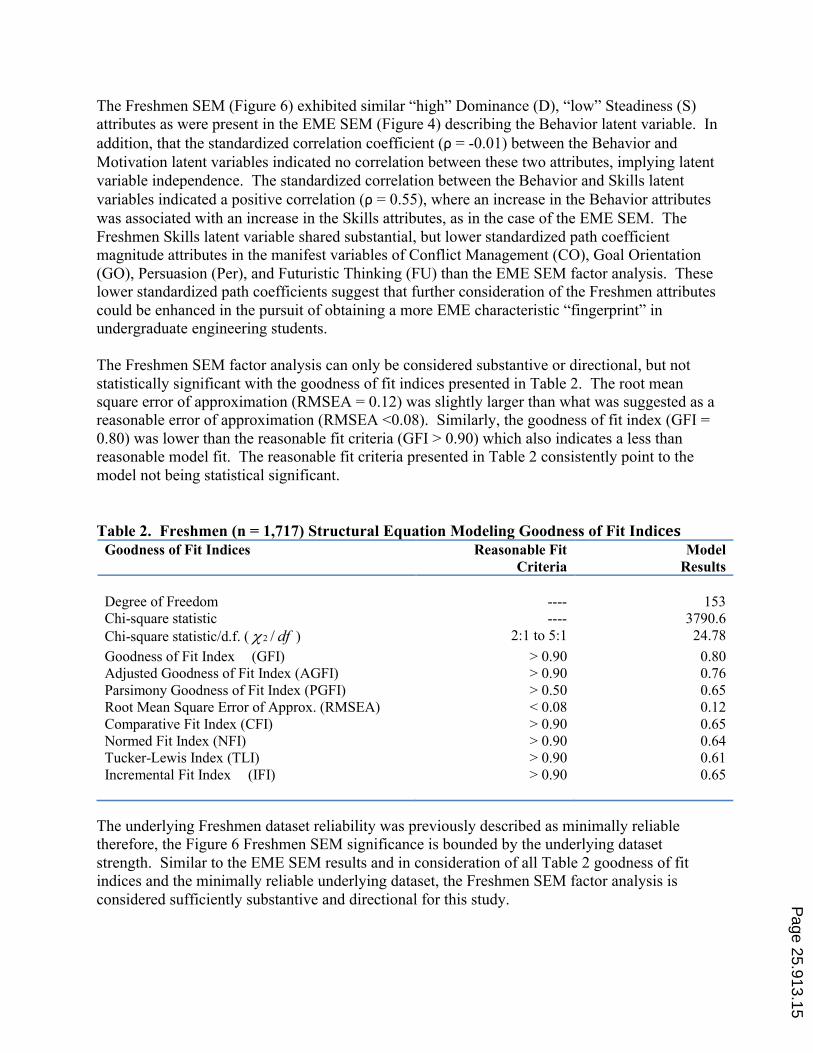
The Freshmen SEM (Figure 6) exhibited similar “high” Dominance (D), “low” Steadiness (S) attributes as were present in the EME SEM (Figure 4) describing the Behavior latent variable. In addition, that the standardized correlation coefficient (ρ = -0.01) between the Behavior and Motivation latent variables indicated no correlation between these two attributes, implying latent variable independence. The standardized correlation between the Behavior and Skills latent variables indicated a positive correlation (ρ = 0.55), where an increase in the Behavior attributes was associated with an increase in the Skills attributes, as in the case of the EME SEM. The Freshmen Skills latent variable shared substantial, but lower standardized path coefficient magnitude attributes in the manifest variables of Conflict Management (CO), Goal Orientation (GO), Persuasion (Per), and Futuristic Thinking (FU) than the EME SEM factor analysis. These lower standardized path coefficients suggest that further consideration of the Freshmen attributes could be enhanced in the pursuit of obtaining a more EME characteristic “fingerprint” in undergraduate engineering students. The Freshmen SEM factor analysis can only be considered substantive or directional, but not statistically significant with the goodness of fit indices presented in Table 2. The root mean square error of approximation (RMSEA = 0.12) was slightly larger than what was suggested as a reasonable error of approximation (RMSEA <0.08). Similarly, the goodness of fit index (GFI = 0.80) was lower than the reasonable fit criteria (GFI > 0.90) which also indicates a less than reasonable model fit. The reasonable fit criteria presented in Table 2 consistently point to the model not being statistical significant. Table 2. Freshmen (n = 1,717) Structural Equation Modeling Goodness of Fit Indices
Goodness of Fit Indices Reasonable Fit Criteria
Model Results
Degree of Freedom ---- 153 Chi-square statistic ---- 3790.6 Chi-square statistic/d.f. ( df/2χ ) 2:1 to 5:1 24.78 Goodness of Fit Index (GFI) > 0.90 0.80 Adjusted Goodness of Fit Index (AGFI) > 0.90 0.76 Parsimony Goodness of Fit Index (PGFI) > 0.50 0.65 Root Mean Square Error of Approx. (RMSEA) < 0.08 0.12 Comparative Fit Index (CFI) > 0.90 0.65 Normed Fit Index (NFI) > 0.90 0.64 Tucker-Lewis Index (TLI) > 0.90 0.61 Incremental Fit Index (IFI) > 0.90 0.65
The underlying Freshmen dataset reliability was previously described as minimally reliable therefore, the Figure 6 Freshmen SEM significance is bounded by the underlying dataset strength. Similar to the EME SEM results and in consideration of all Table 2 goodness of fit indices and the minimally reliable underlying dataset, the Freshmen SEM factor analysis is considered sufficiently substantive and directional for this study.
Page 25.913.15

Senior Undergraduate Engineering Student Modeling The Senior (n = 287) SEM factor analysis resulted in a SEM with 19 manifest variables (Figure 7) following the removal of insignificant regression path coefficients present in the original hypothesized SEM. The Senior SEM is similar to both the EME SEM (Figure 4) and Freshmen SEM (Figure 6).
Figure 7. Senior (n = 287) Structural Equation Model All path coefficients were statistically significant (p = .01). The 19 variable Cronbach’s alpha yielded a standardized α = 0.740 which is considered reasonably close to the minimum reliability of α = 0.8, therefore providing a minimally reliable dataset. The Senior SEM (Figure 7) exhibited similar “high” Dominance (D), “low” Steadiness (S) attributes as were present in the EME SEM (Figure 4) and Freshmen SEM (Figure 6) describing the Behavior latent variable. The standardized correlation coefficient (ρ = -0.01) between the Behavior and Motivation latent variables indicated no correlation between these two attributes, just as in the EME and Freshmen SEMs. The standardized correlation between the Behavior and Skills latent variables indicated a positive correlation (ρ = 0.63), where an increase in the Behavior attributes was associated with an increase in the Skills attributes, as in the case of the EME SEM. The Senior Skills latent variable shared substantial, but lower standardized path coefficient magnitude attributes as the EME SEM in the manifest variables of Conflict Management (CO), Goal Orientation (GO), Persuasion (Per), and Futuristic Thinking (FU) than
Amos_111101_keen_2010_11_senior_rev03group = Senior
BEHAVIOR.76
S
.68D
MOTIVATION
.32TH
.46UT
.48SO
.16IN
SKILLS
.35DE
.09FU
.48Per
.37NE
.36PR
.27PE
.19CR
.28IN
.31CO
.39EM
.40LE
-.01
.10.63
.82
.57
.61
.40
.68
-.87 -.70
.63
.55
.62
.53 .44
.15FL
.13GO
.59
.29
.69.52 .60.38
.36
Page 25.913.16

the EME SEM factor analysis. These path coefficients were also indicated as being relatively lower in the Freshmen SEM (w.r.t. the EME SEM), which eludes to the question of whether there is any exhibited skill manifest variable enhancement during the academic progression from freshman to senior. The Senior SEM factor analysis can only be considered substantive or directional, but not statistically significant with the goodness of fit indices presented in Table 3. The root mean square error of approximation (RMSEA = 0.12) was slightly larger than what was suggested as a reasonable error of approximation (RMSEA <0.08). Similarly, the goodness of fit index (GFI = 0.78) was lower than the reasonable fit criteria (GFI > 0.90) which also indicates a less than reasonable model fit. The reasonable fit criteria presented in Table 3 consistently point to the model not being statistical significant. Table 3. Senior (n = 287) Structural Equation Modeling Goodness of Fit Indices
Goodness of Fit Indices Reasonable Fit Criteria
Model Results
Degree of Freedom ---- 153 Chi-square statistic ---- 807.3 Chi-square statistic/d.f. ( df/2χ ) 2:1 to 5:1 5.28 Goodness of Fit Index (GFI) > 0.90 0.78 Adjusted Goodness of Fit Index (AGFI) > 0.90 0.73 Parsimony Goodness of Fit Index (PGFI) > 0.50 0.63 Root Mean Square Error of Approx. (RMSEA) < 0.08 0.12 Comparative Fit Index (CFI) > 0.90 0.64 Normed Fit Index (NFI) > 0.90 0.59 Tucker-Lewis Index (TLI) > 0.90 0.60 Incremental Fit Index (IFI) > 0.90 0.64
The underlying Senior dataset reliability was previously described as minimally reliable therefore, the Figure 7 Senior SEM significance is bounded by the underlying dataset strength. Similar to both the EME SEM and Freshmen SEM results and in consideration of all Table 3 goodness of fit indices and the minimally reliable underlying dataset, the Senior SEM factor analysis is considered sufficiently substantive and directional for this study. Testing for invariance across Skills Exhibited in EMEs and Seniors The previous SEM factor analysis indicated similar attributes concerning the EME, Freshmen, and Senior Skill latent variables. The testing for the structural path coefficients invariance was chosen to consider the seven variables Conflict Management (CO), Flexibility (FL), Goal Orientation (GO), Persuasion (Per), Futuristic Thinking (FU), Leadership (LE), and Employee Development/ Coaching (EM) due to the relative magnitude of the standardized path coefficient impact and/or squared multiple correlation contribution. The question, “Is there a significant difference between the EME and Senior exhibited skill set?” is to be evaluated in this invariance testing.
Page 25.913.17
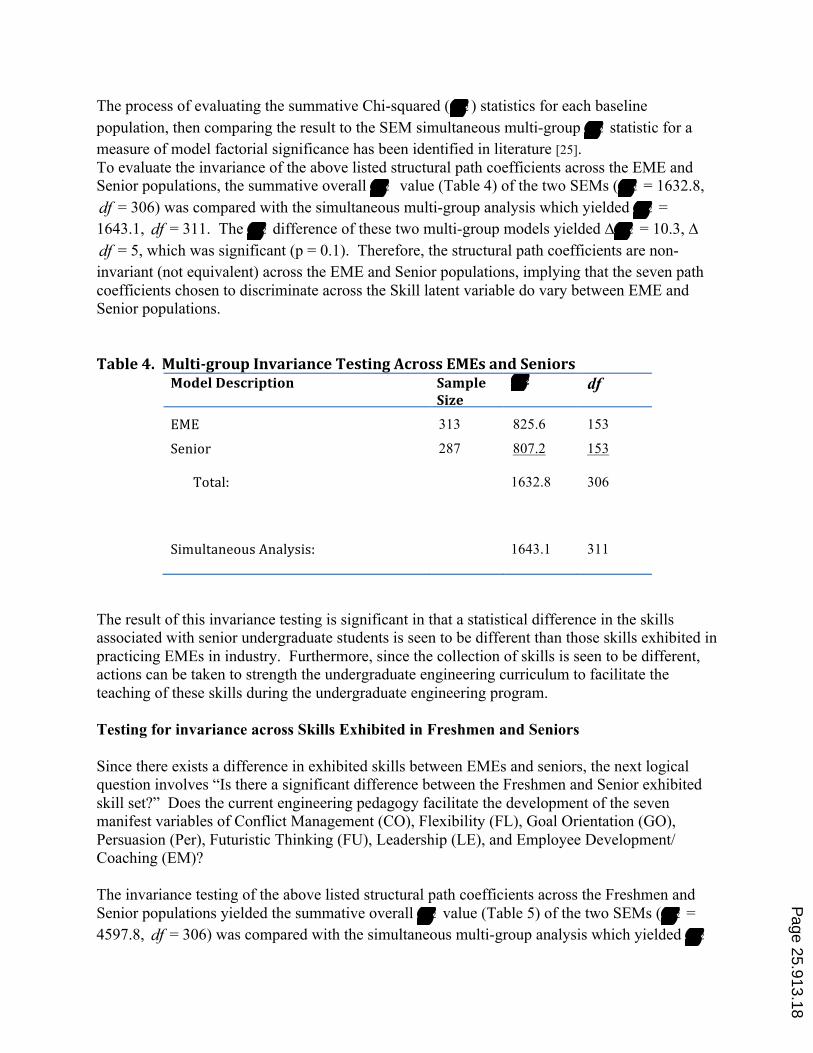
The process of evaluating the summative Chi-squared ( 2χ ) statistics for each baseline population, then comparing the result to the SEM simultaneous multi-group 2χ statistic for a measure of model factorial significance has been identified in literature [25]. To evaluate the invariance of the above listed structural path coefficients across the EME and Senior populations, the summative overall 2χ value (Table 4) of the two SEMs ( 2χ = 1632.8, df = 306) was compared with the simultaneous multi-group analysis which yielded 2χ = 1643.1, df = 311. The 2χ difference of these two multi-group models yielded ∆ 2χ = 10.3, ∆df = 5, which was significant (p = 0.1). Therefore, the structural path coefficients are non-invariant (not equivalent) across the EME and Senior populations, implying that the seven path coefficients chosen to discriminate across the Skill latent variable do vary between EME and Senior populations. Table 4. Multi-‐group Invariance Testing Across EMEs and Seniors
Model Description Sample Size
2χ df
EME 313 825.6 153
Senior 287 807.2 153
Total: 1632.8 306
Simultaneous Analysis: 1643.1 311
The result of this invariance testing is significant in that a statistical difference in the skills associated with senior undergraduate students is seen to be different than those skills exhibited in practicing EMEs in industry. Furthermore, since the collection of skills is seen to be different, actions can be taken to strength the undergraduate engineering curriculum to facilitate the teaching of these skills during the undergraduate engineering program. Testing for invariance across Skills Exhibited in Freshmen and Seniors Since there exists a difference in exhibited skills between EMEs and seniors, the next logical question involves “Is there a significant difference between the Freshmen and Senior exhibited skill set?” Does the current engineering pedagogy facilitate the development of the seven manifest variables of Conflict Management (CO), Flexibility (FL), Goal Orientation (GO), Persuasion (Per), Futuristic Thinking (FU), Leadership (LE), and Employee Development/ Coaching (EM)? The invariance testing of the above listed structural path coefficients across the Freshmen and Senior populations yielded the summative overall 2χ value (Table 5) of the two SEMs ( 2χ = 4597.8, df = 306) was compared with the simultaneous multi-group analysis which yielded 2χ
Page 25.913.18
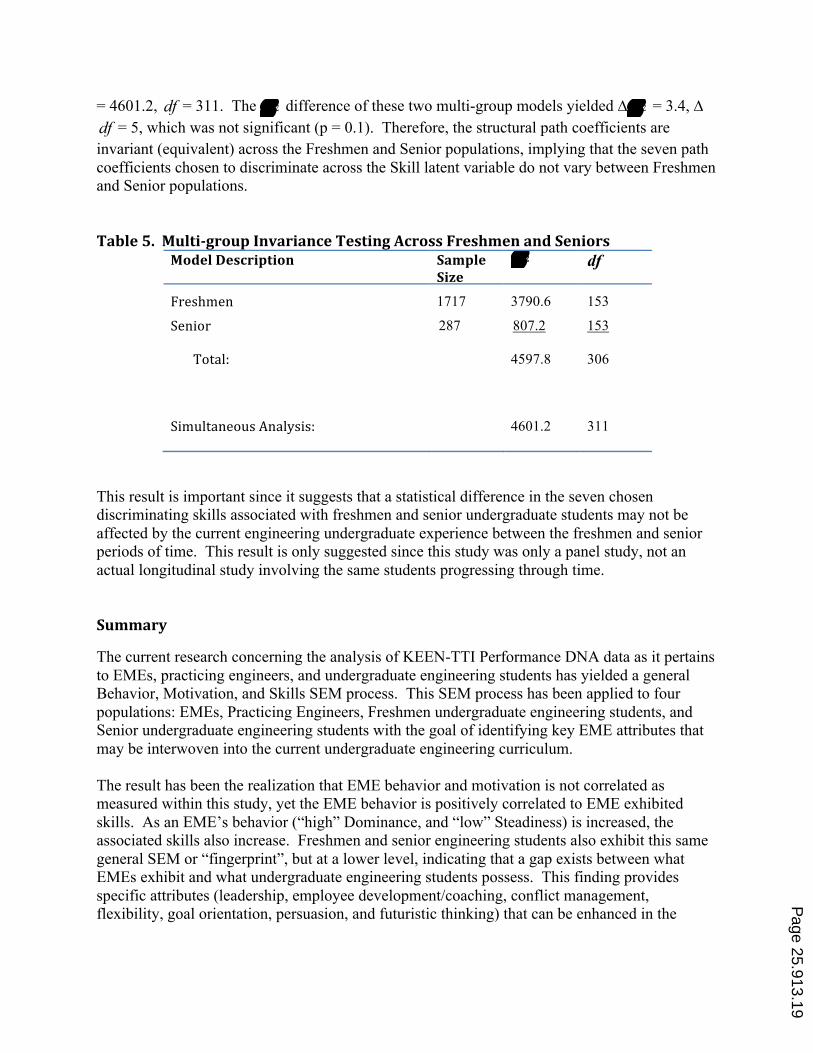
= 4601.2, df = 311. The 2χ difference of these two multi-group models yielded ∆ 2χ = 3.4, ∆df = 5, which was not significant (p = 0.1). Therefore, the structural path coefficients are invariant (equivalent) across the Freshmen and Senior populations, implying that the seven path coefficients chosen to discriminate across the Skill latent variable do not vary between Freshmen and Senior populations. Table 5. Multi-‐group Invariance Testing Across Freshmen and Seniors
Model Description Sample Size
2χ df
Freshmen 1717 3790.6 153
Senior 287 807.2 153
Total: 4597.8 306
Simultaneous Analysis: 4601.2 311
This result is important since it suggests that a statistical difference in the seven chosen discriminating skills associated with freshmen and senior undergraduate students may not be affected by the current engineering undergraduate experience between the freshmen and senior periods of time. This result is only suggested since this study was only a panel study, not an actual longitudinal study involving the same students progressing through time. Summary
The current research concerning the analysis of KEEN-TTI Performance DNA data as it pertains to EMEs, practicing engineers, and undergraduate engineering students has yielded a general Behavior, Motivation, and Skills SEM process. This SEM process has been applied to four populations: EMEs, Practicing Engineers, Freshmen undergraduate engineering students, and Senior undergraduate engineering students with the goal of identifying key EME attributes that may be interwoven into the current undergraduate engineering curriculum. The result has been the realization that EME behavior and motivation is not correlated as measured within this study, yet the EME behavior is positively correlated to EME exhibited skills. As an EME’s behavior (“high” Dominance, and “low” Steadiness) is increased, the associated skills also increase. Freshmen and senior engineering students also exhibit this same general SEM or “fingerprint”, but at a lower level, indicating that a gap exists between what EMEs exhibit and what undergraduate engineering students possess. This finding provides specific attributes (leadership, employee development/coaching, conflict management, flexibility, goal orientation, persuasion, and futuristic thinking) that can be enhanced in the
Page 25.913.19
engineering undergraduate curriculum that may facilitate the reinforcement of these key EME attributes. This study also indicated that there is not a significant difference between the above seven skills in freshmen and senior undergraduate engineering students. This finding illustrates that opportunity to make an impact in engineering education, thus facilitating the increase in key attributes during an engineering academic career. These findings suggest that there is a need to develop skills that complement technical abilities. Project based learning, and co-curricular experiences are important avenues for growth and development of personal and professional competencies. It should be noted that Practicing Engineers, not EMEs, exhibit a different “fingerprint”. This “fingerprint” is characterized by a “low” Dominance and “high” Steadiness behavior and increased emphasis on customer service. The Practicing Engineer population had a relatively small sample size which precluded invariance testing, but the Practicing Engineer SEM did suggest lower interpersonal skills, lower creativity, lower goal orientation, and lower negotiation skills w.r.t. the EME population. Future consideration is suggested in the area of the underlying reliability of the TTI Performance DNA data. The study populations exhibited standardized Cronbach’s alpha (α) values of 0.720 -0.761, when current literature suggests that a minimum value of (α = 0.8) be considered the minimum value of “reasonably reliable” data. It is acknowledged that any SEM evaluation can only be as strong as the underlying data, therefore further evaluation of the data reliability is suggested. In addition, the sample size of the Practicing Engineer population should be increased to at least 150 samples to support the existing Practicing Engineer SEM evaluation. This increased sample size would afford the invariance testing across EMEs and Practicing Engineers, testing the significance of the valence change of the Engineer Dominance and Steadiness manifest variables as well as other Skill attributes. An additional future consideration is the critique and final decision of the discriminating skills (leadership, employee development/coaching, conflict management, flexibility, goal orientation, persuasion, and futuristic thinking) used in invariance testing as an “EME definition” which can be used to investigate undergraduate engineering educational gaps required in tomorrow’s engineers. This research represents the beginning of a long-term study. Additional data is being collected and further analysis underway. What is important to consider, is that empirical research is underway to identify opportunities to develop and offer undergraduate engineering students the platform to blend the technical, professional and personal competencies associated with growth and performance in a global economy. References
[1] Kriewall, T.J., & Mekemson, K. (2010). Instilling the entrepreneurial mindset into engineering undergraduates. The Journal of Engineering Entrepreneurship, 1(1), 5:19.
Page 25.913.20
[2] Ottino, J. (2011). Open letter from Dean Julio M. Ottino, Northwestern, School of Engineering and Applied Science. Retrieved from http://www.mccormick.northwestern.edu/about/ [3] Ibid
[4] Benade, S., & Heunis, C. (2005). Management development: more right brain skills required. Management Today, 21(6), 54-58. [5] Zhand, Y., and Probost, D. (2009). Teaching Engineering for Students with Right Brain Dominance. Proceedings of the 2009 Midwest Section Conference of the American Society for Engineering Educators. http://www.asee.org/documents/sections/midwest/2009/Zhang-‐and-‐Probst-‐14.pdf
[6] Crawford, P., Lang, S., Fink, W., Dalton, R., amd Fielitz, L. (2011). Comparative Analysis of Soft Skills: What is important for New Graduates. Michigan State University and the University Industry Consortium. Pp. 1-24. [7] Von Stamm, B. (2011). Traditional MBA skills are no longer enough. Financial Times, Business Education. Monday, December, 19, 2011, p. 13. [8] Pistrui, D. (2007). Innovate now: Building an Innovation Talent Pool. World Business Chicago, the Illinois Department of Commerce, and Illinois Institute of Technology.
[9] Von Stamm, B. (2011). Traditional MBA skills are no longer enough. Financial Times, Business Education. Monday, December, 19, 2011, p. 13. [10]. Pistrui , D., Bonnstetter, R., Bonnstetter, B., and Fry, C. (2011). Creating, Educating and Assessing a New Class of Entrepreneurial Minded Engineers. Journal of Engineering Entrepreneurship, V. 2, No 2, Special Issue 2011.
[11] Kriewall, T.J., & Mekemson, K. (2010). Instilling the entrepreneurial mindset into engineering undergraduates. The Journal of Engineering Entrepreneurship, 1(1), 5:19.
[12] Ibid
[13] Tabat, D. (2011). Is American industry ready for entrepreneurially minded engineers? Retrieved from http://www.keennetwork.com/wp-content/uploads/2010/10/Is-American-Industry-Ready-for-Entrepreneurially-Minded-Engineers.doc
[14] Pistrui , D., Bonnstetter, R., Bonnstetter, B., and Fry, C. (2011). Creating, Educating and Assessing a New Class of Entrepreneurial Minded Engineers. Journal of Engineering Entrepreneurship, V. 2, No 2, Special Issue 2011.
[15] Williams, L.J., Edwards, J.R., and Vandenberg, R.J. (2003). Recent Advances in Causal Modeling Methods for Organizational and Management Research. Journal of Management. 29, Issue 6, 903-936. [16] Wallgren, L. G., and Hanse, J. J. (2007). Job Characteristics, Motivators, and Stress Among Information Technology Consultants: A Structural Equation Modeling Approach. International Journal of Industrial Ergonomics. 37, 51-59. [17] Layer, J.K., and Gwaltney, C. 2009. International Capstone Design Projects: Evaluating Student Learning and Motivation Associated with International Humanitarian Projects. American Society for Engineering Education (ASEE) 116th Annual Conference and Exposition, June 14 – 17, 2009. Austin, Texas, USA. AC 2009-922. [18] Marston, W. (1979). The Emotions of Normal People. Persona Press, San Francisco, CA
Page 25.913.21
[19] Bonnstetter, B., and Suiter, J. (2010). The Universal Language DISC, A Reference Manual, Thirteenth Edition. Target Training International, LTD. Scottsdale, AZ.
[20] Cronbach, L. (1951). Coefficient Alpha and the Internal Structure of Tests, Psychometrika, 16, 3, 297-334.
[21] Nunnally, J. (1978). Psychometric Theory. McGraw-Hill, NY, New York, p. 245.
[22] Maxim, P.S. (1999). Quantitative Research Methods in the Social Sciences. New York, NY: Oxford University Press. 104-166, 251-278. [23] http://press.linkedin.com/about
[25] Layer, J.K., Karwowski, W., and Furr, A. 2009. The Effect of Cognitive Demands and Perceived Quality of Work Life on Human Performance in Manufacturing Environments. International Journal of Industrial Ergonomics. 39, 413-421 [25 Ibid
Page 25.913.22