Embed Size (px)
Citation preview

Mapping Text with Phrase Nets
Frank van Ham, Martin Wattenberg and Fernanda B. Viégas
Fig. 1. Scanning the bible for textual matches to the pattern ‘X begat Y’ reveals a network of family relations.
Abstract— We present a new technique, the phrase net, for generating visual overviews of unstructured text. A phrase net displays a graph whose nodes are words and whose edges indicate that two words are linked by a user-specified relation. These relations may be defined either at the syntactic or lexical level; different relations often produce very different perspectives on the same text. Taken together, these perspectives often provide an illuminating visual overview of the key concepts and relations in a document or set of documents.
Index Terms— Text visualization, tag cloud, natural language processing, semantic net.
1 INTRODUCTION Scholars have long dreamed of turning text—from books to entire libraries—into maps. A visual perspective on a text has many potential uses. A map can serve as a summary and provide a jumping-off point for close reading. Mapping techniques may also be used to compare multiple texts, whether books by different authors or speeches by different politicians.
Unfortunately, anyone who sets out to map a book quickly runs into two problems. The first is purely conceptual: most interesting texts are large (a typical novel has more than 100,000 words) so some kind of analysis and summarization is necessary to make them amenable to visualization. The key issue is to define an effective unit of analysis; such a unit could range from letters to words to general concepts and ideas. Due to the current state of natural language processing, choosing the right unit involves a tradeoff between
reliability and validity. On one end of the scale, computers can reliably pick out the individual words in a book, leaving the task of putting the words together to a human. On the other end, programs that aim to extract high-level meaning from text—say a semantic network of people and their relations—face significant error rates and are easily misunderstood by their users.
The second problem in the visual display of text involves legibility. In most visualizations, one wants to use spatial position as a meaningful variable. Yet a readable set of words obeys spatial constraints on alignment, grouping, and type size. The conflict between positioning and legibility can lead to displays that are hard to read or where spatial position is essentially random.
In this paper we introduce a new text mapping technique, the phrase net, which seeks a balance both in analysis and display. Our unit of analysis is a “phrase,” i.e., a particular relationship between words that can be defined using either simple pattern matching or syntactic analysis. This unit provides a higher level of analysis than individual words, but is easily understood by users and does not require unreliable artificial intelligence. Our visual displays use a standard graph layout engine that has been modified to ensure that text is readable via constraints on alignment and grouping.
In addition to describing the design and implementation of the phrase net, we also provide a series of sample use cases. Some of these were derived from our own exploration. To find others, we deployed a simplified version of the phrase net on the Many Eyes
• Frank van Ham is with IBM Research, E-Mail: [email protected]. • Martin Wattenberg is with IBM Research, E-Mail: [email protected]. • Fernanda B. Viégas is with IBM Research, E-Mail: [email protected]. Manuscript received 31 March 2009; accepted 27 July 2009; posted online 11 October 2009; mailed on 5 October 2009. For information on obtaining reprints of this article, please send email to: [email protected] .

site, where any user could create their own visualizations of text. While the period of deployment was too short to draw quantitative conclusions about usage, it resulted in several interesting usage scenarios that had not occurred to us.
2 RELATED WORK To place the phrase net in context, we review some existing systems that create maps of text. We focus on the two questions mentioned in the introduction: What is the unit of textual analysis? How does the visualization handle legibility concerns?
At the simplest level of analysis, many visualizations focus on individual words. The simplest example is the tag cloud. Conventional tag clouds display up to several hundred words, typically aligning them in rows for readability. This method of alignment, however, means that the only use of the spatial dimension is the order of words (typically alphabetical). More advanced forms of tag clouds, such as Wordle [6] or Word Clouds [2] enhance readability through careful typography—at the expense of a near-random spatial layout.
Not all visualizations that are based on single words dispense with space as a variable, however. The TextArc tool [5] uses a projection that places words in a two-dimensional space based on where they occur in the text. This method adds another layer of information, letting viewers see which words are only used in specific sections, and ensuring that two words that consistently occur in the same passages will be near each other onscreen. The downside, however, is legibility: the number of words shown, coupled with their continuously varying locations, means that letters overlap and there are often no clear groupings.
This legibility problem is shared by other systems that perform some type of multidimensional scaling. In the algorithm of Sarkar et al. [17], for example, word co-occurrence relations are analyzed instead of simple word frequency. Based on this co-occurrence data, words are mapped to points in two-dimensional space. As with TextArc, the result may be intriguing, but the resulting display has no clear visual organization and can be hard to read
Some visualization systems attack the problem by using semantic analysis. ThemeRiver [10], for example, displays the ebb and flow of “themes” over time in a large body of text. The ThemeRiver display typically only tracks a few themes at a time (published examples show at most a few dozen) and therefore can handle label typography in the same way as a standard graph.
The Docuburst technique [3] and Gist Icons [4] use a pre-existing ontology, Wordnet [7], to group words that have related meanings. While this allows for a natural summary, it is not without problems. Words with multiple meanings can only occur in one location. The categories in Wordnet, like most ontologies, are not completely intuitive—e.g., few users will naturally understand the distinction between an “entity” and an “object,” or expect to see “laryngitis” listed as a type of “psychological feature.” Both systems rely on radial-style visualizations that present a typographical challenge. Gist Icons [4] for instance, shows over a hundred word frequencies at once, literally leaving no room for any text. The Docuburst system uses interaction to tackle this problem.
Another common approach—one that we follow as well—is to depict relationships in a text using a network. The analogy is with the idea of a “semantic net” [18], which has often been used to represent relations between concepts. Often these nets are based on co-occurrence relations. For example [14] creates a network of related terms from patent filings. Peter Cho created a network of words from news stories [1] based on information about which words often followed which other words.
These systems can be beautiful and informative, but the approach suffers from two drawbacks. First, when a typical graph layout algorithm is used to arrange words, it can lead to a set of jumbled text, much as in the case of multidimensional scaling. (The Cho example is beautiful, but was adjusted by hand.) Second, simply looking at co-occurrence shows only one generic type of relation. In
any complicated text there are more specific relationships: agents acting on objects, people possessing things, actions taking place at locations. Simply looking at co-occurrence gives no way of focusing on a type of relation.
The technique presented in this paper attempts to address these shortcomings. We analyze text at the level of relations between words, rather than individual words, and allow users to specify those relations in a variety of ways. We also tune a standard graph layout to create a more legible arrangement of words.
3 HOW THE PHRASE NET WORKS The phrase net extracts and then visualizes networks of terms from bodies of text. In this section we give a basic description of these two steps and the ideas behind them. We do this by conceptually separating the visualization into different stages that map directly to the two main questions defined in the introduction. In the text analysis stage we define the unit of analysis and extract a network of terms from the raw text. Subsequently, in the network abstraction and visual representation stages we deal with the problem of rendering this network effectively. This section discusses each of these stages separately.
3.1 Text analysis To convert a text into a network we define the nodes to be a subset of words occurring in the text, and edges to represent certain relations between these words. There are many ways to choose these node and edge sets. For example, one straightforward method is to take the nodes to be all words, and link two terms if they appear in immediate succession in the text without punctuation between them. We now discuss two finer-grained methods, each based of which uses a certain kind of template to define connections between words. The first method uses syntactic patterns to define word relations, while the second relies on orthographic pattern matching.
3.1.1 Syntactic linking A natural thought is to use patterns based on the syntactic structure of English sentences. To explore this idea, we used the open-source Stanford Parser [13]. Conveniently, one of the output formats of this system is a “typed dependency parse,” which breaks a sentence into pairs of words connected by relations. The relations can be any of several dozen types, ranging from common types like “conjunct” (as in “A and B”) to very specific, such as “element of compound number.”
Given a text that has been parsed in this way, our software allows the user to specify one or more of these relations and then creates a graph where nodes correspond to words, and edges indicate pairs of words that are connected by the specified relations. There are two advantages of using these dependencies rather than relying on a simple method such as word adjacency. First, it gives far more fine-grained control over the network, allowing the user to spotlight only certain types of relationships in the text. Second, it avoids obvious problems inherent in simple word-order approaches: in a sentence like “the keys were found,” a typed-dependency parse will know that “keys” and “found” are related.
Unfortunately, this increased sophistication comes at the price of an unwieldy amount of processing power. For example, running the parser on the novel Pride and Prejudice (about 1 MB of text, and slightly under 6,000 sentences) requires more than 24 hours of CPU time on a Windows Thinkpad T60 with 2GB of RAM. This is more time than it would take an average human to read the whole book. Such a lengthy processing time significantly increases the upfront cost [21] of the visualization, and makes interactive exploration of different corpora a challenge.

Fig 1. Edge compression: Collapsing networks based on identical network neighborhoods. The darker nodes in (a) all have identical neighbor sets {a} and can be collapsed into a singe clustered node. Although the nodes in (b) are all structurally interchangeable they have different neighbor sets {i,j}, {h,j} and {h,i} respectively; we can still merge them if we consider Nself set {h,i,j} instead. The graph in (c) has neighbor sets {l,m,n} for both K and O (dark blue) and Nself set {k,l,m,n,o} (light blue) for L, M and N.
A
B
C
D
E F
G K
L M N
O
H
I J
A
B C D E F G
H I J
K O
L M N
(a) (b) (c)
3.1.2 Orthographic linking To allow more rapid exploration, we investigated a second
method: simple text-based pattern matching. For example, instead of using a parser to look for possessive relations between nouns, we can define an edge (X,Y) for each literal occurrence of “… X’s Y…” which allows us to extract basic genitive relationships from the text. Similarly we can look at occurrences of “… X at Y …” which might hint at relationships between objects and places.
Using regular expressions we can define a wide variety of potentially interesting patterns. For example, we might require that both X and Y start with a capital letter, that either one is a number, or define complex patterns such as “… because X (is|are|was|were) Y …”. Matching regular expressions can be done at interactive speeds (a few seconds for a text of a million words).
We often found these simple pattern matching techniques as useful as full parse-based methods when applied to sufficiently large bodies of text. The basic idea is reminiscent of Hearst patterns [11] for extracting hypernym relations—with enough data, seemingly “superficial” methods produce useful results. A bonus is that simple pattern matching can be explained to users without resorting to technical linguistics terminology.
Figure 2 shows a comparison of two networks generated by these two different methods (with filtering as described below). Although the main terms are very similar, the syntactical parser also picks up occurrences such as “looked at the time”. The orthographical parser ignores the “looked at the” match, since “the” is classified as a stop word.
3.2 Network filtering After parsing the text, we are left with a graph where nodes
represent words in the source text and edges represent a particular connection between those words. The edges are directed—representing the order the words occurred in the slots in the pattern—and weighted according to the number of times the pattern was matched. This graph is potentially too large to render legibly on screen, so we include a filtering phase to reduce its size. As a first
step, we provide the user the option of removing nodes representing commonly occurring words in the English language. These “stopwords” often do not add useful information content and greatly increase the density of the graph as they occur in combinations with many other words.
The next step is to rank words by relevance. There are several simple possible relevance measures. One is degree in the network; another is overall frequency in the text. In our prototype we found that overall frequency was a good relevance measure, with the additional benefit that the resulting display was directly analogous to a word cloud view. Given a relevance rating, we allow the user to set a maximum number N of nodes to display. Our software then looks at the induced subgraph for the N most relevant nodes, discards any degree-zero nodes, and displays the resulting graph, Both this step and the stopword filtering can be executed efficiently; stopword filtering is easily integrated with the pattern matching stage, while the second step involves a single sort of the terms and a linear time filtering operation.
3.3 Edge compression Despite the simplification induced by node filtering, standard
graph layouts often produced busy and confusing graphs. One common problem involved a node with many degree-one neighbors. Most graph layouts, when applied to such a node, will produce a “starburst” of edges evenly spread across different angles and distances. This can be effective when nodes are drawn as points or circles, but creates an unreadable mass of overlapping text when the nodes are words.
To address this problem and draw the graph in a “text friendly” manner, we perform a step we call edge compression. To motivate this step, note that all the degree-one nodes in a starburst are topologically equivalent, in the sense that permuting two of them will result in an isomorphic graph. Since they are equivalent in this sense, we collapse them to a single large node, and draw them in a nicely flush-left vertical column, with a single edge drawn between this column and the central node of the starburst (Fig. 1a). While information is lost about the specific edge weights, all the original topological information remains available.

This method generalizes naturally: whenever we have a set of nodes that are topologically equivalent, we can collapse them into a single supernode. These sets form equivalence classes, so the supernodes are well-defined. Furthermore, it is immediate that sets of equivalent nodes must either be completely disconnected from each other, or must form a clique. We indicate the difference by drawing a small self-loop for cliques as in Fig 1b. Edge-compression saves time in the layout procedure, improves the quality of the resulting layout, and creates a cleaner visual representation. Fortunately, it is also straightforward to perform this calculation efficiently. For each node x, with neighbor set N(x), define Nself(x) := N(x) + {x}. Nodes x and y are topologically equivalent if N(x) = N(y) or Nself(x) = Nself(y). Note that this computation can be applied to both directed and undirected graphs. For undirected graphs we can directly compare the set of neighbors, while for directed graphs we need to compare neighbors connected by an in-edge and neighbors connected by an out-edge separately. In our particular case direction is relevant, so we perform directed edge compression.
For simple (i.e. no self loops, no multi-edges) unweighted graphs, the edge-compressed representation is lossless, meaning that all basic information can still be extracted from the resulting diagram (Fig. 1c). The actual reduction in the number of edges depends on the structure and density of the graph, but we the low complexity and often lossless compression of the network representation potentially makes this algorithm valuable to other graph drawing cases.
3.4 Visual Representation After data extraction and network filtering we are left with a network containing several clusters, some composed of a single node and others made up of a collection of topologically equivalent nodes. The clusters are connected by edges where the weight of an edge depends on the number times a matching pattern was found between the term or terms in the two clusters.
3.4.1 Layout We render each connected component in this network using a node-link diagram, where individual nodes are replaced with a rendered version of the term(s) they represent. Each term is scaled proportionally to the total number of occurrences in the text, as in a tag cloud. For clusters containing multiple terms, we render all the
terms in a vertical list, scaling each of them individually based on frequency of occurrence. Layouts are computed using a stress majorization algorithm [8]. A post-processing step removes any remaining overlaps using an algorithm based on the Force-Transfer approach [12], and enforces a minimum distance between words. Individual connected components in the network are laid out using an incremental approach that tries to minimize the total area of the layout, while avoiding overlap. In a final step, node coordinates in the layout are scaled so that the resulting layout matches the aspect ratio of the screen.
3.4.2 Encoding Since connections between clusters are typically directional (i.e. there is a match for ‘cold and strange’ in Fig. 3, but ‘strange and cold’ never occurs in the text) we indicate them with arrows, where the thickness of an arrow is proportional to the weight of an edge. Every term is rendered in a heavy font with compressed spacing, for a compact and coherent visual representation. As an additional encoding, we decided to encode the ratio of out-degree to in-degree for a node and render terms with a high ratio (i.e. more out-edges than in-edges) in a darker color. This allows the user to quickly spot terms that only occur in the first or last part of the matching pattern. The colors follow a sequential palette running from light to dark blue; an early version of the system used a diverging color scheme that seemed to lead to a cluttered display. Basic zoom and pan controls allow the user modify the viewport, while popover hints provide more contextual information on demand, such as the actual textual matches for a relationship.
3.5 User Interface and Many Eyes deployment We developed several versions of the phrase net. The first two were aimed at experts, and allowed users either to type in regular expressions as matching templates or—if a parsed text had been loaded—to choose syntactic relationships from a menu. While these simple interfaces were effective for our own experimentation, we discovered they were confusing for users who were unfamiliar with the software.
To better understand how people might spontaneously use phrase nets, we deployed a version on the Many Eyes [19] web site. Because of the long time required to perform syntactic parsing, this
Fig 2. Comparing phrase nets of Pride and Prejudice. The left network was generated by an orthographical parser matching ‘X at Y’, while the right network was generated by a syntactical parser looking for the preposition ‘at’. Both manage to identify major locations in the novel., yet the orthographical parser finished in under a second, whereas the syntactical parser took over 24 hours.
version used regular expression templates as a matching device. Of course, it would be unreasonable to expect novice users to master standard notations for regular expressions. This posed an interface challenge: how to combine maximum flexibility with an accessible user experience. To that end, we iterated over several UI options, testing them informally with users in our lab.
We settled on using a simplified version of the basic regular expression syntax: instead of the cryptic (\w+) notation to match an arbitrary word, we used a single asterisk. For instance, if a user wants to define a pattern that looks for two words connected by “and”, she would type in: “* and *”. Users may either enter matching patterns in this simplified form or enter them in full regular expression syntax.
In addition to this text-based input method, we also included a “beginner’s menu” with a number of preset patterns. This menu not only lists a series of simple regular expressions to get the user started, it also serves as a visual guide for how phrase net patterns work (Figure 3). On this list, each pattern appears as a pairing of words with a curved arrow between them, labeled with that pattern’s connector. The first word of the pair appears in dark blue and the second in light blue. This distinction echoes the phrase net color coding. Users’ choice of a preset pattern is reflected on the more advanced free-text input field so that novices may learn how the simplified regular expression syntax works. Finally, users may also
change the maximum number of words on the graph and choose whether to include stop words in the network.
4 EXAMPLE USE CASES The examples in this section illustrate how phrase nets have been utilized so far and the kinds of insight that have been generated by these graphs. We discuss graphs that have been created by the authors as well as those generated by Many Eyes users.
4.1 Styles of exploration Because of its querying capability, a phrase net provides viewers
with great flexibility when exploring a piece of text. Yet there are two main exploratory processes that seem natural when working with phrase nets: using the same regular expression to compare different texts and using different regular expressions to explore the same text.
One example of applying the same regular expression to different texts comes from a Many Eyes user who utilized a phrase net to examine different books in the Bible (see Fig. 4). The pattern “X of Y” reveals stark differences between the Old and New Testaments. While the Old Testament clearly shows the centrality of “Israel”—phrases such as “Children of Israel,” “King of Israel,” and “Land of Israel” loom large—the New Testament shifts in emphasis to “Son of God” and “Kingdom of God.”
Fig 3. The Phrase Net user interface applied to James Joyce’s Portrait of the Artist as a Young Man. The user can select a predefined pattern from the list of patterns on the left or define a custom pattern in the box below. This list of patterns simultaneously serves as a legend, a list of presets and an interactive training mechanism for regular expressions. Here the user has selected “…X and Y…”, revealing two main clusters, one almost exclusively consisting of adjectives, the other of verbs and nouns. The highlighted clusters of terms have been aggregated by our edge compression algorithm.

On the other hand, applying different expressions to the same text can reveal a series of interrelated conceptual networks. The phrase nets of Jane Austin’s novel Pride and Prejudice in Fig. 5 illustrate this. Matching “X and Y” shows a network of concepts and people. The main characters appear neatly organized in two clusters: Jane, Elizabeth, Lydia, Kitty, Catherine and Mr. Bingley form a central cluster, whereas “mother,” “aunt,” and “uncle” keep some distance. Positive attributes such as “sense,” “disposition,” “humour,” “kindness” cluster together while less flattering qualities such as “pride,” “conceit,” “vanity,” “folly,” and “ignorance” form a group of their own. Perhaps most interesting, to those familiar with the novel, is that “Darcy” does not appear in the network—in a certain sense he is the most solitary major character.
If we analyze the same text with the pattern “X at Y” we obtain an entirely different network that reveals the set of locations inhabited by the characters in the novel and the events that take place at those locations. In a sense, the user can direct exploration towards a particular dimension of the text by intelligently choosing the pattern to match for.
Figure 1 shows the result of another targeted pattern. Here we have analyzed the whole bible using the pattern “X begat Y”, a specific formulation from the King James Bible indicating a parent - child relationship. The resulting graph illustrates the lengthy genealogies that are recorded by many different books in the bible. The network also uncovers a number of defining aspects of these lineages, such as the importance of Abraham.
4.2 Regular expressions and matching The patterns we have shown so far are of the form “X <connector> Y”, where the connector is either a separate word or a phrase. However, regular expressions also allow us to specify patterns that match for specific pre- and postfixes to X and Y. Previously, the authors worked with a humanities scholar to analyze a set of 7,000 British novel titles between 1740 and 1850 [15] —in fact, much of the motivation behind building phrase net comes from this collaboration. This scholar was interested in how the use of simple syntactic constructions such as “X of the Y” reflected changes in literary style over the centuries.
Fig 5. Matching different patterns on the same text. Here we analyzed Jane Austen’s Pride and Prejudice with “X and Y” and “X at Y” respectively. The left image shows relationships between the main characters amongst others, while the right image shows relationships between locations.
Fig 4. Matching the same pattern on different texts. Here we used the pattern “X of Y” to compare the old and new testaments. Israel takes a central place in the Old Testament, while God acts as the main pattern receiver in the New Testament.
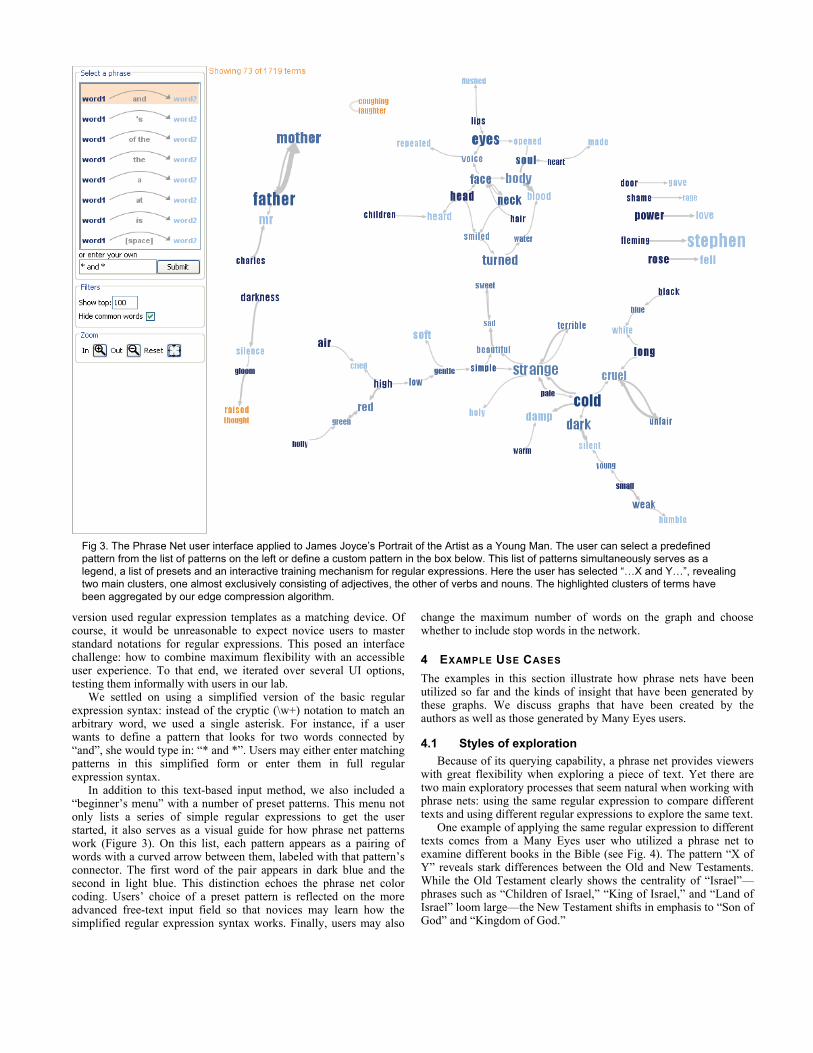
Indeed, simple patterns can reveal a great deal. For instance, a pattern such as “X’s Y” might function as a proxy for understanding power relations. A phrase net of the book titles showing “X’s Y” highlights possession and power in interesting ways (Fig. 6). The graph reveals two main focal points: ‘woman’ and ‘daughter.’ Despite the seeming similarities in the connections between these clusters, the difference in color indicates that they are quite opposite in their relationship to the rest of the graph. Whereas daughters are “possessed” by others — king’s daughter, farmer’s daughter, soldier’s daughter — women “possess” things: woman’s story, woman’s life, woman’s love. Interestingly, even though daughters are other people’s possession, women do not possess people, instead, they are related to abstract ideas such as love, revenge, and story.
The graph also reveals another unexpected pair of female clusters around ‘bride’ and ‘wife’ (Fig. 6). While ‘wife’ is connected to respectable people—e.g. officer, ambassador, banker—‘bride’ is associated with more nefarious figures such as pirate, sailor and bandit. Although one could argue that these patterns could have been found by a simple textual search for `‘s` (while conveniently ignoring the large number of false hits from common contractions like it’s), a phrase net immediately shows all the matches in context.
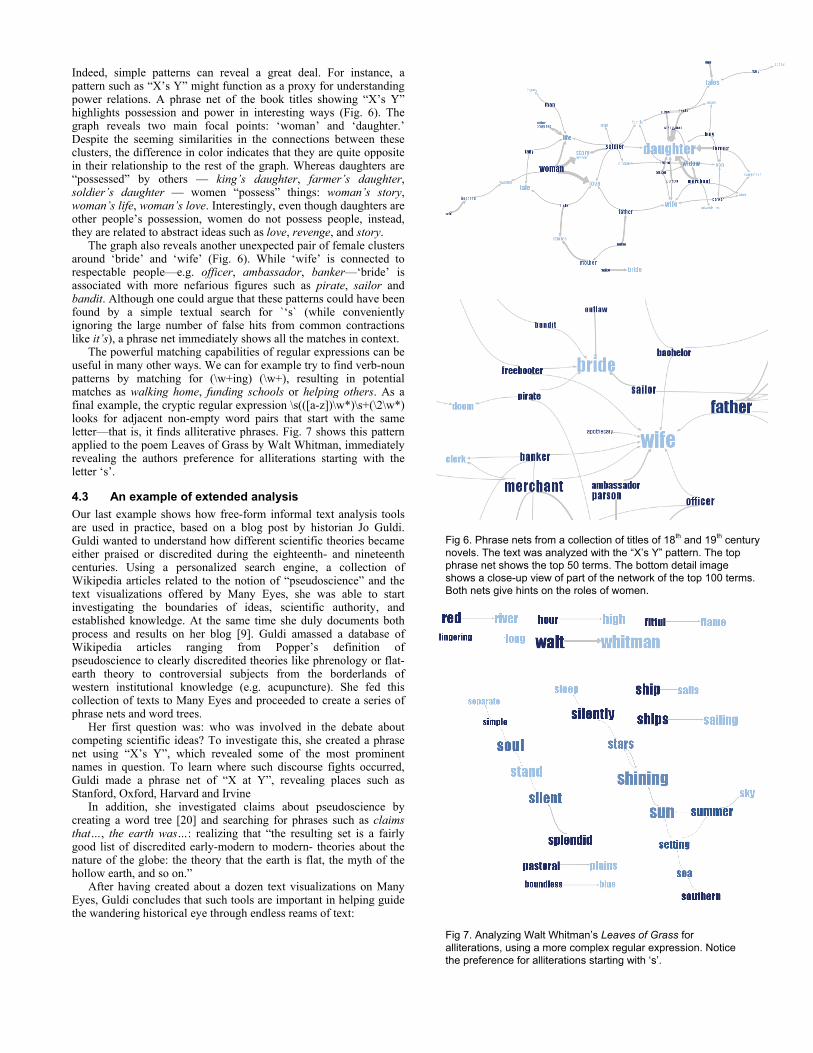
The powerful matching capabilities of regular expressions can be useful in many other ways. We can for example try to find verb-noun patterns by matching for (\w+ing) (\w+), resulting in potential matches as walking home, funding schools or helping others. As a final example, the cryptic regular expression \s(([a-z])\w*)\s+(\2\w*) looks for adjacent non-empty word pairs that start with the same letter—that is, it finds alliterative phrases. Fig. 7 shows this pattern applied to the poem Leaves of Grass by Walt Whitman, immediately revealing the authors preference for alliterations starting with the letter ‘s’.
4.3 An example of extended analysis Our last example shows how free-form informal text analysis tools are used in practice, based on a blog post by historian Jo Guldi. Guldi wanted to understand how different scientific theories became either praised or discredited during the eighteenth- and nineteenth centuries. Using a personalized search engine, a collection of Wikipedia articles related to the notion of “pseudoscience” and the text visualizations offered by Many Eyes, she was able to start investigating the boundaries of ideas, scientific authority, and established knowledge. At the same time she duly documents both process and results on her blog [9]. Guldi amassed a database of Wikipedia articles ranging from Popper’s definition of pseudoscience to clearly discredited theories like phrenology or flat-earth theory to controversial subjects from the borderlands of western institutional knowledge (e.g. acupuncture). She fed this collection of texts to Many Eyes and proceeded to create a series of phrase nets and word trees.
Her first question was: who was involved in the debate about competing scientific ideas? To investigate this, she created a phrase net using “X’s Y”, which revealed some of the most prominent names in question. To learn where such discourse fights occurred, Guldi made a phrase net of “X at Y”, revealing places such as Stanford, Oxford, Harvard and Irvine
In addition, she investigated claims about pseudoscience by creating a word tree [20] and searching for phrases such as claims that…, the earth was…: realizing that “the resulting set is a fairly good list of discredited early-modern to modern- theories about the nature of the globe: the theory that the earth is flat, the myth of the hollow earth, and so on.”
After having created about a dozen text visualizations on Many Eyes, Guldi concludes that such tools are important in helping guide the wandering historical eye through endless reams of text:
Fig 6. Phrase nets from a collection of titles of 18th and 19th century novels. The text was analyzed with the “X’s Y” pattern. The top phrase net shows the top 50 terms. The bottom detail image shows a close-up view of part of the network of the top 100 terms. Both nets give hints on the roles of women.
Fig 7. Analyzing Walt Whitman’s Leaves of Grass for alliterations, using a more complex regular expression. Notice the preference for alliterations starting with ‘s’.

I spend a lot of my time reading endless pamphlet and newspaper
wars, trying to figure out who the sides are in the railway debates and what they care about. While I don't think that I'll ever be freed from reading, algorithms like these promise to give me some of the keywords that can offer me a short cut direct to some of the major controversies in question. The paragraphs on railroads that accuses others of “interest” reference which place-names, for instance? […]
A machine that can predict who the controversialists were and where the places they argued about were located would save the historical researcher untold time.
Although we cannot draw any definitive conclusions from this single case, it illustrates some of the needs of and challenges confronting modern day humanities scholars. Although many of their databases are in digital form, they do not have the tools to quickly explore this data at a higher level of abstraction. Any tool that can create a projection of the text that highlights one particular aspect can be an invaluable asset.
5 CONCLUSION We have introduced the phrase net, a new technique for mapping
unstructured text. The phrase net technique consists of two steps. First is a pattern matching phase, in which linkages are defined between words based on user-defined templates. The second phase involves laying out and rendering the graph. The layout phase includes a new, general clustering procedure that reduces the complexity of the graph while retaining its information content. Finally, we provided examples of spontaneous usage on the public Many Eyes site, along with some of our own scenarios, in which the phrase net provides a lens onto interesting aspects of a text.
There are several natural avenues for future work. First, one might plug many other possible matching template methods into the basic phrase net technique. One might also allow the user to filter words in ways other than by simple word frequency, combining semantic and syntactic information. It is easy to imagine scenarios where a user might want a net consisting only of people, or only of nouns that are related to emotions. Similarly, one might match only patterns that occurred in particular sentences, such as those spoken by a particular character in a novel. It might also be possible to plug in semantic classification services such as openCalais [16] to identify central actors in our document. Finally, applying phrase nets to languages other than English may lead to new challenges.
Many additional possibilities for interaction remain. One might combine the phrase net with other visualization techniques. Often users wish to drill down into a text, and one could imagine selecting a given edge of the graph to bring up a word tree showing all the following or preceding passages to the template match. A last, promising area for future research would be to allow users to easily compare different texts using a phrase net. For example, one might ask if different novelistic genres have distinctive networks, either in word usage or overall topology. Or one might wish to see how document collections change over time, e.g., comparing phrase nets of news stories from day to day.
In addition to the contribution of the technique itself, we believe the design of the tool itself provides useful principles for text visualizations. One is the notion of multiple viewpoints. A novel is much like a high-dimensional numeric data set: there is unlikely to be a single perfect view. Instead, as with high-dimensional data, the best way to visualize it may be to use multiple views. Instead of choosing different projections one may want to choose different types of relationships in the text to highlight. The phrase net provides this control by allowing the user to specify the matching templates. A second theme in the design of the phrase net is the careful tuning of the display to allow for legibility of the text: In addition to careful typographic choices, we have modified the graph layout method to maximize readability. We believe both these themes—multiple
viewpoints, and special tuning of existing geometric techniques—are likely to continue in future text visualization work.
ACKNOWLEDGEMENTS The authors would like to thank Franco Moretti and Jonathan Feinberg for insightful discussions and inspiration, as well as other members of our research group and the anonymous reviewers for their useful comments on an earlier version of this paper.
REFERENCES [1] P. Cho, News Story Maps, http://typotopo.com/projects.php?id
=mappingnews, retrieved March 28, 2009. [2] J. Clark, Neoformix Blog, http://neoformix.com/, retrieved March 28,
2009. [3] C. Collins, DocuBurst: Document Content Visualization Using
Language Structure. In Proceedings of IEEE Symposium on Information Visualization, Poster Compendium, IEEE CS Press, 2006.
[4] P. DeCamp et al., Gist Icons: Seeing Meaning in Large Bodies of Literature. Proceedings of IEEE Symposium on Information Visualization, Poster Compendium, IEEE CS Press, 2005.
[5] W.B. Paley, TextArc: Showing Word Frequency and Distribution in Text. In Proceedings of IEEE Symposium on Information Visualization, Poster Compendium, IEEE CS Press, 2002.
[6] J. Feinberg, Wordle, http://www.wordle.net/, retrieved March 28, 2009. [7] C. Fellbaum (eds), WordNet : An Electronic Lexical Database, The
MIT Press, 1998. [8] E. Gansner, Y. Koren and S. North, Graph Drawing by Stress
Majorization, Proc. 12th Int.Symp. Graph Drawing (GD’04), LNCS 3383, pages 239–250, 2004.
[9] J. Guldi, Inscape Blog, http://landscape.blogspot.com/, retrieved March 28, 2009.
[10] S. Havre et al., ThemeRiver: visualizing thematic changes in large document collections, IEEE Transactions on Visualization and Computer Graphics, Vol. 8, No. 1, pp 9 – 20, 2002.
[11] M. Hearst, Automatic Acquisition of Hyponyms from Large Text Corpora. Proc. of the Fourteenth International Conference on Computational Linguistics, 1992.
[12] X. Huang and W. Lai, Force-Transfer: A New Approach to Removing Overlapping Nodes, in Graph Layout, in ‘25th Australian Computer Science Conference’, pp 249-358, 2003.
[13] D. Klein and C.D. Manning. Fast Exact Inference with a Factored Model for Natural Language Parsing. In Advances in Neural Information Processing Systems 15 (NIPS 2002), pp. 3-10, 2003.
[14] L. Leydesdorff, The university-industry knowledge relationship: Analyzing patents and the science base of technologies, Journal of the American Society for Information Science and Technology, Vol. 55 No. 11, pp 991 – 1001, 2004.
[15] F. Moretti, Graphs, Maps, Trees: Abstract Models for a Literary History, Verso Publishing, 2005.
[16] OpenCalais, http://www.opencalais.com/, retrieved March 28, 2009. [17] P. Sarkar et al., A Latent Space Approach to Dynamic Embedding of
Co-occurrence Data, Proceedings of the Eleventh International Conference on Artificial Intelligence and Statistics AISTATS-07, 2007.
[18] S.C. Shapiro, A net structure for semantic information storage, deduction and retrieval, Proc. IJCAI-71, pp 512-523, 1971.
[19] F.B. Viégas, M. Wattenberg, F. van Ham, J. Kriss and M. McKeon, Many Eyes: A Site for Visualization at Internet Scale, IEEE Transactions on Visualization and Computer Graphics, Vol. 13, No. 6, pp 1121 – 1128, 2007.
[20] M. Wattenberg and F.B. Viégas, The Word Tree, an Interactive Visual Concordance, IEEE Transactions on Visualization and Computer Graphics, Vol. 14, No. 6. pp 1221-1228, 2008.
[21] J.J. van Wijk. The Value of Visualization. In Proceedings of the IEEE Conference on Visualization 2005, pp. 79-86, 2005.