Embed Size (px)
Citation preview
Journal of Agricultural Science; Vol. 11, No. 2; 2019 ISSN 1916-9752 E-ISSN 1916-9760
Published by Canadian Center of Science and Education
477
Mapping of Winter Crops and Second-Crop Corn in the Paraná State-Brazil, Using Multitemporal Images From MODIS Sensor
R. N. Santos1, Erivelto Mercante1, Jerry Adriani Johann1, Carlos Henrique Wachholz de Souza2, Carlos Eduardo Vizzotto Cattani1 & Alex Paludo1
1 Western Paraná State University, Cascavel, PR, Brazil 2 Federal University of Parana, Cascavel, PR, Brazil
Correspondence: Carlos Eduardo Vizzotto Cattani, Western Paraná State University (UNIOESTE), Cascavel, PR, Brazil. Tel: 55-453-220-7366. E-mail: [email protected]
Received: September 5, 2018 Accepted: November 6, 2018 Online Published: January 15, 2019
doi:10.5539/jas.v11n2p477 URL: https://doi.org/10.5539/jas.v11n2p477
The research is financed by CAPES, CNPq, Araucaria foundation.
Abstract The use of effective technologies for the monitoring of agricultural crops should seek methodologies that provide information regarding crop development, preferably before harvesting. The study of the monitoring and/or estimation of areas using vegetation indices derived from multitemporal data from MODIS sensors is being studied in the search for greater objectivity of the generated values. In this context, the objective of this study was to map areas with winter and second-crop corn using EVI/MODIS time series from the Terra and Aqua satellites, for the seasons from 2012 to 2014 in the Paraná state of Brazil. Accuracy analysis of the mappings was performed in spatial resolution images of 30 m (LISS-III and Landsat-8), to identify and validate the masks the crops of interest. The accuracy of the mapping obtained values of global precision 87.5%, 79.5%, and 82.0%, with Kappa index of 0.81, 0.69, and 0.73, in the 2012, 2013, and 2014 harvests, respectively. Comparing with data from the Brazilian Institute of Geography and Statistics (IBGE), the areas obtained by the mappings were underestimated for the second-crop corn in the 2012 and 2013 seasons and overestimated in 2014. The winter crops were overestimated for the three seasons investigated. The use of remote sensing data and techniques can contribute to a quick estimation of crop area information, and can assist in the surveys conducted by official institutions.
Keywords: EVI, Earth & Aqua, vegetation index
1. Introduction Brazil is globally recognized for its food production. This is mainly attributed to the availability of large agricultural areas, as well as technological advances in agriculture. The production of winter crops and second-crop corn is strong in the southern region of Brazil, where the climate favors their cultivation. Paraná State produced nearly 20% of second-crop corn and 59% of the total production of Brazilian winter crops in 2015 (IBGE, 2016). The notorious importance of the production of the 2nd harvest corn and of the winter crops, led to the realization of studies that enable the estimation and monitoring of these crops using remote sensing as a tool to expedite the collection of such information.
Currently, the monitoring of agricultural production in Brazil is still largely performed by questioning farmers and/or cooperatives, known as sampling, carried out by the Brazilian official bodies. This technique requires a long period of time becoming costly (Pino, 2001; Mercante, 2007; Silva Junior et al., 2014). Prior knowledge of agricultural production is important for national economic control and for supplying the internal market. As such, it is vital to obtain effective technologies that quantify the forecast of agricultural crops and the information from cultivated areas.
In this regard, remote sensing techniques have been used in agricultural monitoring given that they allow for supervision of crop production dynamics. These dynamics follow seasonal patterns related to the biological plant life cycle, soil type, climatic variations, and agricultural practices (Atzberger, 2013). The use of satellite images with moderate spatial resolution and high temporal resolution, such as those from the Moderate Resolution
jas.ccsenet.
Imaging Sindices. In(Mengue &
In this conand Hueteagriculturamultitempvariables aobjectives
Eberhardt summer crit possiblemonitoringGrosso usidate of chaof Paraná.possible to
The objectsecond-croand Aqua
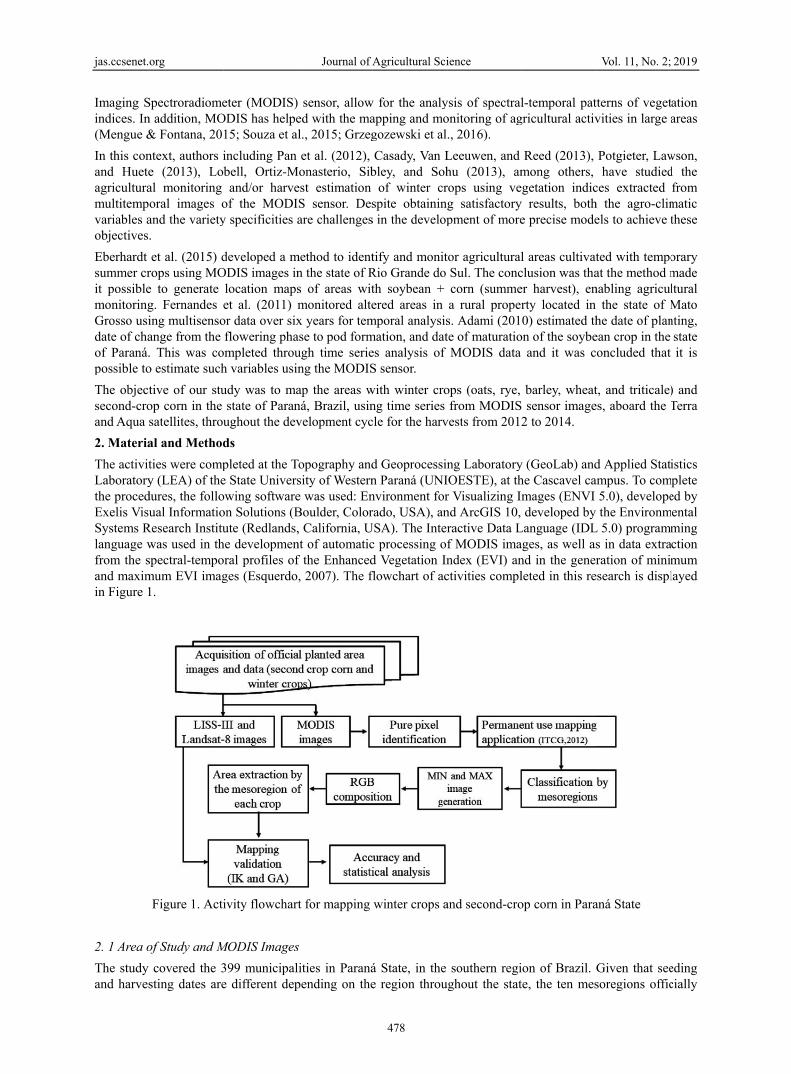
2. MateriaThe activitLaboratorythe procedExelis VisuSystems Rlanguage wfrom the sand maximin Figure 1
2. 1 Area o
The study and harves
org
Spectroradiomen addition, MO& Fontana, 20
ntext, authors ie (2013), Lobal monitoring oral images oand the variety.
et al. (2015) drops using MOe to generate g. Fernandes eing multisensoange from the . This was coo estimate such
tive of our stuop corn in the satellites, throu
al and Methodties were compy (LEA) of thedures, the folloual Informatio
Research Instituwas used in thspectral-tempomum EVI imag1.
Figure 1. Acti
of Study and M
covered the 3sting dates are
eter (MODIS) ODIS has helpe15; Souza et al
including Pan bell, Ortiz-Mand/or harve
of the MODIy specificities a
developed a mODIS images in
location mapset al. (2011) m
or data over sixflowering pha
ompleted throuh variables usin
udy was to mastate of Paranughout the dev
ds pleted at the Te State Universowing softwareon Solutions (Bute (Redlands,
he developmenoral profiles ofges (Esquerdo
ivity flowchart
MODIS Images
399 municipale different dep
Journal of A
sensor, allowed with the mal., 2015; Grzeg
et al. (2012), Monasterio, Sib
est estimation S sensor. Desare challenges
method to identn the state of Rs of areas witmonitored altex years for temase to pod formugh time serieng the MODIS
ap the areas wná, Brazil, usinvelopment cyc
Topography andsity of Westerne was used: EnBoulder, Color, California, U
nt of automaticf the Enhanced, 2007). The fl
t for mapping
s
ities in Paranápending on the
Agricultural Sci
478
w for the analyapping and mogozewski et al
Casady, Van Lbley, and Soh
of winter crspite obtainings in the develop
tify and monitRio Grande do th soybean + ered areas in
mporal analysismation, and dates analysis of S sensor.
with winter crong time series cle for the harv
d Geoprocessinn Paraná (UNInvironment forrado, USA), an
USA). The Interc processing ofd Vegetation Inflowchart of ac
winter crops a
á State, in the e region throu
ience
ysis of spectralonitoring of ag., 2016).
Leeuwen, andhu (2013), amrops using veg satisfactorypment of more
tor agriculturalSul. The conccorn (summea rural propers. Adami (201te of maturatioMODIS data
ops (oats, rye, from MODIS
vests from 2012
ng LaboratoryIOESTE), at thr Visualizing Imnd ArcGIS 10, ractive Data Lf MODIS imandex (EVI) anctivities compl
and second-cro
southern regiughout the stat
l-temporal patgricultural activ
Reed (2013), mong others, getation indic
y results, bothe precise mode
l areas cultivatclusion was thaer harvest), enrty located in 0) estimated th
on of the soybeand it was c
barley, wheat sensor image2 to 2014.
y (GeoLab) andhe Cascavel camages (ENVI developed by
Language (IDLages, as well asnd in the generleted in this re
op corn in Para
ion of Brazil. te, the ten mes
Vol. 11, No. 2;
tterns of vegetvities in large
Potgieter, Lawhave studied
ces extracted h the agro-climels to achieve
ted with tempoat the method mnabling agricul
the state of Mhe date of planean crop in the oncluded that
t, and triticale)es, aboard the
d Applied Statampus. To com
5.0), developethe Environm
L 5.0) programs in data extraration of mini
esearch is displ
aná State
Given that seesoregions offic
2019
tation areas
wson, d the from
matic these
orary made ltural Mato nting, state it is
) and Terra
istics mplete
ed by mental
ming action mum layed
eding cially
jas.ccsenet.
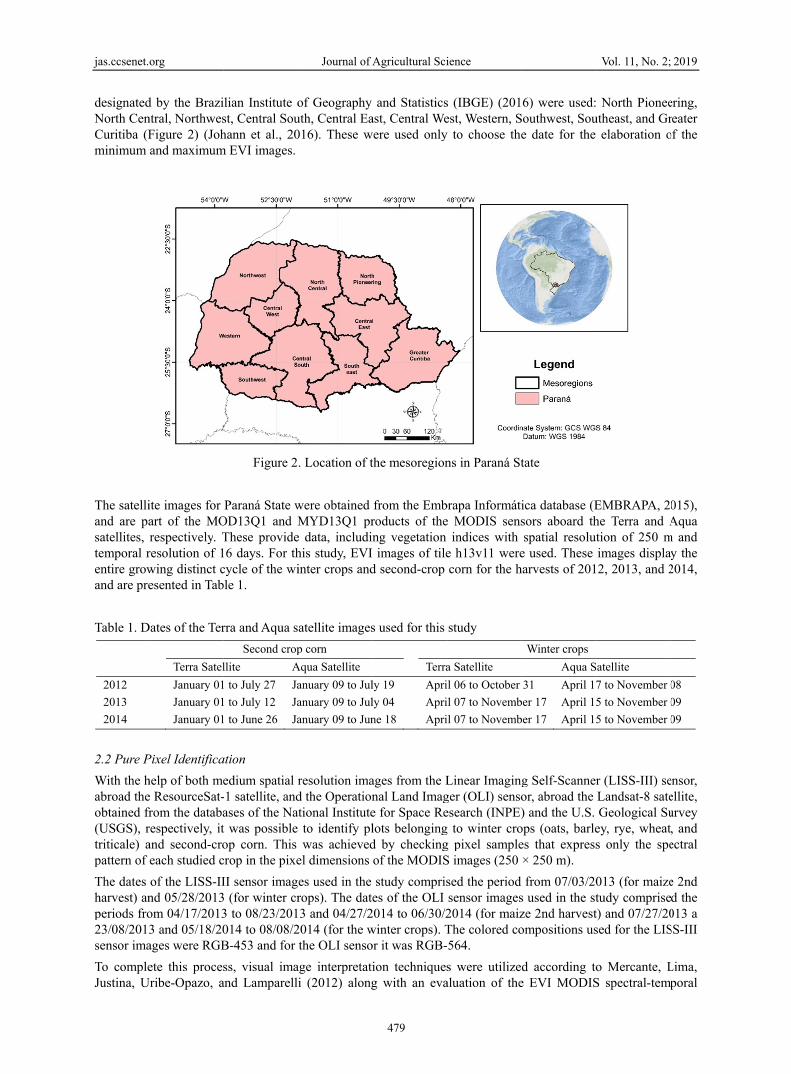
designatedNorth CenCuritiba (Fminimum
The satelliand are pasatellites, temporal rentire growand are pre
Table 1. D
2012
2013
2014
2.2 Pure P
With the habroad theobtained fr(USGS), rtriticale) apattern of
The dates harvest) anperiods fro23/08/2013sensor ima
To compleJustina, U
org
d by the Brazintral, NorthwesFigure 2) (Johand maximum
ite images for art of the MOrespectively. T
resolution of 1wing distinct cesented in Tab
Dates of the Ter
Terra Satel
January 01
January 01
January 01
Pixel Identifica
help of both mee ResourceSat-from the databarespectively, itand second-croeach studied c
of the LISS-IInd 05/28/2013om 04/17/20133 and 05/18/20ages were RGB
ete this procesUribe-Opazo, a
ilian Institute ost, Central Souhann et al., 20
m EVI images.
Figure 2
Paraná State wOD13Q1 and MThese provide16 days. For thcycle of the wible 1.
rra and Aqua s
Second crop
llite A
1 to July 27 Ja
1 to July 12 Ja
1 to June 26 Ja
ation
edium spatial r-1 satellite, andases of the Nat was possible op corn. This crop in the pixe
II sensor imag3 (for winter cr3 to 08/23/201014 to 08/08/2B-453 and for
ss, visual imaand Lamparelli
Journal of A
of Geography uth, Central Ea016). These w
. Location of t
were obtained MYD13Q1 pr
e data, includinhis study, EVI inter crops and
atellite images
p corn
Aqua Satellite
anuary 09 to Jul
anuary 09 to Jul
anuary 09 to Jun
resolution imad the Operationational Institute
to identify plwas achieved
el dimensions
es used in the rops). The date3 and 04/27/2
2014 (for the wthe OLI senso
age interpretatii (2012) along
Agricultural Sci
479
and Statisticsast, Central We
were used only
the mesoregion
from the Embroducts of theng vegetation images of tile
d second-crop
s used for this
Terra
ly 19 Apri
ly 04 Apri
ne 18 Apri
ages from the Lnal Land Image for Space Relots belongingd by checkingof the MODIS
study comprises of the OLI
2014 to 06/30/2winter crops). Tor it was RGB-
ion techniquesg with an eva
ience
s (IBGE) (201est, Western, Sy to choose the
ns in Paraná St
brapa Informátie MODIS sens
indices with e h13v11 werecorn for the h
study
a Satellite
il 06 to October
il 07 to Novemb
il 07 to Novemb
Linear Imagingger (OLI) sensoesearch (INPE)g to winter crog pixel sampleS images (250
sed the period sensor images2014 (for maizThe colored co564.
s were utilizealuation of the
6) were used:Southwest, Soue date for the
tate
ica database (Esors aboard thspatial resolut
e used. These harvests of 201
Winter crops
Aqua S
31 April 17
ber 17 April 15
ber 17 April 15
g Self-Scanneror, abroad the ) and the U.S.
ops (oats, barlees that express× 250 m).
from 07/03/20s used in the stze 2nd harvestompositions us
d according toe EVI MODIS
Vol. 11, No. 2;
North Pioneeutheast, and Gr
elaboration o
EMBRAPA, 2he Terra and Ation of 250 mimages displa2, 2013, and 2
atellite
7 to November 0
5 to November 0
5 to November 0
r (LISS-III) seLandsat-8 sateGeological Su
ey, rye, wheats only the spe
013 (for maizetudy compriset) and 07/27/20sed for the LIS
o Mercante, LS spectral-temp
2019
ering, reater of the
015), Aqua
m and y the 2014,
08
09
09
ensor, ellite, urvey , and ectral
e 2nd d the 013 a SS-III
Lima, poral
jas.ccsenet.
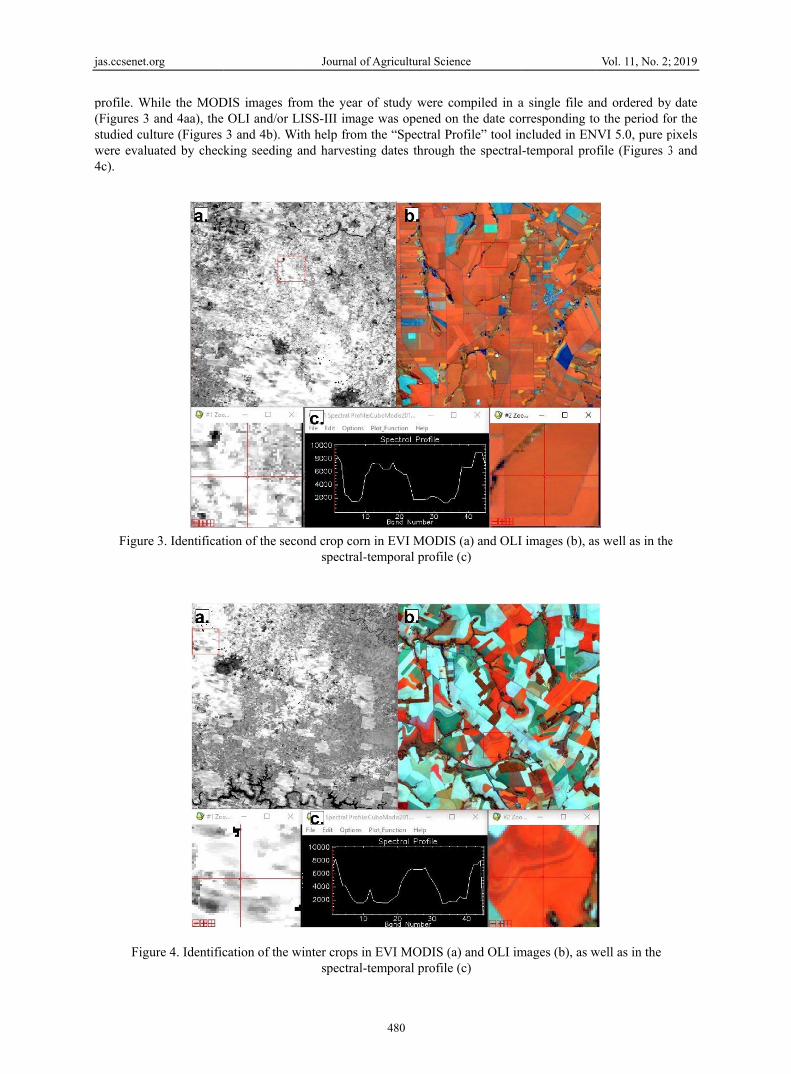
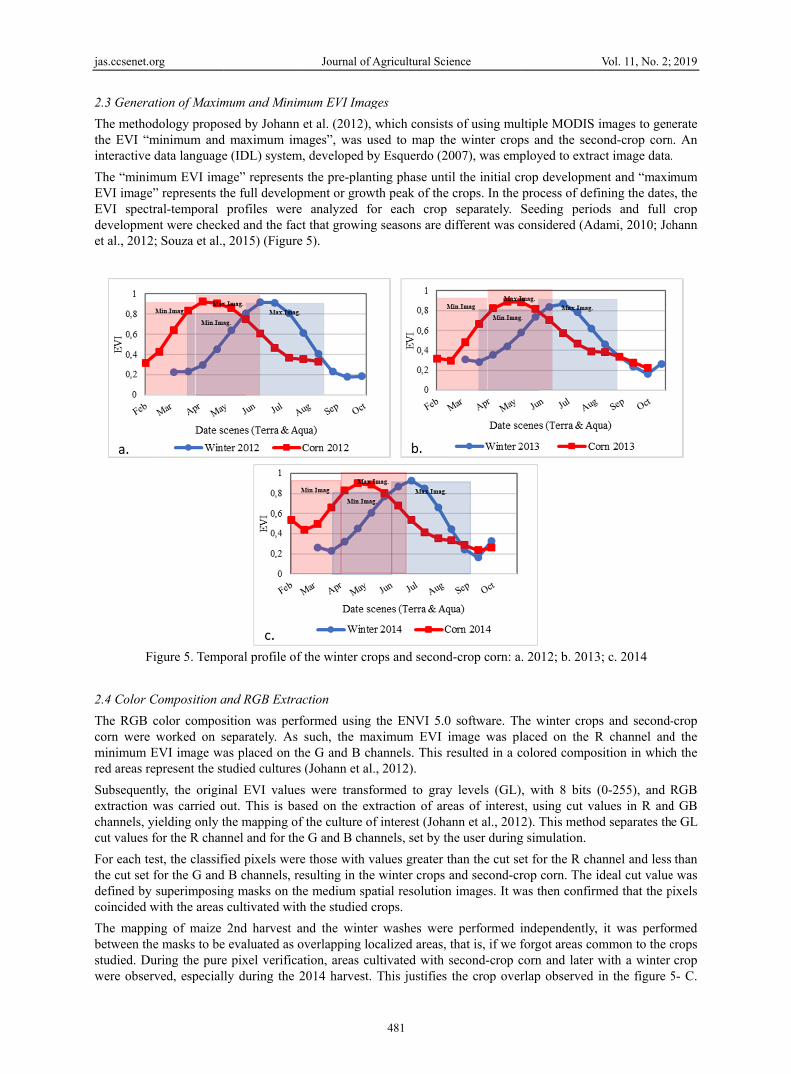
profile. W(Figures 3studied cuwere evalu4c).
Figure
Fig
org
While the MOD and 4aa), the
ulture (Figures uated by check
e 3. Identificat
ure 4. Identific
DIS images fro OLI and/or L3 and 4b). Wiking seeding a
tion of the seco
cation of the w
Journal of A
om the year oLISS-III imageith help from tand harvesting
ond crop corn spectral-te
winter crops in spectral-te
Agricultural Sci
480
of study were e was opened othe “Spectral Pg dates throug
in EVI MODIemporal profil
EVI MODIS emporal profil
ience
compiled in aon the date coProfile” tool ingh the spectral
IS (a) and OLIe (c)
(a) and OLI ime (c)
a single file anrresponding toncluded in EN-temporal pro
I images (b), as
mages (b), as w
Vol. 11, No. 2;
nd ordered byo the period fo
NVI 5.0, pure pfile (Figures 3
s well as in the
well as in the
2019
date or the pixels 3 and
e
jas.ccsenet.
2.3 Genera
The methothe EVI “interactive
The “miniEVI imageEVI spectdevelopmeet al., 2012
F
2.4 Color
The RGB corn wereminimum red areas r
Subsequenextraction channels, ycut values
For each tethe cut setdefined bycoincided
The mappbetween thstudied. Dwere obse
org
ation of Maxim
odology propominimum and
e data language
imum EVI imae” represents thtral-temporal ent were check2; Souza et al.,
Figure 5. Temp
Composition a
color compose worked on sEVI image wa
represent the st
ntly, the originwas carried o
yielding only tfor the R chan
est, the classift for the G andy superimposinwith the areas
ping of maize he masks to be
During the pureerved, especial
mum and Minim
sed by Johannd maximum ime (IDL) system
age” representhe full developprofiles were
ked and the fac, 2015) (Figure
poral profile of
and RGB Extra
sition was perseparately. As as placed on thtudied cultures
nal EVI valueout. This is bathe mapping onnel and for th
fied pixels werd B channels, rng masks on thcultivated wit
2nd harvest ae evaluated as oe pixel verificaly during the
Journal of A
mum EVI Imag
n et al. (2012), mages”, was um, developed b
ts the pre-plantpment or growe analyzed foct that growinge 5).
f the winter cro
action
rformed using such, the ma
he G and B chs (Johann et al
es were transfased on the exf the culture o
he G and B cha
re those with vresulting in thehe medium spath the studied c
and the winteoverlapping loation, areas cu2014 harvest.
Agricultural Sci
481
ges
which consistused to map thby Esquerdo (2
ting phase untwth peak of theor each crop g seasons are d
ops and second
the ENVI 5.0aximum EVI hannels. This r., 2012).
formed to grayxtraction of arf interest (Joha
annels, set by t
values greater te winter crops atial resolutioncrops.
er washes werocalized areas, ultivated with
This justifies
ience
ts of using mulhe winter crop2007), was emp
til the initial cre crops. In the
separately. Sdifferent was c
d-crop corn: a.
0 software. Thimage was plresulted in a c
y levels (GL)reas of interestann et al., 2012the user during
than the cut seand second-cr
n images. It w
re performed ithat is, if we fsecond-crop cthe crop over
ltiple MODIS ps and the secployed to extra
rop developmeprocess of defSeeding perioconsidered (Ad
. 2012; b. 2013
he winter croplaced on the Rcolored compo
, with 8 bits t, using cut va2). This metho
g simulation.
et for the R chrop corn. The i
was then confirm
independently,forgot areas cocorn and later rlap observed
Vol. 11, No. 2;
images to gencond-crop cornact image data
ent and “maxifining the datesods and full dami, 2010; Jo
3; c. 2014
ps and second-R channel and
osition in whic
(0-255), and alues in R andod separates th
annel and lessideal cut valuemed that the p
, it was perfoommon to the cwith a winter in the figure
2019
nerate n. An .
mum s, the crop
ohann
-crop d the h the
RGB d GB e GL
than e was pixels
rmed crops crop
5- C.
jas.ccsenet.
The overlabeing grow
2.5 Accura
The methosampling (
We used 4the target ocompletedfrom LISSthe mediuerrors wer
2.6 Area C
The area darea data, indicators 2). The latmapping aclose to 1,
Where, n: crop area.
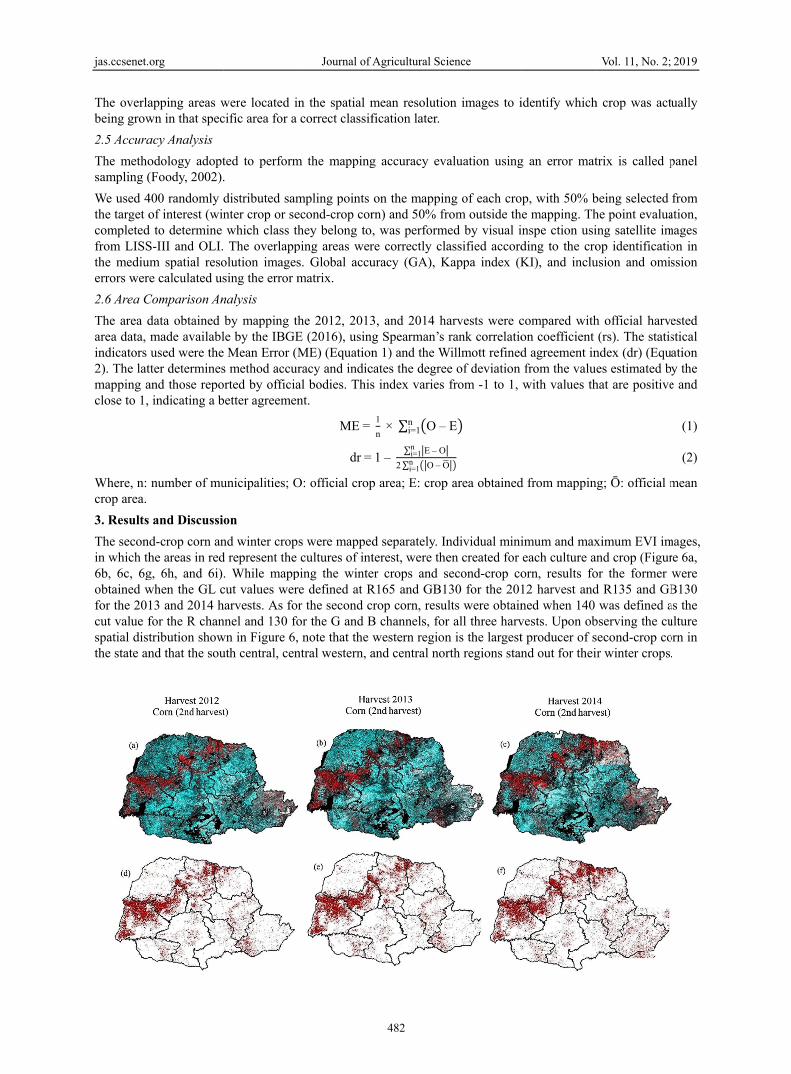
3. ResultsThe seconin which th6b, 6c, 6gobtained wfor the 201cut value fspatial distthe state an
org
apping areas wwn in that spec
acy Analysis
odology adopt(Foody, 2002).
400 randomly dof interest (win
d to determine S-III and OLI.um spatial resoe calculated us
Comparison An
data obtained made availablused were the
tter determinesand those repo
indicating a b
number of mu
and Discussid-crop corn anhe areas in redg, 6h, and 6i)when the GL c13 and 2014 hfor the R chantribution shownd that the sou
were located incific area for a
ted to perform.
distributed samnter crop or sewhich class th The overlapp
olution imagessing the error m
nalysis
by mapping thle by the IBGEe Mean Error (Ms method accurorted by officiabetter agreemen
unicipalities; O
on nd winter cropd represent the . While mappcut values werharvests. As fornnel and 130 fown in Figure 6,uth central, cen
Journal of A
n the spatial mcorrect classif
m the mapping
mpling points econd-crop corhey belong to,
ping areas wers. Global accumatrix.
he 2012, 2013E (2016), usingME) (Equationracy and indical bodies. Thisnt.
ME=
dr=O: official crop
s were mappedcultures of int
ping the wintere defined at Rr the second cor the G and B note that the w
ntral western, a
Agricultural Sci
482
mean resolutiofication later.
g accuracy eva
on the mappinrn) and 50% fr, was performre correctly clauracy (GA), K
3, and 2014 hag Spearman’s n 1) and the W
cates the degrees index varies
1
n× ∑ O–n
i=1
1– ∑ E– On
i=1
2∑ O– Oni=1
p area; E: crop
d separately. Interest, were theer crops and sR165 and GB1rop corn, resu
B channels, forwestern regionand central nor
ience
on images to i
aluation using
ng of each crorom outside th
med by visual iassified accord
Kappa index (K
arvests were crank correlatio
Willmott refinede of deviation from -1 to 1,
E
O
p area obtained
ndividual minien created for second-crop co30 for the 201lts were obtainr all three harvn is the largestrth regions stan
identify which
g an error mat
p, with 50% be mapping. Thnspe ction usiding to the croKI), and inclu
compared withon coefficient d agreement infrom the valuwith values th
d from mappin
imum and maxeach culture anorn, results fo12 harvest andned when 140 vests. Upon obt producer of snd out for thei
Vol. 11, No. 2;
h crop was act
trix is called p
being selected he point evaluaing satellite imop identificatiousion and omi
h official harv(rs). The statis
ndex (dr) (Eques estimated b
hat are positive
ng; Ō: official m
ximum EVI imnd crop (Figur
or the former d R135 and GB
was defined abserving the cusecond-crop coir winter crops
2019
tually
panel
from ation,
mages on in ssion
ested stical ation y the e and
(1)
(2)
mean
mages, re 6a, were B130 as the ulture orn in .
jas.ccsenet.
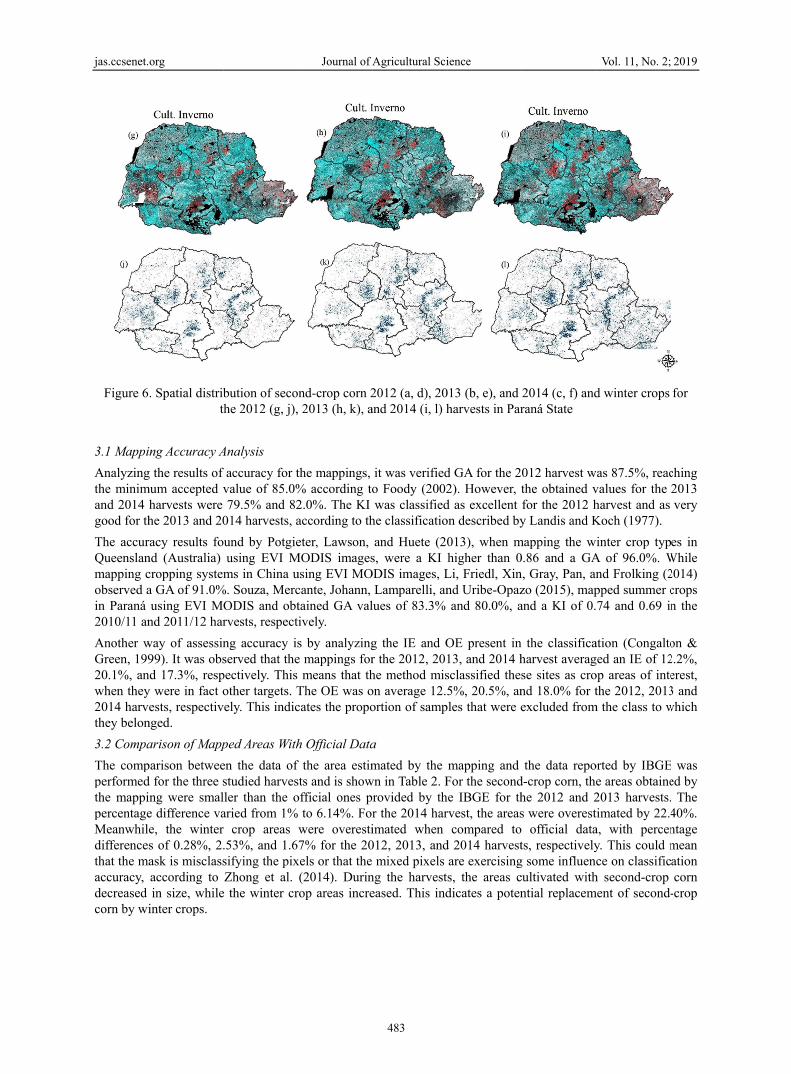
Figure 6
3.1 Mappi
Analyzingthe minimand 2014 hgood for th
The accurQueenslanmapping cobserved ain Paraná 2010/11 an
Another wGreen, 19920.1%, anwhen they2014 harvthey belon
3.2 Compa
The compperformedthe mappipercentageMeanwhiledifferencesthat the maaccuracy, decreased corn by wi
org
. Spatial distribth
ing Accuracy A
g the results of mum accepted v
harvests were he 2013 and 20
racy results fond (Australia) cropping systema GA of 91.0%using EVI MO
nd 2011/12 har
way of assessin99). It was obs
nd 17.3%, respy were in fact oests, respectiv
nged.
arison of Mapp
parison betweed for the three sng were smale difference vae, the winter s of 0.28%, 2.ask is misclassaccording to in size, while
inter crops.
bution of secohe 2012 (g, j),
Analysis
f accuracy for tvalue of 85.0%79.5% and 82
014 harvests, a
und by Potgieusing EVI M
ms in China u%. Souza, Merc
ODIS and obtrvests, respect
ng accuracy isserved that the
pectively. This other targets. T
vely. This indic
ped Areas With
en the data of studied harvesller than the oaried from 1%r crop areas .53%, and 1.6sifying the pixZhong et al.
e the winter cr
Journal of A
nd-crop corn 2 2013 (h, k), a
the mappings, % according to2.0%. The KI according to th
eter, Lawson,MODIS imagesusing EVI MOcante, Johann, tained GA valively.
s by analyzinge mappings for
means that thThe OE was ocates the propo
h Official Data
f the area estimsts and is showofficial ones p to 6.14%. Forwere overesti7% for the 20
xels or that the (2014). Durin
rop areas incre
Agricultural Sci
483
2012 (a, d), 20and 2014 (i, l) h
it was verifiedo Foody (2002was classified
he classificatio
and Huete (20s, were a KI
ODIS images, LLamparelli, an
lues of 83.3%
g the IE and Or the 2012, 201he method mison average 12.5ortion of samp
a
mated by the wn in Table 2. F
rovided by thr the 2014 harimated when 012, 2013, and
mixed pixels ng the harvesteased. This ind
ience
013 (b, e), and harvests in Par
d GA for the 22). However, td as excellent on described by
013), when mhigher than 0
Li, Friedl, Xinnd Uribe-Opazand 80.0%, a
OE present in 13, and 2014 hsclassified thes5%, 20.5%, an
ples that were e
mapping and For the second
he IBGE for thrvest, the areas
compared tod 2014 harvestare exercisings, the areas cdicates a poten
2014 (c, f) andraná State
012 harvest wthe obtained vfor the 2012 hy Landis and K
mapping the w0.86 and a GAn, Gray, Pan, anzo (2015), mapand a KI of 0.
the classificaharvest averagse sites as crond 18.0% for texcluded from
the data repod-crop corn, thehe 2012 and 2s were overest official datats, respectively
g some influenccultivated withntial replacem
Vol. 11, No. 2;
d winter crops
was 87.5%, reacvalues for the harvest and as Koch (1977).
inter crop typA of 96.0%. Wnd Frolking (2pped summer c74 and 0.69 in
ation (Congaltoged an IE of 12op areas of intethe 2012, 2013
m the class to w
orted by IBGEe areas obtaine2013 harvests.timated by 22.4a, with perceny. This could mce on classific
h second-crop ment of second-
2019
for
ching 2013 very
es in While 2014) crops n the
on & 2.2%, erest, 3 and which
E was ed by The 40%. ntage mean ation corn
-crop
jas.ccsenet.org Journal of Agricultural Science Vol. 11, No. 2; 2019
484
Table 2. Differences between the performed mapping (second-crop corn and winter crops) and official area (IBGE) for Paraná State, Brazil
Crops Variables 2012 2013 2014
Second crop corn
IBGE area (ha) 2,039,241 2,150,710 1,898,614
Mapped area (ha) 2,018,850 2,018,675 2,323,837
Difference (Mapping-IBGE) -20,391 -132,035 425,223
Difference (%) -1.00% -6.14% 22.40%
Winter
IBGE area (ha) 935,230 1,125,265 1,510,138
Mapped area (ha) 937,825 1,153,752 1,535,301
Difference (Mapping-IBGE) 2,595 28,487 25,163
Difference (%) 0.28% 2.53% 1.67%
Note. Source: IBGE (2016).
Crusiol et al. (2016) mapped agricultural areas of the municipality of Londrina, Paraná, Brazil, for five summer harvests. When comparing the results obtained with official IBGE data, an overestimation of 31.93% and 44.72% in relation to official data in the 1998/1999 and 2000/2001 harvests, respectively, was observed. This was in addition to an underestimation of 3.96% to 14.80% in the 2001/2002, 2006/2007, and 2008/2009 harvests.
Based on EVI/MODIS spectral-temporal behavior, Mengue and Fontana (2015) mapped summer crops in the state of Rio Grande do Sul, Brazil. When comparing the results obtained with the official IBGE data, an underestimation of 11.13% for soybean and an overestimation of 16.72% for irrigated rice were noted.
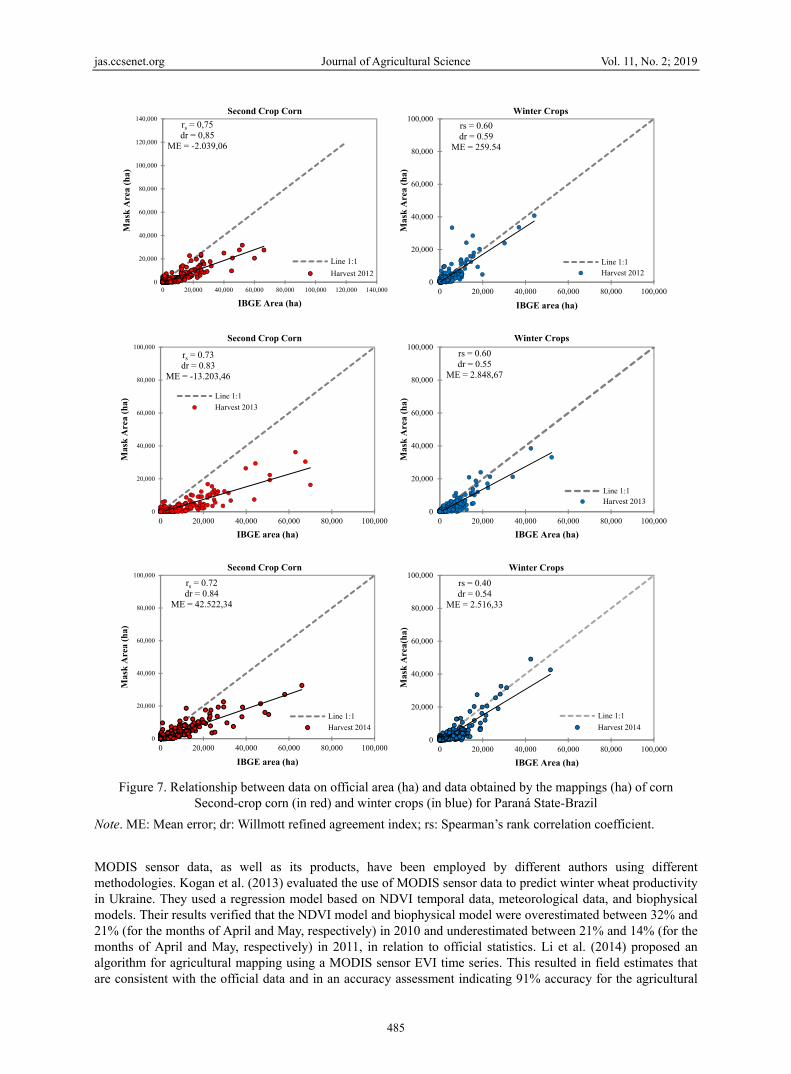
Figure 7 displays the statistical indices ME and dr, and the rs value, with the second-crop corn yielding better results when compared to the winter crops. By analyzing the ME, it was confirmed that the area obtained by the mapping was underestimated on average by 7,621.26 ha for the 2012 and 2013 harvests and overestimated by 42,522.34 ha in 2014 for the second-crop corn. Meanwhile, the method overestimated by an average of 1,874.85 ha in the harvest of winter crops for all three years. When evaluating rs for the second-crop corn, there was a variation from 0.72 to 0.75. This indicates a strong correlation between the official data and the estimated data. On the other hand, rs varied from 0.40 to 0.60 for winter crops, indicating a moderate correlation between the official data and the data obtained by mapping to Andriotti (2009). The dr determines the accuracy of the method with positive values and close to 1 indicating better agreement, so the mapping for the 2nd crop corn presented dr of 0.84 on average and for the winter crops dr of 0.56 on average.
jas.ccsenet.org Journal of Agricultural Science Vol. 11, No. 2; 2019
485
Figure 7. Relationship between data on official area (ha) and data obtained by the mappings (ha) of corn
Second-crop corn (in red) and winter crops (in blue) for Paraná State-Brazil
Note. ME: Mean error; dr: Willmott refined agreement index; rs: Spearman’s rank correlation coefficient.
MODIS sensor data, as well as its products, have been employed by different authors using different methodologies. Kogan et al. (2013) evaluated the use of MODIS sensor data to predict winter wheat productivity in Ukraine. They used a regression model based on NDVI temporal data, meteorological data, and biophysical models. Their results verified that the NDVI model and biophysical model were overestimated between 32% and 21% (for the months of April and May, respectively) in 2010 and underestimated between 21% and 14% (for the months of April and May, respectively) in 2011, in relation to official statistics. Li et al. (2014) proposed an algorithm for agricultural mapping using a MODIS sensor EVI time series. This resulted in field estimates that are consistent with the official data and in an accuracy assessment indicating 91% accuracy for the agricultural
rs = 0,75dr = 0,85
ME = -2.039,06
0
20,000
40,000
60,000
80,000
100,000
120,000
140,000
0 20,000 40,000 60,000 80,000 100,000 120,000 140,000
Mas
k A
rea
(ha)
IBGE Area (ha)
Second Crop Corn
Line 1:1
Harvest 2012
rs = 0.60dr = 0.59
ME = 259.54
0
20,000
40,000
60,000
80,000
100,000
0 20,000 40,000 60,000 80,000 100,000
Mas
k A
rea
(ha)
IBGE area (ha)
Winter Crops
Line 1:1Harvest 2012
rs = 0.73dr = 0.83
ME = -13.203,46
0
20,000
40,000
60,000
80,000
100,000
0 20,000 40,000 60,000 80,000 100,000
Mas
k A
rea
(ha)
IBGE area (ha)
Second Crop Corn
Line 1:1
Harvest 2013
rs = 0.60dr = 0.55
ME = 2.848,67
0
20,000
40,000
60,000
80,000
100,000
0 20,000 40,000 60,000 80,000 100,000
Mas
k A
rea
(ha)
IBGE Area (ha)
Winter Crops
Line 1:1Harvest 2013
rs = 0.72dr = 0.84
ME = 42.522,34
0
20,000
40,000
60,000
80,000
100,000
0 20,000 40,000 60,000 80,000 100,000
Mas
k A
rea
(ha)
IBGE area (ha)
Second Crop Corn
Line 1:1
Harvest 2014
rs = 0.40dr = 0.54
ME = 2.516,33
0
20,000
40,000
60,000
80,000
100,000
0 20,000 40,000 60,000 80,000 100,000
Mas
k A
rea(
ha)
IBGE Area (ha)
Winter Crops
Line 1:1
Harvest 2014
jas.ccsenet.org Journal of Agricultural Science Vol. 11, No. 2; 2019
486
areas.
Based on mapping results, this study confirmed that the estimated values (mapping) differed between -6.14% and 22.40%, when compared to the official data. However, the official statistics are based on research obtained from farmers and cooperatives and agricultural finance data. These values are usually generalized, resulting in relative and imprecise data (Pino, 2001; Antunes et al., 2012; Johann et al., 2012). Antunes, Mercante, Esquerdo, Lamparelli, and Rocha (2012) verified that estimates given by official bodies such as SEAB/DERAL are obtained subjectively using planting intention surveys performed by sampling. According to Pino (2001), the IBGE uses subjective municipal information based on opinions of technical and economic agents. This does not allow for an accurate quantitative analysis of the errors involved and is susceptible to manipulation.
When evaluating the mapping accuracy in relation to the reference (using medium spatial resolution images—LISS-III and OLI), according to Foody (2002), the accepted minimum value indicating the success of the classification was standardized at 85%, and Landis and Koch (1977) state that the KI closer to 1 indicates better quality in the classification. Therefore the results for GA and the KI were satisfactory. A factor that influences mapping is the size of the agricultural areas, which are often small, confusing the mapping and increasing the probability of pixels mixing. Souza, Mercante, Johann, Lamparelli and Uribe-Opazo (2015) mapped soybean and corn crops and concluded that soybean cultivation was better mapped compared to corn. This is probably owing to the large areas planted with soybean in the state, which makes mapping using the MODIS sensor easier. Corn cultivation is usually completed in smaller and more dispersed areas, increasing the probability of mixed pixels.
Zhong, Hu, Yu, Gong, and Biging (2014), mapped soybean and corn in the state of Paraná and confirmed that the mixed pixel effect represents a relevant influence on classification accuracy, and that this effect depends on several pixel mixing patterns between the regions of the state. As such, in highly cultivated regions, many mixed pixels are influenced by crops and can be classified as agricultural areas. This results in overestimation of cultivated areas. On the other hand, in regions with no and/or very small cultivated areas, mixed pixels can be dominated by non-agricultural areas, resulting in an underestimation of cultivated areas (Li et al., 2014). Another possibility could be the spatial resolution of the MODIS sensor (250 m), given that in small agricultural areas (below the spatial resolution of the sensor), the effects of spatial heterogeneity have been noted (Li et al., 2014).
The use of MODIS favors the mapping of agricultural areas based on temporal resolution. Nonetheless, given the image spatial resolution, the difficulty in mapping small areas using this sensor generates some errors in the final results. Further studies need to be carried out to minimize these obstacles in the use of the MODIS sensor.
4. Conclusions The use of MODIS sensor multitemporal images along with the utilized classification method allow for the mapping of winter crops and second-crop corn. This enabled the identification, separation, and mapping of these crops for the state of Paraná, Brazil.
The errors in the comparison between the estimated values (mappings) and the observed ones (IBGE) were in line with those presented in the literature. Spatial accuracy between mapping and reference data was satisfactory, confirming the effectiveness of the applied methodology.
The use of remote sensing data and techniques can contribute to a quick estimation of crop area information and can assist with the surveys conducted by official institutions.
References Adami, M. (2010). Estimativa da data de plantio da soja por meio de séries temporais de imagens MODIS
(Doctoral dissertation, Instituto Nacional de Pesquisas Espaciais, Sensoriamento Remoto, São José dos Campos, Brazil).
Andriotti, J. L. S. (2009). Fundamentos de Estatística e Geoestatística. Editora Unisinos: São Leopoldo, Brazil.
Antunes J. F. G., Mercante, E., Esquerdo, J. C. D. M., Lamparelli, R. A. C., & Rocha J. V. (2012). Estimativa de área de soja por classificação de imagens normalizada pela matriz de erros. Pesquisa Agropecuária Brasileira, 47(9), 1288-1294. https://doi.org/10.1590/S0100-204X2012000900014
Atzberger, C. (2013). Advances in Remote Sensing of Agriculture: Context Description, Existing Operational Monitoring Systems and Major Information Needs. Remote Sensing, 5, 949-981. https://doi.org/10.33 90/rs5020949
jas.ccsenet.org Journal of Agricultural Science Vol. 11, No. 2; 2019
487
Casady, G. M., Van Leeuwen, W. J. D., & Reed, B. C. (2013). Estimating winter annual biomass in the Sonoran and Mojave Deserts with satellite and ground based observations. Remote Sensing, 5, 909-926. https://doi.org/10.3390/rs5020909
Congalton, R. G., & Green, K. (1999). Assessing the accuracy of remotely sensed data: Principles and practices (2nd ed.). Boca Raton, FL: CRC Press.
Crusiol, L. G. T., Neto, O. C. P., Nanni, M. R., Gualberto, A. A. S, Furlanetto, R. H., & Silva Junior, C. A. (2016). Mapeamento de áreas agrícolas na safra de verão a partir de imagens Landsat frente aos dados oficiais. Revista Agro@mbiente On-line, 10(4), 287-298. https://doi.org/10.18227/1982-8470ragro.v10i4.3098
Eberhardt, I. D. R., Luiz, A. J. B., Formaggio, A. R., & Sanches, I. D. (2015). Detecção de áreas agrícolas em tempo quase real com imagens Modis. Pesquisa Agropecuária Brasileira, 50(7), 605-614. https://doi.org/ 10.1590/S0100-204X2015000700010
EMBRAPA (Embrapa Informática Agropecuária). (2015). Sistema de Análise Temporal da Vegetação (SATVeg). Retrived June 10, 2016, from https://www.satveg.cnptia.embrapa.br/satveg/login.html.
Esquerdo, J. C. D. M. (2007). Utilização de perfis multi-temporais do NDVI/AVHRR no acompanhamento da safra de soja no oeste do Paraná (Doctoral dissertation, Universidade Estadual de Campinas, Engenharia Agrícola, Campinas, Brasil).
Fernandes, R. R., Nunes, G. M., & Drescher, R. (2011). Monitoramento de propriedades rurais através de dados multisensores em nível orbital. Ambiência, 7(1), 75-87. https://doi.org/10.5777/ambiencia.2011.01.06
Foody, G. M. (2002). Status of land cover classification accuracy assessment. Remote Sensing of Environment, 80(1), 185-201. https://doi.org/10.1016/S0034-4257(01)00295-4
Grzegozewski, D. M., Johann, J. A., Uribe-Opazo, M. A., Mercante, E., & Coutinho, A. C. (2016). Mapping of the soya bean and corn crops in the State of Paraná using EVI imagens from the MODIS sensor. International Journal of Remote Sensing and Remote Sensing Letters, 37(6), 1257-1275. https://doi.org/ 10.1080/01431161.2016.1148285
IBGE (Instituto Brasileiro de Geografia e Estatística). (2016). Levantamento sistemático da produção agrícola. Retrived November 17, 2016, from http://www.sidra.ibge.gov.br
Johann, J. A., Rocha, J. V., Duft, D. G., & Lamparelli, R. A. C. (2012). Estimativa de áreas com culturas de verão no Paraná, por meio de imagens multitemporais EVI/Modis. Pesquisa Agropecuária Brasileira, 47(9), 1295-1306. https://doi.org/10.1590/S0100-204X2012000900015
Johann, J. A., Becker, W. R., Uribe-Opazo, M. A., & Mercante, E. (2016). Uso de imagens do sensor orbital Modis na estimação de datas do ciclo de desenvolvimento da cultura da soja para o estado do Paraná-Brasil. Engenharia Agrícola, 36(1), 126-142. https://doi.org/10.1590/1809-4430-Eng.Agric.v36n1p126-1 42/2016
Kogan, F., Kussul, N., Adamenko, T., Skakun, S., Kravchenko, O,. Kryvobok, O., … Lavrenyuk, A. (2013). Winter wheat yield forecasting in Ukraine based on Earth observation, meteorological data and biophysical models. International Journal of Applied Earth Observation and Geoinformation, 23, 192-203. https://doi.org/10.1016/j.jag.2013.01.002
Landis, J. R., & Koch, G. G. (1977). The measurement of observer agreement for categorical data. Biometrics, 33(1), 159-174. https://doi.org/10.2307/2529310
Li, L., Friedl, M. A., Xin, Q., Gray, J., Pan, Y., & Frolking, S. (2014). Mapping crop cycles in China using MODIS-EVI time series. Remote Sensing, 6, 2473-2493. https://doi.org/10.3390/rs6032473
Lobell, D. B., Ortiz-Monasterio, J. I., Sibley, A. M., & Sohu, V. S. (2013). Satellite detection of earlier wheat sowing in India and implications for yield trends. Agricultural Systems, 115, 137-143. https://doi.org/ 10.1016/j.agsy.2012.09.003
Mengue, V. P., & Fontana, D. C. (2015). Assessment of spectral-temporal dynamics for mapping the main summer crops in the Rio Grande do Sul State. Bragantia, 74(3), 331-340. https://doi.org/10.1590/1678- 4499.0452
Mercante, E. (2007). Dinâmica espectral da cultura da soja ao longo do ciclo vegetativo e sua relação com a produtividade na região do oeste do Paraná (Doctoral dissertation, Universidade Estadual de Campinas, Engenharia Agrícola.Campinas, Brazil).
Mercante, E., Lima, L. E P., Justina, D. D. D., Uribe-Opazo, M. A., & Lamparelli, R. A. C. (2012). Detection of
jas.ccsenet.org Journal of Agricultural Science Vol. 11, No. 2; 2019
488
soybean planted areas through orbital images based on culture spectral dynamics. Revista Engenharia Agrícola, 32(5), 920-931. https://doi.org/10.1590/S0100-69162012000500011
Mkhabela, M. S., Bullock, P., Raj, S., Wang, S., & Yang, Y. (2011). Crop yield forecasting on the Canadian Prairies using MODIS NDVI data. Agricultural and Forest Meteorology, 151, 385-393. https://doi.org/ 10.1016/j.agrformet.2010.11.012
Pan, Y., Li, L., Zhang, J., Liang, S., Zhu, X., & Sulla-Menashe, D. (2012). Winter wheat area estimation from MODIS-EVI time series data using the Crop Proportion Phenology Index. Remote Sensing of Environment, 119, 232-242. https://doi.org/10.1016/j.rse.2011.10.011
Pino, F. A. (2001). Estimação subjetiva de safras agrícolas. Informações Econômicas, 31(6), 55-58.
Potgieter, A. B., Lawson, K., & Huete, A. R. (2013). Determining crop acreage estimates for specific winter crops using shape attributes from sequential MODIS imagery. International Journal of Applied Earth Observation and Geoinformation, 23, 254-263. https://doi.org/10.1016/j.jag.2012.09.009
Silva Junior, C. A., Frank, T., & Rodrigues, T. C. S. (2014). Discriminação de áreas de soja por meio de imagens EVI/MODIS e análise baseada em geo-objeto. Revista Brasileira de Engenharia Agrícola e Ambiental, 18(1), 44-53. https://doi.org/10.1590/S1415-43662014000100007
Souza, C. H. W., Mercante, E., Johann, J. A., Lamparelli, R. A. C, & Uribe-Opazo, M. A. (2015). Mapping and discrimination of soya bean and corn crops using spectro-temporal profiles of vegetation indices. International Journal of Remote Sensing, 36(7), 1809-1824. https://doi.org/10.1080/01431161.2015.102 6956
Zhong, L., Hu, L., Yu, L., Gong, P., & Biging, G. (2014). Automated mapping of soybean and corn using phenology. Journal of Photogrammetry and Remote Sensing, 119, 151-164. https://doi.org/10.1016/j.isprsjp rs.2016.05.014
Copyrights Copyright for this article is retained by the author(s), with first publication rights granted to the journal.
This is an open-access article distributed under the terms and conditions of the Creative Commons Attribution license (http://creativecommons.org/licenses/by/4.0/).