Embed Size (px)
Citation preview

1
MAPPING
INFORMAL PUBLIC
TRANSPORT
TERMINALS:
THE CASE OF
TRICYCLES OF
BRGY. 176, BAGONG
SILANG, CALOOCAN
CITY
Marie Danielle V. Guillen
Lorenzo V. Cordova
Conference CODATU XV The role of urban mobility in (re)shaping cities
22 to 25 October 2012- Addis Ababa (Ethiopia)

2

3
Conference CODATU XV
« The role of urban mobility in (re)shaping cities »
22 to 25 October 2012- Addis Ababa (Ethiopia)
Mapping Informal Public Transport Terminals:
The Case of Tricycles of Brgy. 176, Bagong Silang, Caloocan City
M.D.V. Guillen , L.V. Cordova School of Government, Ateneo De Manila University
[email protected] ; [email protected] ;
Abstract
Transport infrastructure plays a big role in mobility. Many cities in developing countries are
rapidly urbanizing, roads are expanding and majority of the people rely on public
transportation. However, this public transport system is usually not safe and inefficient.
InMetro Manila’s 11 million population, over a third of which are in poverty. Seventy percent
(70%) of the population are highly reliant on public transportation. This segment of the
population belongs to the urban poor and middle class.
Just like any city in developing countries, informal public transport modes play a major role
in mobility especially of the urban poor and the vulnerable sector of the society. Metro
Manila has a peculiar mix of different public transportation services including buses, GT/FX
Express, jeepneys, tricycles (motorcycle with sidecabs), and “pedicabs” (bicycles with
sidecars). These modes are predominantly operated privately and are poorly regulated by
government. Tricycles alone are estimated to be at 104,166 units.
The complex and diverse modes of transport in Metro Manila has spawned informal transport
terminals and hubs-- public or privately owned terminals for motorized and non-motorized
public transport that have no clear government legal authorization to operate.
Effective management however begins with the identification and inventory of the existing
public transportation facilities especially terminals and hubs (both formal and informal).
Locating and mapping these public transport terminals and hubs, and modes are crucial in
understanding transport challenges and uncovering opportunities for greater and seamless
connectivity in Metro Manila. However, while maps are considered important, Filipinos are
unaccustomed to their use. Not many understand transport features in maps and sharing them
widely is a crucial step in enabling development actors and the people to plan and implement
mobility initiatives.
This study explores the mapping of informal transport terminals and hubs in the smallest
political unit called Brgy. 176, Bagong Silang, Caloocan City. The study will demonstrate
the use of map-oriented studies in triggering community transport initiatives by barangay
leaders, transport managers, and the underserved poor segments of the population.
Keywords: mapping, tricycle, informal public transport terminals

4
1. Introduction
Filipinos are largely reliant on public transportation for employment, mobility and access to
services. In the last decade, the World Bank described the Philippines of having attained
important improvements in transport infrastructure and services. Transportation determines
the level of accessibility of the people and commodities from one place to another. Many of
the options presented, however, add to economic burden of working poor, elderly and/ or
middle class. The important challenges remain with serious consequences for the country’s
competitiveness and for meeting its growth and poverty reduction targets.
In a rapid urbanizing world, transportation systems became more diverse. Metro Manila, as
the country’s foremost urban center caters to different public transportation services including
buses, jeepneys, tricycles, and taxis. These are predominantly privately owned and operated.
Tricycles (motorcycles with sidecars) and pedicabs (bicycles with sidecars) provide
transportation services through narrow streets and routes where jeepneys and buses are not
allowed to operate. There are also vans (e.g. GT express) that ply to the major routes and
carry more passengers and charge a rate depending on distance.
While the country relies heavily on road network to accommodate the passengers and
increasing public transport supply, there is growing demand to improve urban public
transportation by making it more efficient, dependable and sustainable. It is believed that an
effective management of public transportation may lead to a sound economic growth and
development.
Effective management however depends in understanding transport features. One of these is
in the identification and inventory of the existing public transportation facilities especially
terminals and hubs (both formal and informal). Mapping is very good way to do this .
Locating and mapping these facilities and modes are crucial in order to assess the mobility
problems and opportunities in Metro Manila .However, it remains to be expensive and the
demand for up to date user-ready and easy access information in transportation is high. .
The focus of this study is to identify and map the public transportation terminals (specifically
for tricycle) and assess its impact in terms of numbers, facilities/ infrastructure available and
how they are being utilized for the transportation needs of the barangay. Tricycle was chosen
as a focus of this study since they comprise the majority and the primary mode of
transportation within the barangay aside from jeepney, buses, and pedicabs.
This study will explore the use of crowdsourcing as a method of mapping public transport
terminal (formal and informal) in the Barangay. Crowdsourcing is essential especially in new
forms of mapping, which large group of users come together to create data and to add value
by sharing (Smith et al., 2008). The current situation shows the proliferation of public
transport terminals (mostly tricycles) in the barangay. It came to a point that there is a need to
manage these terminals to lessen traffic in intersections and lessen transport related violence.
However the local government do not have baseline and transport maps to start with where
they can base their governance initiatives and policy recommendations.
The capabilities available in the GIS software will be explored to map the location of tricycle
terminals and in order to support the analysis with regards to improving the mobility, traffic
flow and transportation services within the barangay.

5
GIS generated maps on current transportation system can be used by the local government.
Information generated from the study may open new opportunities for proactive engagement
and partnership. Research results and analysis are also envisaged to be useful for planning.
The results obtained can be used by the barangay leaders, transport system managers to
identify strategies and policies to better plan the public transportation. Further results can be
used in enhancing enforcement of safety, locations to better services, and outreach. The
recommendations and strategic actions on the other may be useful for designing new
innovative programs1.
2. Brief description of study area
Bagong Silang or Barangay 176 is located at the northern part of Caloocan City (Figure 1). It
is bounded in the North and West by the Marilao River, Barangay 175 in the South and
Barangay 186 in the East. It has a total land area of 524.68 hectares2 with topography of
gently to steeply undulating to rolling topography. It was subdivided into several phases that
have been developed into Phase I, II, III, IV, V, VII, VIII, IX and X. The land use is mostly
allocated for residential uses with several industrial areas. The barangay have a Type 1 with
dry season from October to January and wet season from June to September.
In 1995, Barangay 176 comprised 15% of city’s total population with a total 157,578 persons.
With an average household size of 5, the barangay have 31,523 households. As of 2007,
NSCB accounts for a total population is 221,874 or 16.1% share of city’s population.
The barangay was chosen as a study area due to the demand from the local government
officials to help them manage their public transportation. Problems related to public
transportation have been a perennial problem in the area. Providing the local government
with baseline information and maps is already a big leap to start with.
1 The paper this paper is based on the paper entitled “ Public Transportation Supply Mapping in Brgy
176, Bagong Silang, Caloocan City: An Illustration of GIS by Mr. Cordova, LV, Mr. Josef, JF and Mr.
Ong, A. submitted to Dr. Jun T. Castro, in partial fulfilment for the Plan 259 course, 1st
semester 2011-
2012 at the School of Urban and Regional Planning, University of the Philippines.
2 Based on Caloocan City Medium Term Development Plan (2000-2005)

6
Source: Caloocan City government
http://www.caloocancity.gov.ph/content.aspx?sectionid=23
1 and http://en.wikipedia.org/wiki/Caloocan
Current State of Public
Transportation in Barangay 176
Barangay 176 is accessible through Quirino Highway via Malaria Susano Road via
Novaliches town proper and Zabarte – Camarin Road that serves its main thoroughfares.
Transportation supply is not a problem in the barangay. It has ample supply of buses,
jeepneys and tricycle. In the recent information acquired from the Tricycle and Pedicab
Regulatory Service (TPRS)3, the barangay have a total of 2,558 units of tricycles (Table 1)
comprising 4 Tricycle Operators and Drivers Association (TODA).
The Caloocan City Medium Term Development Plan (MTDP) of 2000-2005 already
identified that the Bagong Silang Resettlement Project’s intersections poses serious traffic
problems and affects transportation efficiency in general. The identified causes of traffic
congestion includes narrow right of ways and sidewalks, inefficient public transport terminal
facilities, street and market vendor, poor pavement, inadequate Traffic Management System
(TMS), and inadequate road geometry.
Moreover, the local barangay officials identified the problem related to public transportation
supply as one of the issue in the locality that sometimes are the causes of conflict and
violence affecting the peace and order situation. An important factor contributing to public
transportation related problems includes illegal terminals of tricylces, conflict among TODA
with regards to route assignments, node designated loading and unloading areas, and no
central terminal.
3 TPRS is the recommending body to the City Council for the approval of franchise, permits, and assignment of
terminals of tricycles and pedicabs.

7
Table 1. Route assignments of tricycles per TODA in Brgy. 176
NAME OF TODA Number of
Units
Coverage/ Routes
West Bagong Silang
TODA
238 Phase 4 (A, B, C), Phase 9, Phase 10 (A, B)
BASITODA 1500 Phase 1, 2, 3 and 8
Phase 5 TODA 320 Phase 5, 7 (A, B, C) and Phase 12
BASIDECO 500 Phase 4 (A, B, C), Phase 9, Phase 10 (A, B)
Source: TPRS (2011)
In its MTDP, the City of Caloocan already cited that the expanded public capital investments
essential to uplift level and extent of social and economic infrastructure services, and traffic
engineering in these northern areas of the city. This includes Barangay 176.
3. Objectives
The goal of the study is to identify, map and assess the public transportation supply (with
focus on tricycles) with the aide of crowdsourcing technique and GIS. Specifically, the
project would like to:
1. Develop a map of public transportation terminals of Barangay 176;
2. Analyze the current public transportation supply (specifically tricycles) and facilities
with the standards and existing policies vis-à-vis identified problems within the
barangay.
3. Identify strategic actions that the Barangay can undertake to improve their transport
situation vis-à-vis the local government’s plan.
4. Methodology
To identify, map and assess the public transportation supply of Barangay 176, the following
conceptual framework below (Figure 2) was used. A Pressure-State-Response framework was
utilized as a reference in the assessment and getting the feedback from the local stakeholders.
Several methods for data collection were done4
1. Crowdsourcing mapping – technique used to easily pinpoint the location of terminals
in the Barangay.
2. Focus Group Discussions – An FGD was conducted with select barangay officials
including those involved in policy and program implementation (e.g. traffic).
4 The methodology and activities in this paper is based on the class group exercise (Cordova, LV, Josef,
JF and Ong, A.) in Plan 259 AY 2011-2012 School of Urban and Regional Planning, UP Diliman.

8
Figure 3. Discussions and crowdsourcing exercise
with local stakeholders
3. Key Informant Interviews – The team also conducted KIIs with local policy makers,
TPRS, DPSTM and commuters (in general) to gather more data that will support the
project.
4. Survey questionnaire – Through the office of Barangay Secretary, the team was able
to distribute a total of 100 questionnaires to stakeholders (government officials/
workers, private sector, drivers, and commuters)
5. Secondary Data Gathering
Local knowledge is very important. Using crowdsourcing technique, these knowledge can be
translated into essential information for mapping public transport terminals. Through this
method, everyone contributes.. Crowdsourcing was done by utilizing a big barangay map.
Key questions were asked to the local stakeholders in order to identify and pinpoint the
locations and what mode is in the specific locations. The method generated lots of
information in less than an hour at the least cost. Then the data information will be validated
through ground verification.
In order to generate maps of
Barangay 176, the data from the
crowdsourcing technique was
inputed and translated into
shape files. Since there are no
shape files available, raster
images road networks and
barangay boundary from
wikimapia and Google Earth
using ArcGIS were utilized.
Likewise, global positioning
system (gps) coordinates from
Google Earth were used for
georeferencing.
Figure 2. Conceptual and Analytical Framework of the
Study

9
Table 2. Additional data on transportation systems gathered during consultation and
added to database to generate GIS map.
First step was to overlay the
road network from
wikimapia.org onto the satellite
image from Go ogle Earth
using GIMP, a graphic
manipulation software, to
produce a single raster image
(jpeg file). The output image
was then added as a layer file
into ArcGIS and georeferenced
using datum WGS_1984 and
GCS_WGS_1984 for projection, the
spatial references used by Google Earth.
A separate shape file (polyline) for baranggay boundary and road network was added, and the
barangay boundary and roads were traced onto the respective layers. Segments were then
labelled as major and minor roads. These were identified and validated through a
consulstation by key barangay officials. This serves as an additional field in the attributes
table of the road network shape file that was us d to generate base maps.
Feature/Data Shape file/layer Methods employed
Major roads – 10 m buffer Generated new polyline
shape file using road
network layer
Added field 'Type' in attributes
table
Exported identified segments as
a new layer
Buffer (analysis) using 10m as
buffer value
Minor roads – 7m buffer Generated new polyline
shape file using road
network layer
Added field 'Type' in attributes
table
Exported identified segments as
a new layer
Buffer (analysis) using 7m as
buffer value
Tricycle terminals Added new point shape
file Added terminals as points in
identified areas onto the shape file
Jeepney terminals Added new point shape
file Added terminals as points in
identified areas onto the shape file
Bus terminal Added new polygon shape
file Added terminal as polygon in
identified area onto the shape file
Traffic prone areas Generated new polyline
shape file using road
network layer
Added field 'TPA' in road
network attributes table
Exported identified segments as
a new layer
Buffer (analysis) using 10m as
buffer value

10
Figure 4. Typical road scenes during
Sundays.
Feature/Data Shape file/layer Methods employed
Re-routing Generated new polyline
shape file using road
network layer
Added field 'Reroute' in road
network attributes table
Exported identified segments as
a new layer
Buffer (analysis) using 10m as
buffer value
To analyze the maps generated for the barangay, planning theories and concepts, HLURB
guidelines and standards (Table 2) were used as references. This also served as the basis of
recommended strategic actions vis-a-vis existing national and local policies.
Table 3. Standards and methods employed to analyze the maps.
Analysis Map Basis used Methods employed
Tricycle terminals and
200m buffer zones
Used the walkabilty index
(200 – 400m) from
HLURB
Buffer (analysis) using points in
tricycle terminals shape file and
200m buffer value
Identification of No
Loading/ Unloading Zones
(proposed)
Used the walkabilty index
(200 – 400m) from
HLURB
Created new point shape file to
mark center of traffic prone area
Buffer (analysis) using tricycle
terminal shape file and 200m buffer
value
Identification of Loading/
Unloading Zones
Used the walkabilty index
(200 – 400m) from
HLURB
Created new point shape file for
loading/unloading zones
Measure tool, to manually measure
200m intervals from No
loading/unloading zones buffer
edges
Identification of Possible
Sites for Central Terminal
HLURB standard (750m) Created new polygon shape file for
central market
Buffer (analysis) using market as
center and 350m buffer value
5. Results and analysis
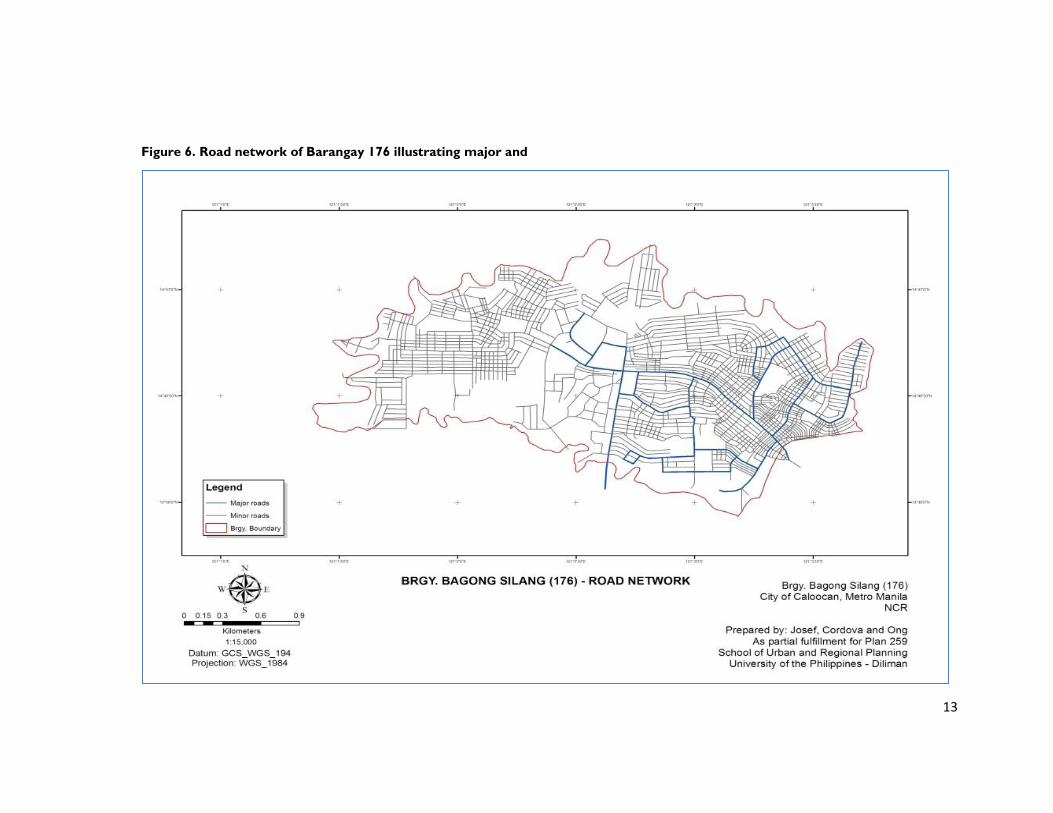
5.1 Road Networks and Public Transportation Routes
Using the buffers set and KII conducted
with key local officials, road networks and
routes were mapped. Figure 6 shows the major
and minor roads. The locals classify major roads
into kanan and kaliwa. There are jeepneys
assigned to take these routes. Figure 7 Buses are
taking the kanan (Camarin Road) route along
with some jeepneys and separate in the
industrial site in Phases 2 and 3. While these

11
modes traverse major roads, tricycles service the periphery or minor roads.
There are 3 traffic prone areas identified. These are located in the rotonda (Phase 9) that serve
as terminal of jeepney taking kaliwa route and tricycles. Second is located in the intersection
of Camarin and Ligaya Roads near the Phase 1 and Phase 4 market, parish church, and
barangay hall. The other traffic prone area is in the intersection located at Phase 5. Rows of
commercial establishments are located in this area of the barangay. Many of the jeepneys are
taking time to load and wait for passengers that causes traffic. Other factors that cause traffic
are vendors along the streets and on Sundays in churches.
5.2 Location of Terminals
This study also located other transport terminals such as jeepney, buses, and pedicab to see its
connection with the tricycle terminals. The TPRS designates terminal assignments of the
tricycles through their respective TODAs. Table 4 showed that there are only ten (10)
terminals are officially assigned by the TPRS for tricycles. However, we have accounted a
total of 40 terminals of tricycles. The excess terminals are unaccounted and unofficially
recorded in the local government office. Though residents are accustomed to see them and not
aware that these are informal terminals. Aside from this, there are also 2 terminals of
jeepneys, 1 for buses, and 1 for pedicab identified in the Barangay. Figure 8 shows the
locations of these terminals.
Table 4. Designated terminal assignment for tricycles.
NAME OF TODA Designated Terminals5
West Bagong Silang TODA Bridge going to Harmony, Front of Kalayaan Elem. School
BASITODA Phase 1 (front of Elem. School), Phase 3 (Front of Elem.
School) and Phase 8
Phase 5 TODA Phase 5 and Phase 7C (covered court)
BASIDECO Phases 2, 3,4,10 (Pagkabuhay and Shelter)
Source: TPRS, Caloocan City
5 Based on the interview with TPRS personnel

12
Figure 5. Locations of facilities from the
market
Source: Housing and Land Use Regulatory Board (HLURB)
Using the walkability6 index and
factoring in the location of the
terminals, it can be easily
observed that the terminals
(especially tricycles) are in
excess and located near to each
other (Figure 9). Terminals are
either on the streets or shares
space with pedestrian sidewalks.
The HLURB Executive Order
648 prescribes that the location
of the terminal (presumably
central terminal) should be
located at least 750 meters away
from the market (Figure 5; Figure
10). However, the situation of
terminals in the barangay is seen
otherwise.
Tricycle terminals are not
strategically located and some
are concentrated in an area (e.g.
Phase 4 near market and Phase
10). The bus and jeepney
terminals on the other hand
utilize the vacant lot and
roadsides which affect the traffic
flow.
Figure 10 suggests the proper location of infrastructure and other facilities. It is expected that
by adopting the prescribe standards may further improve planning, management and policy/
decision making of the barangay.
6 Generally defined as a measure of how friendly an area is to walking. For this study, distance is set at 200
meters.
13
Figure 6. Road network of Barangay 176 illustrating major and
minor roads

14
Figure 7. Road network and routes of Barangay 176 in major roads

15
Figure 8. Identified terminals for jeepneys tricycles, and pedicabs, and traffic prone
areas

16
Figure 9. Identified terminals of tricycles overlaid with walkability zones.

17
Figure 10. Illustration of 750 meters radius consideration in locating central terminal.

18
6. Recommendations/Strategic actions
Analysis of the four (Figure 6-9) generated baseline maps means that management of public
transportation supply requires an integrated approach. This included policies, governance,
infrastructure, and innovative schemes. With the available information, possible GIS applications
its basis (with regards to standards used) were explored and utilized the solutions and strategies
identified by the barangay officials to manage their public transportation supply. Moreover, the
strategic actions identified also supports the perception of stakeholders (commuters in general)
gathered from the survey. The GIS generated maps generated are expected to provide illustration
of the strategic actions.
Policies
The pending Barangay Ordinance No. 005 Series of 2011-02-24 for the implementation of
stickering system is a good start to manage the public transportation supply. The RDPSTM
recorded more than 300 tricycle and jeepney violators (e.g. colorum and out-of-line) as of January
2011. According to the key barangay officials, the proposed ordinance and system envisaged to
help solve these problems that add to the volume of public transportation in the Barangay.
Moreover, this moved is expected to change the behaviour of the commuters not to ride and
utilize the colorum and out-of-line vehicles.
Another policy aspect is the formulation of traffic schemes and strict implementation of traffic
rules and regulations. The current traffic scheme of the barangay is limited to the previous
ordinance7 that needs to be updated. To address the flow of traffic and manage the daily public
transportation supply in the identified traffic areas, rerouting schemes are identified as a possible
solution.
As shown in Figure 11 the areas for re-routing schemes were illustrated. These are: 1) Near
intersection of Camarin and Langit Roads – diverting all vehicles, making right turn after the
market and closing the segment of Camarin Road before the barangay hall and few meters away
from the parish church; 2) Before the bridge bordering Brgy. Camarin and Brgy. 176, jeepneys
and buses will be diverted to take an alternate route going directly to the terminal in Phase 2. This
will lessen the volume of vehicles towards northern directions passing through the Camarin Road.
Facilities and Infrastructure
In support to the traffic schemes, designating loading and unloading areas should be established
in the barangay along major roads to start with. This is to facilitate the traffic flow and discipline
among drivers and commuters. Using the walkability index 200 meters, loading and unloading
areas were identified along the major roads (Figure 12). Loading and unloading starts at 200
meters from the intersection of the identified traffic prone areas and assignments can be identified
accordingly by the barangay officials. Considering the traffic guidelines, it is also recommended
that loading and unloading starts 6 meters from all intersections. It should be supported by
7 The barangay officials is currently looking for the copy of the ordinance in order to recommend
amendments of the current scheme through a resolution.

19
infrastructures like waiting sheds and walkways or sidewalks to ensure safety of the commuters.
Other infrastructures like central terminal should be considered by the LGU in the future.

20
Figure 11. Proposed re-routing schemes in Barangay 176

21
Figure 12. Proposed loading and unloading areas in Barangay 176

22

Governance
The aspect of governance will only become effective only if all stakeholders are involved in the
process determining solutions. Public transportation is a sensitive issue in the Barangay. It has been
the root cause of many police reports and news in media. Added to this, it is the main source of
income for many families in the area. However, this need to be resolved with continues coordination
among sectors supported with soft and hard infrastructure of the local government.
Conflict among operators/drivers is a governance issues. These should be resolved with continuous
dialogue considering future plans (e.g. properly locating of terminals) that conforms with the set
standards (e.g. HLURB, National Building Code, National EST Strategy), local policies and plans
such as the Caloocan City’s Medium Term Development and Comprehensive Land Use Plans that
considers safety and convenience of all stakeholders.
The Barangay may also consider building its own database of public transportation supply especially
starting from registered buses, jeepneys, tricycles and pedicabs top archiving ordinances. This is
deemed necessary and will enable easy implementation of all programs in the future. Moreover, they
can closely coordinate with TPRS and RDPSTM to support this initiative.
To further manage the public transportation in the barangay, the authorities may also consider working
with national agencies/ bureaus like MMDA and LTFRB in relation to programs related to urban
redevelopment and transportation planning.
7. Limitation and opportunities of the study
The scope of the study was limited to available data accessed during the 3-month period. However, the
group was able to establish the baseline and generate digitize maps that can be used in future studies
and planning of the barangay. Future studies that may be explored by the barangay may include the
following:
Volume inventory and road capacity
Travel pattern with regards to peak hours
Demand patterns
Transportation forecasting
Passenger behaviour
Road capacity
Impact of transportation to land use and future development
Formulate transport plans considering National EST Strategy
References
Barangay Ordinance No. 005 Series of 2011-02-24, Brgy. 176, Caloocan City.
Barangay 176. 2011. Brief History of Bagong Silang Barangay 176, Lungsod ng Caloocan.
Caloocan City Medium Term Development Plan (2000-2005) [online]Available at
http://www.caloocancity.gov.ph/content.aspx?sectionid=328 [Accessed 5October 2011]
City of Caloocan. Comprehensive Land Use Plan Report (1995-2020) [online] Available at
http://www.caloocancity.gov.ph/content.aspx?sectionid=328 [Accessed: October 5, 2011]

CODATU XV - Le rôle de la mobilité urbaine pour (re)modeler les villes 1
HLURB. Implementing Rules and Regulations to Govern the Processing of Application or Locational
Clearance of Markets as Amanded. http://hlurb.gov.ph/uploads/laws-issuances/jan11/Markets.pdf Date
[Accessed 5 October 2012]
NSCB. 2007. PSGC Interactive, Caloocan City.
http://www.nscb.gov.ph/activestats/psgc/municipality.asp?muncode=137501000®code=13&provc
ode=75 [Accessed 5 October2011]
Smith, A., Crooks, M., and Milton, R. 2008. Mapping for the Masses: Accessing Web 2.0 through
Crowdsourcing. Working Papers Series, Paper 143 – Aug 08. UCL Centre for Advanced Spatial
Analysis, [online] Available at: <http://www.bartlett.ucl.ac.uk/casa/pdf/paper143.pdf> [Accessed: 28
November 2011].
Worldbank. Tranport in the Philippines.
http://www.worldbank.org.ph/WBSITE/EXTERNAL/COUNTRIES/EASTASIAPACIFICEXT/PHILI
PPINESEXTN/0,,contentMDK:20458733~menuPK:333013~pagePK:1497618~piPK:217854~theSite
PK:332982,00.html [Accessed 5 October 2011]


![Fixed tricycle landing gear - wiley.com · PDF fileUsing a reference such as [8], identify one aircraft with fixed tricycle landing gear, one aircraft with retractable tricycle landing](https://img.pdfslide.us/doc/110x75/5aae6fdc7f8b9a190d8c2907/fixed-tricycle-landing-gear-wileycom-a-reference-such-as-8-identify-one-aircraft.jpg)