Embed Size (px)
Citation preview
1Dam Engineering Vol XVIII Issue 3
Mapping impulsive waves due to subaeriallandslides into a dam reservoir: a case study ofShafa-Roud Dam
B Ataie-Ashtiani & S Malek-MohammadiDepartment of Civil EngineeringSharif University of TechnologyTehranIranFax: +98 21 66014828Email: [email protected]
AbstractIn this work, Subaerial Landslide Generated Waves (SLGW) generation and propaga-tion are studied numerically for a real case. The Shafa-Roud Dam reservoir, in the northof Iran, is considered as the case study. Empirical equations are applied to estimate thenear field characteristics of generated waves due to three possible slide scenarios.Empirical-based equations can provide the initial condition for Boussinesq-type wavepropagation models. Wave propagation velocity, dam overtopping volume and maxi-mum wave height above dam crest have been evaluated using the FUNWAVE numeri-cal model. Considering the previous experimental data, and observed data fromNorwegian fjords landslide events, and also the results of the numerical simulations inthis work, amplitude attenuation of SLGW is studied. Based on the results, the necessityfor a more conservative criterion for freeboard determination, for the cases of landslideevents, is emphasized.
Keywords: Dam reservoir, subaerial landslide, impulsive wave, tsunami, numerical model.
1. IntroductionSubaerial landslides in dam reservoirs pose destructive water waves and, consequently,massive damage to reservoir sidewalls, dam body, adjacent hydraulic structures, anddownstream or upstream agricultural and residential areas (cf, Semenza [21]). If they havehuge size, diminution of the reservoir capacity and subsequent economical damages isalso expected. A large number of analytical, experimental and numerical studies havebeen made to investigate the landslide generated waves. Ataie-Ashtiani & Najafi-Jilani [2]have performed a comprehensive review on the experimental and numerical studies [2, 3].
Dam Engineering Vol XVIII Issue 3 Dam Engineering Vol XVIII Issue 3 32
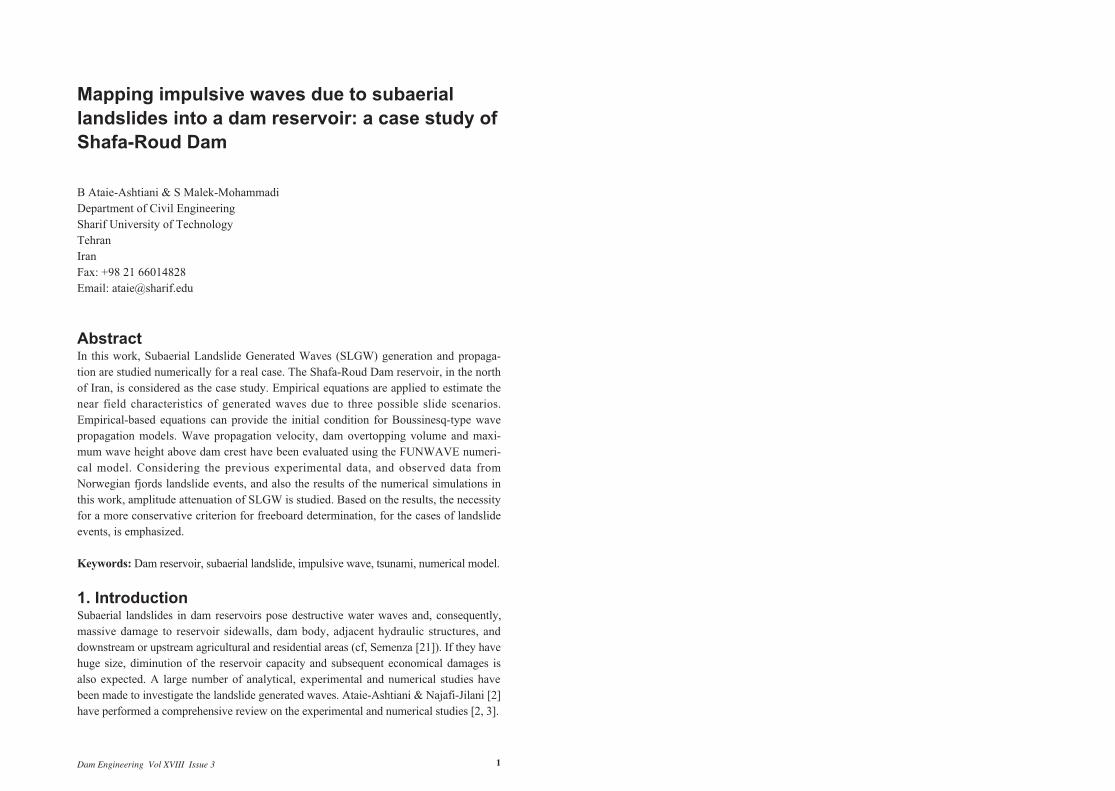
Four distinct stages can be distinguished in simulating SLGW related problems indam reservoirs. Generation, propagation, overtopping and inundation. Figure 1 illus-trates these separated stages. In the present study the Boussinesq-type wave propagationmodel, FUNWAVE [6], which has been developed at the University of Delaware, hasbeen applied to a landslide-susceptible reservoir, ie. the Shafa-Roud Dam reservoir inIran [15].
Wave heights along adjacent sidewalls and near the Shafa-Roud Dam, total volumeof dam overtopping, and wave propagation velocity, have been estimated for three dis-tinct scenarios of subaerial landslides. Wave amplitude attenuation has been studiedusing physical scale modelling of four SLGW scenarios in the Libby Dam reservoir,which has been carried out by Davidson & Whalin [4]. By means of empiricalapproach, new and more conservative criteria for freeboard considerations in fjord-likelandslide-susceptible reservoirs have been discussed.
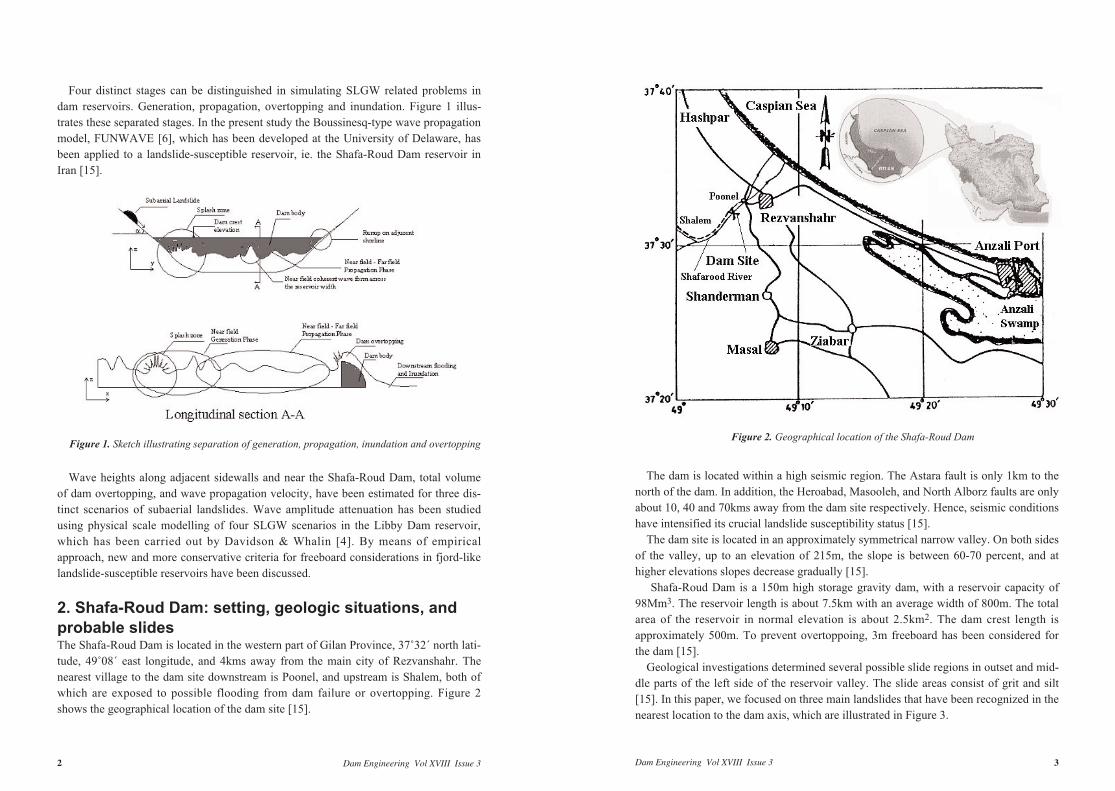
2. Shafa-Roud Dam: setting, geologic situations, andprobable slidesThe Shafa-Roud Dam is located in the western part of Gilan Province, 37˚32´ north lati-tude, 49˚08´ east longitude, and 4kms away from the main city of Rezvanshahr. Thenearest village to the dam site downstream is Poonel, and upstream is Shalem, both ofwhich are exposed to possible flooding from dam failure or overtopping. Figure 2shows the geographical location of the dam site [15].
The dam is located within a high seismic region. The Astara fault is only 1km to thenorth of the dam. In addition, the Heroabad, Masooleh, and North Alborz faults are onlyabout 10, 40 and 70kms away from the dam site respectively. Hence, seismic conditionshave intensified its crucial landslide susceptibility status [15].
The dam site is located in an approximately symmetrical narrow valley. On both sidesof the valley, up to an elevation of 215m, the slope is between 60-70 percent, and athigher elevations slopes decrease gradually [15].
Shafa-Roud Dam is a 150m high storage gravity dam, with a reservoir capacity of98Mm3. The reservoir length is about 7.5km with an average width of 800m. The totalarea of the reservoir in normal elevation is about 2.5km2. The dam crest length isapproximately 500m. To prevent overtoppoing, 3m freeboard has been considered forthe dam [15].
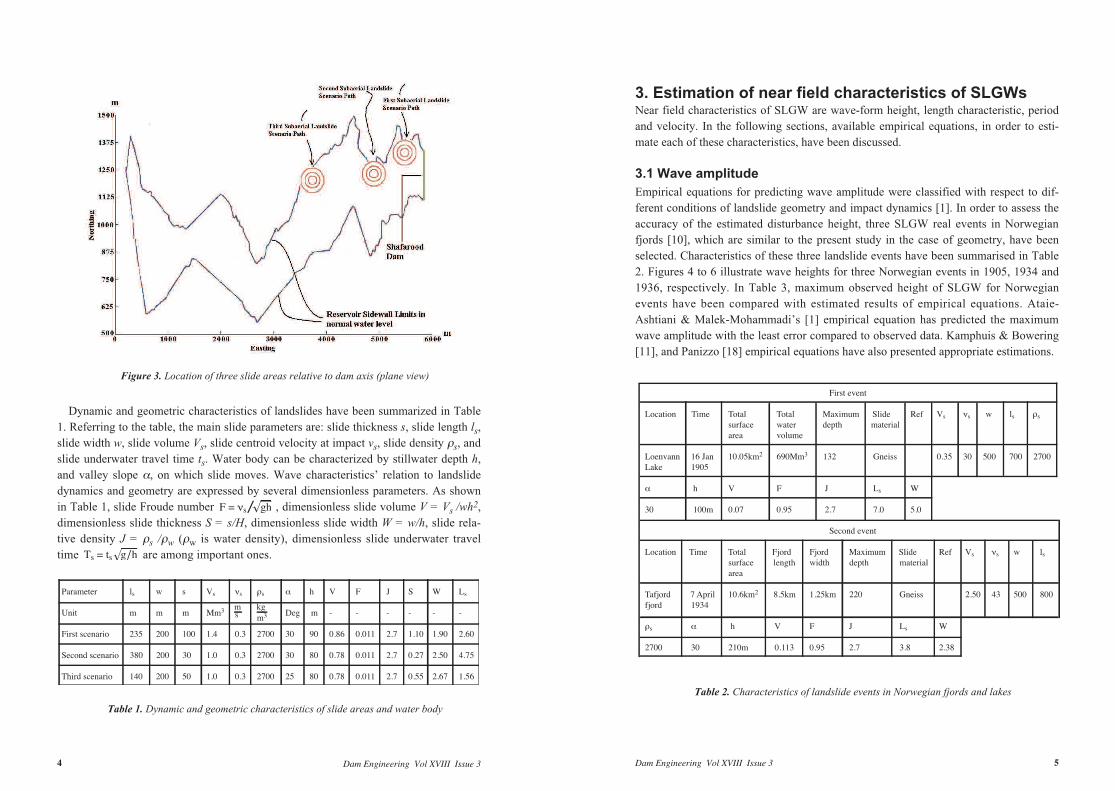
Geological investigations determined several possible slide regions in outset and mid-dle parts of the left side of the reservoir valley. The slide areas consist of grit and silt[15]. In this paper, we focused on three main landslides that have been recognized in thenearest location to the dam axis, which are illustrated in Figure 3.
Figure 1. Sketch illustrating separation of generation, propagation, inundation and overtoppingFigure 2. Geographical location of the Shafa-Roud Dam
Dam Engineering Vol XVIII Issue 34 Dam Engineering Vol XVIII Issue 3 5
Dynamic and geometric characteristics of landslides have been summarized in Table1. Referring to the table, the main slide parameters are: slide thickness s, slide length ls,slide width w, slide volume Vs, slide centroid velocity at impact vs, slide density ρs, andslide underwater travel time ts. Water body can be characterized by stillwater depth h,and valley slope α, on which slide moves. Wave characteristics’ relation to landslidedynamics and geometry are expressed by several dimensionless parameters. As shownin Table 1, slide Froude number , dimensionless slide volume V = Vs /wh2,dimensionless slide thickness S = s/H, dimensionless slide width W = w/h, slide rela-tive density J = ρs /ρw (ρw is water density), dimensionless slide underwater traveltime are among important ones.
3. Estimation of near field characteristics of SLGWs Near field characteristics of SLGW are wave-form height, length characteristic, periodand velocity. In the following sections, available empirical equations, in order to esti-mate each of these characteristics, have been discussed.
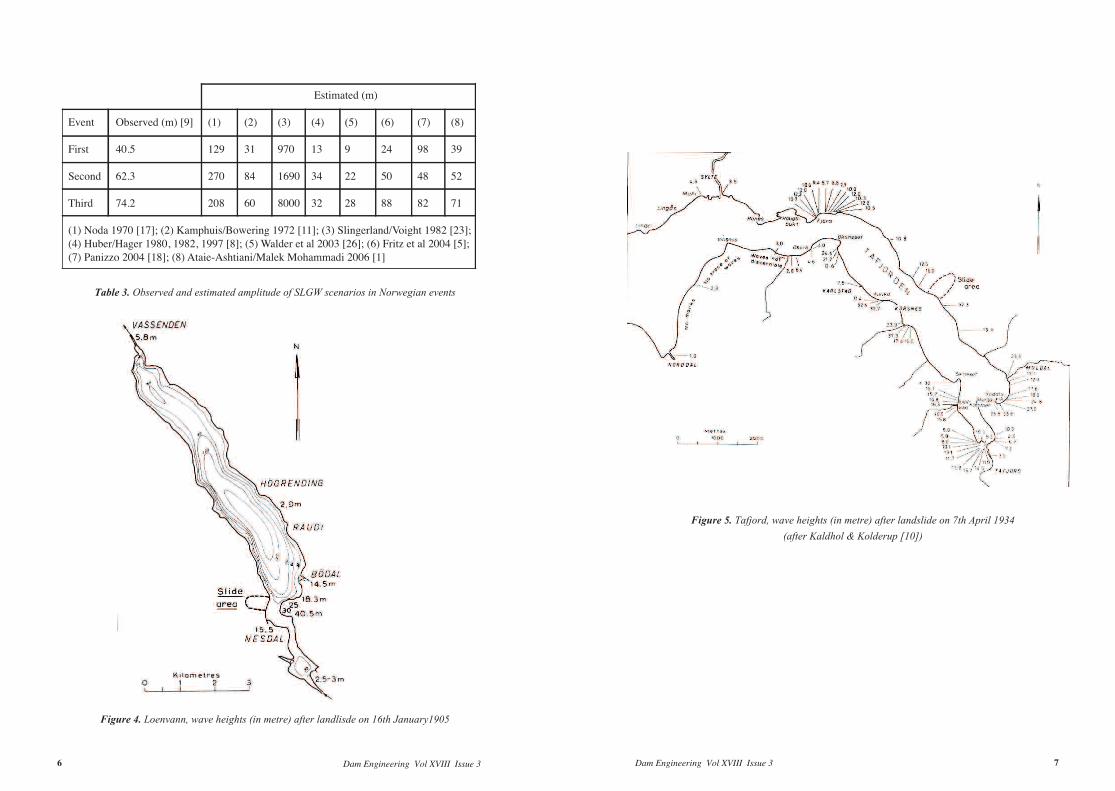
3.1 Wave amplitudeEmpirical equations for predicting wave amplitude were classified with respect to dif-ferent conditions of landslide geometry and impact dynamics [1]. In order to assess theaccuracy of the estimated disturbance height, three SLGW real events in Norwegianfjords [10], which are similar to the present study in the case of geometry, have beenselected. Characteristics of these three landslide events have been summarised in Table2. Figures 4 to 6 illustrate wave heights for three Norwegian events in 1905, 1934 and1936, respectively. In Table 3, maximum observed height of SLGW for Norwegianevents have been compared with estimated results of empirical equations. Ataie-Ashtiani & Malek-Mohammadi’s [1] empirical equation has predicted the maximumwave amplitude with the least error compared to observed data. Kamphuis & Bowering[11], and Panizzo [18] empirical equations have also presented appropriate estimations.
Figure 3. Location of three slide areas relative to dam axis (plane view)
Table 1. Dynamic and geometric characteristics of slide areas and water bodyTable 2. Characteristics of landslide events in Norwegian fjords and lakes
Dam Engineering Vol XVIII Issue 3 7Dam Engineering Vol XVIII Issue 36
Table 3. Observed and estimated amplitude of SLGW scenarios in Norwegian events
Figure 4. Loenvann, wave heights (in metre) after landlisde on 16th January1905
Figure 5. Tafjord, wave heights (in metre) after landslide on 7th April 1934 (after Kaldhol & Kolderup [10])
Dam Engineering Vol XVIII Issue 3 9Dam Engineering Vol XVIII Issue 38
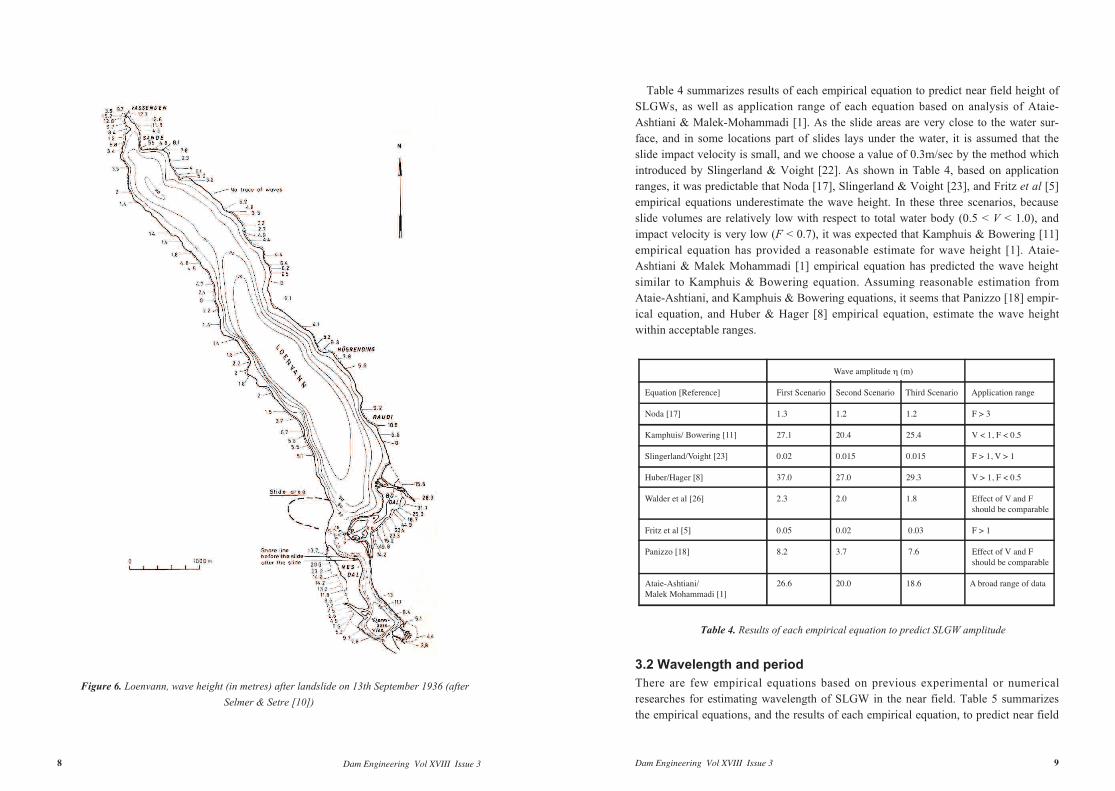
Table 4 summarizes results of each empirical equation to predict near field height ofSLGWs, as well as application range of each equation based on analysis of Ataie-Ashtiani & Malek-Mohammadi [1]. As the slide areas are very close to the water sur-face, and in some locations part of slides lays under the water, it is assumed that theslide impact velocity is small, and we choose a value of 0.3m/sec by the method whichintroduced by Slingerland & Voight [22]. As shown in Table 4, based on applicationranges, it was predictable that Noda [17], Slingerland & Voight [23], and Fritz et al [5]empirical equations underestimate the wave height. In these three scenarios, becauseslide volumes are relatively low with respect to total water body (0.5 < V < 1.0), andimpact velocity is very low (F < 0.7), it was expected that Kamphuis & Bowering [11]empirical equation has provided a reasonable estimate for wave height [1]. Ataie-Ashtiani & Malek Mohammadi [1] empirical equation has predicted the wave heightsimilar to Kamphuis & Bowering equation. Assuming reasonable estimation fromAtaie-Ashtiani, and Kamphuis & Bowering equations, it seems that Panizzo [18] empir-ical equation, and Huber & Hager [8] empirical equation, estimate the wave heightwithin acceptable ranges.
3.2 Wavelength and periodThere are few empirical equations based on previous experimental or numericalresearches for estimating wavelength of SLGW in the near field. Table 5 summarizesthe empirical equations, and the results of each empirical equation, to predict near field
Figure 6. Loenvann, wave height (in metres) after landslide on 13th September 1936 (afterSelmer & Setre [10])
Table 4. Results of each empirical equation to predict SLGW amplitude

Dam Engineering Vol XVIII Issue 3 11Dam Engineering Vol XVIII Issue 310
SLGW wavelength in the Shafa-Roud Dam scenarios. From Table 5, Fritz empiricalequation most probably underestimates the wavelength because the velocity and volumeof the slide is beyond the application range of Fritz equations. However, due to lack offield observations, or experimental data on SLGW wavelength, Walder et al [26] empir-ical equation is used in the present study, in spite of incompatible application ranges.
There are few empirical equations based on the previous experimental or numericalresearches for estimating period of SLGW in the near field. Table 6 summarizes theempirical equations, and the results of each empirical equation, to predict SLGW periodfor the Shafa-Roud Dam scenarios. From Table 6, although Kamphuis & Bowering [11]equation is in the application range, such a long period is not expected for impulsivewaves and, hence, we have used Panizzo [18] empirical equation. This equation givesthe least period, hence the propagation velocity will be uttermost, and simulation will bein the safe side.
4. Computation of wave propagation and overtopping
4.1 Proxy initial conditionThe proxy initial condition for wave propagation model consists of the maximum waveheight and length characteristic in the near field. Wave height has been estimated fol-lowing the results of Section 3.1, based on empirical equation of Ataie-Ashtiani &Malek-Mohammadi [1], and Kamphuis & Bowering [11]. Wavelength in the near fieldhas been estimated following the results of Section 3.2, based on empirical equation ofWalder et al [26]. Table 7 summarizes generated wave characteristics in the near fieldused to assign appropriate initial conditions.
Table 5. Results of each empirical equation to predict wavelength of SLGW
Table 7. Summary of near-field characteristics of SLGW scenariosTable 6. Results of each empirical equation to predict period of SLGW scenarios
Dam Engineering Vol XVIII Issue 3 13Dam Engineering Vol XVIII Issue 312
At least one solitary wave could be generated by any boundary movement that pro-duces a net positive displacement volume of water. Hence, distribution of the waveheight in the near field has been approximated by first order solution of Euler equations(Boussinesq approximation) for solitary waves which has formerly been used byWalder et al [27]:
(1)
(2)
In the above equations, ηm is the maximum height of the solitary wave that was sub-stituted by the values of the second column in Table 7. L is the length characteristic ofthe solitary hump that was substituted by the values of the first column in Table 7. x andy are defined as directions along, and normal to the slide path, respectively.
To complete the initial conditions, water velocity must be applied to the model. Asmentioned in the previous studies, the water velocity in the near field can be presented byapproximate solution of Boussinesq for solitary wave theory . Neglectingnonlinear effects with respect to general accuracy of the method, phase velocity approxi-mated to . This velocity has been applied to the water near the source, to simu-late initial wave propagation velocity in the near field as shown in the last column ofTable 7.
All of these estimations have been performed with this general assumption that land-slide stops under the water, splashing zone has disappeared, and the water has reachedits near steady conditions.
4.2 Grid generation and boundary conditions Bathymetry of the reservoir was obtained by digitising a topographic map made beforethe construction of the Shafa-Roud Dam, then interpolating values onto a curvi-lineargrid with 10m spacing along the reservoir length (East - West), and 15m spacing alongthe reservoir width (North - South). The initial condition is passed to the numericalmodel, FUNWAVE, and it solved the wave propagation problem using finite differencescheme. Time step was chosen as 0.01 secs. In Appendix A, selecting appropriate timeand grid spacing have been discussed.
Far field boundary condition at the east end of the reservoir, and total reflecting (rigidwall) boundary condition at the dam site, has been applied. In reservoir sidewalls,because of porosity and slope, partial reflection boundary condition have been appliedto the numerical model.
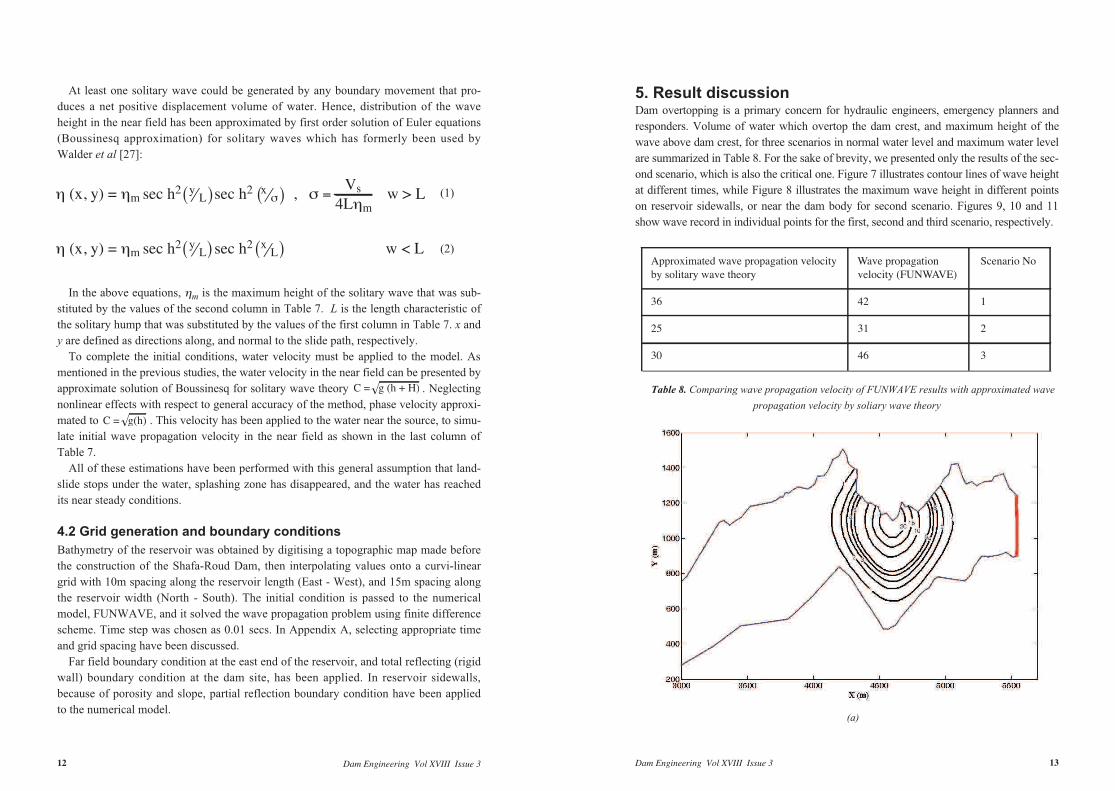
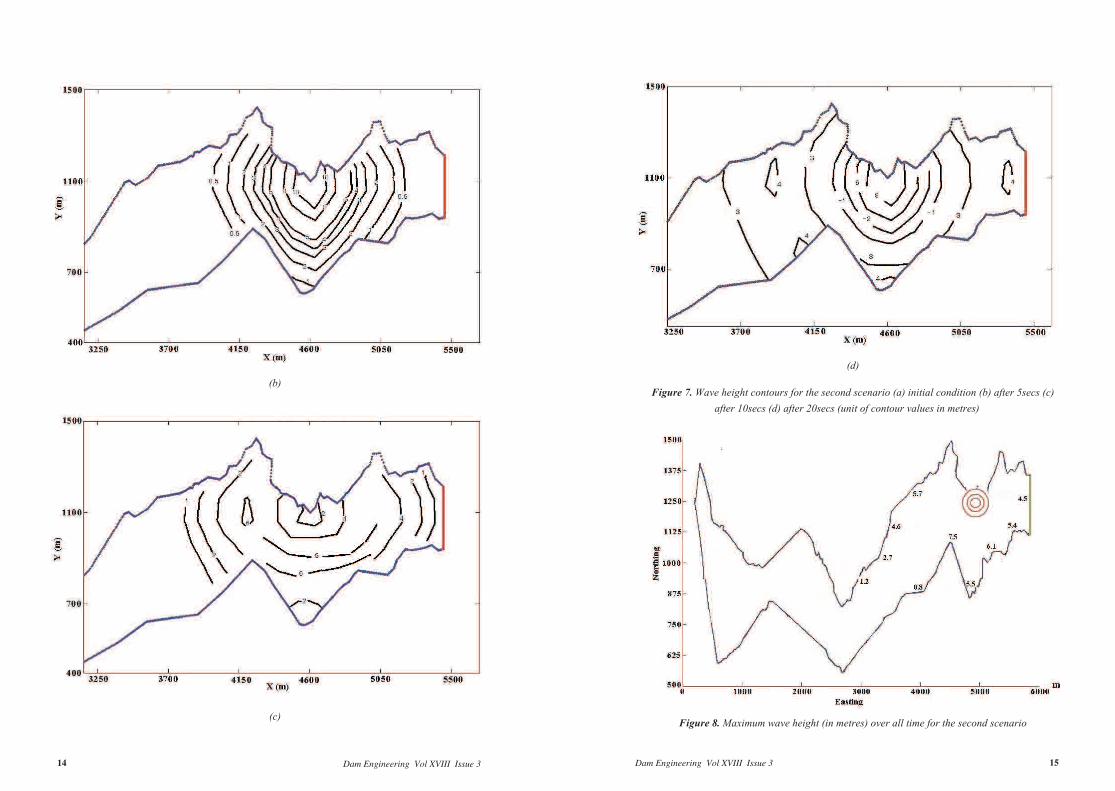
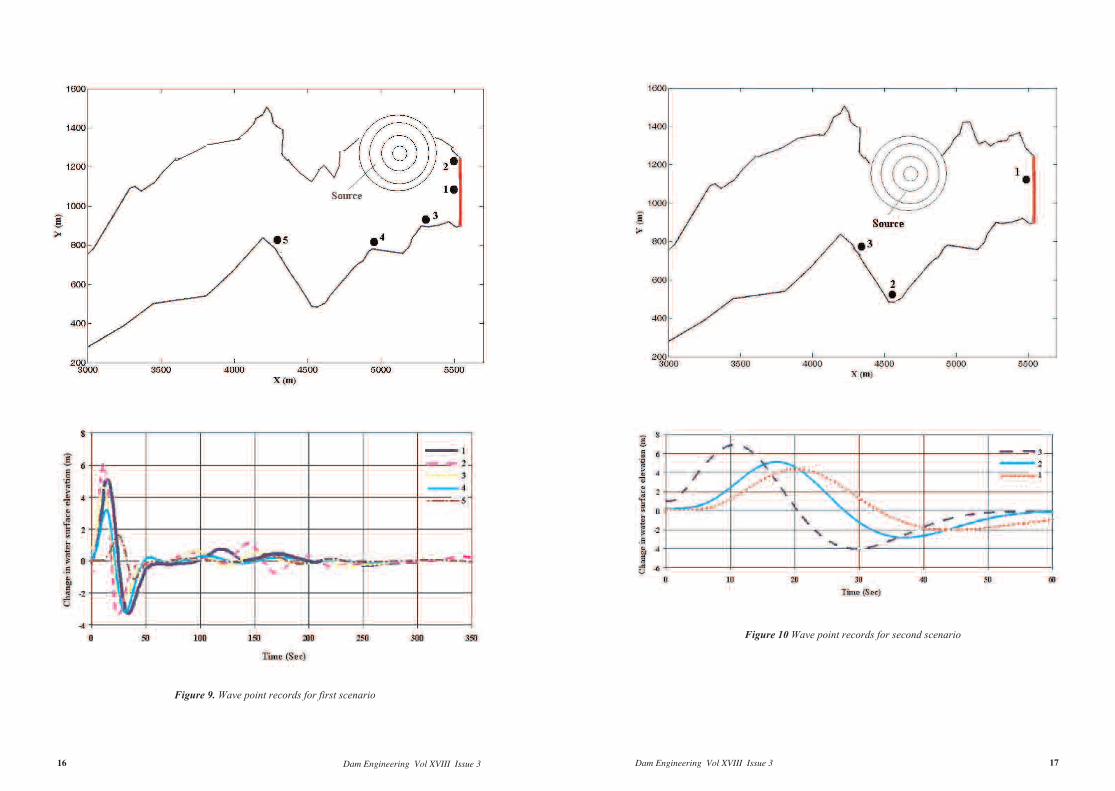
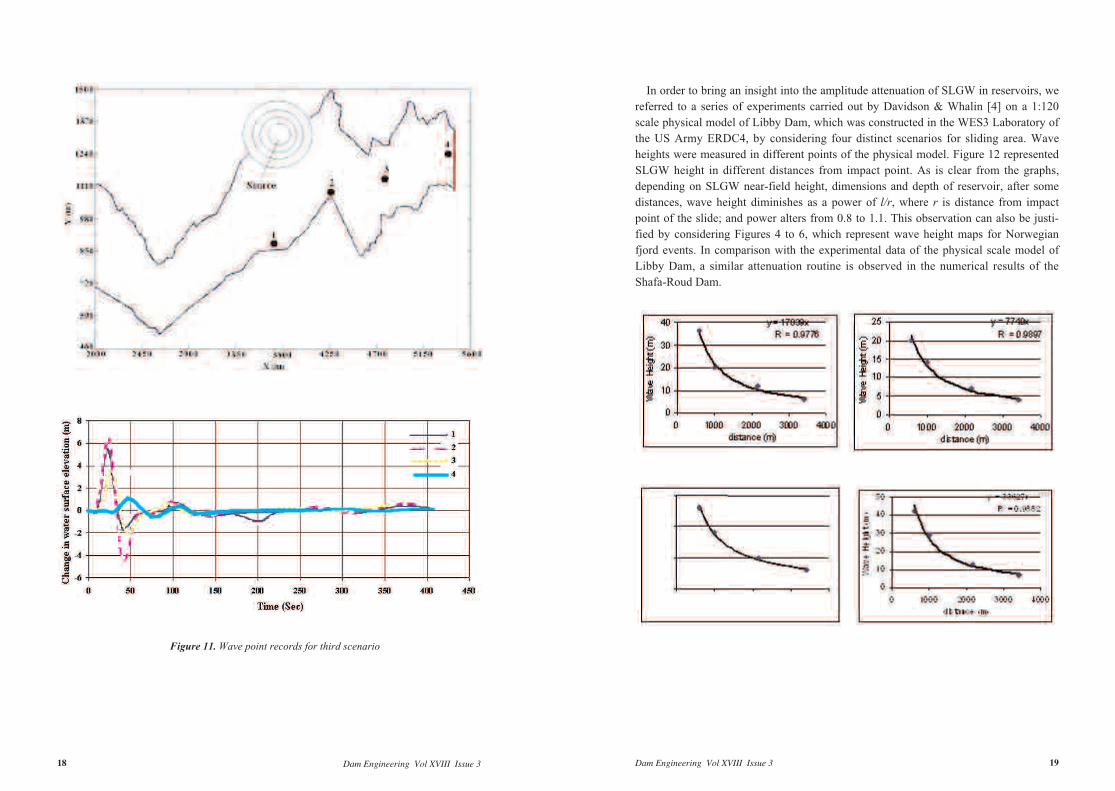
5. Result discussionDam overtopping is a primary concern for hydraulic engineers, emergency planners andresponders. Volume of water which overtop the dam crest, and maximum height of thewave above dam crest, for three scenarios in normal water level and maximum water levelare summarized in Table 8. For the sake of brevity, we presented only the results of the sec-ond scenario, which is also the critical one. Figure 7 illustrates contour lines of wave heightat different times, while Figure 8 illustrates the maximum wave height in different pointson reservoir sidewalls, or near the dam body for second scenario. Figures 9, 10 and 11show wave record in individual points for the first, second and third scenario, respectively.
(a)
Table 8. Comparing wave propagation velocity of FUNWAVE results with approximated wavepropagation velocity by soliary wave theory
Dam Engineering Vol XVIII Issue 3 15Dam Engineering Vol XVIII Issue 314
(b)
(c)
(d)
Figure 7. Wave height contours for the second scenario (a) initial condition (b) after 5secs (c)after 10secs (d) after 20secs (unit of contour values in metres)
Figure 8. Maximum wave height (in metres) over all time for the second scenario
Dam Engineering Vol XVIII Issue 3 17Dam Engineering Vol XVIII Issue 316
Figure 9. Wave point records for first scenario
Figure 10 Wave point records for second scenario
Dam Engineering Vol XVIII Issue 3 19Dam Engineering Vol XVIII Issue 318
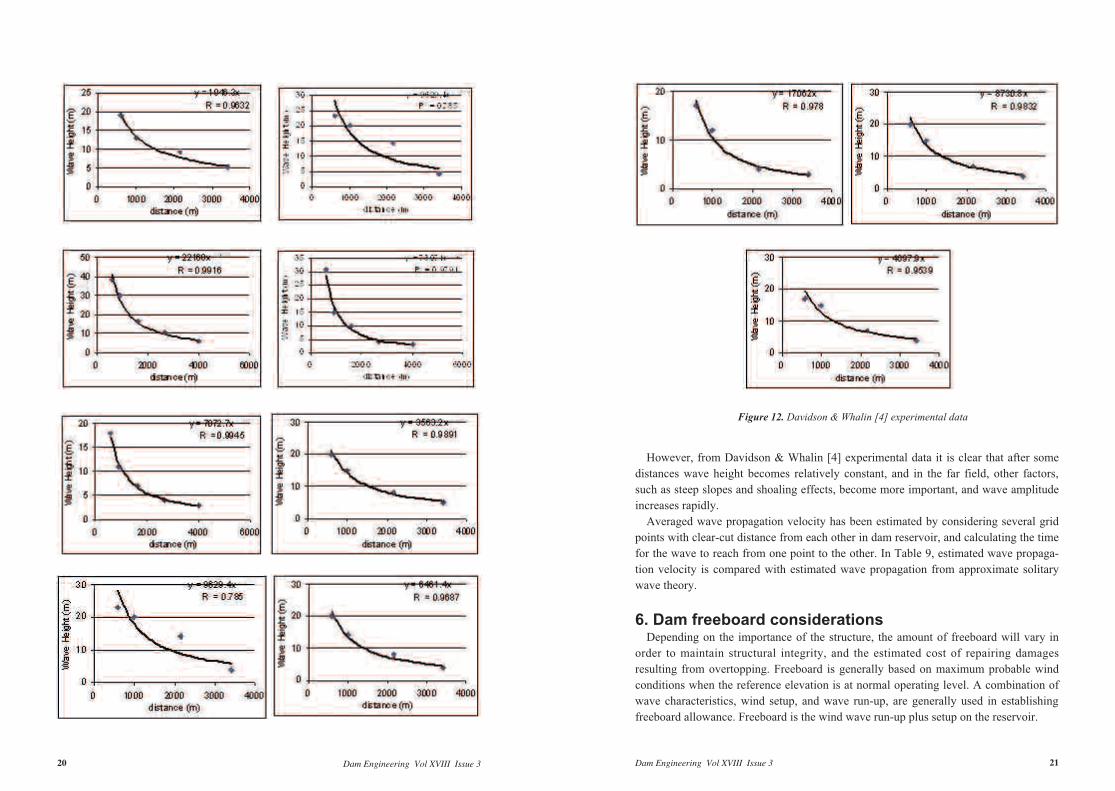
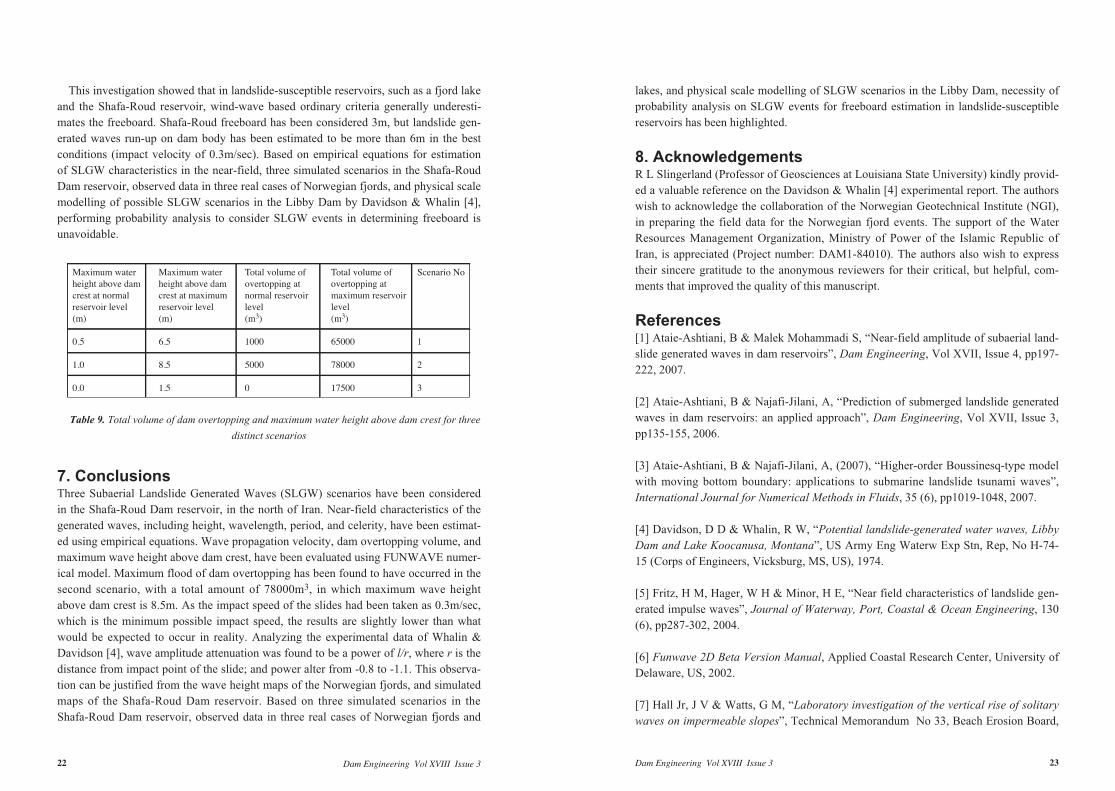
In order to bring an insight into the amplitude attenuation of SLGW in reservoirs, wereferred to a series of experiments carried out by Davidson & Whalin [4] on a 1:120scale physical model of Libby Dam, which was constructed in the WES3 Laboratory ofthe US Army ERDC4, by considering four distinct scenarios for sliding area. Waveheights were measured in different points of the physical model. Figure 12 representedSLGW height in different distances from impact point. As is clear from the graphs,depending on SLGW near-field height, dimensions and depth of reservoir, after somedistances, wave height diminishes as a power of l/r, where r is distance from impactpoint of the slide; and power alters from 0.8 to 1.1. This observation can also be justi-fied by considering Figures 4 to 6, which represent wave height maps for Norwegianfjord events. In comparison with the experimental data of the physical scale model ofLibby Dam, a similar attenuation routine is observed in the numerical results of theShafa-Roud Dam.
Figure 11. Wave point records for third scenario
Dam Engineering Vol XVIII Issue 3 21Dam Engineering Vol XVIII Issue 320
However, from Davidson & Whalin [4] experimental data it is clear that after somedistances wave height becomes relatively constant, and in the far field, other factors,such as steep slopes and shoaling effects, become more important, and wave amplitudeincreases rapidly.
Averaged wave propagation velocity has been estimated by considering several gridpoints with clear-cut distance from each other in dam reservoir, and calculating the timefor the wave to reach from one point to the other. In Table 9, estimated wave propaga-tion velocity is compared with estimated wave propagation from approximate solitarywave theory.
6. Dam freeboard considerationsDepending on the importance of the structure, the amount of freeboard will vary in
order to maintain structural integrity, and the estimated cost of repairing damagesresulting from overtopping. Freeboard is generally based on maximum probable windconditions when the reference elevation is at normal operating level. A combination ofwave characteristics, wind setup, and wave run-up, are generally used in establishingfreeboard allowance. Freeboard is the wind wave run-up plus setup on the reservoir.
Figure 12. Davidson & Whalin [4] experimental data
Dam Engineering Vol XVIII Issue 3 23Dam Engineering Vol XVIII Issue 322
This investigation showed that in landslide-susceptible reservoirs, such as a fjord lakeand the Shafa-Roud reservoir, wind-wave based ordinary criteria generally underesti-mates the freeboard. Shafa-Roud freeboard has been considered 3m, but landslide gen-erated waves run-up on dam body has been estimated to be more than 6m in the bestconditions (impact velocity of 0.3m/sec). Based on empirical equations for estimationof SLGW characteristics in the near-field, three simulated scenarios in the Shafa-RoudDam reservoir, observed data in three real cases of Norwegian fjords, and physical scalemodelling of possible SLGW scenarios in the Libby Dam by Davidson & Whalin [4],performing probability analysis to consider SLGW events in determining freeboard isunavoidable.
7. ConclusionsThree Subaerial Landslide Generated Waves (SLGW) scenarios have been consideredin the Shafa-Roud Dam reservoir, in the north of Iran. Near-field characteristics of thegenerated waves, including height, wavelength, period, and celerity, have been estimat-ed using empirical equations. Wave propagation velocity, dam overtopping volume, andmaximum wave height above dam crest, have been evaluated using FUNWAVE numer-ical model. Maximum flood of dam overtopping has been found to have occurred in thesecond scenario, with a total amount of 78000m3, in which maximum wave heightabove dam crest is 8.5m. As the impact speed of the slides had been taken as 0.3m/sec,which is the minimum possible impact speed, the results are slightly lower than whatwould be expected to occur in reality. Analyzing the experimental data of Whalin &Davidson [4], wave amplitude attenuation was found to be a power of l/r, where r is thedistance from impact point of the slide; and power alter from -0.8 to -1.1. This observa-tion can be justified from the wave height maps of the Norwegian fjords, and simulatedmaps of the Shafa-Roud Dam reservoir. Based on three simulated scenarios in theShafa-Roud Dam reservoir, observed data in three real cases of Norwegian fjords and
lakes, and physical scale modelling of SLGW scenarios in the Libby Dam, necessity ofprobability analysis on SLGW events for freeboard estimation in landslide-susceptiblereservoirs has been highlighted.
8. AcknowledgementsR L Slingerland (Professor of Geosciences at Louisiana State University) kindly provid-ed a valuable reference on the Davidson & Whalin [4] experimental report. The authorswish to acknowledge the collaboration of the Norwegian Geotechnical Institute (NGI),in preparing the field data for the Norwegian fjord events. The support of the WaterResources Management Organization, Ministry of Power of the Islamic Republic ofIran, is appreciated (Project number: DAM1-84010). The authors also wish to expresstheir sincere gratitude to the anonymous reviewers for their critical, but helpful, com-ments that improved the quality of this manuscript.
References[1] Ataie-Ashtiani, B & Malek Mohammadi S, “Near-field amplitude of subaerial land-slide generated waves in dam reservoirs”, Dam Engineering, Vol XVII, Issue 4, pp197-222, 2007.
[2] Ataie-Ashtiani, B & Najafi-Jilani, A, “Prediction of submerged landslide generatedwaves in dam reservoirs: an applied approach”, Dam Engineering, Vol XVII, Issue 3,pp135-155, 2006.
[3] Ataie-Ashtiani, B & Najafi-Jilani, A, (2007), “Higher-order Boussinesq-type modelwith moving bottom boundary: applications to submarine landslide tsunami waves”,International Journal for Numerical Methods in Fluids, 35 (6), pp1019-1048, 2007.
[4] Davidson, D D & Whalin, R W, “Potential landslide-generated water waves, LibbyDam and Lake Koocanusa, Montana”, US Army Eng Waterw Exp Stn, Rep, No H-74-15 (Corps of Engineers, Vicksburg, MS, US), 1974.
[5] Fritz, H M, Hager, W H & Minor, H E, “Near field characteristics of landslide gen-erated impulse waves”, Journal of Waterway, Port, Coastal & Ocean Engineering, 130(6), pp287-302, 2004.
[6] Funwave 2D Beta Version Manual, Applied Coastal Research Center, University ofDelaware, US, 2002.
[7] Hall Jr, J V & Watts, G M, “Laboratory investigation of the vertical rise of solitarywaves on impermeable slopes”, Technical Memorandum No 33, Beach Erosion Board,
Table 9. Total volume of dam overtopping and maximum water height above dam crest for threedistinct scenarios
Dam Engineering Vol XVIII Issue 3 25Dam Engineering Vol XVIII Issue 324
US Army Corps of Engineers, Washington, DC, US, 1953.
[8] Huber, A & Hager, W H, “Forecasting impulse waves in reservoirs”, Dix-neuvièmeCongrès des Grands Barrages C, 31, pp993-1005, Florence, Italy, CommissionInternationale des Grands Barrages, Paris, France, 1997.
[9] Hughes, S A, “Estimation of wave run-up on smooth, impermeable slopes using thewave momentum flux parameter”, Journal of Coastal Engineering, 51, pp1085-1104,2004.
[10] Jørstad, F A, “Waves generated by landslides in Norwegian fjords and lakes”,Norwegian Geotechnical Institute, Publication No 79, 13-31, 1968.
[11] Kamphuis, J W & Bowering, R J, “Impulse waves generated by landslides”, Proc,12th Coastal Engineering Conference, ASCE, Reston, VA, US, 1, pp575-588, 1970.
[12] Kranzer, H C & Keller, J B, “Water waves produced by explosion”, Journal ofApplied Physics, 30, pp398-407, 1959.
[13] Li, Y & Raichlen, F, “Solitary wave run-up on plane slopes”, Journal of Waterway,Port, Coastal & Ocean Engineering, 127 (1), pp33-44, 2001.
[14] Law, L & Brebner, A, “On water waves generated by landslides”, 3rd AustralianConference on Hydraulics & Fluid Mechanics, Sydney, Australia, 2561, pp155-159,1968.
[15] Mahab Ghods Inc, “Final report of Shafa-Roud Dam reservoir project”, (inPersian), 1999.
[16] Malek-Mohammadi, S, “Estimation of near-field amplitude and propagation simu-lation of subaerial landslide generated waves in dam reservoirs”, MSc Thesis, SharifUniversity of Technology, Tehran, Iran, p218 (in Persian), 2006.
[17] Noda, E, “Water waves generated by landslides,” Journal of Waterway, Port,Coastal & Ocean Division, ASCE, 96 (4), pp835-855, 1970.
[18] Panizzo A, De Girolamo, P, Di Risio, M, Maistri, A & Petaccia, A, “Great land-slide events in Italian artificial reservoirs,”, Natural Hazards & Earth System Sciences,5, pp733-740, 2005.
[19] Panizzo, A, De Girolamo, P & Pettacia, A, “Forecasting impulse waves generatedby subaerial landslides”, Journal of Geophysical Reserach, 110, C12025, 2005.
[20] Rzadkiewicz, S A, Mariotti, C & Heinrich, P, “Numerical simulation of submarinelandslides and their hydraulic effects”, Journal of Waterway, Port, Coastal & OceanEngineering, ASCE, July/August, pp149- 157, 1997.
[21] Semenza, E, “La storia del Vajont, raccontata dal geologo che ha scoperto lafrana”, Tecomproject, Ferrara, 2002.
[22] Slingerland, R L & Voight, B, “Occurrences, properties and predictive models oflandslide-generated impulse waves”, Rockslides Avalanches 2, pp317-397, B Voight,Ed, Elsevier, Amsterdam, The Netherlands, 1979.
[23] Slingerland, R L & Voight, B, “Evaluating hazard of landslide-induced waterwaves”, Journal of Waterway, Port, Coastal, Ocean Division, ASCE, 108 (4), pp504-512, 1982.
[24] US Army Corps of Engineers (USACE), “Storm surge analysis and design waterlevel determinations”, EM 1110-2-1412, DAEN-CWH-W, Washington, DC, US, 15April 1986.
[25] US Army Corps of Engineers (USACE), “Coastal Engineering Manual”, EM1110-2-1100, US Army Corps of Engineers, Washington, DC, US, (in six volumes),2003.
[26] Walder, J S, Watts, P, Sorensen, O E & Janssen, K, “Water waves generated bysubaerial mass flows”, Journal of Geophysical Research, [Solid Earth], 108 (5),pp2236-2255, 2003.
[27] Walder, J S, Watts, P & Waythomas, C F, “Case study: mapping tsunami hazardsassociated with debris flow into a reservoir”, Journal of Hydraulic Engineering, ASCE,132 (1), pp1-11, 2006.
[28] Wen Long, (one of the FUNWAVE developers at Delaware University), personalcommunications.
Dam Engineering Vol XVIII Issue 3 27Dam Engineering Vol XVIII Issue 326
Appendix A
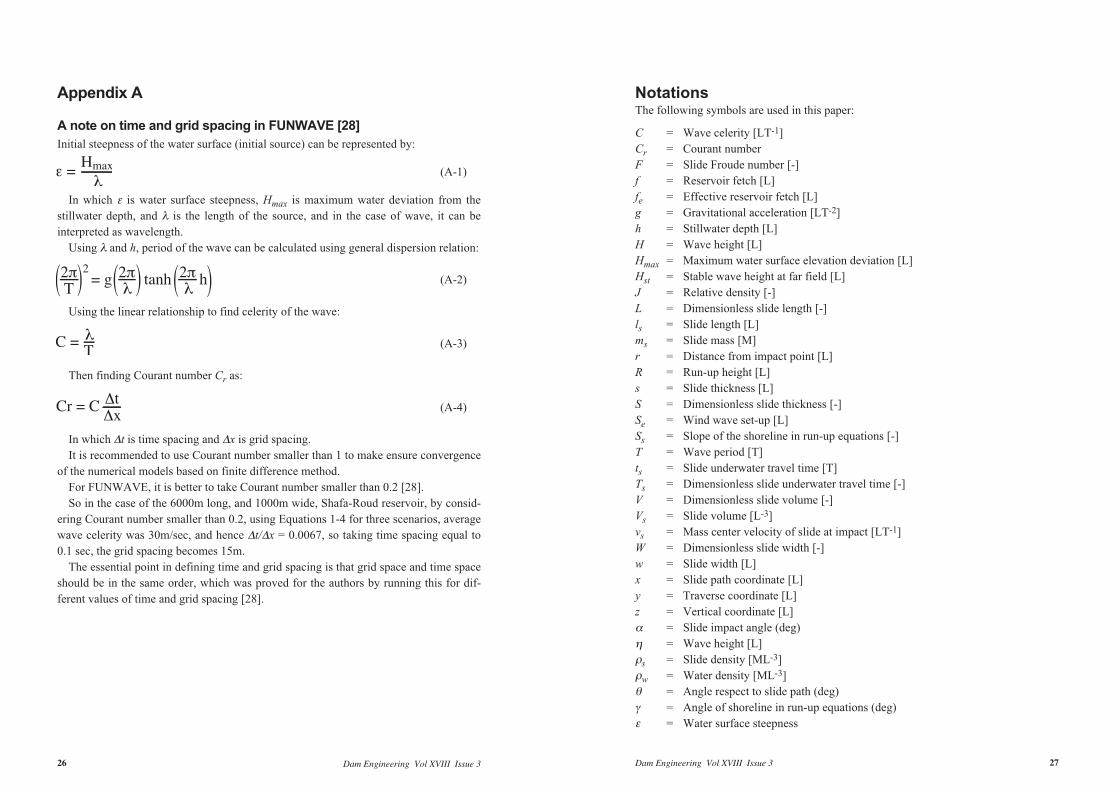
A note on time and grid spacing in FUNWAVE [28]Initial steepness of the water surface (initial source) can be represented by:
(A-1)
In which ε is water surface steepness, Hmax is maximum water deviation from thestillwater depth, and λ is the length of the source, and in the case of wave, it can beinterpreted as wavelength.
Using λ and h, period of the wave can be calculated using general dispersion relation:
(A-2)
Using the linear relationship to find celerity of the wave:
(A-3)
Then finding Courant number Cr as:
(A-4)
In which ∆t is time spacing and ∆x is grid spacing.It is recommended to use Courant number smaller than 1 to make ensure convergence
of the numerical models based on finite difference method.For FUNWAVE, it is better to take Courant number smaller than 0.2 [28].So in the case of the 6000m long, and 1000m wide, Shafa-Roud reservoir, by consid-
ering Courant number smaller than 0.2, using Equations 1-4 for three scenarios, averagewave celerity was 30m/sec, and hence ∆t/∆x = 0.0067, so taking time spacing equal to0.1 sec, the grid spacing becomes 15m.
The essential point in defining time and grid spacing is that grid space and time spaceshould be in the same order, which was proved for the authors by running this for dif-ferent values of time and grid spacing [28].
NotationsThe following symbols are used in this paper:
C = Wave celerity [LT-1]Cr = Courant numberF = Slide Froude number [-]f = Reservoir fetch [L]fe = Effective reservoir fetch [L]g = Gravitational acceleration [LT-2]h = Stillwater depth [L]H = Wave height [L]Hmax = Maximum water surface elevation deviation [L]Hst = Stable wave height at far field [L]J = Relative density [-]L = Dimensionless slide length [-]ls = Slide length [L]ms = Slide mass [M]r = Distance from impact point [L]R = Run-up height [L]s = Slide thickness [L]S = Dimensionless slide thickness [-]Se = Wind wave set-up [L]Ss = Slope of the shoreline in run-up equations [-]T = Wave period [T]ts = Slide underwater travel time [T]Ts = Dimensionless slide underwater travel time [-]V = Dimensionless slide volume [-]Vs = Slide volume [L-3]vs = Mass center velocity of slide at impact [LT-1]W = Dimensionless slide width [-]w = Slide width [L]x = Slide path coordinate [L]y = Traverse coordinate [L]z = Vertical coordinate [L]α = Slide impact angle (deg)η = Wave height [L]ρs = Slide density [ML-3]ρw = Water density [ML-3]θ = Angle respect to slide path (deg)γ = Angle of shoreline in run-up equations (deg)ε = Water surface steepness


![[Murrey Jeneth] Impulsive Proposal](https://img.pdfslide.us/doc/110x75/563db8ff550346aa9a99002a/murrey-jeneth-impulsive-proposal.jpg)