Embed Size (px)
Citation preview
Mapping and Study ofCoastal Water Bodies in Nagapattinam District
Commissioned byNGO Co-ordination and Resource Centre (NCRC)
Nagapattinam
Supported by
Concern Worldwide
ByDr.R.K. Sivanappan & Associates
April 2007
MAPPING AND STUDY OF COASTAL WATER BODIES INNAGAPATTINAM DISTRICT
ByDr.R.K. Sivanappan & Associates
April 2007
Published byNGO Co-ordination and Resource CentreNagapattinam
Edited byDr. Ahana Lakshmi
Designed byC.R.Aravindan, SIFFS
Printed atNeo Graphics, Trivandrum
CONTENTS
Acknowledgements
Preface
Executive Summary
Chapter One Introduction .......................................................................... 1
Chapter Two Agriculture in Nagapattinam ................................................ 15
Chanpter Three Brief on Vulnerability Study ................................................ 19
Chapter Four Need for the Study ............................................................... 23
Chapter Five Methodology ........................................................................ 25
Chapter Six Observations - Water Bodies ............................................... 33
Chapter Seven TER-Based Observations ..................................................... 57
Chapter Eight Recommendations ................................................................ 99
Chapter Nine Groundwater Recharge ........................................................ 127
Chapter Ten Community Based Water Resource Management ............... 135
Chapter Eleven General Recommendations and Budget ............................... 139
ACKNOWLEDGEMENTS
NCRC has great pleasure in publishing this study on the “Mapping and Study
of Coastal Water Bodies in Nagapattinam District”. This has been the
culmination of the natural progression from relief to rehabilitation and then to
development through disaster- proofing of agriculture. It is an attempt to leave
behind a legacy that, despite being of the very limited mandate of disaster
response, will have a larger role to play in not only restoring agriculture to its
immediate pre- tsunami status but also starting a process that will hopefully
reinstate agriculture to its former stature of being the life- line of the food security
of the State.
NCRC takes this opportunity to gratefully acknowledge the financial, technical
and moral support provided by Concern Worldwide who partnered us every
step of this journey, especially Mr. Prabhakaran and Mr. Pattabhiraman.
NCRC gratefully acknowledges the “open-door policy” and the support of the
Nagapattinam District Collector, Sri Tenkasi S. Jawahar, IAS, and his staff to
NCRC.
NCRC also states its indebtedness to Mr. Nalluswamy, CE WRO/PWD- Trichy,
Mr. Ganesan, SE WRO/PWD - Thanjavur, Mr. Murthy and Mr. Kannan EEs
WRO/PWD, Mr. Bhaskaran AE/WRO/PWD, Thiruvarur, Mr. Rajendran AE/
Thanjavur, Mr. Senthil, EE, AED- Nagapattinam, Mr. N. Varadaraj R.D., CGWB,
Chennai, and all their staff for their unstinted support and guidance all through
the study.
This Report would have been grossly deficient if not for the experience, expertise
and perspectives shared by the farming communities either directly or through
their representatives. NCRC gratefully acknowledges their valuable inputs.
This Study has gained immensely from the rich experience and sectoral
understanding of Dr. R K Sivanappan, erstwhile member of the State Planning
Commission and former Dean of Agriculture Engineering College, Coimbatore,
who agreed not only to lead this Study but also voluntarily walked the extra
mile to enrich the study.
NCRC gratefully thanks CCD, CEE, TOFARM, Kudumbam and Venture Trust
for collaborating with us on this Study and providing us with their staff despite
the exigencies on their time.
Special heartfelt thanks to Dr. Ahana Lakshmi of TRINet for the time and
commitment put into editing this report and to the CMS team for their patient
handling of queries and data management. NCRC also owes its gratitude to Sri.
Satish Babu and Sri. C.R.Aravind of SIFFS for providing layout and printing
support despite the last minute hitches and pressures.
NCRC has the proud privilege of dedicating this report to the farmers of Cauvery DeltaRegion.
The NCRC Team
PREFACE
The NGO Coordination and Resource Centre (NCRC) Nagapattinam entrusted
me with the task of mapping the coastal water bodies including ground water
in Nagapattinam district. Though it was a challenging task to cover the full
length of 145 km of the east coast, I agreed since I have been involved in studying
the various problems encountered in the coastal area, especially the water logging
and drainage problems which affect agricultural production and thereby
livelihood of the population. I organized an international seminar on Land
drainage in deltaic regions in 1984 at Kattuthottam, near Thanjavur and many
experts in this field from England, Philippines and top scientists from India
attended the seminar and shared their experiences.
The study relates not only mapping the coastal water bodies but also how to use
the flood/rain water for agriculture and drinking water supply; and recharging
the ground water. This will help solving the twin problems of flooding and
betterment of the poor people living in areas that are regularly affected during
the north east monsoon.
The data required for mapping were collected by the five NGOs deputing two
persons by each NGO and with the help of the staff working in the Agricultural
sector of NCRC. The data relate to the number of channels, the ayacut, length,
width, depth of both irrigation and drainage channels, encroachments, siltation,
bund damages, flooding, weed in the water bodies / bund damages and the
damages to the various structures. They were gathered by walking and studying
the entire study area with the help of WRO/PWD, Agricultural Engineering,
Agriculture and Groundwater officials. Similarly the data for the other bodies
like ponds, lakes, tanks, farm ponds, alams, wells, details of crops grown, yield
obtained and the problem etc, were collected with the cooperation with VAO/
SHG/WUA and other public in the study area. Further, in order to store the
floods/rain water, the existing structures and the proposed structures were
identified and details were gathered. I also traveled the study area to get first
hand information and discussed with farmers, officials of various Departments,
NGOs etc. After analyzing the data, the report was prepared in a short period.
I specially thank Ms Annie George, CEO and Mr. Chandramohan, Agricultural
sector head, NCRC for their confidence in entrusting this job to me. I thank Mr.
Ramesh Pandian and Mr. Perumal who have helped to collect the data and other
details in the field including preparing the figure and tables with the support of
5 NGOs namely: 1) Covenant Centre for Development, Poompuhar 2) Centre
for Environmental Education, Karaikal 3) Tamil Nadu Organic Farmers Trust,
Nagapattinam 4) Kudumbam, Trichy & 5) Venture Trust, Pudukottai.
I also thank Mr. Raghunathan and Mr. Balakrishnan of CMS, Bangalore for their
computer work and their suggestions.
My special thanks are due to Mr. Nalluswamy CE WRO/PWD- Trichy, Mr.
Ganesan SE WRO/PWD - Thanjavur, Mr. Murthy and Mr. Kannan EEs WRO/
PWD for their support. I thank Mr. N. Varadaraj R.D., CGWB, Chennai for his
suggestions made to recharge the ground water in this salt water terrain and his
staff. I am very thankful to Mr. Bhaskaran AE/WRO/PWD, Thiruvarur and Mr.
Rajendran AE/Thanjavur who have helped me whenever I needed any
assistance. I am thankful to Mr. Senthil, EE. Agricultural Engineering
Department, JDA - Agricultural department, TWAD Board staff, especially Dr.
Natesan, Senior Hydro geologist, Chennai, fisheries department etc. I thank
Mr. Ranganathan, General Secretary- TamilNadu Cauvery Delta Farmers Welfare
Association, Mannargudi for sharing his vast experience and many other farmers
and NGOs for their suggestions. My thanks are to my daughters Mrs. Kavitha
and Mrs. Uma for untiring efforts in typing and retyping work for the study
report.
Finally I thank the donors who have provided funds for taking up the study.
(R.K. SIVANAPPAN)
EXECUTIVE SUMMARY
Nagapattinam is one of the coastal districts in Tamil Nadu and is a part of the
Cauvery river basin and delta. The Cauvery delta begins from the Grand Anicut
near Tiruchirapalli, constructed more than 1800 years ago by King
Karikalacholan. The main direction of the flow of the River Cauvery is east
and the delta spreads northwards and southwards from Grand Anicut. The
distributaries originating from the Cauvery finally discharge their waters into
the Bay of Bengal.
Being at the tail end of the Cauvery delta, Nagapattinam is at the mercy of the
water flow from the Mettur dam. Located on the Bay of Bengal coast, it is also
frequently hit by cyclones that bring in large quantities of rain in short spells.
Alternate periods of water scarcity and flooding have resulted in frequent crop
losses and a steady decline of cropping area under paddy, the main crop of
this region. The 2004 tsunami was, therefore, only another disaster to contend
with for the farmers of Nagapattinam.
While working on the rehabilitation of farmers affected by the tsunami, it
became apparent that the malaise went much deeper. NCRC, supported by
Concern Worldwide, commissioned a study to understand the different
vulnerabilities faced by the farmers, belonging mostly to the marginal farmers
group, of Nagapattinam. This study highlighted, inter-alia other findings, the
high degree of sensitivity of the area to flooding or drought- like conditions
and to the poor status of the irrigation and drainage mechanisms prevailing in
the area. Successful post- tsunami interventions, by some NGOs, in correcting
such identified flaws in small pockets, only validated this finding.
Based on this understanding, NCRC, again strongly supported by Concern
Worldwide, followed up with another study with the following objectives:
1. Collectively address the issues of identifying, prioritizing and planning the courseof action to improve the irrigation and drainage infrastructure, including the canalsand all water bodies, that have been neglected leading to frequent flooding andsalination.
2. Influence the Government / NGOs and farmers to maintain these life support systemsof agriculture as the quickest means of disaster proofing of agriculture in the district.
The study area was spread in all the taluks of the district except Mayiladuthurai
and worked out to about 92,851 ha out of the total geographical area of 2,71,583
ha of the district, covering 148 revenue villages including 779 hamlets. The
irrigated area studied (31,500 ha) is 28% of the total irrigated area of the district.
Five NGOs were involved in the study, each covering one taluk.
A Co-ordinator from NCRC facilitated the entire process. Dr. R.K. Sivanappan,
erstwhile member of the State Planning Commission and former Dean of the
Agriculture Engineering College, Coimbatore, who is also an Expert in Water
Resources Development was the Team Leader for the Study. Apart from NGOs,
the study was a collaborative effort with the involvement of personnel fromPWD, AED, Ground Water Department (both Central & State), TWAD Boardand other line departments. The farming community was involved throughoutthe study at various stages.
Irrigation channels and drainage channels at various levels, standing waterbodies such as ponds, tanks, ooranis and alams and different kinds ofgroundwater sources such as wells and bore wells were mapped. There are1141 irrigation channels running up to 1324 km with an ayacut of 25509 Hawhile there are 180 drainage channels with a total length of 346 km. 1075 villageponds, 652 farm ponds, 6437 wells, 4 irrigation tanks and 6 alams were alsofound in the study area apart from the Vedaranyam Canal and the BuckinghamCanal.
Siltation, damages to bunds and other structures like shutters and notches,deliberate encroachment for cultivation, aquafarming, habitation andweed infestation were the common adverse conditions found across mostof the water bodies; more so in the drainage channels than the irrigationcanals.
· The Study estimates a total amount of Rs. 125 Cr. for desilting, weeding, repairsand maintenance and construction of some additional structures in the totalarea of the 14 TERs studied. This is designed to not only restore the efficiencyof the irrigation and drainage channels and other water bodies but also improvetheir potential for additional storage of fresh water.
Irrigation Channels:Damages: 526 of the 1141 irrigation channels showed siltation to theextent of 6.7 lakh m3. 147 of channels had bund damages requiring 1.67lakh m3 of earth work. 35 ha of channel area showed high levels of weedinfestation. 147 sluices require various levels of repairs and 107 shuttersneed to be repaired/ replaced.
Estimate for repair/ maintenance/ new construction: The total cost ofrepairs, maintenance and additional construction in the irrigationchannels is estimated at Rs.264.88 lakhs. Desilting of the irrigationchannels is estimated at Rs. 122 lakhs, repairs of the damaged bunds atRs. 28.34 lakhs, weed removal at Rs. 13.86 lakhs, repairs of shutters/sluices and other structures at Rs. 86.35 lakhs and construction ofadditional structures at Rs. 13.69 lakhs.
Drainage Channels:Damages: 138 of the 181 channels show siltation to the extent of 34. 3lakh cubic mtrs. 6.36 lakh cubic mtrs. of earth work is required to repairthe bund damages seen in 99 of the channels. 27.6 ha of the drainagechannel area are seen to be heavily weed infested.
Estimate for repair/ maintenance/ new construction: The total cost ofrepairs, maintenance and additional construction in the drainage
channels is estimated at Rs.887.08 lakhs. Desilting of the drainage
channels is estimated at Rs. 751.91 lakhs, repairs of the damaged bunds
at Rs. 114.36 lakhs, weed removal at Rs. 11 lakhs, and repairs of other
structures at Rs. 9.8 lakhs
Positioning of the TERs at long distances from the confluence of the river and
the sea, coupled with the low slope gradient has resulted in high levels of
salination of the water as well as farm lands leading to conversion of cultivable
land to either fallow land or shrimp farms. This Study has highlighted the need
for additional regulators closer to the sea for effective blocking of ingress of sea-
water during high tides and to increase the potential of fresh water storage.
Construction of additional regulators is estimated to cost Rs. 1956 lakhs.
The total estimate also includes Rs. 1500 lakhs for restoration of the Vedaranyam
Canal, construction of additional ponds at Rs. 3972 lakhs and a detailed study
of Buckingham Canal.
This intervention is estimated to restore and improve the production and
productivity of 30000 ha of cultivable land. For this intervention to be sustainable,
the Study also recommends a “Participatory Irrigation Management “approach
with the farming user community taking the responsibility of the continued
operation and maintenance of these water bodies.
NGO Co-ordination and Resource Centre (NCRC), Nagapattinam 1
Chapter One
Introduction
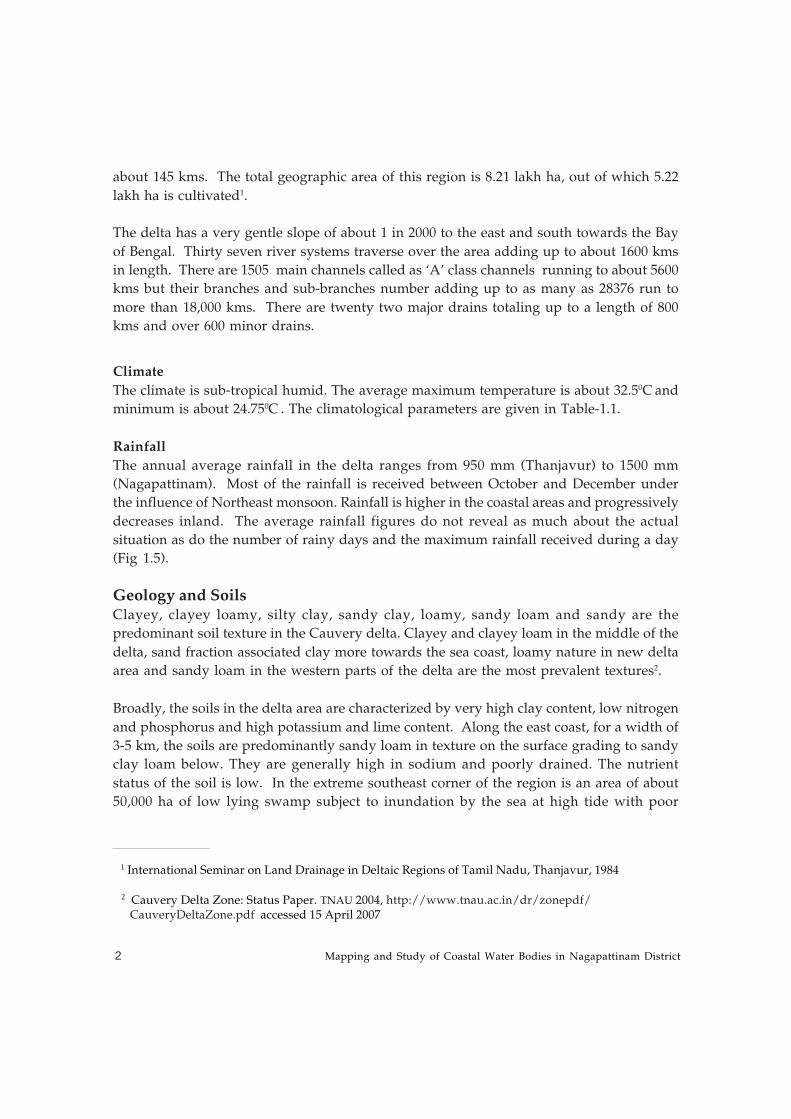
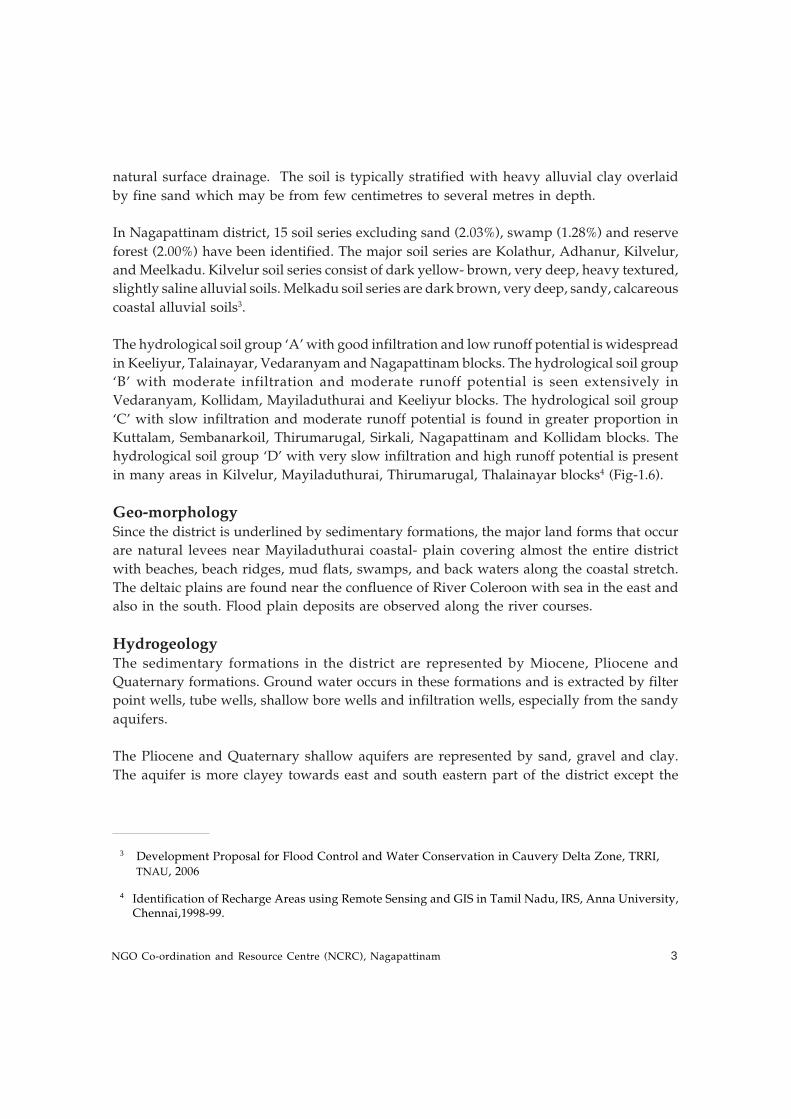
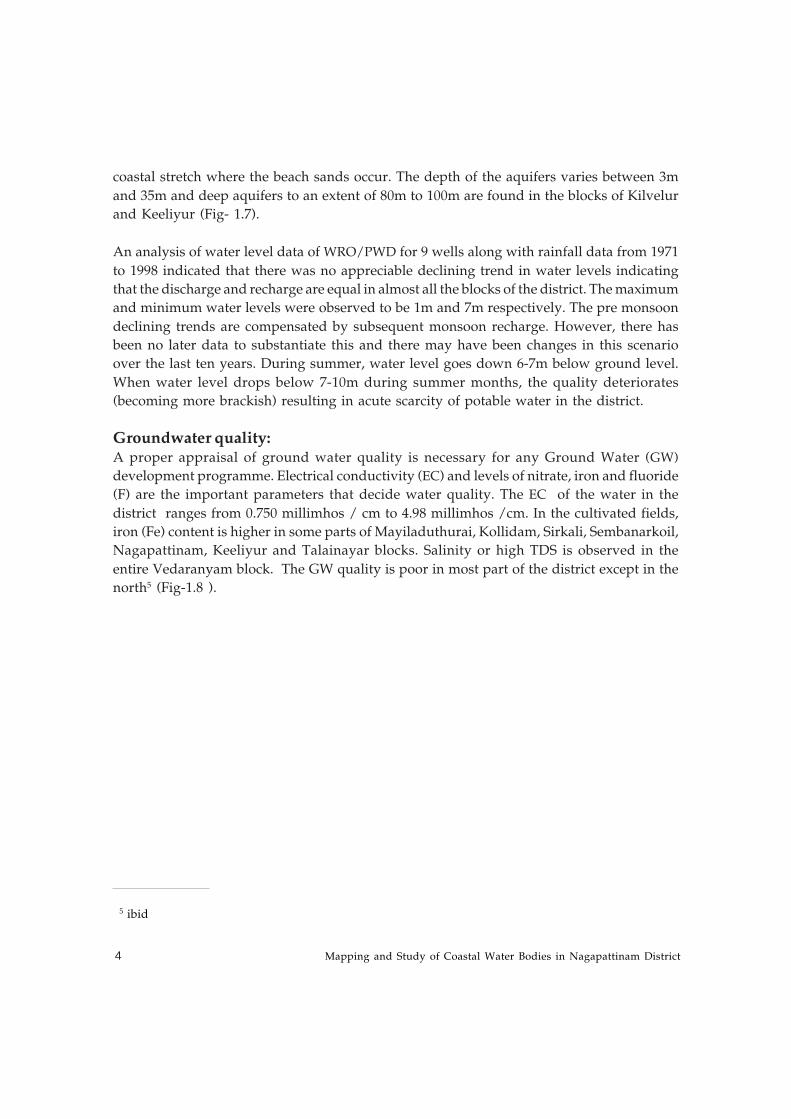
Nagapattinam is one of the coastal districts in Tamil Nadu. It was carved out of the
Thanjavur district in 1997. Located between 100 15’ to 110 30’N and 790 30’ to 790 55’ E,
it stretches from River Coleroon in the north to Kodikarai in the south.(Fig 1.1).
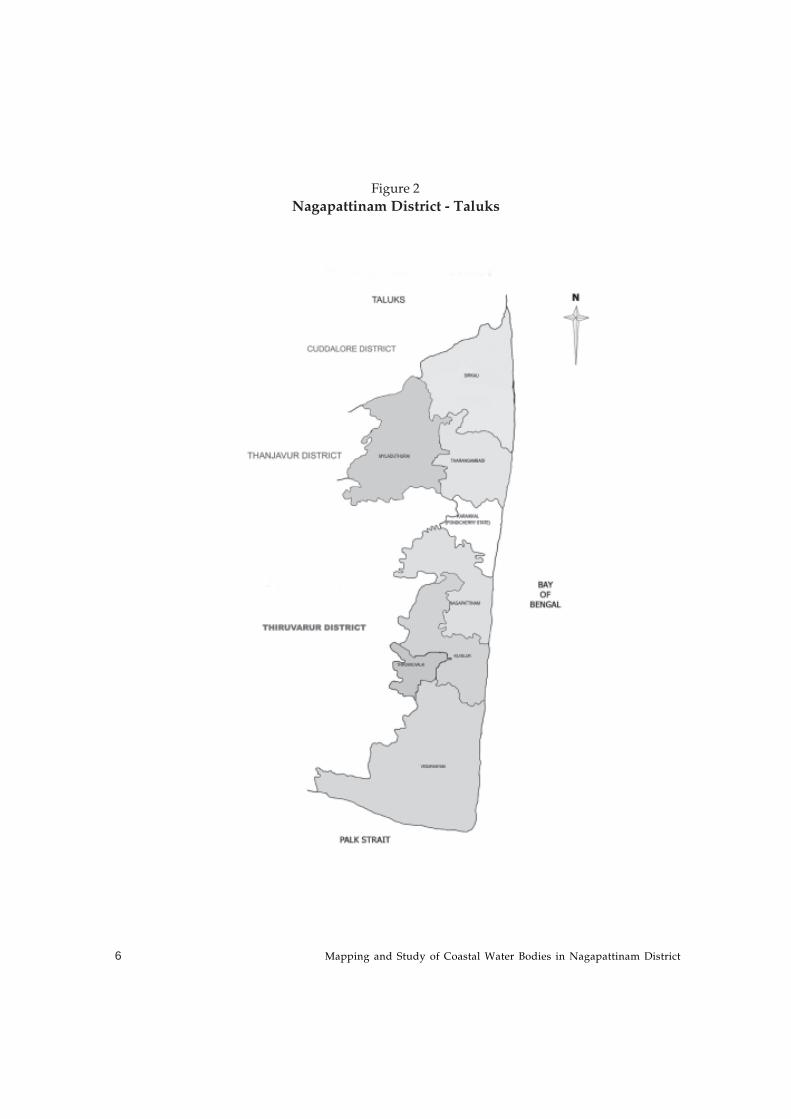
The district forms part of the Cauvery river basin and delta. For administrative purposes,
the district is divided into seven taluks namely Sirkali, Mayiladuthurai, Tharangambadi,
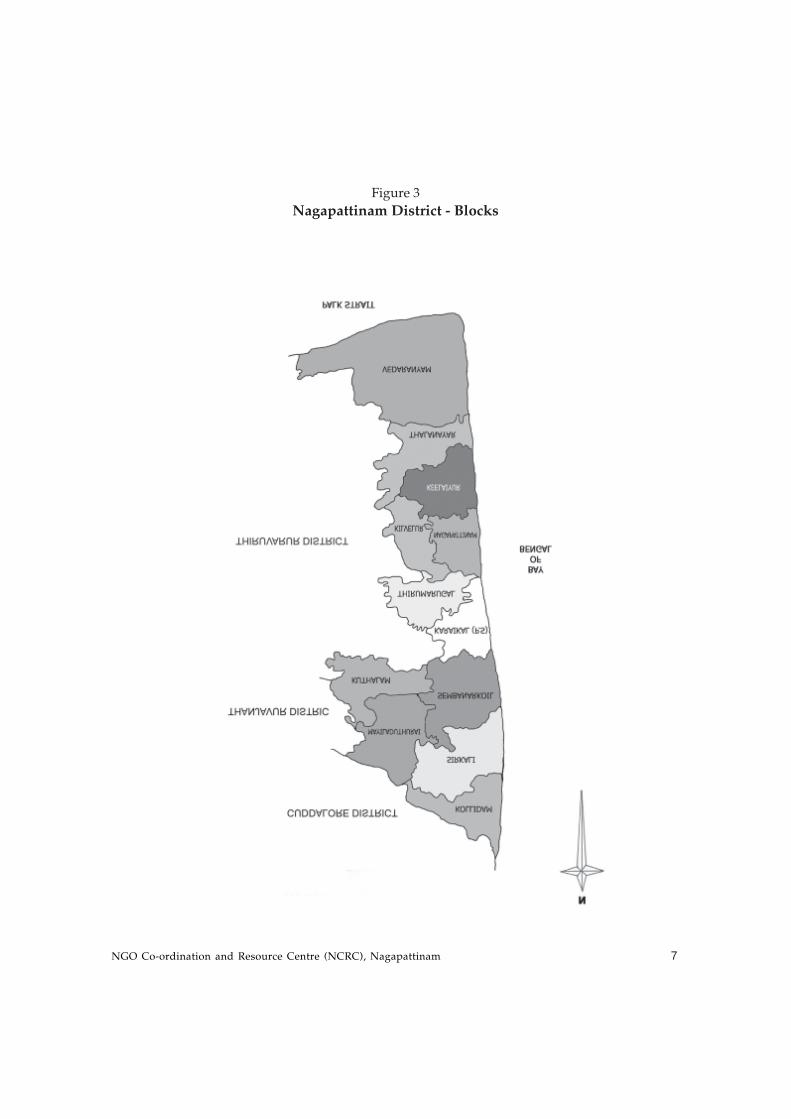
Nagapattinam, Kilvelur, Thirukkuvalai and Vedaranyam (Fig-1.2). These are further divided
into 11 blocks namely Mayiladuthurai, Kuttalam, Sembanarkoil, Sirkali, Kollidam,
Vedaranyam, Thalainayar, Nagapattinam, Keeliyur, Kilvelur and Thirumarugal (Fig-1.3).
The district has a coastline stretching to 190 km.
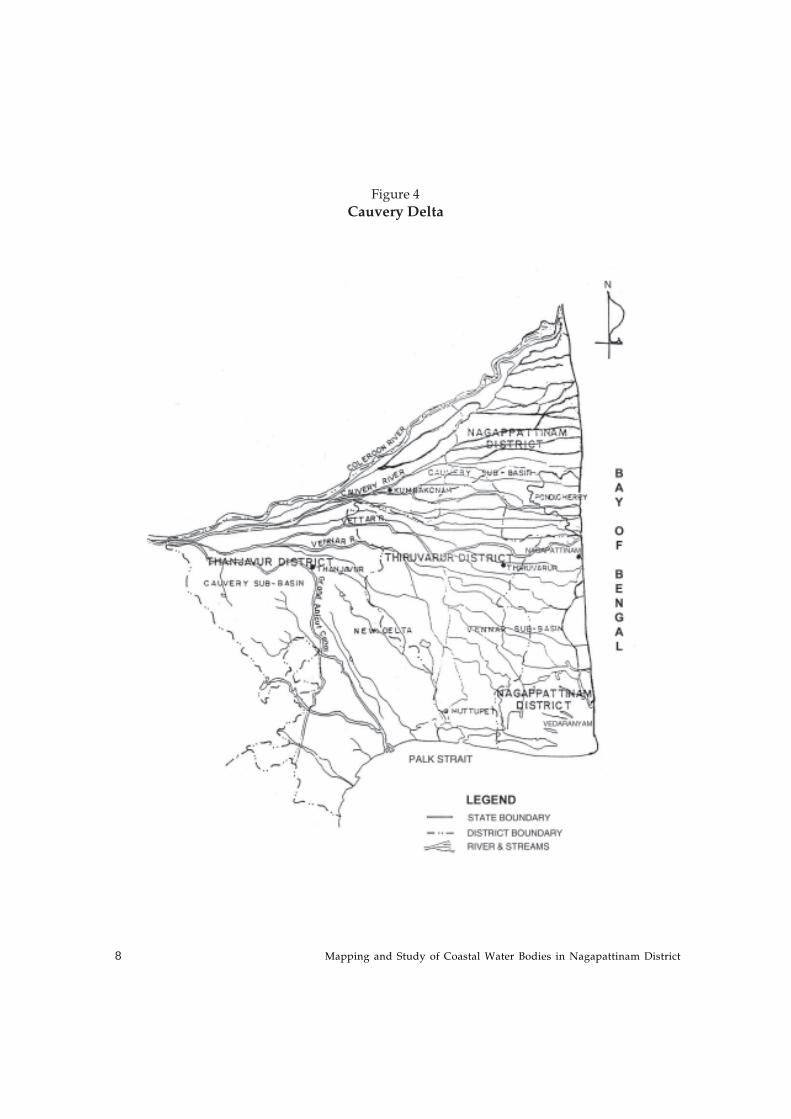
Physical description of the deltaThe Cauvery delta begins from the Grand Anicut near Tiruchirapalli. It was constructed
more than 1800 years ago by King Karikalcholan (Fig-1.4). The gross area irrigated by the
rivers and canals commencing from this point is nearly 5.60 lakh ha spread over the erstwhile
Thanjavur district (currently split into Thanjavur, Tiruvarur and Nagapattinam Districts)
and a portion of Pudukottai district. Most of the area in Pudukottai district has been brought
under irrigation only after the construction in 1934 of the Mettur dam/Grand Anicut canal
(hence known as the new delta).
The main direction of the flow of the River Cauvery is east and the delta spreads northwards
and southwards from Grand Anicut. The distributaries originating from the Cauvery finally
discharge their waters into the Bay of Bengal. The distance from the Grand Anicut to the
Bay of Bengal is about 110 kms and the north-south spread of the delta along the coast is
Mapping and Study of Coastal Water Bodies in Nagapattinam District2
about 145 kms. The total geographic area of this region is 8.21 lakh ha, out of which 5.22
lakh ha is cultivated1.
The delta has a very gentle slope of about 1 in 2000 to the east and south towards the Bay
of Bengal. Thirty seven river systems traverse over the area adding up to about 1600 kms
in length. There are 1505 main channels called as ‘A’ class channels running to about 5600
kms but their branches and sub-branches number adding up to as many as 28376 run to
more than 18,000 kms. There are twenty two major drains totaling up to a length of 800
kms and over 600 minor drains.
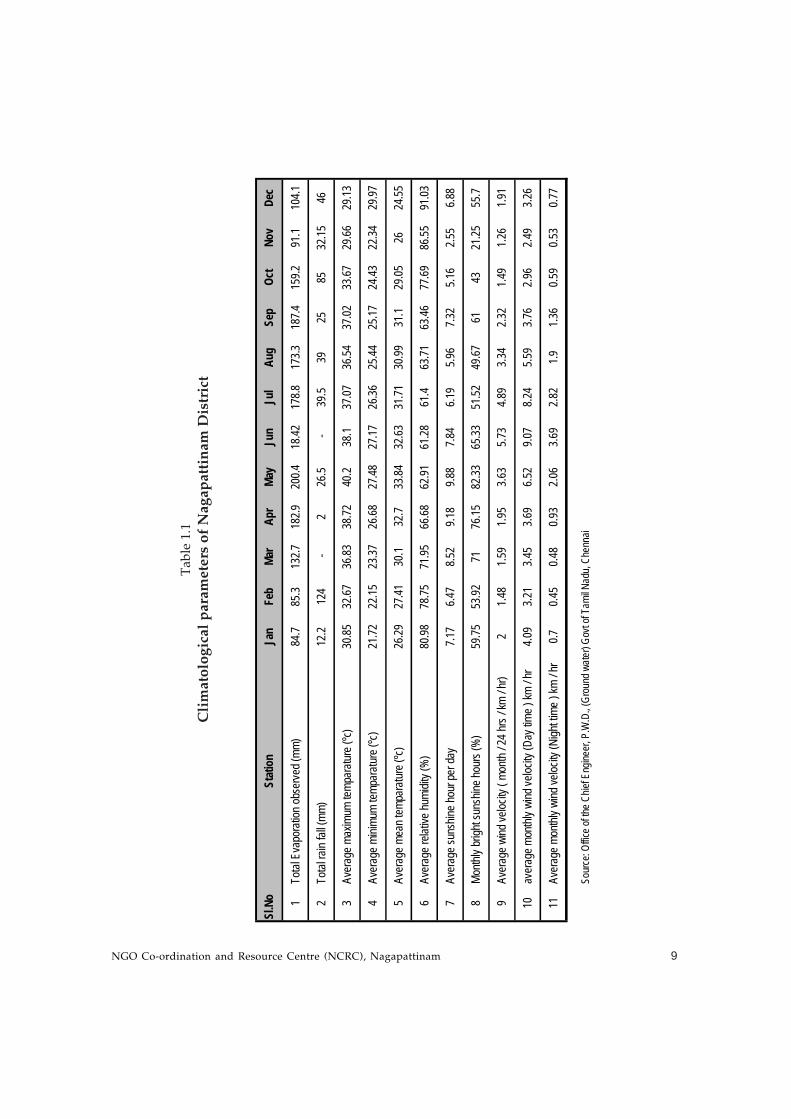
Climate
The climate is sub-tropical humid. The average maximum temperature is about 32.50C and
minimum is about 24.750C . The climatological parameters are given in Table-1.1.
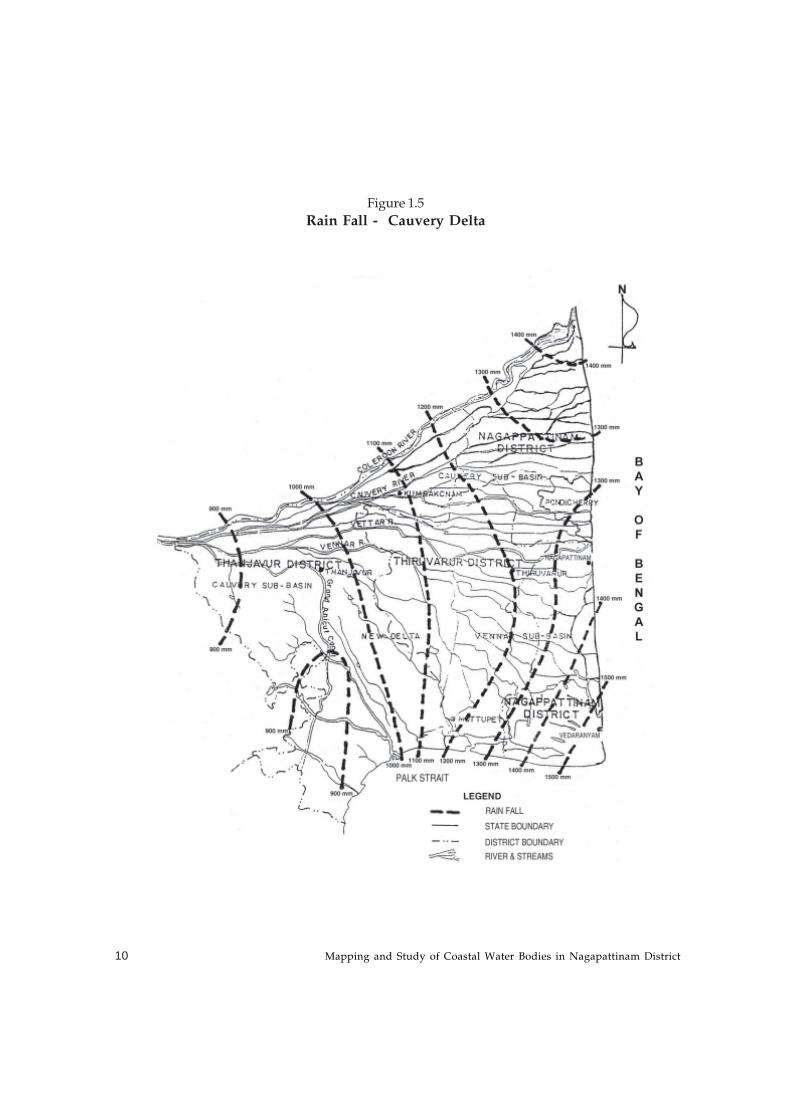
Rainfall
The annual average rainfall in the delta ranges from 950 mm (Thanjavur) to 1500 mm
(Nagapattinam). Most of the rainfall is received between October and December under
the influence of Northeast monsoon. Rainfall is higher in the coastal areas and progressively
decreases inland. The average rainfall figures do not reveal as much about the actual
situation as do the number of rainy days and the maximum rainfall received during a day
(Fig 1.5).
Geology and SoilsClayey, clayey loamy, silty clay, sandy clay, loamy, sandy loam and sandy are the
predominant soil texture in the Cauvery delta. Clayey and clayey loam in the middle of the
delta, sand fraction associated clay more towards the sea coast, loamy nature in new delta
area and sandy loam in the western parts of the delta are the most prevalent textures2.
Broadly, the soils in the delta area are characterized by very high clay content, low nitrogen
and phosphorus and high potassium and lime content. Along the east coast, for a width of
3-5 km, the soils are predominantly sandy loam in texture on the surface grading to sandy
clay loam below. They are generally high in sodium and poorly drained. The nutrient
status of the soil is low. In the extreme southeast corner of the region is an area of about
50,000 ha of low lying swamp subject to inundation by the sea at high tide with poor
1 International Seminar on Land Drainage in Deltaic Regions of Tamil Nadu, Thanjavur, 1984
2 Cauvery Delta Zone: Status Paper. TNAU 2004, http://www.tnau.ac.in/dr/zonepdf/ CauveryDeltaZone.pdf accessed 15 April 2007
NGO Co-ordination and Resource Centre (NCRC), Nagapattinam 3
natural surface drainage. The soil is typically stratified with heavy alluvial clay overlaid
by fine sand which may be from few centimetres to several metres in depth.
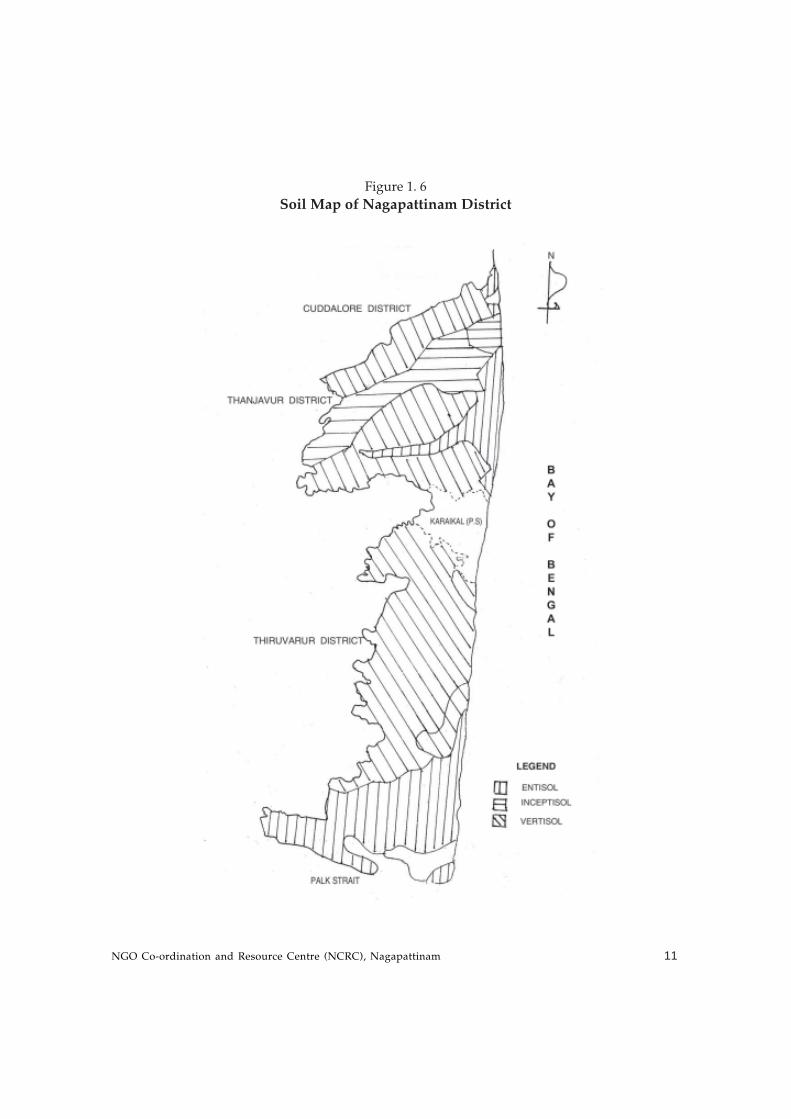
In Nagapattinam district, 15 soil series excluding sand (2.03%), swamp (1.28%) and reserve
forest (2.00%) have been identified. The major soil series are Kolathur, Adhanur, Kilvelur,
and Meelkadu. Kilvelur soil series consist of dark yellow- brown, very deep, heavy textured,
slightly saline alluvial soils. Melkadu soil series are dark brown, very deep, sandy, calcareous
coastal alluvial soils3.
The hydrological soil group ‘A’ with good infiltration and low runoff potential is widespread
in Keeliyur, Talainayar, Vedaranyam and Nagapattinam blocks. The hydrological soil group
‘B’ with moderate infiltration and moderate runoff potential is seen extensively in
Vedaranyam, Kollidam, Mayiladuthurai and Keeliyur blocks. The hydrological soil group
‘C’ with slow infiltration and moderate runoff potential is found in greater proportion in
Kuttalam, Sembanarkoil, Thirumarugal, Sirkali, Nagapattinam and Kollidam blocks. The
hydrological soil group ‘D’ with very slow infiltration and high runoff potential is present
in many areas in Kilvelur, Mayiladuthurai, Thirumarugal, Thalainayar blocks4 (Fig-1.6).
Geo-morphologySince the district is underlined by sedimentary formations, the major land forms that occur
are natural levees near Mayiladuthurai coastal- plain covering almost the entire district
with beaches, beach ridges, mud flats, swamps, and back waters along the coastal stretch.
The deltaic plains are found near the confluence of River Coleroon with sea in the east and
also in the south. Flood plain deposits are observed along the river courses.
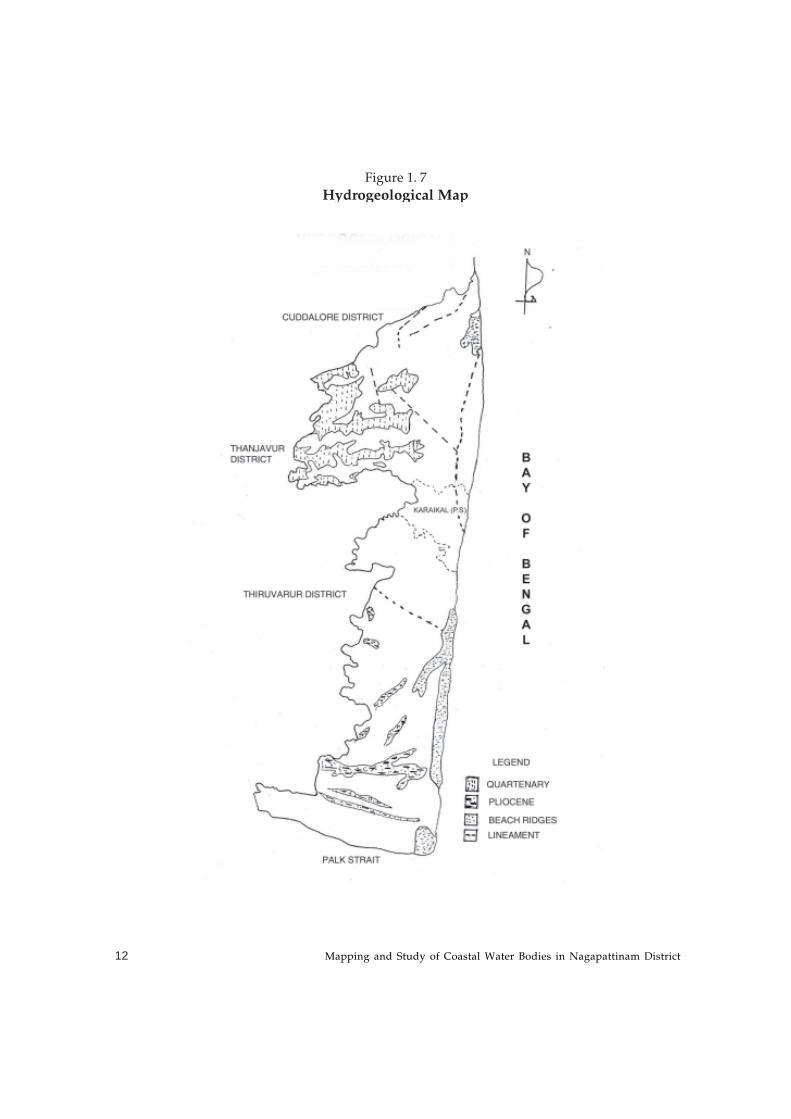
HydrogeologyThe sedimentary formations in the district are represented by Miocene, Pliocene and
Quaternary formations. Ground water occurs in these formations and is extracted by filter
point wells, tube wells, shallow bore wells and infiltration wells, especially from the sandy
aquifers.
The Pliocene and Quaternary shallow aquifers are represented by sand, gravel and clay.
The aquifer is more clayey towards east and south eastern part of the district except the
3 Development Proposal for Flood Control and Water Conservation in Cauvery Delta Zone, TRRI,
TNAU, 2006
4 Identification of Recharge Areas using Remote Sensing and GIS in Tamil Nadu, IRS, Anna University, Chennai,1998-99.
Mapping and Study of Coastal Water Bodies in Nagapattinam District4
coastal stretch where the beach sands occur. The depth of the aquifers varies between 3m
and 35m and deep aquifers to an extent of 80m to 100m are found in the blocks of Kilvelur
and Keeliyur (Fig- 1.7).
An analysis of water level data of WRO/PWD for 9 wells along with rainfall data from 1971
to 1998 indicated that there was no appreciable declining trend in water levels indicating
that the discharge and recharge are equal in almost all the blocks of the district. The maximum
and minimum water levels were observed to be 1m and 7m respectively. The pre monsoon
declining trends are compensated by subsequent monsoon recharge. However, there has
been no later data to substantiate this and there may have been changes in this scenario
over the last ten years. During summer, water level goes down 6-7m below ground level.
When water level drops below 7-10m during summer months, the quality deteriorates
(becoming more brackish) resulting in acute scarcity of potable water in the district.
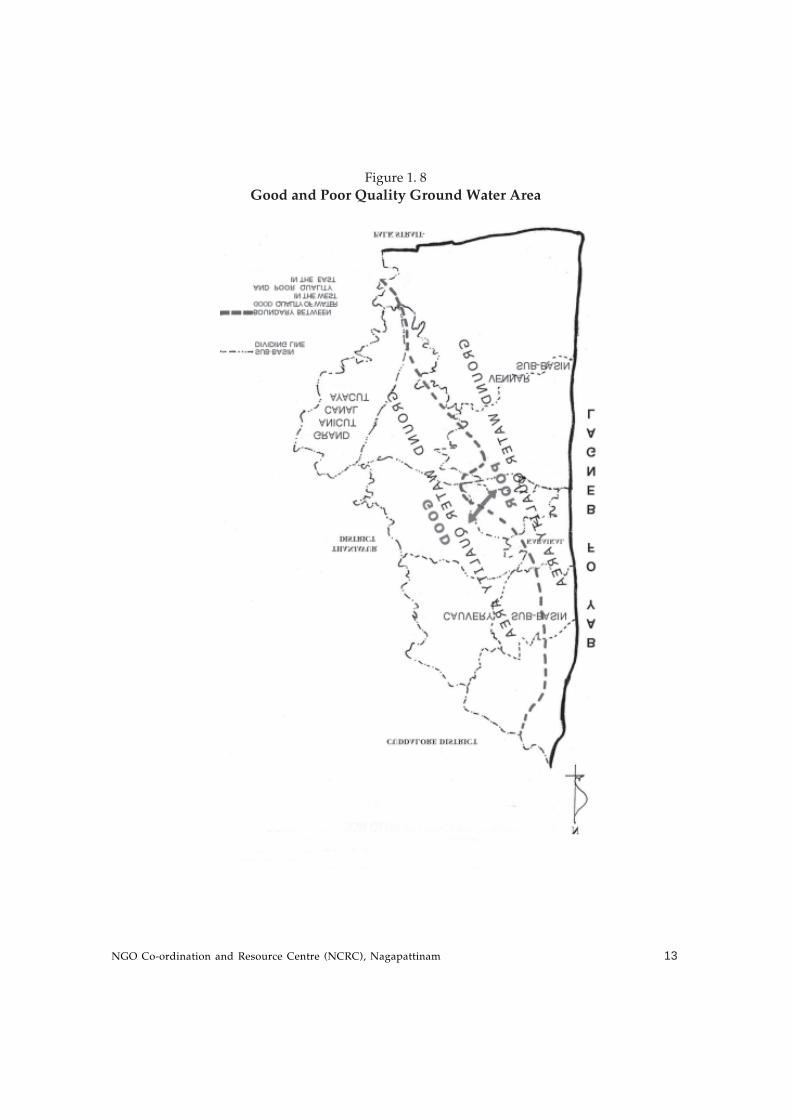
Groundwater quality:A proper appraisal of ground water quality is necessary for any Ground Water (GW)
development programme. Electrical conductivity (EC) and levels of nitrate, iron and fluoride
(F) are the important parameters that decide water quality. The EC of the water in the
district ranges from 0.750 millimhos / cm to 4.98 millimhos /cm. In the cultivated fields,
iron (Fe) content is higher in some parts of Mayiladuthurai, Kollidam, Sirkali, Sembanarkoil,
Nagapattinam, Keeliyur and Talainayar blocks. Salinity or high TDS is observed in the
entire Vedaranyam block. The GW quality is poor in most part of the district except in the
north5 (Fig-1.8 ).
5 ibid
NGO Co-ordination and Resource Centre (NCRC), Nagapattinam 5
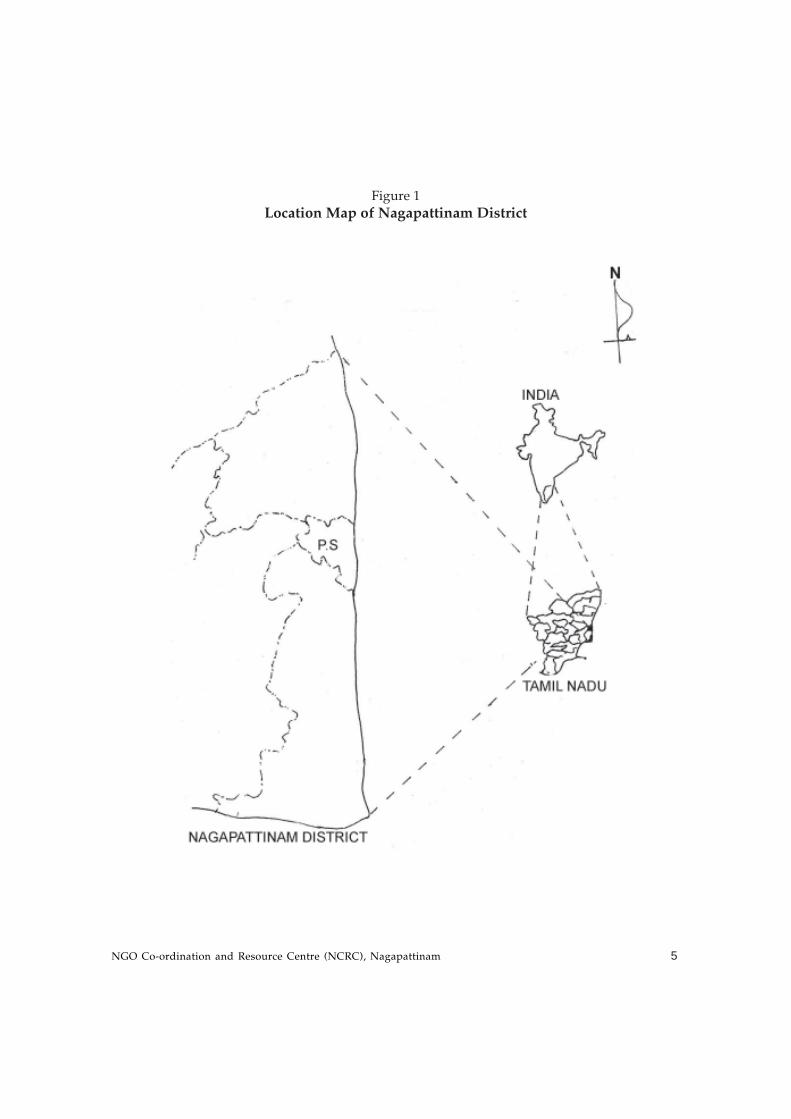
Figure 1
Location Map of Nagapattinam District
Mapping and Study of Coastal Water Bodies in Nagapattinam District6
Figure 2
Nagapattinam District - Taluks
NGO Co-ordination and Resource Centre (NCRC), Nagapattinam 7
Figure 3
Nagapattinam District - Blocks
Mapping and Study of Coastal Water Bodies in Nagapattinam District8
Figure 4
Cauvery Delta
NGO Co-ordination and Resource Centre (NCRC), Nagapattinam 9
Tab
le 1
.1
Cli
mat
olo
gic
al p
aram
eter
s o
f N
agap
atti
nam
Dis
tric
t
Sl.N
oSt
atio
nJa
nFe
bMa
rAp
rMa
yJu
nJu
lAu
gSe
pOc
tNo
vDe
c
1To
tal E
vapo
ratio
n obs
erve
d (mm
)84
.785
.313
2.718
2.920
0.418
.4217
8.817
3.318
7.415
9.291
.110
4.1
2To
tal ra
in fal
l (mm)
12.2
124
-2
26.5
-39
.539
2585
32.15
46
3Av
erag
e max
imum
temp
aratu
re (º
c)
30.85
32.67
36.83
38.72
40.2
38.1
37.07
36.54
37.02
33.67
29.66
29.13
4Av
erag
e mini
mum
tempa
ratur
e (ºc
)21
.7222
.1523
.3726
.6827
.4827
.1726
.3625
.4425
.1724
.4322
.3429
.97
5Av
erag
e mea
n tem
para
ture (
ºc)
26.29
27.41
30.1
32.7
33.84
32.63
31.71
30.99
31.1
29.05
2624
.55
6Av
erag
e rela
tive h
umidi
ty (%
)80
.9878
.7571
.9566
.6862
.9161
.2861
.463
.7163
.4677
.6986
.5591
.03
7Av
erag
e sun
shine
hour
per d
ay7.1
76.4
78.5
29.1
89.8
87.8
46.1
95.9
67.3
25.1
62.5
56.8
8
8Mo
nthly
brigh
t sun
shine
hour
s (%
)59
.7553
.9271
76.15
82.33
65.33
51.52
49.67
6143
21.25
55.7
9Av
erag
e wind
veloc
ity (
month
/ 24 h
rs / k
m / h
r)2
1.48
1.59
1.95
3.63
5.73
4.89
3.34
2.32
1.49
1.26
1.91
10av
erag
e mon
thly w
ind ve
locity
(Day
time )
km / h
r4.0
93.2
13.4
53.6
96.5
29.0
78.2
45.5
93.7
62.9
62.4
93.2
6
11Av
erag
e mon
thly w
ind ve
locity
(Nigh
t time
) km
/ hr
0.70.4
50.4
80.9
32.0
63.6
92.8
21.9
1.36
0.59
0.53
0.77
Sour
ce: O
ffice o
f the C
hief E
ngine
er, P
.W.D
., (Gr
ound
wate
r) Go
vt of
Tami
l Nad
u, Ch
enna
i
Mapping and Study of Coastal Water Bodies in Nagapattinam District10
Figure 1.5
Rain Fall - Cauvery Delta
NGO Co-ordination and Resource Centre (NCRC), Nagapattinam 11
Figure 1. 6
Soil Map of Nagapattinam District
Mapping and Study of Coastal Water Bodies in Nagapattinam District12
Figure 1. 7
Hydrogeological Map
NGO Co-ordination and Resource Centre (NCRC), Nagapattinam 13
Figure 1. 8
Good and Poor Quality Ground Water Area

Mapping and Study of Coastal Water Bodies in Nagapattinam District14
NGO Co-ordination and Resource Centre (NCRC), Nagapattinam 15
Chapter Two
Agriculture in Nagapattinam
Table 2.1
Important crops grown with area of cultivation and yield
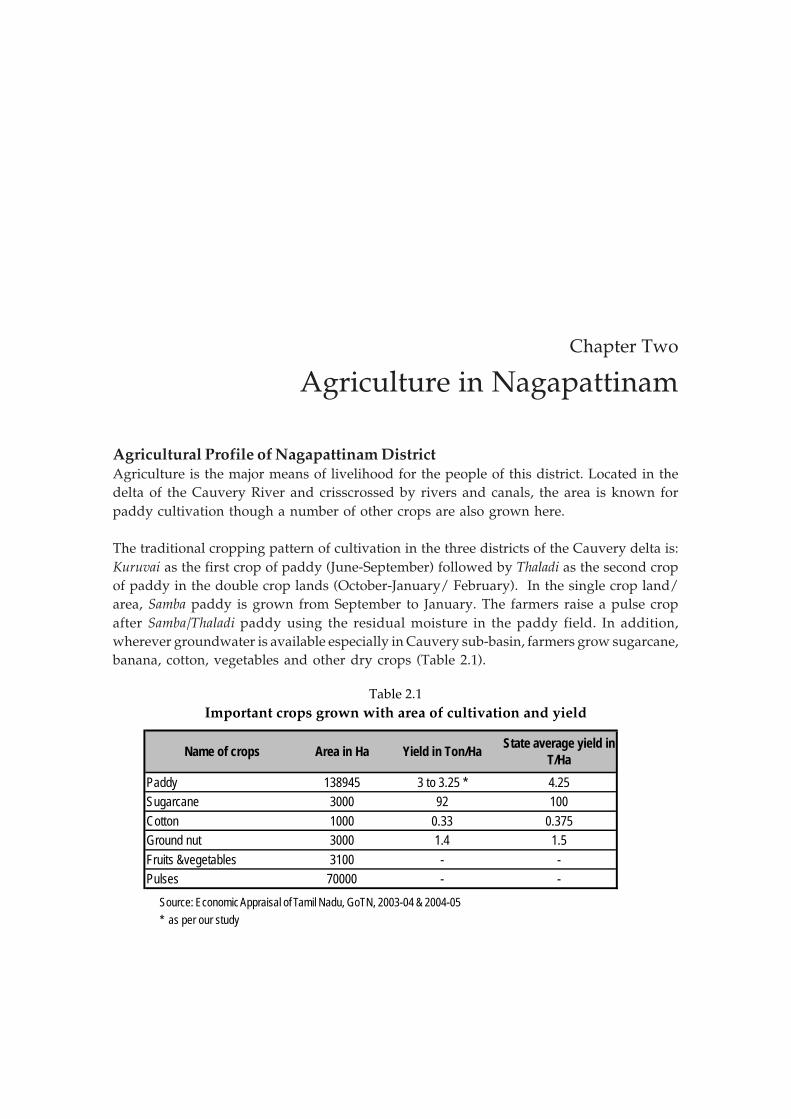
Agricultural Profile of Nagapattinam DistrictAgriculture is the major means of livelihood for the people of this district. Located in the
delta of the Cauvery River and crisscrossed by rivers and canals, the area is known for
paddy cultivation though a number of other crops are also grown here.
The traditional cropping pattern of cultivation in the three districts of the Cauvery delta is:
Kuruvai as the first crop of paddy (June-September) followed by Thaladi as the second crop
of paddy in the double crop lands (October-January/ February). In the single crop land/
area, Samba paddy is grown from September to January. The farmers raise a pulse crop
after Samba/Thaladi paddy using the residual moisture in the paddy field. In addition,
wherever groundwater is available especially in Cauvery sub-basin, farmers grow sugarcane,
banana, cotton, vegetables and other dry crops (Table 2.1).
Source: Economic Appraisal of Tamil Nadu, GoTN, 2003-04 & 2004-05* as per our study
Name of crops Area in Ha Yield in Ton/Ha State average yield in T/Ha
Paddy 138945 3 to 3.25 * 4.25Sugarcane 3000 92 100Cotton 1000 0.33 0.375Ground nut 3000 1.4 1.5Fruits &vegetables 3100 - -Pulses 70000 - -
Mapping and Study of Coastal Water Bodies in Nagapattinam District16
6 Source: Economic Appraisal of Tamil Nadu, Government of Tamil Nadu, 2003-04 an 2004-05
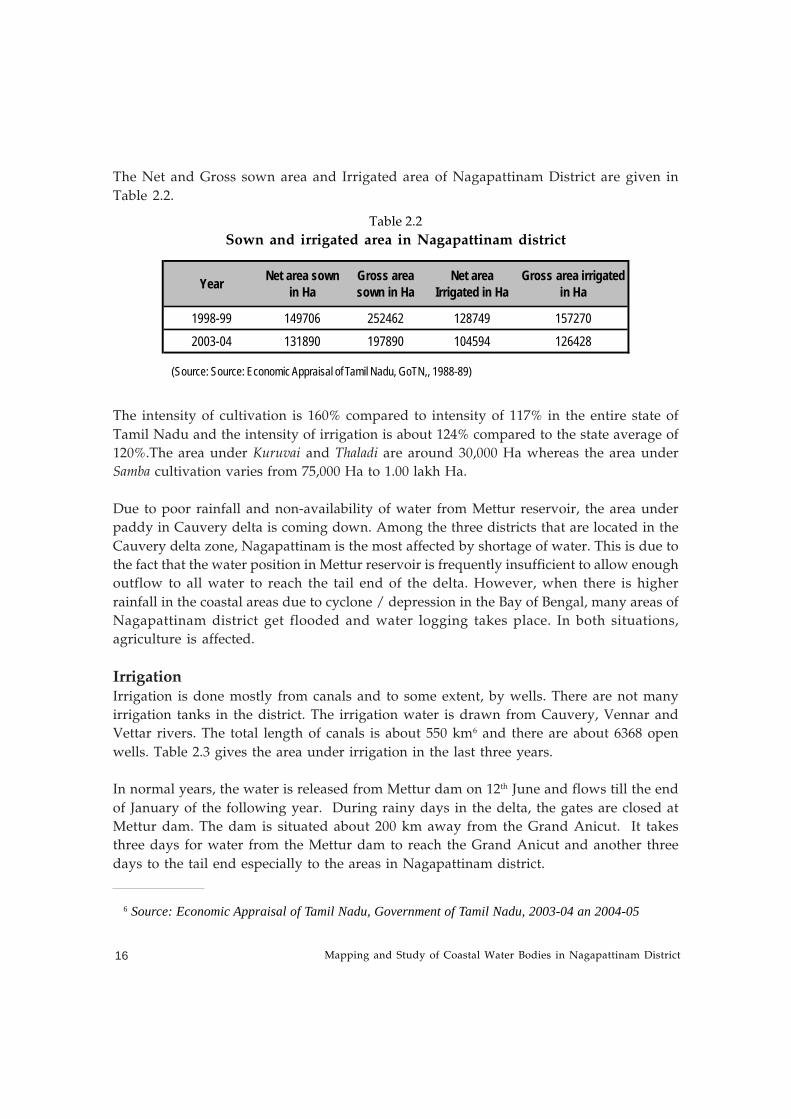
Table 2.2
Sown and irrigated area in Nagapattinam district
The Net and Gross sown area and Irrigated area of Nagapattinam District are given in
Table 2.2.
(Source: Source: Economic Appraisal of Tamil Nadu, GoTN,, 1988-89)
The intensity of cultivation is 160% compared to intensity of 117% in the entire state of
Tamil Nadu and the intensity of irrigation is about 124% compared to the state average of
120%.The area under Kuruvai and Thaladi are around 30,000 Ha whereas the area under
Samba cultivation varies from 75,000 Ha to 1.00 lakh Ha.
Due to poor rainfall and non-availability of water from Mettur reservoir, the area under
paddy in Cauvery delta is coming down. Among the three districts that are located in the
Cauvery delta zone, Nagapattinam is the most affected by shortage of water. This is due to
the fact that the water position in Mettur reservoir is frequently insufficient to allow enough
outflow to all water to reach the tail end of the delta. However, when there is higher
rainfall in the coastal areas due to cyclone / depression in the Bay of Bengal, many areas of
Nagapattinam district get flooded and water logging takes place. In both situations,
agriculture is affected.
IrrigationIrrigation is done mostly from canals and to some extent, by wells. There are not many
irrigation tanks in the district. The irrigation water is drawn from Cauvery, Vennar and
Vettar rivers. The total length of canals is about 550 km6 and there are about 6368 open
wells. Table 2.3 gives the area under irrigation in the last three years.
In normal years, the water is released from Mettur dam on 12th June and flows till the end
of January of the following year. During rainy days in the delta, the gates are closed at
Mettur dam. The dam is situated about 200 km away from the Grand Anicut. It takes
three days for water from the Mettur dam to reach the Grand Anicut and another three
days to the tail end especially to the areas in Nagapattinam district.
Year Net area sown in Ha
Gross area sown in Ha
Net area Irrigated in Ha
Gross area irrigated in Ha
1998-99 149706 252462 128749 157270
2003-04 131890 197890 104594 126428
NGO Co-ordination and Resource Centre (NCRC), Nagapattinam 17
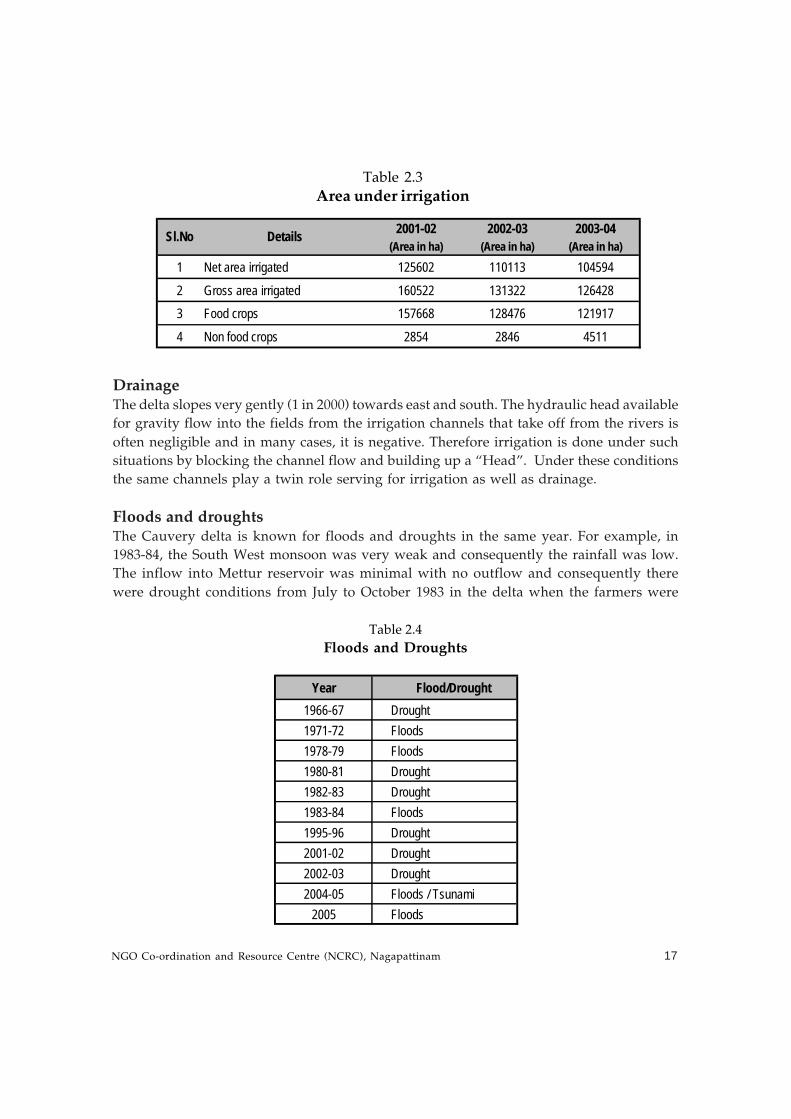
Table 2.3
Area under irrigation
DrainageThe delta slopes very gently (1 in 2000) towards east and south. The hydraulic head available
for gravity flow into the fields from the irrigation channels that take off from the rivers is
often negligible and in many cases, it is negative. Therefore irrigation is done under such
situations by blocking the channel flow and building up a “Head”. Under these conditions
the same channels play a twin role serving for irrigation as well as drainage.
Floods and droughtsThe Cauvery delta is known for floods and droughts in the same year. For example, in
1983-84, the South West monsoon was very weak and consequently the rainfall was low.
The inflow into Mettur reservoir was minimal with no outflow and consequently there
were drought conditions from July to October 1983 in the delta when the farmers were
Table 2.4
Floods and Droughts
2001-02 2002-03 2003-04(Area in ha) (Area in ha) (Area in ha)
1 Net area irrigated 125602 110113 104594
2 Gross area irrigated 160522 131322 1264283 Food crops 157668 128476 121917
4 Non food crops 2854 2846 4511
Sl.No Details
Year Flood/Drought1966-67 Drought1971-72 Floods1978-79 Floods1980-81 Drought1982-83 Drought1983-84 Floods1995-96 Drought2001-02 Drought2002-03 Drought2004-05 Floods / Tsunami
2005 Floods
Mapping and Study of Coastal Water Bodies in Nagapattinam District18
unable to raise any crop. With the onset of North East monsoon in October-November
1983, paddy was planted. In December 1983-January 1984 there was heavy rain in the delta
leading to unprecedented floods in low lying areas especially in Nagapattinam district.
Many villages were marooned for weeks. Table 2.4 gives an idea of the frequency of floods
and droughts in the district.
Thrusts in Agricultural DevelopmentMore than 80% of the water available is used for agriculture in Tamil Nadu. Hence it is
essential that the available water be used efficiently, and economically. The main thrusts in
Agricultural Development are as follows.
1. Increase the availability of surface and ground water
2. Increase the water use efficiency in canal, tank irrigation and in wellirrigation.
3. Increase the yield per unit of water, land and time.
4. Introduce advanced method of irrigation in paddy cultivation (SRImethod) and drip and sprinkler methods in well irrigation.
5. Bridge the yield gap in various crops grown in the district.
6. Change crop and cropping pattern based on the availability of water -introduce more areas under horticulture crops like growing fruit treesand vegetables in areas irrigated by groundwater.
7. Increase the fertility of soils and reduce the soil salinity.
8. It will also be worthwhile to start an attempt by pumping saline waterfrom nearby canals on both sides into the canals and recharging themthrough flood/rain water, which will result in reducing salinity in aquifers
in the long run.
NGO Co-ordination and Resource Centre (NCRC), Nagapattinam 19
Chapter Three
Brief on Vulnerability Study
6 “Tiding over Tsunami”, p16. Government of Tamil Nadu, December 2005
Impact of tsunami on water resources and agricultureThe tsunami of 26th December 2004 impacted the coast of Tamil Nadu, Kerala and Andhra
Pradesh on the Indian mainland, with the tsunami waters exerting their damaging effects
up to 2 km from the coastline. Nagapattinam district was the worst affected district in
Tamil Nadu. While the impact on the fishing community was most obvious, over 8460 Ha
of agricultural land was also affected by the tsunami, of which over 4650 Ha was in
Nagapattinam district according to official reports6. Apart from the waves that inundated
lands close to the shore, the inflow of water through the channels and backwaters in the
area resulted in the inundation of fields up to a distance of 7 km from the coast, causing
extensive damage.
The agricultural land and water bodies were affected in the following manner due to the
tsunami:
• Drying and scorching of the standing crop
• Spreading of debris to a distance of up to 1km
• Deposition of sand over the agriculture lands to depths varying from 3-15 inches
• Formation of sand mounds in some places
• Deposition of sea mud / saline soil up to 3 inches deep in some places
• Siltation of skimming wells with sea sand
• Contamination of water bodies with seawater
• Formation of gullies (channels developed due to erosion) in some areas
Mapping and Study of Coastal Water Bodies in Nagapattinam District20
Study on vulnerability of agricultural communities by NCRC
While working on the surveying to understand the impact of the tsunami on the agricultural
sector, it became apparent that the tsunami had only brought into the limelight the vulnerable
status of the agricultural community that had been reeling under the impact of alternate
floods and droughts of increasing frequency and impact in recent times. NCRC felt relevant
to understand these from communities’ point of view, and identify focus areas to prepare
communities to face future disasters. The first step in this direction was to undertake a
systematic study, as grass-root level data on these issues were not readily available for
planning. Subsequently, a sample study was conducted by NCRC in the district, to
understand vulnerabilities of agricultural communities to frequent disasters and also their
coping mechanisms. The outputs of the study were presented in the “National Workshop
on Disaster Preparedness in Agriculture” in August 2006. Some of the relevant aspects of
the study are described below.
A large number of coastal habitations are dependent on agriculture for their livelihoods;
with higher proportion of families in Southern Region. In most habitations, large proportion
of farmers have very small land holding, with large proportion of houses being thatched
or government colonies, reflecting the poor economic status of most families living in
these habitations.
The important immediate impact of the various disasters affecting agriculture has been
reduced or total loss of production from the particular season, and reduced productivity
of land due to salination (during floods) or lack of irrigation (during droughts). However,
the effects of disasters are much wider than just loss to physical or tangible assets (such as
land) and have been found to affect different profiles of communities in different ways.
The responses to these disasters from government and other agencies seem to be asset
based and reactive. There has been very little or no effort to mitigate these disasters or to
help communities to prepare themselves to face and manage future disasters.
Coping mechanismsThe coping mechanisms adopted by farmers have been on individual household’s ability to
access financial and other support. Most of the marginal farmers shift to construction
labour or even migrate due to loss of livelihood. They rarely get technical or financial
support to return back to normalcy. This trend has been continuing over a long time
thereby not allowing these communities to move out of a vicious poverty cycle. There are
no safety nets for these farmers and their families to fall back on. Even normal or good
yield gained from some years are wiped out in just one disaster.
The coping mechanisms adopted by the farmers were studied in two areas – with respect
to land and crop, and with respect to managing their household chores. More than a third
of marginal farmers quoted that they did not do anything to improve the situation during
NGO Co-ordination and Resource Centre (NCRC), Nagapattinam 21
flood situations. About half of these farmers tried to drain excess water. In terms of
running the family, 43% marginal go to informal sources for credit (with high interest
rates) and 28% take up labour work either within the village or migrate. The proportion of
small and medium/ large farmers taking up labour work is limited. A large proportion
(57%) of medium/ large farmers managed these with their own money (savings).
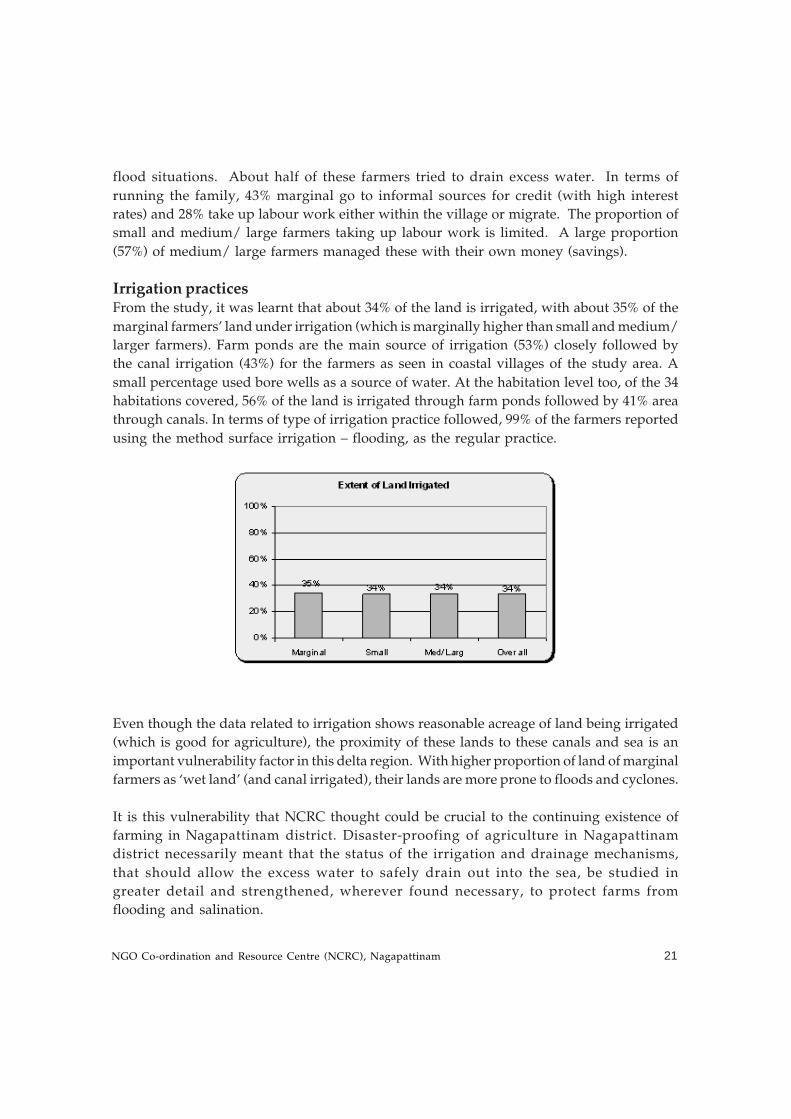
Irrigation practicesFrom the study, it was learnt that about 34% of the land is irrigated, with about 35% of the
marginal farmers’ land under irrigation (which is marginally higher than small and medium/
larger farmers). Farm ponds are the main source of irrigation (53%) closely followed by
the canal irrigation (43%) for the farmers as seen in coastal villages of the study area. A
small percentage used bore wells as a source of water. At the habitation level too, of the 34
habitations covered, 56% of the land is irrigated through farm ponds followed by 41% area
through canals. In terms of type of irrigation practice followed, 99% of the farmers reported
using the method surface irrigation – flooding, as the regular practice.
Even though the data related to irrigation shows reasonable acreage of land being irrigated
(which is good for agriculture), the proximity of these lands to these canals and sea is an
important vulnerability factor in this delta region. With higher proportion of land of marginal
farmers as ‘wet land’ (and canal irrigated), their lands are more prone to floods and cyclones.
It is this vulnerability that NCRC thought could be crucial to the continuing existence of
farming in Nagapattinam district. Disaster-proofing of agriculture in Nagapattinam
district necessarily meant that the status of the irrigation and drainage mechanisms,
that should allow the excess water to safely drain out into the sea, be studied in
greater detail and strengthened, wherever found necessary, to protect farms from
flooding and salination.

Mapping and Study of Coastal Water Bodies in Nagapattinam District22
NGO Co-ordination and Resource Centre (NCRC), Nagapattinam 23
Chapter Four
Need for the Study
Water management in agriculture is an increasingly important matter. Nagapattinam district,
though located in the Cauvery delta, is at the tail end of the delta, which means that if
there is not enough water in the Mettur dam, water does not reach the agricultural fields
situated in Nagapattinam district resulting in drought like conditions leading to crop failure.
Nagapattinam is also a coastal district and affected by tidal influx through the many
confluences of the Delta Rivers and canals. Large tracts of land get flooded with saline
water during tidal influxes and this has resulted in increased salination of the land as well
as waterbodies making them unfit for agricultural use especially those close to the coast. In
addition, the coastal areas are lashed by cyclones, which frequent the Bay of Bengal, bringing
in very heavy rainfall within very short periods of time. This causes extensive flooding.
The tsunami was only another disaster for the farmers of Nagapattinam district who were
reeling under the impact of alternate floods and droughts in the region. As part of trying
to understand the problems of the agricultural community in Nagapattinam district, studies
were carried out which indicate that more than 80% of the farmers are marginal and small
farmers and many of the problems faced by them could be traced to issues of drainage.
Post tsunami, some NGOs worked at the field level and put in a lot of effort to improve
drainage, at least locally. Their efforts paid off when later that year (2005), heavy rains led
to flooding and crop losses in large areas but in areas where the drainage issue had been
worked on, most of the crop could be saved.
While the drainage issue has been tackled in a few instances, it is generally localized and it
is only when a holistic picture is made available and comprehensive solutions found that
Mapping and Study of Coastal Water Bodies in Nagapattinam District24
there can be improvement in the status of agriculture. Hence NCRC commissioned a study
with the following objectives:
1. Collectively address the issues of identifying, prioritizing and planning the
course of action to improve the irrigation and drainage infrastructure
including the canals and all water bodies that have been neglected and
lead to frequent flooding and salination.
2. Influence the Government / NGOs and farmers to maintain these life
support systems of agriculture as the quickest means of disaster proofing
of agriculture in the district.
The expected outcome of the study includes the mapping of the entire infrastructure, which
are useful for agriculture in Nagapattinam district. This includes all the water bodies
like irrigation canals, drainage channels, tanks, ponds, ooranis, temple tanks, farm
ponds, percolation ponds, wells, check dams and other water storage structures in the
study area.
NGO Co-ordination and Resource Centre (NCRC), Nagapattinam 25
Chapter Five
Methodology
Choice of Study area:The tail end of Cauvery delta covers the entire Nagapattinam district from Sirkali taluk
(River Coleroon) in the north to Vedaranyam taluk (swampy area) in the south for a distance
of 145 Km. There are about 20 rivers/channels/drains in this stretch which flow into the
Bay of Bengal. Of these, six channels/drains are in the Karaikal region of Puducherry state
and fourteen are in Nagapatttinam district.
Tail End Regulators (TER) are provided at appropriate points towards the tail end of the
river, from which main irrigation channels (A class) are drawn on one or both sides. These
TERs are used to maintain the command level in the rivers to help the channels (A class or
main channels) taking off above the regulators. From the A class channels, sub mains,
distributaries, field booths (B,C,D class channels) are seen branching off and used for
irrigation. After the TER, the river channel acts only as a drain and joins the sea. The TERs
are situated about 5 to 20 km west of the coastline.
Being an impossible task to cover the entire Nagapattinam district in the short period
during which the study was to be done, consultations were held with the officials of the
WRO/PWD, Department of Agricultural Engineering, Agriculture, Horticulture and others
to identify a suitable area. WRO/PWD suggested that the points where the TER are located
in all the river channels could be taken as the boundary on the western side. The area
between the boundary of the TER points in the west and coastline in the east was taken as
the study area. This was considered reasonable and could be covered by the team in 3 to 4
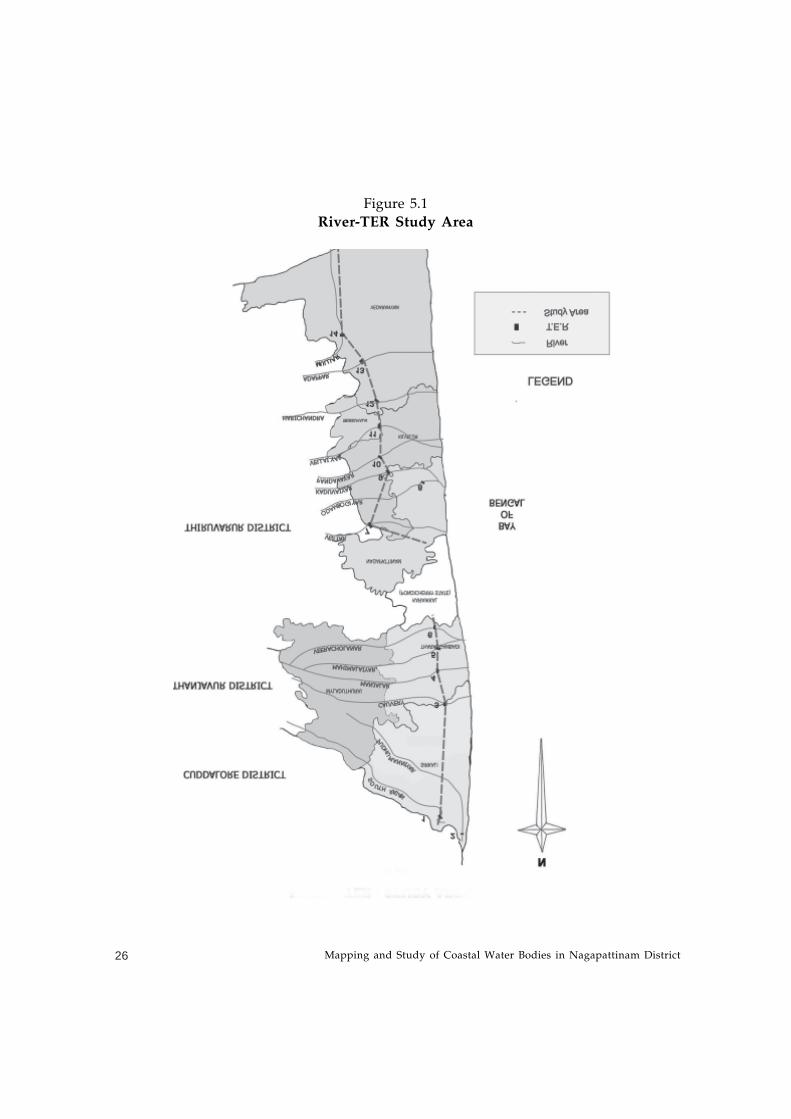
months. The area comes to about 33% of the total area of Nagapattinam district (Fig-5.1).
The study area thus selected was spread in all the taluks of the district except Mayiladuthurai
and worked out about 92,851ha out of the total geographical area of 2,71,583 ha of the
district. The irrigated area is about 31,500 ha (25,500 + 6,000) which is about 28% of the
Mapping and Study of Coastal Water Bodies in Nagapattinam District26
Figure 5.1
River-TER Study Area
NGO Co-ordination and Resource Centre (NCRC), Nagapattinam 27
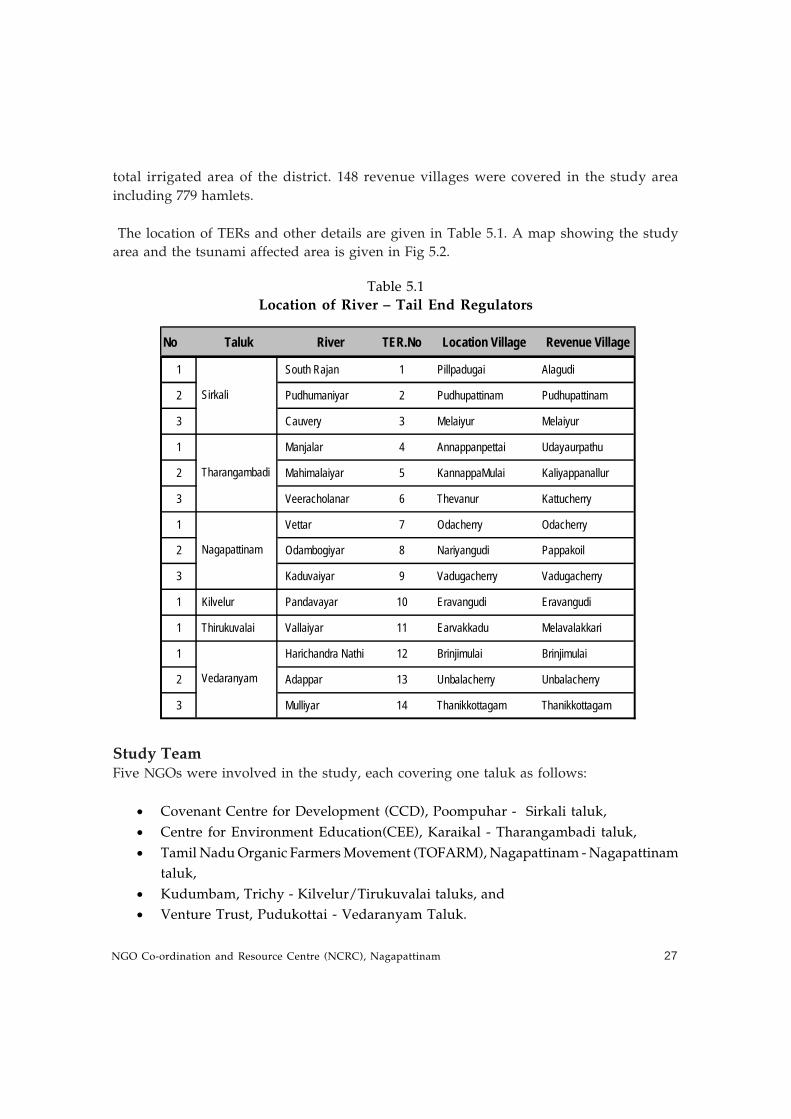
total irrigated area of the district. 148 revenue villages were covered in the study area
including 779 hamlets.
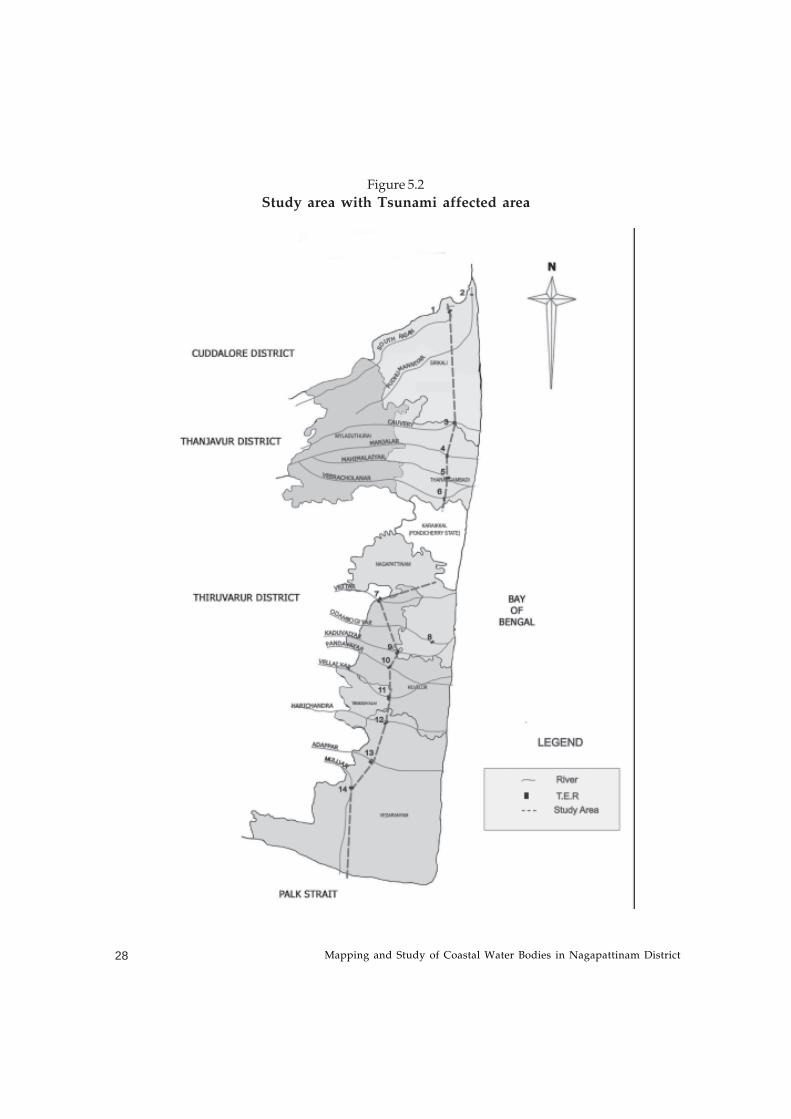
The location of TERs and other details are given in Table 5.1. A map showing the study
area and the tsunami affected area is given in Fig 5.2.
Table 5.1
Location of River – Tail End Regulators
Study TeamFive NGOs were involved in the study, each covering one taluk as follows:
• Covenant Centre for Development (CCD), Poompuhar - Sirkali taluk,
• Centre for Environment Education(CEE), Karaikal - Tharangambadi taluk,
• Tamil Nadu Organic Farmers Movement (TOFARM), Nagapattinam - Nagapattinam
taluk,
• Kudumbam, Trichy - Kilvelur/Tirukuvalai taluks, and
• Venture Trust, Pudukottai - Vedaranyam Taluk.
No Taluk River TER.No Location Village Revenue Village
1 South Rajan 1 Pillpadugai Alagudi
2 Pudhumaniyar 2 Pudhupattinam Pudhupattinam
3 Cauvery 3 Melaiyur Melaiyur
1 Manjalar 4 Annappanpettai Udayaurpathu
2 Mahimalaiyar 5 KannappaMulai Kaliyappanallur
3 Veeracholanar 6 Thevanur Kattucherry
1 Vettar 7 Odacherry Odacherry
2 Odambogiyar 8 Nariyangudi Pappakoil
3 Kaduvaiyar 9 Vadugacherry Vadugacherry
1 Kilvelur Pandavayar 10 Eravangudi Eravangudi
1 Thirukuvalai Vallaiyar 11 Earvakkadu Melavalakkari
1 Harichandra Nathi 12 Brinjimulai Brinjimulai
2 Adappar 13 Unbalacherry Unbalacherry
3 Mulliyar 14 Thanikkottagam Thanikkottagam
Sirkali
Tharangambadi
Nagapattinam
Vedaranyam
Mapping and Study of Coastal Water Bodies in Nagapattinam District28
Figure 5.2
Study area with Tsunami affected area
NGO Co-ordination and Resource Centre (NCRC), Nagapattinam 29
Two staff members from each NGO were involved in the study process on a full time basis
for a period of three months. A study co-ordinator from NCRC facilitated the entire process.
Dr. R.K. Sivanappan, Senior Consultant and Expert in Water Resources Development,
erstwhile State Planning Board member and former Dean of Agriculture Engineering College,
Coimbatore, was the Team Leader for the Study.
Stakeholders involvedApart from NGOs, the study was a collaborative effort with the involvement of personnel
from PWD, AED, Ground Water Department (both Central & State), TWAD Board and
other line departments. The farming community was involved throughout the study at
various stages. Catalyst Management Services (CMS), Bangalore did the data management.
Capacity Building of the study team:
1. Orientation programmeAfter conceptualizing the study, a “pilot study cum orientation programme” was organized
covering one full river system (TER) visiting all irrigation (A, B, C, D class) / drainage channels
(main/sub) and ‘other water bodies’ (village ponds, tanks, farm ponds, open/bore
wells etc.) with PWD officials. Sessions on information/data formats were organized
periodically.
2. Review & Planning
• Meetings were organized with the NGO field staff on a weekly basis during the
entire study period. These meetings helped in a large way to review, assess andplan; and to discuss problems/issues in the field.
• A few meetings were held with the NGOs along with the PWD personnel initiallyto plan the study and identify the study area, and later to collectively work onlocation of TERs, irrigation/drainage channels etc.
• Meetings from time to time were held with Sub-Divisional Officers (SDOs) andAssistant Engineers (AEs) of PWD in their respective offices as well as in NCRC
office in order to map out all the irrigation / drainage channels and other water
bodies.
SamplingAs each river system is unique and the off-take of channels from the main river varies from
one TER to another, it was felt necessary to study the entire network of irrigation / drainage
channels. The study, hence, covers all the channels including A, B, C, D class under irrigation
and the river, main, sub drainage channels under the given TER.
Mapping and Study of Coastal Water Bodies in Nagapattinam District30
Owing to the nature of ‘other water bodies’, it was felt necessary to study them only on a
revenue village- wise basis. The time constraint of the study coupled with huge number of
‘other water bodies’ permitted sampling only in 25% of the total revenue villages in the
study area on a random selection basis. The information thus collected is to be extrapolated
to the entire study area.
Primary and Secondary Information collection
The methodology of data collection in the field includes the following.
• Transect walk along the river system with key informants (farmers), taking
measurements and making observations.
• Focus Group Discussions with farmers / Self Help Groups / Water User Associationsin the villages.
• Discussions with representative farmers at district level.
• Discussions with personnel of PWD, AED, Department of Agriculture (DoA), CentralGroundwater Board and other line departments.
Apart from the above departments, secondary data was also collected from Revenue
department (Taluk office, Village Administrative Officer), Statistics department, Tamil Nadu
Rice Research Institute (TRRI) and other institutions. Secondary as well as supportive
information has been taken from annual reports of departments / institutions, workshop
reports and other papers.
Historical information on the Vedaranyam and Buckingham canals as well as on Alams,
irrigation tanks and sand ridges / sand dunes was collected.
Damage Assessment and status of water bodiesThe NGO representatives surveyed the area covered under the TER and collected the flow
chart for the TER from the concerned section officer in charge of the River Channel. The
flow chart contains the irrigation and drainage channels under the TER. With this map,
and with the help and guidance of the key informants (VAO/Farmer/WUA member/SHG
member) the field investigators walked along the A class channel (Fig-5.3) and all other
branch channels to study the existing conditions of the channels, problems in the channels
and what is to be done for increasing the flow, and methods of control and regulation for
efficient use of water.
The data and details collected with detailed measurements for all the channels under each
TER / channel wise are as follows:
NGO Co-ordination and Resource Centre (NCRC), Nagapattinam 31
• Number of irrigation channels
• Area irrigated (ayacut)
• Length, average width and average depth of channels
• Number of abandoned/used channels
• Number of channels encroached, total area encroached and type ofencroachment
• Details of vegetation/weeds obstructing flow
• No of channels silted and extent of siltation
• Damage to channel bund and volume of earth required for strengtheningthe bund to the original condition
• Sluices and other structures damaged and extent of damage
The time line with respect to status of water bodies was studied to know the trend over
years in terms of maintenance, regulation and other mechanisms. Information on the
community’s involvement in management of water bodies over the years was also collected.
Basic village and agricultural information (crops, trees, horticulture, animal husbandry-
related) were collected as primary information from villages. The issues in agriculture as
felt by farmers were also collected.
Data AnalysisPrimary data collected has also been triangulated with secondary data available, wherever
possible, to minimize discrepancies. The primary data (both quantitative & qualitative) in
prescribed formats were then analyzed using the services of CMS. Interpretations were
made based on data analysis.
Mapping and Study of Coastal Water Bodies in Nagapattinam District32

NGO Co-ordination and Resource Centre (NCRC), Nagapattinam 33
Chapter Six
Observations - Water Bodies
6a: Water bodiesTwo different kinds of water bodies can be distinguished - flowing water and standing
water. In the former are included rivers, their distributaries and the various canals and
channels that have been carved out of the rivers for irrigation/drainage. Standing water
bodies include both natural and artificial structures formed mainly by collection of water
in low lying areas. Some of these are fed by rivers/channels, others are transient structures
which are mainly rain-fed. There are also various kinds of wells that are used to harvest
groundwater. In this study focusing on the irrigation systems prevailing in the areas, as a
representative sample, one quarter of the villages in the study area were surveyed for
their water bodies.
Channels that are cut directly from the river for irrigation purposes are called ‘A’ class
channels. From these, sub channels are sourced and are classified as ‘B’, ‘C’ and ‘D’ class
channels. There are also channels that carry the excess irrigation water from the fields. In
some cases, irrigation channels may also serve as drainage channels. The river after the
TER serves only as a drain. The total length of irrigation channels in the study area is 1324
km compared to the 346 km of drainage channels. The total number of irrigation channels
is 1141 against 180 drainage channels.
The tail end regulators are used to maintain command level in the rivers to help the A class
channels taking off above this regulator. The TERs are constructed at appropriate locations
that permit water taken from the sluices (in the A class channel) to irrigate all the lands
below the TER up to the sea. There are 14 TERs in the study area. The TERs are constructed
about 3 to 20 km from the confluence of the river and sea depending on the terrain and
located suitably so as to irrigate all the command area up to the seashore. TER No 7 in the
Mapping and Study of Coastal Water Bodies in Nagapattinam District34
Table 6.1Irrigation Channels in the study area
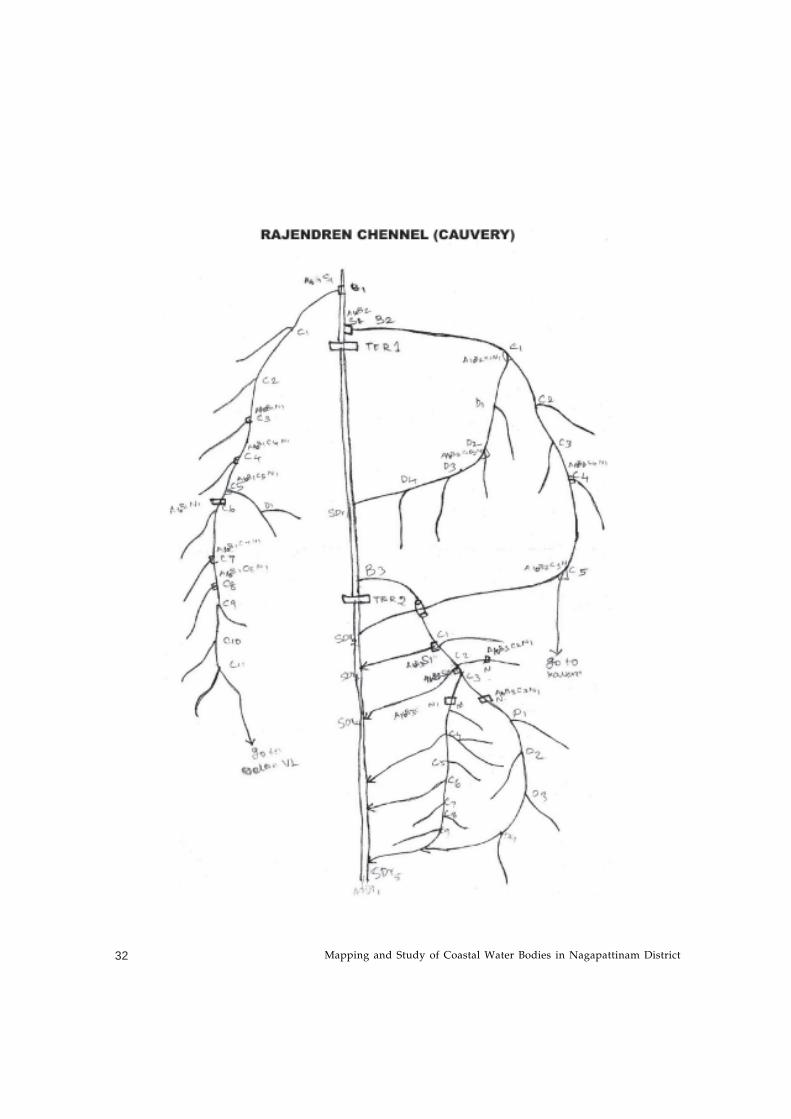
River Vettar is at the furthest distance from the confluence. TER 2 on the river Pudumanniar
River is located closest to the sea at about 200 m from the point where the river joins
the sea.
The TERs serve not only to divert water for irrigation and collect excess water from the
fields but also help prevent seawater ingress.
Table 5.1 (Chapter 5) gives a list of the 14 TER and the villages in which they are located.
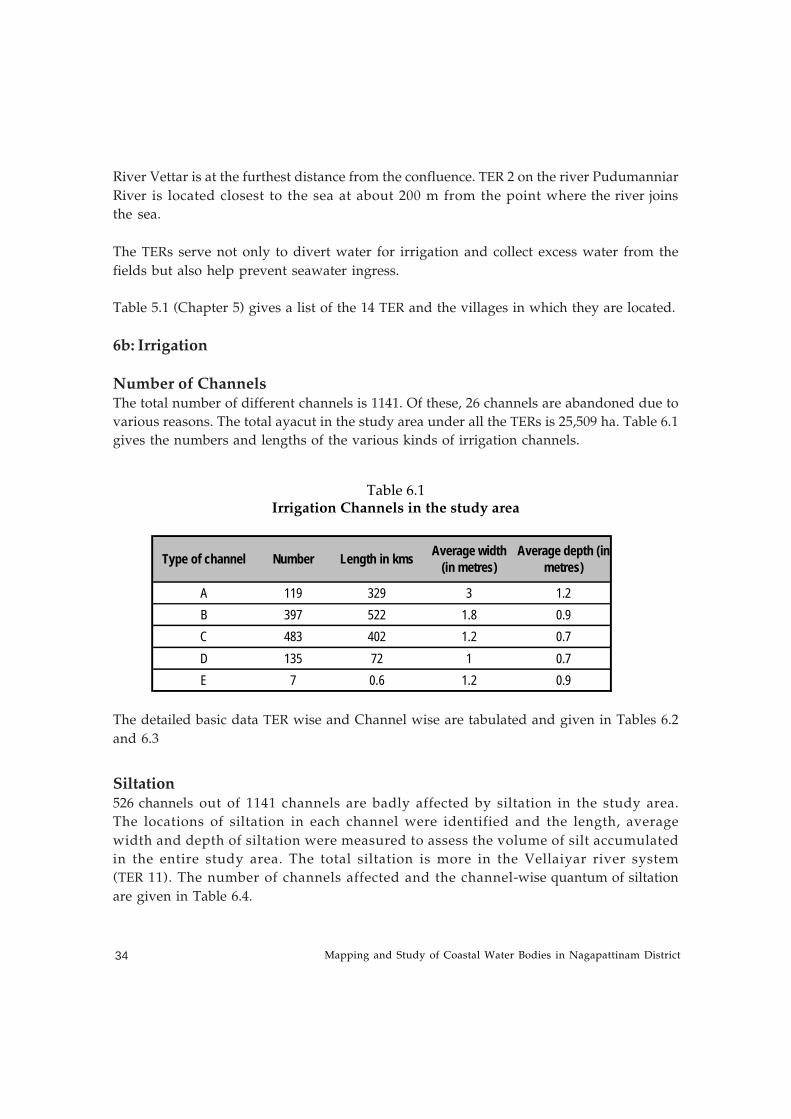
6b: Irrigation
Number of ChannelsThe total number of different channels is 1141. Of these, 26 channels are abandoned due to
various reasons. The total ayacut in the study area under all the TERs is 25,509 ha. Table 6.1
gives the numbers and lengths of the various kinds of irrigation channels.
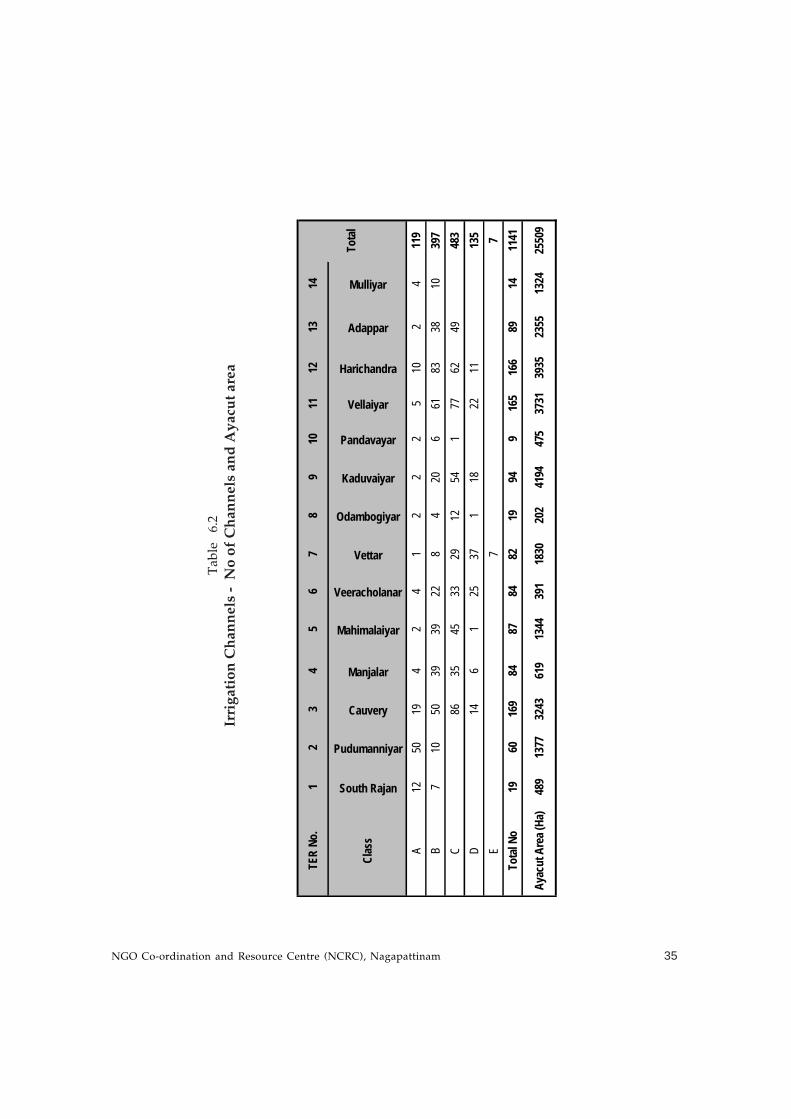
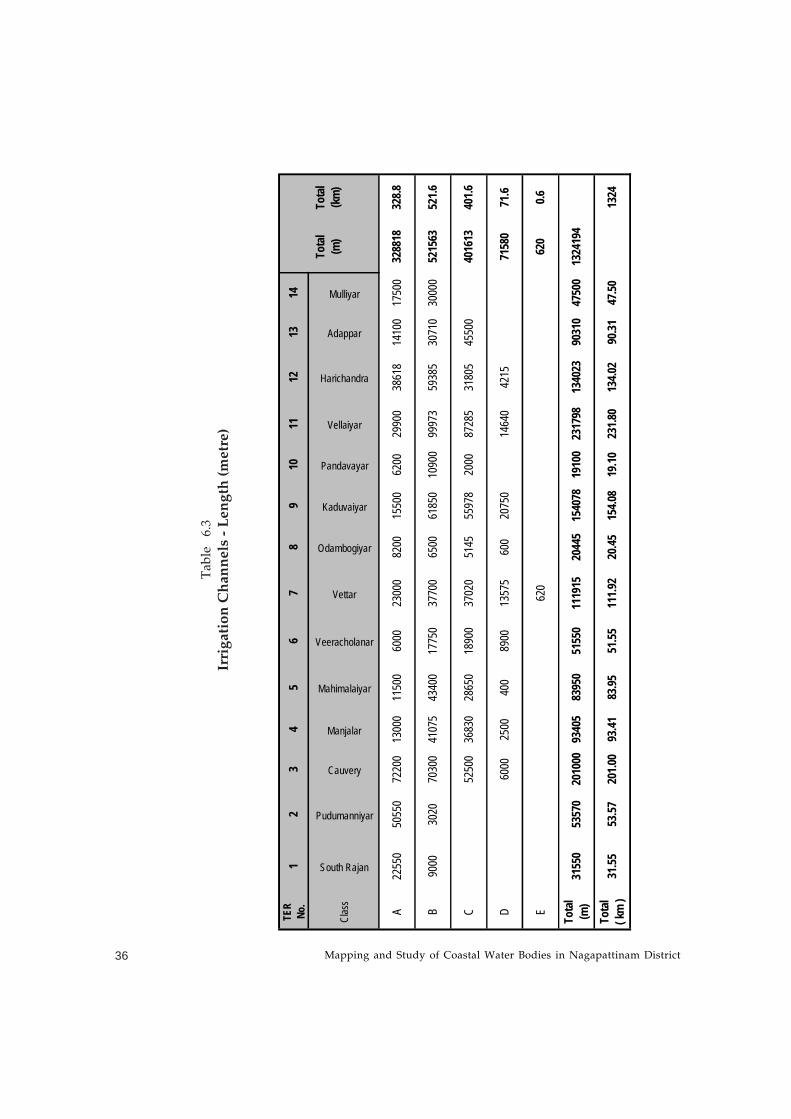
The detailed basic data TER wise and Channel wise are tabulated and given in Tables 6.2
and 6.3
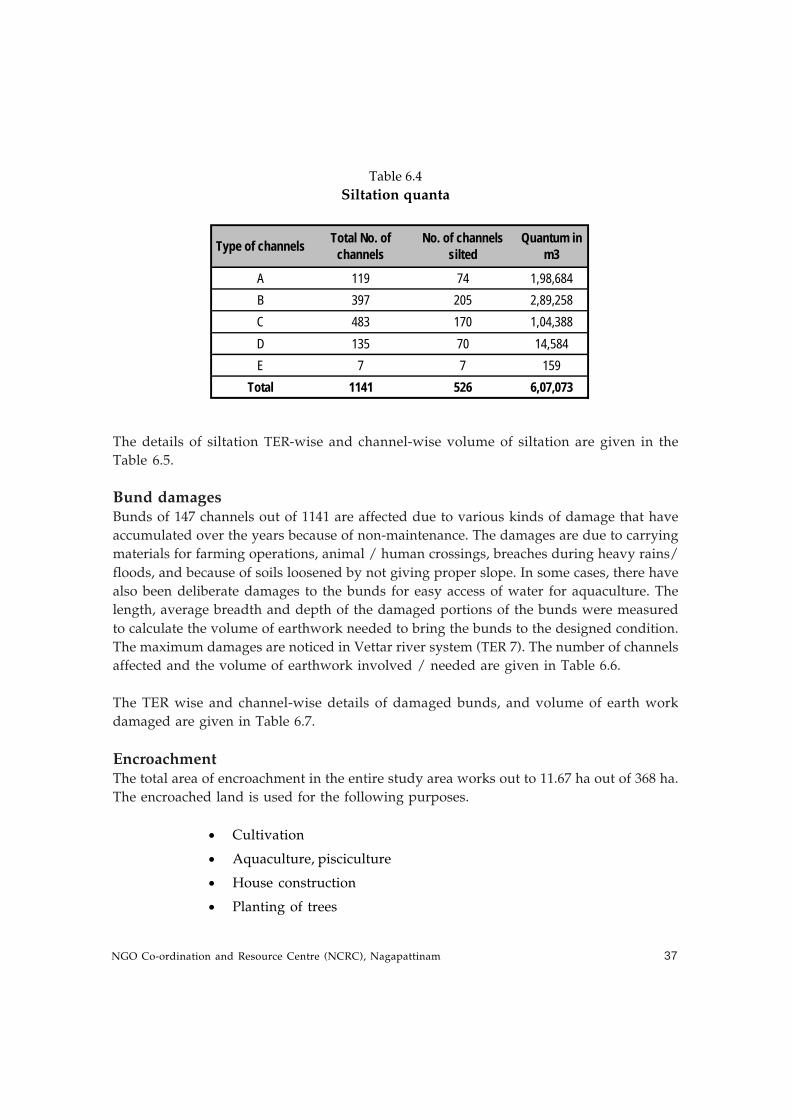
Siltation526 channels out of 1141 channels are badly affected by siltation in the study area.
The locations of siltation in each channel were identified and the length, average
width and depth of siltation were measured to assess the volume of silt accumulated
in the entire study area. The total siltation is more in the Vellaiyar river system
(TER 11). The number of channels affected and the channel-wise quantum of siltation
are given in Table 6.4.
Type of channel Number Length in kms Average width (in metres)
Average depth (in metres)
A 119 329 3 1.2B 397 522 1.8 0.9C 483 402 1.2 0.7D 135 72 1 0.7E 7 0.6 1.2 0.9
NGO Co-ordination and Resource Centre (NCRC), Nagapattinam 35
Ta
ble
6
.2
Irri
gat
ion
Ch
ann
els
- N
o o
f C
han
nel
s an
d A
yac
ut
area
TER
No.
12
34
56
78
910
1112
1314
Clas
s
South Rajan
Pudumanniyar
Cauvery
Manjalar
Mahimalaiyar
Veeracholanar
Vettar
Odambogiyar
Kaduvaiyar
Pandavayar
Vellaiyar
Harichandra
Adappar
Mulliyar
A12
5019
42
41
22
25
102
411
9B
710
5039
3922
84
206
6183
3810
397
C86
3545
3329
1254
177
6249
483
D14
61
2537
118
2211
135
E7
7To
tal N
o19
6016
984
8784
8219
949
165
166
8914
1141
Ayac
ut A
rea (
Ha)
489
1377
3243
619
1344
391
1830
202
4194
475
3731
3935
2355
1324
2550
9
Tota
l
Mapping and Study of Coastal Water Bodies in Nagapattinam District36
Ta
ble
6
.3
Irri
gat
ion
Ch
ann
els
- L
eng
th (
met
re)
TER
No.
12
34
56
78
910
1112
1314
Clas
s
South Rajan
Pudumanniyar
Cauvery
Manjalar
Mahimalaiyar
Veeracholanar
Vettar
Odambogiyar
Kaduvaiyar
Pandavayar
Vellaiyar
Harichandra
Adappar
Mulliyar
A22
550
5055
072
200
1300
011
500
6000
2300
082
0015
500
6200
2990
038
618
1410
017
500
3288
1832
8.8
B90
0030
2070
300
4107
543
400
1775
037
700
6500
6185
010
900
9997
359
385
3071
030
000
5215
6352
1.6
C52
500
3683
028
650
1890
037
020
5145
5597
820
0087
285
3180
545
500
4016
1340
1.6
D60
0025
0040
089
0013
575
600
2075
014
640
4215
7158
071
.6
E62
062
00.6
Tota
l (m
)31
550
5357
020
1000
9340
583
950
5155
011
1915
2044
515
4078
1910
023
1798
1340
2390
310
4750
013
2419
4
Tota
l ( k
m )
31.55
53.57
201.0
093
.4183
.9551
.5511
1.92
20.45
154.0
819
.1023
1.80
134.0
290
.3147
.50
1324
Tota
l (m
)To
tal
(km
)
NGO Co-ordination and Resource Centre (NCRC), Nagapattinam 37
Table 6.4
Siltation quanta
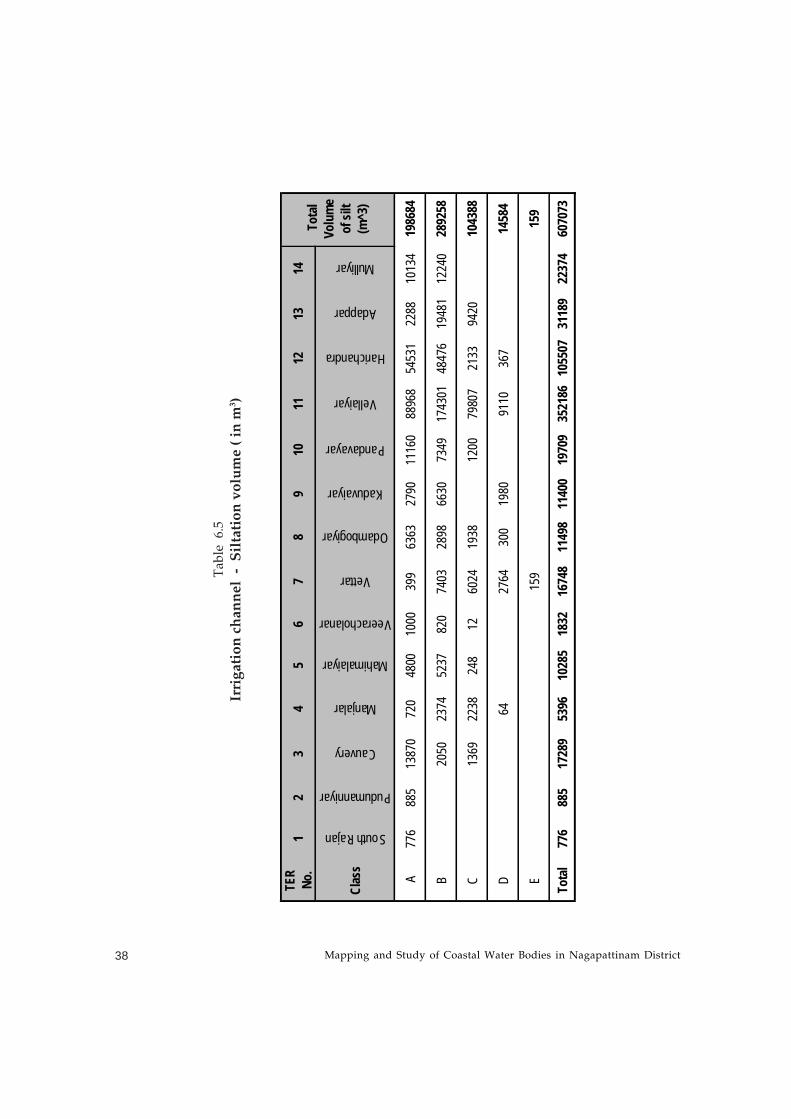
The details of siltation TER-wise and channel-wise volume of siltation are given in the
Table 6.5.
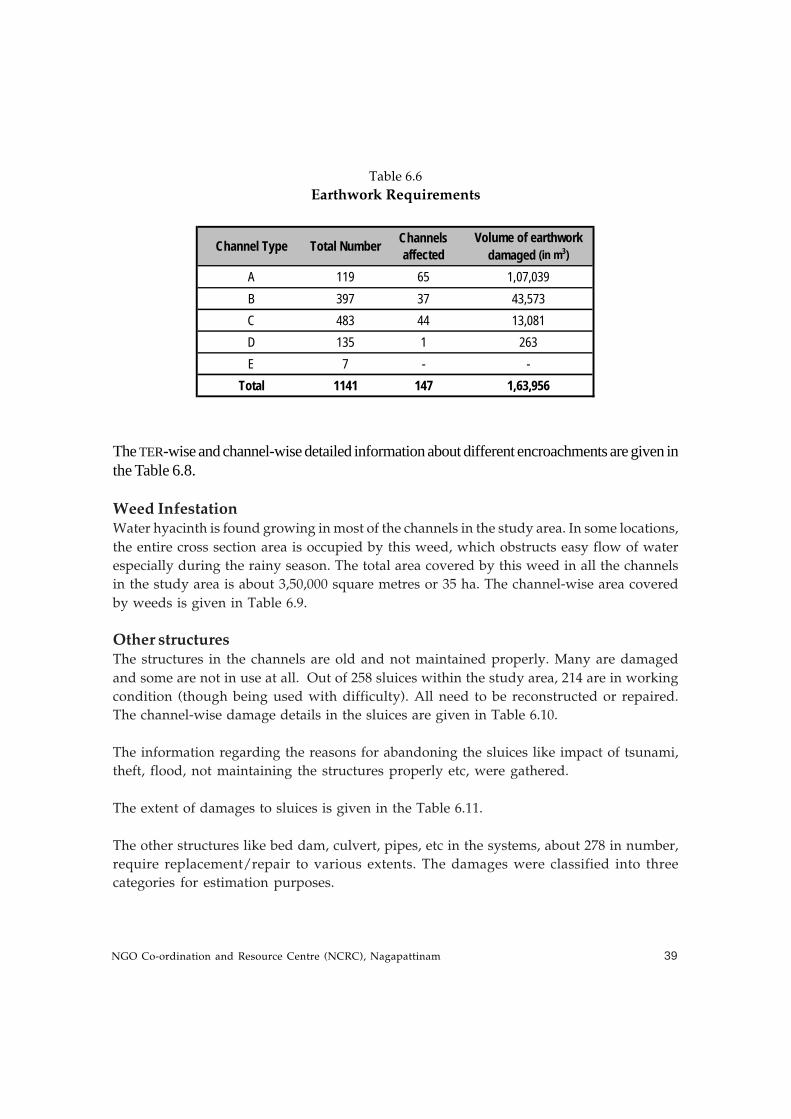
Bund damagesBunds of 147 channels out of 1141 are affected due to various kinds of damage that have
accumulated over the years because of non-maintenance. The damages are due to carrying
materials for farming operations, animal / human crossings, breaches during heavy rains/
floods, and because of soils loosened by not giving proper slope. In some cases, there have
also been deliberate damages to the bunds for easy access of water for aquaculture. The
length, average breadth and depth of the damaged portions of the bunds were measured
to calculate the volume of earthwork needed to bring the bunds to the designed condition.
The maximum damages are noticed in Vettar river system (TER 7). The number of channels
affected and the volume of earthwork involved / needed are given in Table 6.6.
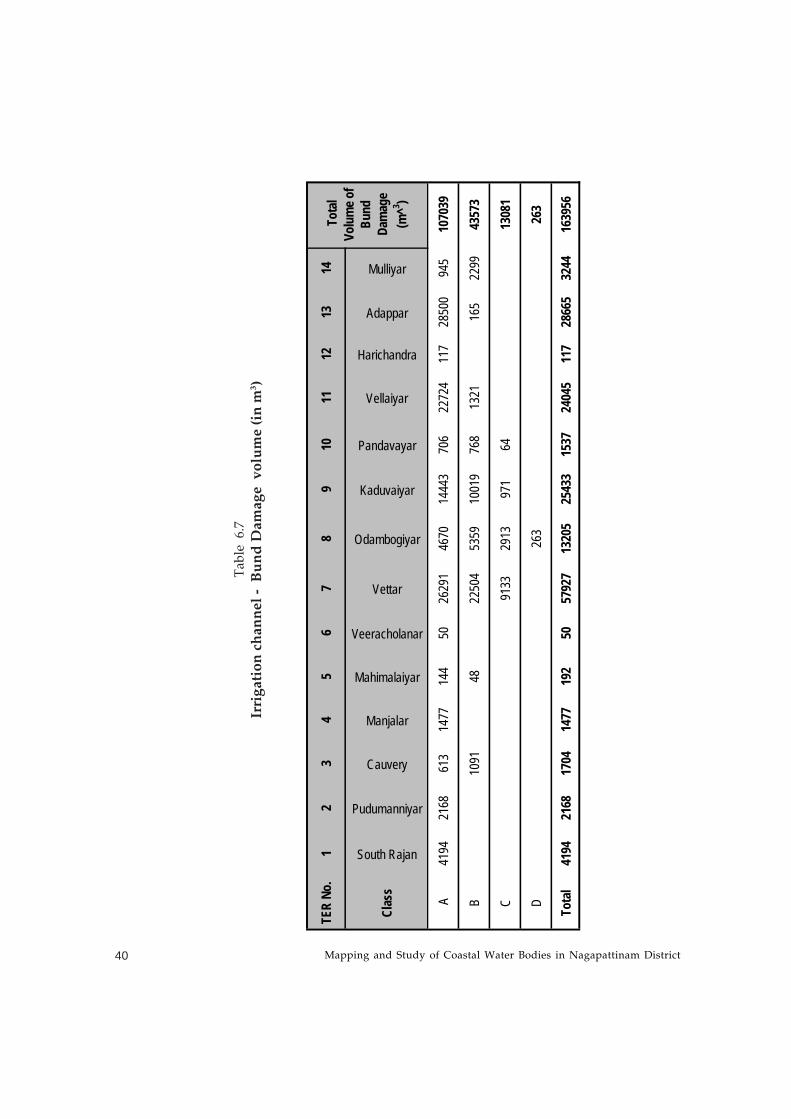
The TER wise and channel-wise details of damaged bunds, and volume of earth work
damaged are given in Table 6.7.
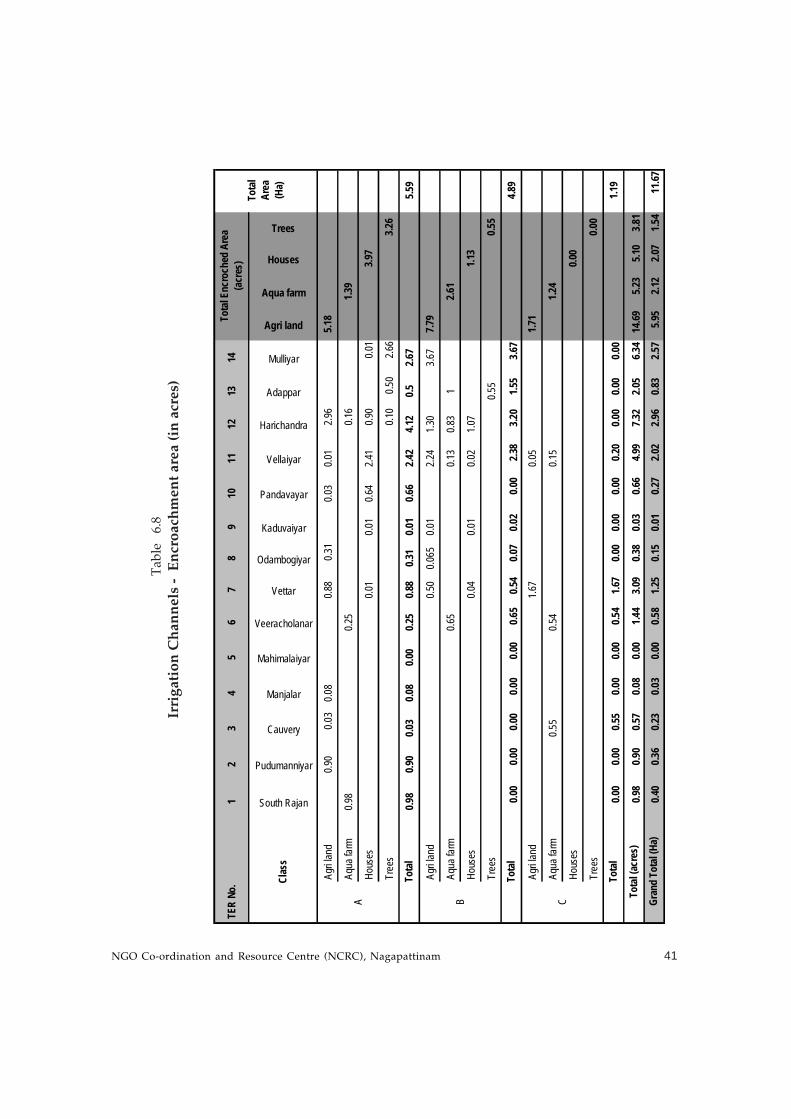
EncroachmentThe total area of encroachment in the entire study area works out to 11.67 ha out of 368 ha.
The encroached land is used for the following purposes.
• Cultivation
• Aquaculture, pisciculture
• House construction
• Planting of trees
Type of channels Total No. of channels
No. of channels silted
Quantum in m3
A 119 74 1,98,684B 397 205 2,89,258C 483 170 1,04,388D 135 70 14,584E 7 7 159
Total 1141 526 6,07,073
Mapping and Study of Coastal Water Bodies in Nagapattinam District38
Ta
ble
6
.5
Irri
gat
ion
ch
ann
el
- S
ilta
tio
n v
olu
me
( in
m3 )
TER
No.
12
34
56
78
910
1112
1314
Clas
s
South Rajan
Pudumanniyar
Cauvery
Manjalar
Mahimalaiyar
Veeracholanar
Vettar
Odambogiyar
Kaduvaiyar
Pandavayar
Vellaiyar
Harichandra
Adappar
Mulliyar
A77
688
513
870
720
4800
1000
399
6363
2790
1116
088
968
5453
122
8810
134
1986
84
B20
5023
7452
3782
074
0328
9866
3073
4917
4301
4847
619
481
1224
028
9258
C13
6922
3824
812
6024
1938
1200
7980
721
3394
2010
4388
D64
2764
300
1980
9110
367
1458
4
E15
915
9
Tota
l77
688
517
289
5396
1028
518
3216
748
1149
811
400
1970
935
2186
1055
0731
189
2237
460
7073
Tot
al Vo
lum
e of
silt
(m^3
)
NGO Co-ordination and Resource Centre (NCRC), Nagapattinam 39
Table 6.6
Earthwork Requirements
The TER-wise and channel-wise detailed information about different encroachments are given inthe Table 6.8.
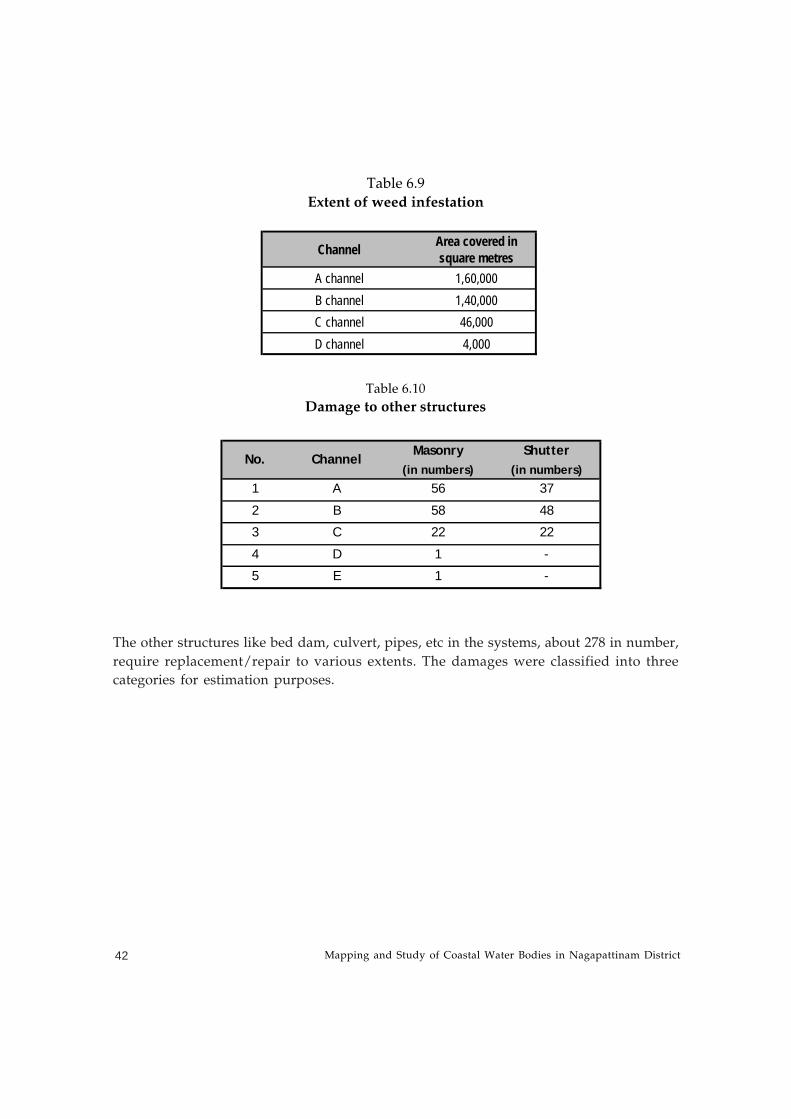
Weed InfestationWater hyacinth is found growing in most of the channels in the study area. In some locations,
the entire cross section area is occupied by this weed, which obstructs easy flow of water
especially during the rainy season. The total area covered by this weed in all the channels
in the study area is about 3,50,000 square metres or 35 ha. The channel-wise area covered
by weeds is given in Table 6.9.
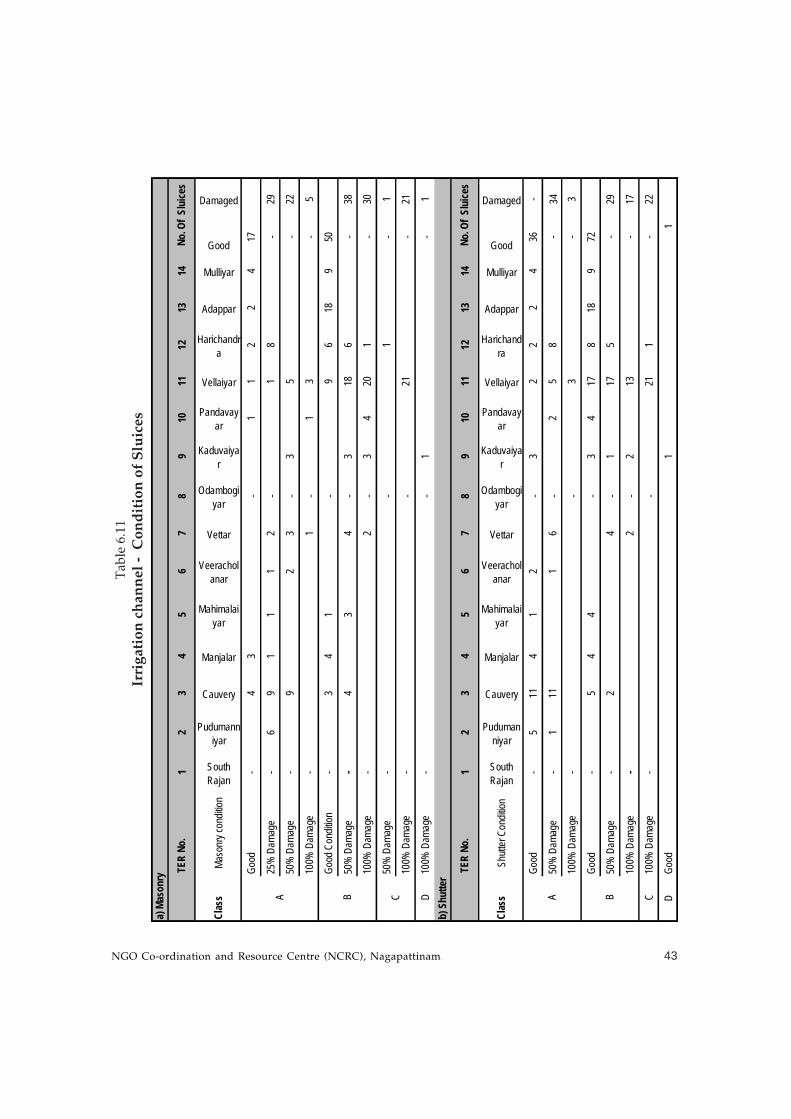
Other structuresThe structures in the channels are old and not maintained properly. Many are damaged
and some are not in use at all. Out of 258 sluices within the study area, 214 are in working
condition (though being used with difficulty). All need to be reconstructed or repaired.
The channel-wise damage details in the sluices are given in Table 6.10.
The information regarding the reasons for abandoning the sluices like impact of tsunami,
theft, flood, not maintaining the structures properly etc, were gathered.
The extent of damages to sluices is given in the Table 6.11.
The other structures like bed dam, culvert, pipes, etc in the systems, about 278 in number,
require replacement/repair to various extents. The damages were classified into three
categories for estimation purposes.
Channel Type Total Number Channels affected
Volume of earthwork damaged (in m3)
A 119 65 1,07,039B 397 37 43,573C 483 44 13,081D 135 1 263E 7 - -
Total 1141 147 1,63,956
Mapping and Study of Coastal Water Bodies in Nagapattinam District40
Ta
ble
6
.7
Irri
gat
ion
ch
ann
el -
B
un
d D
amag
e v
olu
me
(in
m3)
TER
No.
12
34
56
78
910
1112
1314
Clas
s
South Rajan
Pudumanniyar
Cauvery
Manjalar
Mahimalaiyar
Veeracholanar
Vettar
Odambogiyar
Kaduvaiyar
Pandavayar
Vellaiyar
Harichandra
Adappar
Mulliyar
A41
9421
6861
314
7714
450
2629
146
7014
443
706
2272
411
728
500
945
1070
39
B10
9148
2250
453
5910
019
768
1321
165
2299
4357
3
C91
3329
1397
164
1308
1
D26
326
3
Tota
l41
9421
6817
0414
7719
250
5792
713
205
2543
315
3724
045
117
2866
532
4416
3956
Tot
al Vo
lum
e of
Bund
Da
mag
e (m
^3 )
NGO Co-ordination and Resource Centre (NCRC), Nagapattinam 41
T
ab
le
6.8
Irri
ga
tio
n C
ha
nn
els
-
En
cro
ach
me
nt
are
a (
in a
cre
s)
TER
No.
12
34
56
78
910
1112
1314
South Rajan
Pudumanniyar
Cauvery
Manjalar
Mahimalaiyar
Veeracholanar
Vettar
Odambogiyar
Kaduvaiyar
Pandavayar
Vellaiyar
Harichandra
Adappar
Mulliyar
Agri land
Aqua farm
Houses
Trees
Agri l
and
0.90
0.03
0.08
0.88
0.31
0.03
0.01
2.96
5.18
Aqua
farm
0.98
0.25
0.16
1.39
Hous
es
0.01
0.01
0.64
2.41
0.90
0.01
3.97
Tree
s0.1
00.5
02.6
63.2
6
0.98
0.90
0.03
0.08
0.00
0.25
0.88
0.31
0.01
0.66
2.42
4.12
0.52.6
75.5
9
Agri l
and
0.50
0.065
0.01
2.24
1.30
3.67
7.79
Aqua
farm
0.65
0.13
0.83
12.6
1
Hous
es0.0
40.0
10.0
21.0
71.1
3
Tree
s0.5
50.5
5
0.00
0.00
0.00
0.00
0.00
0.65
0.54
0.07
0.02
0.00
2.38
3.20
1.55
3.67
4.89
Agri l
and
1.67
0.05
1.71
Aqua
farm
0.55
0.54
0.15
1.24
Hous
es0.0
0
Tree
s0.0
0
0.00
0.00
0.55
0.00
0.00
0.54
1.67
0.00
0.00
0.00
0.20
0.00
0.00
0.00
1.19
0.98
0.90
0.57
0.08
0.00
1.44
3.09
0.38
0.03
0.66
4.99
7.32
2.05
6.34
14.69
5.23
5.10
3.81
0.40
0.36
0.23
0.03
0.00
0.58
1.25
0.15
0.01
0.27
2.02
2.96
0.83
2.57
5.95
2.12
2.07
1.54
11.67
C
Tota
l
Gran
d To
tal (
Ha)
Tota
l Ar
ea(H
a)
Tota
l Enc
roch
ed A
rea
(acr
es)
Tota
l (ac
res)
A B
Tota
l
Tota
l
Clas
s
Mapping and Study of Coastal Water Bodies in Nagapattinam District42
Table 6.9
Extent of weed infestation
Table 6.10
Damage to other structures
The other structures like bed dam, culvert, pipes, etc in the systems, about 278 in number,
require replacement/repair to various extents. The damages were classified into three
categories for estimation purposes.
Channel Area covered in square metres
A channel 1,60,000B channel 1,40,000C channel 46,000D channel 4,000
Masonry Shutter (in numbers) (in numbers)
1 A 56 37
2 B 58 48
3 C 22 22
4 D 1 -
5 E 1 -
No. Channel
NGO Co-ordination and Resource Centre (NCRC), Nagapattinam 43
Tab
le 6
.11
Irri
gat
ion
ch
ann
el -
C
on
dit
ion
of
Slu
ices
12
34
56
78
910
1112
1314
Clas
sMa
sonr
y con
dition
South Rajan
Pudumanniyar
Cauvery
Manjalar
Mahimalaiyar
Veeracholanar
Vettar
Odambogiyar
Kaduvaiyar
Pandavayar
Vellaiyar
Harichandra
Adappar
Mulliyar
Good
Damaged
Good
-4
3-
11
22
417
25%
Dam
age
-6
91
11
2-
18
-29
50%
Dam
age
-9
23
-3
5-
22
100%
Dam
age
-1
-1
3-
5
Good
Con
dition
-3
41
-9
618
950
50%
Dam
age
-4
34
-3
186
-38
100%
Dam
age
-2
-3
420
1-
30
50%
Dam
age
--
1-
1
100%
Dam
age
--
21-
21
D10
0% D
amag
e-
-1
-1
12
34
56
78
910
1112
1314
Clas
sSh
utter
Con
dition
South Rajan
Pudumanniyar
Cauvery
Manjalar
Mahimalaiyar
Veeracholanar
Vettar
Odambogiyar
Kaduvaiyar
Pandavayar
Vellaiyar
Harichandra
Adappar
Mulliyar
Good
Damaged
Good
-
511
41
2-
32
22
436
-
50%
Dam
age
-1
111
6-
25
8-
3410
0% D
amag
e-
-3
-3
Good
-5
44
-3
417
818
972
50%
Dam
age
-2
4-
117
5-
29
100%
Dam
age
-2
-2
13-
17
C10
0% D
amag
e-
-21
1-
22
DGo
od
11
B
TER
No.
C B A
b) S
hutte
r
No. O
f Sl
uice
s
TER
No.
No. O
f Sl
uice
s
A
a) M
ason
ry
Mapping and Study of Coastal Water Bodies in Nagapattinam District44
6c Drainage Channels
Types of channels
Drainage channels are classified into 1) River drains, 2) Main drains and 3) Sub drains.
1. River drainage: The river serves for irrigation and drainage purposes,
but after the tail end regulators (TER), the river channel does the function
only of drainage and hence is called as river drainage. There are 14
river drainages in the study area corresponding to the 14 TER. Out of
these, two river drainages split into two branches each before joining
the sea.
2. Main drains: Just above the TER, A class channels are drawn from
one or both sides of the rivers. From these, branches are further cut
resulting in the B,C and D class channels. When water is released in all
the channels for irrigation and during rains, the excess water and
seepage/percolation water from channels are collected in a channel which
joins the river drainage. Such drains with a width of more than 5m
were classified as “main drain” for the study. In addition, the channels
that originate between two TERs, run parallel to the river drainage and
join the sea directly are also classified as “Main drain” for the purpose
of this study.
3. Sub drains: Drains of the above type but of width lesser than 5m
were classified as “sub drain” for the study.
In the district map all the River Drainage and Main Drains are marked for the study area
(Fig-6.1). The conditions of these (drainage) channels were studied in depth and
measurements are taken in order to work out the estimation for rehabilitation. Since drainage
/ water logging is the major problem in the coastal area especially in southeast and southern
part of Nagapattinam district, and the main intention of this study was understanding the
means to disaster- proofing of agriculture, there was considerable focus on the drainage
systems. Discussions with the farmers and PWD officials indicated that that about two
third of the paddy land in the study area is badly affected / inundated due to insufficient
drainage.
Number of ChannelsThe total number of different type of drainage channels is 180 having a total length of 346
km. The number, length of the channels are given in Table 6.12.
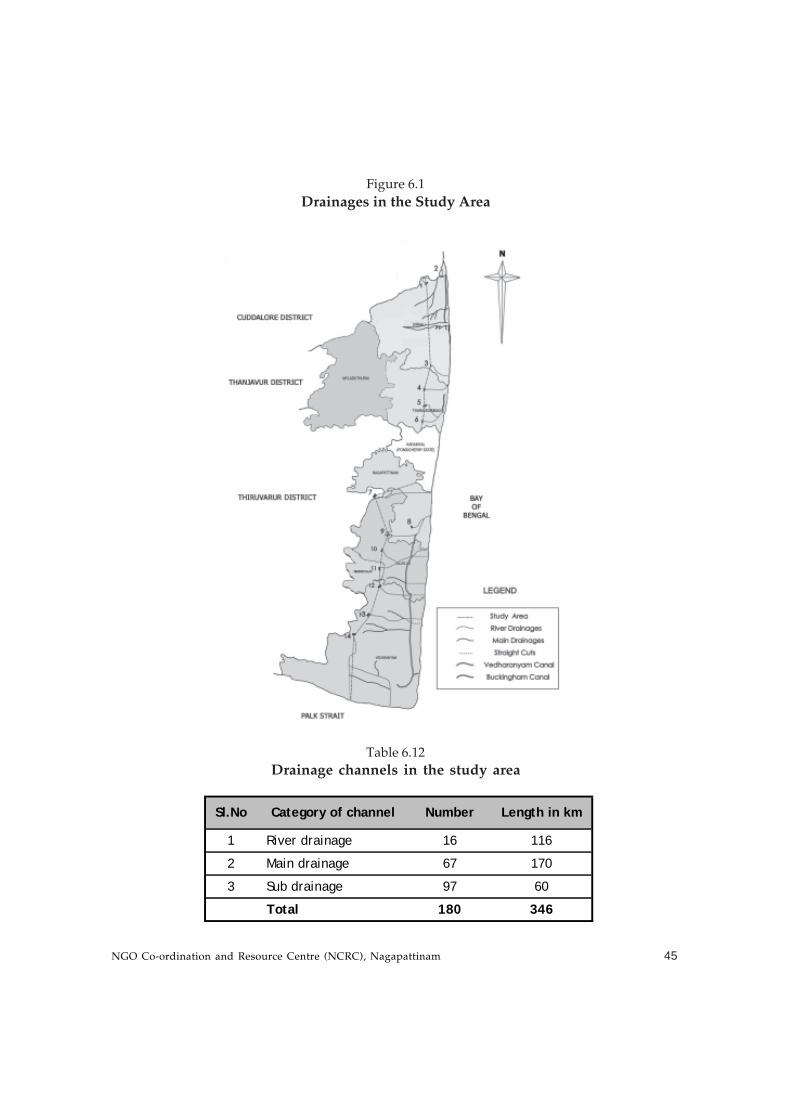
NGO Co-ordination and Resource Centre (NCRC), Nagapattinam 45
Figure 6.1
Drainages in the Study Area
Sl.No Category of channel Number Length in km
1 River drainage 16 116
2 Main drainage 67 170
3 Sub drainage 97 60
Total 180 346
Table 6.12
Drainage channels in the study area
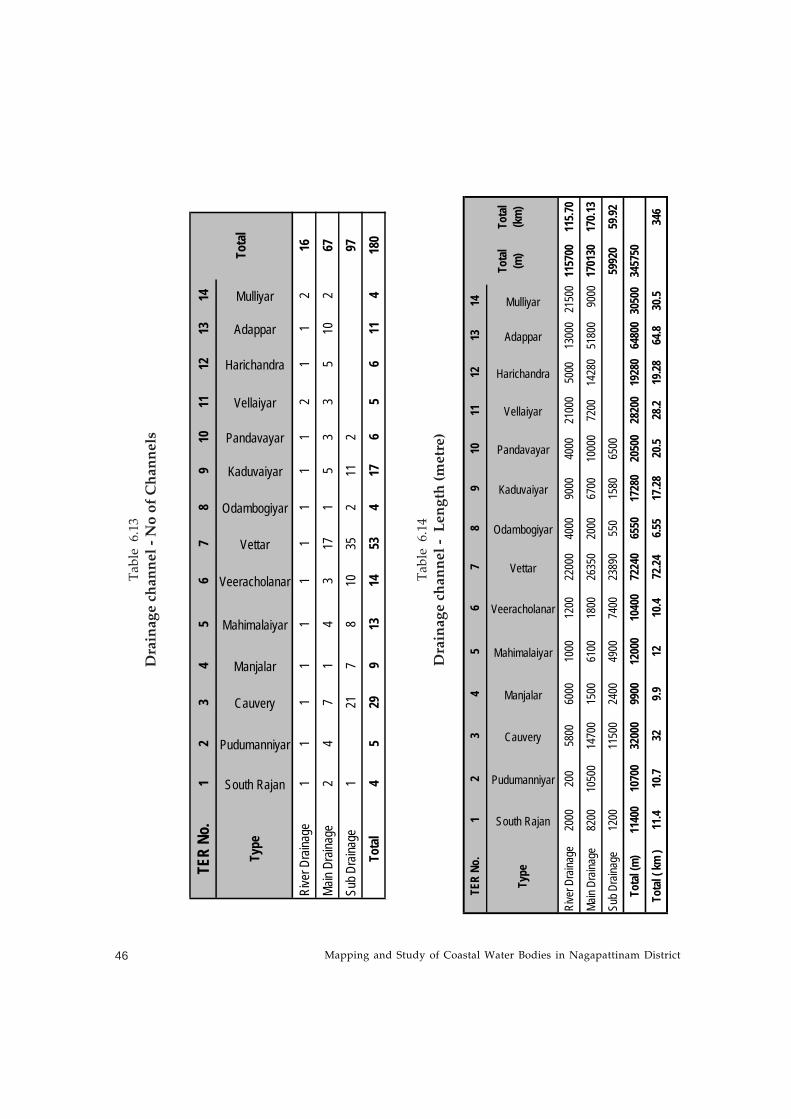
Mapping and Study of Coastal Water Bodies in Nagapattinam District46
Ta
ble
6
.13
Dra
inag
e ch
ann
el -
No
of
Ch
ann
els
Ta
ble
6
.14
Dra
inag
e ch
ann
el -
L
eng
th (
met
re)
TER
No.
12
34
56
78
910
1112
1314
Type
South Rajan
Pudumanniyar
Cauvery
Manjalar
Mahimalaiyar
Veeracholanar
Vettar
Odambogiyar
Kaduvaiyar
Pandavayar
Vellaiyar
Harichandra
Adappar
MulliyarRi
ver D
raina
ge1
11
11
11
11
12
11
216
Main
Dra
inage
24
71
43
171
53
35
102
67Su
b Dra
inage
121
78
1035
211
297
Tota
l4
529
913
1453
417
65
611
418
0
Tota
l
TER
No.
12
34
56
78
910
1112
1314
Type
South Rajan
Pudumanniyar
Cauvery
Manjalar
Mahimalaiyar
Veeracholanar
Vettar
Odambogiyar
Kaduvaiyar
Pandavayar
Vellaiyar
Harichandra
Adappar
Mulliyar
Rive
r Dra
inage
2000
200
5800
6000
1000
1200
2200
040
0090
0040
0021
000
5000
1300
021
500
1157
0011
5.70
Main
Drain
age
8200
1050
014
700
1500
6100
1800
2635
020
0067
0010
000
7200
1428
051
800
9000
1701
3017
0.13
Sub D
raina
ge12
0011
500
2400
4900
7400
2389
055
015
8065
0059
920
59.92
Tota
l (m
)11
400
1070
032
000
9900
1200
010
400
7224
065
5017
280
2050
028
200
1928
064
800
3050
034
5750
Tota
l ( km
)11
.410
.732
9.912
10.4
72.24
6.55
17.28
20.5
28.2
19.28
64.8
30.5
34
6
Tota
l (m
)To
tal
(km
)
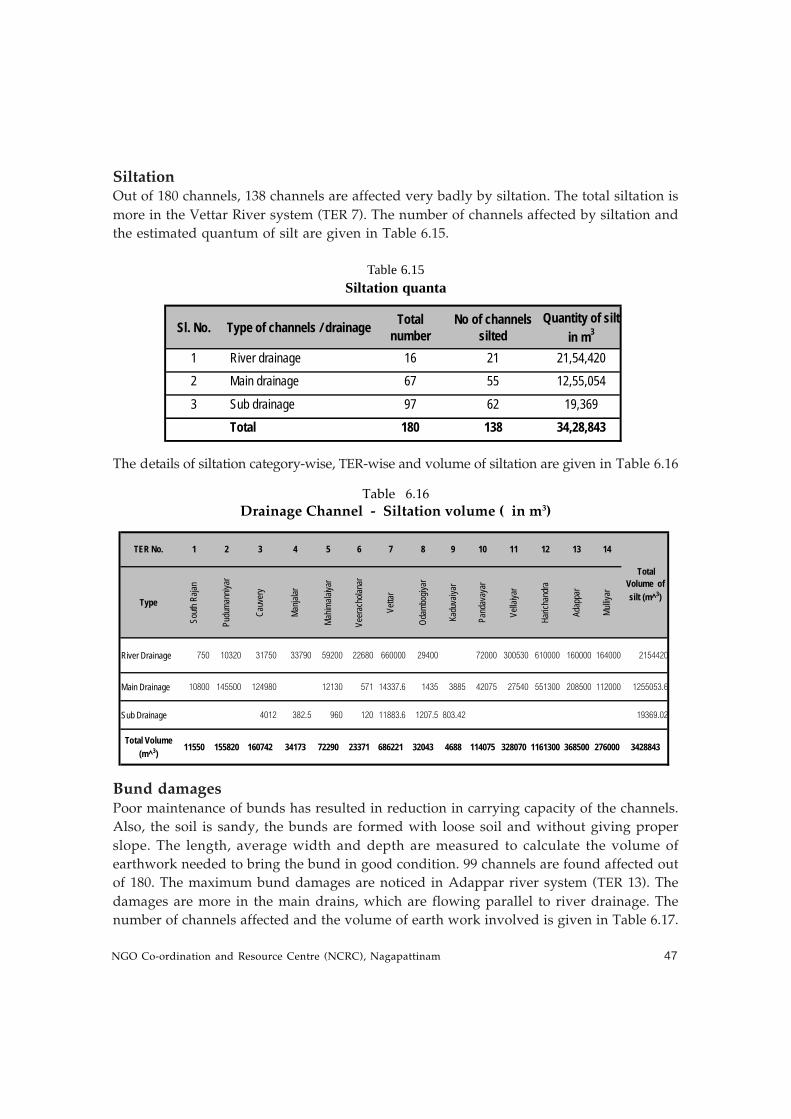
NGO Co-ordination and Resource Centre (NCRC), Nagapattinam 47
Table 6.15Siltation quanta
Table 6.16
Drainage Channel - Siltation volume ( in m3)
SiltationOut of 180 channels, 138 channels are affected very badly by siltation. The total siltation is
more in the Vettar River system (TER 7). The number of channels affected by siltation and
the estimated quantum of silt are given in Table 6.15.
The details of siltation category-wise, TER-wise and volume of siltation are given in Table 6.16
Bund damagesPoor maintenance of bunds has resulted in reduction in carrying capacity of the channels.
Also, the soil is sandy, the bunds are formed with loose soil and without giving proper
slope. The length, average width and depth are measured to calculate the volume of
earthwork needed to bring the bund in good condition. 99 channels are found affected out
of 180. The maximum bund damages are noticed in Adappar river system (TER 13). The
damages are more in the main drains, which are flowing parallel to river drainage. The
number of channels affected and the volume of earth work involved is given in Table 6.17.
Sl. No. Type of channels / drainage Total number
No of channels silted
Quantity of silt in m3
1 River drainage 16 21 21,54,4202 Main drainage 67 55 12,55,054
3 Sub drainage 97 62 19,369 Total 180 138 34,28,843
TER No. 1 2 3 4 5 6 7 8 9 10 11 12 13 14
Type
South
Raja
n
Pudu
mann
iyar
Cauv
ery
Manja
lar
Mahim
alaiya
r
Veer
acho
lanar
Vetta
r
Odam
bogiy
ar
Kadu
vaiya
r
Pand
avay
ar
Vella
iyar
Haric
hand
ra
Adap
par
Mulliy
ar
River Drainage 750 10320 31750 33790 59200 22680 660000 29400 72000 300530 610000 160000 164000 2154420
Main Drainage 10800 145500 124980 12130 571 14337.6 1435 3885 42075 27540 551300 208500 112000 1255053.6
Sub Drainage 4012 382.5 960 120 11883.6 1207.5 803.42 19369.02
Total Volume (m^3)
11550 155820 160742 34173 72290 23371 686221 32043 4688 114075 328070 1161300 368500 276000 3428843
Total Volume of silt (m^3)
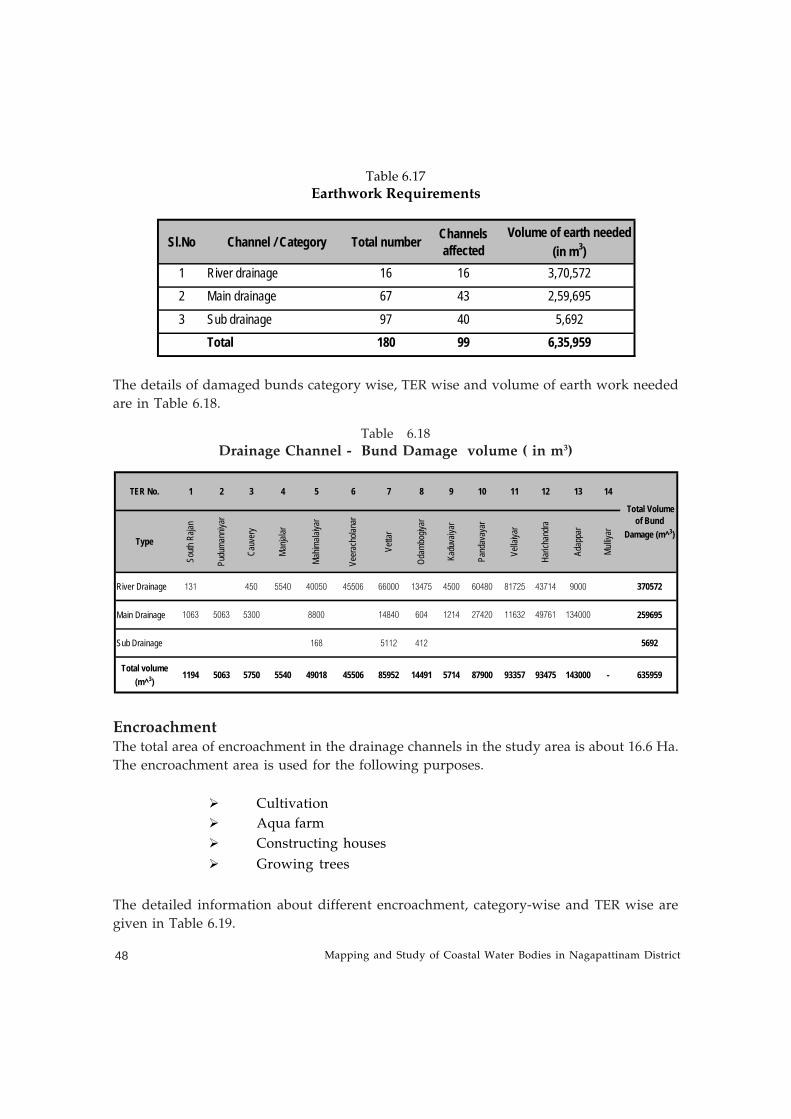
Mapping and Study of Coastal Water Bodies in Nagapattinam District48
Table 6.17
Earthwork Requirements
Table 6.18
Drainage Channel - Bund Damage volume ( in m3)
The details of damaged bunds category wise, TER wise and volume of earth work needed
are in Table 6.18.
EncroachmentThe total area of encroachment in the drainage channels in the study area is about 16.6 Ha.
The encroachment area is used for the following purposes.
Cultivation
Aqua farm
Constructing houses
Growing trees
The detailed information about different encroachment, category-wise and TER wise are
given in Table 6.19.
Sl.No Channel / Category Total number Channels affected
Volume of earth needed (in m3)
1 River drainage 16 16 3,70,5722 Main drainage 67 43 2,59,695
3 Sub drainage 97 40 5,692Total 180 99 6,35,959
TER No. 1 2 3 4 5 6 7 8 9 10 11 12 13 14
Type
South
Raja
n
Pudu
mann
iyar
Cauv
ery
Manja
lar
Mahim
alaiya
r
Veer
acho
lanar
Vetta
r
Odam
bogiy
ar
Kadu
vaiya
r
Pand
avay
ar
Vella
iyar
Haric
hand
ra
Adap
par
Mulliy
ar
River Drainage 131 450 5540 40050 45506 66000 13475 4500 60480 81725 43714 9000 370572
Main Drainage 1063 5063 5300 8800 14840 604 1214 27420 11632 49761 134000 259695
Sub Drainage 168 5112 412 5692
Total volume (m^3)
1194 5063 5750 5540 49018 45506 85952 14491 5714 87900 93357 93475 143000 - 635959
Total Volume of Bund
Damage (m^3)
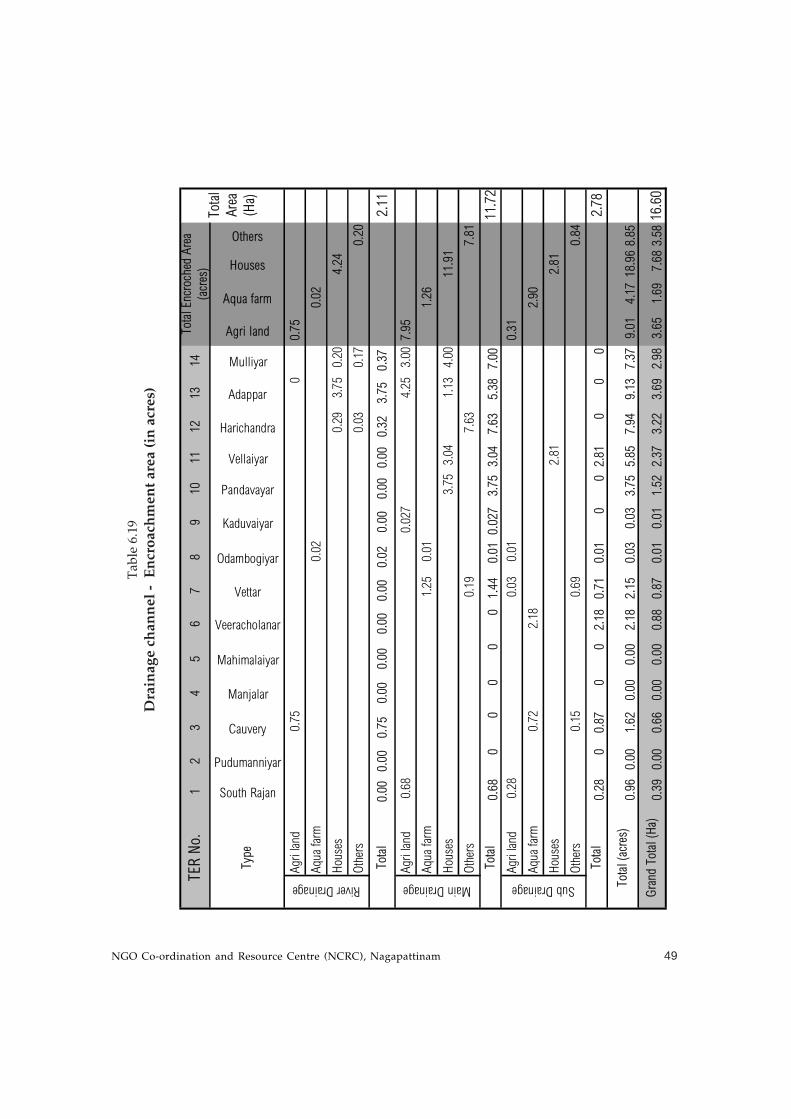
NGO Co-ordination and Resource Centre (NCRC), Nagapattinam 49
Tab
le 6
.19
Dra
inag
e ch
ann
el -
E
ncr
oac
hm
ent
area
(in
acr
es)
12
34
56
78
910
1112
1314
South Rajan
Pudumanniyar
Cauvery
Manjalar
Mahimalaiyar
Veeracholanar
Vettar
Odambogiyar
Kaduvaiyar
Pandavayar
Vellaiyar
Harichandra
Adappar
Mulliyar
Agri land
Aqua farm
Houses
Others
Agri
land
0.75
00.
75
Aqua
farm
0.02
0.02
Hous
es
0.29
3.75
0.20
4.24
Othe
rs0.
030.
170.
20
0.00
0.00
0.75
0.00
0.00
0.00
0.00
0.02
0.00
0.00
0.00
0.32
3.75
0.37
2.11
Agri
land
0.68
0.02
74.
253.
007.
95
Aqua
farm
1.25
0.01
1.26
Hous
es3.
753.
041.
134.
0011
.91
Othe
rs0.
197.
637.
81
0.68
00
00
01.
440.
010.
027
3.75
3.04
7.63
5.38
7.00
11.7
2Ag
ri lan
d0.
280.
030.
010.
31
Aqua
farm
0.72
2.18
2.90
Hous
es2.
812.
81
Othe
rs0.
150.
690.
84
0.28
00.
870
02.
180.
710.
010
02.
810
00
2.78
0.96
0.00
1.62
0.00
0.00
2.18
2.15
0.03
0.03
3.75
5.85
7.94
9.13
7.37
9.01
4.17
18.9
68.
85
0.39
0.00
0.66
0.00
0.00
0.88
0.87
0.01
0.01
1.52
2.37
3.22
3.69
2.98
3.65
1.69
7.68
3.58
16.6
0
Tota
l Ar
ea(H
a)
Tota
l (ac
res)
Sub Drainage
Tota
l
Tota
l Enc
roch
ed A
rea
(acr
es)
River Drainage Main Drainage
Tota
l
TER
No.
Tota
l
Type
Gra
nd T
otal
(Ha)
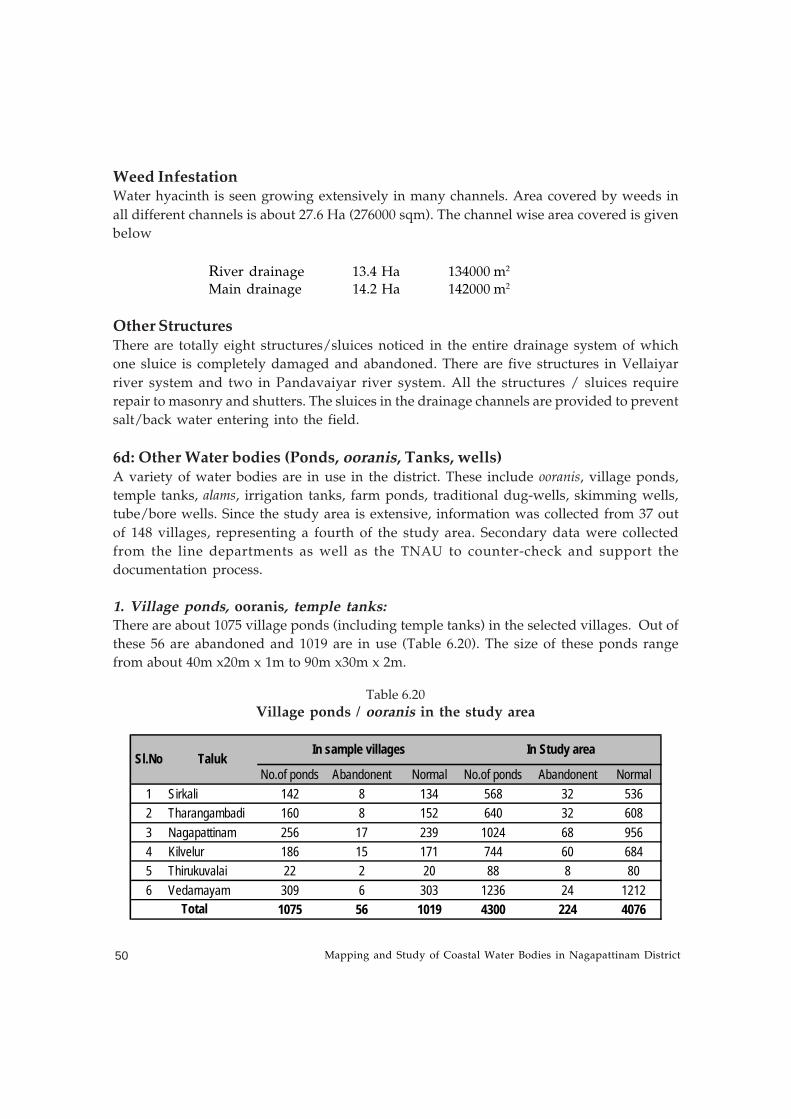
Mapping and Study of Coastal Water Bodies in Nagapattinam District50
Table 6.20
Village ponds / ooranis in the study area
Weed InfestationWater hyacinth is seen growing extensively in many channels. Area covered by weeds in
all different channels is about 27.6 Ha (276000 sqm). The channel wise area covered is given
below
River drainage 13.4 Ha 134000 m2
Main drainage 14.2 Ha 142000 m2
Other StructuresThere are totally eight structures/sluices noticed in the entire drainage system of which
one sluice is completely damaged and abandoned. There are five structures in Vellaiyar
river system and two in Pandavaiyar river system. All the structures / sluices require
repair to masonry and shutters. The sluices in the drainage channels are provided to prevent
salt/back water entering into the field.
6d: Other Water bodies (Ponds, ooranis, Tanks, wells)A variety of water bodies are in use in the district. These include ooranis, village ponds,
temple tanks, alams, irrigation tanks, farm ponds, traditional dug-wells, skimming wells,
tube/bore wells. Since the study area is extensive, information was collected from 37 out
of 148 villages, representing a fourth of the study area. Secondary data were collected
from the line departments as well as the TNAU to counter-check and support the
documentation process.
1. Village ponds, ooranis, temple tanks:There are about 1075 village ponds (including temple tanks) in the selected villages. Out of
these 56 are abandoned and 1019 are in use (Table 6.20). The size of these ponds range
from about 40m x20m x 1m to 90m x30m x 2m.
No.of ponds Abandonent Normal No.of ponds Abandonent Normal1 Sirkali 142 8 134 568 32 5362 Tharangambadi 160 8 152 640 32 6083 Nagapattinam 256 17 239 1024 68 9564 Kilvelur 186 15 171 744 60 6845 Thirukuvalai 22 2 20 88 8 806 Vedarnayam 309 6 303 1236 24 1212
1075 56 1019 4300 224 4076Total
Sl.No Taluk In sample villages In Study area
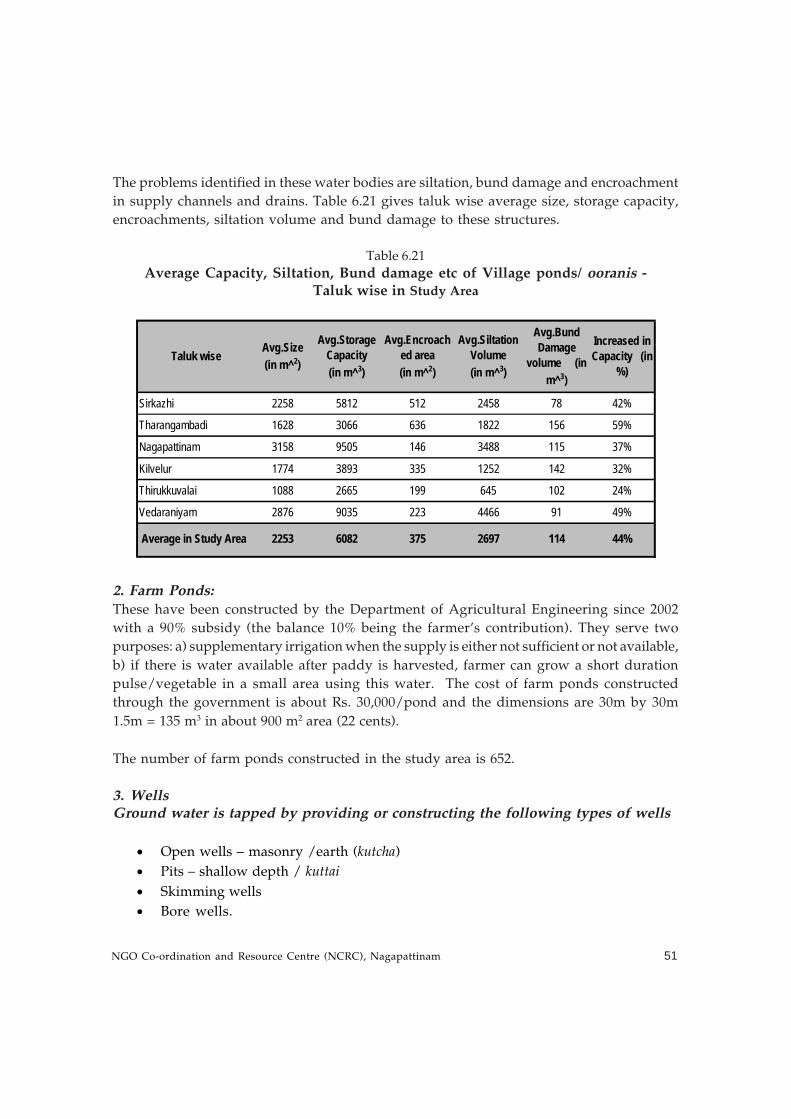
NGO Co-ordination and Resource Centre (NCRC), Nagapattinam 51
The problems identified in these water bodies are siltation, bund damage and encroachment
in supply channels and drains. Table 6.21 gives taluk wise average size, storage capacity,
encroachments, siltation volume and bund damage to these structures.
Table 6.21
Average Capacity, Siltation, Bund damage etc of Village ponds/ ooranis -Taluk wise in Study Area
2. Farm Ponds:These have been constructed by the Department of Agricultural Engineering since 2002
with a 90% subsidy (the balance 10% being the farmer’s contribution). They serve two
purposes: a) supplementary irrigation when the supply is either not sufficient or not available,
b) if there is water available after paddy is harvested, farmer can grow a short duration
pulse/vegetable in a small area using this water. The cost of farm ponds constructed
through the government is about Rs. 30,000/pond and the dimensions are 30m by 30m
1.5m = 135 m3 in about 900 m2 area (22 cents).
The number of farm ponds constructed in the study area is 652.
3. WellsGround water is tapped by providing or constructing the following types of wells
• Open wells – masonry /earth (kutcha)
• Pits – shallow depth / kuttai• Skimming wells
• Bore wells.
Taluk wiseAvg.Size (in m^2)
Avg.Storage Capacity (in m^3)
Avg.Encroached area (in m^2)
Avg.Siltation Volume (in m^3)
Avg.Bund Damage
volume (in m^3)
Increased in Capacity (in
%)
Sirkazhi 2258 5812 512 2458 78 42%
Tharangambadi 1628 3066 636 1822 156 59%
Nagapattinam 3158 9505 146 3488 115 37%
Kilvelur 1774 3893 335 1252 142 32%
Thirukkuvalai 1088 2665 199 645 102 24%
Vedaraniyam 2876 9035 223 4466 91 49%
Average in Study Area 2253 6082 375 2697 114 44%
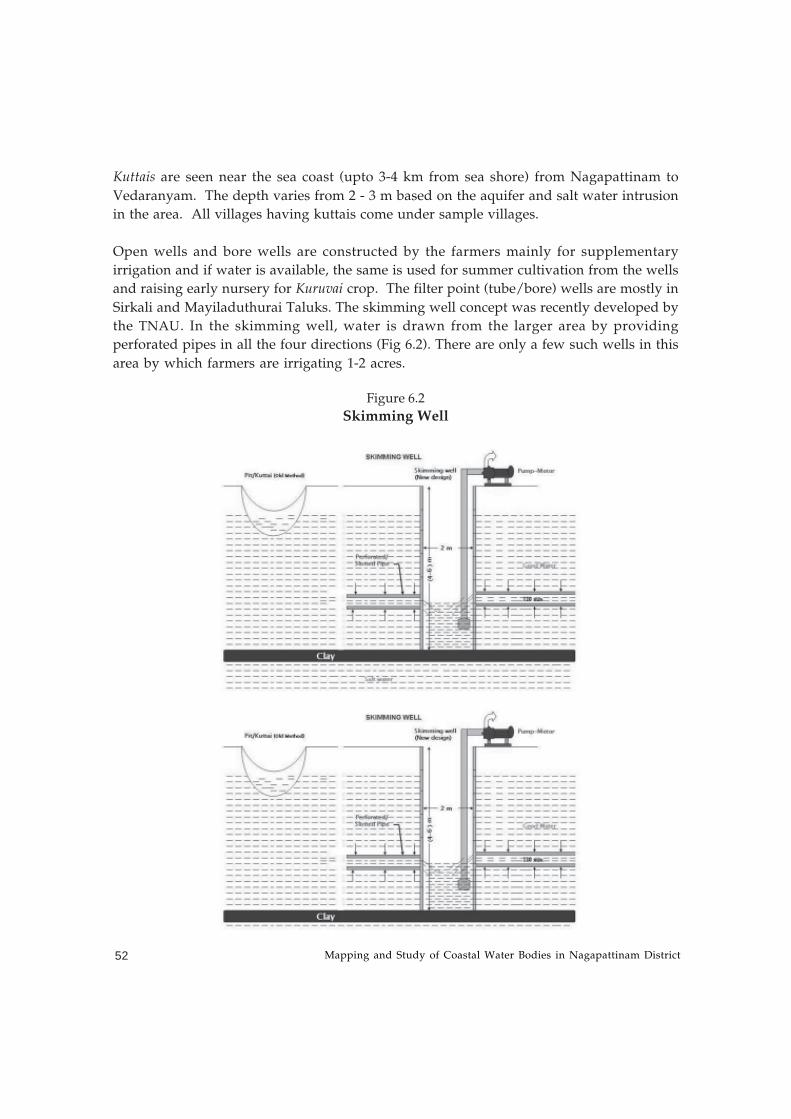
Mapping and Study of Coastal Water Bodies in Nagapattinam District52
Figure 6.2
Skimming Well
Kuttais are seen near the sea coast (upto 3-4 km from sea shore) from Nagapattinam to
Vedaranyam. The depth varies from 2 - 3 m based on the aquifer and salt water intrusion
in the area. All villages having kuttais come under sample villages.
Open wells and bore wells are constructed by the farmers mainly for supplementary
irrigation and if water is available, the same is used for summer cultivation from the wells
and raising early nursery for Kuruvai crop. The filter point (tube/bore) wells are mostly in
Sirkali and Mayiladuthurai Taluks. The skimming well concept was recently developed by
the TNAU. In the skimming well, water is drawn from the larger area by providing
perforated pipes in all the four directions (Fig 6.2). There are only a few such wells in this
area by which farmers are irrigating 1-2 acres.
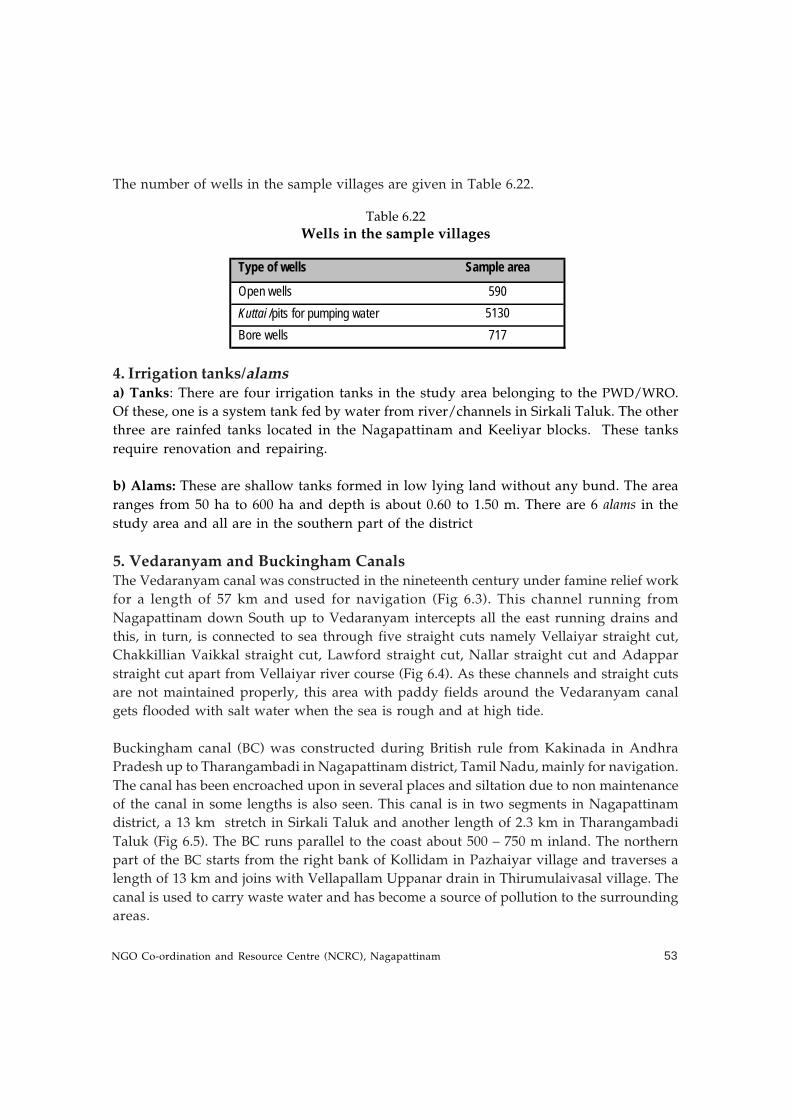
NGO Co-ordination and Resource Centre (NCRC), Nagapattinam 53
Table 6.22
Wells in the sample villages
The number of wells in the sample villages are given in Table 6.22.
4. Irrigation tanks/alamsa) Tanks: There are four irrigation tanks in the study area belonging to the PWD/WRO.
Of these, one is a system tank fed by water from river/channels in Sirkali Taluk. The other
three are rainfed tanks located in the Nagapattinam and Keeliyar blocks. These tanks
require renovation and repairing.
b) Alams: These are shallow tanks formed in low lying land without any bund. The area
ranges from 50 ha to 600 ha and depth is about 0.60 to 1.50 m. There are 6 alams in the
study area and all are in the southern part of the district
5. Vedaranyam and Buckingham CanalsThe Vedaranyam canal was constructed in the nineteenth century under famine relief work
for a length of 57 km and used for navigation (Fig 6.3). This channel running from
Nagapattinam down South up to Vedaranyam intercepts all the east running drains and
this, in turn, is connected to sea through five straight cuts namely Vellaiyar straight cut,
Chakkillian Vaikkal straight cut, Lawford straight cut, Nallar straight cut and Adappar
straight cut apart from Vellaiyar river course (Fig 6.4). As these channels and straight cuts
are not maintained properly, this area with paddy fields around the Vedaranyam canal
gets flooded with salt water when the sea is rough and at high tide.
Buckingham canal (BC) was constructed during British rule from Kakinada in Andhra
Pradesh up to Tharangambadi in Nagapattinam district, Tamil Nadu, mainly for navigation.
The canal has been encroached upon in several places and siltation due to non maintenance
of the canal in some lengths is also seen. This canal is in two segments in Nagapattinam
district, a 13 km stretch in Sirkali Taluk and another length of 2.3 km in Tharangambadi
Taluk (Fig 6.5). The BC runs parallel to the coast about 500 – 750 m inland. The northern
part of the BC starts from the right bank of Kollidam in Pazhaiyar village and traverses a
length of 13 km and joins with Vellapallam Uppanar drain in Thirumulaivasal village. The
canal is used to carry waste water and has become a source of pollution to the surrounding
areas.
Type of wells Sample area
Open wells 590 Kuttai /pits for pumping water 5130 Bore wells 717
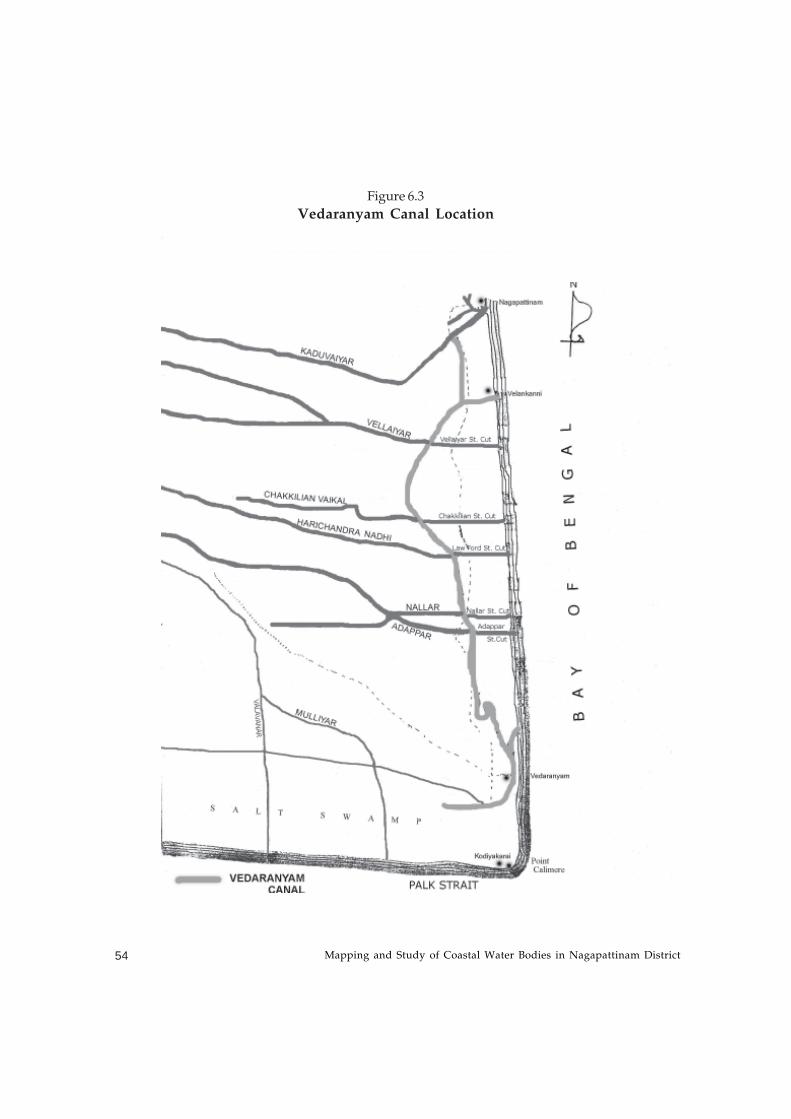
Mapping and Study of Coastal Water Bodies in Nagapattinam District54
Figure 6.3
Vedaranyam Canal Location
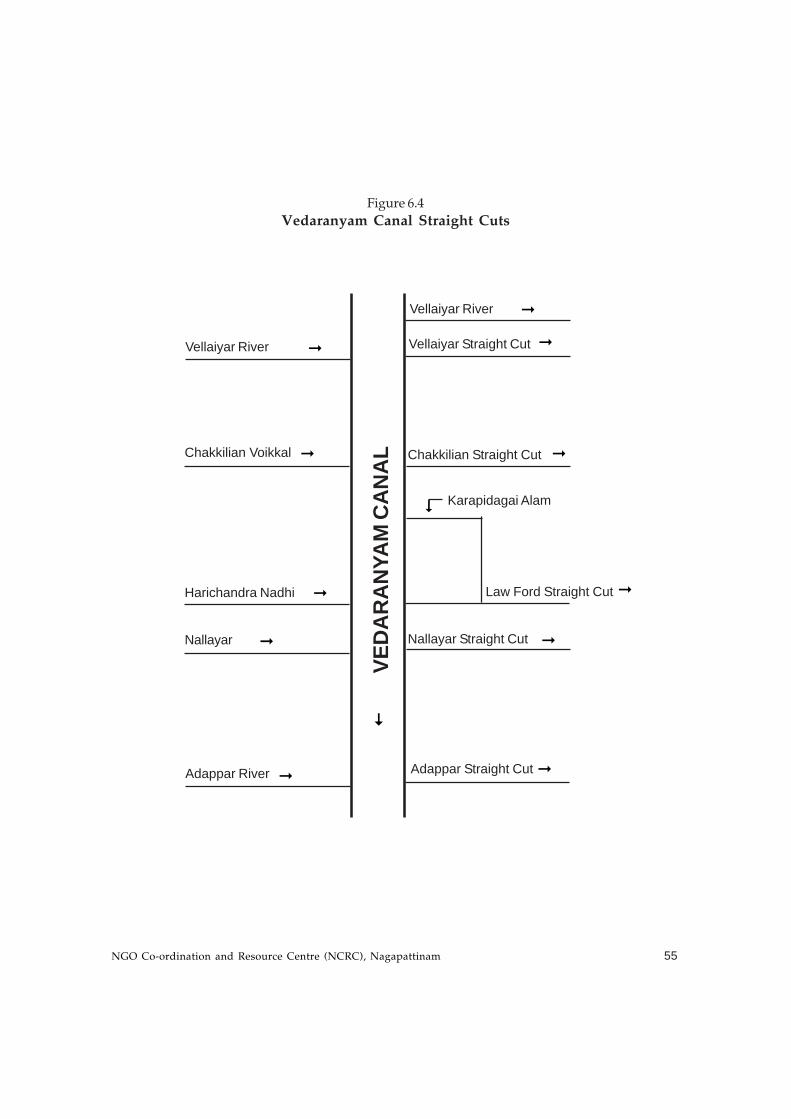
NGO Co-ordination and Resource Centre (NCRC), Nagapattinam 55
Figure 6.4
Vedaranyam Canal Straight Cuts
VED
AR
AN
YAM
CA
NA
L
Vellaiyar Straight CutVellaiyar River
Vellaiyar River
Chakkilian Straight CutChakkilian Voikkal
Adappar River
Harichandra Nadhi
Nallayar
Karapidagai Alam
Law Ford Straight Cut
Nallayar Straight Cut
Adappar Straight Cut
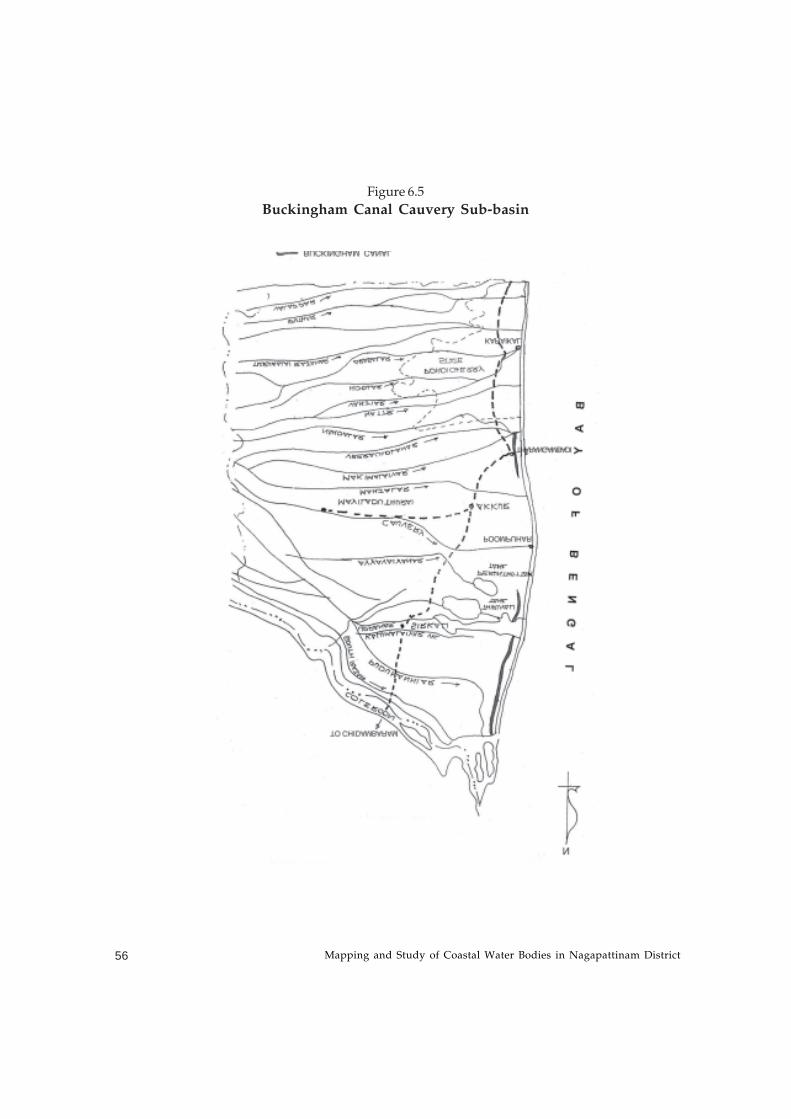
Mapping and Study of Coastal Water Bodies in Nagapattinam District56
Figure 6.5
Buckingham Canal Cauvery Sub-basin
NGO Co-ordination and Resource Centre (NCRC), Nagapattinam 57
There are 14 rivers entering Nagapattinam district from which irrigation channels are drawn
which irrigate about 30,000 Ha of agricultural land before draining into the sea. Tail End
Regulators (TER) are placed at appropriate points of the river, just before which, the river
is channelized into irrigation canals. After the point where the TERs are placed, the river
acts as drainage. The irrigation canal is generally classified as “A” class and the further
sub- divisions classified as “B”, “C” and “D”. Similarly, the drainage system is also classified
as river drain, main drains and sub- drains. The main drains and sub drains are defined
based on the width of the channel for the purpose of this study. Generally, a TER with its
network of irrigation and drainage channels is commonly referred to by the name of the
river on which it is located, for eg., South Rajan TER. There are 14 TERs in the study area
referring to the 14 exclusive irrigation and drainage networks.
TER 1 : South RajanAs is seen by the name, this TER is on the South Rajan River, which enters through Sirkali
Taluk. The network of channels under this TER passes through Mahendrapalli, Kattur,
Semmangadu, Naanal Padugai, Vettathangarai, Rettaikulam, Thaithan, Reghunathapuram
and Nanal padugai before finally draining into the sea. The main revenue villages covered
are Mahendrapalli and Kattur. The Tail End Regulator is placed at Pilpadugai, at a distance
of 2 kms from the confluence with River Coleroon, which runs for 3 km before draining
into the sea. The large numbers of shrimp farms that have come up in this area indicate the
extent of tidal ingress of sea-water. This network of channels is 42.95 kms long, of which,
31.55 kms are for irrigation and 11.4 kms are for drainage.
The irrigation network covers approximately 489 Ha of ayacut and has 12 “A” class and
seven “B” class channels. These channels show some amount of siltation and bund damages.
There is also encroachment in these areas, mainly by the shrimp farms.
Chapter Seven
TER-based Observations and Estimates
Mapping and Study of Coastal Water Bodies in Nagapattinam District58
The drainage network consists of one river drain, two main drains and one sub-drain.
There is considerable siltation and bund damage in these channels. There is also agricultural
encroachment in this area, mainly by the local farmers.
A profiling of the farmers in this area shows 39% of the farmers being dependant on rain-
fed cropping and the rest as having access to surface water irrigation. Of the total, 64% are
marginal farmers, 32% are small farmers and the remaining 4% are medium farmers. There
are no large farmers in this area. An in-depth study of one village in this area identified 10
private ponds and 12 common ponds in this village, apart from the channel running through
this village. However, there were no shallow wells or bore wells seen as being utilized for
agriculture. The major crop cultivated in this village is paddy. Water is available only
during samba season. Although mangoes and cashews are cultivated in other villages of the
same block, this village has only coconuts as its major horticultural crop.
The community, Panchayat and the PWD have jointly desilted the irrigation channel and
repaired the damaged shutters last in 1996. The community stated that damages to the
shutters were due to corrosion and that PWD should restore the old wooden structures
rather than going in for iron shutters. No maintenance work has been done after 1996 and
thereafter they claimed a general lack of interest due to non- availability of water in these
channels. The community also requested that shutters be put in all channels to reduce
salination due to backwaters.
There are no formal water user groups in this area although the community did acknowledge
the need for one. However, they also feel that operation, management, repairs and
maintenance of these were the responsibility of the PWD.
The details of the damages as well as estimates for repair are shown in Table 7.1.
The estimated costs for desilting and repairing the bund damages is estimated to be about
Rs. 90,000 in the agriculture channels and a little over Rs. 2 lakhs in the drainage channels,
totaling to about Rs 3 lakhs as the overall estimate for the complete repairs and maintenance
works. This works out to about Rs. 600/ Ha of ayacut.
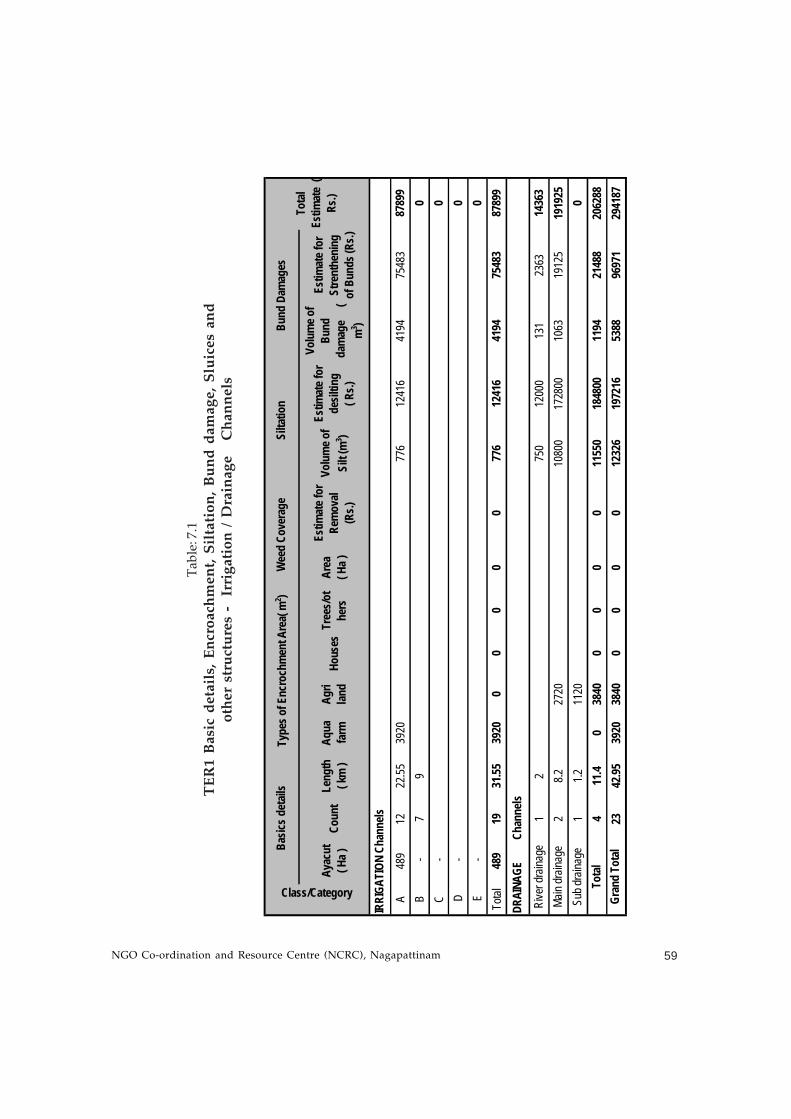
NGO Co-ordination and Resource Centre (NCRC), Nagapattinam 59
Ta
ble
: 7.1
TE
R1
Ba
sic
de
tail
s, E
ncr
oa
chm
en
t, S
ilta
tio
n,
Bu
nd
da
ma
ge
, S
luic
es
an
do
ther
str
uct
ure
s -
Irr
igat
ion
/ D
rain
age
C
han
nel
s
Ayac
ut
( Ha )
Coun
tLe
ngth
( k
m )
Aqua
fa
rmAg
ri lan
dHo
uses
Tree
s/ot
hers
Area
( H
a )
Estim
ate f
or
Rem
oval
(R
s.)
Volu
me o
f Si
lt (m
3 )
Estim
ate f
or
desil
ting
( R
s.)
Volu
me o
f Bu
nd
dam
age
(
m3 )
Estim
ate f
or
Stre
nthe
ning
of
Bun
ds (R
s.)
A48
912
22.55
3920
776
1241
641
9475
483
8789
9B
-7
90
C -
0 D
-0
E -
0To
tal48
919
31.55
3920
00
00
077
612
416
4194
7548
387
899
12
750
1200
013
123
6314
363
28.2
2720
1080
017
2800
1063
1912
519
1925
11.2
1120
04
11.4
038
400
00
011
550
1848
0011
9421
488
2062
8823
42.95
3920
3840
00
00
1232
619
7216
5388
9697
129
4187
IRRI
GATI
ON C
hann
els
DRAI
NAGE
Chan
nels
Gran
d To
tal
Rive
r dra
inage
Main
drain
age
Sub d
raina
geTo
tal
Bund
Dam
ages
Tota
l Es
timat
e (
Rs.)
Class/Category
Basic
s det
ails
Type
s of E
ncro
chm
ent A
rea(
m2 )
Wee
d Co
vera
geSi
ltatio
n
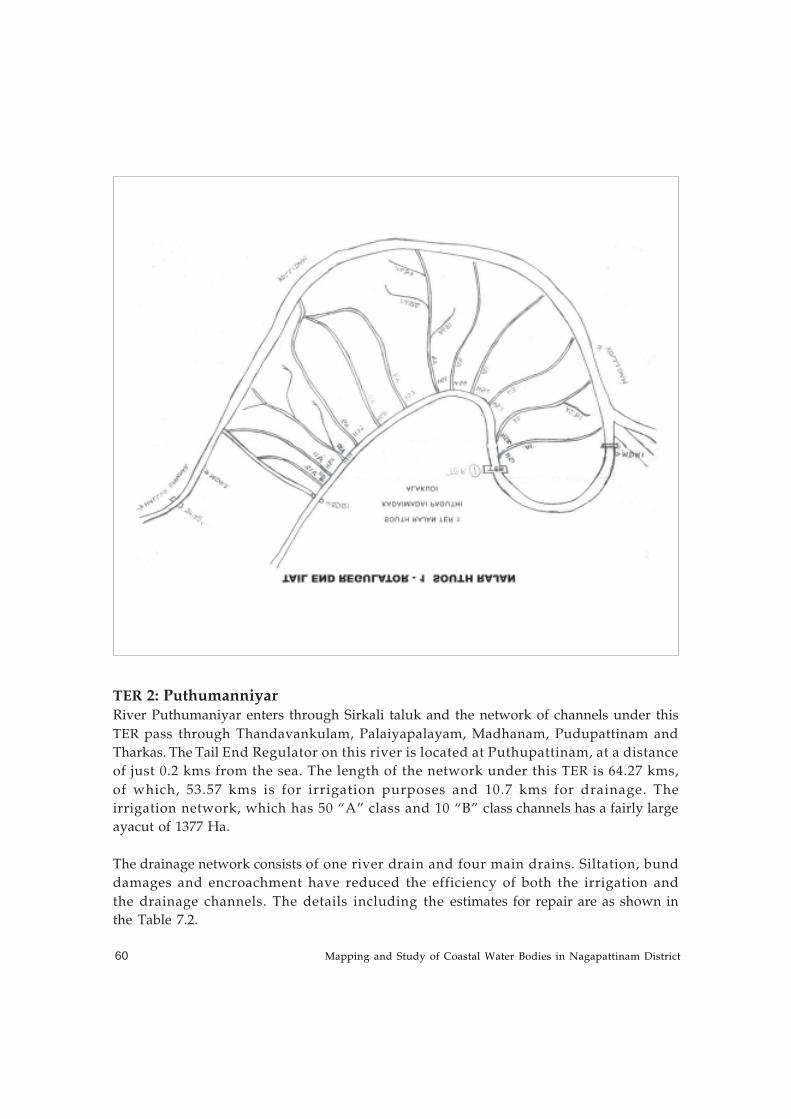
Mapping and Study of Coastal Water Bodies in Nagapattinam District60
TER 2: PuthumanniyarRiver Puthumaniyar enters through Sirkali taluk and the network of channels under this
TER pass through Thandavankulam, Palaiyapalayam, Madhanam, Pudupattinam and
Tharkas. The Tail End Regulator on this river is located at Puthupattinam, at a distance
of just 0.2 kms from the sea. The length of the network under this TER is 64.27 kms,
of which, 53.57 kms is for irrigation purposes and 10.7 kms for drainage. The
irrigation network, which has 50 “A” class and 10 “B” class channels has a fairly large
ayacut of 1377 Ha.
The drainage network consists of one river drain and four main drains. Siltation, bund
damages and encroachment have reduced the efficiency of both the irrigation and
the drainage channels. The details including the estimates for repair are as shown in
the Table 7.2.
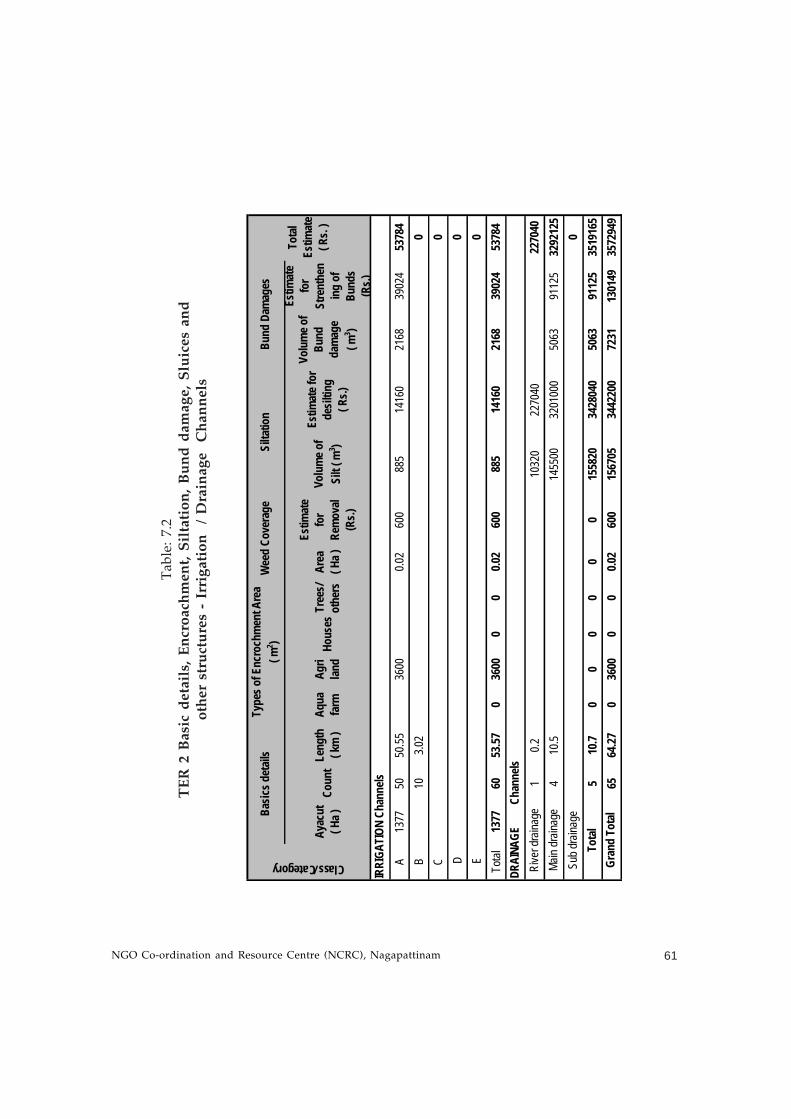
NGO Co-ordination and Resource Centre (NCRC), Nagapattinam 61
Ta
ble
: 7
.2
TE
R 2
Ba
sic
de
tail
s, E
ncr
oa
chm
en
t, S
ilta
tio
n,
Bu
nd
da
ma
ge
, S
luic
es
an
do
ther
str
uct
ure
s -
Irri
gat
ion
/
Dra
inag
e C
han
nel
s
Ayac
ut
( Ha )
Coun
tLe
ngth
( k
m )
Aqua
fa
rmAg
ri lan
dHo
uses
Tree
s/ot
hers
Area
( H
a )
Estim
ate
for
Rem
oval
(Rs.)
Volu
me o
f Si
lt ( m
3 )
Estim
ate f
or
desil
ting
( R
s.)
Volu
me o
f Bu
nd
dam
age
( m
3 )
Estim
ate
for
Stre
nthe
nin
g of
Bu
nds
(Rs.)
A13
7750
50.55
3600
0.02
600
885
1416
021
6839
024
5378
4B
103.0
20
C0
D0
E0
Total
1377
6053
.570
3600
00
0.02
600
885
1416
021
6839
024
5378
4
10.2
1032
022
7040
2270
404
10.5
1455
0032
0100
050
6391
125
3292
125
05
10.7
00
00
00
1558
2034
2804
050
6391
125
3519
165
6564
.270
3600
00
0.02
600
1567
0534
4220
072
3113
0149
3572
949
DRAI
NAGE
Chan
nels
Gran
d To
tal
Rive
r dra
inage
Main
drain
age
Sub d
raina
geTo
tal
Tota
l Es
timat
e ( R
s. )
IRRI
GATI
ON C
hann
els
Bund
Dam
ages
Class/CategoryBa
sics d
etail
sTy
pes o
f Enc
roch
men
t Are
a
( m2 )
Wee
d Co
vera
geSi
ltatio
n
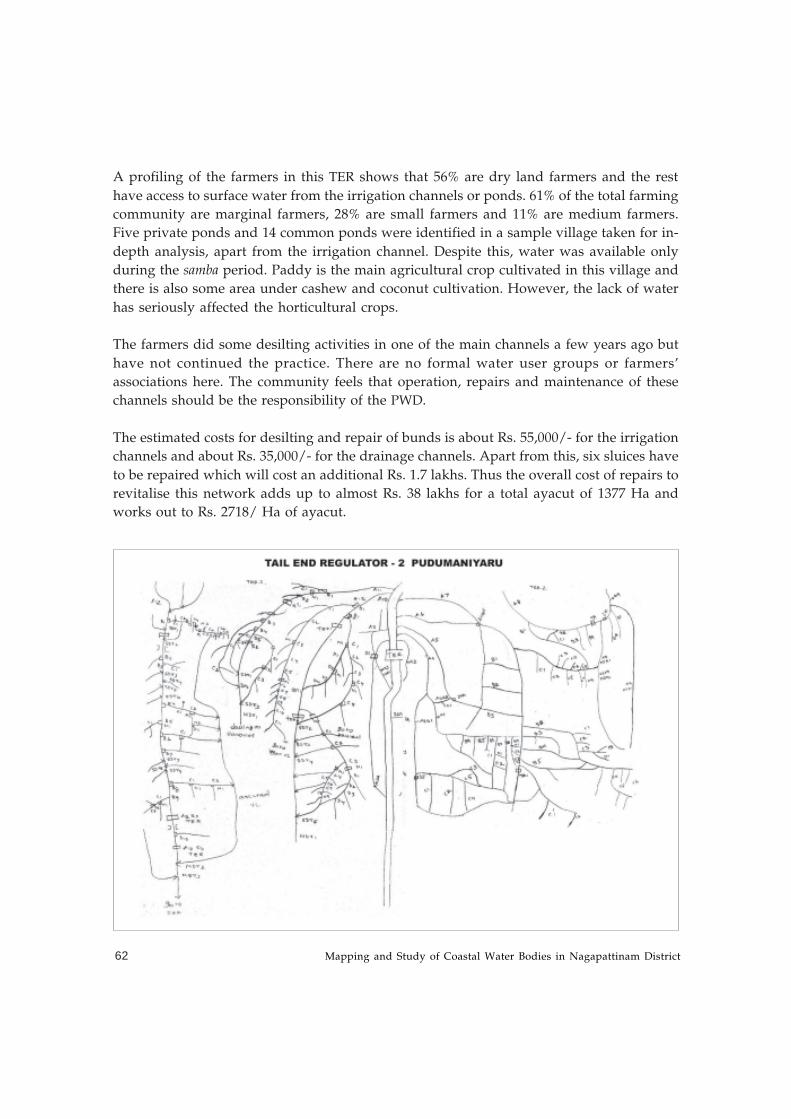
Mapping and Study of Coastal Water Bodies in Nagapattinam District62
A profiling of the farmers in this TER shows that 56% are dry land farmers and the rest
have access to surface water from the irrigation channels or ponds. 61% of the total farming
community are marginal farmers, 28% are small farmers and 11% are medium farmers.
Five private ponds and 14 common ponds were identified in a sample village taken for in-
depth analysis, apart from the irrigation channel. Despite this, water was available only
during the samba period. Paddy is the main agricultural crop cultivated in this village and
there is also some area under cashew and coconut cultivation. However, the lack of water
has seriously affected the horticultural crops.
The farmers did some desilting activities in one of the main channels a few years ago but
have not continued the practice. There are no formal water user groups or farmers’
associations here. The community feels that operation, repairs and maintenance of these
channels should be the responsibility of the PWD.
The estimated costs for desilting and repair of bunds is about Rs. 55,000/- for the irrigation
channels and about Rs. 35,000/- for the drainage channels. Apart from this, six sluices have
to be repaired which will cost an additional Rs. 1.7 lakhs. Thus the overall cost of repairs to
revitalise this network adds up to almost Rs. 38 lakhs for a total ayacut of 1377 Ha and
works out to Rs. 2718/ Ha of ayacut.
NGO Co-ordination and Resource Centre (NCRC), Nagapattinam 63
TER 3: CauveryRiver Cauvery enters through Sirkali taluk and passes through Ayyanarkoil, Kidayakattalai,
Samba Katalai Theru, Melaiyur, Palaiyagaram, Veerameturuppu, Dharmakulam,
Manigramam, Neithavasal, Pudukuppam, Thiruvenkadu, Mandakarai, Maanthankadu,
Yerampalayam, Melaperumpallam, Keelaperumpallam, Vanagiri, Nettaveli, Maruthampallam,
Kidangal, Mamakudi, Chidambarampakkam and Seethambadi. With a length of 233 kms,
this is the longest network of irrigation and drainage channels in the district. Of this, 201
kms comes under irrigation and 32 kms under drainage. This is the fourth largest TER in
terms of ayacut area covered, with a total ayacut area of 3243 Ha. The Tail End Regulator
is placed at Melaiyur, which is 5.8 kms away from the sea.
The distance of the placement of the regulator from the sea has resulted in ingress of sea-
water during high tides through the drainage channels. Shrimp farms have come up in this
area due to the easy access to the seawater through these channels and the bunds have
been deliberately damaged at many points for easy access to this water. About 5080 m2 of
land has been encroached within the channel area for shrimp farming.
The irrigation channels have 19 “A” class, 50 “B” class, 86 “C” class and 14 “D” class channels
of which heavy siltation is seen in “A” class channels and bund damages in “B” class channels.
“C” class channels also show some siltation but no bund damages in the irrigation network.
There are also 18 sluices in “A” and 4 sluices in “B” channels that require repairs.
The 32 km long drainage channels include one river drain, seven main drains and 21
sub- drains. Despite being only 16% of the total system, the volume of damages is
almost 10 times that of the irrigation network. The details of the damages are as given in
the Table 7.3.
Of the total farming community, only about 17.6% of the farmers fully depend on the rain
fed farming. All the rest have access to surface water sources, though only seasonally. 64%
of the farmers are marginal farmers, 30% are small, 5% are medium and about 1% are large
farmers. There are seven irrigation/drainage channels running through this area and hence,
dependence on ponds seems to be much lower. A study of three villages in this area showed
the presence of a total of seven private ponds and five borewells. Paddy is the major
agriculture crop in this area. There is also horticulture with coconut, mango and vegetable
cultivation. Water, from all sources, was available only during samba.
The community and the Panchayat have, together, desilted and repaired the bunds at
Melayur, Vanagiri and Thenampattinam. Shutters have also been repaired in all three places
and notches have been repaired in Thenampattinam where the Panchayat has also desilted
the common ponds. Post-tsunami, some of the NGOs have also supported the desilting of
some of the channels. However, all three villages studied said that they require further
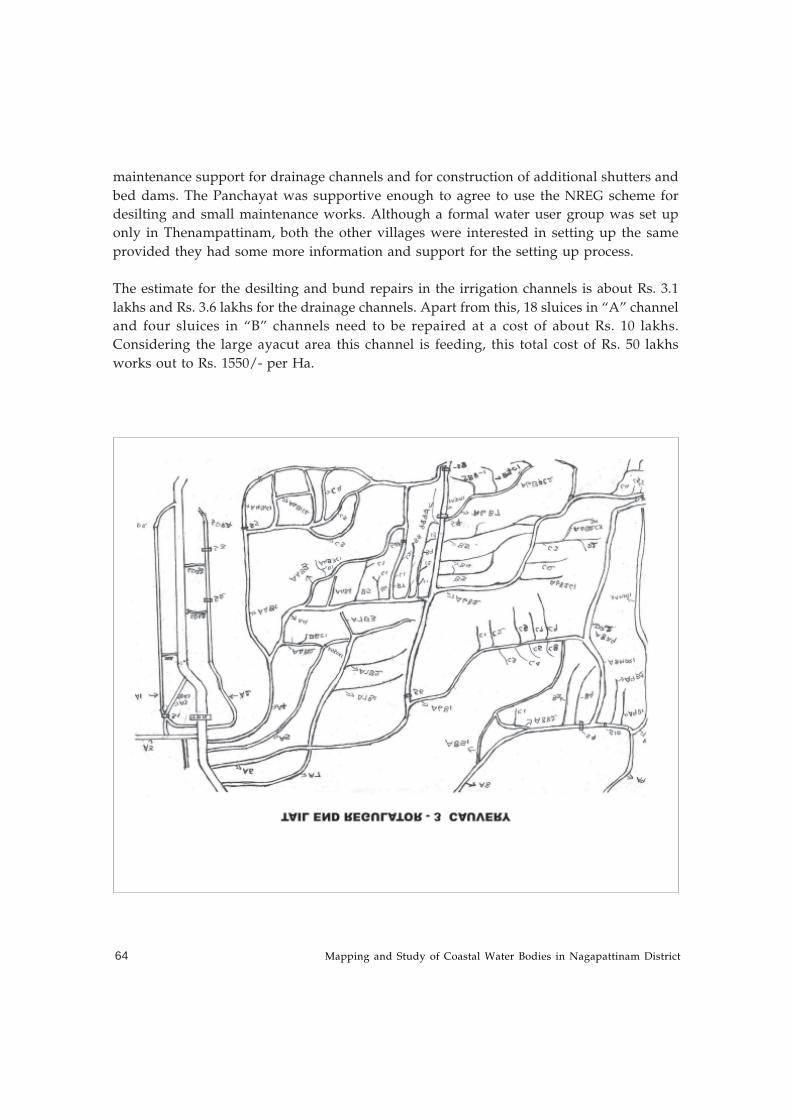
Mapping and Study of Coastal Water Bodies in Nagapattinam District64
maintenance support for drainage channels and for construction of additional shutters and
bed dams. The Panchayat was supportive enough to agree to use the NREG scheme for
desilting and small maintenance works. Although a formal water user group was set up
only in Thenampattinam, both the other villages were interested in setting up the same
provided they had some more information and support for the setting up process.
The estimate for the desilting and bund repairs in the irrigation channels is about Rs. 3.1
lakhs and Rs. 3.6 lakhs for the drainage channels. Apart from this, 18 sluices in “A” channel
and four sluices in “B” channels need to be repaired at a cost of about Rs. 10 lakhs.
Considering the large ayacut area this channel is feeding, this total cost of Rs. 50 lakhs
works out to Rs. 1550/- per Ha.
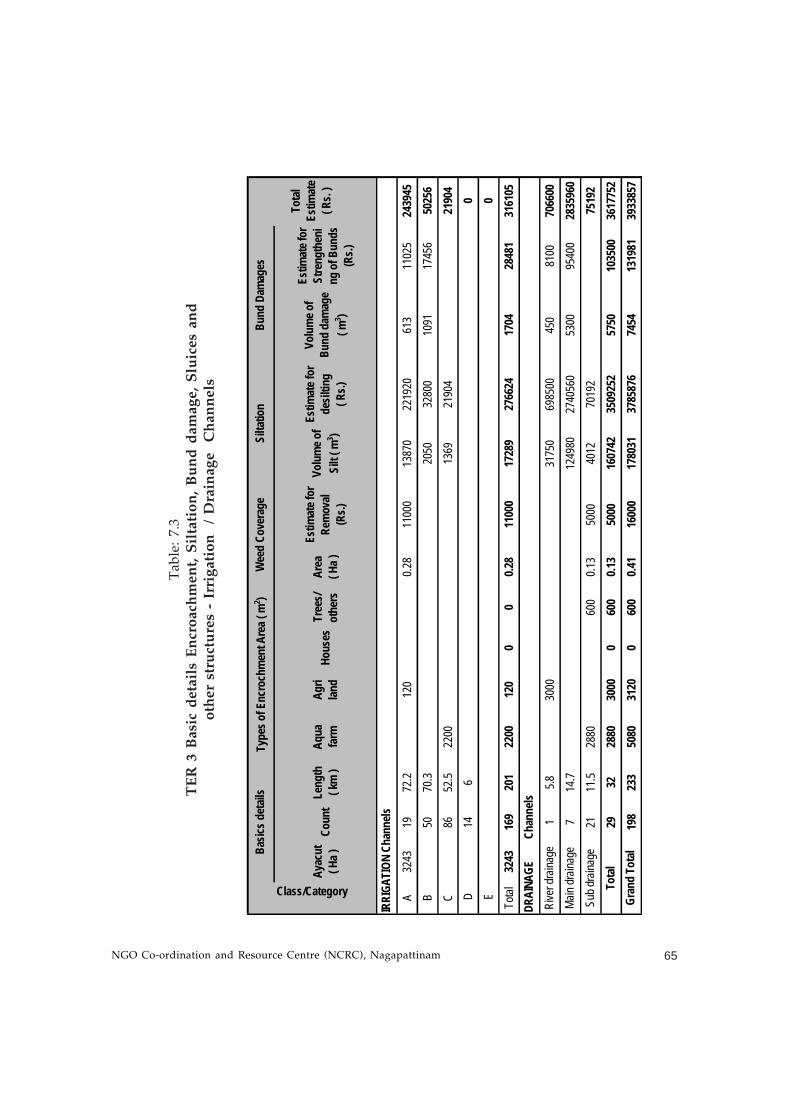
NGO Co-ordination and Resource Centre (NCRC), Nagapattinam 65
Ta
ble
: 7
.3
TE
R 3
Ba
sic
de
tail
s E
ncr
oa
chm
en
t, S
ilta
tio
n,
Bu
nd
da
ma
ge
, S
luic
es
an
do
ther
str
uct
ure
s -
Irri
gat
ion
/
Dra
inag
e C
han
nel
s
Ayac
ut
( Ha )
Coun
tLe
ngth
( k
m )
Aqua
fa
rmAg
ri lan
dHo
uses
Tree
s/ ot
hers
Area
( H
a )
Estim
ate f
or
Rem
oval
(R
s.)
Volu
me o
f Si
lt ( m
3 )
Estim
ate f
or
desil
ting
( R
s.)
Volu
me o
f Bu
nd d
amag
e ( m
3 )
Estim
ate f
or
Stre
ngth
eni
ng o
f Bun
ds
(Rs.)
A32
4319
72.2
120
0.28
1100
013
870
2219
2061
311
025
2439
45B
5070
.320
5032
800
1091
1745
650
256
C86
52.5
2200
1369
2190
421
904
D14
60
E0
Total
3243
169
201
2200
120
00
0.28
1100
017
289
2766
2417
0428
481
3161
05
15.8
3000
3175
069
8500
450
8100
7066
007
14.7
1249
8027
4056
053
0095
400
2835
960
2111
.528
8060
00.1
350
0040
1270
192
7519
229
3228
8030
000
600
0.13
5000
1607
4235
0925
257
5010
3500
3617
752
198
233
5080
3120
060
00.4
116
000
1780
3137
8587
674
5413
1981
3933
857
IRRI
GATI
ON C
hann
els
DRAI
NAGE
Chan
nels
Basic
s det
ails
Type
s of E
ncro
chm
ent A
rea (
m2 )
Wee
d Co
vera
geSi
ltatio
n
Gran
d To
tal
Rive
r dra
inage
Main
drain
age
Sub d
raina
geTo
tal
Bund
Dam
ages
Tota
l Es
timat
e ( R
s. )
Class/Category
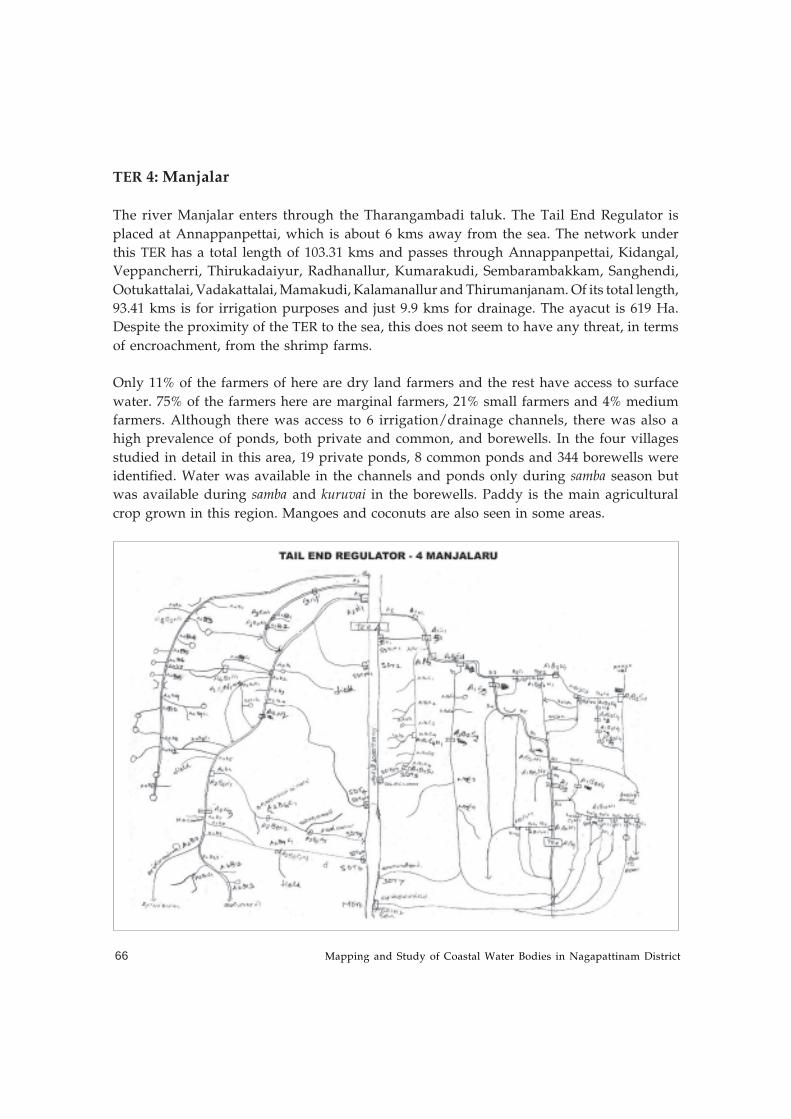
Mapping and Study of Coastal Water Bodies in Nagapattinam District66
TER 4: Manjalar
The river Manjalar enters through the Tharangambadi taluk. The Tail End Regulator is
placed at Annappanpettai, which is about 6 kms away from the sea. The network under
this TER has a total length of 103.31 kms and passes through Annappanpettai, Kidangal,
Veppancherri, Thirukadaiyur, Radhanallur, Kumarakudi, Sembarambakkam, Sanghendi,
Ootukattalai, Vadakattalai, Mamakudi, Kalamanallur and Thirumanjanam. Of its total length,
93.41 kms is for irrigation purposes and just 9.9 kms for drainage. The ayacut is 619 Ha.
Despite the proximity of the TER to the sea, this does not seem to have any threat, in terms
of encroachment, from the shrimp farms.
Only 11% of the farmers of here are dry land farmers and the rest have access to surface
water. 75% of the farmers here are marginal farmers, 21% small farmers and 4% medium
farmers. Although there was access to 6 irrigation/drainage channels, there was also a
high prevalence of ponds, both private and common, and borewells. In the four villages
studied in detail in this area, 19 private ponds, 8 common ponds and 344 borewells were
identified. Water was available in the channels and ponds only during samba season but
was available during samba and kuruvai in the borewells. Paddy is the main agricultural
crop grown in this region. Mangoes and coconuts are also seen in some areas.
NGO Co-ordination and Resource Centre (NCRC), Nagapattinam 67
The irrigation channels include four “A”class channels, 39 “B” class channels, 35 “C” class
channels and six “D” class channels. Similarly, the 9.9 km long drainage channels include
one river drain, one main drain and seven sub-drains. Although the bund damages are not
very high, siltation is quite high in both the irrigation and the drainage channels. There are
other structures also, like the sluices and the notches that require repairs.
Although there are no formal farmer groups or water user groups, the community, along
with the Panchayat and the NGOs desilted “C” and “D” class channels as well as the affected
ponds in 2005. Clearing the irrigation and drainage channels of weeds was another activity
taken up regularly even pre-tsunami. The community stated their need for an additional
regulator one km away from the sea and new bed dams on Manjalar. Almost all the
panchayats, within the area of this network, were interested in sustainable interventions
for maintenance of these structures and were willing to use the NREG and other similar
schemes for regular maintenance works.
The estimate for desilting of irrigation and drainage channels in this TER is over Rs. 8 lakhs
of which, only 10% of it is towards desilting the irrigation network. The bund repairs, for
both together, are estimated at about Rs. 1.3 lakhs. Apart from this, the repair to the other
structures is estimated at Rs. 35,000/- bringing the total budget for this TER to a little short
of Rs. 10 lakhs, which works out to Rs. 1606/ Ha. The details of damages as well as repair
cost estimates are shown in Table 7.4.
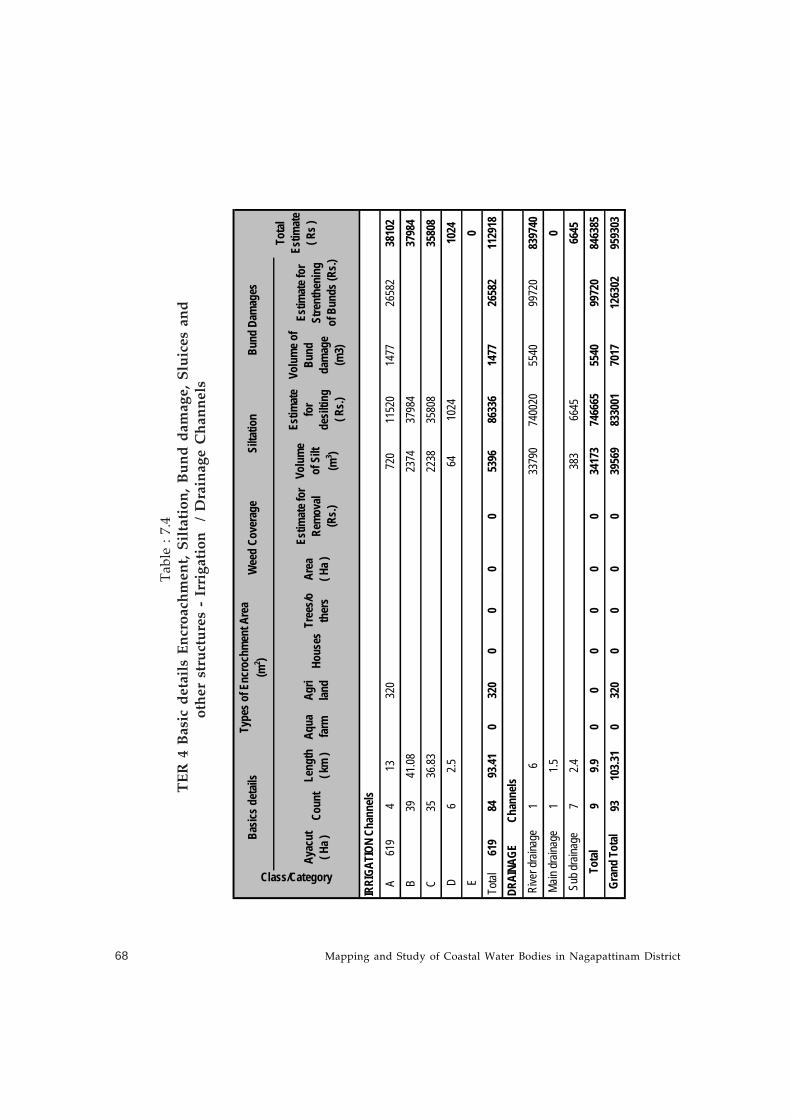
Mapping and Study of Coastal Water Bodies in Nagapattinam District68
Ta
ble
: 7
.4
TE
R 4
Ba
sic
de
tail
s E
ncr
oa
chm
en
t, S
ilta
tio
n,
Bu
nd
da
ma
ge
, S
luic
es
an
do
ther
str
uct
ure
s -
Irri
gat
ion
/
Dra
inag
e C
han
nel
s
Ayac
ut
( Ha )
Coun
tLe
ngth
( k
m )
Aqua
fa
rmAg
ri lan
dHo
uses
Tree
s/oth
ers
Area
( H
a )
Estim
ate f
or
Rem
oval
(R
s.)
Volu
me
of S
ilt
(m3 )
Estim
ate
for
desil
ting
( R
s.)
Volu
me o
f Bu
nd
dam
age
(m3)
Estim
ate f
or
Stre
nthe
ning
of
Bun
ds (R
s.)
A61
94
1332
072
011
520
1477
2658
238
102
B39
41.08
2374
3798
437
984
C35
36.83
2238
3580
835
808
D6
2.564
1024
1024
E0
Total
619
8493
.410
320
00
00
5396
8633
614
7726
582
1129
18
16
3379
074
0020
5540
9972
083
9740
11.5
07
2.438
366
4566
459
9.90
00
00
034
173
7466
6555
4099
720
8463
8593
103.3
10
320
00
00
3956
983
3001
7017
1263
0295
9303
IRRI
GATI
ON C
hann
els
DRAI
NAGE
Chan
nels
Gran
d To
tal
Rive
r dra
inage
Main
drain
age
Sub d
raina
geTo
tal
Tota
l Es
timat
e ( R
s )
Bund
Dam
ages
Class/Category
Basic
s det
ails
Type
s of E
ncro
chm
ent A
rea
(m2 )
Wee
d Co
vera
geSi
ltatio
n

NGO Co-ordination and Resource Centre (NCRC), Nagapattinam 69
TER 5: MahimalaiyarRiver Mahimalaiyar passes through Anandamanagalam, Olugaimangalam, Kattanchavadi,
Kannappamoolai, Manickapangu, Kuttiyandiyur, Velipalayam, Perumalkattalai, Anaikoil,
Erukattancheri and Tharangambadi. The Tail End Regulator is placed at Kannapamoolai, a
mere one kilometre away from the sea. The network under this TER is about 96 kms of
which, 83.95 kms falls under irrigation and 12 kms falls under drainage. This covers a total
ayacut area of 1344 ha.
Mapping and Study of Coastal Water Bodies in Nagapattinam District70
The irrigation channels consist of two “A” class, 39 “B” class, 45 “C” class and nine “D”
class channels. The drainage channels include one river drain, four main drains and eight
sub-drains.
There is a high level of siltation in both the irrigation and the drainage systems with a
lesser level of damage to the bunds. As is the case with the other TERs, the damages are
much lesser in the irrigation network than in the drainage network. While there is only a
10,285 m3 of siltation in irrigation channels, it is 82,575 m3 in the drainage channels. Damage
to the bunds is only 192 m3 of irrigation channels while it is 49,018 m3 in the drainage
channels.
An in- depth study of one of the villages in this TER showed that only 8% of the farmers
were fully dependant on rain fed farming. All others had access to surface water and/ or
ground water. There were four private ponds, four common ponds, two irrigation/ drainage
channels and six borewells available in this one village. Some of the ponds and the borewells
provided water both during samba and kuruvai seasons. Paddy was the main crop and there
were also horticultural crops like mangoes and coconut, and flower cultivation was also
practiced.
The community, with the Panchayat, have desilted and repaired bunds in some of the
channels. However, both were very interested in a complete survey of the channels and
increasing the width wherever felt necessary. They also requested for the strengthening of
bunds. Although there is no formal water user group, both the Panchayat and the community
were interested in starting a functional group to maintain these structures.
The desilting of the irrigation channels is estimated to cost almost Rs.2 lakhs and almost
Rs.16 lakhs for the drainage channels. Including the repairs of other structures, the total
estimate for TER 5 is about Rs. 27.8 lakhs which works out to be Rs. Rs. 2070/ Ha of ayacut
area. The details of damages as well as repair estimates are given in Table 7.5.
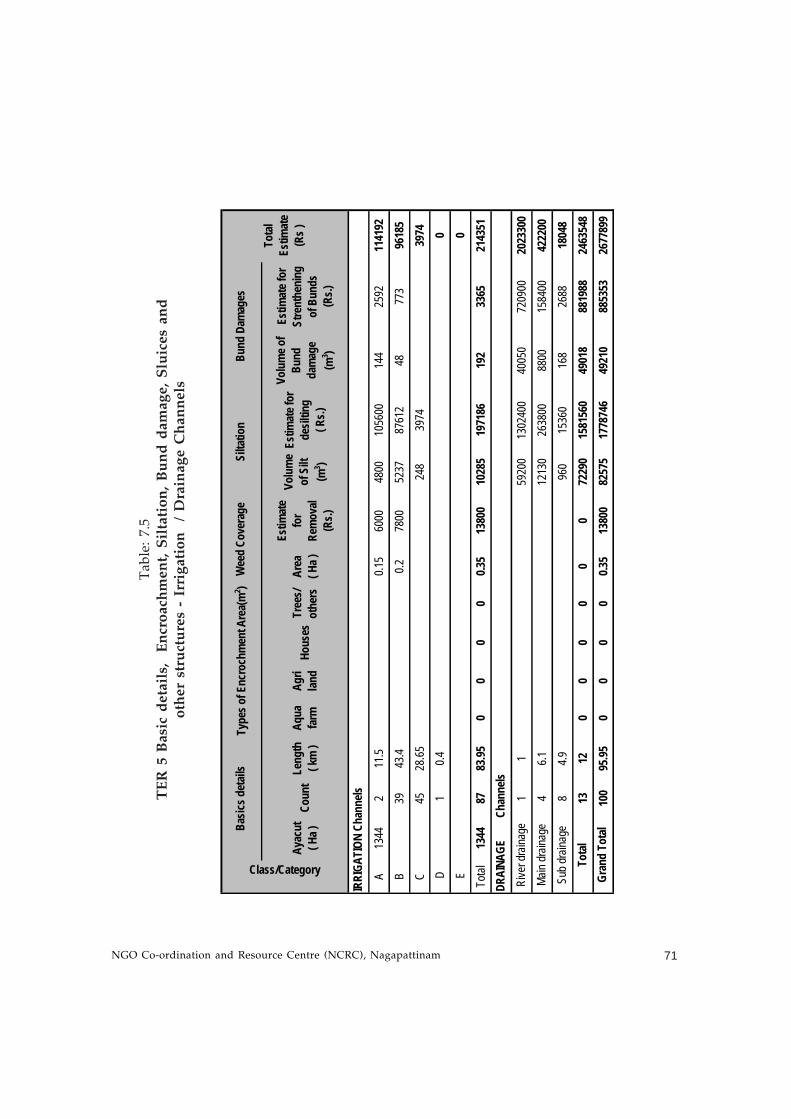
NGO Co-ordination and Resource Centre (NCRC), Nagapattinam 71
Ta
ble
: 7
.5
TE
R 5
Ba
sic
de
tail
s,
En
cro
ach
me
nt,
Sil
tati
on
, B
un
d d
am
ag
e,
Slu
ice
s a
nd
oth
er s
tru
ctu
res
- Ir
rig
atio
n
/ D
rain
age
Ch
ann
els
Ayac
ut
( Ha )
Coun
tLe
ngth
( k
m )
Aqua
fa
rmAg
ri lan
dHo
uses
Tree
s/ot
hers
Area
( H
a )
Estim
ate
for
Rem
oval
(R
s.)
Volu
me
of S
ilt
(m3 )
Estim
ate f
or
desil
ting
( R
s.)
Volu
me o
f Bu
nd
dam
age
(m3 )
Estim
ate f
or
Stre
nthe
ning
of
Bun
ds
(Rs.)
A13
442
11.5
0.15
6000
4800
1056
0014
425
9211
4192
B39
43.4
0.278
0052
3787
612
4877
396
185
C45
28.65
248
3974
3974
D1
0.40
E0
Total
1344
8783
.950
00
00.3
513
800
1028
519
7186
192
3365
2143
51
11
5920
013
0240
040
050
7209
0020
2330
04
6.112
130
2638
0088
0015
8400
4222
008
4.996
015
360
168
2688
1804
813
120
00
00
072
290
1581
560
4901
888
1988
2463
548
100
95.95
00
00
0.35
1380
082
575
1778
746
4921
088
5353
2677
899
IRRI
GATI
ON C
hann
els
DRAI
NAGE
Chan
nels
Basic
s det
ails
Type
s of E
ncro
chm
ent A
rea(
m2 )
Wee
d Co
vera
geSi
ltatio
n
Gran
d To
tal
Rive
r dra
inage
Main
drain
age
Sub d
raina
geTo
tal
Bund
Dam
ages
Tota
l Es
timat
e (R
s )
Class/Category
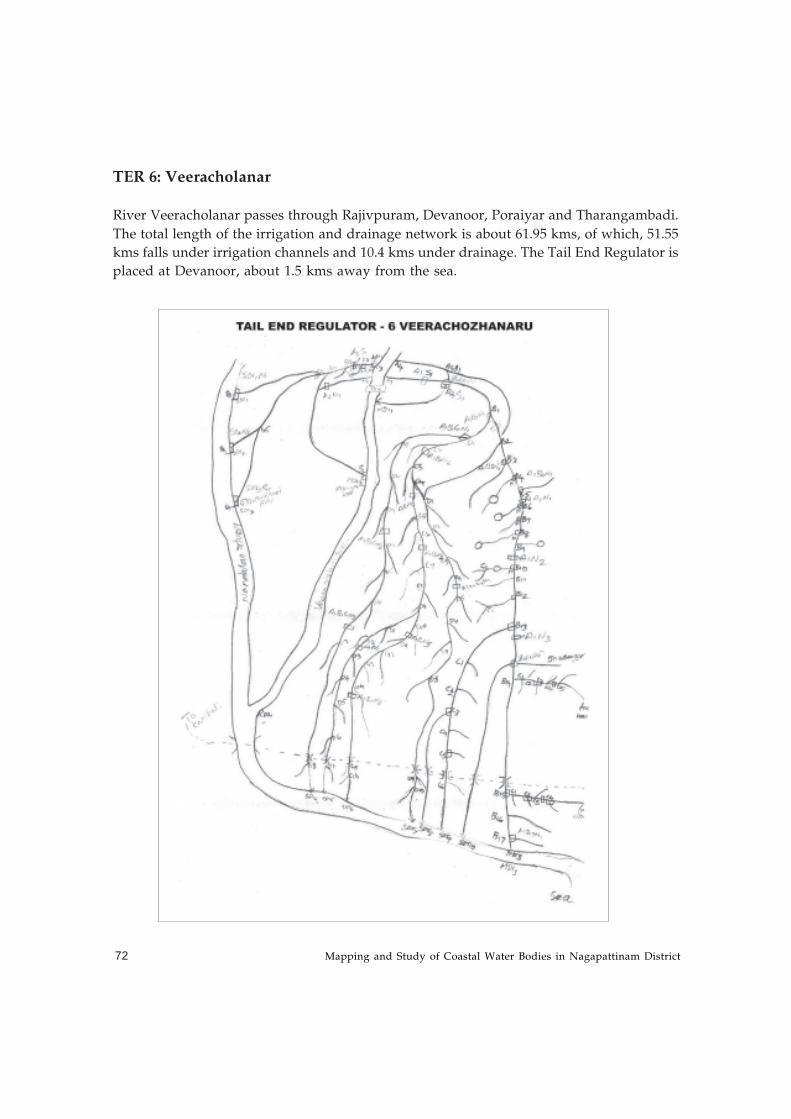
Mapping and Study of Coastal Water Bodies in Nagapattinam District72
TER 6: Veeracholanar
River Veeracholanar passes through Rajivpuram, Devanoor, Poraiyar and Tharangambadi.
The total length of the irrigation and drainage network is about 61.95 kms, of which, 51.55
kms falls under irrigation channels and 10.4 kms under drainage. The Tail End Regulator is
placed at Devanoor, about 1.5 kms away from the sea.
NGO Co-ordination and Resource Centre (NCRC), Nagapattinam 73
The irrigation network consists of four “A” class, 22 “B” class, 33 “C” class and 25 “D” class
channels and the ayacut area is 391 ha. The drainage channels include one river drainage,
three main drainages and ten sub-drainages.
A profile of the villages surveyed under this TER showed that only 10% of the farmers
were totally dependant on rain fed farming. The others had access to some source of
water- either surface water or groundwater. 82% of the farmers were marginal farmers,
16% were small farmers and less than 2 % were medium farmers. There were no large
farmers in this area.
There is some siltation in both the types of channels, predictably the siltation in the drainage
channel being about 22 times that of the irrigation channel (1832 m3 in irrigation and 23371
m3 in drainage). However, the bunds of the river drainage are badly affected.
Although there are no formal water user groups here, the community and the Panchayat
have jointly carried out some desilting and weed clearing work in the “B”, “C” and
“D” channels. However, the bunds, made of sand are weak and need revetment,
which they expect the government/ PWD to provide. The community is also desirous
of having Buckingham Canal desilted and strengthened as they say that is a major source
of flooding.
The desilting in the irrigation and the drainage channels together is estimated to cost
about Rs. 13. 6 lakhs. Including the repairs of the other structures, the total estimate for
rejuvenating this TER is about Rs. 15 lakhs which works out to Rs. 3874/ ha of ayacut area.
The detailed estimates are given in Table 7.6.
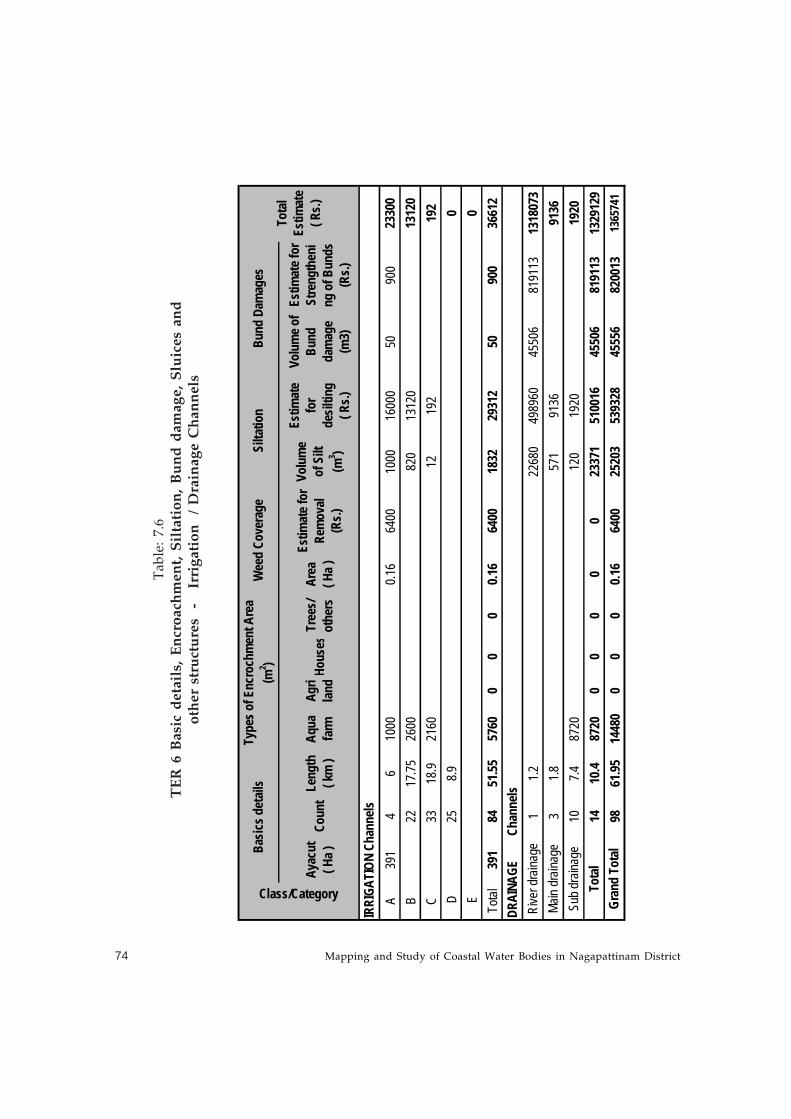
Mapping and Study of Coastal Water Bodies in Nagapattinam District74
Ta
ble
: 7
.6
TE
R 6
Ba
sic
de
tail
s, E
ncr
oa
chm
en
t, S
ilta
tio
n,
Bu
nd
da
ma
ge
, S
luic
es
an
do
ther
str
uct
ure
s -
I
rrig
atio
n
/ D
rain
age
Ch
ann
els
Ayac
ut
( Ha )
Coun
tLe
ngth
( k
m )
Aqua
fa
rmAg
ri lan
dHo
uses
Tree
s/ ot
hers
Area
( H
a )
Estim
ate f
or
Rem
oval
(R
s.)
Volu
me
of S
ilt
(m3 )
Estim
ate
for
desil
ting
( R
s.)
Volu
me o
f Bu
nd
dam
age
(m3)
Estim
ate f
or
Stre
ngth
eni
ng o
f Bun
ds
(Rs.)
A39
14
610
000.
1664
0010
0016
000
5090
023
300
B22
17.75
2600
820
1312
013
120
C33
18.9
2160
1219
219
2 D
258.9
0 E
0To
tal39
184
51.55
5760
00
00.1
664
0018
3229
312
5090
036
612
11.2
2268
049
8960
4550
681
9113
1318
073
31.8
571
9136
9136
107.4
8720
120
1920
1920
1410
.487
200
00
00
2337
151
0016
4550
681
9113
1329
129
9861
.9514
480
00
00.1
664
0025
203
5393
2845
556
8200
1313
6574
1
IRRI
GATI
ON C
hann
els
DRAI
NAGE
Chan
nels
Gran
d To
tal
Rive
r dra
inage
Main
drain
age
Sub d
raina
geTo
tal
Tota
l Es
timat
e ( R
s.)
Bund
Dam
ages
Class/Category
Basic
s det
ails
Type
s of E
ncro
chm
ent A
rea
(m2 )
Wee
d Co
vera
geSi
ltatio
n
NGO Co-ordination and Resource Centre (NCRC), Nagapattinam 75
TER 7: VettarThe River Vettar enters through Nagapattinam taluk and the network of channels under
this TER passes through Elankadambanoor, Mudikondan, Perunkadambanoor, Palaiyur,
Vadapathi, Vairavanirruppu, Palakad, Vadakudi, Sellur, Keelapaliyur, Odacherry,
Theethumattal, Ellumkadambanur, Palur, Theethampattai, Thenkarai, Vankaramavadi,
Melaveli, Thetti, Elusiam, Velipalayam,Karumarangudi, Puliyur, Keelapuliyur, Poothangudi,
Amoor, Orugudy, Villampakkam, Okur, Narimanam, Muttam, Poolangudi, Thennangudi,
Vadagudi, Kottur, Villampakkam and Sirunankai. At 184.16 kms, this is the second longest
network of irrigation and drainage channels in the district. This covers a total ayacut area
of 1830 Ha. The Tail End Regulator is sited in Odacherry, which is 22 kms from the sea, the
farthest inland TER among all 14 TERs.
The irrigation channels which add up to 111.92 kms, consists of one “A” class, 8 “B” class,
29 “C” class 37 “D” class and 7 “E” class channels. The drainage channels, 72.24 kms long in
all, consist of one river drain, 17 main drains and 35 sub- drains.
The profile of the farming community showed that only 6% of the farmers were totally
dependant on rain fed farming. 65% of the farmers were marginal farmers, 23% small
farmers, 10% medium farmers and barely 2% were large farmers. An in- depth study of
four villages in this TER showed a high degree of access to surface water through irrigation
and drainage channels and ponds, as well as ground water through open wells and bore
wells. There were a total of 22 private ponds, 42 common ponds, 12 irrigation/ drainage
channels, 21 open wells and eight borewells. However, the community claimed that water
was available only during kuruvai season. Dry and wet-land paddy cultivation is the main
agricultural practice, although there is also land under horticulture- coconuts, mangoes,
flowers and vegetables.
The community has cleaned up most of the tanks and ponds in their area with the help of
the Panchayat and NGOs. Interestingly, the community also seems to be more interested in
having additional ponds rather than repairing the irrigation channels.
There is extensive damage in this network and necessitates an intensive collaborative effort
from both the government and the community to successfully restore this TER. 16,749 m3 of
siltation is seen in the irrigation channels and 6,86, 222m3 in the drainage channels. Apart
from this, there is almost 58,000 m3 of bund damage in the irrigation channels and 86,000
m3 of bund damage in the drainage channels. Nine sluices and 119 other structures have
been seen as damaged and there is a requirement for thirteen new structures. Apart from
this, about 9 ha are covered with weeds, mainly water hyacinth.
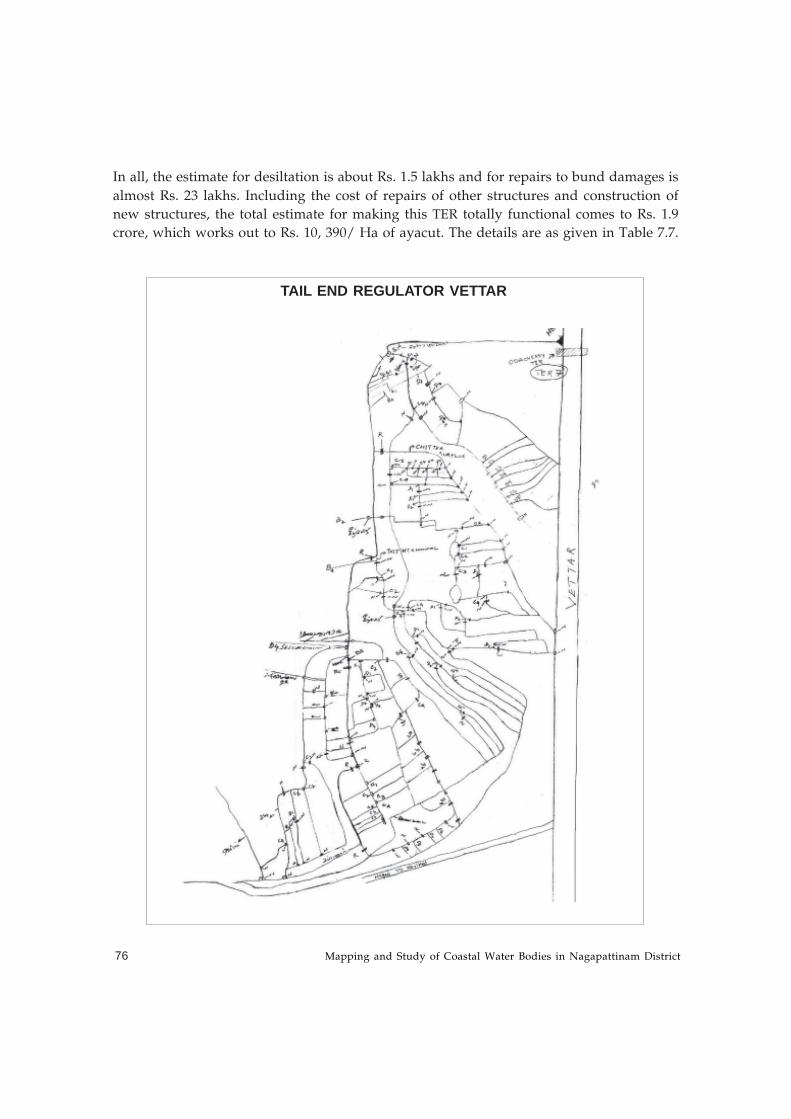
Mapping and Study of Coastal Water Bodies in Nagapattinam District76
In all, the estimate for desiltation is about Rs. 1.5 lakhs and for repairs to bund damages is
almost Rs. 23 lakhs. Including the cost of repairs of other structures and construction of
new structures, the total estimate for making this TER totally functional comes to Rs. 1.9
crore, which works out to Rs. 10, 390/ Ha of ayacut. The details are as given in Table 7.7.
TAIL END REGULATOR VETTAR
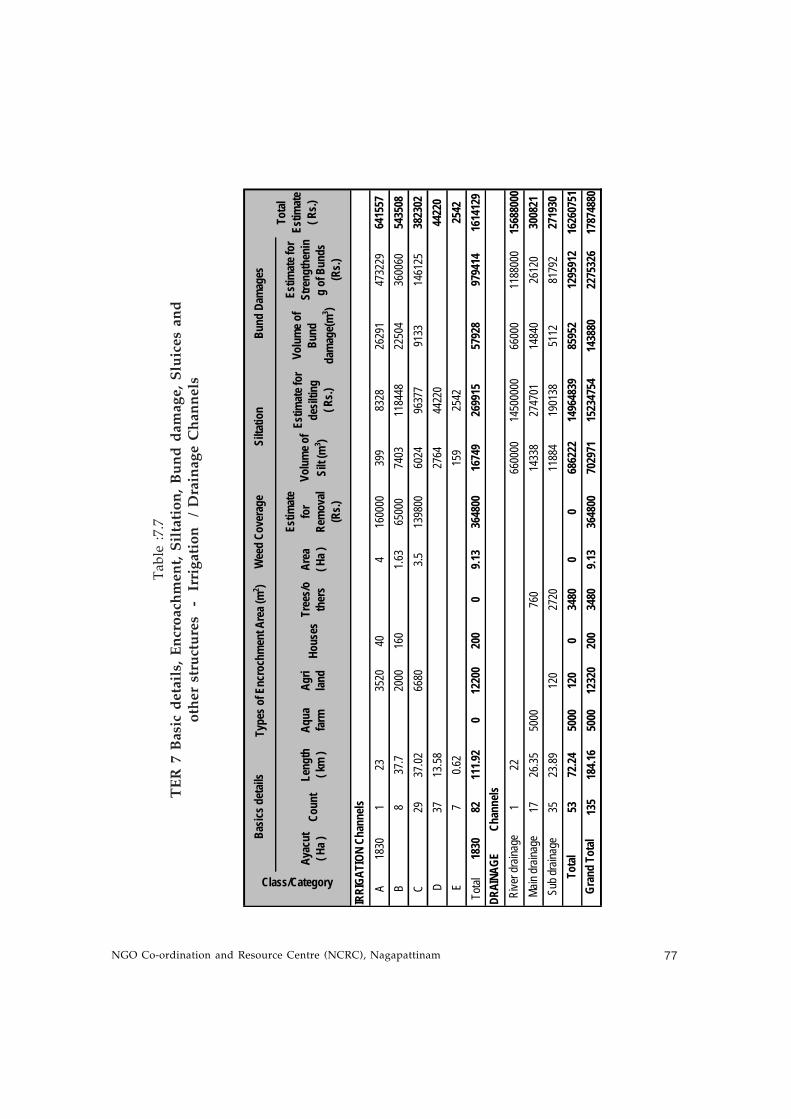
NGO Co-ordination and Resource Centre (NCRC), Nagapattinam 77
Ta
ble
:7
.7
TE
R 7
Ba
sic
de
tail
s, E
ncr
oa
chm
en
t, S
ilta
tio
n,
Bu
nd
da
ma
ge
, S
luic
es
an
do
ther
str
uct
ure
s -
Ir
rig
atio
n
/ D
rain
age
Ch
ann
els
Ayac
ut
( Ha )
Coun
tLe
ngth
( k
m )
Aqua
fa
rmAg
ri lan
dHo
uses
Tree
s/oth
ers
Area
( H
a )
Estim
ate
for
Rem
oval
(R
s.)
Volu
me o
f Si
lt (m
3 )
Estim
ate f
or
desil
ting
( R
s.)
Volu
me o
f Bu
nd
dam
age(
m3 )
Estim
ate f
or
Stre
ngth
enin
g of
Bun
ds
(Rs.)
A18
301
2335
2040
416
0000
399
8328
2629
147
3229
6415
57B
837
.720
0016
01.6
365
000
7403
1184
4822
504
3600
6054
3508
C29
37.02
6680
3.513
9800
6024
9637
791
3314
6125
3823
02 D
3713
.5827
6444
220
4422
0 E
70.6
215
925
4225
42To
tal18
3082
111.9
20
1220
020
00
9.13
3648
0016
749
2699
1557
928
9794
1416
1412
9
122
6600
0014
5000
0066
000
1188
000
1568
8000
1726
.3550
0076
014
338
2747
0114
840
2612
030
0821
3523
.8912
027
2011
884
1901
3851
1281
792
2719
3053
72.24
5000
120
034
800
068
6222
1496
4839
8595
212
9591
216
2607
5113
518
4.16
5000
1232
020
034
809.1
336
4800
7029
7115
2347
5414
3880
2275
326
1787
4880
IRRI
GATI
ON C
hann
els
DRAI
NAGE
Chan
nels
Gran
d To
tal
Rive
r dra
inage
Main
drain
age
Sub d
raina
geTo
tal
Bund
Dam
ages
Tota
l Es
timat
e ( R
s.)
Class/Category
Basic
s det
ails
Type
s of E
ncro
chm
ent A
rea (
m2 )
Wee
d Co
vera
geSi
ltatio
n
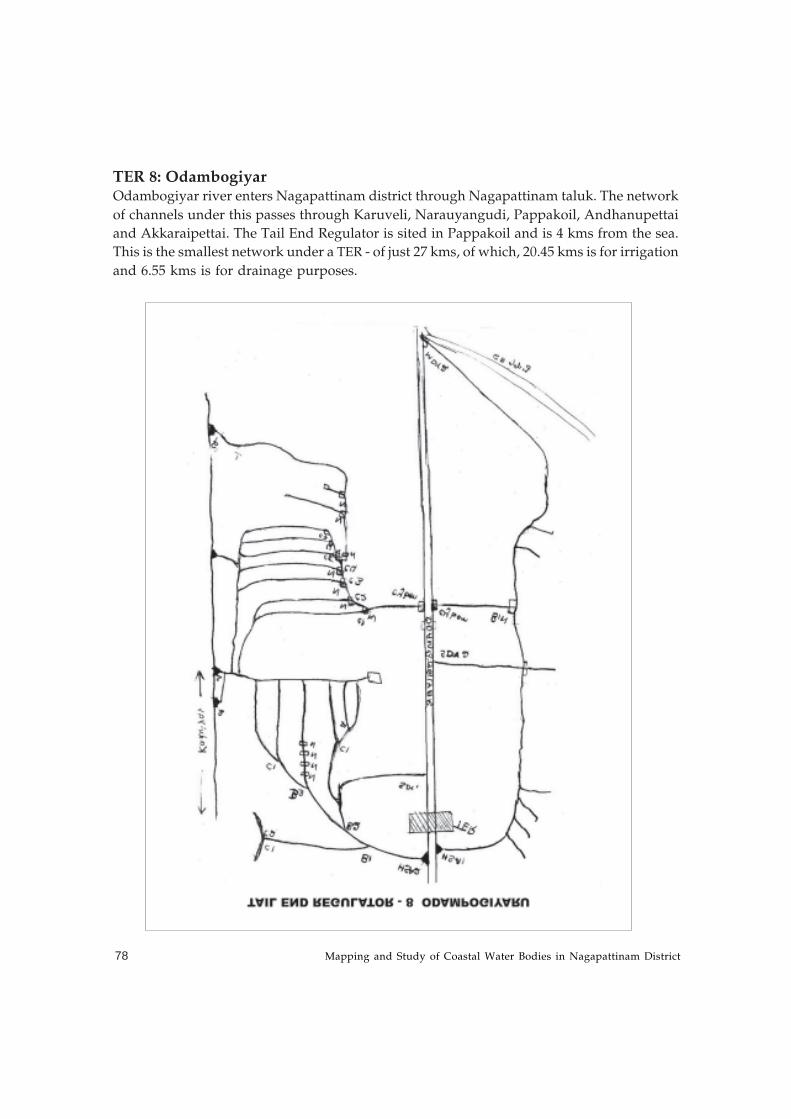
Mapping and Study of Coastal Water Bodies in Nagapattinam District78
TER 8: OdambogiyarOdambogiyar river enters Nagapattinam district through Nagapattinam taluk. The network
of channels under this passes through Karuveli, Narauyangudi, Pappakoil, Andhanupettai
and Akkaraipettai. The Tail End Regulator is sited in Pappakoil and is 4 kms from the sea.
This is the smallest network under a TER - of just 27 kms, of which, 20.45 kms is for irrigation
and 6.55 kms is for drainage purposes.
NGO Co-ordination and Resource Centre (NCRC), Nagapattinam 79
All farmers seem to have access to water for irrigation purposes. 80% of the farmers are
marginal farmers, 16.5% are small, 2% are medium and 1% large farmers. An in-depth
study of one of the villages showed a high prevalence of water sources - 6 private ponds,
21 common ponds, 11 open wells and 8 canals- though water availability was only during
kuruvai at all these sources. Paddy is the main agricultural crop and coconut, the main
horticultural crop.
As seems to be the practice in Nagapattinam block, in this village also, most of the community-
based efforts were on desilting and clearing of ponds and tanks and they also evinced an
interest in adding to the number of ponds and tanks rather than for the maintenance of the
channels.
The damages in this TER network are also considerable with 43,542 m3 of siltation and
27,700 m3 of damage to bunds. There has also been considerable damage to the other
structures like shutters and notches. The estimate for desilting is about Rs. 8.84 lakhs and
repairs Rs. 4.8 lakhs. Including the repairs to the other structures, the total for revitalising
this TER comes to around Rs. 16.6 lakhs, which works out to Rs. 8220/ Ha of ayacut. The
damages and detailed estimates are given in Table 7.8.
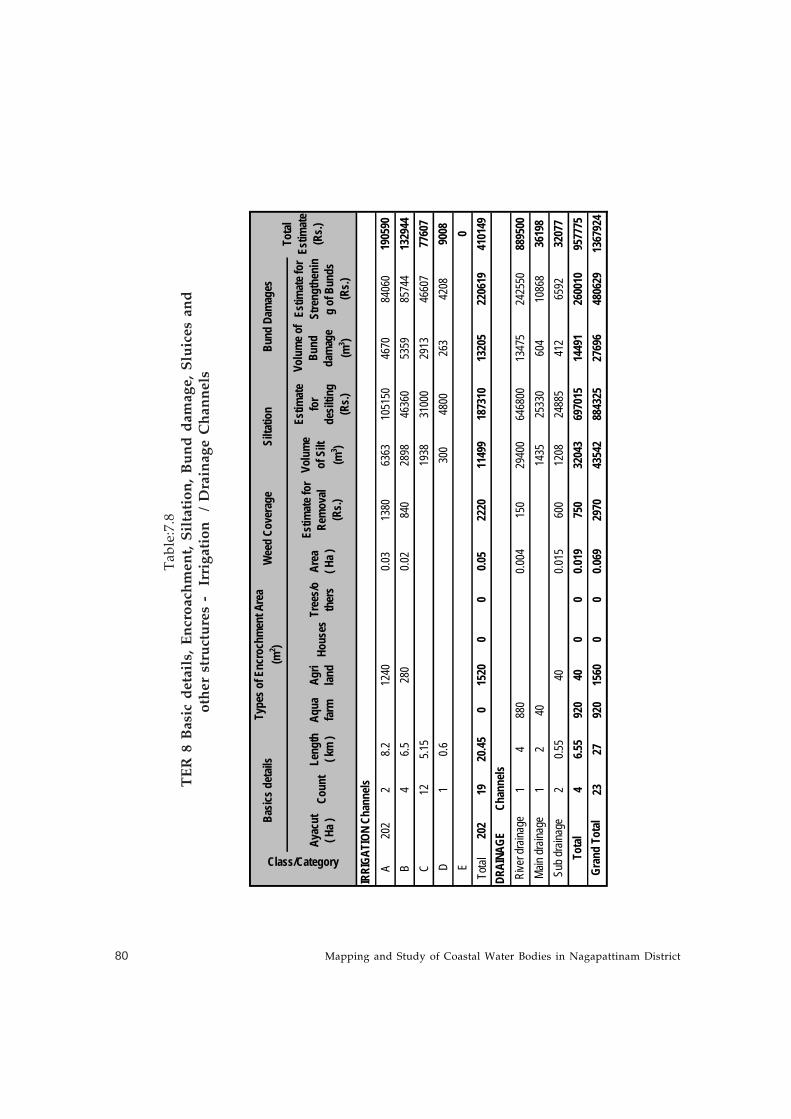
Mapping and Study of Coastal Water Bodies in Nagapattinam District80
Ta
ble
:7.8
TE
R 8
Ba
sic
de
tail
s, E
ncr
oa
chm
en
t, S
ilta
tio
n,
Bu
nd
da
ma
ge
, S
luic
es
an
do
ther
str
uct
ure
s -
Irr
igat
ion
/
Dra
inag
e C
han
nel
s
Ayac
ut
( Ha )
Coun
tLe
ngth
( k
m )
Aqua
fa
rmAg
ri lan
dHo
uses
Tree
s/oth
ers
Area
( H
a )
Estim
ate f
or
Rem
oval
(R
s.)
Volu
me
of S
ilt
(m3 )
Estim
ate
for
desil
ting
(Rs.)
Volu
me o
f Bu
nd
dam
age
(m3 )
Estim
ate f
or
Stre
ngth
enin
g of
Bun
ds
(Rs.)
A20
22
8.212
400.0
313
8063
6310
5150
4670
8406
019
0590
B4
6.528
00.0
284
028
9846
360
5359
8574
413
2944
C12
5.15
1938
3100
029
1346
607
7760
7 D
10.6
300
4800
263
4208
9008
E0
Total
202
1920
.450
1520
00
0.05
2220
1149
918
7310
1320
522
0619
4101
49
14
880
0.004
150
2940
064
6800
1347
524
2550
8895
001
240
1435
2533
060
410
868
3619
82
0.55
400.0
1560
012
0824
885
412
6592
3207
74
6.55
920
400
00.0
1975
032
043
6970
1514
491
2600
1095
7775
2327
920
1560
00
0.069
2970
4354
288
4325
2769
648
0629
1367
924
IRRI
GATI
ON C
hann
els
DRAI
NAGE
Chan
nels
Gran
d To
tal
Rive
r dra
inage
Main
drain
age
Sub d
raina
geTo
tal
Tota
l Es
timat
e (R
s.)
Bund
Dam
ages
Class/Category
Basic
s det
ails
Type
s of E
ncro
chm
ent A
rea
(m2 )
Wee
d Co
vera
geSi
ltatio
n
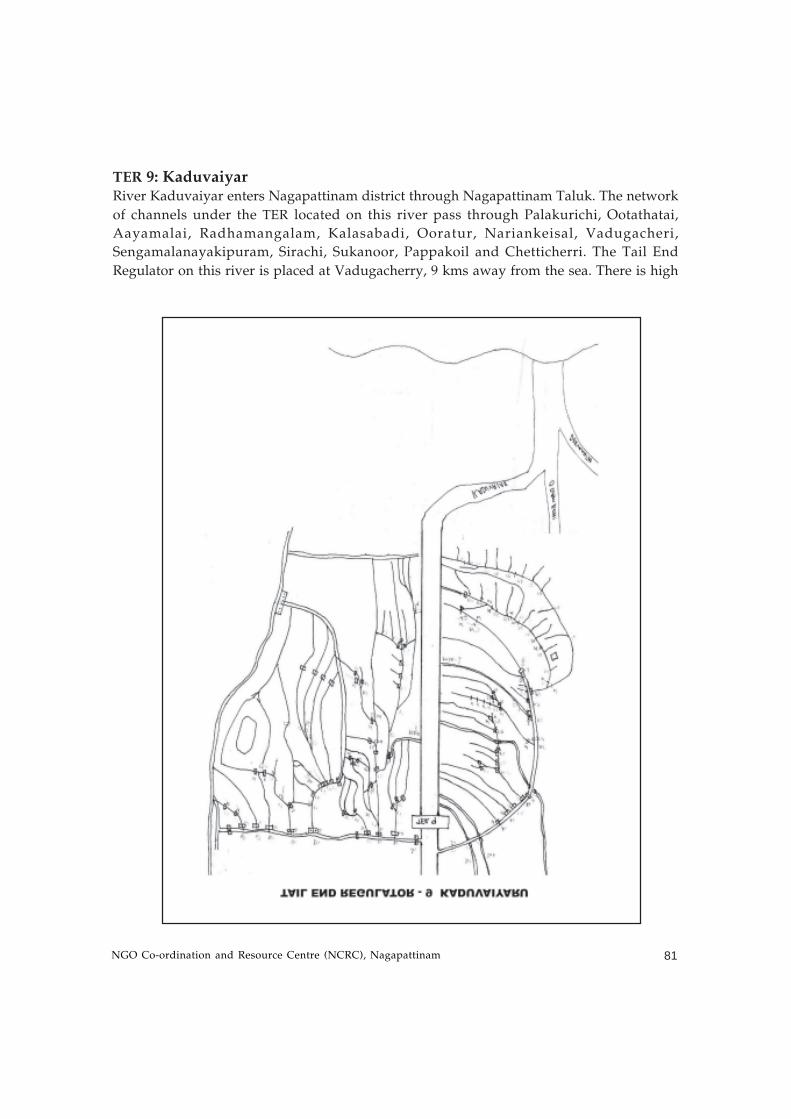
NGO Co-ordination and Resource Centre (NCRC), Nagapattinam 81
TER 9: KaduvaiyarRiver Kaduvaiyar enters Nagapattinam district through Nagapattinam Taluk. The network
of channels under the TER located on this river pass through Palakurichi, Ootathatai,
Aayamalai, Radhamangalam, Kalasabadi, Ooratur, Nariankeisal, Vadugacheri,
Sengamalanayakipuram, Sirachi, Sukanoor, Pappakoil and Chetticherri. The Tail End
Regulator on this river is placed at Vadugacherry, 9 kms away from the sea. There is high
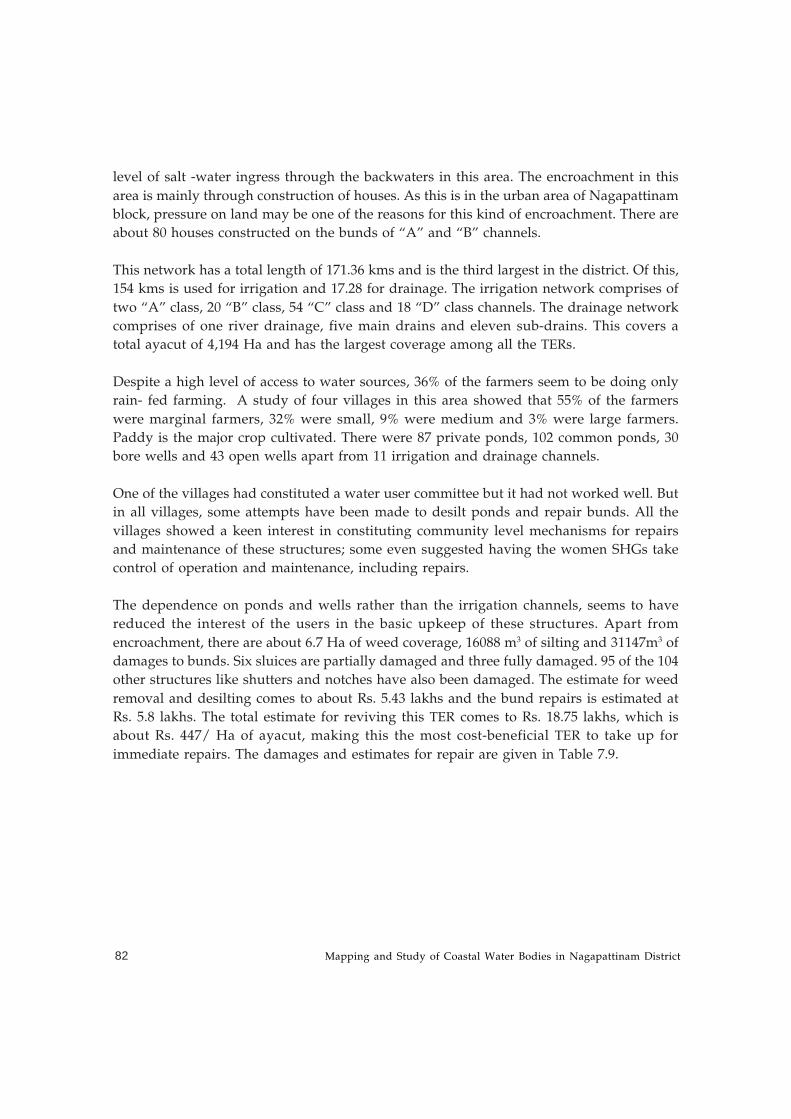
Mapping and Study of Coastal Water Bodies in Nagapattinam District82
level of salt -water ingress through the backwaters in this area. The encroachment in this
area is mainly through construction of houses. As this is in the urban area of Nagapattinam
block, pressure on land may be one of the reasons for this kind of encroachment. There are
about 80 houses constructed on the bunds of “A” and “B” channels.
This network has a total length of 171.36 kms and is the third largest in the district. Of this,
154 kms is used for irrigation and 17.28 for drainage. The irrigation network comprises of
two “A” class, 20 “B” class, 54 “C” class and 18 “D” class channels. The drainage network
comprises of one river drainage, five main drains and eleven sub-drains. This covers a
total ayacut of 4,194 Ha and has the largest coverage among all the TERs.
Despite a high level of access to water sources, 36% of the farmers seem to be doing only
rain- fed farming. A study of four villages in this area showed that 55% of the farmers
were marginal farmers, 32% were small, 9% were medium and 3% were large farmers.
Paddy is the major crop cultivated. There were 87 private ponds, 102 common ponds, 30
bore wells and 43 open wells apart from 11 irrigation and drainage channels.
One of the villages had constituted a water user committee but it had not worked well. But
in all villages, some attempts have been made to desilt ponds and repair bunds. All the
villages showed a keen interest in constituting community level mechanisms for repairs
and maintenance of these structures; some even suggested having the women SHGs take
control of operation and maintenance, including repairs.
The dependence on ponds and wells rather than the irrigation channels, seems to have
reduced the interest of the users in the basic upkeep of these structures. Apart from
encroachment, there are about 6.7 Ha of weed coverage, 16088 m3 of silting and 31147m3 of
damages to bunds. Six sluices are partially damaged and three fully damaged. 95 of the 104
other structures like shutters and notches have also been damaged. The estimate for weed
removal and desilting comes to about Rs. 5.43 lakhs and the bund repairs is estimated at
Rs. 5.8 lakhs. The total estimate for reviving this TER comes to Rs. 18.75 lakhs, which is
about Rs. 447/ Ha of ayacut, making this the most cost-beneficial TER to take up for
immediate repairs. The damages and estimates for repair are given in Table 7.9.
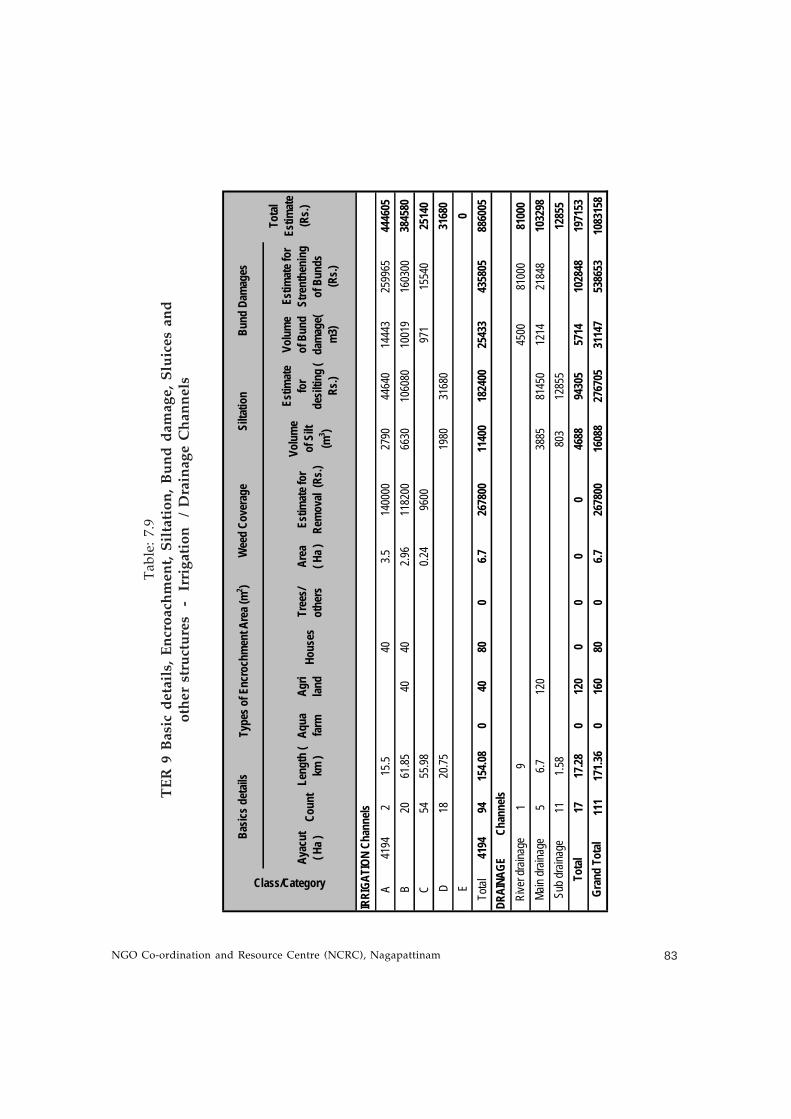
NGO Co-ordination and Resource Centre (NCRC), Nagapattinam 83
Ta
ble
: 7
.9
TE
R 9
Ba
sic
de
tail
s, E
ncr
oa
chm
en
t, S
ilta
tio
n,
Bu
nd
da
ma
ge
, S
luic
es
an
do
ther
str
uct
ure
s -
Ir
rig
atio
n
/ D
rain
age
Ch
ann
els
Ayac
ut
( Ha )
Coun
tLe
ngth
( km
)Aq
ua
farm
Agri
land
Hous
esTr
ees/
othe
rsAr
ea
( Ha )
Estim
ate f
or
Rem
oval
(Rs.)
Volu
me
of S
ilt
(m3 )
Estim
ate
for
desil
ting
( Rs
.)
Volu
me
of B
und
dam
age(
m3)
Estim
ate f
or
Stre
nthe
ning
of
Bun
ds
(Rs.)
A41
942
15.5
403.5
1400
0027
9044
640
1444
325
9965
4446
05B
2061
.8540
402.9
611
8200
6630
1060
8010
019
1603
0038
4580
C54
55.98
0.24
9600
971
1554
025
140
D18
20.75
1980
3168
031
680
E0
Total
4194
9415
4.08
040
800
6.726
7800
1140
018
2400
2543
343
5805
8860
05
19
4500
8100
081
000
56.7
120
3885
8145
012
1421
848
1032
9811
1.58
803
1285
512
855
1717
.280
120
00
00
4688
9430
557
1410
2848
1971
5311
117
1.36
016
080
06.7
2678
0016
088
2767
0531
147
5386
5310
8315
8
IRRI
GATI
ON C
hann
els
DRAI
NAGE
Chan
nels
Basic
s det
ails
Type
s of E
ncro
chm
ent A
rea (
m2 )
Wee
d Co
vera
geSi
ltatio
n
Gran
d To
tal
Rive
r dra
inage
Main
drain
age
Sub d
raina
geTo
tal
Bund
Dam
ages
Tota
l Es
timat
e (R
s.)
Class/Category
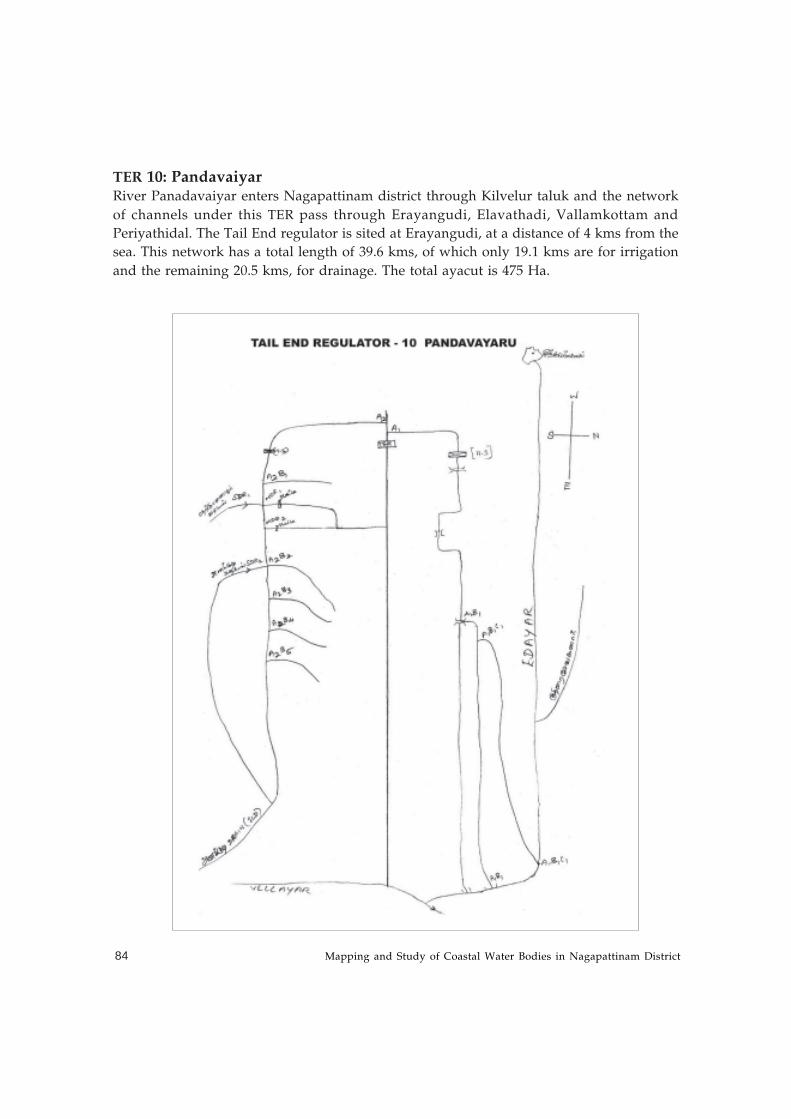
Mapping and Study of Coastal Water Bodies in Nagapattinam District84
TER 10: PandavaiyarRiver Panadavaiyar enters Nagapattinam district through Kilvelur taluk and the network
of channels under this TER pass through Erayangudi, Elavathadi, Vallamkottam and
Periyathidal. The Tail End regulator is sited at Erayangudi, at a distance of 4 kms from the
sea. This network has a total length of 39.6 kms, of which only 19.1 kms are for irrigation
and the remaining 20.5 kms, for drainage. The total ayacut is 475 Ha.
NGO Co-ordination and Resource Centre (NCRC), Nagapattinam 85
The irrigation network has two “A” class channels, six “B” class channels and one “C” class
channel. The drainage network comprises of one river drain, three main drains and two
sub-drains. About 17,520 houses have come up on the bunds of both the irrigation and the
drainage channels, though the number on the drainage channels is much higher.
Only about 8% of the farmers seem to be totally dependant on rain. In the village studied,
there were eight private ponds, 16 common ponds, two open wells and nine irrigation/
drainage canals. About 45% of the farmers are marginal farmers, 26% small, 23% medium
and 6% large farmers. The farming community seems to have generally followed the
decisions of the grama sabha in cleaning and desilting activities. However, there is a strong
discontent among the farmers on the encroachments and they opined that the illegal
encroachment should be removed. They also recommended the repair of the sluices/
regulators and strengthening of the bunds.
There is a fairly high level of siltation in the channels with 19709 m3 in the irrigation channels
and 1, 14,075 m3 in the drainage channels. Bund damages are also high with a total of 89438
m3 of bund area being damaged, mainly in the drainage network. The estimate for
desilting and repairing the damages to the bunds is approximately Rs. 45. 47 lakhs and
including the repairs to other structures will total up to Rs. 49. 27 lakhs, which works
out to be Rs. 10, 373 / ha of ayacut. The details of the damages as well as estimates for
repair are given in Table 7.10.
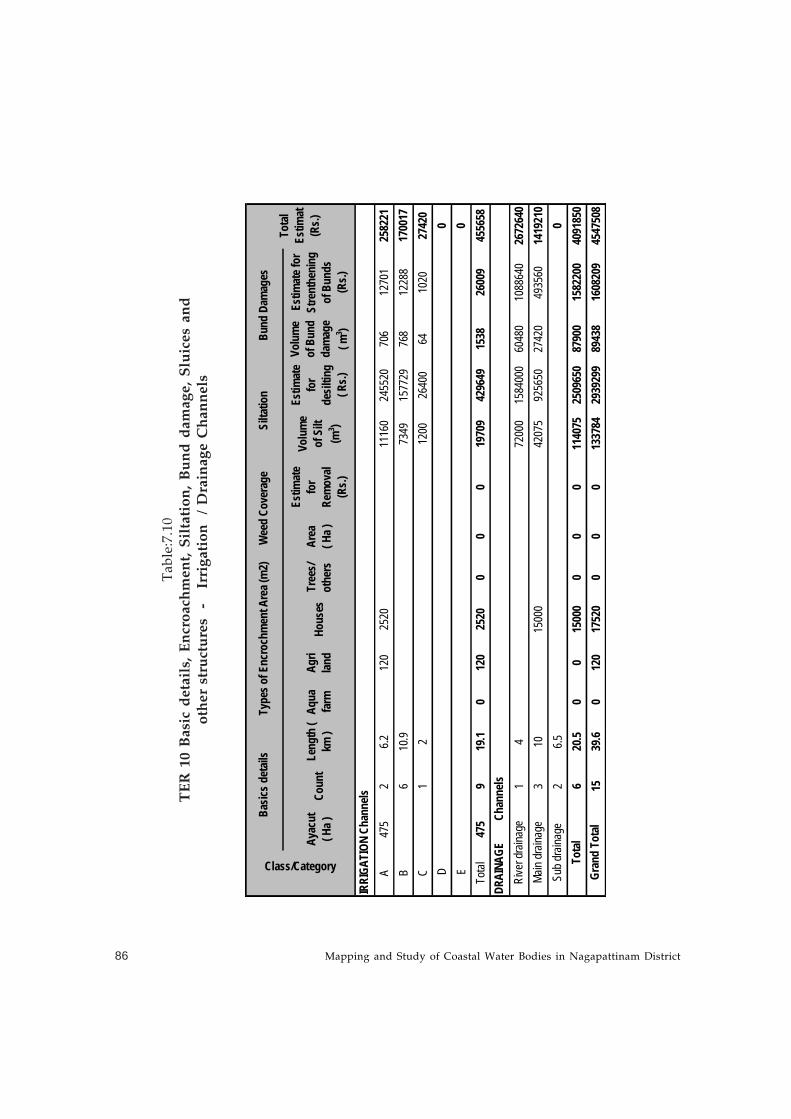
Mapping and Study of Coastal Water Bodies in Nagapattinam District86
Ta
ble
:7.1
0
TE
R 1
0 B
asi
c d
eta
ils,
En
cro
ach
me
nt,
Sil
tati
on
, B
un
d d
am
ag
e,
Slu
ice
s a
nd
oth
er s
tru
ctu
res
-
Irr
igat
ion
/
Dra
inag
e C
han
nel
s
Ayac
ut
( Ha )
Coun
tLe
ngth
( km
)Aq
ua
farm
Agri
land
Hous
esTr
ees/
othe
rsAr
ea
( Ha )
Estim
ate
for
Rem
oval
(Rs.)
Volu
me
of S
ilt
(m3 )
Estim
ate
for
desil
ting
( Rs.)
Volu
me
of B
und
dam
age
( m3 )
Estim
ate f
or
Stre
nthe
ning
of
Bun
ds
(Rs.)
A47
52
6.212
025
2011
160
2455
2070
612
701
2582
21B
610
.973
4915
7729
768
1228
817
0017
C1
212
0026
400
6410
2027
420
D0
E0
Total
475
919
.10
120
2520
00
019
709
4296
4915
3826
009
4556
58
14
7200
015
8400
060
480
1088
640
2672
640
310
1500
042
075
9256
5027
420
4935
6014
1921
02
6.50
620
.50
015
000
00
011
4075
2509
650
8790
015
8220
040
9185
015
39.6
012
017
520
00
013
3784
2939
299
8943
816
0820
945
4750
8
IRRI
GATI
ON C
hann
els
DRAI
NAGE
Chan
nels
Gran
d To
tal
Rive
r dra
inage
Main
drain
age
Sub d
raina
geTo
tal
Tota
l Es
timat
(R
s.)
Bund
Dam
ages
Class/Category
Basic
s det
ails
Type
s of E
ncro
chm
ent A
rea (
m2)
Wee
d Co
vera
geSi
ltatio
n
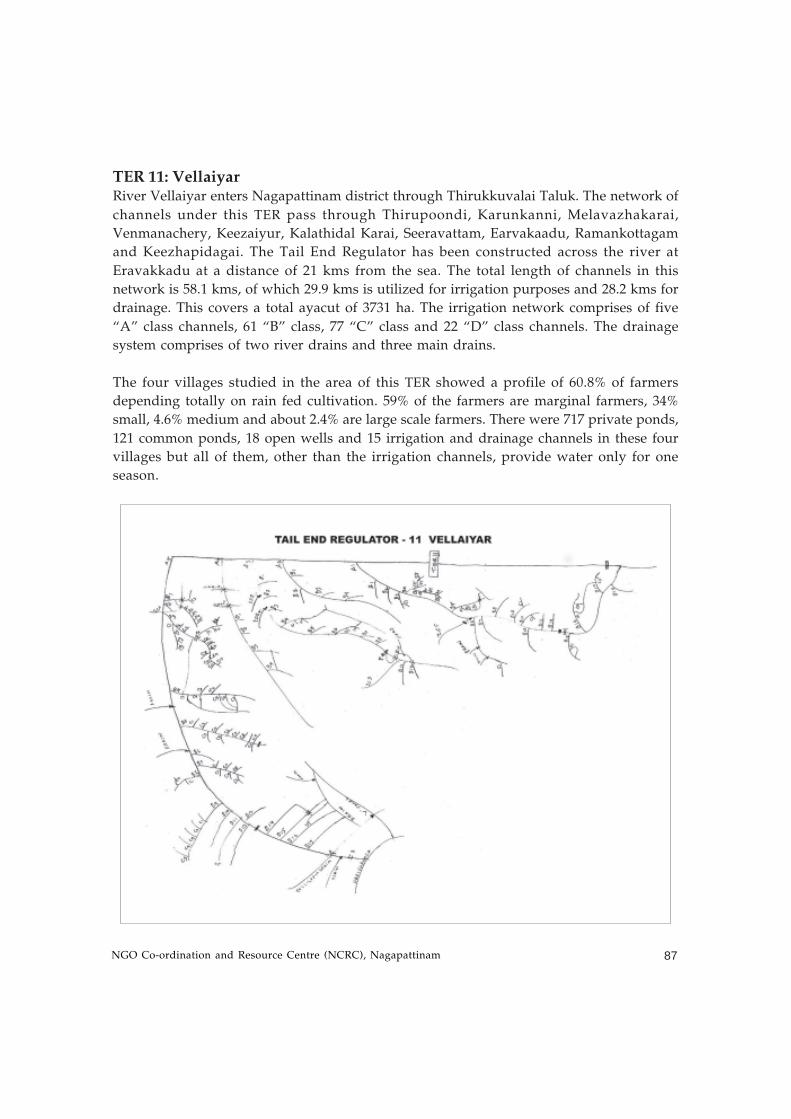
NGO Co-ordination and Resource Centre (NCRC), Nagapattinam 87
TER 11: VellaiyarRiver Vellaiyar enters Nagapattinam district through Thirukkuvalai Taluk. The network of
channels under this TER pass through Thirupoondi, Karunkanni, Melavazhakarai,
Venmanachery, Keezaiyur, Kalathidal Karai, Seeravattam, Earvakaadu, Ramankottagam
and Keezhapidagai. The Tail End Regulator has been constructed across the river at
Eravakkadu at a distance of 21 kms from the sea. The total length of channels in this
network is 58.1 kms, of which 29.9 kms is utilized for irrigation purposes and 28.2 kms for
drainage. This covers a total ayacut of 3731 ha. The irrigation network comprises of five
“A” class channels, 61 “B” class, 77 “C” class and 22 “D” class channels. The drainage
system comprises of two river drains and three main drains.
The four villages studied in the area of this TER showed a profile of 60.8% of farmers
depending totally on rain fed cultivation. 59% of the farmers are marginal farmers, 34%
small, 4.6% medium and about 2.4% are large scale farmers. There were 717 private ponds,
121 common ponds, 18 open wells and 15 irrigation and drainage channels in these four
villages but all of them, other than the irrigation channels, provide water only for one
season.
Mapping and Study of Coastal Water Bodies in Nagapattinam District88
Of the four villages studied in depth, one village, Karunganni, had two water user
associations, both of which were functioning well and working closely with the Panchayat.
Another village, P R Puram, had already done some desilting and maintenance work under
the SYGS in 2005. They wanted their tanks to be desilted, and check dams and retaining
walls built to prevent flooding. In Karunganni, the shrimp farmers had deliberately damaged
the bund in three locations for easier access to the backwater flow of saline water during
high tides. The Panchayat and the User Groups were also helpless against the encroachment
for construction of houses and were ready to back any initiative to remove these
encroachments. Apart from the mechanisms to prevent flooding, the water user groups
also had suggestions for repairing shutters and deepening the lake, which would provide
them with additional storage capacity for fresh water, thereby increasing the cultivation
potential of about 1000 acres in the vicinity.
The estimate for weed removal, desilting and repairing of bunds in both the irrigation and
the drainage network is Rs. 1.73 crores and repairs to the other structures like shutters and
construction of new structures like additional regulators, small dykes for improving the
water storage work out to Rs. 42. 5 lakhs, bringing the total estimate to Rs. 2.16 Crores,
which works out to Rs 5785/ ha of ayacut. The detailed information on damages as well as
estimates for repair are given in Table 7.11.
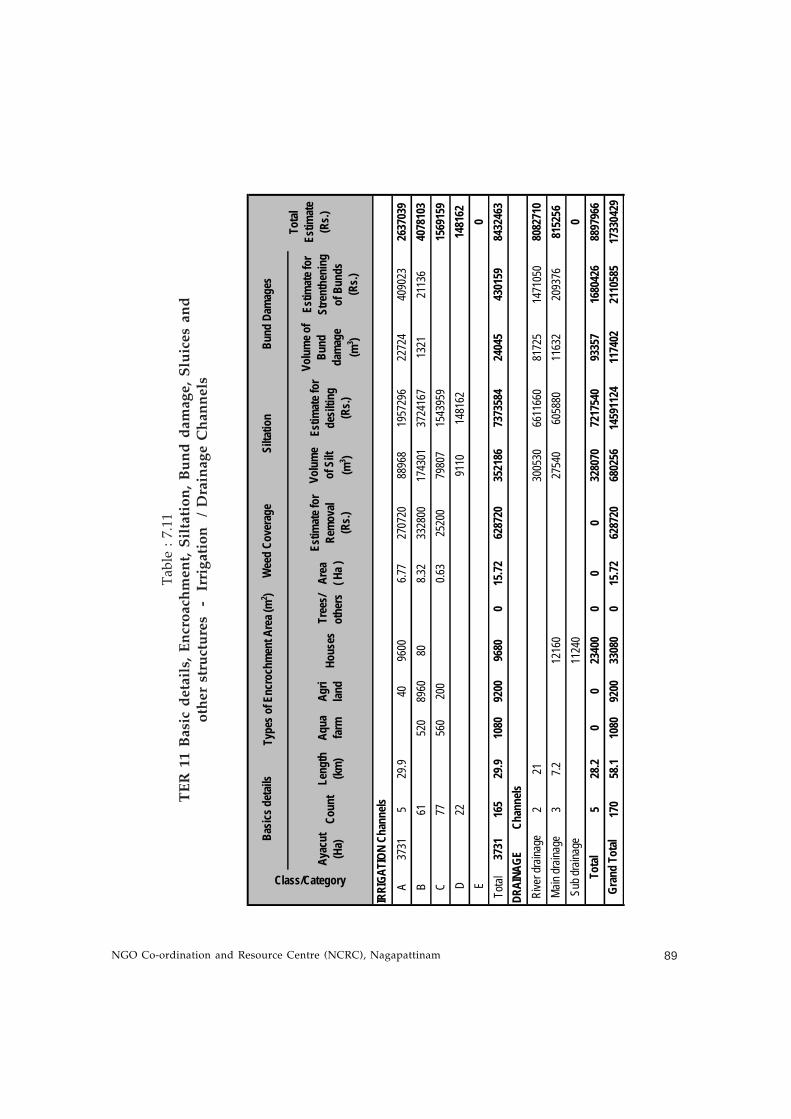
NGO Co-ordination and Resource Centre (NCRC), Nagapattinam 89
Ta
ble
: 7
.11
TE
R 1
1 B
asi
c d
eta
ils,
En
cro
ach
me
nt,
Sil
tati
on
, B
un
d d
am
ag
e,
Slu
ice
s a
nd
oth
er s
tru
ctu
res
-
Irri
gat
ion
/
Dra
inag
e C
han
nel
s
Ayac
ut
(Ha)
Coun
tLe
ngth
(k
m)
Aqua
fa
rmAg
ri lan
dHo
uses
Tree
s/ ot
hers
Area
( H
a )
Estim
ate f
or
Rem
oval
(R
s.)
Volu
me
of S
ilt
(m3 )
Estim
ate f
or
desil
ting
(Rs.)
Volu
me o
f Bu
nd
dam
age
(m3 )
Estim
ate f
or
Stre
nthe
ning
of
Bun
ds
(Rs.)
A37
315
29.9
4096
006.7
727
0720
8896
819
5729
622
724
4090
2326
3703
9B
6152
089
6080
8.32
3328
0017
4301
3724
167
1321
2113
640
7810
3C
7756
020
00.6
325
200
7980
715
4395
915
6915
9 D
2291
1014
8162
1481
62 E
0To
tal37
3116
529
.910
8092
0096
800
15.72
6287
2035
2186
7373
584
2404
543
0159
8432
463
221
3005
3066
1166
081
725
1471
050
8082
710
37.2
1216
027
540
6058
8011
632
2093
7681
5256
1124
00
528
.20
023
400
00
032
8070
7217
540
9335
716
8042
688
9796
617
058
.110
8092
0033
080
015
.7262
8720
6802
5614
5911
2411
7402
2110
585
1733
0429
IRRI
GATI
ON C
hann
els
DRAI
NAGE
Chan
nels
Basic
s det
ails
Type
s of E
ncro
chm
ent A
rea (
m2 )
Wee
d Co
vera
geSi
ltatio
n
Gran
d To
tal
Rive
r dra
inage
Main
drain
age
Sub d
raina
geTo
tal
Bund
Dam
ages
Tota
l Es
timat
e (R
s.)
Class/Category
Mapping and Study of Coastal Water Bodies in Nagapattinam District90
TER 12 HarichandraThe River Harichandra enters Nagapattinam district through Vedaranyam Taluk. The Tail
End Regulator on this river is sited at Brinjimoolai, 5 Kms away from the sea. The network
of canals 153.3 km long pass through Thalainayar, Brinjimoolai, Sadaiyanchi, Thennanchi,
Palayatrankarai, Umbalachery, Kaadanthethi, Manakudi, Sadaiyankottugai, Pudupalli,
Vettaikaranirruppu, Venmanacherri, Thirumalam, Sadaiyamkottagam, Mudulaiyappankandi,
Eagarajapuram, Aaradiyambalam and Vattagudi. This is the third longest system in the
district and has the second largest ayacut at 3935 Ha.
The irrigation network is 134.02 kms long and comprises of 10 “A” class, 83 “B” class, 62
“C” class and 11 “D” class channels. The drainage network is 19.28 kms long and has one
river drain and five main drains.
The population is almost evenly divided between farmers and fishers. Sometimes the farmers
also fish in the straight cuts of the drainage channels, mainly using poles and nets, which
block the free flow of water. 38.43% of the farmers are marginal farmers, 45.7 small farmers,
13.4% medium farmers and 2.5% large farmers. A study done in four of the villages in this
area showed a large presence of water bodies- 929 private ponds, 80 common ponds, 14
open wells and eight irrigation/ drainage channels. Although paddy is the single major
agricultural crop, there is also considerable area under cultivation of horticultural crops
like mangoes, cashew, coconut, vegetables and flowers. Water is stated to be available in
the ponds during both samba and kuruvai, which is probably the reason for the lush greenery
of Vedaranyam.
However, due to very low gradient differential, even a small increase in the water levels
leads to flooding of some of the areas coming under this network. The community states
that desilting was done about 15 years ago. This low gradient also encourages ingress of
sea- water during the high tides, favouring prawn cultivation. Some of the farmers have
converted some area of their agricultural land into shrimp farms. About 3960 m2 of the
channel land has been encroached upon by the shrimp farms. This network has the most
complex encroachments including shrimp farms, houses (about 9000), agricultural purposes
(about 17000 m2) and for horticultural purposes (about 31000 m2). Most of the encroachment
for cultivation has been done by influential farmers from that locality itself; and the others
are unable to evict them.
Probably due to the high dependence on other water sources, not much attention has been
paid to the maintenance of the channels. There is a large volume, 12.67 lakh m3, of siltation
in both types of channels and will require immense financial resources for desiltation.
Two of the villages surveyed stated that they had registered a farmer’s association about
ten years earlier. One of these associations has been active in desilting some of the channels.
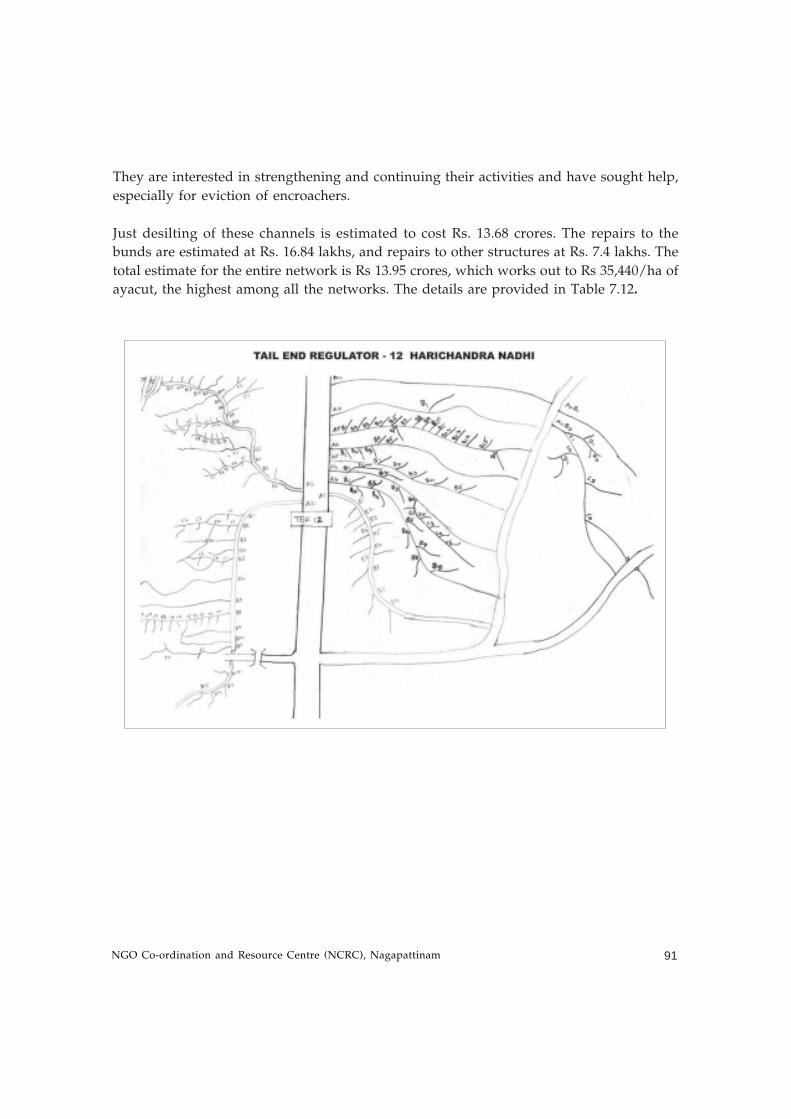
NGO Co-ordination and Resource Centre (NCRC), Nagapattinam 91
They are interested in strengthening and continuing their activities and have sought help,
especially for eviction of encroachers.
Just desilting of these channels is estimated to cost Rs. 13.68 crores. The repairs to the
bunds are estimated at Rs. 16.84 lakhs, and repairs to other structures at Rs. 7.4 lakhs. The
total estimate for the entire network is Rs 13.95 crores, which works out to Rs 35,440/ha of
ayacut, the highest among all the networks. The details are provided in Table 7.12.
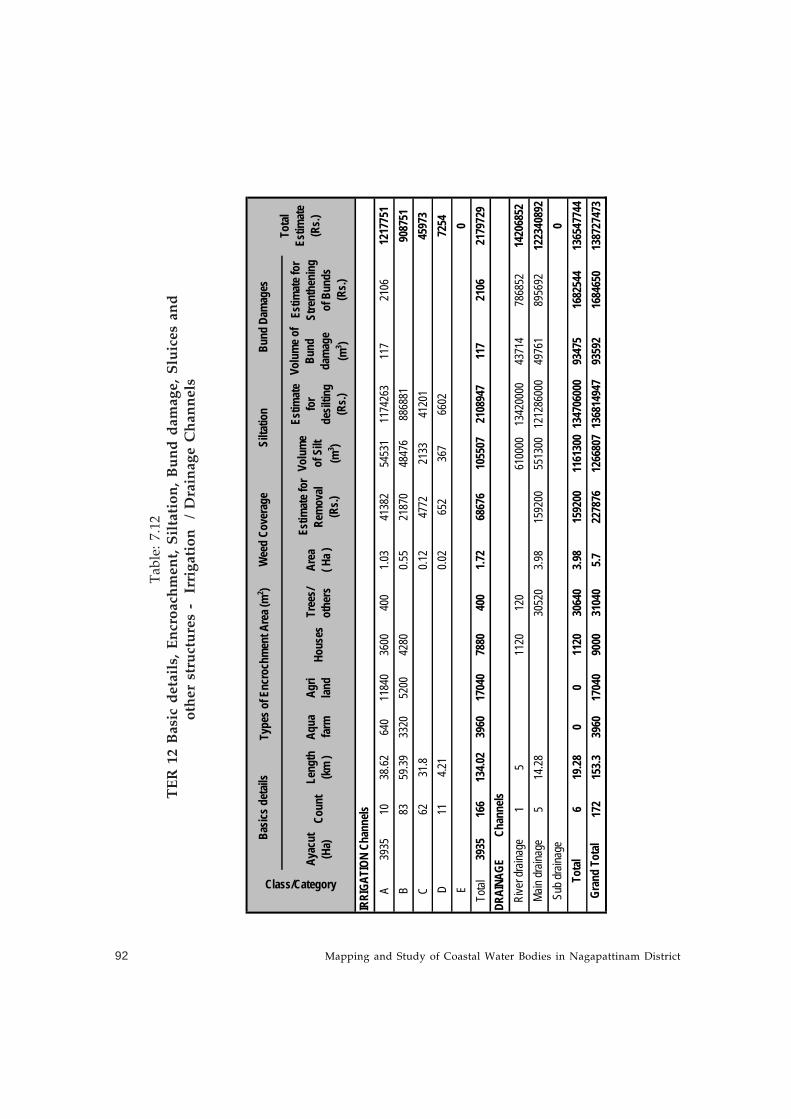
Mapping and Study of Coastal Water Bodies in Nagapattinam District92
Ta
ble
: 7
.12
TE
R 1
2 B
asi
c d
eta
ils,
En
cro
ach
me
nt,
Sil
tati
on
, B
un
d d
am
ag
e,
Slu
ice
s a
nd
oth
er s
tru
ctu
res
- I
rrig
atio
n
/ D
rain
age
Ch
ann
els
Ayac
ut
(Ha)
Coun
tLe
ngth
(k
m )
Aqua
fa
rmAg
ri lan
dHo
uses
Tree
s/ ot
hers
Area
( H
a )
Estim
ate f
or
Rem
oval
(Rs.)
Volu
me
of S
ilt
(m3 )
Estim
ate
for
desil
ting
(Rs.)
Volu
me o
f Bu
nd
dam
age
(m3 )
Estim
ate f
or
Stre
nthe
ning
of
Bun
ds
(Rs.)
A39
3510
38.62
640
1184
036
0040
01.0
341
382
5453
111
7426
311
721
0612
1775
1B
8359
.3933
2052
0042
800.5
521
870
4847
688
6881
9087
51C
6231
.80.1
247
7221
3341
201
4597
3 D
114.2
10.0
265
236
766
0272
54 E
0To
tal39
3516
613
4.02
3960
1704
078
8040
01.7
268
676
1055
0721
0894
711
721
0621
7972
9
15
1120
120
6100
0013
4200
0043
714
7868
5214
2068
525
14.28
3052
03.9
815
9200
5513
0012
1286
000
4976
189
5692
1223
4089
20
619
.280
011
2030
640
3.98
1592
0011
6130
013
4706
000
9347
516
8254
413
6547
744
172
153.3
3960
1704
090
0031
040
5.722
7876
1266
807
1368
1494
793
592
1684
650
1387
2747
3
IRRI
GATI
ON C
hann
els
DRAI
NAGE
Chan
nels
Gran
d To
tal
Rive
r dra
inage
Main
drain
age
Sub d
raina
geTo
tal
Tota
l Es
timat
e (R
s.)
Bund
Dam
ages
Class/Category
Basic
s det
ails
Type
s of E
ncro
chm
ent A
rea (
m2 )
Wee
d Co
vera
geSi
ltatio
n
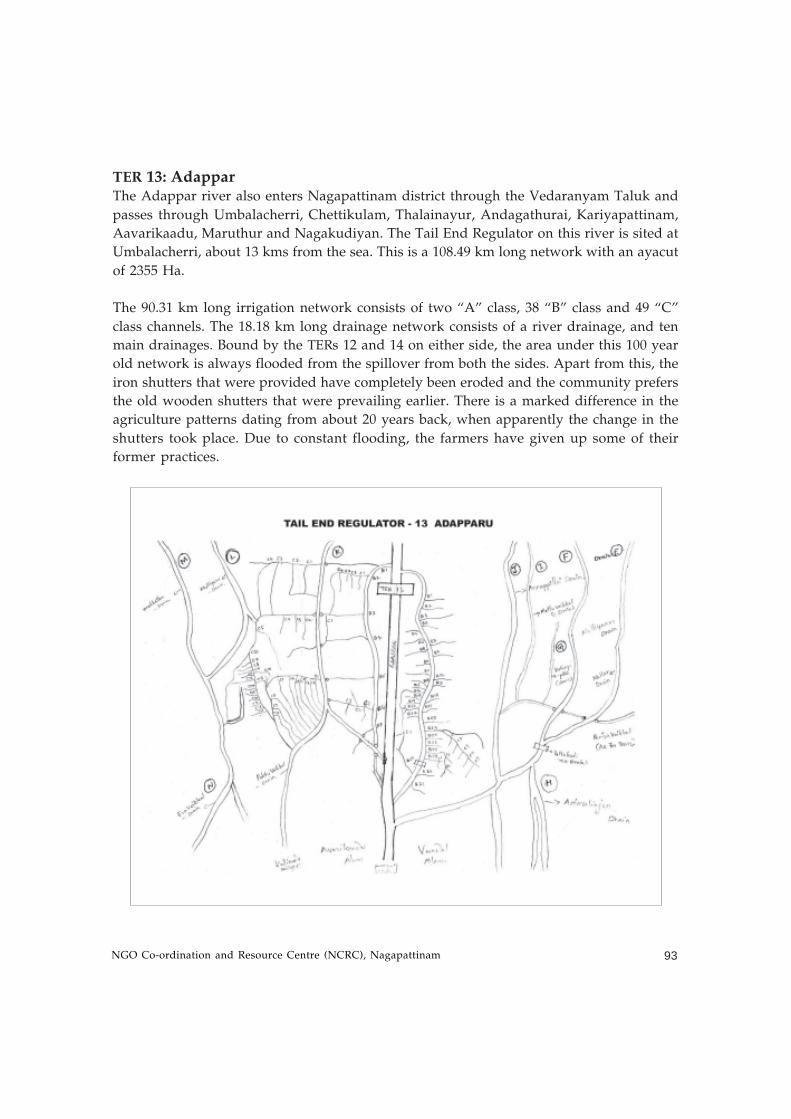
NGO Co-ordination and Resource Centre (NCRC), Nagapattinam 93
TER 13: AdapparThe Adappar river also enters Nagapattinam district through the Vedaranyam Taluk and
passes through Umbalacherri, Chettikulam, Thalainayur, Andagathurai, Kariyapattinam,
Aavarikaadu, Maruthur and Nagakudiyan. The Tail End Regulator on this river is sited at
Umbalacherri, about 13 kms from the sea. This is a 108.49 km long network with an ayacut
of 2355 Ha.
The 90.31 km long irrigation network consists of two “A” class, 38 “B” class and 49 “C”
class channels. The 18.18 km long drainage network consists of a river drainage, and ten
main drainages. Bound by the TERs 12 and 14 on either side, the area under this 100 year
old network is always flooded from the spillover from both the sides. Apart from this, the
iron shutters that were provided have completely been eroded and the community prefers
the old wooden shutters that were prevailing earlier. There is a marked difference in the
agriculture patterns dating from about 20 years back, when apparently the change in the
shutters took place. Due to constant flooding, the farmers have given up some of their
former practices.
Mapping and Study of Coastal Water Bodies in Nagapattinam District94
77% of the farmers here are marginal farmers, 21% small, about 2% medium and barely
0.5% are large farmers. There was a heavy dependence on wells numbering 3975, seen in
the three villages surveyed in this area. Due to the high volume of seawater ingress through
the backwaters, some of the farmers themselves have started converting their land into
shrimp farms. So, even if the farmers at the top end desire shutters blocking ingress closer
to the sea, the farmers at the tail end who access the sea water for shrimp cultivation
oppose it. There are functional registered water user associations in at least two of the
villages surveyed and they have been active in desilting and controlling damage to the
bunds. However, the bund walls, being made of sand, are weak and constantly vulnerable
to damages. They have requested for stronger bund walls.
About 4000 m2 of the channel area has been taken over for shrimp farming. Apart from
this, an estimated 4 lakh m3 of siltation and 1.75 lakh m3 of bund damages were observed.
The estimate for desilting of these channels is Rs. 87.26 lakhs and repairs to bunds is slated
at Rs. 30.9 lakhs. The total estimate for reviving this network is Rs. 1.18 crores, which
works out to Rs 5027/ Ha of ayacut. The details are as shown in Table 7.13.
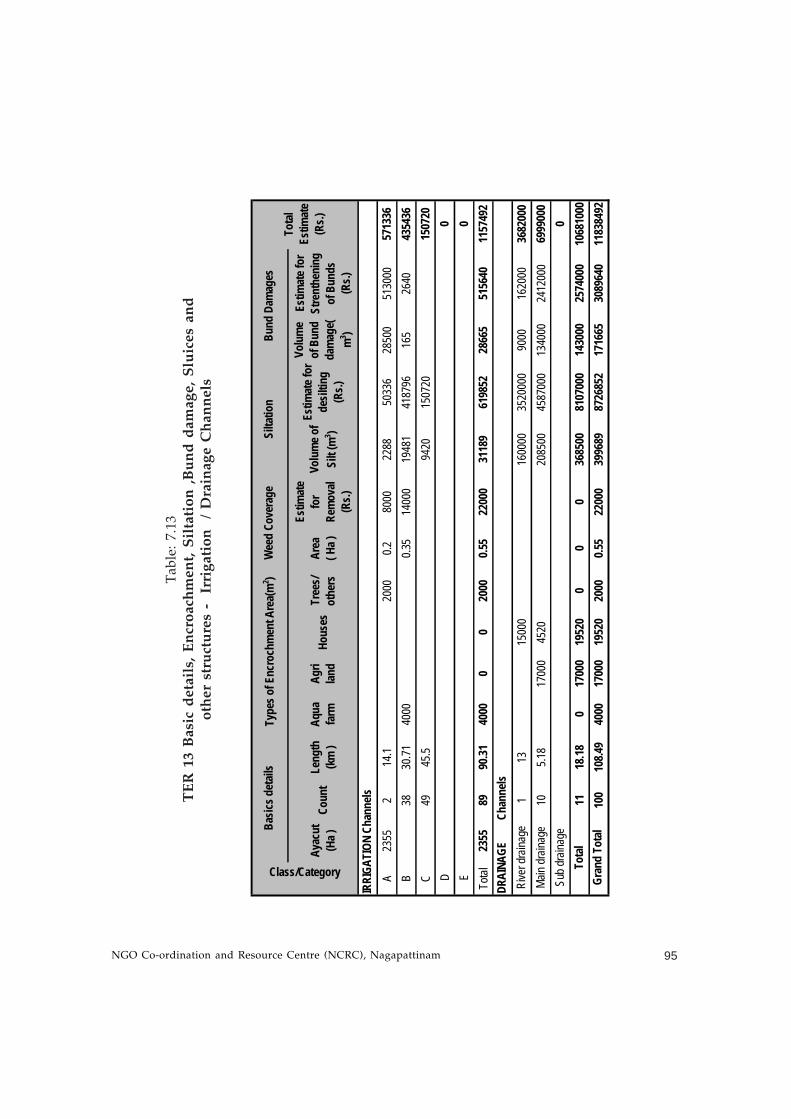
NGO Co-ordination and Resource Centre (NCRC), Nagapattinam 95
Ta
ble
: 7
.13
TE
R 1
3 B
asi
c d
eta
ils,
En
cro
ach
me
nt,
Sil
tati
on
,B
un
d d
am
ag
e,
Slu
ice
s a
nd
oth
er s
tru
ctu
res
- I
rrig
atio
n
/ D
rain
age
Ch
ann
els
Ayac
ut
(Ha )
Coun
tLe
ngth
(k
m )
Aqua
fa
rmAg
ri lan
dHo
uses
Tree
s/ ot
hers
Area
( H
a )
Estim
ate
for
Rem
oval
(Rs.)
Volu
me o
f Si
lt (m
3 )
Estim
ate f
or
desil
ting
(Rs.)
Volu
me
of B
und
dam
age(
m3 )
Estim
ate f
or
Stre
nthe
ning
of
Bun
ds
(Rs.)
A23
552
14.1
2000
0.280
0022
8850
336
2850
051
3000
5713
36B
3830
.7140
000.3
514
000
1948
141
8796
165
2640
4354
36C
4945
.594
2015
0720
1507
20 D
0 E
0To
tal23
5589
90.31
4000
00
2000
0.55
2200
031
189
6198
5228
665
5156
4011
5749
2
113
1500
016
0000
3520
000
9000
1620
0036
8200
010
5.18
1700
045
2020
8500
4587
000
1340
0024
1200
069
9900
00
1118
.180
1700
019
520
00
036
8500
8107
000
1430
0025
7400
010
6810
0010
010
8.49
4000
1700
019
520
2000
0.55
2200
039
9689
8726
852
1716
6530
8964
011
8384
92
IRRI
GATI
ON C
hann
els
DRAI
NAGE
Chan
nels
Basic
s det
ails
Type
s of E
ncro
chm
ent A
rea(
m2 )
Wee
d Co
vera
geSi
ltatio
n
Gran
d To
tal
Rive
r dra
inage
Main
drain
age
Sub d
raina
geTo
tal
Bund
Dam
ages
Tota
l Es
timat
e (R
s.)
Class/Category
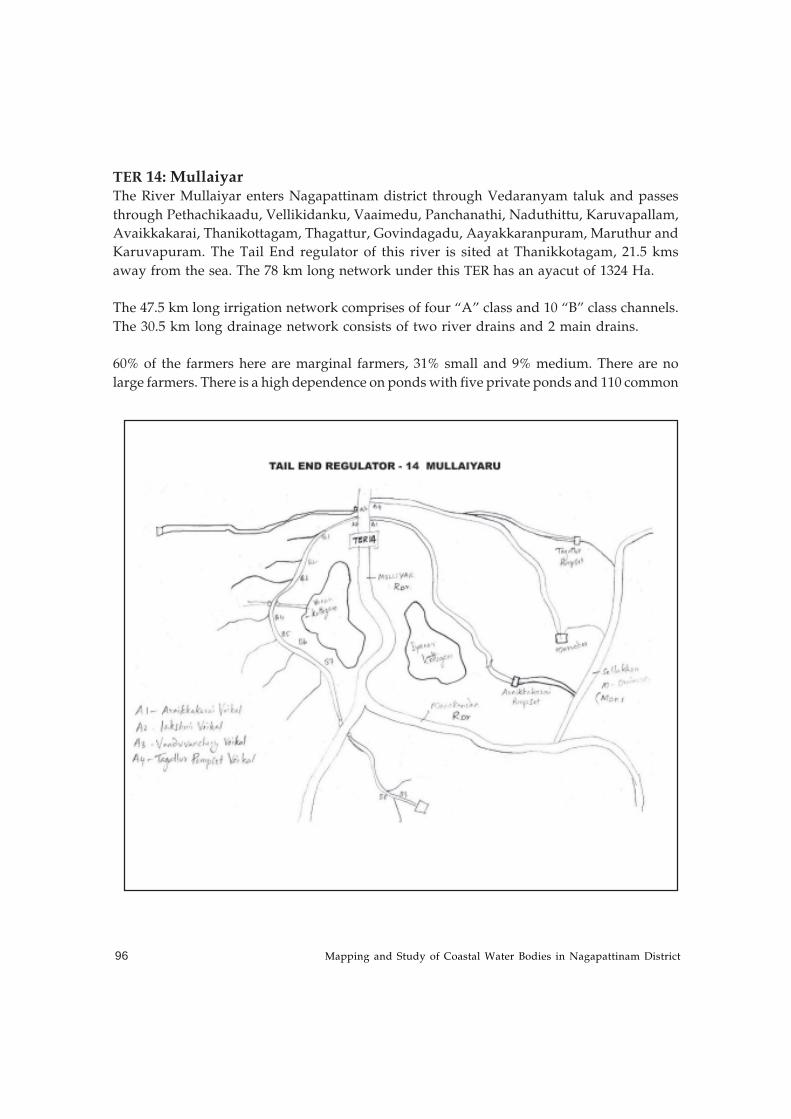
Mapping and Study of Coastal Water Bodies in Nagapattinam District96
TER 14: MullaiyarThe River Mullaiyar enters Nagapattinam district through Vedaranyam taluk and passes
through Pethachikaadu, Vellikidanku, Vaaimedu, Panchanathi, Naduthittu, Karuvapallam,
Avaikkakarai, Thanikottagam, Thagattur, Govindagadu, Aayakkaranpuram, Maruthur and
Karuvapuram. The Tail End regulator of this river is sited at Thanikkotagam, 21.5 kms
away from the sea. The 78 km long network under this TER has an ayacut of 1324 Ha.
The 47.5 km long irrigation network comprises of four “A” class and 10 “B” class channels.
The 30.5 km long drainage network consists of two river drains and 2 main drains.
60% of the farmers here are marginal farmers, 31% small and 9% medium. There are no
large farmers. There is a high dependence on ponds with five private ponds and 110 common
NGO Co-ordination and Resource Centre (NCRC), Nagapattinam 97
ponds in the two villages surveyed in this area. There are only two water channels available
and the poor availability of water sources is probably the reason why 100% of the farmers
here were totally dependant on the rain for their agriculture. Although paddy still continues
to be an important crop, the farmers here have started cultivating casuarina and tobacco
where the per-acre returns are seen to be higher than from paddy. There is also jasmine
cultivation in this area. The other reason for switching from paddy is also the non-
availability of sufficient water which has been vitiated by the height of a retaining wall
built in Thannikottai, eight to ten years ago, which prevents water from irrigating the
farms nearby. Although there are three pumping stations set up by the government about
20 years ago, none of these are functional as there was no water and the mechanism became
non- functional.
Although the Panchayat and the community had attempted at clearing the channels of
weeds, their disposal was stated as a problem. Dumping of the water hyacinth on the
bunds did not eradicate the problem, which just started all over again with the next rains
due to the slipping of the spores back into the water. The meeting of two drainage channels
towards the south of the block and the lack of a gradient has made the surrounding areas
swampy and no cultivation can be done in these areas. There were informal water user
groups, which met at the behest of the Panchayat and followed the decisions taken by
them.
The damage in this network is more through siltation, encroachment and weed coverage
rather than damages to the bund. Siltation is to the tune of 2.98 lakh m2 and about 27000 m2
of land is encroached for agricultural purposes. The estimate for desilting the entire network
is Rs. 64.54 lakhs and for weeding Rs. 9.36 lakhs. Including repairs, the total estimate for
revitalising this network is Rs. 74.40 lakhs, which works out to Rs. 5620/ ha of ayacut. The
details are as shown in Table 7.14.
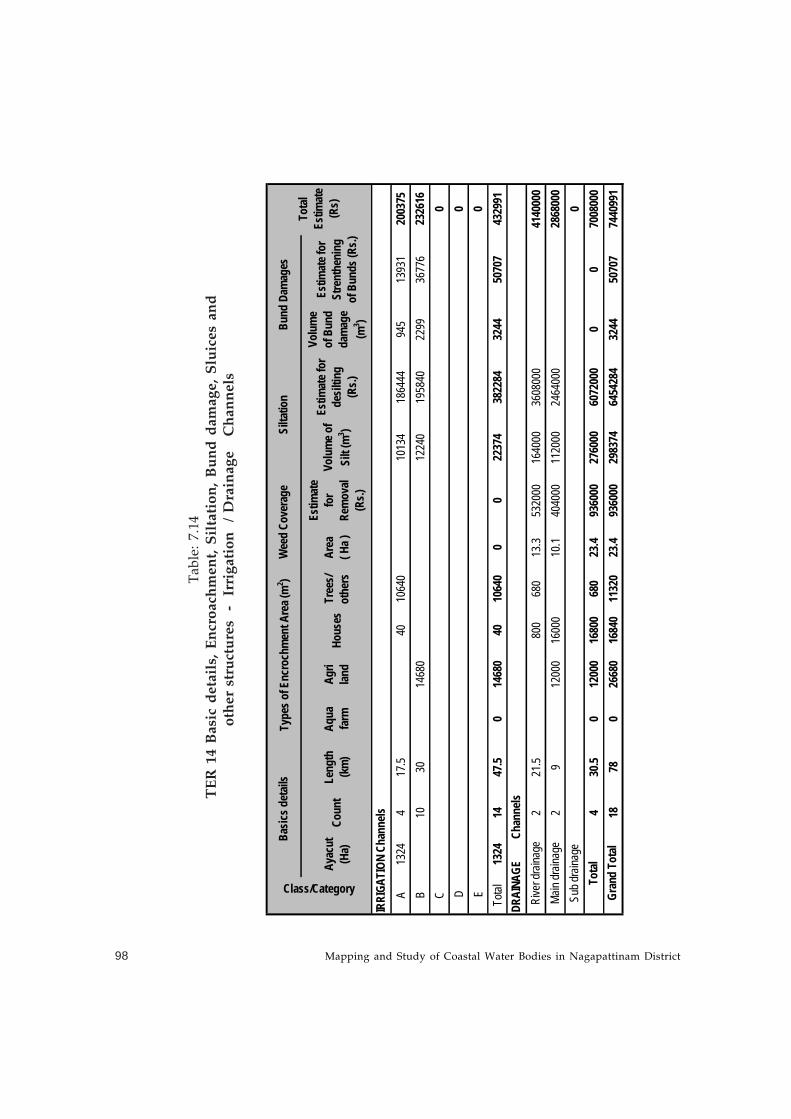
Mapping and Study of Coastal Water Bodies in Nagapattinam District98
Ta
ble
: 7
.14
TE
R 1
4 B
asi
c d
eta
ils,
En
cro
ach
me
nt,
Sil
tati
on
, B
un
d d
am
ag
e,
Slu
ice
s a
nd
oth
er s
tru
ctu
res
-
Irri
gat
ion
/
Dra
inag
e
Ch
ann
els
Ayac
ut
(Ha)
Coun
tLe
ngth
(k
m)
Aqua
fa
rmAg
ri lan
dHo
uses
Tree
s/ ot
hers
Area
( H
a )
Estim
ate
for
Rem
oval
(Rs.)
Volu
me o
f Si
lt (m
3 )
Estim
ate f
or
desil
ting
(Rs.)
Volu
me
of B
und
dam
age
(m3 )
Estim
ate f
or
Stre
nthe
ning
of
Bun
ds (R
s.)
A13
244
17.5
4010
640
1013
418
6444
945
1393
120
0375
B10
3014
680
1224
019
5840
2299
3677
623
2616
C0
D0
E0
Total
1324
1447
.50
1468
040
1064
00
022
374
3822
8432
4450
707
4329
91
221
.580
068
013
.353
2000
1640
0036
0800
041
4000
02
912
000
1600
010
.140
4000
1120
0024
6400
028
6800
00
430
.50
1200
016
800
680
23.4
9360
0027
6000
6072
000
00
7008
000
1878
026
680
1684
011
320
23.4
9360
0029
8374
6454
284
3244
5070
774
4099
1
IRRI
GATI
ON C
hann
els
DRAI
NAGE
Chan
nels
Gran
d To
tal
Rive
r dra
inage
Main
drain
age
Sub d
raina
geTo
tal
Tota
l Es
timat
e (R
s)
Bund
Dam
ages
Class/Category
Basic
s det
ails
Type
s of E
ncro
chm
ent A
rea (
m2 )
Wee
d Co
vera
geSi
ltatio
n
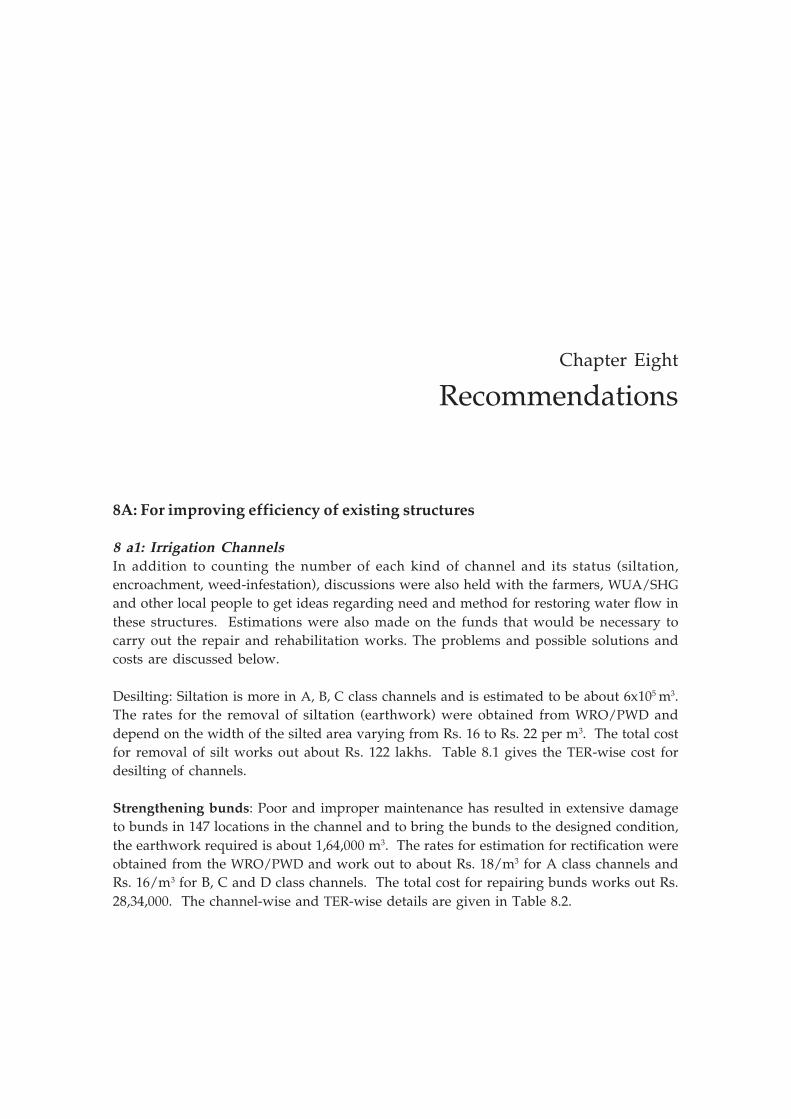
NGO Co-ordination and Resource Centre (NCRC), Nagapattinam 99
Chapter Eight
Recommendations
8A: For improving efficiency of existing structures
8 a1: Irrigation ChannelsIn addition to counting the number of each kind of channel and its status (siltation,
encroachment, weed-infestation), discussions were also held with the farmers, WUA/SHG
and other local people to get ideas regarding need and method for restoring water flow in
these structures. Estimations were also made on the funds that would be necessary to
carry out the repair and rehabilitation works. The problems and possible solutions and
costs are discussed below.
Desilting: Siltation is more in A, B, C class channels and is estimated to be about 6x10⁵ m3.
The rates for the removal of siltation (earthwork) were obtained from WRO/PWD and
depend on the width of the silted area varying from Rs. 16 to Rs. 22 per m3. The total cost
for removal of silt works out about Rs. 122 lakhs. Table 8.1 gives the TER-wise cost for
desilting of channels.
Strengthening bunds: Poor and improper maintenance has resulted in extensive damage
to bunds in 147 locations in the channel and to bring the bunds to the designed condition,
the earthwork required is about 1,64,000 m3. The rates for estimation for rectification were
obtained from the WRO/PWD and work out to about Rs. 18/m3 for A class channels and
Rs. 16/m3 for B, C and D class channels. The total cost for repairing bunds works out Rs.
28,34,000. The channel-wise and TER-wise details are given in Table 8.2.
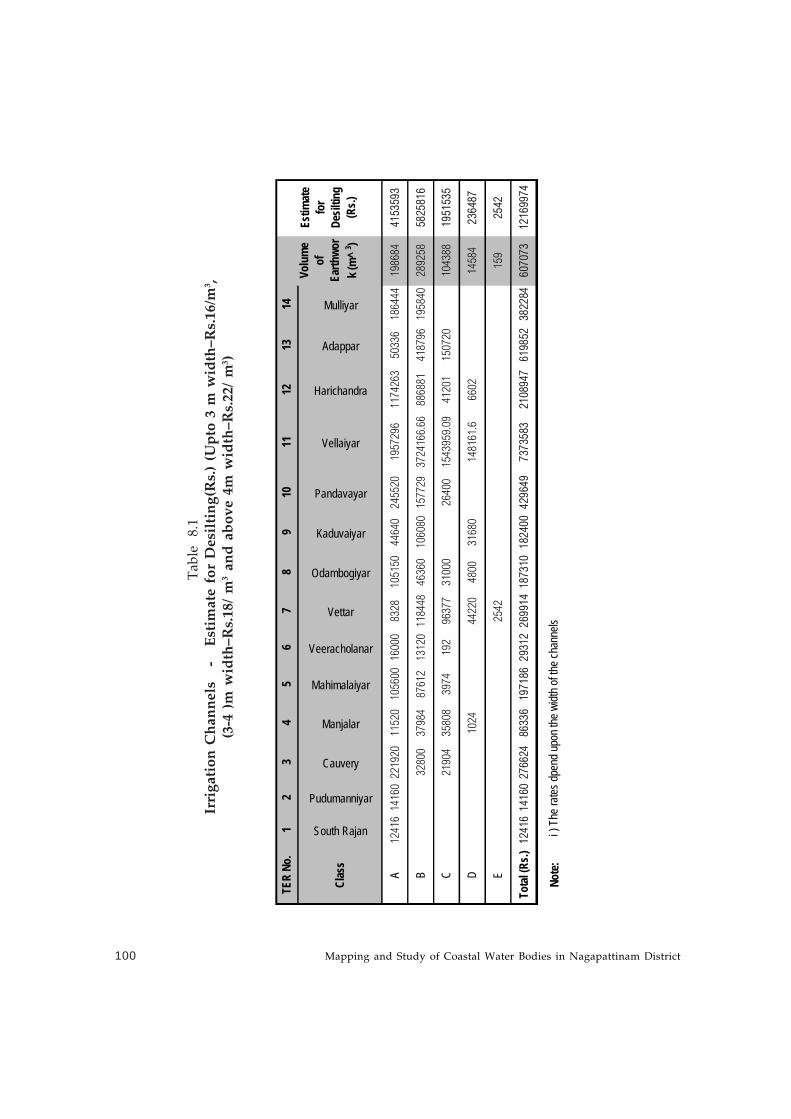
Mapping and Study of Coastal Water Bodies in Nagapattinam District100
Ta
ble
8
.1
Irr
igat
ion
Ch
ann
els
-
E
stim
ate
for
Des
ilti
ng
(Rs.
) (U
pto
3 m
wid
th–R
s.16
/m3 ,
(3-
4 )m
wid
th–R
s.18
/ m
3 a
nd
ab
ov
e 4m
wid
th–R
s.22
/ m
3)
TER
No.
12
34
56
78
910
1112
1314
Clas
s
South Rajan
Pudumanniyar
Cauvery
Manjalar
Mahimalaiyar
Veeracholanar
Vettar
Odambogiyar
Kaduvaiyar
Pandavayar
Vellaiyar
Harichandra
Adappar
Mulliyar
A12
416
1416
022
1920
1152
010
5600
1600
083
2810
5150
4464
024
5520
1957
296
1174
263
5033
618
6444
1986
8441
5359
3
B32
800
3798
487
612
1312
011
8448
4636
010
6080
1577
2937
2416
6.66
8868
8141
8796
1958
4028
9258
5825
816
C21
904
3580
839
7419
296
377
3100
026
400
1543
959.
0941
201
1507
2010
4388
1951
535
D10
2444
220
4800
3168
014
8161
.666
0214
584
2364
87
E25
4215
925
42
Total
(Rs.)
1241
614
160
2766
2486
336
1971
8629
312
2699
1418
7310
1824
0042
9649
7373
583
2108
947
6198
5238
2284
6070
7312
1699
74
Note
: i
) Th
e rate
s dpe
nd up
on th
e widt
h of th
e cha
nnels
Estim
ate
for
Desil
ting
(Rs.)
Volu
me
of
Earth
wor
k (m
^ 3 )
NGO Co-ordination and Resource Centre (NCRC), Nagapattinam 101
Ta
ble
8.2
Irri
gat
ion
Ch
ann
els
- E
stim
ate
for
Str
eng
then
ing
of
Bu
nd
s (R
s.)
(Fo
r A
ch
an
ne
l-R
s.1
8/
m3 ,
B
CD
E c
ha
nn
els
- R
s.1
6/
m3 )
TER
No.
12
34
56
78
910
1112
1314
Clas
s
South Rajan
Pudumanniyar
Cauvery
Manjalar
Mahimalaiyar
Veeracholanar
Vettar
Odambogiyar
Kaduvaiyar
Pandavayar
Vellaiyar
Harichandra
Adappar
Mulliyar
A75
483
3902
411
025
2658
225
9290
047
3229
8406
025
9965
1270
140
9023
2106
5130
0013
931.
110
7039
1923
621
B17
456
772.
836
0060
8574
416
0300
1228
821
136
2640
3677
643
573
6971
73
C14
6125
4660
715
540
1020
1308
120
9292
D42
0826
342
08
Tota
l (Rs
.)754
8339
024
2848
126
582
3365
900
9794
1422
0619
4358
0526
009
4301
5921
0651
5640
5070
716
3956
2834
295
Note:
i) T
he ra
tes dp
end u
pon t
he to
p widt
h of th
e bun
ds
Estim
ate f
or
Stre
ngth
eni
ng o
f Bun
d (R
s.)
Volu
me o
f Ea
rthwo
rk
(m^ 3 )
Mapping and Study of Coastal Water Bodies in Nagapattinam District102
Encroachment: This is an important and difficult problem as eviction of encroachers is
possible only by the Revenue Department. The WRO/PWD does not have the authority to
remove encroachments even when it directly affects water flow in channels. The High
Court has advised the State Government to take action to evict the encroachers in all the
water bodies, but the implementation is not progressing well.
Weed Infestation: Water hyacinth growing in the channels is a problem as it reduces the
flow during rains and hence results in flooding. The cost for removal of this vegetation is
about Rs. 4/m2 or Rs. 40,000/ ha. The total cost for removing this weed in all the irrigation
channels may be about Rs. 13,86,000. Table 8.3 gives the area in each channel affected by
the weed and the cost for removing and destroying the weed.
Other structures: There are about 258 sluices in the entire study area of which 44 are
abandoned. The areas that were under the abandoned sluices are now irrigated through
nearby sluices.
The different types of damages noticed in the sluices are in masonry and in shutters. To get
an idea of repair costs, the damaged masonry structures were classified into three categories
based on the extent of damage (25%, 50%, and 100%). For each category, approximate
repair costs were obtained from WRO/PWD. Accordingly, about 147 sluices require various
levels of repairing/rehabilitation. The total cost for repairing the masonry damages
works out to Rs. 53,35,000. Similarly, the damages to the shutters were also studied
and classified into 2 categories namely 50% and 100% damages. 107 out of 214 shutters
were found damaged and the cost for repair and rehabilitation works out to about Rs.
23,00,000 (Table 8.4).
The cost for the repair and maintenance of the 14 TERs (as in actual structures) are not
included in this report as the WRO/PWD has already submitted detailed estimates to the
government for repairs and rehabilitation at a cost of Rs. 1637 lakhs. The works are
expected to be taken up by the WRO/PWD as soon as the approval is given by the
government.
Apart from sluices and regulators, other structures in the irrigation channels include bed
dam, culverts, pipes and siphons. There are 284 structures of this type in the study
area. The cost of the repairs and rehabilitation of these structures are given in
Table 8.5. The total cost is Rs.11 lakhs to repair the existing structures and Rs. 13.70
lakhs for construction of new structures, totaling Rs 24.7 lakhs. It is also suggested
that a series of regulators be provided in the main river channels to regulate the
flow for irrigation. A number of small check dams may be constructed to store the
flood water at appropriate places.
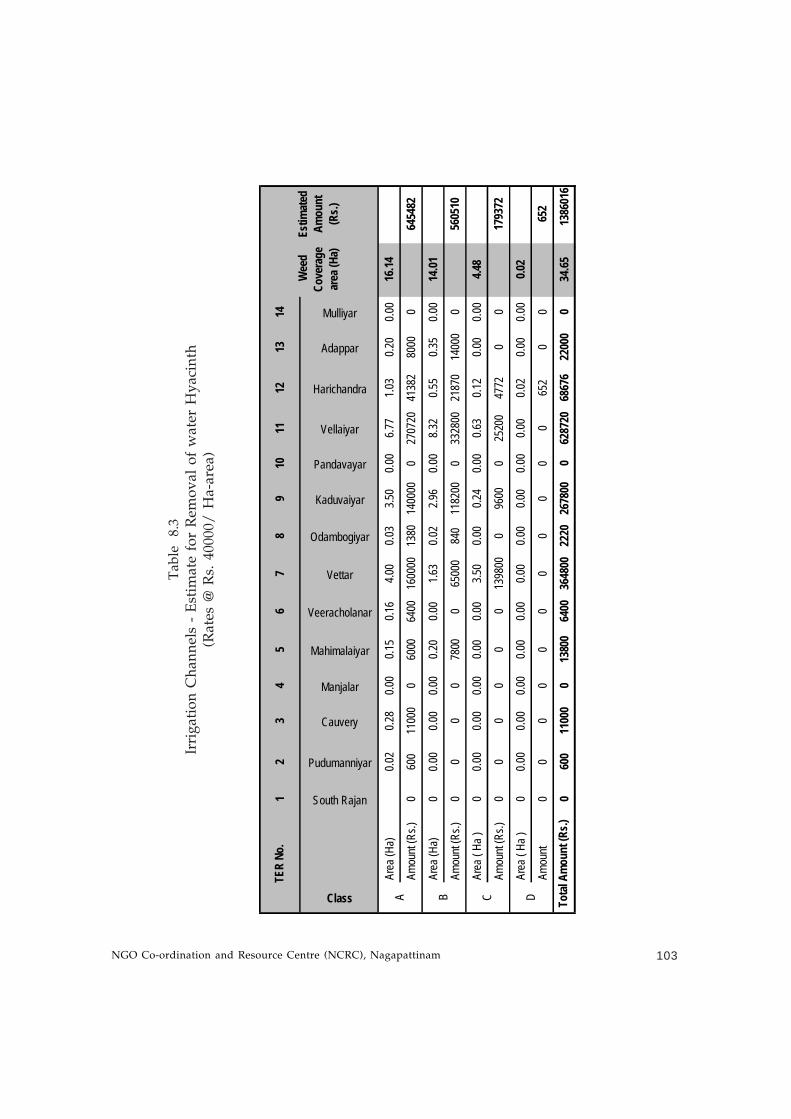
NGO Co-ordination and Resource Centre (NCRC), Nagapattinam 103
Ta
ble
8
.3
Irri
gat
ion
Ch
ann
els
- E
stim
ate
for
Rem
ov
al o
f w
ater
Hy
acin
th(R
ate
s @
Rs.
40
00
0/
Ha
-are
a)
12
34
56
78
910
1112
1314
Class
South Rajan
Pudumanniyar
Cauvery
Manjalar
Mahimalaiyar
Veeracholanar
Vettar
Odambogiyar
Kaduvaiyar
Pandavayar
Vellaiyar
Harichandra
Adappar
Mulliyar
Area
(Ha)
0.02
0.28
0.00
0.15
0.16
4.00
0.03
3.50
0.00
6.77
1.03
0.20
0.00
16.14
Amou
nt (R
s.)0
600
1100
00
6000
6400
1600
0013
8014
0000
027
0720
4138
280
000
6454
82
Area
(Ha)
00.0
00.0
00.0
00.2
00.0
01.6
30.0
22.9
60.0
08.3
20.5
50.3
50.0
014
.01
Amou
nt (R
s.)0
00
078
000
6500
084
011
8200
033
2800
2187
014
000
056
0510
Area
( Ha
)0
0.00
0.00
0.00
0.00
0.00
3.50
0.00
0.24
0.00
0.63
0.12
0.00
0.00
4.48
Amou
nt (R
s.)0
00
00
013
9800
096
000
2520
047
720
017
9372
Area
( Ha
)0
0.00
0.00
0.00
0.00
0.00
0.00
0.00
0.00
0.00
0.00
0.02
0.00
0.00
0.02
Amou
nt0
00
00
00
00
00
652
00
652
060
011
000
013
800
6400
3648
0022
2026
7800
062
8720
6867
622
000
034
.6513
8601
6To
tal A
mou
nt (R
s.)
DCB
Wee
d Co
vera
ge
area
(Ha)
Estim
ated
Am
ount
(R
s.)
A
TER
No.
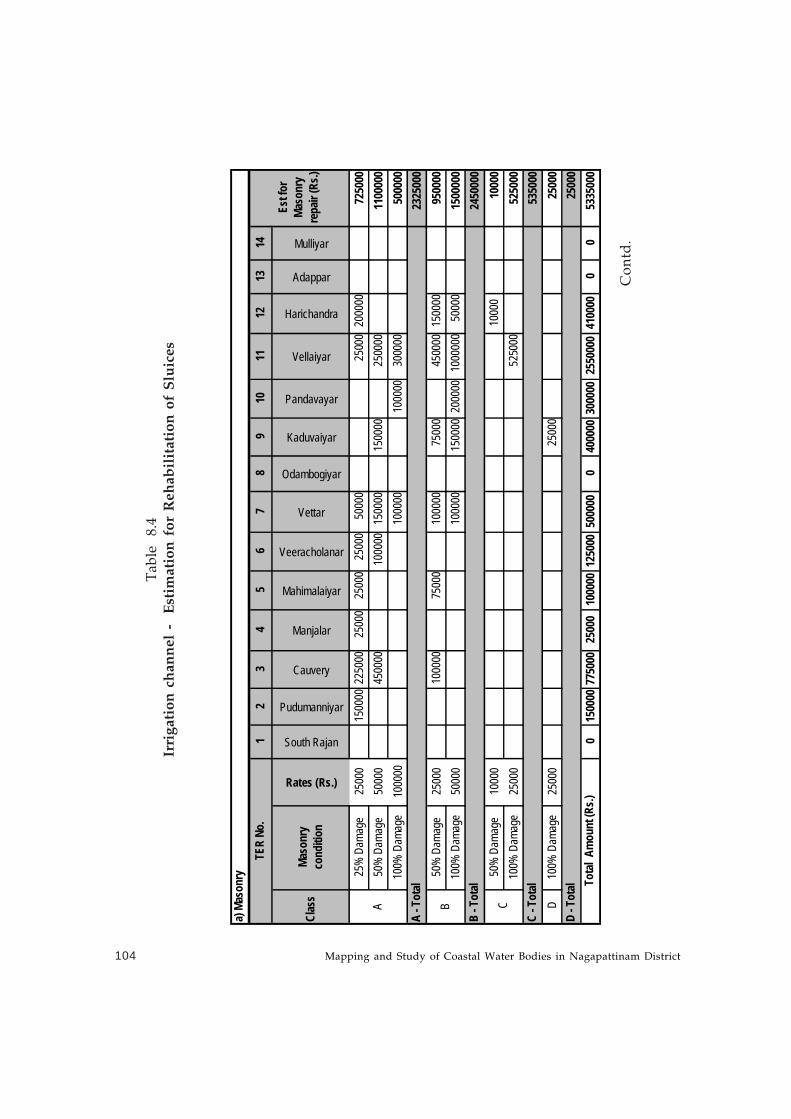
Mapping and Study of Coastal Water Bodies in Nagapattinam District104
Tab
le
8.4
Irri
gat
ion
ch
ann
el -
E
stim
atio
n f
or
Reh
abil
itat
ion
of
Slu
ices
Co
ntd
.
12
34
56
78
910
1112
1314
Clas
sMa
sonr
y co
nditi
on
Rates (Rs.)
South Rajan
Pudumanniyar
Cauvery
Manjalar
Mahimalaiyar
Veeracholanar
Vettar
Odambogiyar
Kaduvaiyar
Pandavayar
Vellaiyar
Harichandra
Adappar
Mulliyar
25%
Dam
age
2500
015
0000
2250
0025
000
2500
025
000
5000
025
000
2000
0072
5000
50%
Dam
age
5000
045
0000
1000
0015
0000
1500
0025
0000
1100
000
100%
Dam
age
1000
0010
0000
1000
0030
0000
5000
0023
2500
050
% D
amag
e25
000
1000
0075
000
1000
0075
000
4500
0015
0000
9500
0010
0% D
amag
e50
000
1000
0015
0000
2000
0010
0000
050
000
1500
000
2450
000
50%
Dam
age
1000
010
000
1000
010
0% D
amag
e25
000
5250
0052
5000
5350
00 D
100%
Dam
age
2500
025
000
2500
025
000
015
0000
7750
0025
000
1000
0012
5000
5000
000
4000
0030
0000
2550
000
4100
000
053
3500
0
a) M
ason
ry
A - T
otal
B - T
otal
BA
D - T
otal
Est f
or
Maso
nry
repa
ir (R
s.)
TER
No.
Tota
l Am
ount
(Rs.)
C - T
otal
C
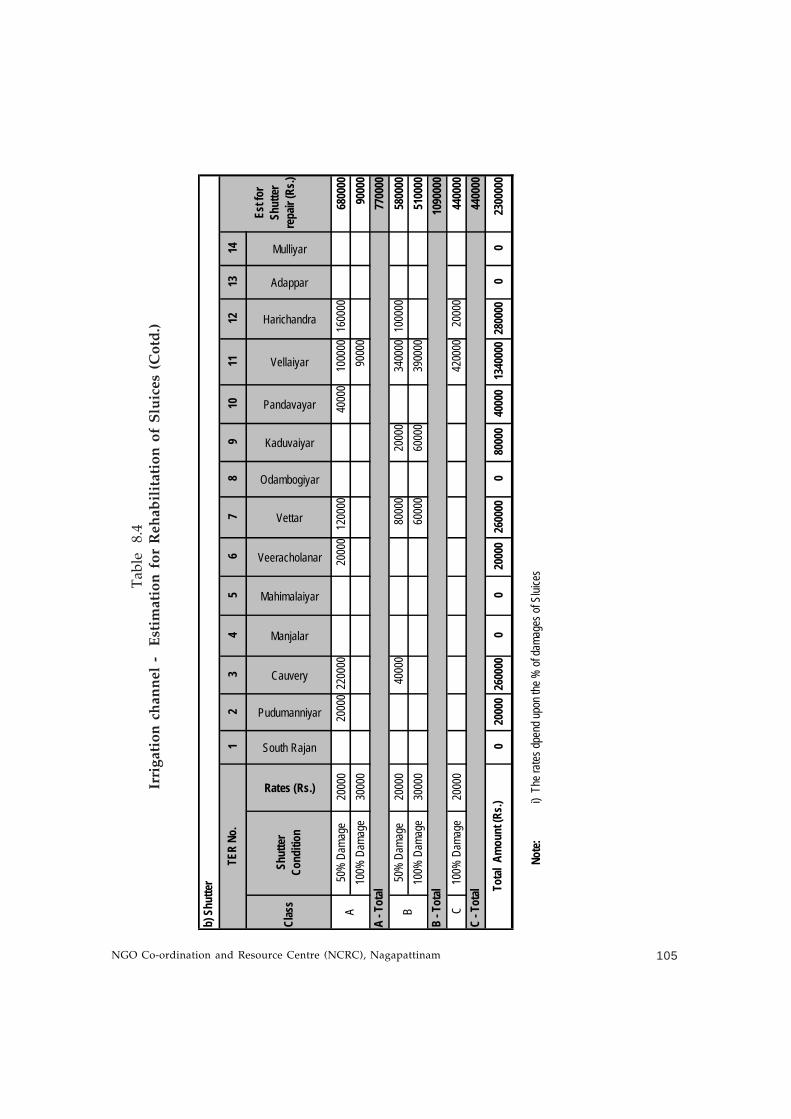
NGO Co-ordination and Resource Centre (NCRC), Nagapattinam 105
Tab
le
8.4
Irri
gat
ion
ch
ann
el -
E
stim
atio
n f
or
Reh
abil
itat
ion
of
Slu
ices
(C
otd
.)
12
34
56
78
910
1112
1314
Clas
sSh
utte
r Co
nditi
on
Rates (Rs.)
South Rajan
Pudumanniyar
Cauvery
Manjalar
Mahimalaiyar
Veeracholanar
Vettar
Odambogiyar
Kaduvaiyar
Pandavayar
Vellaiyar
Harichandra
Adappar
Mulliyar
50%
Dam
age
2000
020
000
2200
0020
000
1200
0040
000
1000
0016
0000
6800
0010
0% D
amag
e30
000
9000
090
000
7700
0050
% D
amag
e20
000
4000
080
000
2000
034
0000
1000
0058
0000
100%
Dam
age
3000
060
000
6000
039
0000
5100
0010
9000
0 C
100%
Dam
age
2000
042
0000
2000
044
0000
4400
00
020
000
2600
000
020
000
2600
000
8000
040
000
1340
000
2800
000
023
0000
0
Note
: i)
The
rates
dpen
d upo
n the
% of
dama
ges o
f Slui
ces
TER
No.
Est f
or
Shut
ter
repa
ir (R
s.)
C - T
otal To
tal A
mou
nt (R
s.)
b) S
hutte
r
A B
A - T
otal
B - T
otal
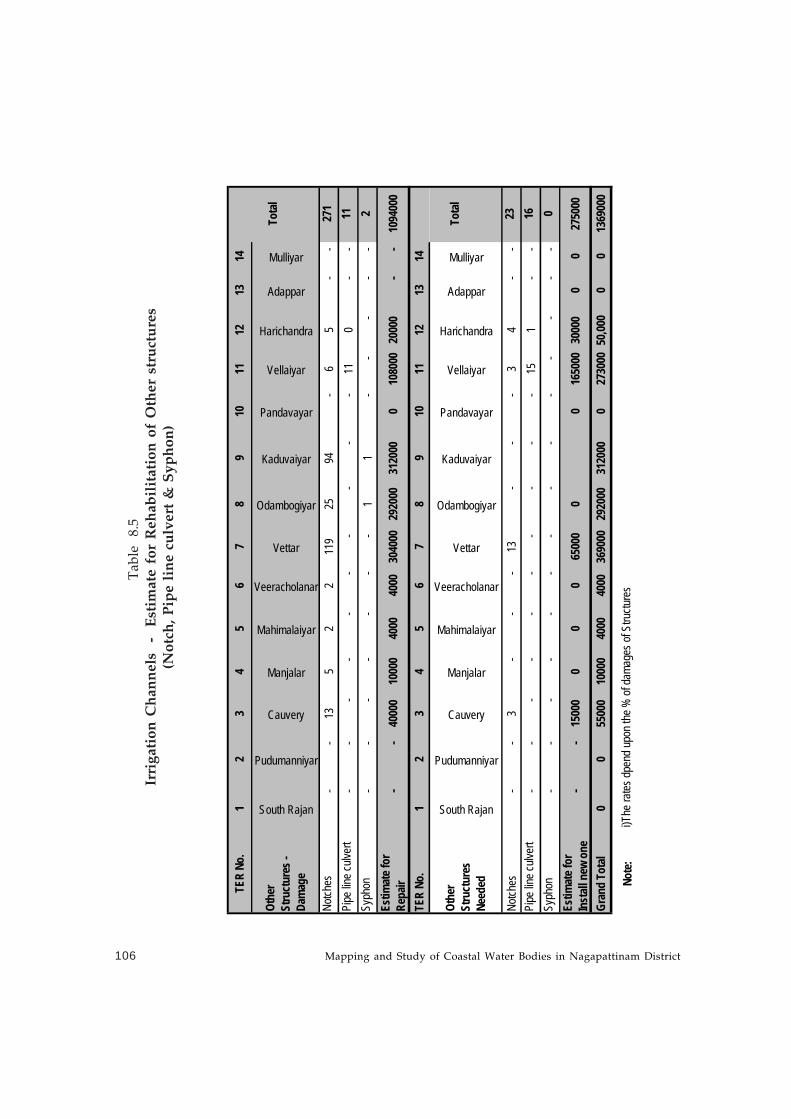
Mapping and Study of Coastal Water Bodies in Nagapattinam District106
Ta
ble
8
.5
Irr
igat
ion
Ch
ann
els
-
Est
imat
e fo
r R
ehab
ilit
atio
n o
f O
ther
str
uct
ure
s (
No
tch
, P
ipe
lin
e cu
lver
t &
Sy
ph
on
)
TER
No.
12
34
56
78
910
1112
1314
Othe
r St
ruct
ures
- Da
mag
e
South Rajan
Pudumanniyar
Cauvery
Manjalar
Mahimalaiyar
Veeracholanar
Vettar
Odambogiyar
Kaduvaiyar
Pandavayar
Vellaiyar
Harichandra
Adappar
Mulliyar
Notch
es
-
-
13
52
211
925
94
-
65
-
-
27
1Pi
pe lin
e culv
ert
-
-
-
-
-
-
-
-
-
-
11
0
-
-
11Sy
phon
-
-
-
-
-
-
-
11
-
-
-
-
-
2
Estim
ate f
or
Repa
ir
-
-
40
000
1000
040
0040
0030
4000
2920
0031
2000
010
8000
2000
0
-
-
1094
000
TER
No.
12
34
56
78
910
1112
1314
Othe
r St
ruct
ures
Ne
eded
South Rajan
Pudumanniyar
Cauvery
Manjalar
Mahimalaiyar
Veeracholanar
Vettar
Odambogiyar
Kaduvaiyar
Pandavayar
Vellaiyar
Harichandra
Adappar
Mulliyar
Notch
es
-
-
3
-
-
-
13
-
-
-
3
4
-
-
23Pi
pe lin
e culv
ert
-
-
-
-
-
-
-
-
-
-
15
1
-
-
16Sy
phon
-
-
-
-
-
-
-
-
-
-
-
-
-
-
0
Estim
ate f
or
Inst
all n
ew o
ne
-
-
15
000
00
065
000
00
1650
0030
000
00
2750
00
Gran
d To
tal
00
5500
010
000
4000
4000
3690
0029
2000
3120
000
2730
0050
,000
0
013
6900
0
Note
: i)
The r
ates d
pend
upon
the %
of da
mage
s of S
tructu
res
Tota
l
Tota
l
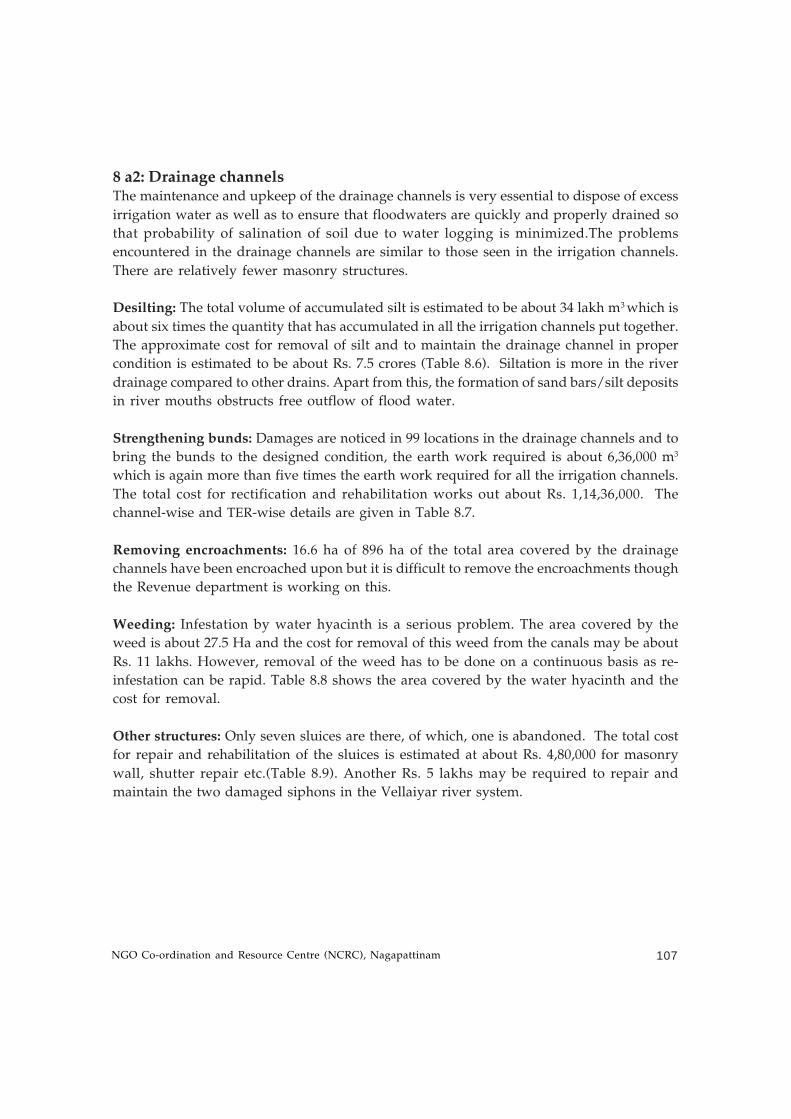
NGO Co-ordination and Resource Centre (NCRC), Nagapattinam 107
8 a2: Drainage channelsThe maintenance and upkeep of the drainage channels is very essential to dispose of excess
irrigation water as well as to ensure that floodwaters are quickly and properly drained so
that probability of salination of soil due to water logging is minimized.The problems
encountered in the drainage channels are similar to those seen in the irrigation channels.
There are relatively fewer masonry structures.
Desilting: The total volume of accumulated silt is estimated to be about 34 lakh m3 which is
about six times the quantity that has accumulated in all the irrigation channels put together.
The approximate cost for removal of silt and to maintain the drainage channel in proper
condition is estimated to be about Rs. 7.5 crores (Table 8.6). Siltation is more in the river
drainage compared to other drains. Apart from this, the formation of sand bars/silt deposits
in river mouths obstructs free outflow of flood water.
Strengthening bunds: Damages are noticed in 99 locations in the drainage channels and to
bring the bunds to the designed condition, the earth work required is about 6,36,000 m3
which is again more than five times the earth work required for all the irrigation channels.
The total cost for rectification and rehabilitation works out about Rs. 1,14,36,000. The
channel-wise and TER-wise details are given in Table 8.7.
Removing encroachments: 16.6 ha of 896 ha of the total area covered by the drainage
channels have been encroached upon but it is difficult to remove the encroachments though
the Revenue department is working on this.
Weeding: Infestation by water hyacinth is a serious problem. The area covered by the
weed is about 27.5 Ha and the cost for removal of this weed from the canals may be about
Rs. 11 lakhs. However, removal of the weed has to be done on a continuous basis as re-
infestation can be rapid. Table 8.8 shows the area covered by the water hyacinth and the
cost for removal.
Other structures: Only seven sluices are there, of which, one is abandoned. The total cost
for repair and rehabilitation of the sluices is estimated at about Rs. 4,80,000 for masonry
wall, shutter repair etc.(Table 8.9). Another Rs. 5 lakhs may be required to repair and
maintain the two damaged siphons in the Vellaiyar river system.
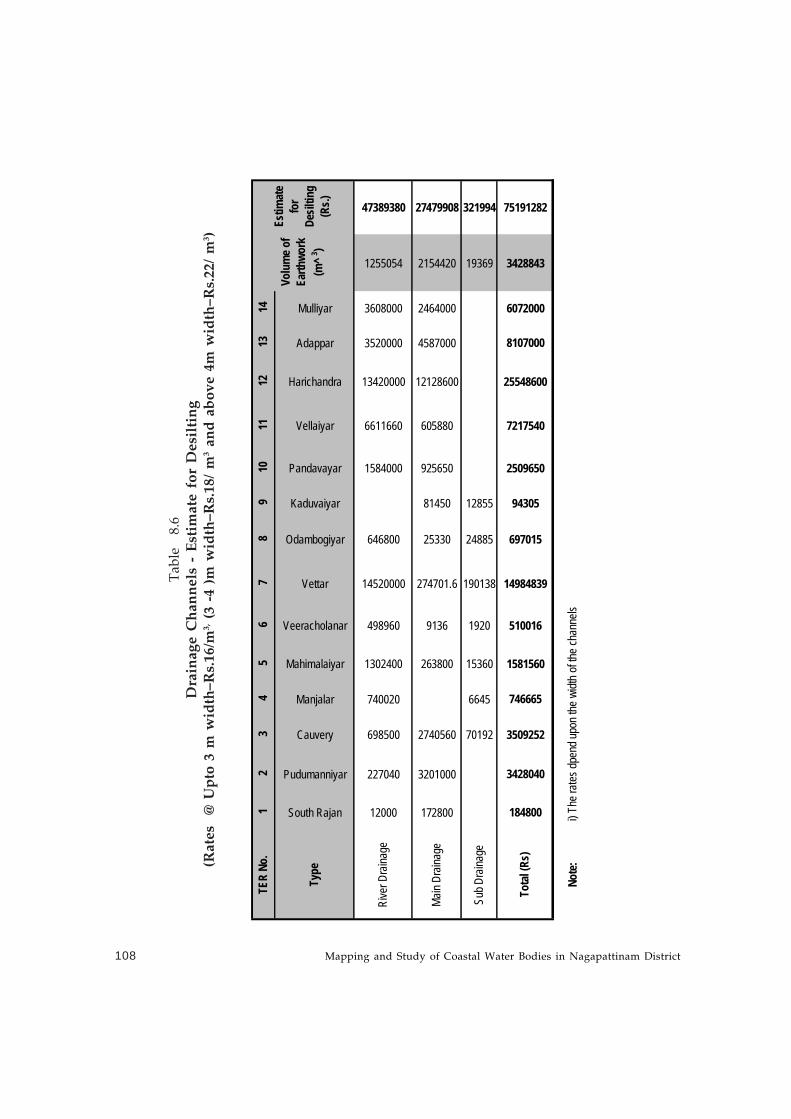
Mapping and Study of Coastal Water Bodies in Nagapattinam District108
Ta
ble
8
.6
Dra
ina
ge
Ch
an
ne
ls -
Est
ima
te f
or
De
silt
ing
(Rat
es
@ U
pto
3 m
wid
th–R
s.16
/m3, (
3 -4
)m
wid
th–R
s.18
/ m
3 an
d a
bo
ve
4m w
idth
–Rs.
22/
m3 )
TER
No.
12
34
56
78
910
1112
1314
Type
South Rajan
Pudumanniyar
Cauvery
Manjalar
Mahimalaiyar
Veeracholanar
Vettar
Odambogiyar
Kaduvaiyar
Pandavayar
Vellaiyar
Harichandra
Adappar
Mulliyar
Rive
r Dra
inage
12000
227040
698500
740020
1302400
498960
14520000
646800
1584000
6611660
13420000
3520000
3608000
1255054
47389380
Main
Drain
age
172800
3201000
2740560
263800
9136
274701.6
25330
81450
925650
605880
12128600
4587000
2464000
2154420
27479908
Sub D
raina
ge
70192
6645
15360
1920
190138
24885
12855
19369
321994
Tota
l (Rs
)
184800
3428040
3509252
746665
1581560
510016
14984839
697015
94305
2509650
7217540
25548600
8107000
6072000
3428843
75191282
Note
: i
) The
rates
dpen
d upo
n the
widt
h of th
e cha
nnels
Volu
me o
f Ea
rthwo
rk
(m^ 3 )
Estim
ate
for
Desil
ting
(Rs.)
NGO Co-ordination and Resource Centre (NCRC), Nagapattinam 109
Ta
ble
8.7
Dra
inag
e C
han
nel
s -
Est
imat
e fo
r S
tren
gth
enin
g o
f B
un
ds
(Rat
es @
R
DR
& M
DR
- R
s.1
8/
m3
SD
R c
han
nel
-Rs.
16/
m3 )
TER
No.
12
34
56
78
910
1112
1314
Type
South Rajan
Pudumanniyar
Cauvery
Manjalar
Mahimalaiyar
Veeracholanar
Vettar
Odambogiyar
Kaduvaiyar
Pandavayar
Vellaiyar
Harichandra
Adappar
Mulliyar
Rive
r Dr
ainag
e
2362.5
8100
99720
720900
819113
1188000
242550
81000
1088640
1471050
786852.29
162000
370572
6670287
Main
Drain
age
19125
91125
95400
158400
267120
10868
21848
493560
209376
895691.88
2412000
259695
4674513
Sub D
raina
ge
2688
81792
6592
5692
91072
Tota
l (Rs.)
21488
91125
103500
99720
881988
819113
1536912
260010
102848
1582200
1680426
1682544
2574000
0
635959
11435872
Note
: i)
The
rates
dpen
d upo
n the
top w
idth o
f the b
unds
Volu
me o
f Ea
rthwo
rk
(m3 )
Estim
ate f
or
Stre
ngth
enin
g of
Bun
d (R
s.)
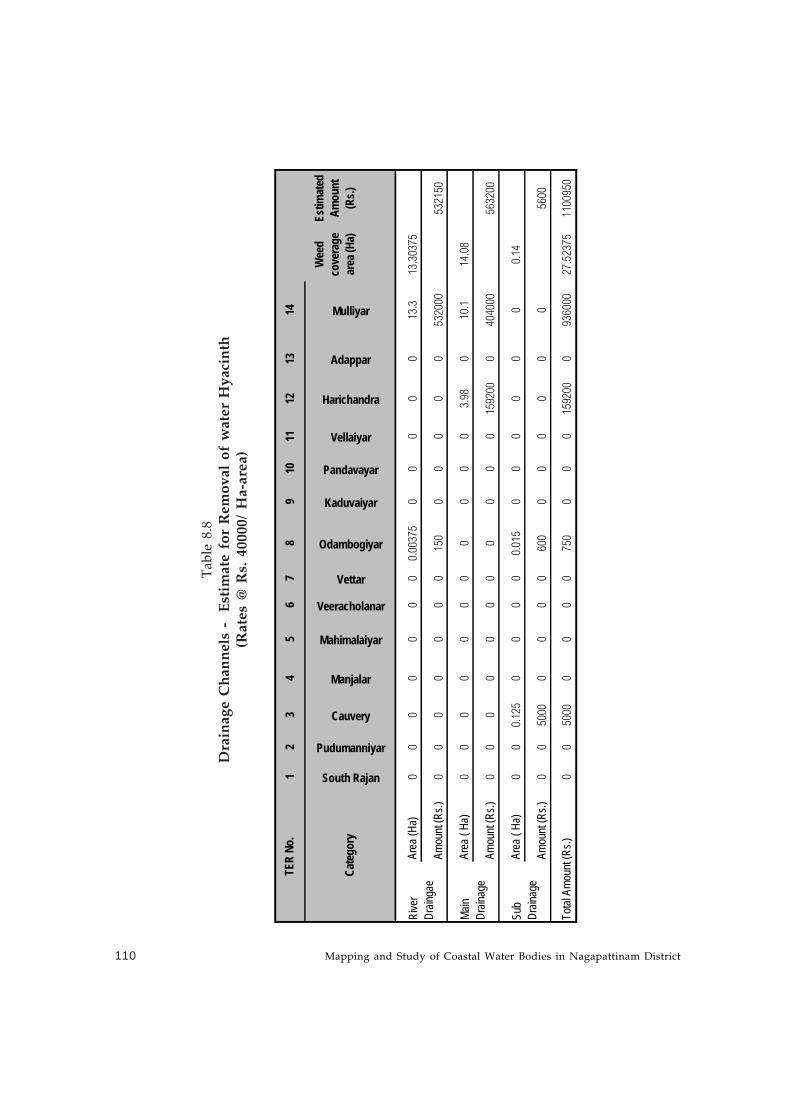
Mapping and Study of Coastal Water Bodies in Nagapattinam District110
Ta
ble
8.8
Dra
inag
e C
han
nel
s -
Est
imat
e fo
r R
emo
val
of
wat
er H
yac
inth
(Ra
tes
@ R
s. 4
00
00
/ H
a-a
rea
)
12
34
56
78
910
1112
1314
South Rajan
Pudumanniyar
Cauvery
Manjalar
Mahimalaiyar
Veeracholanar
Vettar
Odambogiyar
Kaduvaiyar
Pandavayar
Vellaiyar
Harichandra
Adappar
Mulliyar
Area
(Ha)
00
00
00
00.
0037
50
00
00
13.3
13.3
0375
Amou
nt (R
s.)0
00
00
00
150
00
00
053
2000
5321
50
Area
( Ha
)0
00
00
00
00
00
3.98
010
.114
.08
Amou
nt (R
s.)0
00
00
00
00
00
1592
000
4040
0056
3200
Area
( Ha
)0
00.
125
00
00
0.01
50
00
00
00.
14
Amou
nt (R
s.)0
050
000
00
060
00
00
00
056
00
Total
Amo
unt (
Rs.)
00
5000
00
00
750
00
015
9200
093
6000
27.5
2375
1100
950
Estim
ated
Am
ount
(R
s.)
Rive
r Dr
ainga
e
Main
Drain
age
Sub
Drain
age C
ateg
ory
TER
No.
Wee
d co
vera
ge
area
(Ha)
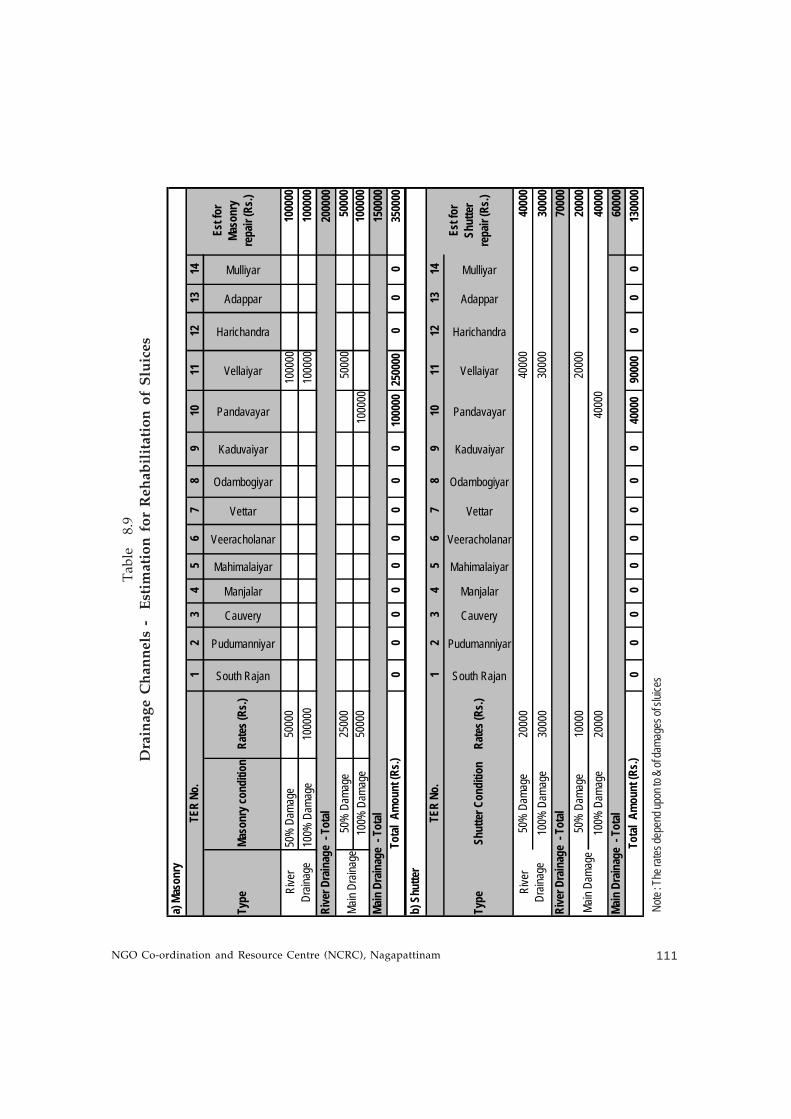
NGO Co-ordination and Resource Centre (NCRC), Nagapattinam 111
Ta
ble
8
.9
Dra
inag
e C
han
nel
s -
Est
imat
ion
fo
r R
ehab
ilit
atio
n o
f S
luic
es
12
34
56
78
910
1112
1314
Type
Maso
nry c
ondi
tion
Rate
s (Rs
.)
South Rajan
Pudumanniyar
Cauvery
Manjalar
Mahimalaiyar
Veeracholanar
Vettar
Odambogiyar
Kaduvaiyar
Pandavayar
Vellaiyar
Harichandra
Adappar
Mulliyar50
% D
amag
e50
000
1000
0010
0000
100%
Dam
age
1000
0010
0000
1000
0020
0000
50%
Dam
age
2500
050
000
5000
010
0% D
amag
e50
000
1000
0010
0000
1500
000
00
00
00
00
1000
0025
0000
00
035
0000
12
34
56
78
910
1112
1314
Type
Shut
ter C
ondi
tion
Rate
s (Rs
.)
South Rajan
Pudumanniyar
Cauvery
Manjalar
Mahimalaiyar
Veeracholanar
Vettar
Odambogiyar
Kaduvaiyar
Pandavayar
Vellaiyar
Harichandra
Adappar
Mulliyar
50%
Dam
age
2000
040
000
4000
010
0% D
amag
e30
000
3000
030
000
7000
050
% D
amag
e10
000
2000
020
000
100%
Dam
age
2000
040
000
4000
060
000
00
00
00
00
040
000
9000
00
00
1300
00
Est f
or
Shut
ter
repa
ir (R
s.)
a) M
ason
ryTE
R No
.
Est f
or
Maso
nry
repa
ir (R
s.)
Rive
r Dr
ainag
eRi
ver D
rain
age
- Tot
al
Tota
l Am
ount
(Rs.)
Main
Drain
age
Main
Dra
inag
e - T
otal
Tota
l Am
ount
(Rs.)
b) S
hutte
rTE
R No
.
Rive
r Dr
ainag
eRi
ver D
rain
age
- Tot
al
Main
Dama
ge
Main
Dra
inag
e - T
otal
Note
: The
rates
depe
nd up
on to
& of
dama
ges o
f slui
ces
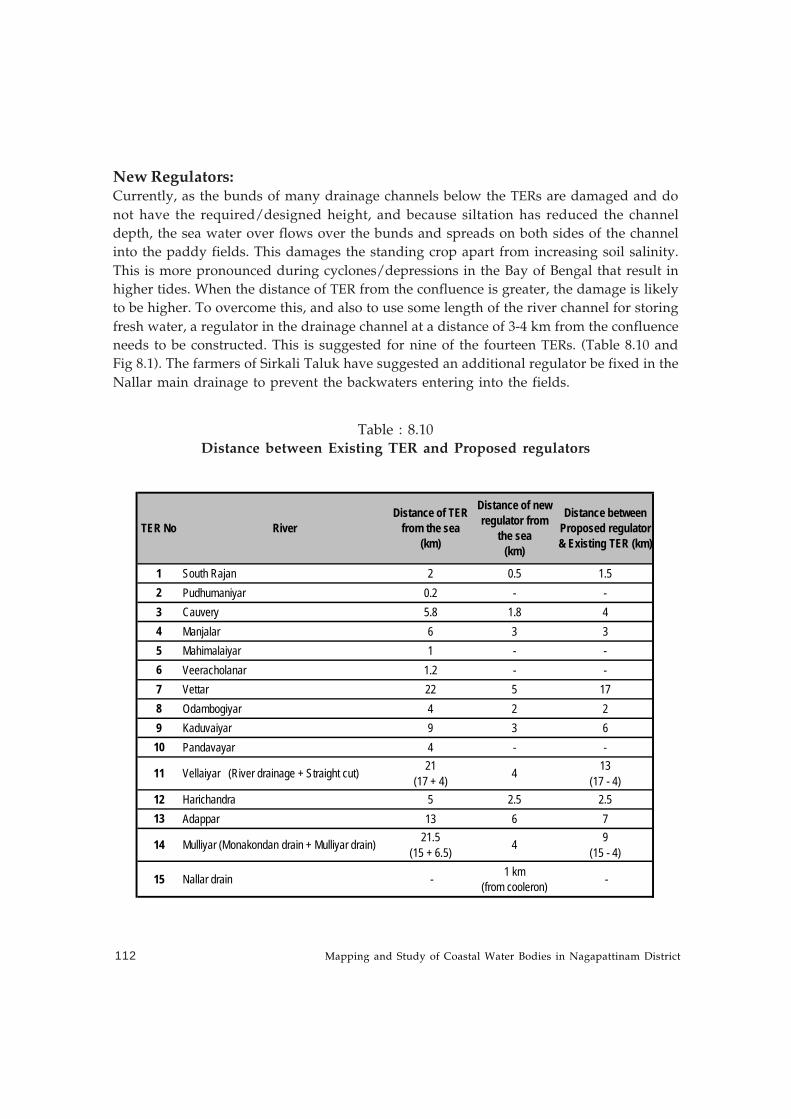
Mapping and Study of Coastal Water Bodies in Nagapattinam District112
New Regulators:Currently, as the bunds of many drainage channels below the TERs are damaged and do
not have the required/designed height, and because siltation has reduced the channel
depth, the sea water over flows over the bunds and spreads on both sides of the channel
into the paddy fields. This damages the standing crop apart from increasing soil salinity.
This is more pronounced during cyclones/depressions in the Bay of Bengal that result in
higher tides. When the distance of TER from the confluence is greater, the damage is likely
to be higher. To overcome this, and also to use some length of the river channel for storing
fresh water, a regulator in the drainage channel at a distance of 3-4 km from the confluence
needs to be constructed. This is suggested for nine of the fourteen TERs. (Table 8.10 and
Fig 8.1). The farmers of Sirkali Taluk have suggested an additional regulator be fixed in the
Nallar main drainage to prevent the backwaters entering into the fields.
Table : 8.10
Distance between Existing TER and Proposed regulators
TER No RiverDistance of TER
from the sea (km)
Distance of new regulator from
the sea (km)
Distance between Proposed regulator & Existing TER (km)
1 South Rajan 2 0.5 1.52 Pudhumaniyar 0.2 - -3 Cauvery 5.8 1.8 44 Manjalar 6 3 35 Mahimalaiyar 1 - -6 Veeracholanar 1.2 - -7 Vettar 22 5 178 Odambogiyar 4 2 29 Kaduvaiyar 9 3 610 Pandavayar 4 - -
11 Vellaiyar (River drainage + Straight cut) 21 (17 + 4) 4 13
(17 - 4)12 Harichandra 5 2.5 2.513 Adappar 13 6 7
14 Mulliyar (Monakondan drain + Mulliyar drain) 21.5 (15 + 6.5) 4 9
(15 - 4)
15 Nallar drain - 1 km (from cooleron) -
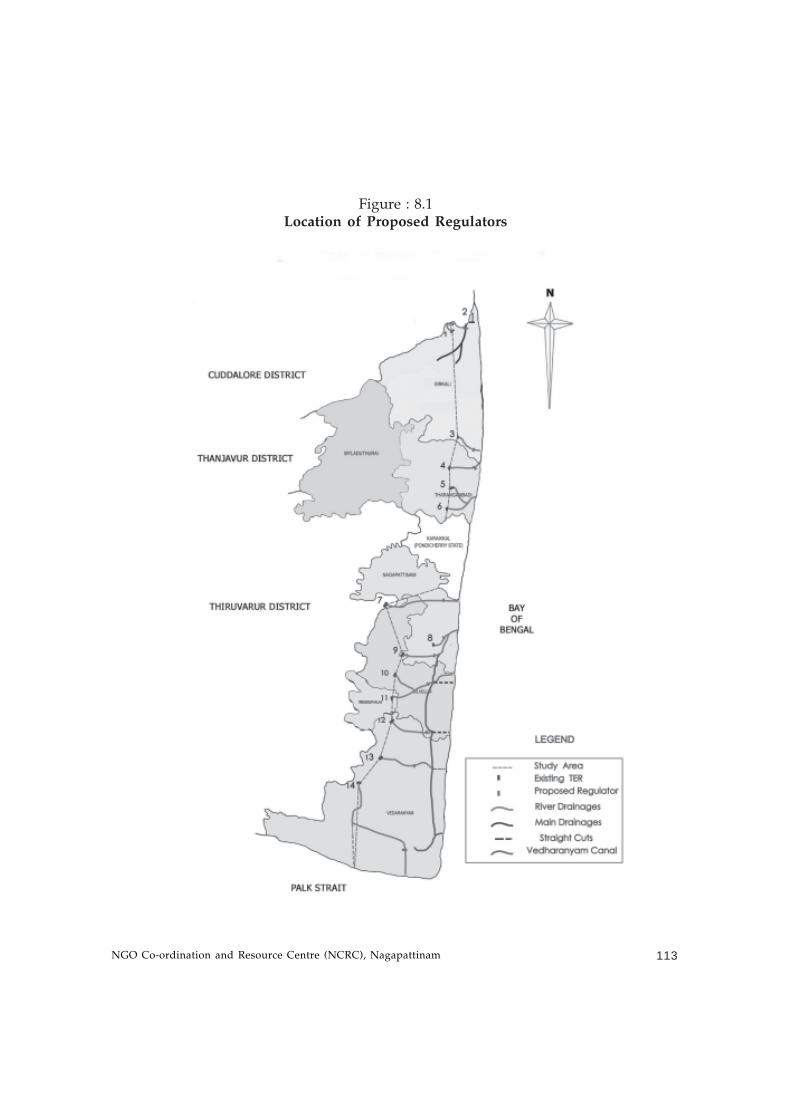
NGO Co-ordination and Resource Centre (NCRC), Nagapattinam 113
Figure : 8.1Location of Proposed Regulators
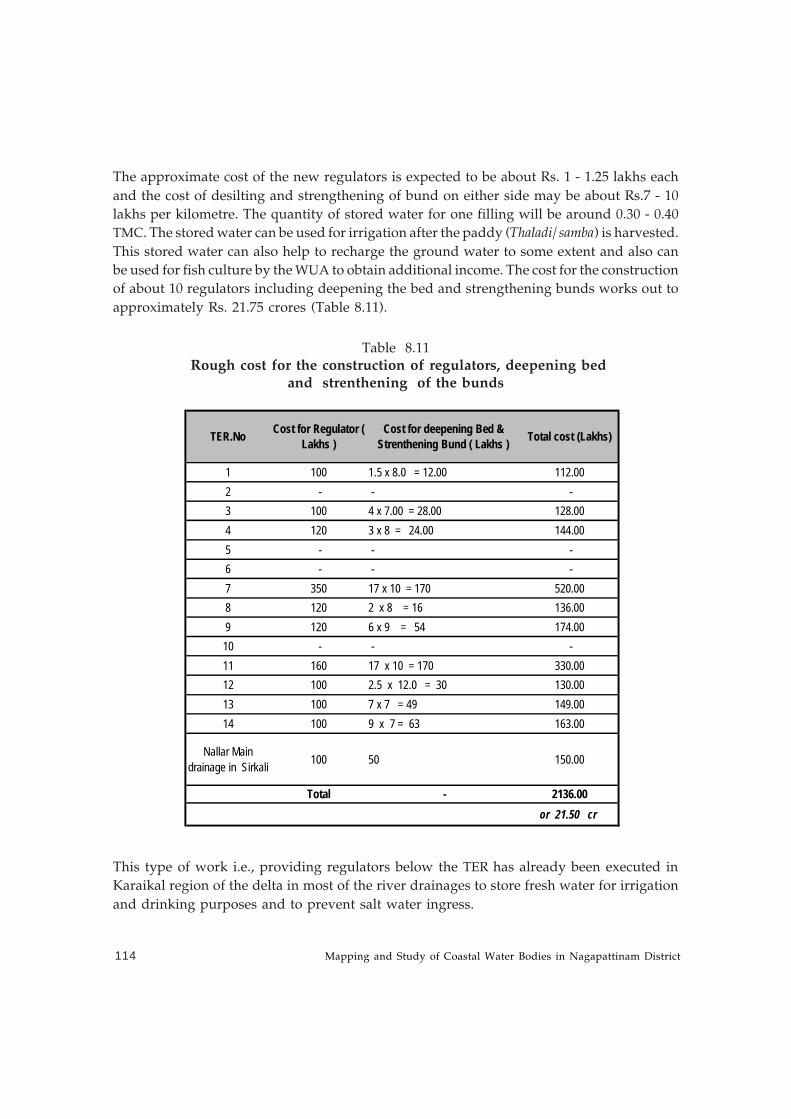
Mapping and Study of Coastal Water Bodies in Nagapattinam District114
The approximate cost of the new regulators is expected to be about Rs. 1 - 1.25 lakhs each
and the cost of desilting and strengthening of bund on either side may be about Rs.7 - 10
lakhs per kilometre. The quantity of stored water for one filling will be around 0.30 - 0.40
TMC. The stored water can be used for irrigation after the paddy (Thaladi/ samba) is harvested.
This stored water can also help to recharge the ground water to some extent and also can
be used for fish culture by the WUA to obtain additional income. The cost for the construction
of about 10 regulators including deepening the bed and strengthening bunds works out to
approximately Rs. 21.75 crores (Table 8.11).
Table 8.11
Rough cost for the construction of regulators, deepening bedand strenthening of the bunds
This type of work i.e., providing regulators below the TER has already been executed in
Karaikal region of the delta in most of the river drainages to store fresh water for irrigation
and drinking purposes and to prevent salt water ingress.
TER.No Cost for Regulator ( Lakhs )
Cost for deepening Bed & Strenthening Bund ( Lakhs ) Total cost (Lakhs)
1 100 1.5 x 8.0 = 12.00 112.002 - - -3 100 4 x 7.00 = 28.00 128.004 120 3 x 8 = 24.00 144.005 - - -6 - - -7 350 17 x 10 = 170 520.008 120 2 x 8 = 16 136.009 120 6 x 9 = 54 174.0010 - - -11 160 17 x 10 = 170 330.0012 100 2.5 x 12.0 = 30 130.0013 100 7 x 7 = 49 149.0014 100 9 x 7 = 63 163.00
Nallar Main drainage in Sirkali 100 50 150.00
Total - 2136.00or 21.50 cr
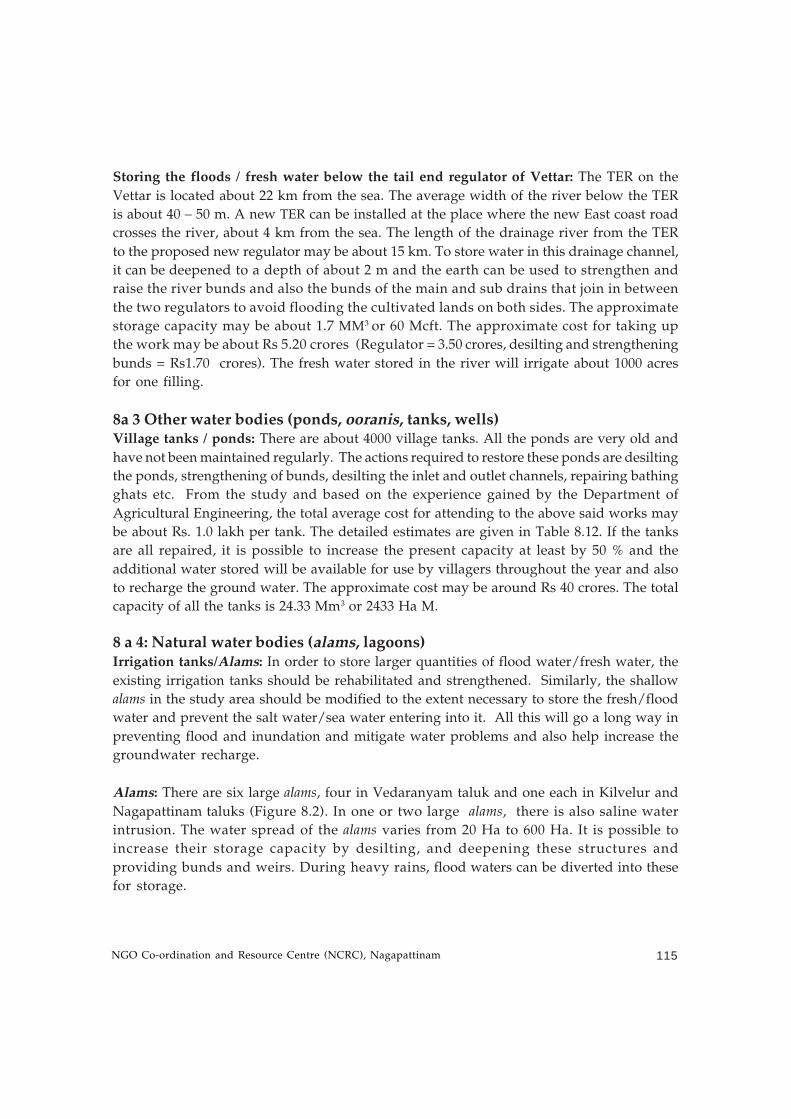
NGO Co-ordination and Resource Centre (NCRC), Nagapattinam 115
Storing the floods / fresh water below the tail end regulator of Vettar: The TER on the
Vettar is located about 22 km from the sea. The average width of the river below the TER
is about 40 – 50 m. A new TER can be installed at the place where the new East coast road
crosses the river, about 4 km from the sea. The length of the drainage river from the TER
to the proposed new regulator may be about 15 km. To store water in this drainage channel,
it can be deepened to a depth of about 2 m and the earth can be used to strengthen and
raise the river bunds and also the bunds of the main and sub drains that join in between
the two regulators to avoid flooding the cultivated lands on both sides. The approximate
storage capacity may be about 1.7 MM3 or 60 Mcft. The approximate cost for taking up
the work may be about Rs 5.20 crores (Regulator = 3.50 crores, desilting and strengthening
bunds = Rs1.70 crores). The fresh water stored in the river will irrigate about 1000 acres
for one filling.
8a 3 Other water bodies (ponds, ooranis, tanks, wells)Village tanks / ponds: There are about 4000 village tanks. All the ponds are very old and
have not been maintained regularly. The actions required to restore these ponds are desilting
the ponds, strengthening of bunds, desilting the inlet and outlet channels, repairing bathing
ghats etc. From the study and based on the experience gained by the Department of
Agricultural Engineering, the total average cost for attending to the above said works may
be about Rs. 1.0 lakh per tank. The detailed estimates are given in Table 8.12. If the tanks
are all repaired, it is possible to increase the present capacity at least by 50 % and the
additional water stored will be available for use by villagers throughout the year and also
to recharge the ground water. The approximate cost may be around Rs 40 crores. The total
capacity of all the tanks is 24.33 Mm3 or 2433 Ha M.
8 a 4: Natural water bodies (alams, lagoons)Irrigation tanks/Alams: In order to store larger quantities of flood water/fresh water, the
existing irrigation tanks should be rehabilitated and strengthened. Similarly, the shallow
alams in the study area should be modified to the extent necessary to store the fresh/flood
water and prevent the salt water/sea water entering into it. All this will go a long way in
preventing flood and inundation and mitigate water problems and also help increase the
groundwater recharge.
Alams: There are six large alams, four in Vedaranyam taluk and one each in Kilvelur and
Nagapattinam taluks (Figure 8.2). In one or two large alams, there is also saline water
intrusion. The water spread of the alams varies from 20 Ha to 600 Ha. It is possible to
increase their storage capacity by desilting, and deepening these structures and
providing bunds and weirs. During heavy rains, flood waters can be diverted into these
for storage.
Mapping and Study of Coastal Water Bodies in Nagapattinam District116
Tab
le
8.1
2
Est
imat
e fo
r R
ehab
ilit
atio
n
of
V
illa
ge
po
nd
/ O
ora
nis
in t
he
Stu
dy
Are
a
Sl.N
oTa
luk w
ise
No o
f
Villa
gepo
nd/
Oora
nies
in th
e stu
dy
area
Aver
age s
iltat
ion
volu
me i
n sa
mpl
e vil
lages
( m
3)
Estim
ate f
or
desil
ting
@ R
s 22 /
m
3 (in
lakh
s)
Aver
age
Bund
da
mag
e vo
lum
e in
sa
mpl
e vil
lages
(m3 )
Estim
ate f
or
Stre
ngth
enin
g bu
nd @
Rs
20 /m
3 (in
lak
hs)
Reha
bilit
atio
n fo
r Fee
der
/Dra
in ca
nals
@
Rs 0
.3 lak
s /p
ond
Tota
l Est
imat
e Am
ount
(in
La
khs)
1Si
rkali
536
2458
289.8
578
8.361
616
0.80
459.0
1
2Th
aran
gam
badi
608
1822
243.7
115
618
.9696
182.4
044
5.08
3Na
gapa
ttinam
956
3488
733.6
011
521
.988
286.8
010
42.38
4Ki
lvelur
684
1252
188.4
014
219
.4256
205.2
041
3.03
5Th
iruku
valai
8064
511
.35
102
1.632
24.0
036
.98
6Ve
dara
nyam
1212
4466
1190
.81
9122
.0584
363.6
015
76.47
Stud
y Are
a40
7623
5526
57.72
114
92.44
1222
.8039
72.96
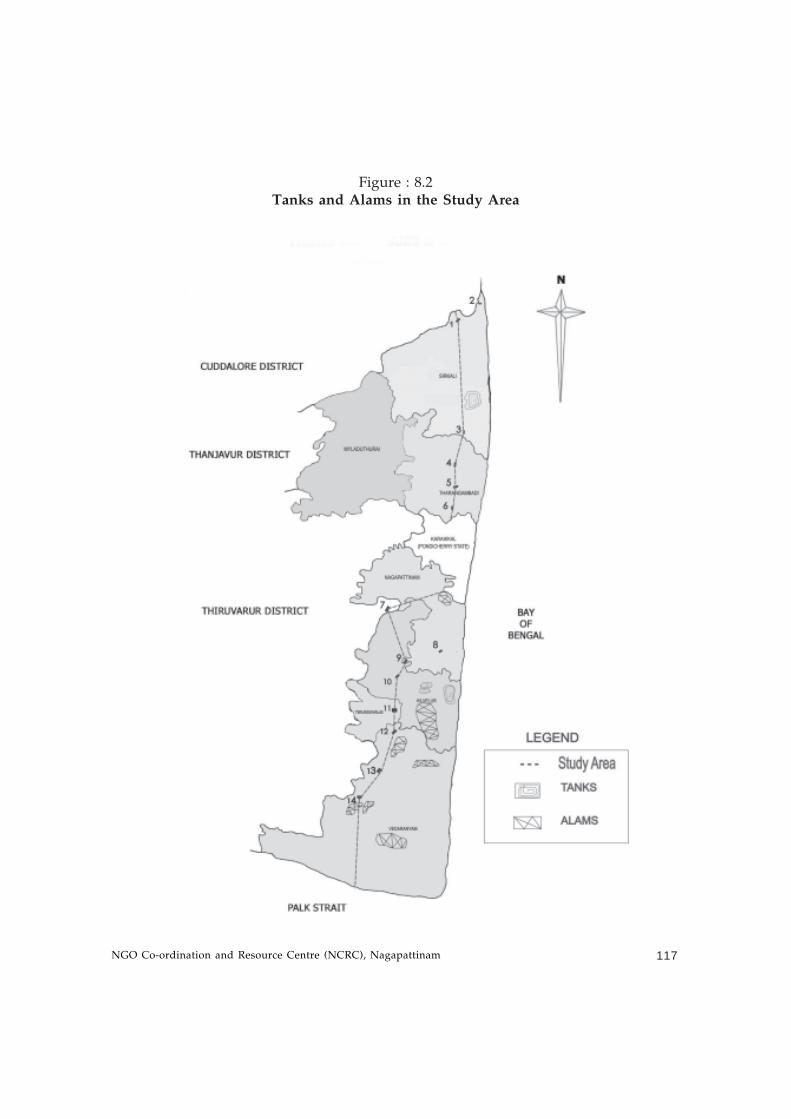
NGO Co-ordination and Resource Centre (NCRC), Nagapattinam 117
Figure : 8.2Tanks and Alams in the Study Area
Mapping and Study of Coastal Water Bodies in Nagapattinam District118
The details of the alams and the improvements proposed are given below
a. Panangudi:This is in Panangudi village of Nagapattinam Taluk, 5 km north-west of Nagapattinam on
the Nagapattinam – Thittachery road. The tank is about 1.5 km long and 0.5 km wide with
a depth varying from 2-6 m and a water spread of about 75 - 80 Ha. It has its own catchment
area. Water drained from the nearby fields also accumulates in the depressions. The rain
water stored in the alam is used by the farmers for irrigation by installing diesel pump sets.
The stored water at present is available up to February/March. This alam can be strengthened
by forming earthen bunds and providing a surplus weir and sluices. The approximate
capacity of the tank may be about 2 Mm3. This water can be used for irrigation or as a
source of drinking water as well as to recharge groundwater. Flood waters can be stored
(3 or 4 fillings) which will help to reduce the drainage congestion. It is expected that
reconstruction of this tank as stated above may cost about Rs 250 lakhs (as estimated by
WRO/PWD). The area irrigated from the water stored can be about 400 ha for one filling.
b. Karapidagai alam:Karapidagai alam is near the tail end of the Harichandra nadhi in Thalainayar block of
Nagapattinam district. It is bounded on the east by the Nagapattinam – Vedaranyam Road,
on the south by the Law ford straight cut, on the west by the Vedaranyam canal and on the
north by Chakkilian vaikkal straight cut. This alam has a water spread of about 600 ha. The
maximum depth of the alam at present is only about 0.60m. Since the bund surrounding this
alam is damaged, water enters the alam from the Vedaranyam canal and the two straight
cuts in the southern and northern sides. The entire area is saline and hence water cannot be
used. Fresh water can be stored in this alam after deepening it to 2 - 2.5 m and strengthening
and raising the bunds when its capacity would be about 15 Mm3 or 1500 ha m. Fresh water
can be obtained from Harichandra nadhi and Chaklian vaikal during monsoon. This water
can be used for recharging ground water and can be used for drinking and irrigation
purposes. The WRO /PWD had prepared a rough estimate to restore this alam some years
ago for Rs. 3 crores7. If this is implemented, the drainage congestion and salinity problem
can be minimized in the area. (Fig 8.3). The water stored is sufficient to irrigate 3000 ha in
summer for one filling.
7 Personal communication
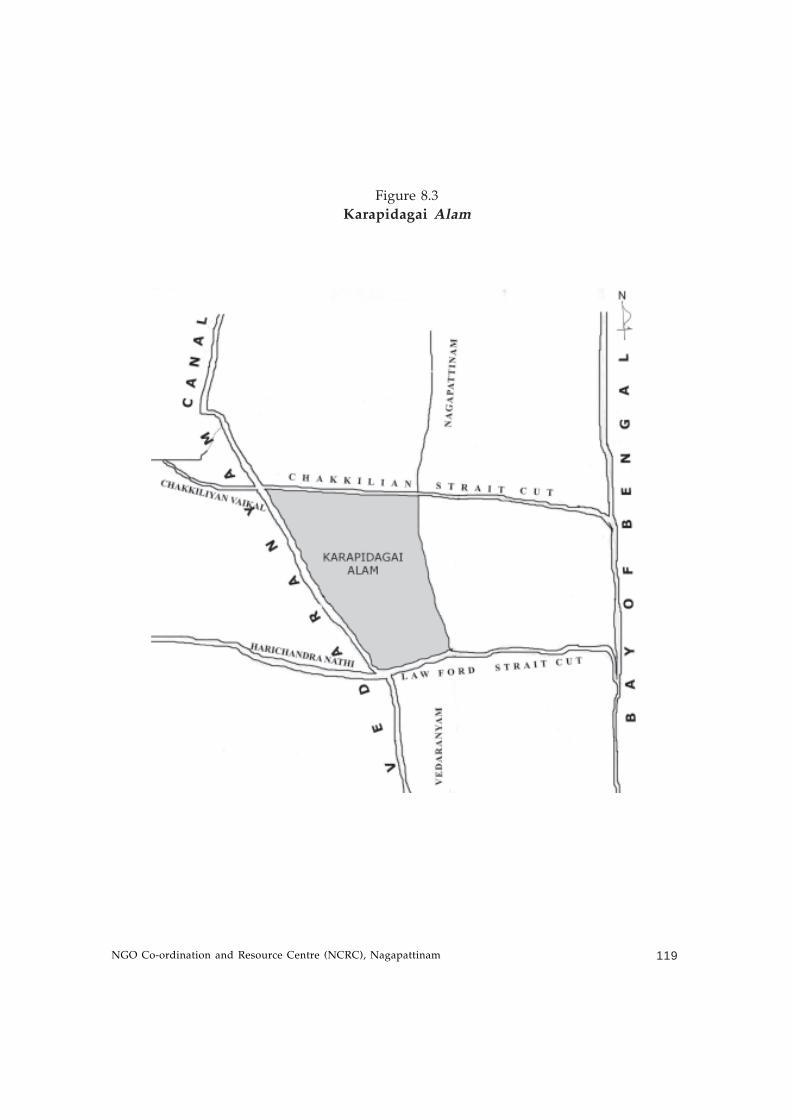
NGO Co-ordination and Resource Centre (NCRC), Nagapattinam 119
Figure 8.3
Karapidagai Alam
Mapping and Study of Coastal Water Bodies in Nagapattinam District120
c. Alams in Vedaranyam taluk in Thalainayaru, Adhanoor,Thanikkottagam andVandal villages:
The water spread area of these alams are about 480 ha, 160 ha, 20 ha and 80 ha respectively.
All these four alams can be deepened and converted into tanks by providing sluices and
weirs. The total water spread area is about 640 ha. The average depth of the tanks can be
increased to 2-3 metres. If rain water / flood water is stored, it is possible to store about
1600 ha m or 16 Mm3 of water. This water can be used for recharging ground water,
drinking and irrigation purposes. The approximate cost for rehabilitating the four alams is
about Rs. 3.0 Crores. The stored water will be sufficient to irrigate 3200 ha in summer for
one filling.
8 a 5. TanksImprovements to the four major irrigation tanks:
There are four major irrigation tanks built and controlled by the PWD in the study area
(Fig 8.2). The details of the four tanks are given in Table 8.13.
Table 8.13
Irrigation Tanks
The WRO / PWD has estimated that --the repair and rehabilitation (including sluice and
weir) for the Perunthottam tank in Sirkali taluk would be about to Rs 100 lakhs. This will
help to irrigate the entire ayacut and also carry over the excess water stored to allow a
summer crop.
The other 3 tanks are in the south, located in the rainfed areas and receive water only from
their own catchment areas. Since these tanks are non system tanks, routine minor
maintenance like strengthening bunds and repairs to sluices is done. Hence for bringing
these tanks in their original condition, it is estimated that about Rs 35 lakhs may be required
for the 3 tanks (Keeraneri Rs 25 lakhs and Chittary and Thildalari Rs 5 lakhs each). By
repairing all the tanks, the total ayacut of about 1000 Ha can be irrigated.
Sl.No Name of the tank Ayacut area in acres Type
1 Perunthottam 2020 System
2 Thidalari 219 Non system3 Keeraneri 285 Non system
4 Chittery 142 Non system
NGO Co-ordination and Resource Centre (NCRC), Nagapattinam 121
8 a 6 Vedaranyam Canal
Details about Vedaranyam Canal:The effective length in which water can be stored in the Vedaranyam Canal is 50 km. The
average width is about 20m with an average bed level of about 0.6m. Currently Vedaranyam
canal is filled with sea water. This increases the salinity of groundwater and affects nearby
land. At high tide, the water level in this area is about +0.6 m above MSL.
It is suggested that the canal is rehabilitated a) to store the monsoon/flood water – this can
be made possible by widening and desilting the canal and providing shutters / regulators
for closing at both the ends of the canal and in the straight cuts (Fig 8.4), and b) to serve as
flood carrier to drain excess water into the sea which can be done by providing two more
straight cuts with regulators in addition to the existing five straight cuts.
If VC is restored to its original width (20 m) and deepened to a depth of 2.50 m and both
its mouths are cut off from the sea, it can definitely act as a storage structure by absorbing
flood water entering into the canal. Since this canal runs parallel to the coast, the improved
/ rehabilitated VC can effectively act as a barrier to sea water intrusion. The bund of the
canal will act as a protective barrier from the high sea waves.
Proposal details / modification for VC:To carry out the above, sea water needs to be drained from Vedaranyam canal which then
has to be filled with fresh water (flood and drainage from the delta rivers). The canal is to
be restored to its original capacity with the depth increased to 2.5m. Existing inlets and
outlets of the canal are to be regulated by providing suitable control structures. The
bund should be made 1.0 m above MSL. This would result in the carrying capacity of the
modified canal to be 3 Mm3 or 0.10 TMC. Assuming number of fillings as equal to four,
utilizable fresh water availability will be about 0.4 TMC which is sufficient to irrigate
about 5,000 acres (dry crops). An operation rule has to be framed for effective functioning
of the system.
Issues encountered in this proposalAquafarms now exist along the banks of Vedaranyam canal to its full stretch. The reasons
for the recent development of aquafarms are due to non availability of sufficient water for
irrigation especially during crucial periods in the tail end regions of the delta and the fact
that sea water mixed with fresh water as now available in the existing Vedaranyam canal is
conducive for aquaculture.
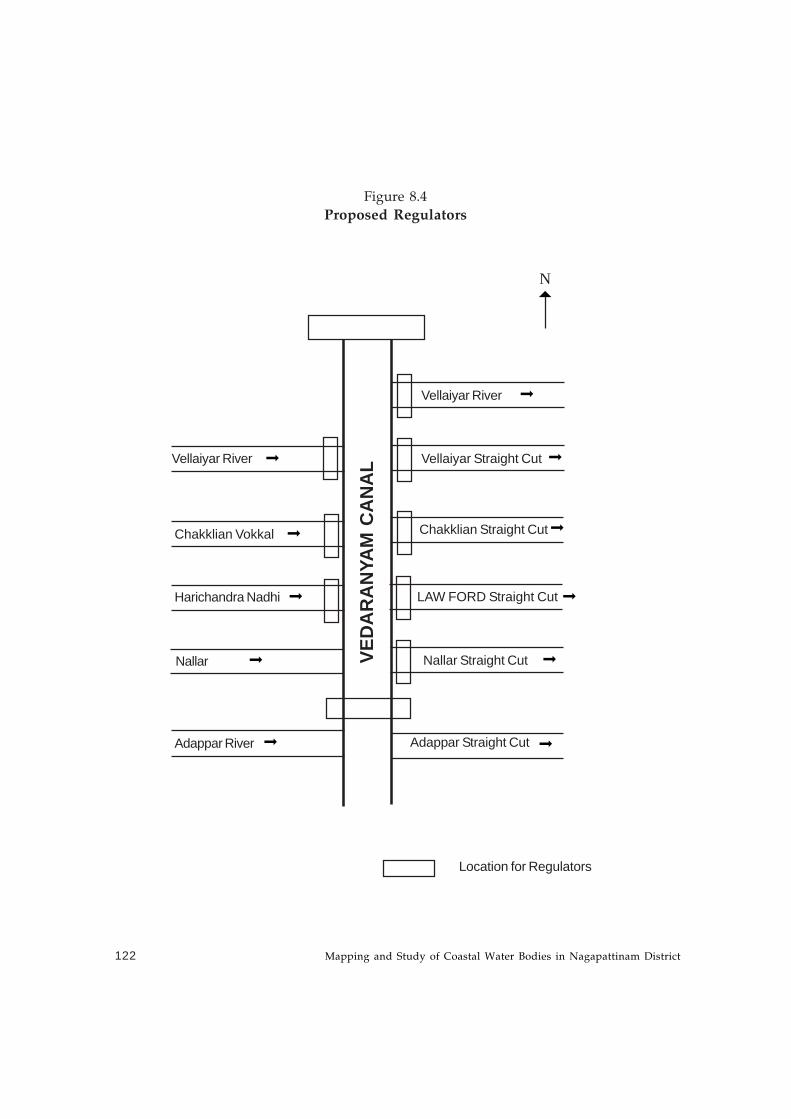
Mapping and Study of Coastal Water Bodies in Nagapattinam District122
Figure 8.4
Proposed Regulators
Location for Regulators
VED
AR
AN
YAM
CA
NA
L
LAW FORD Straight Cut
Vellaiyar River
Vellaiyar River
Vellaiyar Straight Cut
Chakklian Vokkal Chakklian Straight Cut
Harichandra Nadhi
Nallar Nallar Straight Cut
Adappar River Adappar Straight Cut
N
NGO Co-ordination and Resource Centre (NCRC), Nagapattinam 123
Adverse effects due to the existence of these aqua farms are listed below8.
1. Increased salinity of water in the canal due to letting out water of higher salinity
into the canal from the Aqua farms.
2. Vast area of land are already affected. The concern is that the land will become
totally unrecoverable
3. Farm labourers are reportedly affected due to the reduced agricultural activities
and this has aggravated social problems in this area.
4. Water for both drinking and irrigation, already scarce, will be very scarce in this
area in near future.
The approximate cost for all the works may be about Rs. 15 crores (as estimated by PWD).
If this proposal is accepted and the Government of Tamil Nadu can take up the work, it
will go a long way to solve many problems in the coastal district of Cauvery delta.
Recently the Tamil Nadu Government has sanctioned Rs. 70 lakhs for desilting, widening
and strengthening bunds of the VC and another Rs. 25 lakhs for desilting and strengthening
of the five straight cuts taken from the VC canal. The channel and straight cuts should be
maintained periodically for quick disposal of flood water to the sea.
8 a 7 Buckingham CanalThe BC runs parallel to the coast about 500 – 750 m inland. The northern part of the BC
starts from the right bank of Kollidam in Pazhaiyar village and traverses a length of 13 km
and joins with Vellapallam Uppanar drain in Thirumulaivasal village. The canal is used to
carry wastewater and has become a source of pollution to the surrounding areas.
Under Emergency Tsunami Rehabilitation Project the WRO / PWD has proposed to desilt
and strengthen the bunds for both lengths at a cost of Rs 263 lakhs9. In order to store more
water and to improve the drainage, it is suggested to extend the canal in both sectors. Rs
Five lakhs may be required to make a detailed study for taking up the works.
8 Personal Communication from PWD
9 Information from PWD
Mapping and Study of Coastal Water Bodies in Nagapattinam District124
8b Additional Structures proposed
Joining Eravaikal to Manakondan drain:At present Eravaikal is running towards east and joins the VC. During high rainfall in the
north east monsoon, the flood waters in the VC prevent the Eravaikal water from entering
the VC and hence the entire area is flooded. It is reported that the situation is very severe
in disaster years. To avoid the water stagnation and flooding in the area, it is suggested
that the Eravaikal can be diverted south to join Manakondan river which is flowing east
and then turned right to drain into the swamp (Fig 8.5). The length of the new channel
proposed is about 10 km. Poromboke / government land is available for this, except for
about 2 km which will have to be aquired. The Eravaikal carries the drainage water from
about 25 villages covering an area of 10, 000 Ha. During monsoon this land is submerged
and farmers are unable to get any yield from their lands.. The approximate cost for the
implementation may be about Rs. 250 lakhs. This work may be taken after a detailed study.
Construction of storage tanks in the locations where sub drain / main drains jointhe river drain below the TER and in other government vacant lands:
There are about 175 drains in the study area to carry excess irrigation water and flood
water to the river drainage which in turn carries the water to the sea. Water stagnation is
noticed in these small channels before they drain into the river. There is scope to construct
a storage tank by deepening the area so that appreciable quantity of water can be stored.
As there are many such channels in the area, it will help to ease the drainage congestion.
Similarly there are small pockets of government poromboke lands/ panchayat waste lands
and these uncultivated common lands (small pockets) can also be made into storage ponds
wherever possible. This will also help to store the flood water. All these activities will help
in recharging the ground water position in the area. A sum of about Rs 50 lakhs may be
required to implement this.
Farm ponds: These have become acceptable to the farmer for the role they play during
both droughts and floods. It is suggested that about 2500 farm ponds can be constructed in
the next 5-7 years in the study area, i.e., one tank in a 10 ha field. The size of the tank can
be 30m by 30m by 1.5m and the cost may be about Rs. 30,000/- per tank.
Wells: The type of wells suitable here are the kuttai, which are dug to a depth of 2 to 3 m
and provided with oil engine10 that can extract sufficient water to grow vegetables, ground
nut and tree crops. An improved version of this is the skimming well which gets water
10 Farmers refer to motors served with regular power as ‘motors’ and those powered by diesel as ‘oil
engines’
NGO Co-ordination and Resource Centre (NCRC), Nagapattinam 125
from large catchment and has the capacity to irrigate about 1 - 1 ½ acres compared to the
kuttai that can irrigate only about ½ to ¾ of an acre. The cost of kuttai with oil engine may
be about Rs. 15,000/- whereas the skimming well will cost about Rs. 60,000/- (including the
cost of a pumpset). It is suggested that about 500 kuttai and about 1000 skimming wells can
be provided in the next 5-7 years to improve water availability especially for the poor
farmers.
The total cost for the 2 type of wells are as follows.
For 500 kuttai (pit type of well = 500 x 15,000 = 75,00,000 or Rs. 0.75 crores.
For 1000 skimming wells = 1000 x 60,000 = 6,00,00,000 or Rs. 6 crores.
In addition, deep bore well (>300 m deep) can be constructed 15 km from the sea shore,
where the salinity level is only about 1.50 mmhos/cm and the extracted water can be
distributed to the farmers during periods of water scarcity. Each well would probably
cost Rs. 10 to 12 lakhs. If necessary this water can be used by mixing with fresh water or
canal water.
To mitigate drainages problems and to store the rain/monsoon water, if these
measures are implemented, farmers in the area will be benefited and food production
can be increased.
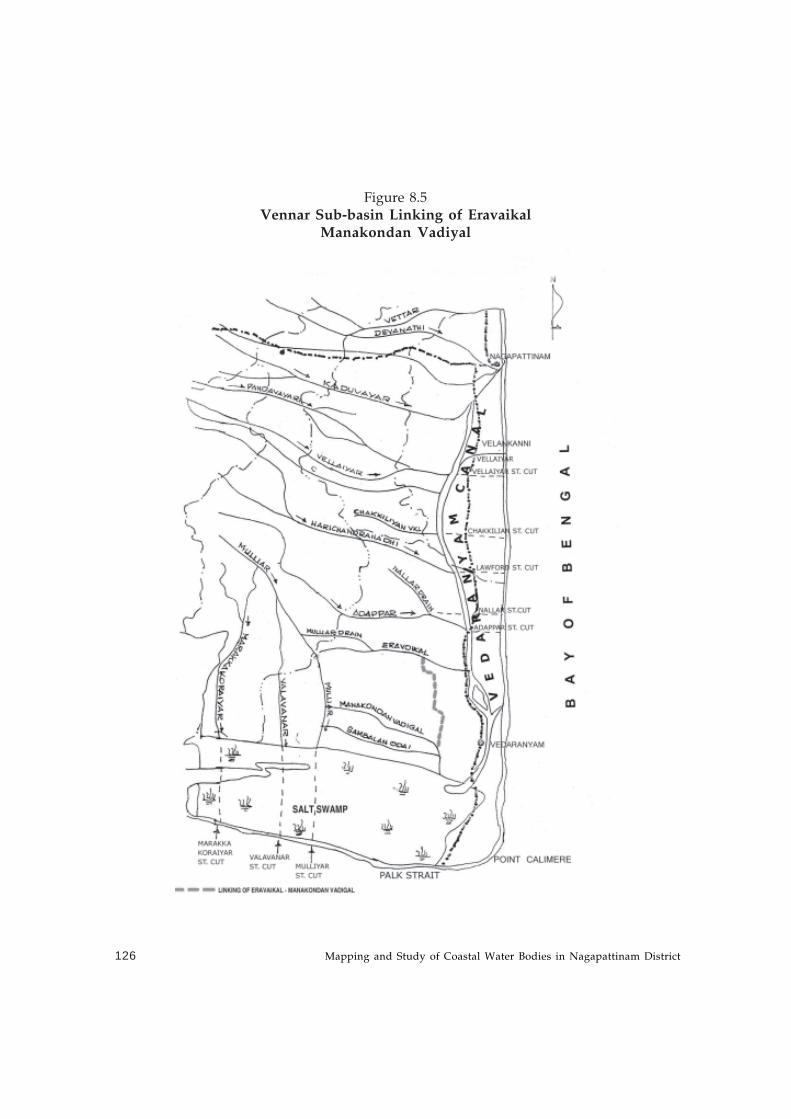
Mapping and Study of Coastal Water Bodies in Nagapattinam District126
Figure 8.5
Vennar Sub-basin Linking of EravaikalManakondan Vadiyal
NGO Co-ordination and Resource Centre (NCRC), Nagapattinam 127
Chapter Nine
Groundwater Recharge
Water, for most of the irrigation in the Cauvery delta, is obtained from the Mettur reservoir.
However, groundwater also plays an important role during seasons of scarcity and also
enables growing of crops in summer. At present, groundwater in the delta is used
• For raising seedlings for kuruvai crop
• To augment supply from Mettur dam when there is a shortfall during the
regular season
• As a supplement at the fag end of samba and thaladi crops when the water
supply from Mettur reservoir is either stopped or is in short supply.
• To raise a third crop during summer (February to April)
Ground water positionTwo main aquifer systems present in the delta are a) Shallow aquifer consisting of 1)
Quaternary and 2) Pliocene and b) Deep aquifer consisting of 1) Aquitanian termed as
Oranthanadu aquifer and 2) Burdigalian termed as main flushing zone. In Tamil Nadu,
groundwater levels are monitored by the PWD, TWAD Board and Central Groundwater
Board. Water level and water quality are monitored during the post-monsoon and the pre-
monsoon every year and the ground water level status reports are maintained. The water
level and fluctuations for Nagapattinam district made by Central Groundwater board and
TWAD board are given in Tables 9.1 and 9.2.
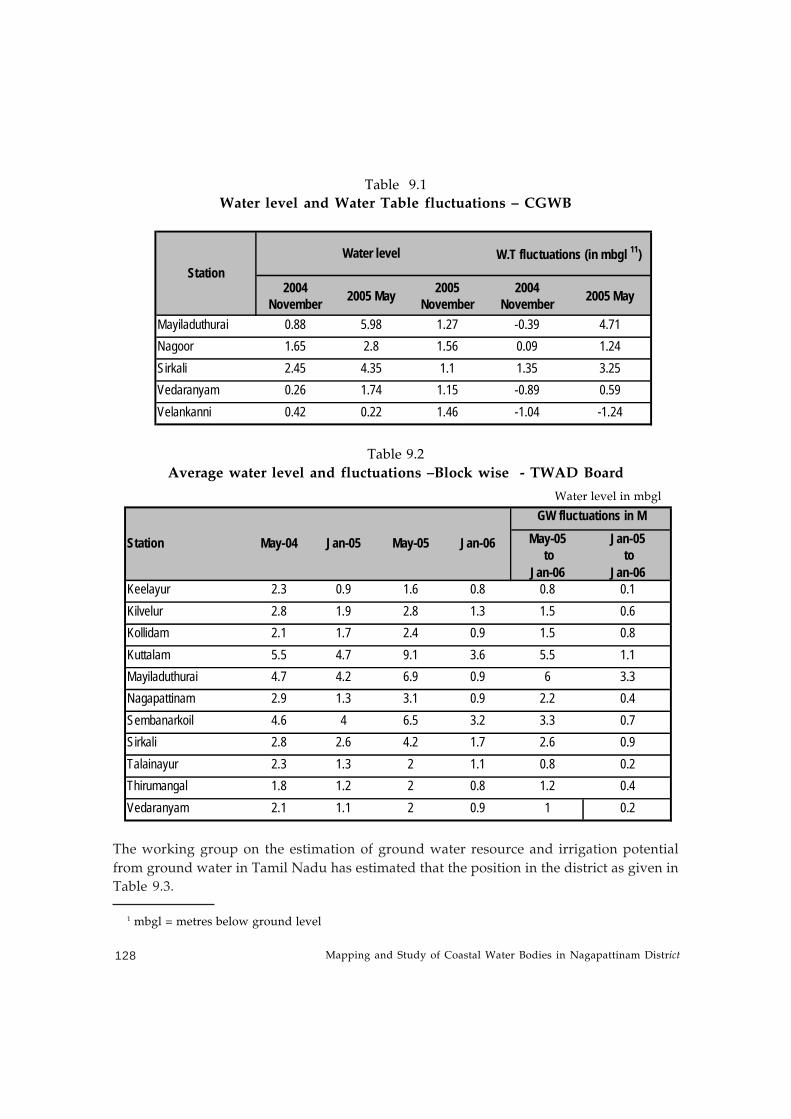
Mapping and Study of Coastal Water Bodies in Nagapattinam District128
2004 November 2005 May 2005
November2004
November 2005 May
Mayiladuthurai 0.88 5.98 1.27 -0.39 4.71Nagoor 1.65 2.8 1.56 0.09 1.24Sirkali 2.45 4.35 1.1 1.35 3.25Vedaranyam 0.26 1.74 1.15 -0.89 0.59Velankanni 0.42 0.22 1.46 -1.04 -1.24
W.T fluctuations (in mbgl 11)Station
Water level
Table 9.1
Water level and Water Table fluctuations – CGWB
Table 9.2
Average water level and fluctuations –Block wise - TWAD Board
May-05 Jan-05 to to
Jan-06 Jan-06Keelayur 2.3 0.9 1.6 0.8 0.8 0.1Kilvelur 2.8 1.9 2.8 1.3 1.5 0.6Kollidam 2.1 1.7 2.4 0.9 1.5 0.8Kuttalam 5.5 4.7 9.1 3.6 5.5 1.1Mayiladuthurai 4.7 4.2 6.9 0.9 6 3.3Nagapattinam 2.9 1.3 3.1 0.9 2.2 0.4Sembanarkoil 4.6 4 6.5 3.2 3.3 0.7Sirkali 2.8 2.6 4.2 1.7 2.6 0.9Talainayur 2.3 1.3 2 1.1 0.8 0.2Thirumangal 1.8 1.2 2 0.8 1.2 0.4Vedaranyam 2.1 1.1 2 0.9 1 0.2
Jan-06
GW fluctuations in M
Station May-04 Jan-05 May-05
Water level in mbgl
1 mbgl = metres below ground level
The working group on the estimation of ground water resource and irrigation potential
from ground water in Tamil Nadu has estimated that the position in the district as given in
Table 9.3.
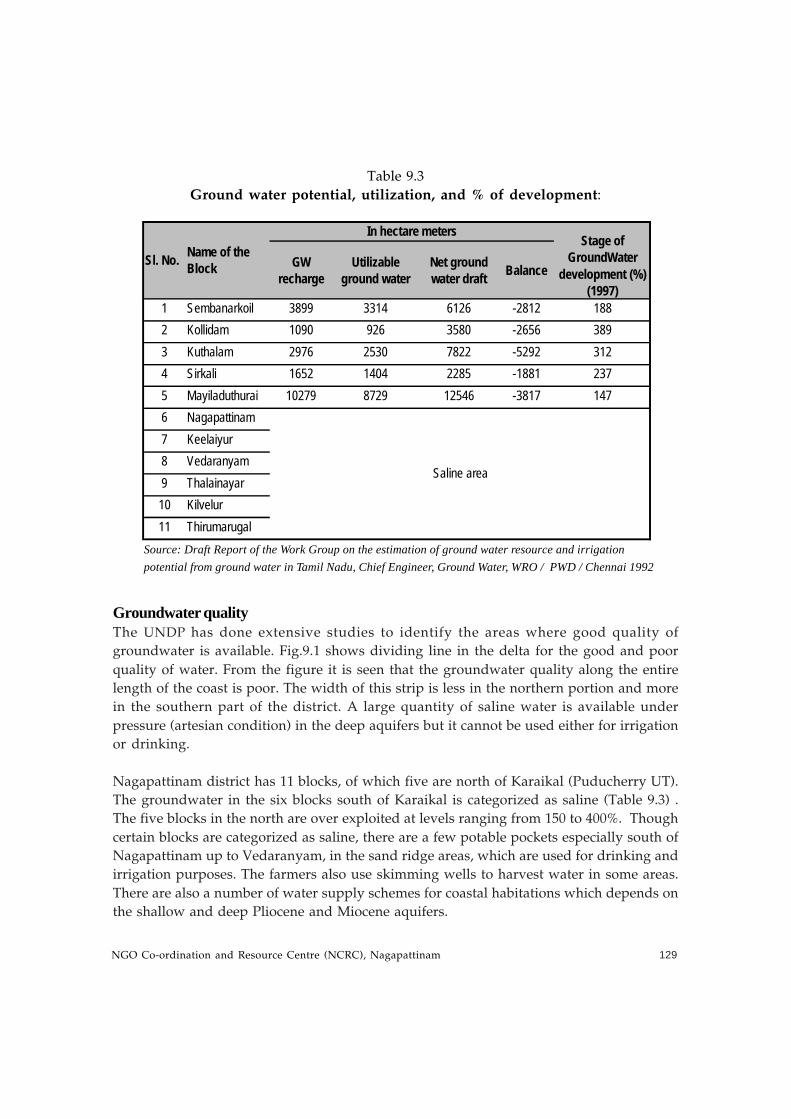
NGO Co-ordination and Resource Centre (NCRC), Nagapattinam 129
GW recharge
Utilizable ground water
Net ground water draft Balance
1 Sembanarkoil 3899 3314 6126 -2812 1882 Kollidam 1090 926 3580 -2656 3893 Kuthalam 2976 2530 7822 -5292 3124 Sirkali 1652 1404 2285 -1881 2375 Mayiladuthurai 10279 8729 12546 -3817 1476 Nagapattinam7 Keelaiyur8 Vedaranyam9 Thalainayar10 Kilvelur11 Thirumarugal
Saline area
Stage of GroundWater
development (%) (1997)
Sl. No. Name of the Block
In hectare meters
Table 9.3
Ground water potential, utilization, and % of development:
Source: Draft Report of the Work Group on the estimation of ground water resource and irrigationpotential from ground water in Tamil Nadu, Chief Engineer, Ground Water, WRO / PWD / Chennai 1992
Groundwater qualityThe UNDP has done extensive studies to identify the areas where good quality of
groundwater is available. Fig.9.1 shows dividing line in the delta for the good and poor
quality of water. From the figure it is seen that the groundwater quality along the entire
length of the coast is poor. The width of this strip is less in the northern portion and more
in the southern part of the district. A large quantity of saline water is available under
pressure (artesian condition) in the deep aquifers but it cannot be used either for irrigation
or drinking.
Nagapattinam district has 11 blocks, of which five are north of Karaikal (Puducherry UT).
The groundwater in the six blocks south of Karaikal is categorized as saline (Table 9.3) .
The five blocks in the north are over exploited at levels ranging from 150 to 400%. Though
certain blocks are categorized as saline, there are a few potable pockets especially south of
Nagapattinam up to Vedaranyam, in the sand ridge areas, which are used for drinking and
irrigation purposes. The farmers also use skimming wells to harvest water in some areas.
There are also a number of water supply schemes for coastal habitations which depends on
the shallow and deep Pliocene and Miocene aquifers.
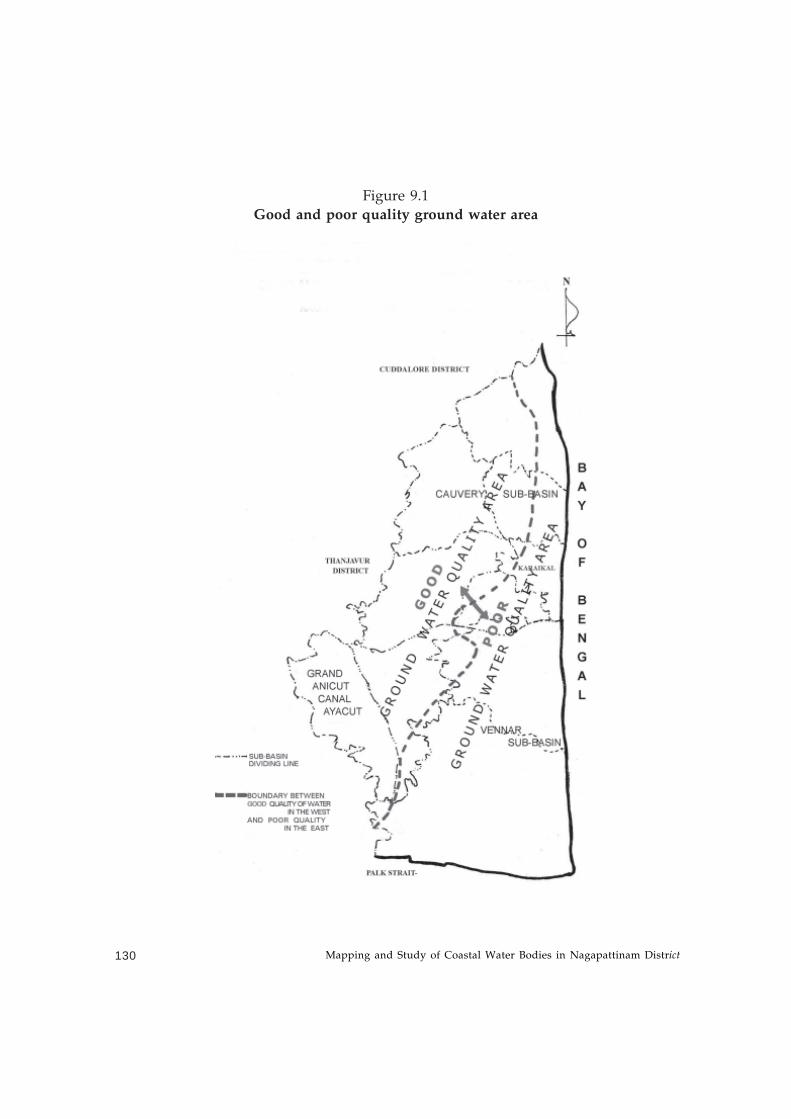
Mapping and Study of Coastal Water Bodies in Nagapattinam District130
Figure 9.1
Good and poor quality ground water area
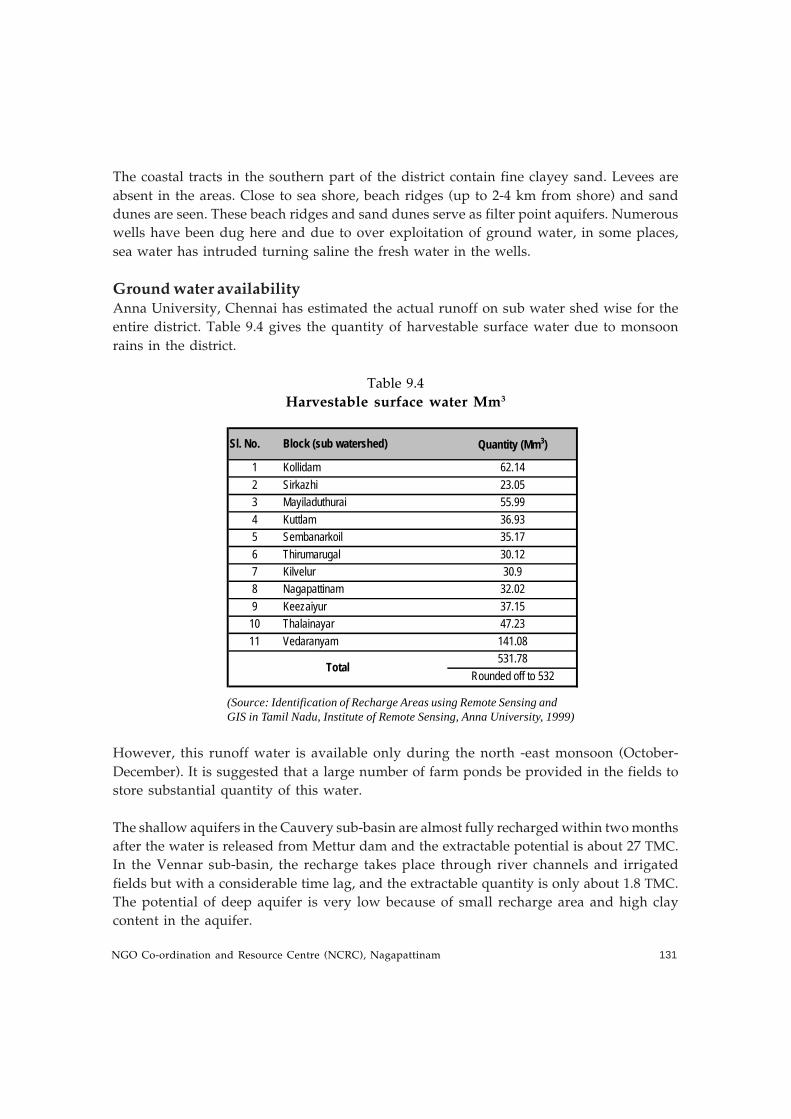
NGO Co-ordination and Resource Centre (NCRC), Nagapattinam 131
The coastal tracts in the southern part of the district contain fine clayey sand. Levees are
absent in the areas. Close to sea shore, beach ridges (up to 2-4 km from shore) and sand
dunes are seen. These beach ridges and sand dunes serve as filter point aquifers. Numerous
wells have been dug here and due to over exploitation of ground water, in some places,
sea water has intruded turning saline the fresh water in the wells.
Ground water availabilityAnna University, Chennai has estimated the actual runoff on sub water shed wise for the
entire district. Table 9.4 gives the quantity of harvestable surface water due to monsoon
rains in the district.
Sl. No. Block (sub watershed) Quantity (Mm3)
1 Kollidam 62.142 Sirkazhi 23.053 Mayiladuthurai 55.994 Kuttlam 36.935 Sembanarkoil 35.176 Thirumarugal 30.127 Kilvelur 30.98 Nagapattinam 32.029 Keezaiyur 37.15
10 Thalainayar 47.2311 Vedaranyam 141.08
531.78Rounded off to 532
Total
Table 9.4
Harvestable surface water Mm3
(Source: Identification of Recharge Areas using Remote Sensing andGIS in Tamil Nadu, Institute of Remote Sensing, Anna University, 1999)
However, this runoff water is available only during the north -east monsoon (October-
December). It is suggested that a large number of farm ponds be provided in the fields to
store substantial quantity of this water.
The shallow aquifers in the Cauvery sub-basin are almost fully recharged within two months
after the water is released from Mettur dam and the extractable potential is about 27 TMC.
In the Vennar sub-basin, the recharge takes place through river channels and irrigated
fields but with a considerable time lag, and the extractable quantity is only about 1.8 TMC.
The potential of deep aquifer is very low because of small recharge area and high clay
content in the aquifer.
Mapping and Study of Coastal Water Bodies in Nagapattinam District132
However, if a dynamic plan can be prepared such as pumping of water using low-head and
high discharge pumps after storing the flood water in the low-level areas/alams in the
coastal areas, it is possible to recharge large quantities of water and the same can be used
for irrigation and other purposes.
There is no scope to bring more area under irrigation unless fresh water or flood water is
stored and used to recharge shallow unconfined aquifers. Towards this, an effort has been
made to locate appropriate sites.
The major problems in the study area are
• Floods during north-east monsoon (October – December),
• Non-availability of Mettur water in the lean season as this area is in the tail endof the delta, and
• Saline groundwater in most places except at shallow depths due to sand ridgesin the coastal areas south of Nagapattinam.
Improvement of groundwater quality and availabilityTo look into possibilities of improving the groundwater potential, the area was visited
along with Regional Director, Central Groundwater board followed by interactions with
the geologists of TWAD board and Central Groundwater board. The following measures
are suggested:
• Provision of a wide channel in the western side near the sand ridges area parallel
to sea to store the rain/flood water.
• Identification of the numerous depressions in the sand dunes/ridges between the
sea and Vedaranyam canal and developing them to store the flood water/ rain
water
• Pumping out the mild saline groundwater on both the sides of the river channel
and mixing with the canal water. This will improve availability of space in the
underground aquifer to recharge the groundwater. The saline water in the aquifer
can be slowly changed into sweet water over a period of time. .
· A detailed study can be undertaken to implement the above suggestions.
NGO Co-ordination and Resource Centre (NCRC), Nagapattinam 133
Prospects of Artificial RechargeThe uneven distribution of rainfall, erratic flow in canals in recent years and its shrinkage
due to encroachment and siltation and poor quality of ground water necessitates
augmentation of groundwater by recharging in this area. Drinking water has become a
scarce commodity in eastern and south eastern part of the district. Indiscriminate pumping
of groundwater will lead to depletion of water level and intrusion of sea water which is to
be prevented.
The physical requirements for undertaking artificial recharge for an area are:
1) Basin must be suitable from consideration of storage capacity and transmissibility
of aquifer. For e.g., the transmissivity of Vennar sub-basin is only one-third of the
value of the Cauvery basin.
2) Sufficient water should be available for recharge. Since adequate storage space is
not available during the rainy season, the flood water is allowed to drain into the
sea. The depth of water level ranges from 0.2 to 4 mbgl during the post-monsoon
period whereas during the pre-monsoon period, it is from 1.56 to 8.65 mbgl. The
deeper aquifers are in confined conditions with poor quality of water.
From the above, it is clear that the artificial recharge of groundwater is not an easy task in
this area. More scientific studies are to be undertaken for the prevailing hydro-geological
conditions.
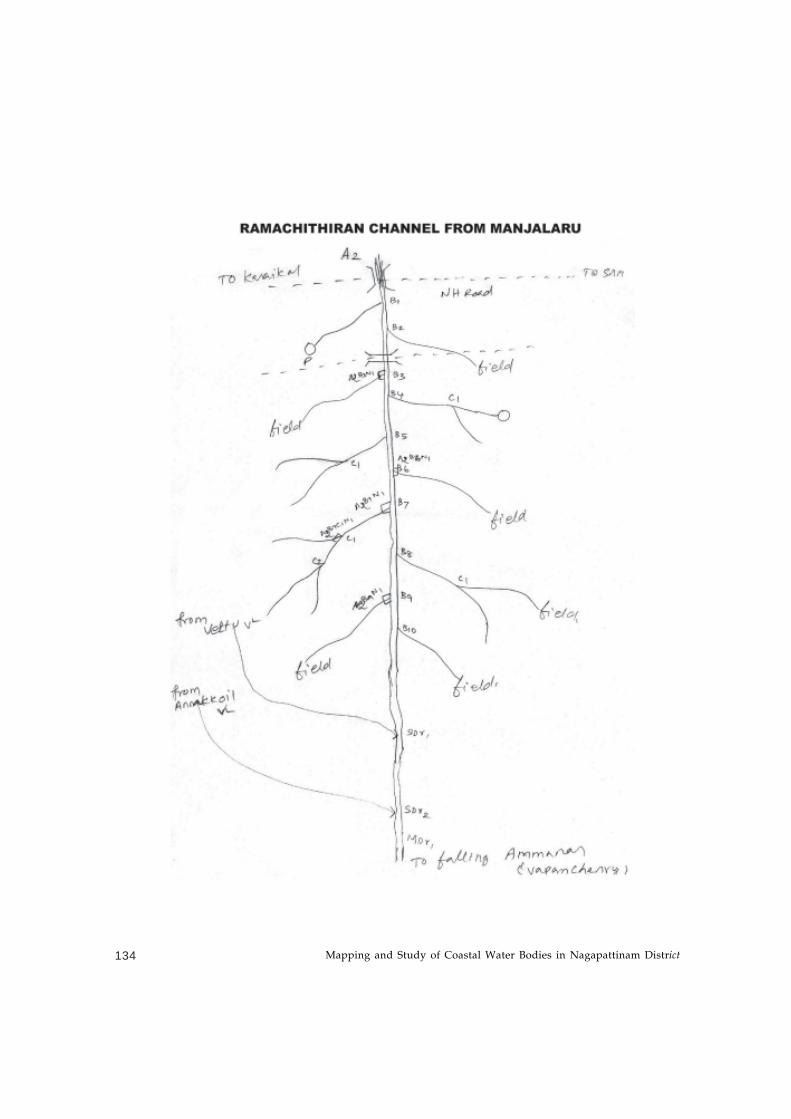
Mapping and Study of Coastal Water Bodies in Nagapattinam District134
NGO Co-ordination and Resource Centre (NCRC), Nagapattinam 135
Chapter Ten
Community Based Water ResourceManagement
IntroductionIn Tamil Nadu, most of the surface water potential was harvested even before the 1970s.
The area of irrigation was about one third in each system viz canal, tank and well irrigation.
The surface irrigation systems, namely the canals and tanks are under the control of the
government. The maintenance has not been done periodically as required and hence many
channels are silted up, bunds damaged, and encroachments are commonly seen in all water
bodies. The effect of this has been the reduction in area of irrigation under canal and tank
irrigation system, namely 29% in canal and 22% in tank system. The area irrigated using
groundwater has increased from about 9 million Ha to 14 million Ha in this period.
In olden days, irrigation systems were maintained by stakeholders themselves by engaging
staff called Neer Katti. The available water was distributed evenly to all, based on the land
area, condition of the crop etc. Subsequently, the government took charge of the
maintenance but it was not done every year to the extent needed. The net result was
deterioration of the channel and sluices. The water distribution was also done by the
Luskar, a government official.
A decision was taken by the Central / State Governments, in early 2000, to entrust the
operations and maintenance of the irrigation systems to the stakeholders by forming Water
Users Associations (WUA)/ or otherwise called participatory irrigation management groups.
The Central and State governments have accepted, in principle, the Participatory Irrigation
Management (PIM) concept. The Tamil Nadu government has framed the Tamil Nadu
Mapping and Study of Coastal Water Bodies in Nagapattinam District136
Farmers Management of Irrigation System Act, 2001 to provide legal support to the farmers.
Necessary rules for implementation of the act were also framed in 2002. The Act has been
brought into force in all the ayacut area.
The Act provides for the contribution of farmers organization comprising:
a. WUA at primary level.
b. Distributory Committee at secondary level.
c. Project committee at project level.
At present the primary level of the farmers’ organization, namely WUAs, have been
constituted in only about 6.0 lakh Ha out of 21 lakh Ha in the command area. In these
areas, the next levels of farmers’ organization, i.e., Distribution Committee (D.C) and Project
Committee (P.C) are yet to be formed.
The National Water Policy (2002), of the Government of India has suggested the progressive
involvement of farmers in the management of irrigation systems particularly in water
distribution and collection of water rates. Separate guidelines have also been issued on
farmers’ participation in irrigation management. These include
• Setting up of WUAs on hydrological basis.
• Registration of the WUA.
• Signing MoU between WUA and WRO unit.
• WUAs assuming the responsibility of obtaining required water and distributing
it among the members, i.e., the responsibility for the management of system.
• WUAs should be responsible of collecting the water cess (charge) from the
members and remitting the same to the government.
The repair and maintenance of the irrigation system, i.e., canals and drains are be undertaken
by the WUAs. The works which involve technical skill and major construction are to be
taken up only by the WRO/PWD. Even here, the execution can be allotted to the WUAs. In
the proposal based on the present study, many constructions especially the regulation below
TER and major shutters in the VC are included. These are major components which require
detailed survey and design of the system. This cannot be done by WUAs. However the
design and preparation of estimate and floating tenders for these major works can be
taken up by the WRO, but the execution of civil works should be given only to WUAs. The
involvement of the WUA/farmers will help develop ownership of the structures/project.
Similarly, by giving the power of distribution of water, the users are likely to take more
care to save water since the water thus saved will be used by them to grow one more crop.
NGO Co-ordination and Resource Centre (NCRC), Nagapattinam 137
This will increase the intensity of cultivation and irrigation. In turn, this will help them to
get more income from their lands and enhance the employment opportunity in the villages.
Functions of farmers’ associationsThe WUA is expected to perform the following functions as per the Act passed in the
assembly:
a. To prepare and implement an operational plan and rotational water supply to eachirrigation system (warabandhi), consistent with the operational plan, prepared bythe distribution committee and the project committee, and based upon theenlistment, area, soil and cropping pattern as approved by the managing committee.
b. To prepare a plan for the maintenance of irrigation system in the area of itsoperation at the end of each crop season and carry out the maintenance works ofboth distributory systems, irrigation channels and field drains in its area of operationwith the funds of the WUA from time to time.
c. To regulate the use of water among the various sluices under the area of operationaccording to rotational water supply.
d. To promote the economy in the use of water allotted.
e. To assist the authorities of the Revenue Department in the preparation and demandand collection of water charges.
f. To maintain a register of water users.
g. To monitor the flow of water for irrigation.
h. To resolve the disputes between the members of the WUA.
i. To raise resources.
j. To maintain accounts/audit accounts.
k. To assist and conduct elections/maintain the records.
l. To conduct GB meeting etc.
m. To remove the encroachments on canals, drains, and poromboke in the area of
jurisdiction of the WUA.
From the above it is clear that the WUA has all the powers as per the Act to repair and
maintain the irrigation and drainage channels/structures including levying and collecting
Mapping and Study of Coastal Water Bodies in Nagapattinam District138
the money from the users; and distribution of water to all the farmers based on the stage
of the crop and the extent of area etc. The association is to be formed and the office
bearers are to be elected according to the rules. Though the Act has been in vogue for
nearly five years, in many places the WUA have not been constituted and office bearers
have not been elected. The farmers should take action to see that the Act is implemented
early for their own benefit.
Although such formally registered groups have been seen in the villages visited in the
course of this study, not all of them have been active. Lack of water in these irrigation
canals has been one of the most common reasons cited. There have also been informal
groups in quite a few of the villages, formed due to common interest or at the behest of the
elected Panchayat. Most of such groups have been involved in cleaning up activities and
minor repairs. However, there is a feeling of futility as they recognize the fact that unless
there is a unified and synchronized attempt by all the habitations along the length of the
canal, such interventions in limited geographical areas, however well- intentioned, is not
going to be useful.
In all the villages visited, both the farming community and the Panchayat were equivocal
in the pressing need to repair and revitalize these canals. In one area, the farmers went to
the extent of being thankful to the tsunami as it had at least brought the travails of the
farmers to the fore. They were worried that their village would also have to be abandoned
like their neighbouring village Keelakarai, near Madampattinam in Sirkali, where all the
inhabitants have migrated to other places after the repeated failure of agriculture and
salination of their lands.
The community and the Panchayat are willing to provide all support, through available
schemes as well as through labour, to the Government or any other willing agency for the
work to be carried out in these canals. They are also willing to formally take on the continuing
operation and maintenance, provided they are given some back-stopping support by the
PWD and the Administration.
NGO Co-ordination and Resource Centre (NCRC), Nagapattinam 139
Chapter Eleven
General Recommendationsand Budget Estimates
The study is only on a small portion of the delta below the Grand Anicut from where the
Cauvery water is diverted to the 2 sub basins namely Cauvery and Vennar and subsequently
to the Grand Anicut canal system to irrigate a gross area of about 5.60 Lakh ha of agricultural
land. Any water resources development should be tackled only on watershed basis. The
rain water/runoff water coming from the catchment area from the south-west/right side
of Grand Anicut and Thanjavur in addition to the rainfall in the command area of the delta
is to be managed. The drainage problem is more where the rainfall is high and the soil is
clayey and the slope of the terrain is nearly zero. This is true of the south eastern and
southern part of the delta i.e., most of the study area.
The study area is limited to about 30,000 Ha in the tail end portion in a total watershed of
about 800,000 ha, i.e., about 4% of the total watershed. It is believed that the mapping of
the waterbodies and identifying ways in which their status can be improved as expounded
in the report will enhance the efficiency of water use, production and productivity. The
cost estimates for all the works contemplated are abstracted and given in Table 11.1. The
total costs works out to Rs. 125 crores. However, before execution of all the works, detailed
design and estimates for all works are to be prepared.
The repair, rehabilitation and improvements for all the irrigation and drainage channels,
the construction of new structures, modernization of the existing ones and other works to
store fresh / rain water and dispose of the flood water were estimated based on the
requirements and assuming the rates as adopted by WRO/PWD. The implementing
/ execution of works can be undertaken by the WRO/PWD (Govt.) WUA / NGO
(Public-Private Partnership), or by farmers depending on the nature of the works.
Accordingly, suggestions on the works and the agencies that can implement them are given
in Table 11.2.
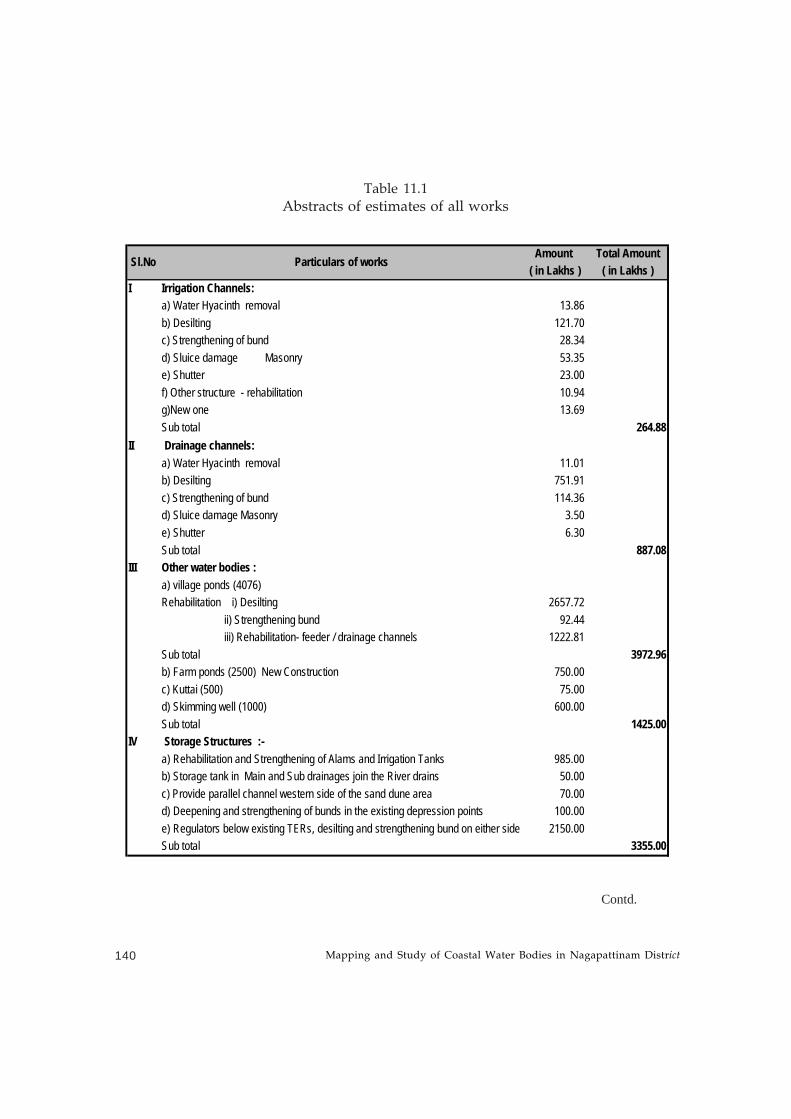
Mapping and Study of Coastal Water Bodies in Nagapattinam District140
Table 11.1
Abstracts of estimates of all works
Contd.
Amount Total Amount( in Lakhs ) ( in Lakhs )
I Irrigation Channels: a) Water Hyacinth removal 13.86b) Desilting 121.70c) Strengthening of bund 28.34d) Sluice damage Masonry 53.35e) Shutter 23.00f) Other structure - rehabilitation 10.94g)New one 13.69Sub total 264.88
II Drainage channels:a) Water Hyacinth removal 11.01b) Desilting 751.91c) Strengthening of bund 114.36d) Sluice damage Masonry 3.50e) Shutter 6.30Sub total 887.08
III Other water bodies : a) village ponds (4076) Rehabilitation i) Desilting 2657.72 ii) Strengthening bund 92.44 iii) Rehabilitation- feeder / drainage channels 1222.81Sub total 3972.96b) Farm ponds (2500) New Construction 750.00c) Kuttai (500) 75.00d) Skimming well (1000) 600.00Sub total 1425.00
IV Storage Structures :-a) Rehabilitation and Strengthening of Alams and Irrigation Tanks 985.00 b) Storage tank in Main and Sub drainages join the River drains 50.00c) Provide parallel channel western side of the sand dune area 70.00d) Deepening and strengthening of bunds in the existing depression points 100.00e) Regulators below existing TERs, desilting and strengthening bund on either side 2150.00
Sub total 3355.00
Particulars of worksSl.No
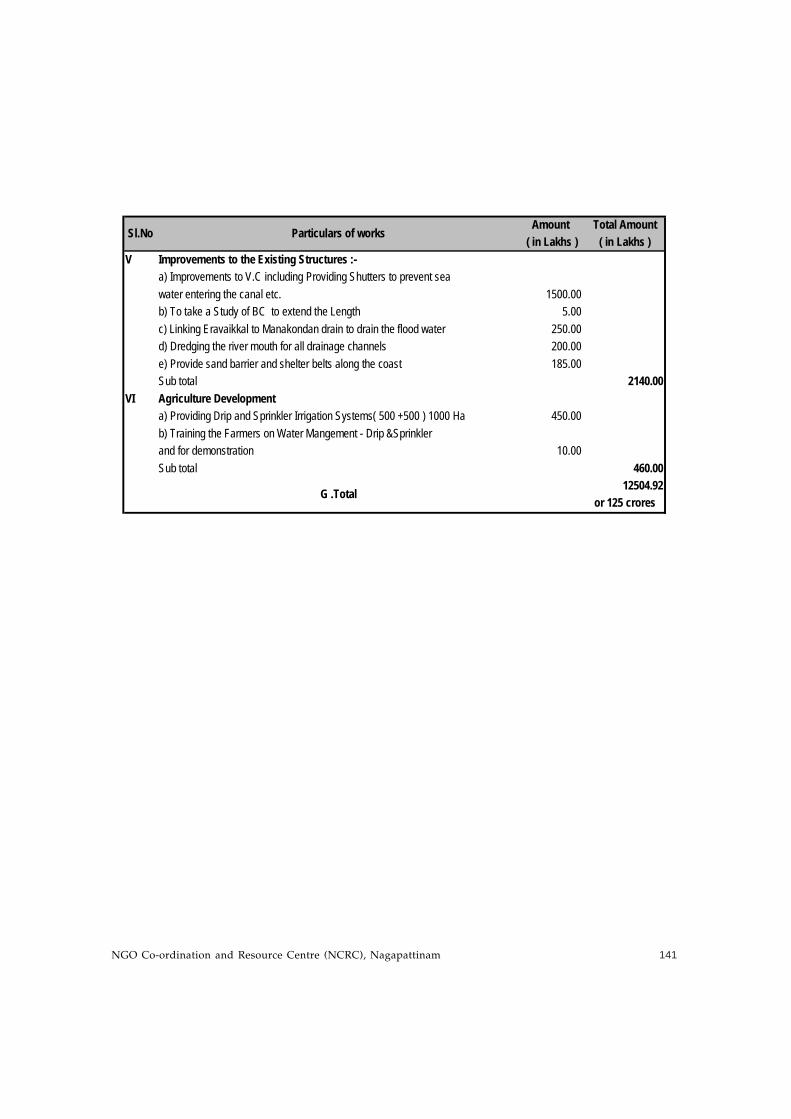
NGO Co-ordination and Resource Centre (NCRC), Nagapattinam 141
Amount Total Amount( in Lakhs ) ( in Lakhs )
V Improvements to the Existing Structures :- a) Improvements to V.C including Providing Shutters to prevent sea water entering the canal etc. 1500.00b) To take a Study of BC to extend the Length 5.00c) Linking Eravaikkal to Manakondan drain to drain the flood water 250.00d) Dredging the river mouth for all drainage channels 200.00e) Provide sand barrier and shelter belts along the coast 185.00Sub total 2140.00
VI Agriculture Developmenta) Providing Drip and Sprinkler Irrigation Systems( 500 +500 ) 1000 Ha 450.00b) Training the Farmers on Water Mangement - Drip &Sprinkler and for demonstration 10.00Sub total 460.00
12504.92or 125 crores
G .Total
Sl.No Particulars of works
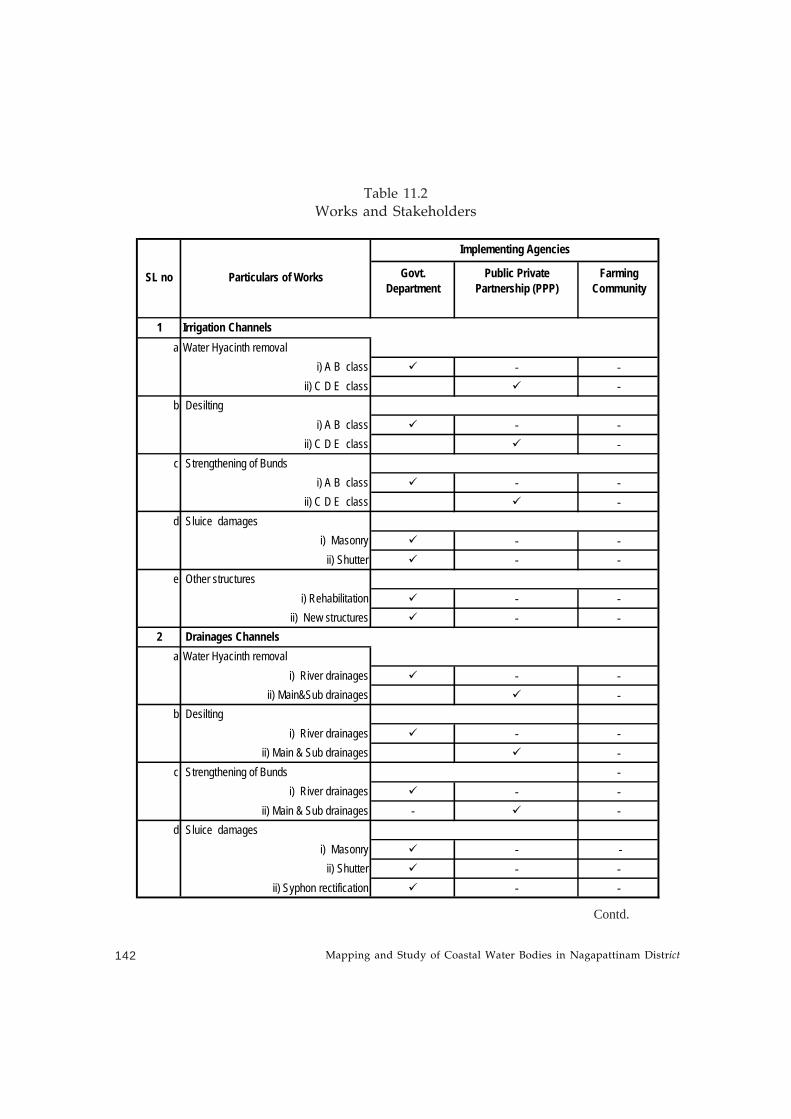
Mapping and Study of Coastal Water Bodies in Nagapattinam District142
Table 11.2
Works and Stakeholders
Contd.
Govt. Department
Public Private Partnership (PPP)
Farming Community
1 Irrigation Channelsa Water Hyacinth removal
i) A B class - - ii) C D E class -
b Desilting i) A B class - -
ii) C D E class -c Strengthening of Bunds
i) A B class - - ii) C D E class -
d Sluice damages i) Masonry - -
ii) Shutter - -e Other structures
i) Rehabilitation - - ii) New structures - -
2 Drainages Channelsa Water Hyacinth removal
i) River drainages - - ii) Main&Sub drainages -
b Desilting i) River drainages - -
ii) Main & Sub drainages -c Strengthening of Bunds -
i) River drainages - - ii) Main & Sub drainages - -
d Sluice damages i) Masonry - -
ii) Shutter - - ii) Syphon rectification - -
Particulars of WorksSL no
Implementing Agencies
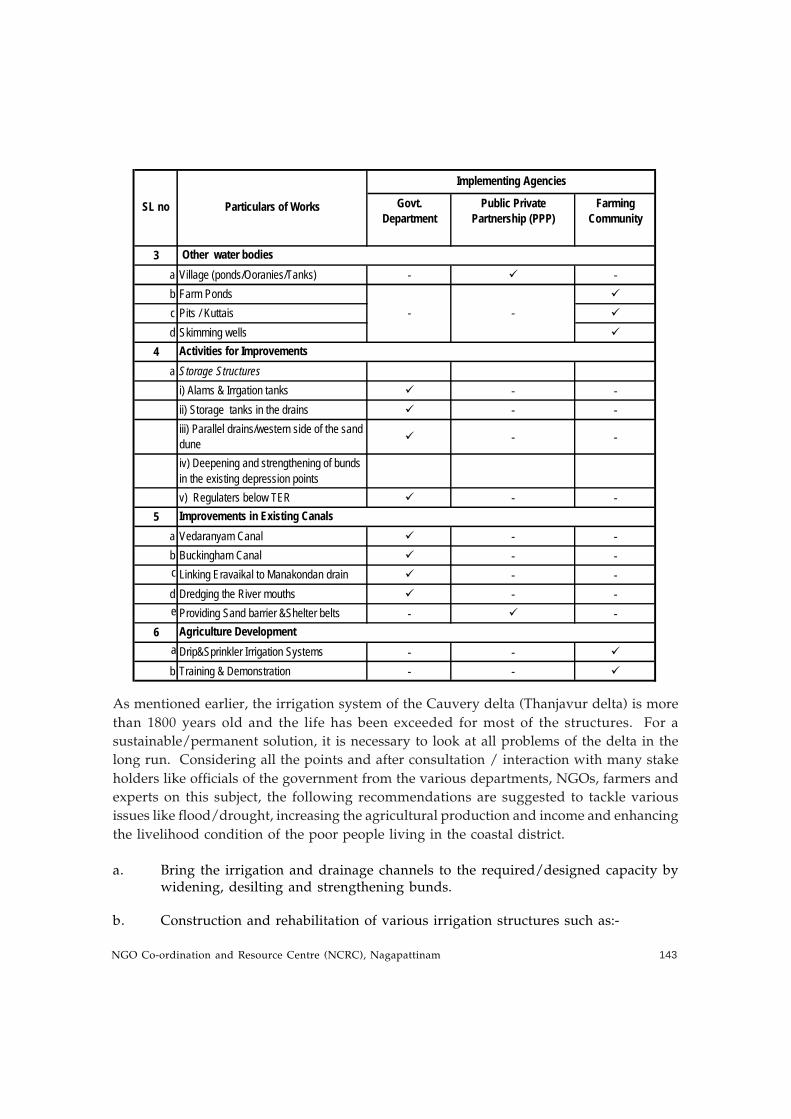
NGO Co-ordination and Resource Centre (NCRC), Nagapattinam 143
Govt. Department
Public Private Partnership (PPP)
Farming Community
3a Village (ponds/Ooranies/Tanks) - -b Farm Pondsc Pits / Kuttaisd Skimming wells
4a Storage Structures i) Alams & Irrgation tanks - - ii) Storage tanks in the drains - -
iii) Parallel drains/western side of the sand dune - -
iv) Deepening and strengthening of bunds in the existing depression pointsv) Regulaters below TER - -
5a Vedaranyam Canal - -b Buckingham Canal - -c Linking Eravaikal to Manakondan drain - -d Dredging the River mouths - -e Providing Sand barrier &Shelter belts - -
6a Drip&Sprinkler Irrigation Systems - -b Training & Demonstration - -
SL no Particulars of Works
Implementing Agencies
Activities for Improvements
Improvements in Existing Canals
Agriculture Development
--
Other water bodies
As mentioned earlier, the irrigation system of the Cauvery delta (Thanjavur delta) is more
than 1800 years old and the life has been exceeded for most of the structures. For a
sustainable/permanent solution, it is necessary to look at all problems of the delta in the
long run. Considering all the points and after consultation / interaction with many stake
holders like officials of the government from the various departments, NGOs, farmers and
experts on this subject, the following recommendations are suggested to tackle various
issues like flood/drought, increasing the agricultural production and income and enhancing
the livelihood condition of the poor people living in the coastal district.
a. Bring the irrigation and drainage channels to the required/designed capacity bywidening, desilting and strengthening bunds.
b. Construction and rehabilitation of various irrigation structures such as:-
Mapping and Study of Coastal Water Bodies in Nagapattinam District144
i. Main regulators.
ii. Diversion weirs
iii. Sluices/vents
iv. Siphon arrangements
v. Series of regulators to control and distribute water
vi. Culverts / pipes
vii. Bed dam
viii. Check dams in the rivers
ix. Other structures.
c. The monsoon flood waters from the catchment in the upland tracts lying southwest of delta must either be detained in the upland itself by watershed developmentworks or the runoff must be diverted to areas other than the Vennar sub basin.
d. Provide linking of drains and providing proper location of in-fall points of minordrains into the main drain. This has to be done only after a careful study of thedrains in the intended area.
e. Provide a number of straight cuts in Vedaranyam canal and in the salt swamp/lagoons for easy / quick disposal of flood water.
f. Dredging all the river mouths
g. Recharging the ground water through construction of a number of deep bore wellsat the appropriate place and pumping the water using pressure to push the saltwater to the sea.
h. Reclaim the salt affected agricultural lands for bringing the land under normalproduction conditions.
i. Improve the fertility of the soil.
j. Water management including introducing advanced methods of irrigation etc.
To take up all the above said items of work and to have a permanent solution, rehabilitation
and modernization of the entire delta is necessary. The approximate amount required for
the works may be around Rs. 3000-3500 crores, which can be taken up and completed in a
phased manner in 7-10 years. The cost was about Rs. 1000 crores in early 1980s and it is
now increased threefold. Hence early action is recommended with respect to rehabilitation
/ modernization in a reasonable period.