Embed Size (px)
Citation preview
MAP Office HoursFall 2018
Presented by theData Use for School Improvement Team
1
Having trouble with audio? You can also
call in using your phone.
United States: +1 (646) 749-3112
Access Code: 253-921-813

Session Facilitators
2
Kelly CunninghamDirector, Data Use for School Improvementkelly.cunningham@
Tamara EasterSpecialist, Data Use for School Improvementtamara.easter@
Claudia AllenSpecialist, Data Use for School Improvementclaudia.allen@
Ashley WilliamsSpecialist, Data Use for School Improvementashleyj.williams@
Mary ParadzinskyMAP Coordinatormary.paradzinsky@

Objectives
3
By the end of our time today you will:
1. Understand the key reports to access student data.
1. Know how to use data from MAP reports to drive instruction

Agenda
4
Item Time
Needs Assessment 5m
Refresher: MAP Reports 15m
Q + A 35m

Needs Assessment
5
1. What questions do you have about using MAP data reports?
2. How have you used these reports in the past?3. What do you need from today’s Office Hours?

•Log-in to the web-based MAP at http://teach.mapnwea.org/
•Your MAP username is your entire CMS email address.
•Your MAP password is what you created when you received the temporary password from NWEA. If you have forgotten your password, please click on Forgot Username or Password? on the login screen.
6
Accessing MAP Growth Reports

7
Click
Accessing MAP Growth Reports
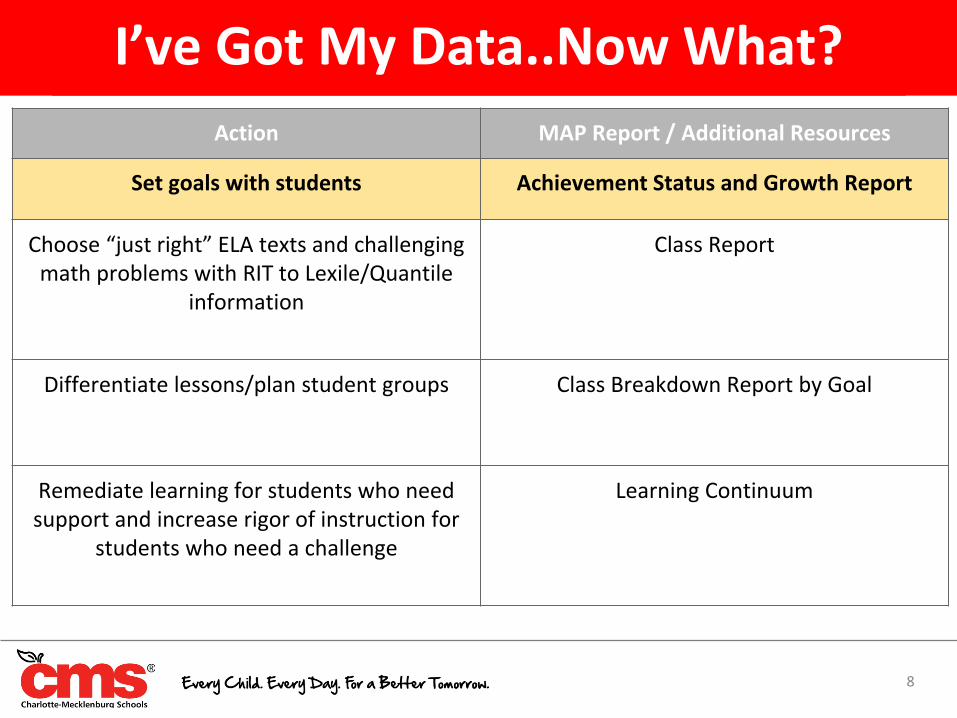
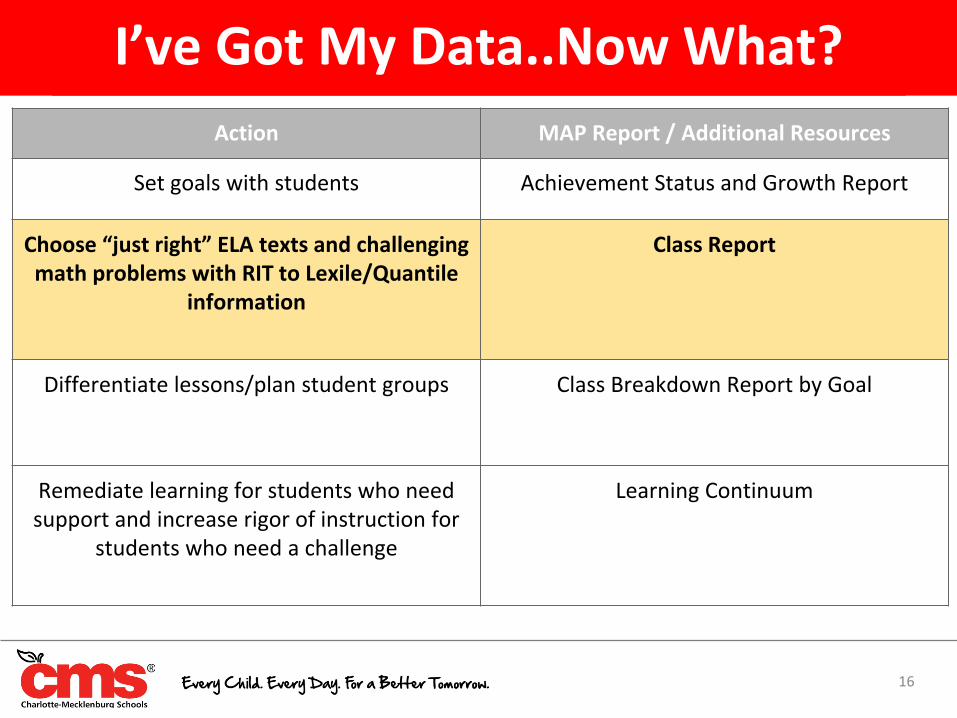
I’ve Got My Data..Now What?
8
Action MAP Report / Additional Resources
Set goals with students Achievement Status and Growth Report
Choose “just right” ELA texts and challenging math problems with RIT to Lexile/Quantile
information
Class Report
Differentiate lessons/plan student groups Class Breakdown Report by Goal
Remediate learning for students who need support and increase rigor of instruction for
students who need a challenge
Learning Continuum

Achievement Status & Growth Report
9
PathwayMAP Growth Reports > Achievement Status & Growth > Projection or Summary > Select Term
Rostered > Select Term Tested > Select Class > Select Growth Period > Create PDF Report
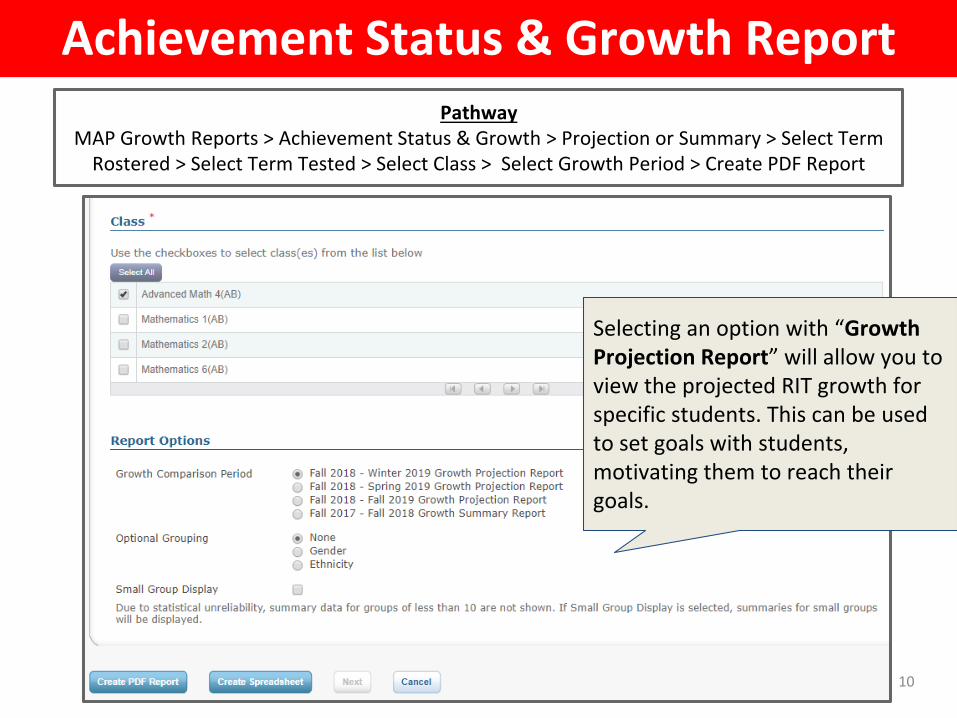
Achievement Status & Growth Report
10
PathwayMAP Growth Reports > Achievement Status & Growth > Projection or Summary > Select Term
Rostered > Select Term Tested > Select Class > Select Growth Period > Create PDF Report
Selecting an option with “Growth Projection Report” will allow you to view the projected RIT growth for specific students. This can be used to set goals with students, motivating them to reach their goals.

11
According to this report, Brandy and Andrea are both projected to grow by 3 RIT points each, pushing Brandy to 229 and Andrea to 223.

12

13

14

15
I’ve Got My Data..Now What?
16
Action MAP Report / Additional Resources
Set goals with students Achievement Status and Growth Report
Choose “just right” ELA texts and challenging math problems with RIT to Lexile/Quantile
information
Class Report
Differentiate lessons/plan student groups Class Breakdown Report by Goal
Remediate learning for students who need support and increase rigor of instruction for
students who need a challenge
Learning Continuum

17
PathwayMAP Growth Reports > Achievement Status & Growth > Projection or Summary > Select Term
Rostered > Select Term Tested > Select Class > Select Growth Period > Create PDF Report
Class Report

18
Class Report Summary Page
19
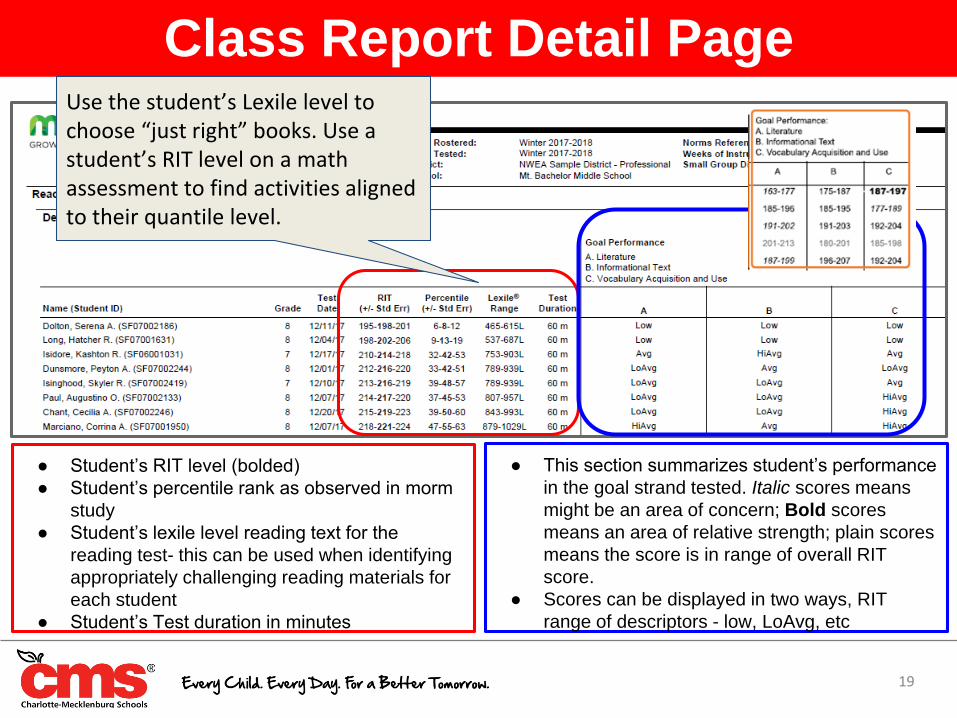
Class Report Detail Page
● Student’s RIT level (bolded)
● Student’s percentile rank as observed in morm
study
● Student’s lexile level reading text for the
reading test- this can be used when identifying
appropriately challenging reading materials for
each student
● Student’s Test duration in minutes
● This section summarizes student’s performance
in the goal strand tested. Italic scores means
might be an area of concern; Bold scores
means an area of relative strength; plain scores
means the score is in range of overall RIT
score.
● Scores can be displayed in two ways, RIT
range of descriptors - low, LoAvg, etc
Use the student’s Lexile level to choose “just right” books. Use a student’s RIT level on a math assessment to find activities aligned to their quantile level.

20
Instructional Resources
khanacademy.org/mappers

21
Instructional Resources
newsela.com

I’ve Got My Data..Now What?
22
Action MAP Report / Additional Resources
Set goals with students Achievement Status and Growth Report
Choose “just right” ELA texts and challenging math problems with RIT to Lexile/Quantile
information
Class Report
Differentiate lessons/plan student groups Class Breakdown Report by Goal
Remediate learning for students who need support and increase rigor of instruction for
students who need a challenge
Learning Continuum

23
Links to Learning
Continuum
PathwayMAP Growth Reports > Class Breakdown > Select Term Rostered > Select Term Tested > Select
School, Instructor, Class > View Report Online
Class Breakdown by Goal

I’ve Got My Data..Now What?
24
Action MAP Report / Additional Resources
Set goals with students Achievement Status and Growth Report
Choose “just right” ELA texts and challenging math problems with RIT to Lexile/Quantile
information
Class Report
Differentiate lessons/plan student groups Class Breakdown Report by Goal
Remediate learning for students who need support and increase rigor of instruction for
students who need a challenge
Learning Continuum

What is the Learning Continuum?
•The Learning Continuum puts standards and skills on a framework, based on RIT score, providing a better picture of what students already know and what they need to learn next.
•The Learning Continuum provides a map for individual students and groups of students based on students’ specific instructional levels and needs.
25
120
250
195

26
Click
Select by Topic or Standard
Select Grade Level
Click
Recommend by
Standard
Learning Continuum
PathwayMAP Growth Reports > Learning Continuum > Select School, Instructor, Class, Test
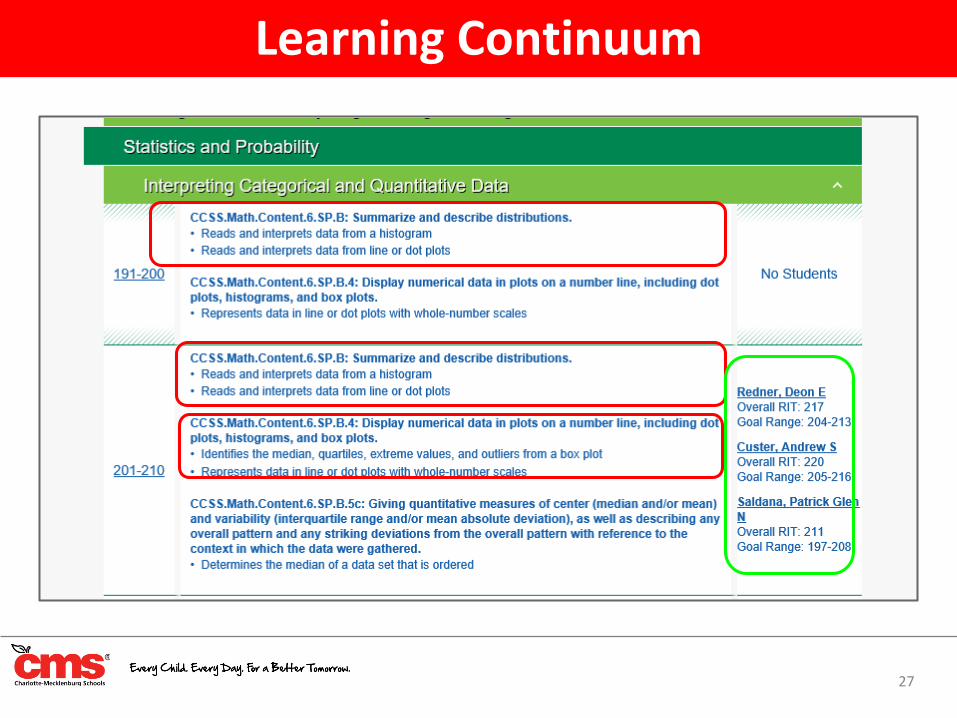
27
Learning Continuum

28
Key Takeaways
Achievement Status & Growth Reports - Use this report to identify achievement
status and growth for individual student and class, to support student goal setting for
growth and improvement, and to compare the class achievement and growth status
to normative data.
Class Report - Use this report to identify goal areas that are relative strength or
area of concern. This report can support class goal setting for growth and
improvement.
Class Break Down Report - Use this report to quickly identify areas of relative
strength or areas of concern to plan for differentiated instruction for small groups or
individual students.
Learning Continuum - Identify where students are ready to learn and develop as
they align to the standards; to plan instruction that engages every learner at his/her
level of readiness; develop student learning goals.

29
cmsmap.weebly.com
Key MAP Resources
1. CMS MAP Weebly (Link Below)2. 2015 MAP Normative Data Study3. Map Growth Comparative Data4. MAP Report Reference5. North Carolina Linking Study6. MAP RIT to Lexile and Quantile
Documents

30
MAP Training for Your School
To sign up for PD to your school, click on the link or scan the QR code below:
tinyurl.com/2018-2019MAPPDRequest

Q + A
31
What questions do you have for us?

Access Today’s Slides
32
Thank You - DUSI TeamAshley, Claudia, Kelly, Tamara, and Mary
tinyurl.com/FallMAPWebinar