Embed Size (px)
Citation preview
Volume 4 • Issue 1 • 1000126J Inform Tech Softw EngISSN: 2165-7866 JITSE, an open access journal
Chavez and Karstoft, J Inform Tech Softw Eng 2014, 4:1 DOI: 10.4172/2165-7866.1000126
Case Report Open Access
Map Building Based on a Xtion Pro Live RGBD and a Laser SensorsAlfredo Chavez1* and Henrik Karstoft2
1Faculty of Information Technology (FIT), Brno University of Technology, Czech Republic2Aarhus University, School of Engineering, Finlandsgade 22, 8200 Aarhus, Denmark
*Corresponding author: Alfredo Chavez, Faculty of Information Technology(FIT), Brno University of Technology, Czech Republic, Tel: +45-28498465; E-mail: [email protected]
Received February 07, 2014; Accepted February 27, 2014; Published March 07, 2014
Citation: Chavez A, Karstoft H (2014) Map Building Based on a Xtion Pro Live RGBD and a Laser Sensors. J Inform Tech Softw Eng 4: 126. doi:10.4172/2165-7866.1000126
Copyright: © 2014 Chavez A, et al. This is an open-access article distributed under the terms of the Creative Commons Attribution License, which permits unrestricted use, distribution, and reproduction in any medium, provided the original author and source are credited.
Keywords: Map Building; Xtion pro live RGBD; Laser sensors;Integration methods; Random vectors
IntroductionMobile robot’s full autonomy widens their range of applicability.
In this context, it is essential that a mobile robot is able to construct its own map based on sensors data readings, which are the only means the robot has to interact with its surroundings. Thus, map building, path planning, obstacle avoidance, and control are crucial in achieving full autonomy. Map building shall be carried out based on fusion of sensory information and uncertainty is one of the problems when dealing with sensor data readings. Therefore, it shall to be taken into account by the use of probabilistic sensor models.
Previous research on sensor data fusion has focused on different integration methods, i.e. Bayesian, Dempster Shafer, Fuzzy Logic, Neural Networks, among others [1-3]. Each sensor fusion method previously mentioned is unique to some extent. The Bayesian is the oldest approach and the one with strongest foundation. It offers an approach to some of the fundamental problems of sensor fusion: information uncertainty, conflicts, and incompleteness [4]. Due to this fact, the inclination of using Bayes has been taken into consideration to carry out the fusion process along the research in this paper. The result of the fusing process from the sensory information can be used to build a map of the robot’s environment by means of the mentioned Bayes approach. Once the map has been created, modules for localization, path planning, obstacle avoidance and control can be applied in the hierarchical architecture of the robot, thus achieving full autonomy.
One of the requirements when dealing with sensor data fusion that has to be taken into consideration is the choice of the internal representation. This representation must be chosen so that it is common to all sensors. This means that sensor readings of different modalities must be converted to the common internal representation in advance before the fusion process is carried out. Therefore, occupied as well as empty areas of any arbitrary environment must also be modeled without a prior knowledge of it. It must also represent the estimation and the certainty values of the confidence of the true parameters. The fusion process for different sensors must be feasible under this internal representation. Conversion of sensor data from the physical measurements to the internal representation should be easy to carry out. In this context, the map should be expanded as needed and must have multiple resolutions for different mobile robot tasks [5-8].
One internal representation that fulfills the above requirements is the occupancy grid introduced by Elfes [5-7]. An occupancy grid is a tessellation of the robot’s environment into cells defined over a discrete spatial lattice. The parameters in this random field are the stochastic random variables or cells Ci, i = 1, …, n. The status of these cells being occupied or empty is denoted o and e respectively. The state of each cell is exhaustive and exclusive, meaning that Po + Pe ≡ 1, where P is the probability of a random variable that gets a particular state.
Previous research on map building based on sensor fusion between laser range finder and cameras has been carried out. For instance Saurav et al. [9] has presented a heuristic sensor fusion method for a laser and a stereo vision camera to generate 2D occupancy grid. However, despite they have presented good results in reducing computational burden, the method lacks a more reliable sensor fusion technique that can cope better with uncertainties. Peyman et al. [10] has focused on fusing laser with depth images using a stereo vision system, where Vector Field Histogram (VFH) is used as a sensor fusion technique. The main result of this paper is to show that the field of view of both sensors complements each other when creating an occupancy grid map for robot planning tasks. A 2D model is constructed in front of the robot by projecting the 3D world model from disparity information, which then can be fused with the 2D laser map. Jia et al. [11] exemplifies successfully a map building method based on a Bayesian technique using range data from a binocular stereo vision and laser range finder sensors.
Moreover, other works on stereo vision system and laser for map building based on sensor fusion can be found in the literature. Yoder et al. [12] uses the Bayesian Occupancy Filter (BOF) to combine both stereo vision and laser sensors to an occupancy grid. The BOF consists
AbstractThe main contribution of this paper is to show the feasibility to use the novel Xtion Pro Live RGBD camera into
the field of sensor data fusion and map making based on the well established Bayesian method. This approach involves the combination of the Xtion Pro Live RGBD camera with the Hokuyo laser sensor data readings, which are interpreted by a probabilistic heuristic model that abstracts the beam into a ray casting to an occupied grid cell. Occupancy grid is proposed for representing the probability of the occupied and empty areas. In order to update the occupancy grid, the Bayesian estimation method is applied to both sensor data arrays. The sensor data fusion yields a significant improvement of the combined occupancy grid compared to the individual occupied sensor data readings. It is also shown by the Mahalanobis distance that by integrating both sensors, more reliable and accurate maps are produced. The approach has been exemplified by following a sensor data fusion method to building a map of an indoor environment robot.
Jour
nal o
f Inf
orm
ation Technology & Software Engineering
ISSN: 2165-7866
Journal ofInformation Technology & Software Engineering
Volume 4 • Issue 1 • 1000126J Inform Tech Softw EngISSN: 2165-7866 JITSE, an open access journal
Citation: Chavez A, Karstoft H (2014) Map Building Based on a Xtion Pro Live RGBD and a Laser Sensors. J Inform Tech Softw Eng 4: 126. doi:10.4172/2165-7866.1000126
Page 2 of 7
of a prediction phase and an estimate phase. This work has presented as the first experiments in the use of the BOF to fuse data obtained from stereo vision and laser sensors, on an intelligent vehicle platform.
One of the main drawbacks of the Xtion Pro Live RGBD camera when compared to the stereo vision system is the missing depth measurements (nmd pixels) [13]. However, the main advantages of the RGBD are its low price and the possibility to acquire video and depth data with a good resolution. And, the research done in this work has been focusing on the problem of fusing laser range and RGBD readings. Thus, a sensor data fusion approach has been followed by combining the information of a laser scanner (2D) with the RGBD image (3D) for mapping purposes. This is an advantage since the vertical field of view of the RGBD sensor provides more information what is in front of the robot than the laser does. However, the laser catches more information in the horizontal field of view than the RGBD sensor.
The research done in this paper has shown the feasibility to use the novel RGBD camera into the field of sensor data fusion and map making based on the well known Bayesian method. The approach has been exemplified by building a map of an indoor environment robot. It is also shown that by integrating both sensors, more reliable and accurate maps are produced. Ray casting to a hit occupied cell is proposed instead of a probabilistic sensor model.
Section 3 describes the sensors used in the present work e.g. the laser range finder and the RGBD. Section 4 deals with a description of the probabilistic sensor model. Section 5 explains how the Bayes recursive formula can be applied to the occupancy grids in order to integrate and update the maps. 5 - .1 also describes the fusion of two sensors with two occupancy grids. Section 6 shows the experimental results of the fusion of the different sensors using the previous methods and also analyses the maps by means of the Mahalanobis distance. And, finally, section 7 presents the conclusion and future research work.
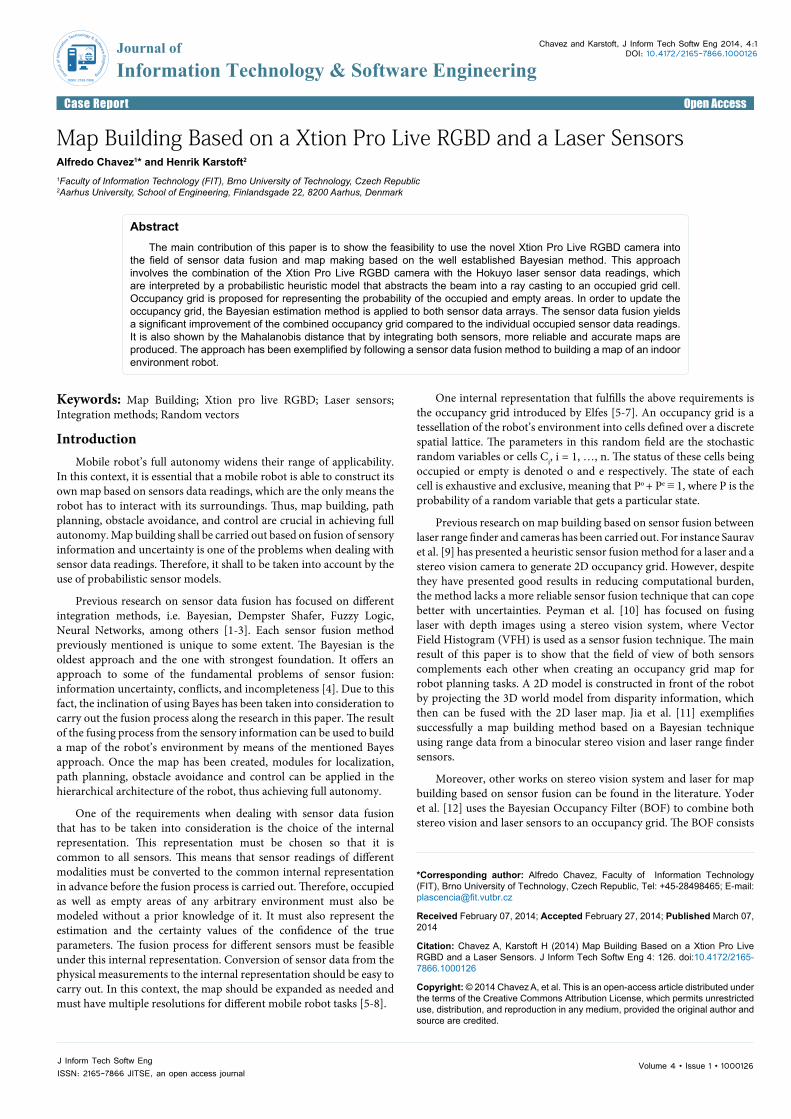
SensorsThe RGBD sensor from Asus as seen in Figure 1 is becoming quite
utilized in various mobile robot tasks [14].
However, the narrow field of view and the close range are limitations of the sensor. It has a field of view of 58° H, 45° V (Horizontal, Vertical). Meanwhile, the sensor’s depth image size is 640 × 480 pixels with a total of 307,200 pixels. To this end, a good field of view is important in mobile robots, because the more wide the field view, the more precise the map, e.g. the robot can catch more features from the environment in a single sensor reading. On the other hand, a mobile robot with poor field view must constantly maneuver to fill up the missing map. The distance of use of the sensor is between 0.8m and 3.5m. This limited range might be a problem when navigating. More precisely, the robot may crash with objects that are situated between the RGBD sensor and the minimum range.
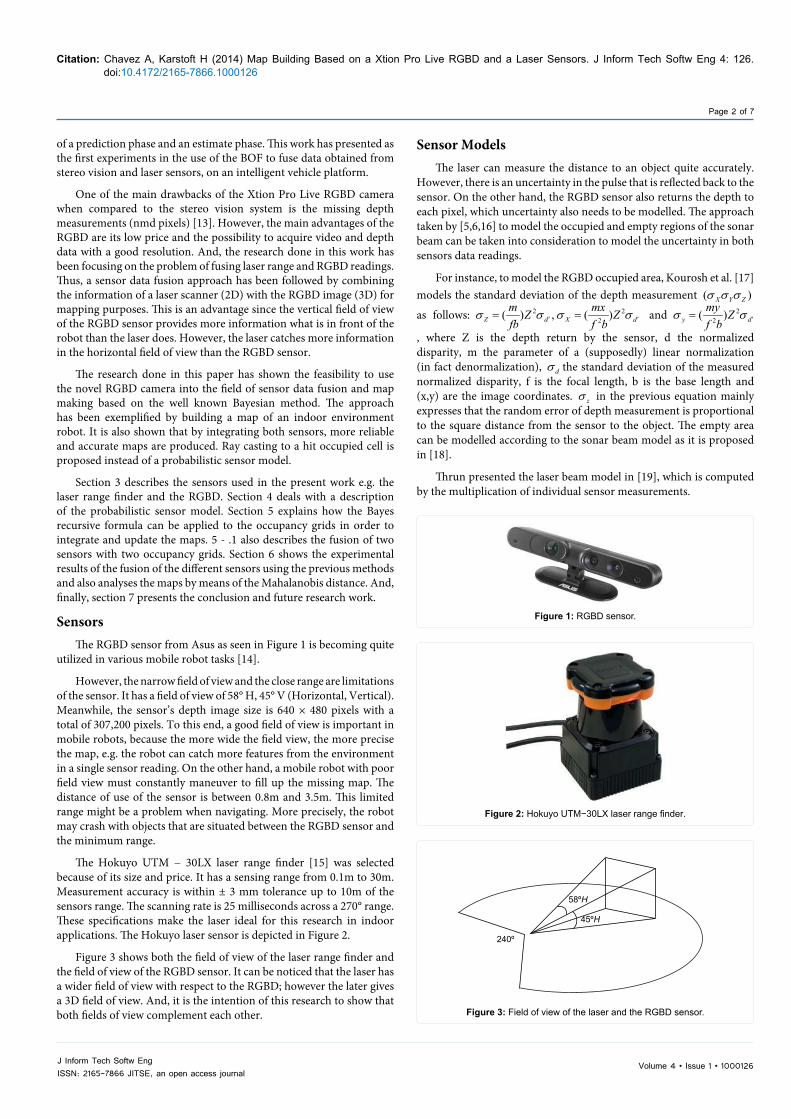
The Hokuyo UTM − 30LX laser range finder [15] was selected because of its size and price. It has a sensing range from 0.1m to 30m. Measurement accuracy is within ± 3 mm tolerance up to 10m of the sensors range. The scanning rate is 25 milliseconds across a 270° range. These specifications make the laser ideal for this research in indoor applications. The Hokuyo laser sensor is depicted in Figure 2.
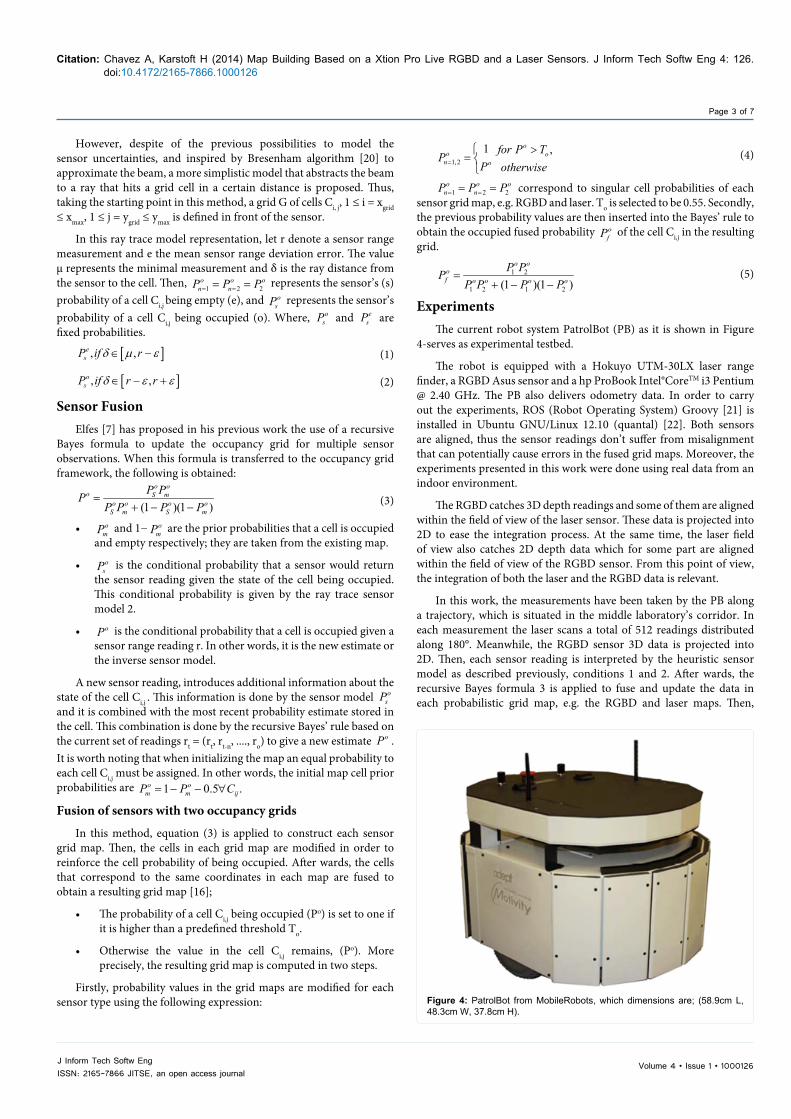
Figure 3 shows both the field of view of the laser range finder and the field of view of the RGBD sensor. It can be noticed that the laser has a wider field of view with respect to the RGBD; however the later gives a 3D field of view. And, it is the intention of this research to show that both fields of view complement each other.
Sensor ModelsThe laser can measure the distance to an object quite accurately.
However, there is an uncertainty in the pulse that is reflected back to the sensor. On the other hand, the RGBD sensor also returns the depth to each pixel, which uncertainty also needs to be modelled. The approach taken by [5,6,16] to model the occupied and empty regions of the sonar beam can be taken into consideration to model the uncertainty in both sensors data readings.
For instance, to model the RGBD occupied area, Kourosh et al. [17] models the standard deviation of the depth measurement ( )X Y Zσ σ σ
as follows: 2 22( ) , ( )Z d X d
m mxZ Zfb f b′ ′= =σ σ σ σ and 2
2( )y dmy Zf b ′=σ σ
, where Z is the depth return by the sensor, d the normalized disparity, m the parameter of a (supposedly) linear normalization (in fact denormalization), dσ the standard deviation of the measured normalized disparity, f is the focal length, b is the base length and (x,y) are the image coordinates. zσ in the previous equation mainly expresses that the random error of depth measurement is proportional to the square distance from the sensor to the object. The empty area can be modelled according to the sonar beam model as it is proposed in [18].
Thrun presented the laser beam model in [19], which is computed by the multiplication of individual sensor measurements.
Figure 1: RGBD sensor.
Figure 2: Hokuyo UTM−30LX laser range finder.
240º
45ºH
58ºH
Figure 3: Field of view of the laser and the RGBD sensor.
Volume 4 • Issue 1 • 1000126J Inform Tech Softw EngISSN: 2165-7866 JITSE, an open access journal
Citation: Chavez A, Karstoft H (2014) Map Building Based on a Xtion Pro Live RGBD and a Laser Sensors. J Inform Tech Softw Eng 4: 126. doi:10.4172/2165-7866.1000126
Page 3 of 7
However, despite of the previous possibilities to model the sensor uncertainties, and inspired by Bresenham algorithm [20] to approximate the beam, a more simplistic model that abstracts the beam to a ray that hits a grid cell in a certain distance is proposed. Thus, taking the starting point in this method, a grid G of cells Ci, j, 1 ≤ i = xgrid ≤ xmax, 1 ≤ j = ygrid ≤ ymax is defined in front of the sensor.
In this ray trace model representation, let r denote a sensor range measurement and e the mean sensor range deviation error. The value µ represents the minimal measurement and δ is the ray distance from the sensor to the cell. Then, 1 2 2
o o on nP P P= == = represents the sensor’s (s)
probability of a cell Ci,j being empty (e), and osP represents the sensor’s
probability of a cell Ci,j being occupied (o). Where, osP and e
sP are fixed probabilities.
[ ], ,esP if r∈ −δ µ ε (1)
[ ], ,osP if r r∈ − +δ ε ε (2)
Sensor FusionElfes [7] has proposed in his previous work the use of a recursive
Bayes formula to update the occupancy grid for multiple sensor observations. When this formula is transferred to the occupancy grid framework, the following is obtained:
(1 )(1 )
o oo S m
o o o oS m S m
P PPP P P P
=+ − − (3)
• omP and 1− o
mP are the prior probabilities that a cell is occupied and empty respectively; they are taken from the existing map.
• osP is the conditional probability that a sensor would return
the sensor reading given the state of the cell being occupied. This conditional probability is given by the ray trace sensor model 2.
• oP is the conditional probability that a cell is occupied given a sensor range reading r. In other words, it is the new estimate or the inverse sensor model.
A new sensor reading, introduces additional information about the state of the cell Ci,j . This information is done by the sensor model o
sP and it is combined with the most recent probability estimate stored in the cell. This combination is done by the recursive Bayes’ rule based on the current set of readings rt = (rt, rt-n, ...., ro) to give a new estimate oP . It is worth noting that when initializing the map an equal probability to each cell Ci,j must be assigned. In other words, the initial map cell prior probabilities are 1 0.5 .o o
m m ijP P C= − − ∀
Fusion of sensors with two occupancy grids
In this method, equation (3) is applied to construct each sensor grid map. Then, the cells in each grid map are modified in order to reinforce the cell probability of being occupied. After wards, the cells that correspond to the same coordinates in each map are fused to obtain a resulting grid map [16];
• The probability of a cell Ci,j being occupied (Po) is set to one if it is higher than a predefined threshold To.
• Otherwise the value in the cell Ci,j remains, (Po). More precisely, the resulting grid map is computed in two steps.
Firstly, probability values in the grid maps are modified for each sensor type using the following expression:
1,2
1 ,oo o
n o
for P TP
P otherwise=
>=
(4)
1 2 2o o o
n nP P P= == = correspond to singular cell probabilities of each sensor grid map, e.g. RGBD and laser. To is selected to be 0.55. Secondly, the previous probability values are then inserted into the Bayes’ rule to obtain the occupied fused probability o
fP of the cell Ci,j in the resulting grid.
1 2
1 2 1 2(1 )(1 )
o oof o o o o
P PPP P P P
=+ − −
(5)
ExperimentsThe current robot system PatrolBot (PB) as it is shown in Figure
4-serves as experimental testbed.
The robot is equipped with a Hokuyo UTM-30LX laser range finder, a RGBD Asus sensor and a hp ProBook Intel®CoreTM i3 Pentium @ 2.40 GHz. The PB also delivers odometry data. In order to carry out the experiments, ROS (Robot Operating System) Groovy [21] is installed in Ubuntu GNU/Linux 12.10 (quantal) [22]. Both sensors are aligned, thus the sensor readings don’t suffer from misalignment that can potentially cause errors in the fused grid maps. Moreover, the experiments presented in this work were done using real data from an indoor environment.
The RGBD catches 3D depth readings and some of them are aligned within the field of view of the laser sensor. These data is projected into 2D to ease the integration process. At the same time, the laser field of view also catches 2D depth data which for some part are aligned within the field of view of the RGBD sensor. From this point of view, the integration of both the laser and the RGBD data is relevant.
In this work, the measurements have been taken by the PB along a trajectory, which is situated in the middle laboratory’s corridor. In each measurement the laser scans a total of 512 readings distributed along 180°. Meanwhile, the RGBD sensor 3D data is projected into 2D. Then, each sensor reading is interpreted by the heuristic sensor model as described previously, conditions 1 and 2. After wards, the recursive Bayes formula 3 is applied to fuse and update the data in each probabilistic grid map, e.g. the RGBD and laser maps. Then,
Figure 4: PatrolBot from MobileRobots, which dimensions are; (58.9cm L, 48.3cm W, 37.8cm H).
Volume 4 • Issue 1 • 1000126J Inform Tech Softw EngISSN: 2165-7866 JITSE, an open access journal
Citation: Chavez A, Karstoft H (2014) Map Building Based on a Xtion Pro Live RGBD and a Laser Sensors. J Inform Tech Softw Eng 4: 126. doi:10.4172/2165-7866.1000126
Page 4 of 7
Equation 5 is applied to both maps in the integration process to obtain a single fused map. In this map the gray value represents the unknown probability, e.g. 1 0.5 .o o
m m ijP P C= − = ∀
Throughout the experiments, the values of osP = 0.95 and e
sP = 0.40, corresponding for occupied (white) and free cells (black), respectively. The previous values have been determined experimentally to work best for the case of mapping mostly in static environments.
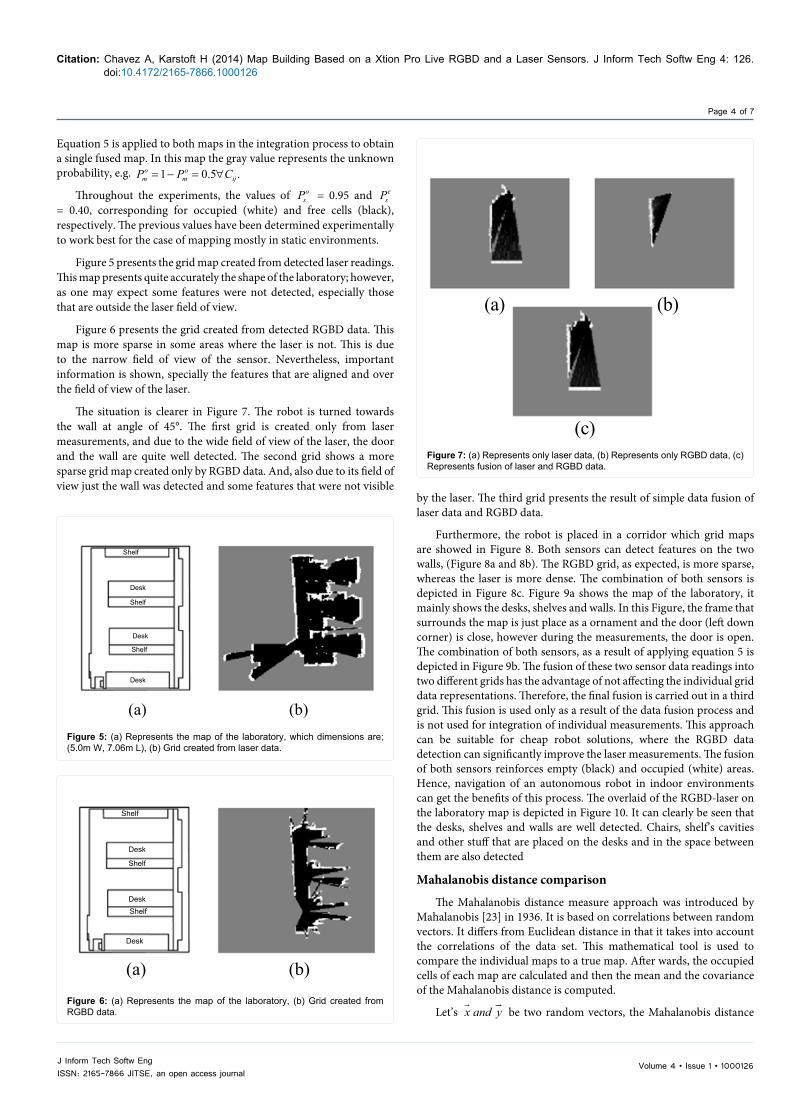
Figure 5 presents the grid map created from detected laser readings. This map presents quite accurately the shape of the laboratory; however, as one may expect some features were not detected, especially those that are outside the laser field of view.
Figure 6 presents the grid created from detected RGBD data. This map is more sparse in some areas where the laser is not. This is due to the narrow field of view of the sensor. Nevertheless, important information is shown, specially the features that are aligned and over the field of view of the laser.
The situation is clearer in Figure 7. The robot is turned towards the wall at angle of 45°. The first grid is created only from laser measurements, and due to the wide field of view of the laser, the door and the wall are quite well detected. The second grid shows a more sparse grid map created only by RGBD data. And, also due to its field of view just the wall was detected and some features that were not visible
by the laser. The third grid presents the result of simple data fusion of laser data and RGBD data.
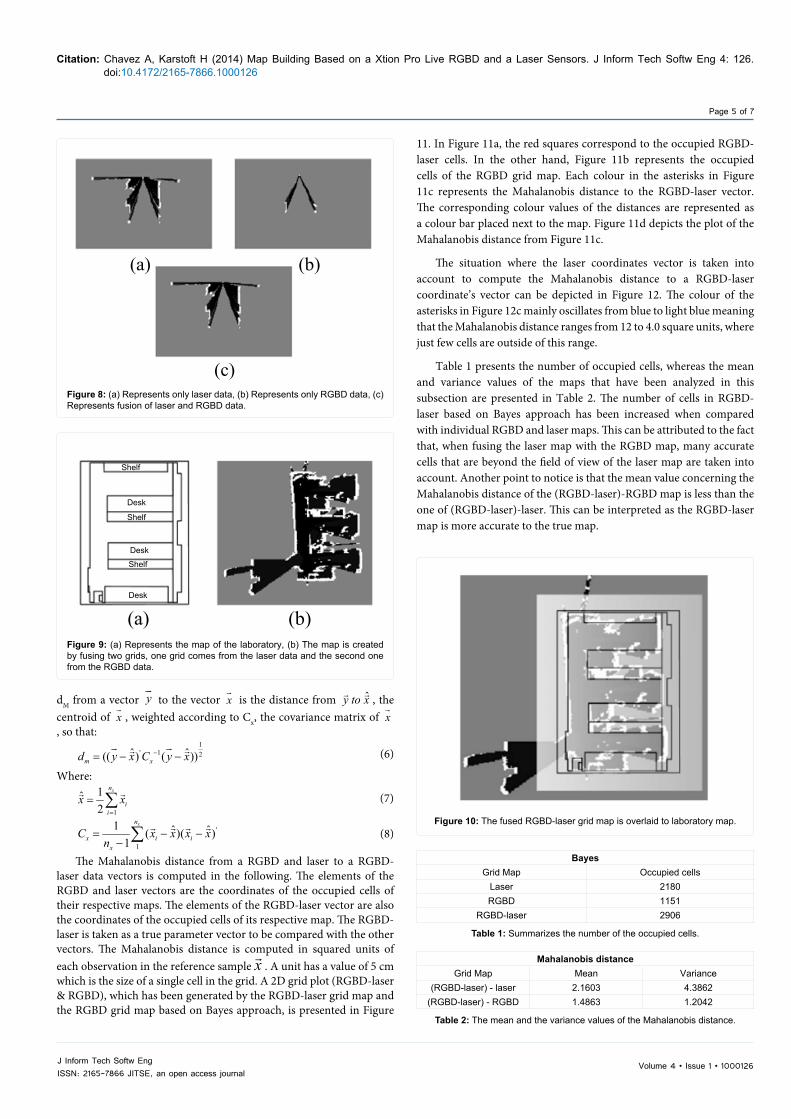
Furthermore, the robot is placed in a corridor which grid maps are showed in Figure 8. Both sensors can detect features on the two walls, (Figure 8a and 8b). The RGBD grid, as expected, is more sparse, whereas the laser is more dense. The combination of both sensors is depicted in Figure 8c. Figure 9a shows the map of the laboratory, it mainly shows the desks, shelves and walls. In this Figure, the frame that surrounds the map is just place as a ornament and the door (left down corner) is close, however during the measurements, the door is open. The combination of both sensors, as a result of applying equation 5 is depicted in Figure 9b. The fusion of these two sensor data readings into two different grids has the advantage of not affecting the individual grid data representations. Therefore, the final fusion is carried out in a third grid. This fusion is used only as a result of the data fusion process and is not used for integration of individual measurements. This approach can be suitable for cheap robot solutions, where the RGBD data detection can significantly improve the laser measurements. The fusion of both sensors reinforces empty (black) and occupied (white) areas. Hence, navigation of an autonomous robot in indoor environments can get the benefits of this process. The overlaid of the RGBD-laser on the laboratory map is depicted in Figure 10. It can clearly be seen that the desks, shelves and walls are well detected. Chairs, shelf’s cavities and other stuff that are placed on the desks and in the space between them are also detected
Mahalanobis distance comparison
The Mahalanobis distance measure approach was introduced by Mahalanobis [23] in 1936. It is based on correlations between random vectors. It differs from Euclidean distance in that it takes into account the correlations of the data set. This mathematical tool is used to compare the individual maps to a true map. After wards, the occupied cells of each map are calculated and then the mean and the covariance of the Mahalanobis distance is computed.
Let’s x and y
be two random vectors, the Mahalanobis distance
Shelf
Shelf
Shelf
Desk
Desk
Desk
(a) (b)Figure 5: (a) Represents the map of the laboratory, which dimensions are; (5.0m W, 7.06m L), (b) Grid created from laser data.
Desk
Desk
Desk
Shelf
Shelf
Shelf
(a) (b)Figure 6: (a) Represents the map of the laboratory, (b) Grid created from RGBD data.
(a) (b)
(c)Figure 7: (a) Represents only laser data, (b) Represents only RGBD data, (c) Represents fusion of laser and RGBD data.
Volume 4 • Issue 1 • 1000126J Inform Tech Softw EngISSN: 2165-7866 JITSE, an open access journal
Citation: Chavez A, Karstoft H (2014) Map Building Based on a Xtion Pro Live RGBD and a Laser Sensors. J Inform Tech Softw Eng 4: 126. doi:10.4172/2165-7866.1000126
Page 5 of 7
dM from a vector y
to the vector x
is the distance from ˆy to x , the centroid of x
, weighted according to Cx, the covariance matrix of x
, so that: 1
' 1 2ˆ ˆ(( ) ( ))m xd y x C y x−= − −
(6)
Where:
1
1ˆ2
xn
ii
x x=
= ∑ (7)
'
1
1 ˆ ˆ( )( )1
xn
x i ix
C x x x xn
= − −− ∑ (8)
The Mahalanobis distance from a RGBD and laser to a RGBD-laser data vectors is computed in the following. The elements of the RGBD and laser vectors are the coordinates of the occupied cells of their respective maps. The elements of the RGBD-laser vector are also the coordinates of the occupied cells of its respective map. The RGBD-laser is taken as a true parameter vector to be compared with the other vectors. The Mahalanobis distance is computed in squared units of each observation in the reference sample x . A unit has a value of 5 cm which is the size of a single cell in the grid. A 2D grid plot (RGBD-laser & RGBD), which has been generated by the RGBD-laser grid map and the RGBD grid map based on Bayes approach, is presented in Figure
(a) (b)
(c)Figure 8: (a) Represents only laser data, (b) Represents only RGBD data, (c) Represents fusion of laser and RGBD data.
(a) (b)
Shelf
Shelf
Shelf
Desk
Desk
Desk
Figure 9: (a) Represents the map of the laboratory, (b) The map is created by fusing two grids, one grid comes from the laser data and the second one from the RGBD data.
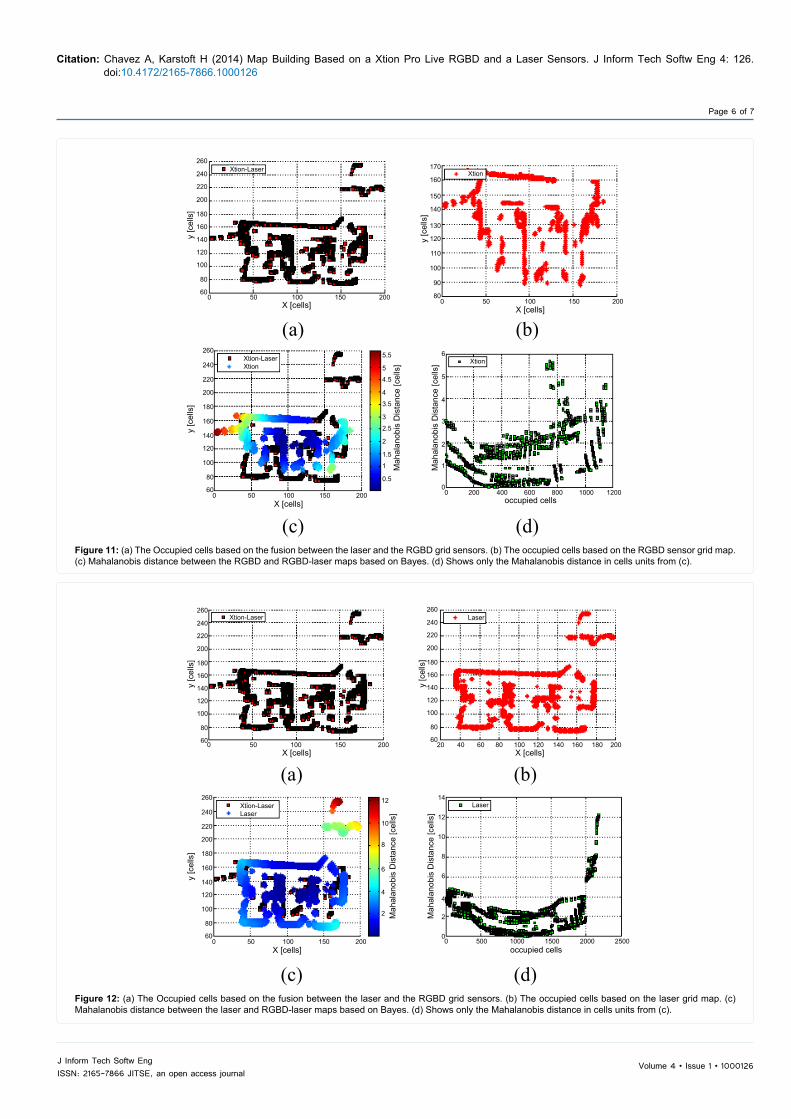
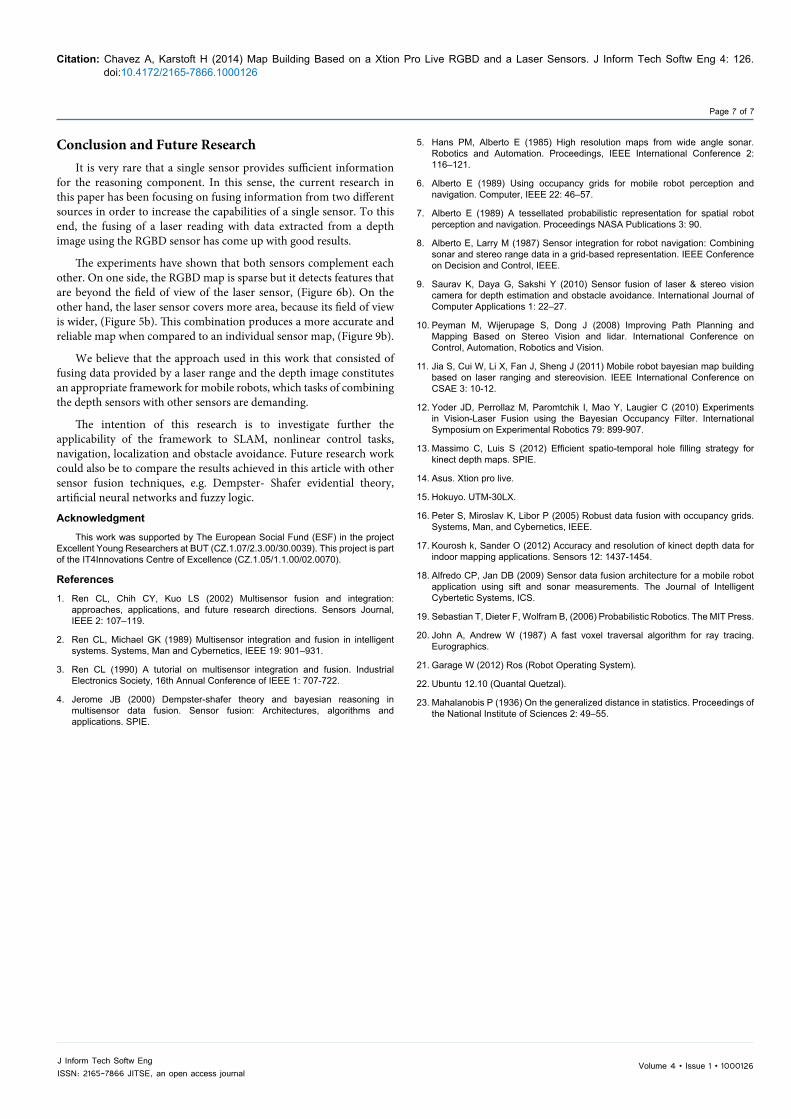
11. In Figure 11a, the red squares correspond to the occupied RGBD-laser cells. In the other hand, Figure 11b represents the occupied cells of the RGBD grid map. Each colour in the asterisks in Figure 11c represents the Mahalanobis distance to the RGBD-laser vector. The corresponding colour values of the distances are represented as a colour bar placed next to the map. Figure 11d depicts the plot of the Mahalanobis distance from Figure 11c.
The situation where the laser coordinates vector is taken into account to compute the Mahalanobis distance to a RGBD-laser coordinate’s vector can be depicted in Figure 12. The colour of the asterisks in Figure 12c mainly oscillates from blue to light blue meaning that the Mahalanobis distance ranges from 12 to 4.0 square units, where just few cells are outside of this range.
Table 1 presents the number of occupied cells, whereas the mean and variance values of the maps that have been analyzed in this subsection are presented in Table 2. The number of cells in RGBD-laser based on Bayes approach has been increased when compared with individual RGBD and laser maps. This can be attributed to the fact that, when fusing the laser map with the RGBD map, many accurate cells that are beyond the field of view of the laser map are taken into account. Another point to notice is that the mean value concerning the Mahalanobis distance of the (RGBD-laser)-RGBD map is less than the one of (RGBD-laser)-laser. This can be interpreted as the RGBD-laser map is more accurate to the true map.
Figure 10: The fused RGBD-laser grid map is overlaid to laboratory map.
Table 1: Summarizes the number of the occupied cells.
BayesGrid Map Occupied cells
Laser 2180RGBD 1151
RGBD-laser 2906
Table 2: The mean and the variance values of the Mahalanobis distance.
Mahalanobis distanceGrid Map Mean Variance
(RGBD-laser) - laser 2.1603 4.3862(RGBD-laser) - RGBD 1.4863 1.2042
Volume 4 • Issue 1 • 1000126J Inform Tech Softw EngISSN: 2165-7866 JITSE, an open access journal
Citation: Chavez A, Karstoft H (2014) Map Building Based on a Xtion Pro Live RGBD and a Laser Sensors. J Inform Tech Softw Eng 4: 126. doi:10.4172/2165-7866.1000126
Page 6 of 7
(a) (b)
(c) (d)
260
240
220
200
180
160
140
120
100
80
60
y [c
ells
]
y
[cel
ls]
260
240
220
200
180
160
140
120
100
80
600 50 100 150 200
0 50 100 150 200 0 50 100 150 200
170
160
150
140
130
120
110
100
90
80
0 200 400 600 800 1000 1200occupied cellsX [cells]
X [cells] X [cells]
y [c
ells
]
Mah
alan
obis
Dis
tanc
e [c
ells
]
Mah
alan
obis
Dis
tanc
e [c
ells
]
5.5
5
4.5
4
3.5
3
2.5
2
1.5
1
0.5
6
5
4
3
2
1
0
Xtion-LaserXtion
Xtion
XtionXtion-Laser
Figure 11: (a) The Occupied cells based on the fusion between the laser and the RGBD grid sensors. (b) The occupied cells based on the RGBD sensor grid map. (c) Mahalanobis distance between the RGBD and RGBD-laser maps based on Bayes. (d) Shows only the Mahalanobis distance in cells units from (c).
(a) (b)
(c) (d)
260
240
220
200
180
160
140
120
100
80
60
260
240
220
200
180
160
140
120
100
80
60
260
240
220
200
180
160
140
120
100
80
60
14
12
10
8
6
4
2
0
12
10
8
6
4
2
0 50 100 150 200
0 50 100 150 200
20 40 60 80 100 120 140 160 180 200
0 500 1000 1500 2000 2500
X [cells]X [cells]
X [cells] occupied cells
LaserXtion-Laser
LaserXtion-LaserLaser
y [c
ells
]
y
[cel
ls]
y [c
ells
]
Mah
alan
obis
Dis
tanc
e [c
ells
]
Mah
alan
obis
Dis
tanc
e [c
ells
]
Figure 12: (a) The Occupied cells based on the fusion between the laser and the RGBD grid sensors. (b) The occupied cells based on the laser grid map. (c) Mahalanobis distance between the laser and RGBD-laser maps based on Bayes. (d) Shows only the Mahalanobis distance in cells units from (c).
Volume 4 • Issue 1 • 1000126J Inform Tech Softw EngISSN: 2165-7866 JITSE, an open access journal
Citation: Chavez A, Karstoft H (2014) Map Building Based on a Xtion Pro Live RGBD and a Laser Sensors. J Inform Tech Softw Eng 4: 126. doi:10.4172/2165-7866.1000126
Page 7 of 7
Conclusion and Future ResearchIt is very rare that a single sensor provides sufficient information
for the reasoning component. In this sense, the current research in this paper has been focusing on fusing information from two different sources in order to increase the capabilities of a single sensor. To this end, the fusing of a laser reading with data extracted from a depth image using the RGBD sensor has come up with good results.
The experiments have shown that both sensors complement each other. On one side, the RGBD map is sparse but it detects features that are beyond the field of view of the laser sensor, (Figure 6b). On the other hand, the laser sensor covers more area, because its field of view is wider, (Figure 5b). This combination produces a more accurate and reliable map when compared to an individual sensor map, (Figure 9b).
We believe that the approach used in this work that consisted of fusing data provided by a laser range and the depth image constitutes an appropriate framework for mobile robots, which tasks of combining the depth sensors with other sensors are demanding.
The intention of this research is to investigate further the applicability of the framework to SLAM, nonlinear control tasks, navigation, localization and obstacle avoidance. Future research work could also be to compare the results achieved in this article with other sensor fusion techniques, e.g. Dempster- Shafer evidential theory, artificial neural networks and fuzzy logic.
Acknowledgment
This work was supported by The European Social Fund (ESF) in the project Excellent Young Researchers at BUT (CZ.1.07/2.3.00/30.0039). This project is part of the IT4Innovations Centre of Excellence (CZ.1.05/1.1.00/02.0070).
References
1. Ren CL, Chih CY, Kuo LS (2002) Multisensor fusion and integration: approaches, applications, and future research directions. Sensors Journal, IEEE 2: 107–119.
2. Ren CL, Michael GK (1989) Multisensor integration and fusion in intelligentsystems. Systems, Man and Cybernetics, IEEE 19: 901–931.
3. Ren CL (1990) A tutorial on multisensor integration and fusion. Industrial Electronics Society, 16th Annual Conference of IEEE 1: 707-722.
4. Jerome JB (2000) Dempster-shafer theory and bayesian reasoning inmultisensor data fusion. Sensor fusion: Architectures, algorithms and applications. SPIE.
5. Hans PM, Alberto E (1985) High resolution maps from wide angle sonar. Robotics and Automation. Proceedings, IEEE International Conference 2: 116–121.
6. Alberto E (1989) Using occupancy grids for mobile robot perception andnavigation. Computer, IEEE 22: 46–57.
7. Alberto E (1989) A tessellated probabilistic representation for spatial robotperception and navigation. Proceedings NASA Publications 3: 90.
8. Alberto E, Larry M (1987) Sensor integration for robot navigation: Combiningsonar and stereo range data in a grid-based representation. IEEE Conference on Decision and Control, IEEE.
9. Saurav K, Daya G, Sakshi Y (2010) Sensor fusion of laser & stereo vision camera for depth estimation and obstacle avoidance. International Journal of Computer Applications 1: 22–27.
10. Peyman M, Wijerupage S, Dong J (2008) Improving Path Planning and Mapping Based on Stereo Vision and lidar. International Conference on Control, Automation, Robotics and Vision.
11. Jia S, Cui W, Li X, Fan J, Sheng J (2011) Mobile robot bayesian map building based on laser ranging and stereovision. IEEE International Conference on CSAE 3: 10-12.
12. Yoder JD, Perrollaz M, Paromtchik I, Mao Y, Laugier C (2010) Experiments in Vision-Laser Fusion using the Bayesian Occupancy Filter. International Symposium on Experimental Robotics 79: 899-907.
13. Massimo C, Luis S (2012) Efficient spatio-temporal hole filling strategy for kinect depth maps. SPIE.
14. Asus. Xtion pro live.
15. Hokuyo. UTM-30LX.
16. Peter S, Miroslav K, Libor P (2005) Robust data fusion with occupancy grids. Systems, Man, and Cybernetics, IEEE.
17. Kourosh k, Sander O (2012) Accuracy and resolution of kinect depth data for indoor mapping applications. Sensors 12: 1437-1454.
18. Alfredo CP, Jan DB (2009) Sensor data fusion architecture for a mobile robotapplication using sift and sonar measurements. The Journal of Intelligent Cybertetic Systems, ICS.
19. Sebastian T, Dieter F, Wolfram B, (2006) Probabilistic Robotics. The MIT Press.
20. John A, Andrew W (1987) A fast voxel traversal algorithm for ray tracing. Eurographics.
21. Garage W (2012) Ros (Robot Operating System).
22. Ubuntu 12.10 (Quantal Quetzal).
23. Mahalanobis P (1936) On the generalized distance in statistics. Proceedings of the National Institute of Sciences 2: 49–55.


![Layered RGBD Scene Flow Estimation - cv- · PDF fileLayered RGBD Scene Flow Estimation Deqing Sun 1Erik B. Sudderth2 Hanspeter Pfister ... Ghuffar et al. [14] first estimate the](https://img.pdfslide.us/doc/110x75/5a9df7f17f8b9ad2298b81d8/layered-rgbd-scene-flow-estimation-cv-rgbd-scene-flow-estimation-deqing-sun-1erik.jpg)
![RGBD Datasets: Past, Present and Future - arXiv · RGBD Datasets: Past, Present and Future Michael Firman ... ternative method of evaluation or rely on human ... [95]. Synthetic data](https://img.pdfslide.us/doc/110x75/5b83ccae7f8b9adc698ddf12/rgbd-datasets-past-present-and-future-arxiv-rgbd-datasets-past-present.jpg)