Embed Size (px)
Citation preview
International Research Journal of Engineering and Technology (IRJET) e-ISSN: 2395-0056
Volume: 04 Issue: 12 | Dec-2017 www.irjet.net p-ISSN: 2395-0072
© 2017, IRJET | Impact Factor value: 6.171 | ISO 9001:2008 Certified Journal | Page 1801
Manufacturing Lead Time Reduction in Monoblock (SWJ) Pump
Industry
M.Parthiban 1a, M.Perumalsamy 1b, G.Aravinddinesh 2
1a Assistant Professor, Department of Mechanical Engineering, PSG College of Technology, Tamilnadu, India 1b,2 PG Scholar, Department of Mechanical Engineering, PSG College of Technology, Tamilnadu, India
---------------------------------------------------------------------***---------------------------------------------------------------------
Abstract - Manufacturing lead time is the time required to produce product from its raw materials to final product.A company has to fulfill its customer needs to sustain in this competitive world. Lean has served the manufacturing sector with speed and quality. This project aims at lead time reduction in pump manufacturing company. Value Stream Map(VSM) served as an initiative for identifying bottlenecks process and waste in the manufacturing line; current state map is drawn by the observation made on the shop floor. The takt time is calculated for the demand to find out the bottleneck operations. After identifying the bottleneck operations line balancing is done. The Work In Process (WIP) inventory is reduced by balancing the workstation. Future state map is developed in the perspective of reduction of lead time and to match the takt time with bottleneck process. After line balancing implementation, the lead time for assembly of the SWJ pump is reduced 32 percent and work in process inventory is reduced 25 percent.
Key Words: Value Stream Mapping, Lead Time, Lean Production Tools, Line Balancing, SWJ Pump, Takt time.
1. INTRODUCTION
When we look at the present scenario we learn due to growing pressure and competition in the present changing environment, companies are all out to enter into the competitive world and give all advantages. This step is often to find out a way to reduce lead time in a way to decrease cost increase customer service lead time reduction which is one of the most significant aspects of successful manufacturing customers except quick and effective response to their needs and expectations, and deliver excellent quality on time thus lead time has become the prime focus for companies.
1.1 Lean Manufacturing
Lean manufacturing is a management philosophy focusing on the decrease or reduction of the seven wastes Over-production, Waiting time, Transportation, Processing, Inventory, Motion and Scrap in manufactured products. By eliminating waste (Muda), quality is improved, work in process inventory reduced, production time is reduced, and the cost is reduced. Lean is all about getting the right quantity while minimising waste and being flexible and open to change. Lean manufacturing is a technique which focuses on customer needs and fulfills it by delivering the requirements at less time with high quality and cheaper cost through
eliminating all kinds of hidden wastes that present in the companies by continuous improvement. The implementation of lean manufacturing techniques in a company will result in higher productivity with less lead time. Therefore, lean practices contribute substantially to plant operational operation. Lean tools like Value stream mapping (VSM), Kanban, cellular manufacturing, 5S, visual management, etc., are used in the implementation stage to reduce the wastes, and non-value added activities in an organisation.
1.2 Types of Activities And Seven Wastes of Production
The activities that comprise work can be grouped into three categories.
1. Value-added work.
2. Non-value-added work.
3. Waste.
Customers will pay for value-added work, and for the non-value-added work Customers will not pay for waste. Waste is defined as any activity that consumes resource such as raw material, machine, labour, etc., but does not create any value for the customer.
Further, the wastes are classified into seven major types. The seven types of wastes are
Overproduction
Production of products which are not in need and also production done earlier than the demand is overproduction. When the overproduction is done there is a risk of producing products of less quality and due to this, there are possibilities of the goods being sold for a very low price and sometimes risks of discarding them as scrap. Nevertheless, in some cases when extra supplies of finished and semi-finished goods are purposely maintained, even by lean manufacturers.
Transportation
Transporting raw materials or semi-finished products with less or no value to the customer, from one workstation to another is transportation. The purpose behind this is the transportation of materials at different stages of production is to use the output of one process is immediate as input for next process. This transportation between process stages
International Research Journal of Engineering and Technology (IRJET) e-ISSN: 2395-0056
Volume: 04 Issue: 12 | Dec-2017 www.irjet.net p-ISSN: 2395-0072
© 2017, IRJET | Impact Factor value: 6.171 | ISO 9001:2008 Certified Journal | Page 1802
leads to prolonging production cycle times, inefficient use of workforce and workspace which can be a source of production stoppages.
Waiting
When there is an inefficient production flow on the shop floor or bottlenecks, waiting is considered as the idle time for machines or workers.Waiting also includes minor delays between processing of components. Waiting for results at a significant cost as it increases labour wages.
Motion
When workers adopt unnecessary physical movement or when workers divert from actual processing work, is motion. For example, walking around the factory in search of the tool, or difficult physical movement, because of improper design of the ergonomics, which causes the workers to slow down in their work is motion.
Over-processing
Doing work which is not necessary and expected by the customers and their requirement, concerning product quality or features, like polishing or applying finishing on some areas of a product that is not seen or concerned by the customer is known as over processing and this is considered as waste.
Inventory
When a large amount of raw materials which are not necessary is stocked, and also work in progress and finished products is inventory waste. More inventory leads to higher inventory financing cost, higher holding costs, and defect rates.
Defects
Defects are errors in the production of goods, cost addition to the sold goods, errors in paperwork, provision of wrong information’s about products, late delivery, deviation from the specification, use of excess materials or generating of unnecessary scrap.
2. LITERATURE SURVEY
The concepts required for the project were gathered and studied from various journals published in the field of lean manufacturing techniques, for improving productivity and lead time reduction
2.1 Value Stream Mapping
Visualization of tool oriented to the Toyota version of lean manufacturing (Toyota Production System), is value stream mapping this assists a manufacturing company to understand or record current lead time, understand the inventory levels and cycle times to determine the ratio of value added to the
total lead time of the assembly time which is analysed. The first action taken is to create a current state map to make a representation of the production flow and learn the companies existing cycle times, communication flow, and also the capacity of the machine. By their step we get the required information for the production of future state maps by creating an image of an ideal product flow, this is not the end of a complete study. The aim is to identify and remove the waste. [1]
The value stream process will help to expose that a substantial amount of non-value-added activities are present in the manufacturing process. These activities consume longer lead time without any adding value. Nonetheless, some of these activities are necessary for the process, So the idea is to maintain their impact. [2]
For the purpose of improving the flow of work in process inventory and information, Value Stream Mapping a special type of flowchart that uses symbols which is called the "language of lean" is utilized. It provides optimal value to the customer, through a complete value creation process with minimum lead time. [3]
Recently it is learned various organizations and companies, which mainly focus on improving the efficiency of the operations by eliminating and reducing wastes have been following lean manufacturing initiative, and they have been discussing about the application of value stream mapping for reducing of cycle time by the machining process. [4]
VSM is the starting point of the lean manufacturing tools, it having the three stages there are a current stage, future stage, and implementation. Rahani AR says current state VSM is used to identify the problem and future stage VSM (Value Stream mapping) eliminate NVA (Non-Value Added activity) and necessary non value added activities for enhancing the productivity then make the SOP in production line by reducing lead time and improving method study. This tool is reducing the bottleneck for making continuous flow. [5]
2.2 Work Study
Work study is a time and method study for examining human working, all its context and which lead to a systematic investigation of all the factors which affect the efficiency of the situation that is reviewed to make improvements the look deals with an introduction to work-study by international labour office. [6]
The author describes the procedure to do work study including the method study and work measurement. It also gives the standards to follow during the operations in the manufacturing industry. It helps to improve the quality. The efficient use of time study and line balancing in the industry is correctly analysed by Johan Oscar Ong, in his paper he provided a case study of a doll manufacturer focusing on productivity increase through time study, redesign of work arrangement and line balancing. [7]
International Research Journal of Engineering and Technology (IRJET) e-ISSN: 2395-0056
Volume: 04 Issue: 12 | Dec-2017 www.irjet.net p-ISSN: 2395-0072
© 2017, IRJET | Impact Factor value: 6.171 | ISO 9001:2008 Certified Journal | Page 1803
2.3 Line Balancing
Line balancing is very vital in most of the production or assembly lines, through bottleneck point off often happens. As a result of this, there are chances for heavy wastage. There are numerous methods to balance the line and also eliminates wastes. The quality of the electronics component assembly line was improved in regards with line balancing index, overall labour effectiveness, productivity and also the elimination of wastes in spite of human resources decrease, could meet the customer demand. With simple lean tools, wastes could be eliminated. In a principle method, but it would bring essential benefits. [8]
Eryuruk et al. gave an explanation that problem of multi-model assembly line balancing in a clothing company for two models gave information about definitions and solution methods related to assembly line balancing. [10]
There are five heuristic methods of line balancing is available. In this ranked position weighted method is useful when the smaller amount data is available. It is explained that with the help of ranked position weighted method, we can find out the way to synchronize the workstations for the workflow and sequencing. This help to minimize the bottleneck operation in assembly line has been determined, based on ranked position weighted method. [11]
3. OBJECTIVES
The problem identified in the company is during the seasonal time the Pump has more demand than the regular time. Demand is not met in the seasonal time due to increased lead time due to nonvalue-added activities such as Work In Process (WIP) inventory, Defects. To overcome the above mention problem, project objectives are framed.The objective of our project is to demonstrate systematically how lean manufacturing tools used appropriately so that industry can reduce the lead time through the elimination of the seven kinds of wastage.
To analyse the manufacturing process.
To study the process and identify the bottlenecks.
To reduce the cycle time involved in the manufacturing of pumps.
To satisfy the customer requirements.
4. METHODOLOGY
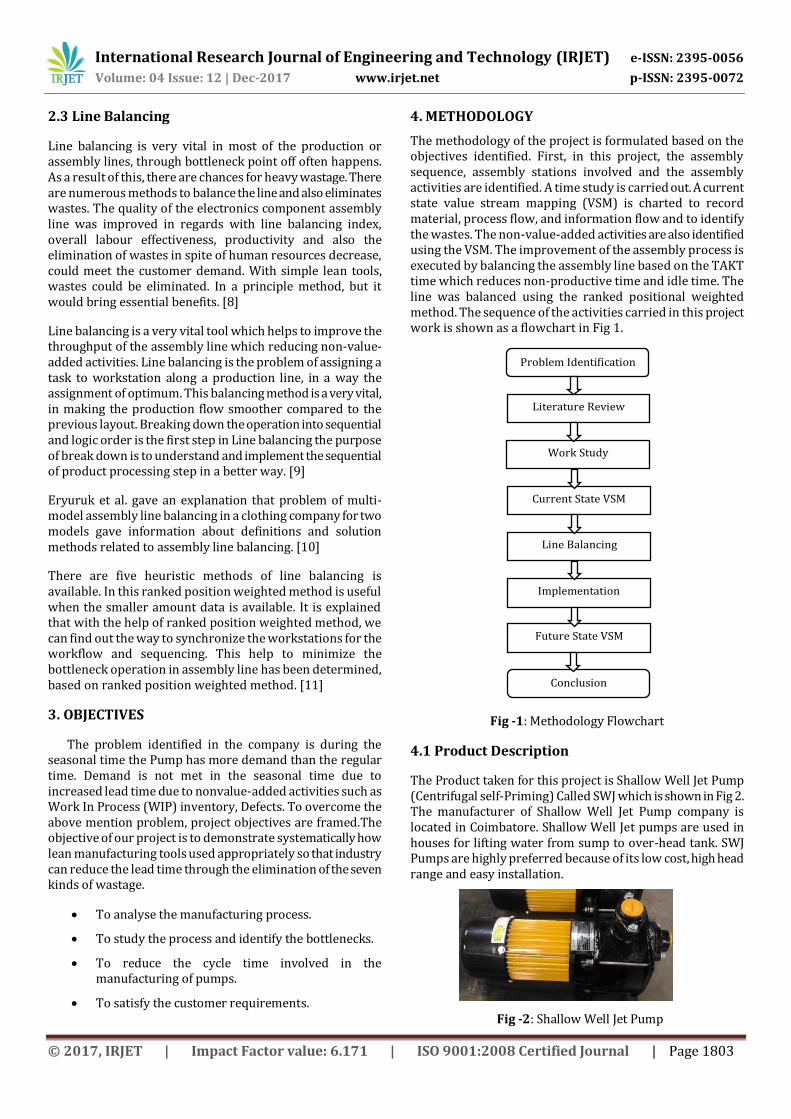
The methodology of the project is formulated based on the objectives identified. First, in this project, the assembly sequence, assembly stations involved and the assembly activities are identified. A time study is carried out. A current state value stream mapping (VSM) is charted to record material, process flow, and information flow and to identify the wastes. The non-value-added activities are also identified using the VSM. The improvement of the assembly process is executed by balancing the assembly line based on the TAKT time which reduces non-productive time and idle time. The line was balanced using the ranked positional weighted method. The sequence of the activities carried in this project work is shown as a flowchart in Fig 1.
Fig -1: Methodology Flowchart
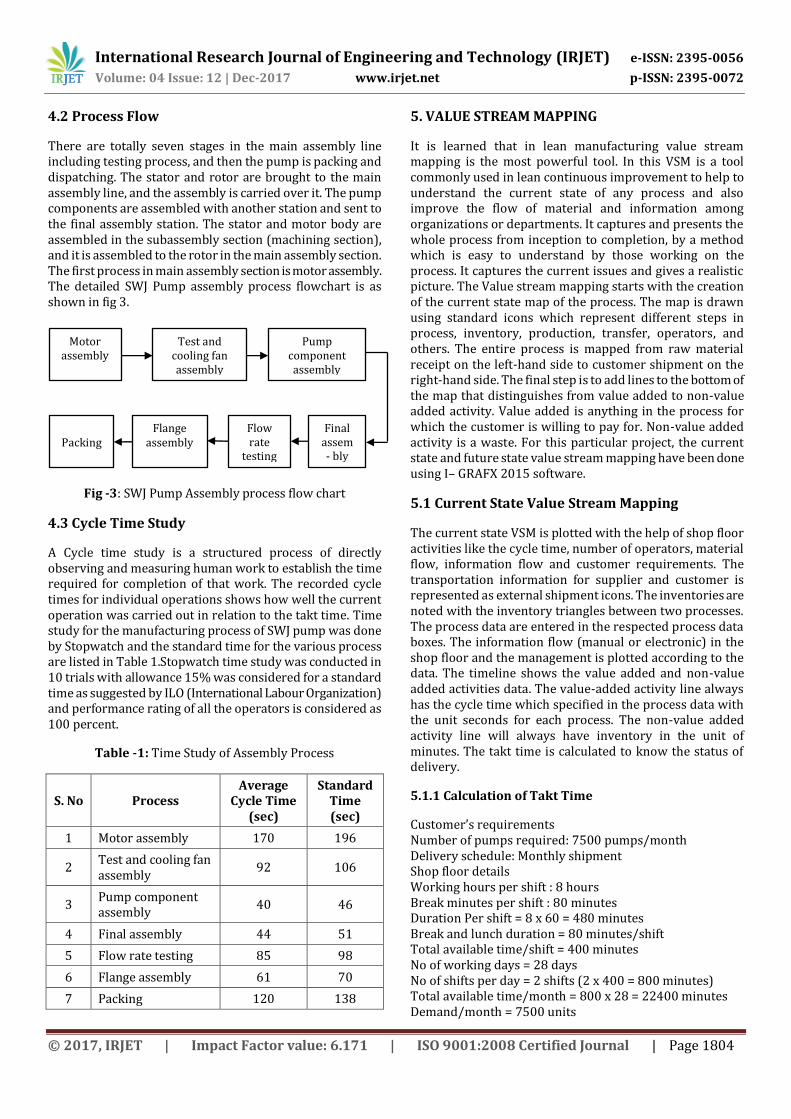
4.1 Product Description
The Product taken for this project is Shallow Well Jet Pump (Centrifugal self-Priming) Called SWJ which is shown in Fig 2. The manufacturer of Shallow Well Jet Pump company is located in Coimbatore. Shallow Well Jet pumps are used in houses for lifting water from sump to over-head tank. SWJ Pumps are highly preferred because of its low cost, high head range and easy installation.
Fig -2: Shallow Well Jet Pump
Literature Review
Work Study
Problem Identification
Line Balancing
Current State VSM
Implementation
Future State VSM
Conclusion
Line balancing is a very vital tool which helps to improve the throughput of the assembly line which reducing non-value-added activities. Line balancing is the problem of assigning a task to workstation along a production line, in a way the assignment of optimum. This balancing method is a very vital, in making the production flow smoother compared to the previous layout. Breaking down the operation into sequential and logic order is the first step in Line balancing the purpose of break down is to understand and implement the sequential of product processing step in a better way. [9]
International Research Journal of Engineering and Technology (IRJET) e-ISSN: 2395-0056
Volume: 04 Issue: 12 | Dec-2017 www.irjet.net p-ISSN: 2395-0072
© 2017, IRJET | Impact Factor value: 6.171 | ISO 9001:2008 Certified Journal | Page 1804
4.2 Process Flow
There are totally seven stages in the main assembly line including testing process, and then the pump is packing and dispatching. The stator and rotor are brought to the main assembly line, and the assembly is carried over it. The pump components are assembled with another station and sent to the final assembly station. The stator and motor body are assembled in the subassembly section (machining section), and it is assembled to the rotor in the main assembly section. The first process in main assembly section is motor assembly. The detailed SWJ Pump assembly process flowchart is as shown in fig 3.
Fig -3: SWJ Pump Assembly process flow chart
4.3 Cycle Time Study
A Cycle time study is a structured process of directly observing and measuring human work to establish the time required for completion of that work. The recorded cycle times for individual operations shows how well the current operation was carried out in relation to the takt time. Time study for the manufacturing process of SWJ pump was done by Stopwatch and the standard time for the various process are listed in Table 1.Stopwatch time study was conducted in 10 trials with allowance 15% was considered for a standard time as suggested by ILO (International Labour Organization) and performance rating of all the operators is considered as 100 percent.
Table -1: Time Study of Assembly Process
S. No Process Average
Cycle Time (sec)
Standard Time (sec)
1 Motor assembly 170 196
2 Test and cooling fan assembly
92 106
3 Pump component assembly
40 46
4 Final assembly 44 51
5 Flow rate testing 85 98
6 Flange assembly 61 70
7 Packing 120 138
5. VALUE STREAM MAPPING
It is learned that in lean manufacturing value stream mapping is the most powerful tool. In this VSM is a tool commonly used in lean continuous improvement to help to understand the current state of any process and also improve the flow of material and information among organizations or departments. It captures and presents the whole process from inception to completion, by a method which is easy to understand by those working on the process. It captures the current issues and gives a realistic picture. The Value stream mapping starts with the creation of the current state map of the process. The map is drawn using standard icons which represent different steps in process, inventory, production, transfer, operators, and others. The entire process is mapped from raw material receipt on the left-hand side to customer shipment on the right-hand side. The final step is to add lines to the bottom of the map that distinguishes from value added to non-value added activity. Value added is anything in the process for which the customer is willing to pay for. Non-value added activity is a waste. For this particular project, the current state and future state value stream mapping have been done using I– GRAFX 2015 software.
5.1 Current State Value Stream Mapping
The current state VSM is plotted with the help of shop floor activities like the cycle time, number of operators, material flow, information flow and customer requirements. The transportation information for supplier and customer is represented as external shipment icons. The inventories are noted with the inventory triangles between two processes. The process data are entered in the respected process data boxes. The information flow (manual or electronic) in the shop floor and the management is plotted according to the data. The timeline shows the value added and non-value added activities data. The value-added activity line always has the cycle time which specified in the process data with the unit seconds for each process. The non-value added activity line will always have inventory in the unit of minutes. The takt time is calculated to know the status of delivery.
5.1.1 Calculation of Takt Time
Customer’s requirements Number of pumps required: 7500 pumps/month Delivery schedule: Monthly shipment Shop floor details Working hours per shift : 8 hours Break minutes per shift : 80 minutes Duration Per shift = 8 x 60 = 480 minutes Break and lunch duration = 80 minutes/shift Total available time/shift = 400 minutes No of working days = 28 days No of shifts per day = 2 shifts (2 x 400 = 800 minutes) Total available time/month = 800 x 28 = 22400 minutes Demand/month = 7500 units
Test and cooling fan assembly
Pump component assembly
Motor assembly
Final assem - bly
Flow rate
testing
Flange assembly
Packing
International Research Journal of Engineering and Technology (IRJET) e-ISSN: 2395-0056
Volume: 04 Issue: 12 | Dec-2017 www.irjet.net p-ISSN: 2395-0072
© 2017, IRJET | Impact Factor value: 6.171 | ISO 9001:2008 Certified Journal | Page 1805
Takt time =
=
= 2.98
Takt time = 2.98 minutes or 179 seconds
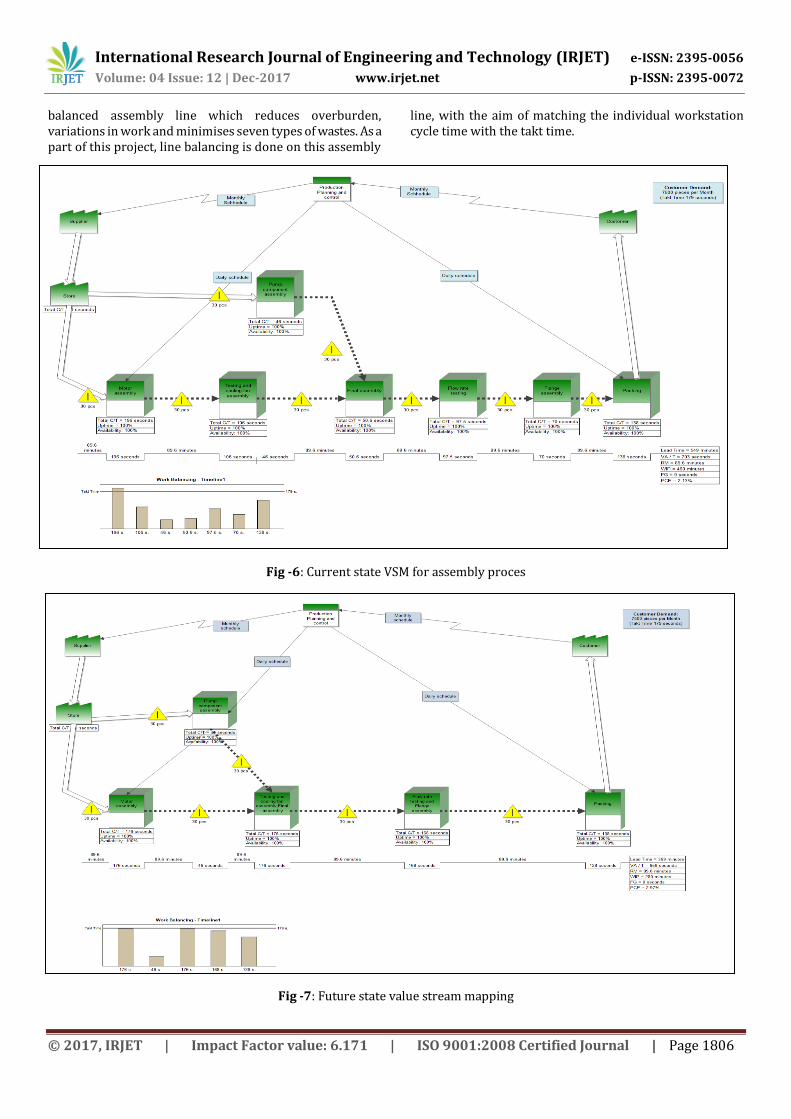
Using the data collected on the shop floor, current state value stream map is drawn as shown in Fig 6. The current state value stream map has been drawn for pump assembly process. The value ratio is 1.28 percent.The lead time of the assembly process is 549 minutes.The work in process inventory time is 460 minutes and value-added time for the product is only 703 seconds. In the current assembly process consists of 7 workstations, during the assembly process batch process is followed, so that work in process inventory created. From the current value stream mapping, the first workstation takes more time then the takt time. The batch size for the assembly is huge on the current state value stream map. Large batch size utilises more workspace and also results in large work-in-process inventories.
6. LINE BALANCING
After calculating the takt time for the demand, the precedence constraints are noted. The Task relationship and order of precedence is listed in Table 2.
Table -2: Elemental Task Table
Task Number
Process Precedence Time (sec)
1 Motor assembly - 196
2 Testing and cooling fan assembly
1 106
3 Pump component assembly
2 46
4 Final assembly 2,3 51
5 Flow rate testing 4 98
6 Flange assembly 5 70
7 Packing 6 138
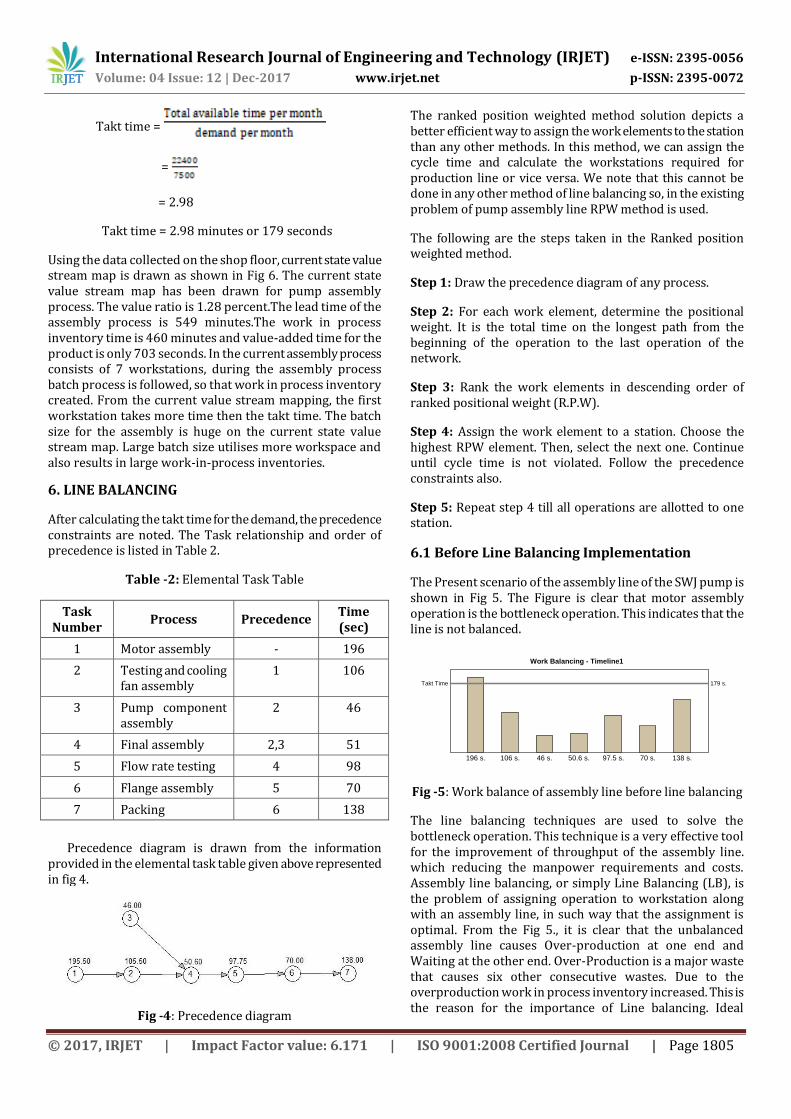
Precedence diagram is drawn from the information provided in the elemental task table given above represented in fig 4.
Fig -4: Precedence diagram
The ranked position weighted method solution depicts a better efficient way to assign the work elements to the station than any other methods. In this method, we can assign the cycle time and calculate the workstations required for production line or vice versa. We note that this cannot be done in any other method of line balancing so, in the existing problem of pump assembly line RPW method is used.
The following are the steps taken in the Ranked position weighted method.
Step 1: Draw the precedence diagram of any process.
Step 2: For each work element, determine the positional weight. It is the total time on the longest path from the beginning of the operation to the last operation of the network.
Step 3: Rank the work elements in descending order of ranked positional weight (R.P.W).
Step 4: Assign the work element to a station. Choose the highest RPW element. Then, select the next one. Continue until cycle time is not violated. Follow the precedence constraints also.
Step 5: Repeat step 4 till all operations are allotted to one station.
6.1 Before Line Balancing Implementation
The Present scenario of the assembly line of the SWJ pump is shown in Fig 5. The Figure is clear that motor assembly operation is the bottleneck operation. This indicates that the line is not balanced.
Work Balancing - Timeline1
196 s. 106 s. 46 s. 50.6 s. 97.5 s. 70 s. 138 s.
Takt Time 179 s.
L/T = 0 seconds
VA/T = 0 seconds
Fig -5: Work balance of assembly line before line balancing
The line balancing techniques are used to solve the bottleneck operation. This technique is a very effective tool for the improvement of throughput of the assembly line. which reducing the manpower requirements and costs. Assembly line balancing, or simply Line Balancing (LB), is the problem of assigning operation to workstation along with an assembly line, in such way that the assignment is optimal. From the Fig 5., it is clear that the unbalanced assembly line causes Over-production at one end and Waiting at the other end. Over-Production is a major waste that causes six other consecutive wastes. Due to the overproduction work in process inventory increased. This is the reason for the importance of Line balancing. Ideal
International Research Journal of Engineering and Technology (IRJET) e-ISSN: 2395-0056
Volume: 04 Issue: 12 | Dec-2017 www.irjet.net p-ISSN: 2395-0072
© 2017, IRJET | Impact Factor value: 6.171 | ISO 9001:2008 Certified Journal | Page 1806
balanced assembly line which reduces overburden, variations in work and minimises seven types of wastes. As a part of this project, line balancing is done on this assembly
line, with the aim of matching the individual workstation cycle time with the takt time.
Fig -6: Current state VSM for assembly proces
Fig -7: Future state value stream mapping
International Research Journal of Engineering and Technology (IRJET) e-ISSN: 2395-0056
Volume: 04 Issue: 12 | Dec-2017 www.irjet.net p-ISSN: 2395-0072
© 2017, IRJET | Impact Factor value: 6.171 | ISO 9001:2008 Certified Journal | Page 1807
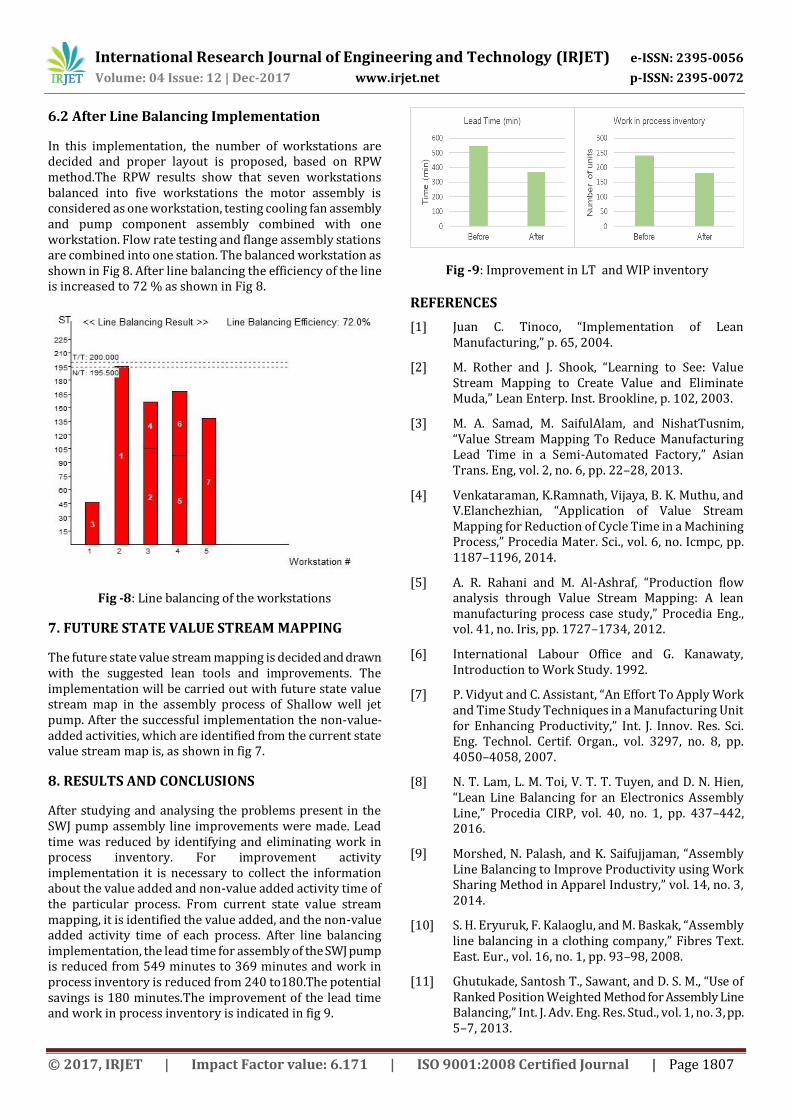
6.2 After Line Balancing Implementation
In this implementation, the number of workstations are decided and proper layout is proposed, based on RPW method.The RPW results show that seven workstations balanced into five workstations the motor assembly is considered as one workstation, testing cooling fan assembly and pump component assembly combined with one workstation. Flow rate testing and flange assembly stations are combined into one station. The balanced workstation as shown in Fig 8. After line balancing the efficiency of the line is increased to 72 % as shown in Fig 8.
Fig -8: Line balancing of the workstations
7. FUTURE STATE VALUE STREAM MAPPING
The future state value stream mapping is decided and drawn with the suggested lean tools and improvements. The implementation will be carried out with future state value stream map in the assembly process of Shallow well jet pump. After the successful implementation the non-value-added activities, which are identified from the current state value stream map is, as shown in fig 7.
8. RESULTS AND CONCLUSIONS
After studying and analysing the problems present in the SWJ pump assembly line improvements were made. Lead time was reduced by identifying and eliminating work in process inventory. For improvement activity implementation it is necessary to collect the information about the value added and non-value added activity time of the particular process. From current state value stream mapping, it is identified the value added, and the non-value added activity time of each process. After line balancing implementation, the lead time for assembly of the SWJ pump is reduced from 549 minutes to 369 minutes and work in process inventory is reduced from 240 to180.The potential savings is 180 minutes.The improvement of the lead time and work in process inventory is indicated in fig 9.
Fig -9: Improvement in LT and WIP inventory
REFERENCES
[1] Juan C. Tinoco, “Implementation of Lean Manufacturing,” p. 65, 2004.
[2] M. Rother and J. Shook, “Learning to See: Value Stream Mapping to Create Value and Eliminate Muda,” Lean Enterp. Inst. Brookline, p. 102, 2003.
[3] M. A. Samad, M. SaifulAlam, and NishatTusnim, “Value Stream Mapping To Reduce Manufacturing Lead Time in a Semi-Automated Factory,” Asian Trans. Eng, vol. 2, no. 6, pp. 22–28, 2013.
[4] Venkataraman, K.Ramnath, Vijaya, B. K. Muthu, and V.Elanchezhian, “Application of Value Stream Mapping for Reduction of Cycle Time in a Machining Process,” Procedia Mater. Sci., vol. 6, no. Icmpc, pp. 1187–1196, 2014.
[5] A. R. Rahani and M. Al-Ashraf, “Production flow analysis through Value Stream Mapping: A lean manufacturing process case study,” Procedia Eng., vol. 41, no. Iris, pp. 1727–1734, 2012.
[6] International Labour Office and G. Kanawaty, Introduction to Work Study. 1992.
[7] P. Vidyut and C. Assistant, “An Effort To Apply Work and Time Study Techniques in a Manufacturing Unit for Enhancing Productivity,” Int. J. Innov. Res. Sci. Eng. Technol. Certif. Organ., vol. 3297, no. 8, pp. 4050–4058, 2007.
[8] N. T. Lam, L. M. Toi, V. T. T. Tuyen, and D. N. Hien, “Lean Line Balancing for an Electronics Assembly Line,” Procedia CIRP, vol. 40, no. 1, pp. 437–442, 2016.
[9] Morshed, N. Palash, and K. Saifujjaman, “Assembly Line Balancing to Improve Productivity using Work Sharing Method in Apparel Industry,” vol. 14, no. 3, 2014.
[10] S. H. Eryuruk, F. Kalaoglu, and M. Baskak, “Assembly line balancing in a clothing company,” Fibres Text. East. Eur., vol. 16, no. 1, pp. 93–98, 2008.
[11] Ghutukade, Santosh T., Sawant, and D. S. M., “Use of Ranked Position Weighted Method for Assembly Line Balancing,” Int. J. Adv. Eng. Res. Stud., vol. 1, no. 3, pp. 5–7, 2013.