Embed Size (px)
Citation preview
Ambidexterity Trends in Dutch Manufacturing
Firms
Author: Tom Benerink University of Twente
P.O. Box 217, 7500AE Enschede The Netherlands
ABSTRACT,
Research on ambidexterity focused mainly on finding optimal approaches to deal
with tensions & difficulties between exploration & exploitation activities. Ignoring
that there may be interdependent variables that cause specific ambidextrous behavior
and resulting exploration/exploitation patterns. This research is a first step to identify
key variables that may cause or at least correlate with specific ambidextrous patterns.
Identifying such variables can help firms and researchers to better understand
decision making and biases that influence the innovative activities a firm pursues. A
sample of respectively 106 and 91 companies has been used for the variables industry
section and firm size. This sample has been created by combining machine learning
to classify innovation projects in the period of 2010-2014 with metadata from the
financial database Orbis, in order to research whether the interdependent variables
size and industry section correlate with specific trends in exploration/exploitation
balances. The structure and quality of the data and the lack of metadata made it
difficult to reach definite results, but some indication has been found that firm size
influences the ambidextrous behavior of a firm.
Graduation Committee members: Matthias de Visser & Michel Ehrenhard
Keywords Ambidexterity, exploration, exploitation, innovation, innovation portfolio, firm size, industry sector, trends
This is an open access article under the terms of the Creative Commons Attribution License, which permits use, distribution and reproduction in any medium, provided the original work is properly cited.
CC-BY-NC
2
1. INTRODUCTION Innovation, an abstract concept that has been defined dissimilar
by scholars. A general definition of innovation can be defined
as: ‘The successful exploitation of new ideas’ (Irani et al.,
2004). Elaborating on this definition Schilling provides a more
detailed description of innovation: ‘Innovation is the
implementation of creative ideas into some new device or
process. Requires combining creativity with resources and
expertise’ (Schilling 2013). As a result of the comprehensive
nature of innovation as illustrated by these definitions different
types of innovation have been defined, to support
understanding innovation and its related behavior.
Companies invest in innovation projects to gain a competitive
advantage. This investment would hypothetically lead to a
larger innovation capacity resulting in supreme organizational
performance. (Hult et al., 2003). This competitive advantage
can be sustained for example by innovating to produce more
efficiently, thus being able to offer products at a lower price
point than competitors. Or creating a product that has superior
characteristics over those of competitors. Furthermore, being
too conservative and clamping on to existing business models
or processes could lead to the demise of the firm. An excellent
example are firms active in the music industry at the time music
streaming made its appearance. There were five large
companies that dominated the industry: Universal/Polygram,
Sony Music Entertainment, EMI, Warner Music Group and the
Bertelsmann Group (BMG), at their peak controlling
approximately 80 percent of the market. When streaming
appeared, they reacted by allocating resources to innovation
activity that aimed at defending the physical cd business model.
Trying to exploit their current business, instead of exploring
new business models. This failed, resulting in a decimation of
organizational performance (Dolata, 2011).
When firms pursuit innovation they will face an uncertain and
rapid changing environment. Resulting in high risks, the
making of missteps could have serious consequences. (Brown
and Eisenhardt, 1997; Drucker, 1999). In addition to the
complexity that the environment adds research showed that
different types of innovation are interdependent. This means
that they are influencing each other and the overall company
performance. (Fritsch & Meschede, 2001; (Damanpour &
Evan, 1984; Kotabe & Murray, 1990). Most studies focus
however on a single innovation type when researching the
innovation-performance relationship. Mostly disregarding the
interdependency between innovations (Damanpour, 2009).
Exploring this interdependency further shows that undertaking
innovative activities confronts firms with demands that are
often cross with one another, demanding flexibility and
experimentation or commitment and focus (Van Looy &
Visscher, 2011). Firms are juggling between sustaining current
business (exploiting) and creating new opportunities by
innovating (exploring). This balancing act is defined in
literature as the ambidexterity concept. This concept focusses
on the interdependency of innovation types and how to
overcome the problems that arise, by examining the tensions
between exploration and exploitation activities. Ambidexterity
describes the firm’s ability to simultaneously exploit and
explore (Luger et al., 2018).
Further exploring the complexity of innovation, it can be
broken down into for example product, process, explorative or
exploitative innovation. By categorizing the innovation, in
order to help grasp this comprehensive concept, innovation
portfolios can be created. The managing of these include
dividing scarce resources over the different innovation projects
in order to realize competitive advantage. As explained before
this is difficult due to the uncertainty and risks involved, wrong
choices could decimate or bankrupt companies as occurred in
the music industry. There are thus multiple variables that need
tuning for success, an example is the number of resources to
put in exploitation vs. exploration activities. Making the ‘right’
decision does to not come down to a binary: innovate/not
innovate decision but is more complex.
To fill the research gap that exists on the interdependency of
innovative activities previous research has been done on the
effect of the innovation portfolio mix of explorative and
exploitative innovation on financial performance (Wiegard,
2018). This research aimed to identify if such a mix exist and
did not differentiate between firms.
Companies however are not identical, so it would seem unlikely
to have a one size fits all innovation portfolio. As for example
small firms have different resources than large firms that help
them to overcome barriers that prove a greater challenge for
larger firms. (Dean et al., 1998) Also there are significant
differences in innovation patterns of industry sectors. (Tether,
2010) It is thus plausible that in different sized firms or industry
sectors different patterns emerge when using the ambidexterity
concept for analysis. Innovation choices that are made can be
influenced by such interdependent variables, providing fertile
ground for biased decision making. However, to recognize this
and understand decision making, the variables that correlate
with certain ambidextrous behavior need to be identified. This
paper will explore the patterns of exploration and exploitation
in the innovation portfolio of companies by incorporating the
variables size and industry sector. This will be executed by first
analyzing the theory in section 2, then the dataset of 4689 Dutch
manufacturing SME’s innovation cases which have been
classified using machine learning techniques and the dependent
and independent variables will be introduced in section 3.
Concluding with the results of analysis and discussion in
section 4 and 5.
2. THEORY
2.1 Definitions Firstly, before going into analysis it is important to establish
consensus about the definition of innovation as used in this
paper. The term innovation as explained is broad and has been
broken down into different types for easier comprehension and
analysis. The overarching definition: ‘The successful
exploitation of new ideas’ (Irani et al., 2004), already provides
some ambiguities: When can something be defined as new?
Does the idea need to take a physical (product) form or can it
be a process? Although a bit ambiguous it describes the core of
innovation, only having an idea is not considered innovating, it
should be put into practice. The second description found in the
book of Schilling (Schilling, 2013) is more specific:’
Innovation is the implementation of creative ideas into some
new device or process. Requires combining creativity with
resources and expertise.’ As it states some prerequisites:
creativity and resources and describes two forms of innovation:
process and product innovation. This study concerns something
to be an innovation when it is new to the organization. As
stated, earlier researchers have come up with various typologies
to classify innovation in order to create some grip on the
concept. A widely known typology is the radical/incremental
innovation typology. Incremental innovations are for example
increasing the features or lowering the costs of products or
services and are relatively predictable and safe. Radical
innovation entails more than that: entering new markets and
facing high risk of losing major amounts of capital. It requires
doing something not on the foundations of already existing
business or technologies (Doyle, 2001).
3
Another typology adopted by the OECD can be characterized
as the classical four types: product innovation, process
innovation, organizational innovation and marketing
innovation (Mortensen & Bloch, 2005). Summarizing the
definitions of the OECD each type can be described for as:
- Product: A significantly improved good or service,
improved in its characteristics or intended uses.
- Process: innovating the process or delivery method.
- Marketing: significant changes in the marketing
method, such as product design, packaging,
placement, promotion or pricing.
- Organizational: execution of a new organizational
method. Changing firm’s business practices,
external relations or workplace organization.
Innovation opportunities can also be classified based on the
characteristics of the opportunity that drives them. Either
demand pull, or technology push (Dorf & Byers, 2004, p. 28).
The demand-pull means that one starts with a market need that
needs to be filled. This demand may be filled by several
different products. In the technology push case one start with a
new capability (often a new technology or a new application of
existing technology). Combining this capability with others
leads to a new cohesive product, a new capability can even be
applied to multiple products. Which can be applied to different
markets and customer needs. Central in this typology is
matching important needs with a good solution.
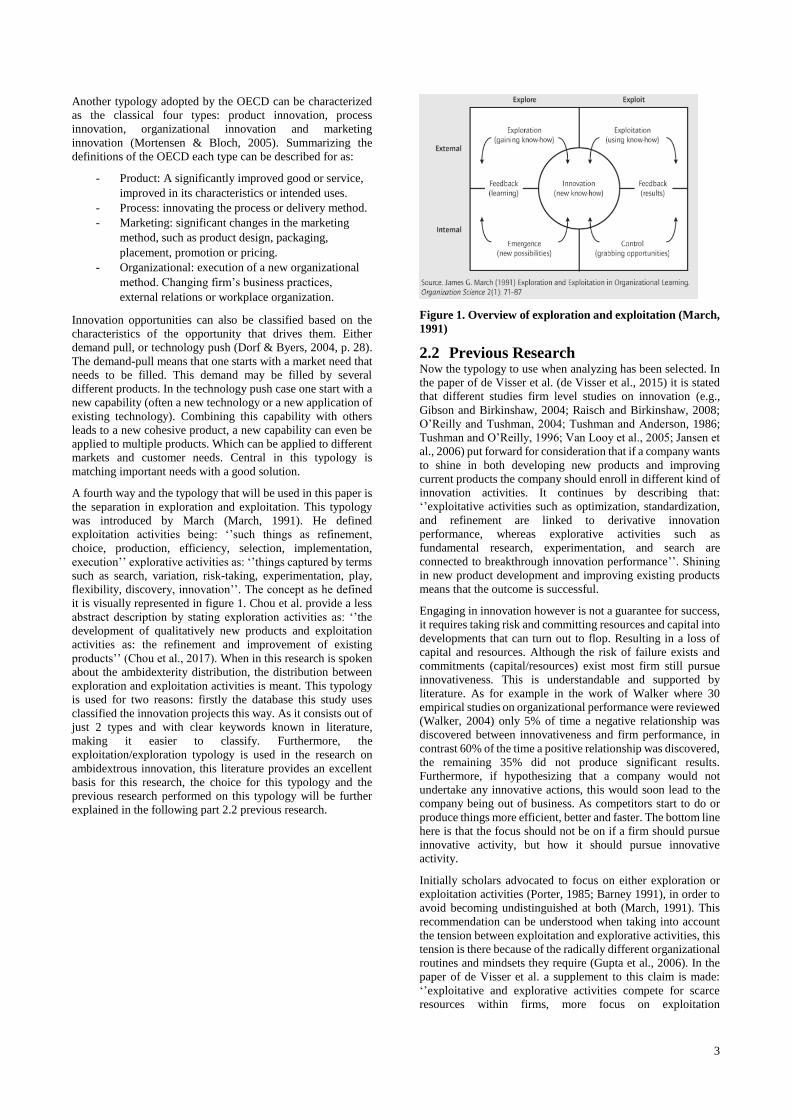
A fourth way and the typology that will be used in this paper is
the separation in exploration and exploitation. This typology
was introduced by March (March, 1991). He defined
exploitation activities being: ‘’such things as refinement,
choice, production, efficiency, selection, implementation,
execution’’ explorative activities as: ‘’things captured by terms
such as search, variation, risk-taking, experimentation, play,
flexibility, discovery, innovation’’. The concept as he defined
it is visually represented in figure 1. Chou et al. provide a less
abstract description by stating exploration activities as: ‘’the
development of qualitatively new products and exploitation
activities as: the refinement and improvement of existing
products’’ (Chou et al., 2017). When in this research is spoken
about the ambidexterity distribution, the distribution between
exploration and exploitation activities is meant. This typology
is used for two reasons: firstly the database this study uses
classified the innovation projects this way. As it consists out of
just 2 types and with clear keywords known in literature,
making it easier to classify. Furthermore, the
exploitation/exploration typology is used in the research on
ambidextrous innovation, this literature provides an excellent
basis for this research, the choice for this typology and the
previous research performed on this typology will be further
explained in the following part 2.2 previous research.
Figure 1. Overview of exploration and exploitation (March,
1991)
2.2 Previous Research Now the typology to use when analyzing has been selected. In
the paper of de Visser et al. (de Visser et al., 2015) it is stated
that different studies firm level studies on innovation (e.g.,
Gibson and Birkinshaw, 2004; Raisch and Birkinshaw, 2008;
O’Reilly and Tushman, 2004; Tushman and Anderson, 1986;
Tushman and O’Reilly, 1996; Van Looy et al., 2005; Jansen et
al., 2006) put forward for consideration that if a company wants
to shine in both developing new products and improving
current products the company should enroll in different kind of
innovation activities. It continues by describing that:
‘’exploitative activities such as optimization, standardization,
and refinement are linked to derivative innovation
performance, whereas explorative activities such as
fundamental research, experimentation, and search are
connected to breakthrough innovation performance’’. Shining
in new product development and improving existing products
means that the outcome is successful.
Engaging in innovation however is not a guarantee for success,
it requires taking risk and committing resources and capital into
developments that can turn out to flop. Resulting in a loss of
capital and resources. Although the risk of failure exists and
commitments (capital/resources) exist most firm still pursue
innovativeness. This is understandable and supported by
literature. As for example in the work of Walker where 30
empirical studies on organizational performance were reviewed
(Walker, 2004) only 5% of time a negative relationship was
discovered between innovativeness and firm performance, in
contrast 60% of the time a positive relationship was discovered,
the remaining 35% did not produce significant results.
Furthermore, if hypothesizing that a company would not
undertake any innovative actions, this would soon lead to the
company being out of business. As competitors start to do or
produce things more efficient, better and faster. The bottom line
here is that the focus should not be on if a firm should pursue
innovative activity, but how it should pursue innovative
activity.
Initially scholars advocated to focus on either exploration or
exploitation activities (Porter, 1985; Barney 1991), in order to
avoid becoming undistinguished at both (March, 1991). This
recommendation can be understood when taking into account
the tension between exploitation and explorative activities, this
tension is there because of the radically different organizational
routines and mindsets they require (Gupta et al., 2006). In the
paper of de Visser et al. a supplement to this claim is made:
‘’exploitative and explorative activities compete for scarce
resources within firms, more focus on exploitation
4
(exploration) is likely to imply less attention to exploration
(exploitation).’’ (de Visser et al., 2015). Thus, it is crucial to
manage these in order to achieve successful innovative
activities in both the area of exploration and exploitation. In
order for the whole firm to flourish. To achieve this, studies
have proposed either of two approaches: sequential
ambidexterity or simultaneous ambidexterity as a tool to
manage these tensions (Chou et al., 2017). Simultaneous
ambidexterity implies that an organization undertakes both
exploitation activities and exploration activities at the same
time. On the contrary sequential ambidexterity means that firms
should cycle through periods of exploration or exploitation,
avoiding the for mentioned tension between the two activities.
Chen argues in his work that firms need to adopt dynamic
ambidexterity instead, which entails that firms should adopt
structural ambidexterity on the corporate level, contextual
ambidexterity on the business unit level and sequential
ambidexterity on the project level (Chen, 2017). He thus
expands on the typology of ambidexterity by using the concepts
structural and contextual ambidexterity. Contextual
ambidexterity implies that employees can choose to exploit or
explore, supported by an organizational context that makes this
possible (Birkinshaw & Gibson, 2004; Gibson & Birkinshaw,
2004). An example as cited in the work of Chen is Alphabet,
who let employees free to choose what to do 20% of their
working time, resulting in side projects that turn out to become
successful ventures. Thus creating opportunities for emerging
innovation. Structural ambidexterity divides exploration and
exploitation into different and separated business units, which
are coordinated by top managers (O’Reilly & Tushman, 2004,
2016; Tushman & O’Reilly, 1996). Having as a main advantage
that different business units can adopt varying strategies,
processes and structures suitable to their innovative activity. In
the work of Luger et al. the approach is again different, as they
conceptualize ambidexterity as the dynamic process of
balancing the emerging outcomes of capability building
processes (to balance exploration/exploitation) with capability
shifting processes (to adapt the exploration/exploitation
balance) (Luger et al., 2018).
In summary there are numerous views on how to manage
ambidexterity. Whether it may be by adopting varying
approaches on different business level units, adopting
sequential or simultaneous ambidexterity or introducing
adaptation into the ambidexterity concept.
2.3 Hypothesis Development As previously explored in the theory there are different
conceptualizations and varying views about how firms should
manage and structure innovation based on the ambidexterity
concept. This study is not per se focused on determining on
finding the best approach, but on empirically examining which
trends appear and if they differ from sector to sector or between
different sized firms. As there is debate about what the optimal
approach may be, however there is little empirical research on
which ambidexterity patterns companies actually display in
practice.
Firstly, the manufacturing firms operate in different industry
sectors. Different sectors require different innovation solutions.
‘Several scholars have suggested that the characteristics of an
industrial sector have an influence on innovation development’
(Forsman, 2011). Furthermore, when firms operate in different
sectors this means that the competitive environment they
operate in differs. The study of Chang et al. also showed the
that the relationship between environmental forces and
company performance is partially mediated by a balancing of
innovation ambidexterity (Chang et al., 2011). In addition,
Jansen et al. claim that companies that are in sectors that are
more competitive require exploitative innovation to survive,
while companies active in dynamic sectors require explorative
activity to prepare for uncertain future states of the sector
(Jansen et al., 2006). This difference in dynamic and goods &
services lead to stable business sectors to become more
incremental innovation focused (Brem & Voigt, 2009).
Furthermore, competition intensity (Ganter & Hecker, 2013)
and industry wide R&D intensity (Uotila et al., 2009) have been
identified as anteceding and moderating factors between
innovation and firm performance. Customer orientation has
been identified as being one of the causes of exploration-
exploitation tensions (Andriopoulos & Lewis, 2009). Sectors in
which most economic activity is in a business to business model
have customers with different demands than sectors in which
most activity for example is business to consumer. All in all,
sectors differ significantly from each other and it would be
expected that their innovation patterns differ to match their
respective challenges (i.e. environmental, customer or
technological challenges). Meaning thus that the search for an
exploration/exploitation trend in the dataset consisting out of
mainly manufacturing firms can be classified by using as
independent variable the sectors in which these manufacturing
firms operate. This possible relationship is interesting to
research as the ambidexterity literature does not contain
numerous contributions yet that provide insights into the
dynamic between industry sectors and the trend in
ambidexterity of the firms that operate in them.
H1: In various industry sectors emerge different distributions
between exploration and exploitation.
Another important variable factor is the firm size. Firms can be
categorized as either small (<50 employees), medium (50-249
employees) or large (>249 employees) sized (OECD, 2019).
Firm size is significantly associated with both the new and
incremental R&D. Moreover, firm size is found to be
significantly associated with other types of R&D compositions
such as the share of R&D devoted to incremental innovation
and multidimensional combinations of product, process, new
and incremental R&D (Choi, 2018). Boiling this down to more
concrete arguments it can be argued first that small enterprises
cannot actively realize the same benefits of organizational
learning, as they do not have the same slack in resources as
large companies (Cegarra-Navarro & Dewhurst, 2007).
Secondly the organizational learning processes differs as there
is an absence of institutionalized or formal routines along with
mechanisms for distribution and gathering of new knowledge
(Jones & Macpherson, 2006). Thirdly large firms have more
complex bureaucracies, in contrast to the SME in which senior
managers have direct and extensive involvement in strategic
and tactical decision making (Lubatkin et al., 2006). The work
of Benner and Tushman moreover, argues that firms should
departmentalize explorative activities into R&D departments,
to avoid the difficulties of having to deal with the contradictory
demands of exploitation and exploration throughout the whole
firm (Benner & Tushman, 2003). However smaller companies
mostly are not able to found departmentalized R&D
departments. Lastly firm size has been identified as anteceding
and moderating variable between innovation and firm
performance (Needy & Hii, 1998; Hadjimanolis, 2000; Lavie
et al., 2010). Together these arguments make it likely that firm
size impacts the inclination of a firm, making it plausible that
different sized firms have different distributions in portfolios
regarding to the exploitation and exploration classifications
used in this paper.
5
H2: Different distributions between exploration and
exploitation emerge when classifying firms based on size.
Researching the above-mentioned hypothesis is interesting as
there is not much research on what ambidexterity patterns
emerge in practice and what the causes are for different
patterns. Researching these hypotheses provides an interesting
side effect. The data used in this research is gathered by
machine learning techniques as will be explained in section 3.1.
By researching these hypothesizes, data is structured and
prepared for analysis such that one can identify individual
innovation patterns of firms, which can be coupled back to
firms to check how accurate the machine learning was and if
the data corresponds with their real-life experience.
3. METHODOLOGY
3.1 Data and sample For this research a dataset consisting out of 4689 projects that
have been started in the period of 2008 till the end of 2014. This
dataset has been aggregated from client data of a European
consultancy firm and then classified by Roelofs last year using
machine learning techniques. Roelofs found out that using the
naïve Bayes (nB) classifier provided the highest accuracy when
classifying the projects based on exploration/exploitation traits.
The accuracy of this automatic classifying was 82%. The nB
worked well mainly due to the small sample size over which
the classifying was performed, as there were just 300 labelled
cases. Other classifiers therefore did not perform well in the
project of Roelofs, nB however has a high tolerance to noise
and needs little data in order to be accurate. Rather short or
ambiguous project descriptions made it more difficult to
accurately classify the projects, however for
exploration/exploitation it outperformed manual classification
(Roelofs, 2018).
To understand better how the classifying has been performed
and to be transparent about the quality of the data a detailed
explanation will be given based on the work of Roelofs. He
started with a raw database, consisting out of 5901 project
descriptions from 440 manufacturing firms between 2008-
2016. Each project description was written for a grant
application and approximately 500 words long. Thus, not all
projects of a firm in the period may be present, as they may not
have applied for grants for every project they started. From this
raw data, cases were merged that were part of long-lasting
projects that were resubmitted every year. Process innovation
cases were removed to ease classifying as he used different
typologies not all suited for process innovation (this project will
only focus on the classifying based on the
exploration/exploitation typology). This resulted in 1649
remaining descriptions. Of these descriptions 300 were semi-
random selected, not completely random to ensure that there
were no firms overrepresented. For the exploration/exploitation
the distinction was made based on whether the projects aimed
for new knowledge (exploration) or build on existing
knowledge (exploitation). With the sample selected 2 raters
labelled the cases, each familiar with the typologies used. After
labelling approximately one third of the cases they compared
labels and discovered inter-rater agreement was low. They then
agreed on clearer typology definitions. Resulting eventually in
an agreement of 51% in the case of exploration/exploitation.
Now the part of automatic classifying using machine learning
makes its appearance. The approach used was using machine
learning based on Natural Language Processing (NLP). There
are two prominent approaches to NLP: traditional text
classification and deep learning. For the classification of this
dataset traditional text classification has been used. Firstly, the
data needed pre-processing. Meaning that capitals, punctuation,
non-alphabetic tokens and stop words were removed, in
addition all words were reduced to their word stem. The
remaining word list did still contain words that are not useful
for modelling, to improve classification performance and
reduce training time feature selection can be used (Guyon &
Elisseeff, 2003). Based on the work of de Visser et al. (2017)
that feature selection on basis of information gain (Perkins,
2014) provides the best input data this was the selected method.
The pre-processed data was stored in a bag-of-words depiction
(set of separate words, not using word order or grammar).
Now the algorithm can be trained, in the work of Roelofs there
are different algorithms tested, as previously stated the naïve
Bayes proved to give the best results and there will be zoomed
in on this algorithm here. The Bernoulli naïve Bayes variant
was used, as this is most commonly used (McCallum & Nigam,
1998). A set of simple logistic classifiers form the naïve Bayes
classifiers. The logistic classifiers try to model the distribution
of data between the cases and their matching class, based on
this Bayes theorem is used to calculate the probability that a set
of features is part of a certain class, making it a generative
model. The main assumption, over simplifying, made is that all
features are statistically independent.
After training the naïve Bayes algorithm using the manually
classified cases it was ran on the complete dataset consisting
out of 4689 projects. Resulting in a nB classifier that classified
each individual project as either explorative or exploitative.
Enabling the analysis of trends within the projects. For more in-
depth knowledge and background it is advised to read the work
of Roelofs (2018).
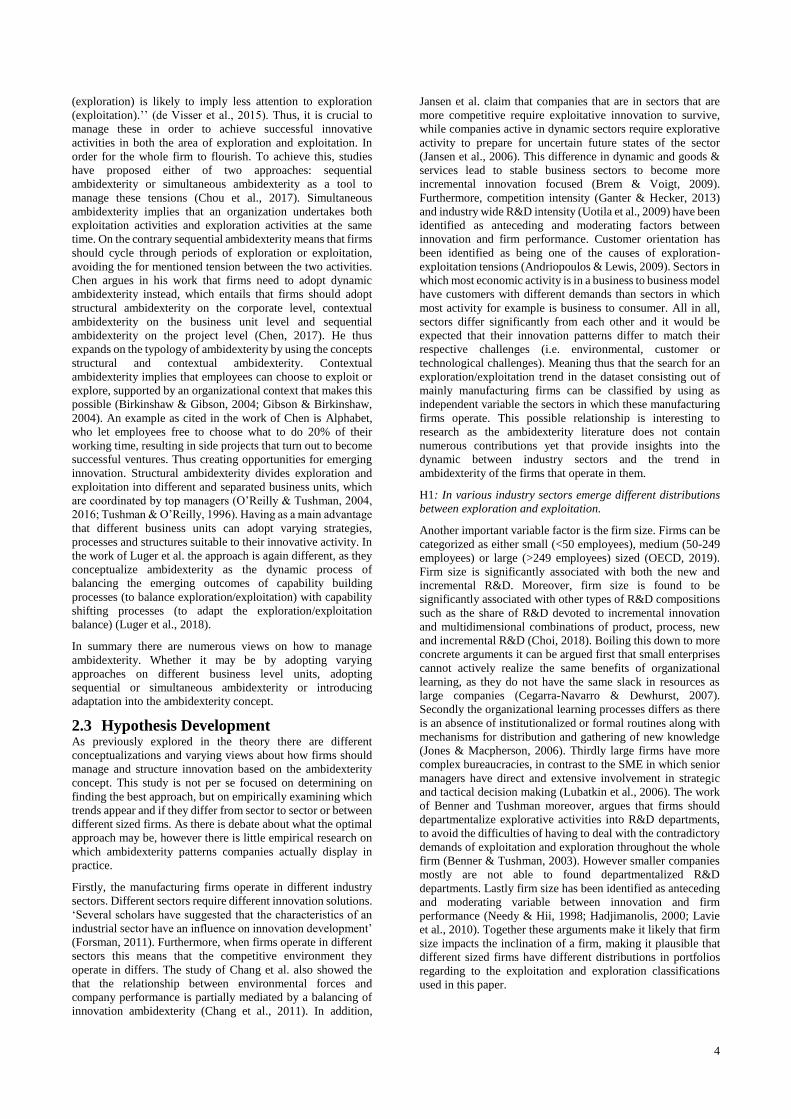
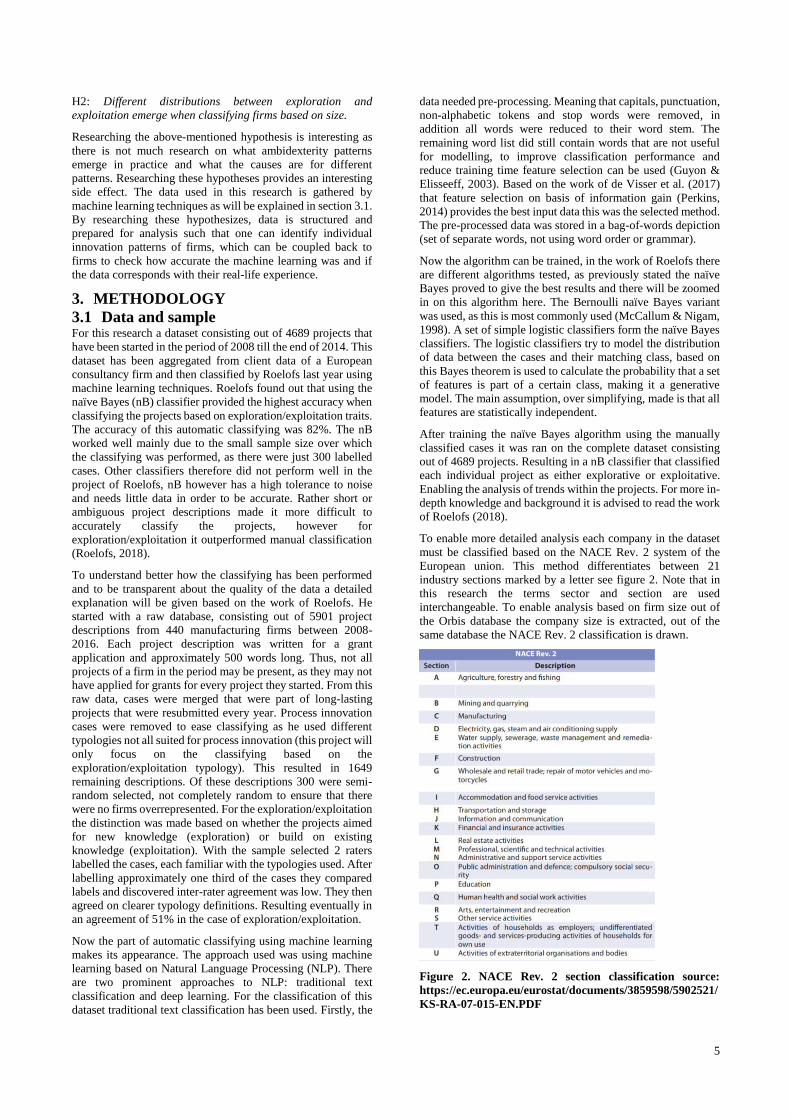
To enable more detailed analysis each company in the dataset
must be classified based on the NACE Rev. 2 system of the
European union. This method differentiates between 21
industry sections marked by a letter see figure 2. Note that in
this research the terms sector and section are used
interchangeable. To enable analysis based on firm size out of
the Orbis database the company size is extracted, out of the
same database the NACE Rev. 2 classification is drawn.
Figure 2. NACE Rev. 2 section classification source:
https://ec.europa.eu/eurostat/documents/3859598/5902521/
KS-RA-07-015-EN.PDF
6
A problem occurred when searching for the data in Orbis, as for
most of the companies in the database there was no data
available on size or industry sector. The cause was twofold,
firstly as there are a lot of firms in the database that do not
produce public financial reports, secondly the firms were
nicknamed in the database. This nickname was only coupled to
a short name for the company that was often a generic
abbreviation such as for example ABC B.V. or a very generic
name as for example John Doe B.V.. This made it difficult to
match those names to the correct data from a database such as
Orbis. After manually checking results, it resulted eventually in
91 companies that could be classified based on their most recent
company size and 106 companies that could be classified based
on industry section into a total of 6 sections: C –
Manufacturing, F-Construction, G- Wholesale, retail and trade,
K-Financial and insurance activities, M-Professional scientific
and technical activities & N-Administrative and support service
activities.
Out of the 21 sections there were more than 6 that contained
companies when preparing the data for analysis, however there
were only 1 or 2 companies in some of those remaining sectors,
therefore they were excluded from analysis, resulting in the 106
companies that could be classified in either of the six sections.
As there was not enough data on the years 2008 and 2009 these
were excluded from analysis, leaving the interval 2010-2014.
3.2 Variables As previously mentioned, the two independent variables are
size and industry section. In table 1 the frequency (amount of
companies) per industry section and the number of projects that
are undertaken in the period between 2010-2014 is displayed.
SECTION FREQUENCY #PROJECTS
C 36 512
F 8 65
G 13 265
K 35 373
M 8 213
N 6 97
Table 1. Frequency & total number of projects per industry
section
In total there were 106 companies and 1525 projects available
for analysis.
In table 2 the number of firms per size classification is
displayed. With exactly the same indicators as in the previous
table.
SIZE FREQUENCY # OF
PROJECT
SMALL
(<50)
14 206
MEDIUM
(49<250)
41 503
LARGE
(249<)
36 605
Table 2. Frequency & total number of projects per firm size
For the variable size there were 91 companies and a total of
1314 projects available for analysis.
The dependent variable will be the percentage of exploration
project hours over the total project hours. So, if there is a total
of 2 project hours, of which 1.5 is in exploration the dependent
variable will have a score of 1.5/2= 0,75 = 75%.
3.3 Research Design Analysis will be executed by plotting graphs that show the
percentage of exploration activity expressed in man hours
invested in projects relative to total innovation activity per year
in between 2010 and 2014. So, if for example in 2010 the
percentage is 60%, it means that 60% of total hours invested in
innovation was in exploration related projects and the
remaining 40% in exploitation projects. This will be done for
the sample differentiated for the independent variable industry
sector and for the sample differentiated based on the
independent variable company size. For the total amount of
projects in the database the same plot will be created as a mean
division between exploration and exploitation per year. The
plotting of these graphs enables visual analyses of the trend that
occur for each independent variable. As the sample is too small
to use statistics reliably this visual method still enables the user
to spot possible trends. In addition to this analysis tables will
be created that indicate the quality of the sample by showing
the number of projects, hours & companies. Furthermore, the
table shows the standard deviation for both the number of
projects and hours per company & the mean projects and hours
per company.
4. RESULTS
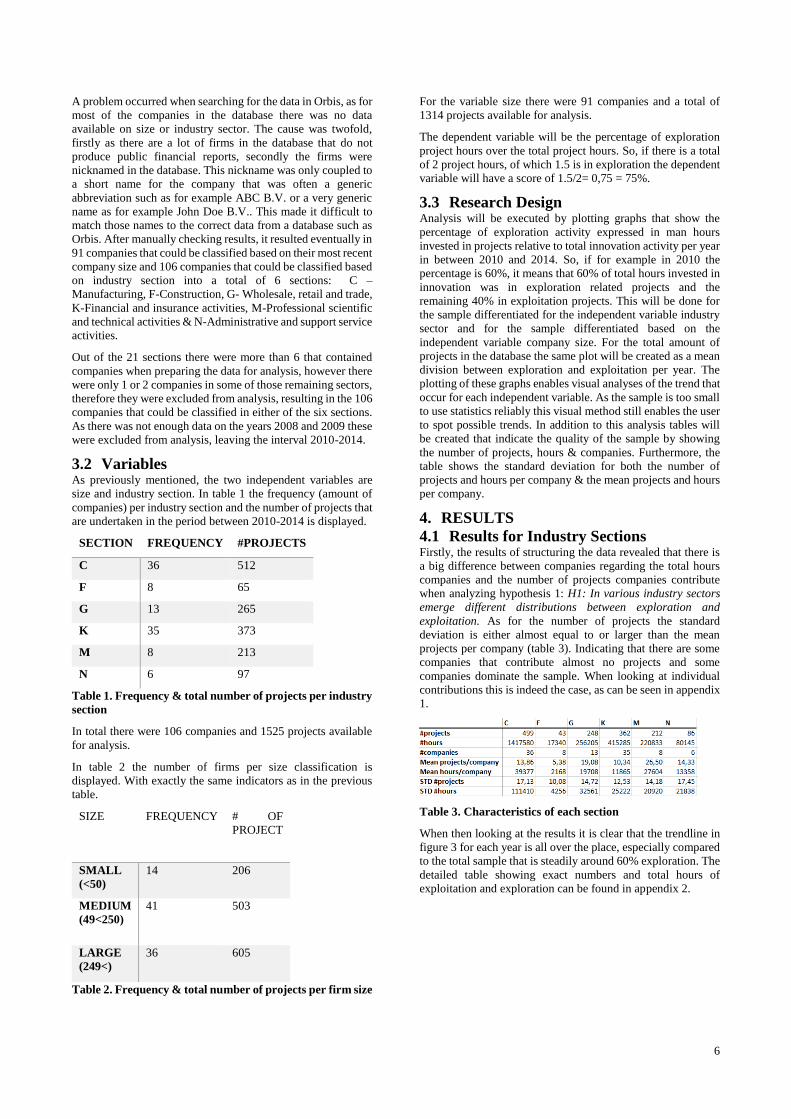
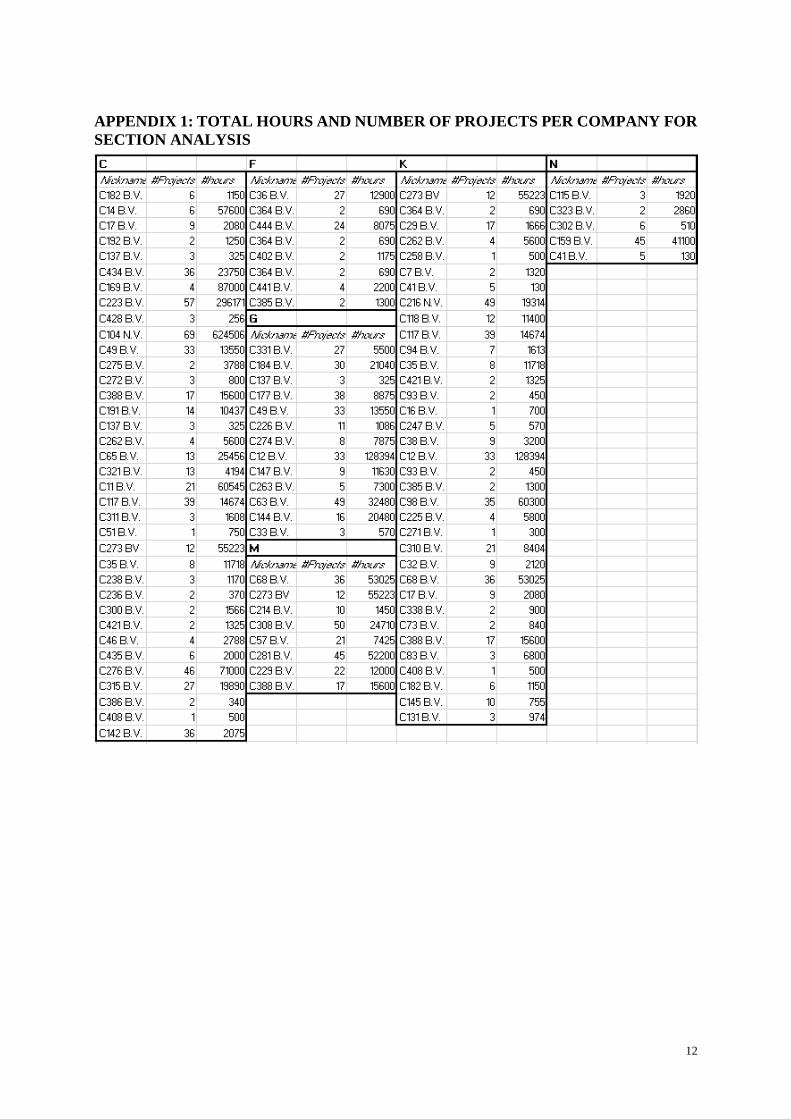
4.1 Results for Industry Sections Firstly, the results of structuring the data revealed that there is
a big difference between companies regarding the total hours
companies and the number of projects companies contribute
when analyzing hypothesis 1: H1: In various industry sectors
emerge different distributions between exploration and
exploitation. As for the number of projects the standard
deviation is either almost equal to or larger than the mean
projects per company (table 3). Indicating that there are some
companies that contribute almost no projects and some
companies dominate the sample. When looking at individual
contributions this is indeed the case, as can be seen in appendix
1.
Table 3. Characteristics of each section
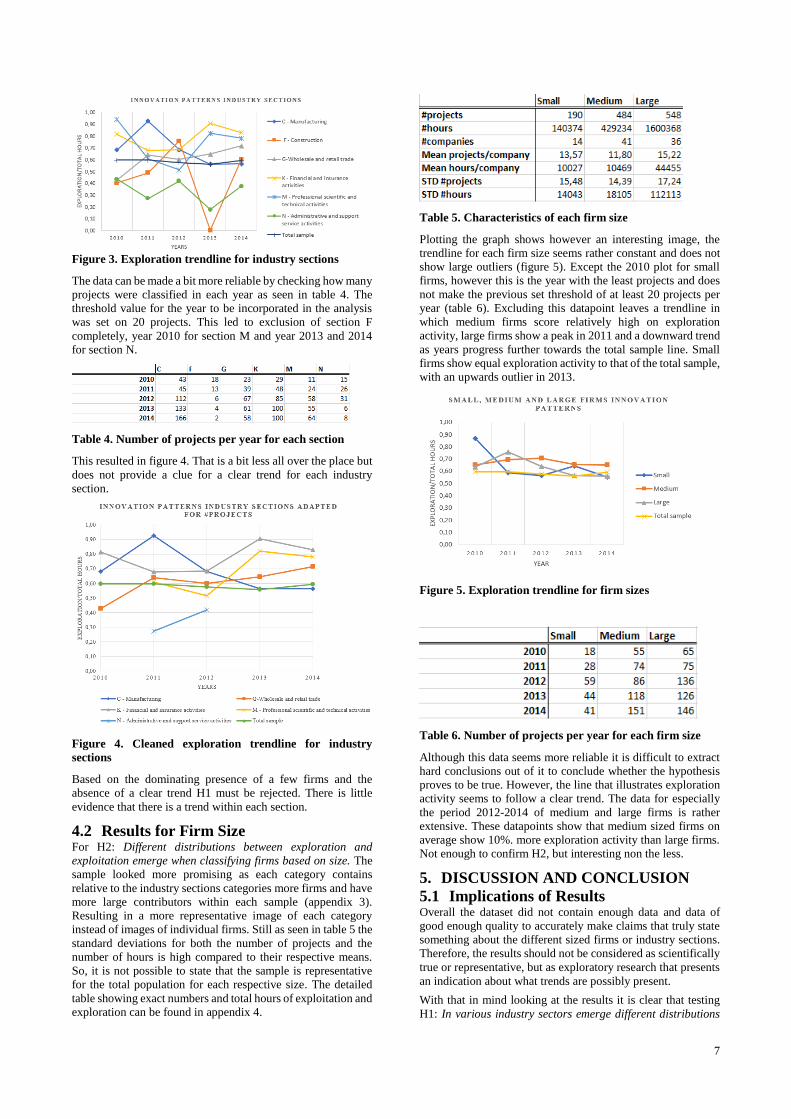
When then looking at the results it is clear that the trendline in
figure 3 for each year is all over the place, especially compared
to the total sample that is steadily around 60% exploration. The
detailed table showing exact numbers and total hours of
exploitation and exploration can be found in appendix 2.
7
Figure 3. Exploration trendline for industry sections
The data can be made a bit more reliable by checking how many
projects were classified in each year as seen in table 4. The
threshold value for the year to be incorporated in the analysis
was set on 20 projects. This led to exclusion of section F
completely, year 2010 for section M and year 2013 and 2014
for section N.
Table 4. Number of projects per year for each section
This resulted in figure 4. That is a bit less all over the place but
does not provide a clue for a clear trend for each industry
section.
Figure 4. Cleaned exploration trendline for industry
sections
Based on the dominating presence of a few firms and the
absence of a clear trend H1 must be rejected. There is little
evidence that there is a trend within each section.
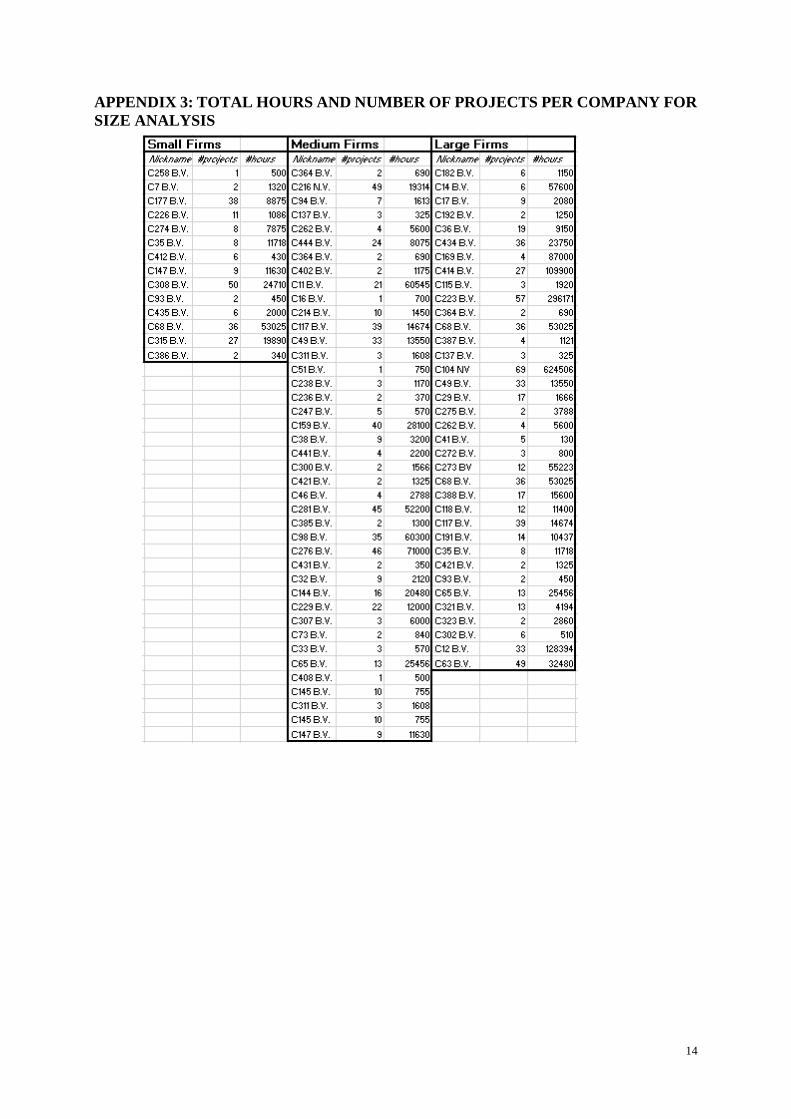
4.2 Results for Firm Size For H2: Different distributions between exploration and
exploitation emerge when classifying firms based on size. The
sample looked more promising as each category contains
relative to the industry sections categories more firms and have
more large contributors within each sample (appendix 3).
Resulting in a more representative image of each category
instead of images of individual firms. Still as seen in table 5 the
standard deviations for both the number of projects and the
number of hours is high compared to their respective means.
So, it is not possible to state that the sample is representative
for the total population for each respective size. The detailed
table showing exact numbers and total hours of exploitation and
exploration can be found in appendix 4.
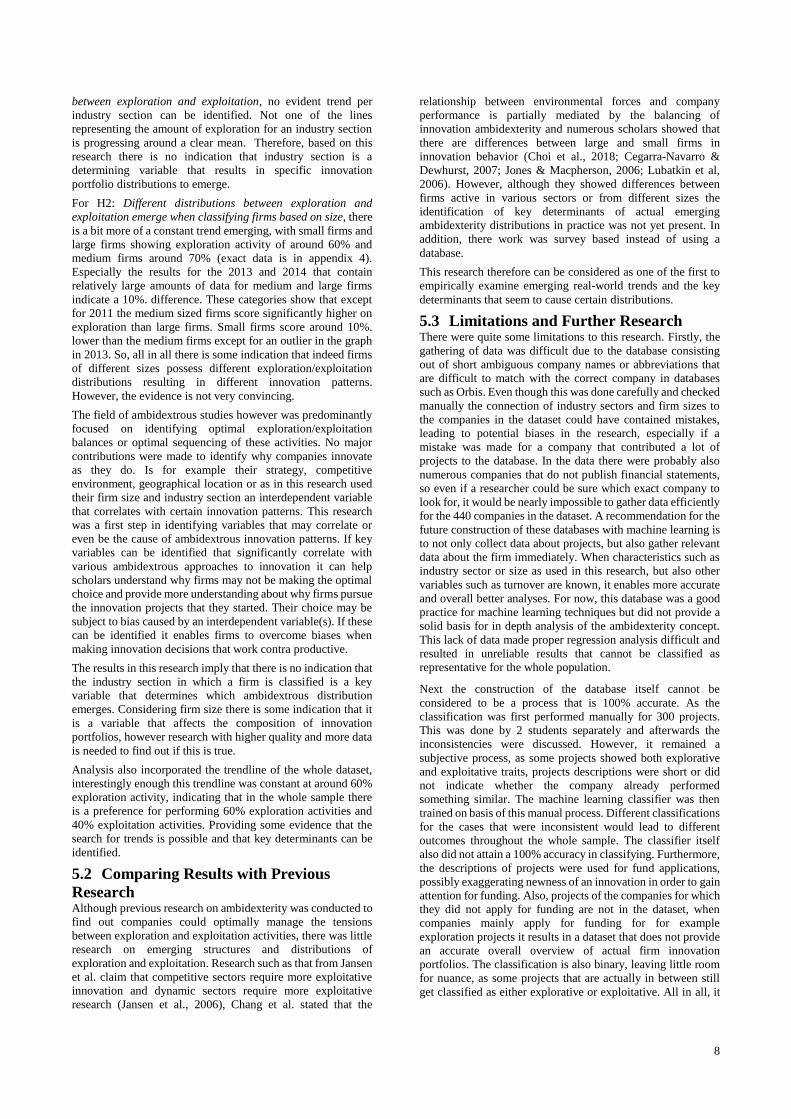
Table 5. Characteristics of each firm size
Plotting the graph shows however an interesting image, the
trendline for each firm size seems rather constant and does not
show large outliers (figure 5). Except the 2010 plot for small
firms, however this is the year with the least projects and does
not make the previous set threshold of at least 20 projects per
year (table 6). Excluding this datapoint leaves a trendline in
which medium firms score relatively high on exploration
activity, large firms show a peak in 2011 and a downward trend
as years progress further towards the total sample line. Small
firms show equal exploration activity to that of the total sample,
with an upwards outlier in 2013.
Figure 5. Exploration trendline for firm sizes
Table 6. Number of projects per year for each firm size
Although this data seems more reliable it is difficult to extract
hard conclusions out of it to conclude whether the hypothesis
proves to be true. However, the line that illustrates exploration
activity seems to follow a clear trend. The data for especially
the period 2012-2014 of medium and large firms is rather
extensive. These datapoints show that medium sized firms on
average show 10%. more exploration activity than large firms.
Not enough to confirm H2, but interesting non the less.
5. DISCUSSION AND CONCLUSION
5.1 Implications of Results Overall the dataset did not contain enough data and data of
good enough quality to accurately make claims that truly state
something about the different sized firms or industry sections.
Therefore, the results should not be considered as scientifically
true or representative, but as exploratory research that presents
an indication about what trends are possibly present.
With that in mind looking at the results it is clear that testing
H1: In various industry sectors emerge different distributions
8
between exploration and exploitation, no evident trend per
industry section can be identified. Not one of the lines
representing the amount of exploration for an industry section
is progressing around a clear mean. Therefore, based on this
research there is no indication that industry section is a
determining variable that results in specific innovation
portfolio distributions to emerge.
For H2: Different distributions between exploration and
exploitation emerge when classifying firms based on size, there
is a bit more of a constant trend emerging, with small firms and
large firms showing exploration activity of around 60% and
medium firms around 70% (exact data is in appendix 4).
Especially the results for the 2013 and 2014 that contain
relatively large amounts of data for medium and large firms
indicate a 10%. difference. These categories show that except
for 2011 the medium sized firms score significantly higher on
exploration than large firms. Small firms score around 10%.
lower than the medium firms except for an outlier in the graph
in 2013. So, all in all there is some indication that indeed firms
of different sizes possess different exploration/exploitation
distributions resulting in different innovation patterns.
However, the evidence is not very convincing.
The field of ambidextrous studies however was predominantly
focused on identifying optimal exploration/exploitation
balances or optimal sequencing of these activities. No major
contributions were made to identify why companies innovate
as they do. Is for example their strategy, competitive
environment, geographical location or as in this research used
their firm size and industry section an interdependent variable
that correlates with certain innovation patterns. This research
was a first step in identifying variables that may correlate or
even be the cause of ambidextrous innovation patterns. If key
variables can be identified that significantly correlate with
various ambidextrous approaches to innovation it can help
scholars understand why firms may not be making the optimal
choice and provide more understanding about why firms pursue
the innovation projects that they started. Their choice may be
subject to bias caused by an interdependent variable(s). If these
can be identified it enables firms to overcome biases when
making innovation decisions that work contra productive.
The results in this research imply that there is no indication that
the industry section in which a firm is classified is a key
variable that determines which ambidextrous distribution
emerges. Considering firm size there is some indication that it
is a variable that affects the composition of innovation
portfolios, however research with higher quality and more data
is needed to find out if this is true.
Analysis also incorporated the trendline of the whole dataset,
interestingly enough this trendline was constant at around 60%
exploration activity, indicating that in the whole sample there
is a preference for performing 60% exploration activities and
40% exploitation activities. Providing some evidence that the
search for trends is possible and that key determinants can be
identified.
5.2 Comparing Results with Previous
Research Although previous research on ambidexterity was conducted to
find out companies could optimally manage the tensions
between exploration and exploitation activities, there was little
research on emerging structures and distributions of
exploration and exploitation. Research such as that from Jansen
et al. claim that competitive sectors require more exploitative
innovation and dynamic sectors require more exploitative
research (Jansen et al., 2006), Chang et al. stated that the
relationship between environmental forces and company
performance is partially mediated by the balancing of
innovation ambidexterity and numerous scholars showed that
there are differences between large and small firms in
innovation behavior (Choi et al., 2018; Cegarra-Navarro &
Dewhurst, 2007; Jones & Macpherson, 2006; Lubatkin et al,
2006). However, although they showed differences between
firms active in various sectors or from different sizes the
identification of key determinants of actual emerging
ambidexterity distributions in practice was not yet present. In
addition, there work was survey based instead of using a
database.
This research therefore can be considered as one of the first to
empirically examine emerging real-world trends and the key
determinants that seem to cause certain distributions.
5.3 Limitations and Further Research There were quite some limitations to this research. Firstly, the
gathering of data was difficult due to the database consisting
out of short ambiguous company names or abbreviations that
are difficult to match with the correct company in databases
such as Orbis. Even though this was done carefully and checked
manually the connection of industry sectors and firm sizes to
the companies in the dataset could have contained mistakes,
leading to potential biases in the research, especially if a
mistake was made for a company that contributed a lot of
projects to the database. In the data there were probably also
numerous companies that do not publish financial statements,
so even if a researcher could be sure which exact company to
look for, it would be nearly impossible to gather data efficiently
for the 440 companies in the dataset. A recommendation for the
future construction of these databases with machine learning is
to not only collect data about projects, but also gather relevant
data about the firm immediately. When characteristics such as
industry sector or size as used in this research, but also other
variables such as turnover are known, it enables more accurate
and overall better analyses. For now, this database was a good
practice for machine learning techniques but did not provide a
solid basis for in depth analysis of the ambidexterity concept.
This lack of data made proper regression analysis difficult and
resulted in unreliable results that cannot be classified as
representative for the whole population.
Next the construction of the database itself cannot be
considered to be a process that is 100% accurate. As the
classification was first performed manually for 300 projects.
This was done by 2 students separately and afterwards the
inconsistencies were discussed. However, it remained a
subjective process, as some projects showed both explorative
and exploitative traits, projects descriptions were short or did
not indicate whether the company already performed
something similar. The machine learning classifier was then
trained on basis of this manual process. Different classifications
for the cases that were inconsistent would lead to different
outcomes throughout the whole sample. The classifier itself
also did not attain a 100% accuracy in classifying. Furthermore,
the descriptions of projects were used for fund applications,
possibly exaggerating newness of an innovation in order to gain
attention for funding. Also, projects of the companies for which
they did not apply for funding are not in the dataset, when
companies mainly apply for funding for for example
exploration projects it results in a dataset that does not provide
an accurate overall overview of actual firm innovation
portfolios. The classification is also binary, leaving little room
for nuance, as some projects that are actually in between still
get classified as either explorative or exploitative. All in all, it
9
is questionable how reliable the project classifications can be
considered.
Thirdly the sample that was used for analysis was for both
industry sector and firm size dominated by some companies.
To exaggerate a bit, you could say the Pareto principle held and
20% of the companies were responsible for 80% of the projects.
This was not exactly the case, the point however is that this
decreased representativeness. As the amount of companies was
already rather limited it resulted in a comparison between
individual companies instead of a comparison between
representative samples for size and sectors. The sample
furthermore contained only Dutch firms, making it not
representative for the whole world, therefore a more balanced
sample that contains data of international and firms of different
origin would be required.
Fourthly the analysis assumed a direct relationship between the
dependent and independent variable, excluding third variables
that may have an influence. For example: centralization,
company age, ownership structures, economic circumstances
etc. could possibly influence innovation patterns and
ambidextrous behaviors of firms. Therefore, the results may
show correlation, but it is not certain whether it is actually
causation between the two variables.
Fifthly the NAVE Rev 2. classification is rather broad. The
sections are not a perfect classifier to determine in which
industry sector a firm is active as the 21 sections are further
divided into 88 divisions, 272 groups and 615 classes, implying
that there are still large differences between firms in the same
section. However, due to the limited data available it was not
favorable to further divide the firms into divisions or even
further.
For further research it is advisable to use the knowledge and
experience about machine learning to create a new database. If
the goal is to not only learn about machine learning but also use
the data for research it is important to not only gather data about
projects, but to connect as much interesting parameters to the
companies as possible, making sure that the projects are clearly
linked to companies. If such a database is created a researcher
can do interesting research to possibly identify innovation
patterns/trends and if these are emerging search for causes that
create different trends. Providing more insight in ambidextrous
behavior and capacities. This research provided some
indication that different sized firms indeed display alternating
ambidexterity patterns, which can be validated by using a larger
database containing more parameters, that enables the
researcher to use proper statistical techniques. Considering the
machine learning part of this project the results of the data
structuring in this research can be used to verify the outcomes
of the machine learning classifier. By creating innovation
patterns for individual firms and checking with them if it
represents reality, enabling assessment of how accurate
machine learning is and where it can be improved.
Further research can optimally be conducted by combining an
extensive international database with metadata with either the
statistical method known as ANOVA or ANCOVA if your
sample size is large enough and complies to the assumptions of
each test. These tests are suitable for comparing differences
between groups (different sized firms for example). ANOVA
can be used if the researcher does not expect the dependent
variable to be influenced by covariates, which are variables that
influence the dependent variable next to the interdependent
variable. If the researcher expects that covariates are present an
ANCOVA can be used, that takes these covariates into account.
In the database a dependent variable that represents the ratio
between exploration and exploitation needs to be created, as for
example done in this research by expressing total explorative
activity as explorative activity/total innovative activity. This
can be done per year or in total. After doing so the ANOVA or
ANCOVA test enables a researcher to determine whether there
is a significant difference between the different exploration and
exploitation balances of firms categorized based on an
interdependent variable such as size. By supplementary making
a trend analysis over the years as done in this research,
preferably using a larger interval such as for example 2000-
2020, to enable visual inspection to determine whether a clear
trend or recurring patterns are actually there, a reliable result
can be created to determine what variables influence
differences in ambidextrous behavior.
6. ACKNOWLEDGEMENTS I would like to thank my thesis supervisor Matthias de Visser
for his support and proactive thinking along during difficult
phases in the process of writing my thesis.
7. REFERENCES Andriopoulos, C., & Lewis, M. W. (2009, July-August).
Exploitation-Exploration Tensions and Organizational
Ambidexterity: managing Paradoxes of Innovation.
Organization Science, 20(4), 696-717.
Benner, M. J., & Tushman, M. L. (2003). Exploitation,
explorationa, and process management: The
productivity dilemma revisited. Academy of
Management Review, 238-256.
Birkinshaw, J., & Gibson, C. (2004). Building ambidexterity into
an organization. MIT Sloan Management Review, 45(4),
47-55.
Brem, A., & Voigt, K.-I. (2009). Integration of market pull and
technology push in the corporate front end and
innovation management - Insight from the German
software industry. Technovation, 29, 351-367.
Brown, S. L., & Eisenhardt, K. M. (1997). The art of continuous
change: Linking complexity theory and time-paced
evolution in relentlessly shifting
organizations. Administrative science quarterly, 1-34.
Cegarra-Navarro, J. G., & Dewhurst, F. (2007). Linking
organizational learning and customer capital through an
ambidexterity context: an empirical investigation in
SMEs. The International Journal of Human Resource
Management, 18(10), 1720-1735.
Chang, Y. Y., Hughes, M., & Hotho, S. (2011). Internal and
external antecedents of SMEs' innovation ambidexterity
outcomes. Management Decision, 49(10), 1658-1676.
Chen, Y. (2017). Dynamic ambidexterity: How innovators manage
exploration and exploitation. Business Horizons, 60(3),
385-394.
Chou, C., Yang, K. P., & Chiu, Y. J. (2018). Managing sequential
ambidexterity in the electronics industry: roles of
temporal switching capability and contingent
factors. Industry and Innovation, 25(8), 752-777.
Damanpour, F., & Evan, W. (1984). Organizational Innovation
and Performance: The Problem of "Organizational Lag".
Administrative Science Quarterly, 29(3), 392409.
Damanpour, F., Walker, R., & Avellaneda, C. (2009).
Combinative Effects of Innovation Types and
Organizational Performance: A Longitudinal Study of
Service Organizations. Journal of Management Studies,
46(4), 650-675.
10
De Visser, M., de Weerd-Nederhof, P., Faems, D., Song, M., Van
Looy, B., & Visscher, K. (2010). Structural
ambidexterity in NPD processes: A firm-level
assessment of the impact of differentiated structures on
innovation performance. Technovation, 30(5-6), 291-
299.
De Visser, M., Miao, S., Englebienne, G., Sools, A. M., &
Visscher, K. (2017). Machine-based mapping of
innovation portfolios. 667-671. Paper presented at 18th
International CINet Conference, Potsdam, Germany.
Dean, T. J., Brown, R. L., & Bamford, C. E. (1998). Differences
in large and small firm responses to environmental
context: Strategic implications from a comparative
analysis of business formations. Strategic management
journal, 19(8), 709-728.
Dolata, U. (2011). The music industry and the internet: a decade
of disruptive and uncontrolled sectoral change (No.
2011-02). Stuttgarter Beiträge zur Organisations-und
Innovationsforschung, SOI Discussion Paper.
Dorf, R. C., & Byers, T. H. (2004). MP: Technology Ventures:
From Idea to Enterprise w/Engineering Subscription
Card. McGraw-Hill Science/Engineering/Math.
Doyle, J. (2001). Radical innovation: How mature companies can
outsmart upstarts. Ubiquity, 2001(January), 2.
doi:10.1145/358974.358977
Drucker, P. (1999). Beyond the information revolution. Atlantic
Monthly, 284, 47-57.
Eurostat - European Commission. (2008). NACE Rev. 2. Retrieved
from Statistical classification of economic activities in
the European Community:
http://ec.europa.eu/eurostat/documents/3859598/59025
21/KS-RA-07-015-EN.PDF
Forsman, H. (2011). Innovation capacity and innovation
development in small enterprises. A comparison
between the manufacturing and service
sectors. Research Policy, 40(5), 739-750.
Fritsch, M., & Meschede, M. (2001). Product innovation, process
innovation, and size. Review of Industrial Organization,
19, 335-350.
Gibson, C. B., & Birkinshaw, J. (2004). The antecedents,
consequences, and mediating role of organizational
ambidexterity. Academy of management Journal, 47(2),
209-226.
Gupta, A. K., Raj, S. P., & Wilemon, D. (1986). A model for
studying R&D–marketing interface in the product
innovation process. Journal of marketing, 50(2), 7-17.
Guyon, I., & Elisseeff, A. (2003). An introduction to variable and
feature selection. Journal of machine learning research,
3(Mar), 1157-1182.
Hadjimanolis, A. (2000). An investigation of innovation
antecedents in small firms in the context of a small
developing country. R&D Management, 30(3), 235-246.
Hecker, A., & Ganter, A. (2013). The influence of product market
competition on technological and management
innovation: Firm‐level evidence from a large‐scale
survey. European Management Review, 10(1), 17-33.
Hult, G. T. M., Snow, C. C., & Kandemir, D. (2003). The role of
entrepreneurship in building cultural competitiveness in
different organizational types. Journal of
management, 29(3), 401-426.
Irani, Z., Beskese, A., & Love, P. E. D. (2004). Total quality
management and corporate culture: constructs of
organisational excellence. Technovation, 24(8), 643-
650.
Jansen, J. J., Van Den Bosch, F. A., & Volberda, H. W. (2006).
Exploratory innovation, exploitative innovation, and
performance: Effects of organizational antecedents and
environmental moderators. Management science,
52(11), 1661-1674.
Jones, O., & Macpherson, A. (2006). Inter-organizational learning
and strategic renewal in SMEs: extending the 4I
framework. Long Range Planning, 39(2), 155-175.
Kotabe, M., & Murray, J. (1990). Linking product and process
innovation and modes of international sourcing in global
competition: a case of foreign multinational firms.
Journal of International Business Studies, 21, 383-408.
Lavie, D., Stettner, U., & Tushman, M. L. (2010). Exploration and
exploitation within and across organizations. Academy
of Management annals, 4(1), 109-155.
Lubatkin, M. H., Simsek, Z., Ling, Y., & Veiga, J. F. (2006).
Ambidexterity and performance in small-to medium-
sized firms: The pivotal role of top management team
behavioral integration. Journal of management, 32(5),
646-672.
Luger, J., Raisch, S., & Schimmer, M. (2018). Dynamic balancing
of exploration and exploitation: The contingent benefits
of ambidexterity. Organization Science, 29(3), 449-470.
McCallum, A., & Nigam, K. (1998, July). A comparison of event
models for naive bayes text classification. In AAAI-98
workshop on learning for text categorization (Vol. 752,
No. 1, pp. 41-48).
Mortensen, P. S., & Bloch, C. W. (2005). Oslo Manual-Guidelines
for Collecting and Interpreting Innovation Data:
Proposed Guidelines for Collecting and Interpreting
Innovation Data. Organisation for Economic
Cooporation and Development, OECD.
Neely, A., & Hii, J. (1998). Innovation and business performance:
a literature review. The Judge Institute of Management
Studies, University of Cambridge, 0-65.
OECD (2019), Enterprises by business size (indicator). doi:
10.1787/31d5eeaf-en (Accessed on 10 June 2019)
O'Reilly 3rd, C. A., & Tushman, M. L. (2004). The ambidextrous
organization. Harvard business review, 82(4), 74.
O'Reilly III, C. A., & Tushman, M. L. (2013). Organizational
ambidexterity: Past, present, and future. Academy of
management Perspectives, 27(4), 324-338.
Raisch, S., & Birkinshaw, J. (2008). Organizational ambidexterity:
Antecedents, outcomes, and moderators. Journal of
management, 34(3), 375-409.
Roelofs, T. J. T. (2018). Machine Learning-Based Classification
of Innovation Projects.
Tether, B. S. (2003). The sources and aims of innovation in
services: variety between and within sectors. Economics
of Innovation and new technology, 12(6), 481-505.
Tushman, M. L., & Anderson, P. (1986). Technological
discontinuities and organizational environments.
Administrative science quarterly, 439-465.
Tushman, M. L., & O'Reilly III, C. A. (1996). Ambidextrous
organizations: Managing evolutionary and revolutionary
change. California management review, 38(4), 8-29.

11
Uotila, J., Maula, M., Keil, T., & Zahra, S. A. (2009). Exploration,
exploitation, and financial performance: analysis of
S&P 500 corporations. Strategic Management Journal,
30(2), 221-231.
Van Looy, B., & Visscher, K. (2011). Organizing innovation
within incumbent firms: structure enabling strategic
autonomy. Review of Business and Economic
Literature, 56(2), 147-167.
Van Looy, B., Martens, T., & Debackere, K. (2005). Organizing
for continuous innovation: On the sustainability of
ambidextrous organizations. Creativity and Innovation
Management, 14(3), 208-221.
Walker, R. (2004). Innovation and Organizational Performance:
Evidence and A Research Agenda. Advanced Institute
for Management Research Working Paper, WP
No.:002-June.
Wiegard, S. (2018). The impact of exploitative and explorative
innovation on companies’ financial performance: a
longitudinal study. Retrieved from:
http://purl.utwente.nl/essays/75304
12
APPENDIX 1: TOTAL HOURS AND NUMBER OF PROJECTS PER COMPANY FOR
SECTION ANALYSIS

13
APPENDIX 2: OVERVIEW OF SECTION ANALYSIS
14
APPENDIX 3: TOTAL HOURS AND NUMBER OF PROJECTS PER COMPANY FOR
SIZE ANALYSIS
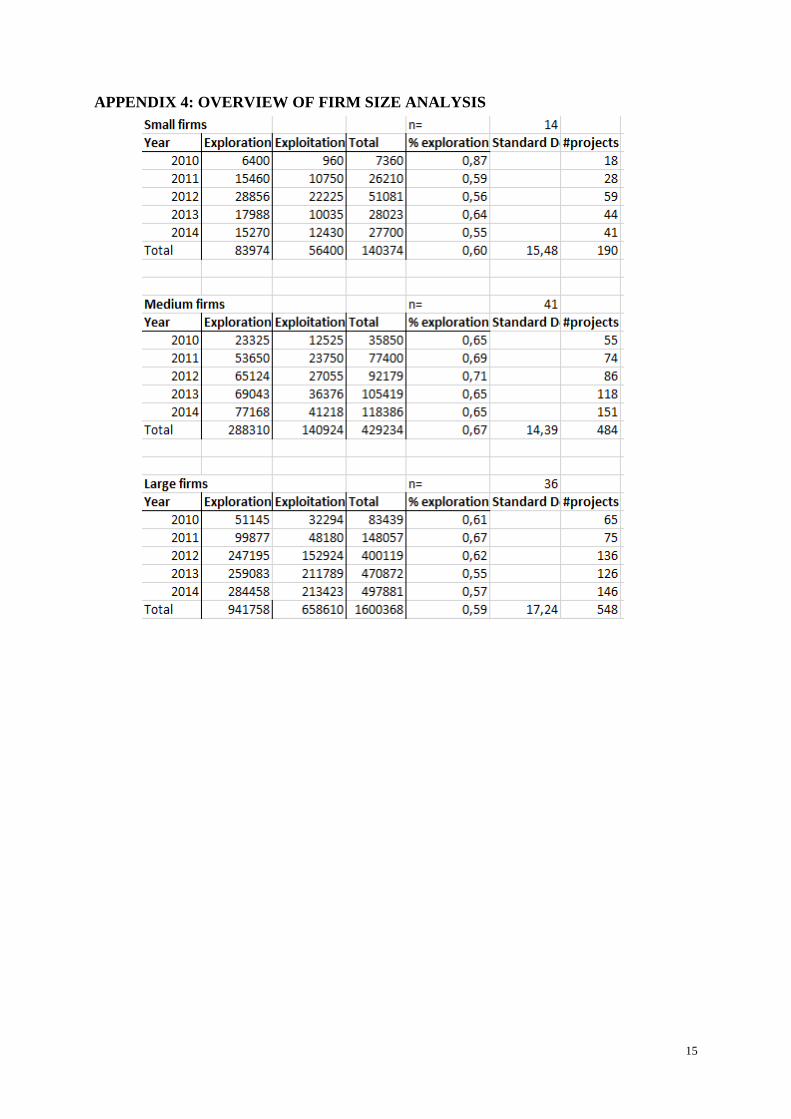
15
APPENDIX 4: OVERVIEW OF FIRM SIZE ANALYSIS