Embed Size (px)
Citation preview

IAEA-TECDOC-1239
Manual of acid in situ leach uranium mining technology
August 2001

The originating Section of this publication in the IAEA was:
Nuclear Fuel Cycle and Materials Section International Atomic Energy Agency
Wagramer Strasse 5 P.O. Box 100
A-1400 Vienna, Austria
MANUAL OF ACID IN SITU LEACH URANIUM MINING TECHNOLOGY
IAEA, VIENNA, 2001 IAEA-TECDOC-1239
ISSN 1011–4289 © IAEA, 2001
Printed by the IAEA in Austria August 2001

FOREWORD
An important part of the IAEA programme for reactor fuels involves eliciting and circulating information on innovative uranium production technologies. As compared with conventional mining, in situ leach (ISL) technology is both innovative and relatively young. It is recognized as having economic and environmental advantages when properly employed by knowledgeable specialists to extract uranium from suitable sandstone type deposits.
In recent years ISL uranium mining has been producing about 13 to 15 per cent of world output. Because of its potential for both low cost recovery and having environmental advantages, the use of the technology will very probably increase. This may occur because sandstone hosted uranium deposits amenable to ISL recovery are relatively widespread in the world.
ISL technology recovers uranium using two alternative chemical leaching systems —
acid and alkaline. Acid leach is the more widely employed and has historically produced a majority of the world’s ISL production. This technology, with its origins in the 1960s, was developed and employed in the former Soviet Union and the successor states, as well as in central and eastern Europe. The report describes operational practices developed under the economic systems, together with the governmental policies and programmes prevailing over this period. The United States of America is the only other country with an extended history of ISL uranium production. In the USA, both acid and alkaline leach systems were tested before alkaline technology was exclusively adopted for environmental reasons. As with all mining technology, any project must be planned, developed, operated and closed, only when appropriate consideration is made for environmental impacts.
This report brings together information from several technical disciplines that are an essential part of ISL technology. They include uranium geology, geohydrology, chemistry, as well as reservoir engineering and process engineering, It is not intended as a how to do it manual. However, it does provide insights into many of the considerations related to the technical feasibility of planning, operating and closing ISL uranium mining projects.
No comprehensive report exits for either acid or alkaline ISL uranium mining.
Furthermore, while there is a significant amount of literature on alkaline leach systems, almost no English language literature is available for acid technology. Therefore this manual is the first report published in English providing an extensive description of acid ISL uranium mining technology. It should also be noted that much of the material may also be of value for planning or operating alkaline ISL projects.
The IAEA wishes to thank the consultants who took part in the preparation of this report for their valuable contributions. The IAEA is also grateful to the Member States and individual organizations for their generous support in providing experts to assist in this work. In particular it expresses its appreciation to the staff of the All Russian Research Institute of Chemical Technology for its major contribution. The IAEA officer responsible for this publication was D.H. Underhill of the Division of Nuclear Fuel Cycle and Waste Technology.

EDITORIAL NOTE
The use of particular designations of countries or territories does not imply any judgement by the publisher, the IAEA, as to the legal status of such countries or territories, of their authorities and institutions or of the delimitation of their boundaries.
The mention of names of specific companies or products (whether or not indicated as registered) does not imply any intention to infringe proprietary rights, nor should it be construed as an endorsement or recommendation on the part of the IAEA.
CONTENTS
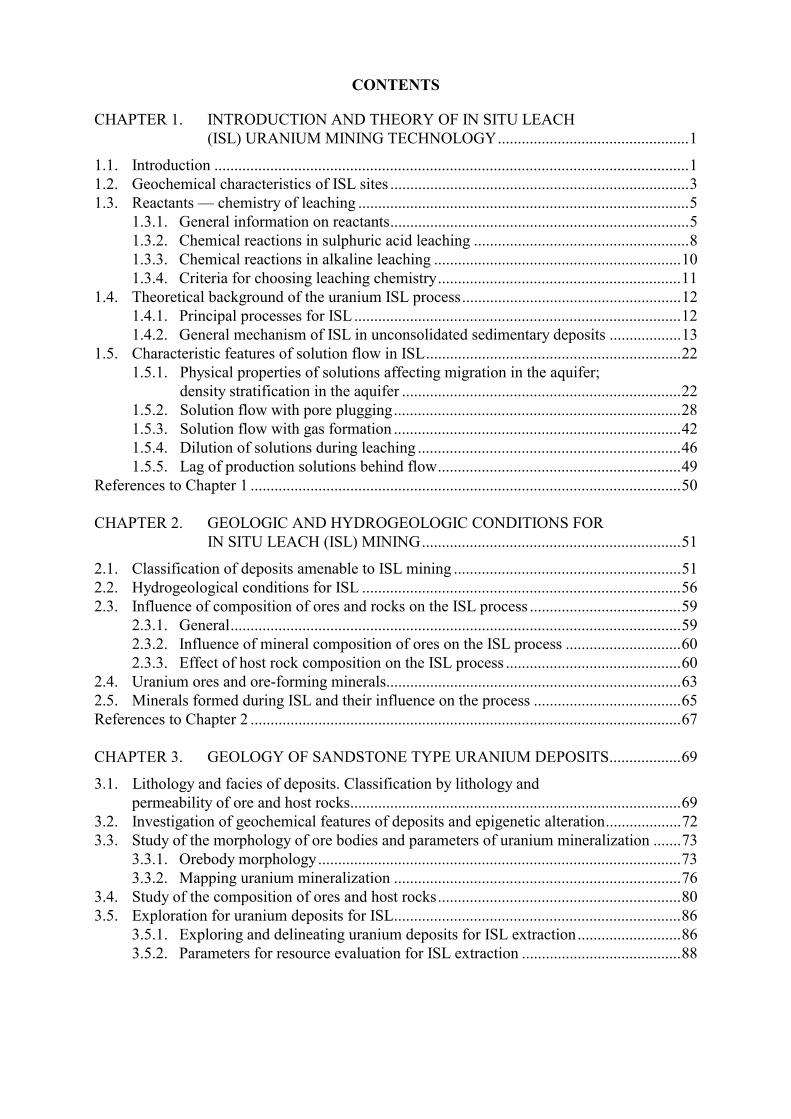
CHAPTER 1. INTRODUCTION AND THEORY OF IN SITU LEACH (ISL) URANIUM MINING TECHNOLOGY................................................1
1.1. Introduction .......................................................................................................................1 1.2. Geochemical characteristics of ISL sites ...........................................................................3 1.3. Reactants — chemistry of leaching ...................................................................................5
1.3.1. General information on reactants...........................................................................5 1.3.2. Chemical reactions in sulphuric acid leaching ......................................................8 1.3.3. Chemical reactions in alkaline leaching ..............................................................10 1.3.4. Criteria for choosing leaching chemistry.............................................................11
1.4. Theoretical background of the uranium ISL process.......................................................12 1.4.1. Principal processes for ISL ..................................................................................12 1.4.2. General mechanism of ISL in unconsolidated sedimentary deposits ..................13
1.5. Characteristic features of solution flow in ISL................................................................22 1.5.1. Physical properties of solutions affecting migration in the aquifer; density stratification in the aquifer ......................................................................22 1.5.2. Solution flow with pore plugging........................................................................28 1.5.3. Solution flow with gas formation ........................................................................42 1.5.4. Dilution of solutions during leaching ..................................................................46 1.5.5. Lag of production solutions behind flow.............................................................49
References to Chapter 1 ............................................................................................................50 CHAPTER 2. GEOLOGIC AND HYDROGEOLOGIC CONDITIONS FOR IN SITU LEACH (ISL) MINING.................................................................51
2.1. Classification of deposits amenable to ISL mining .........................................................51 2.2. Hydrogeological conditions for ISL ................................................................................56 2.3. Influence of composition of ores and rocks on the ISL process ......................................59
2.3.1. General.................................................................................................................59 2.3.2. Influence of mineral composition of ores on the ISL process .............................60 2.3.3. Effect of host rock composition on the ISL process ............................................60
2.4. Uranium ores and ore-forming minerals..........................................................................63 2.5. Minerals formed during ISL and their influence on the process .....................................65 References to Chapter 2 ............................................................................................................67 CHAPTER 3. GEOLOGY OF SANDSTONE TYPE URANIUM DEPOSITS..................69
3.1. Lithology and facies of deposits. Classification by lithology and permeability of ore and host rocks...................................................................................69 3.2. Investigation of geochemical features of deposits and epigenetic alteration...................72 3.3. Study of the morphology of ore bodies and parameters of uranium mineralization .......73
3.3.1. Orebody morphology...........................................................................................73 3.3.2. Mapping uranium mineralization ........................................................................76
3.4. Study of the composition of ores and host rocks.............................................................80 3.5. Exploration for uranium deposits for ISL........................................................................86
3.5.1. Exploring and delineating uranium deposits for ISL extraction..........................86 3.5.2. Parameters for resource evaluation for ISL extraction ........................................88

3.6. Geophysical studies used in uranium ISL........................................................................91 3.6.1. General.................................................................................................................91 3.6.2. Investigations of ore and host rocks using logging methods ...............................94 3.6.3. Surveying drift, drill hole diameter and geothermal characteristics of measurements ..........................................................................94
References to Chapter 3 ............................................................................................................95 Bibliography to Chapter 3.........................................................................................................95 CHAPTER 4. HYDROGEOLOGICAL EVALUATION OF URANIUM DEPOSITS................................................................................97
4.1. General.............................................................................................................................97 4.2. Hydrological studies at various stages of the evaluation.................................................97
4.2.1. Preliminary evaluation.........................................................................................97 4.2.2. Further investigation............................................................................................98 4.2.3. Detailed exploration.............................................................................................99
4.3. Pump tests........................................................................................................................99 4.4. Static monitor wells.......................................................................................................100 4.5. Geophysical methods of assessing flow properties..........................................................101 4.6. Hydrogeological zoning of ISL deposits..........................................................................103 References to Chapter 4 ..........................................................................................................104 CHAPTER 5. MODELLING AND LABORATORY INVESTIGATION .......................105
5.1. Modelling the ISL process.............................................................................................105 5.1.1. General concepts................................................................................................105 5.1.2. Ore sampling......................................................................................................108 5.1.3. Preparation for column leaching........................................................................109 5.1.4. Column leaching................................................................................................111 5.1.5. Leach modeling in ground trays.........................................................................113 5.1.6. Modeling leaching from clayey ores..................................................................116
5.2. Determining permeability properties of unconsolidated rock and ores .........................118 5.2.1. General...............................................................................................................118 5.2.2. Determination of initial hydraulic conductivities for rock and ores ..................119 5.2.3. Variations of hydraulic conductivity of rock and ore during leaching ..............120
References to Chapter 5 ..........................................................................................................122 Bibliography to Chapter 5.......................................................................................................122 CHAPTER 6. WELLFIELD LEACH TESTS AT ISL DEPOSITS ..................................123
6.1. General concepts and the sequence of leach tests .........................................................123 6.2. Well patterns at ISL test sites ........................................................................................124 6.3. Information requirements for leach test sites.................................................................134 6.4. Calculation of leaching characteristics and evaluating their reliability.........................138 References to Chapter 6 ..........................................................................................................146 CHAPTER 7. WELLFIELD SYSTEMS FOR ISL MINING OF SANDSTONE DEPOSITS.........................................................................147
7.1. ISL wellfield systems.....................................................................................................147 7.2. Flow networks for major wellfield pattern systems ......................................................149 7.3. Selection of the optimal design ISL well patterns .........................................................152
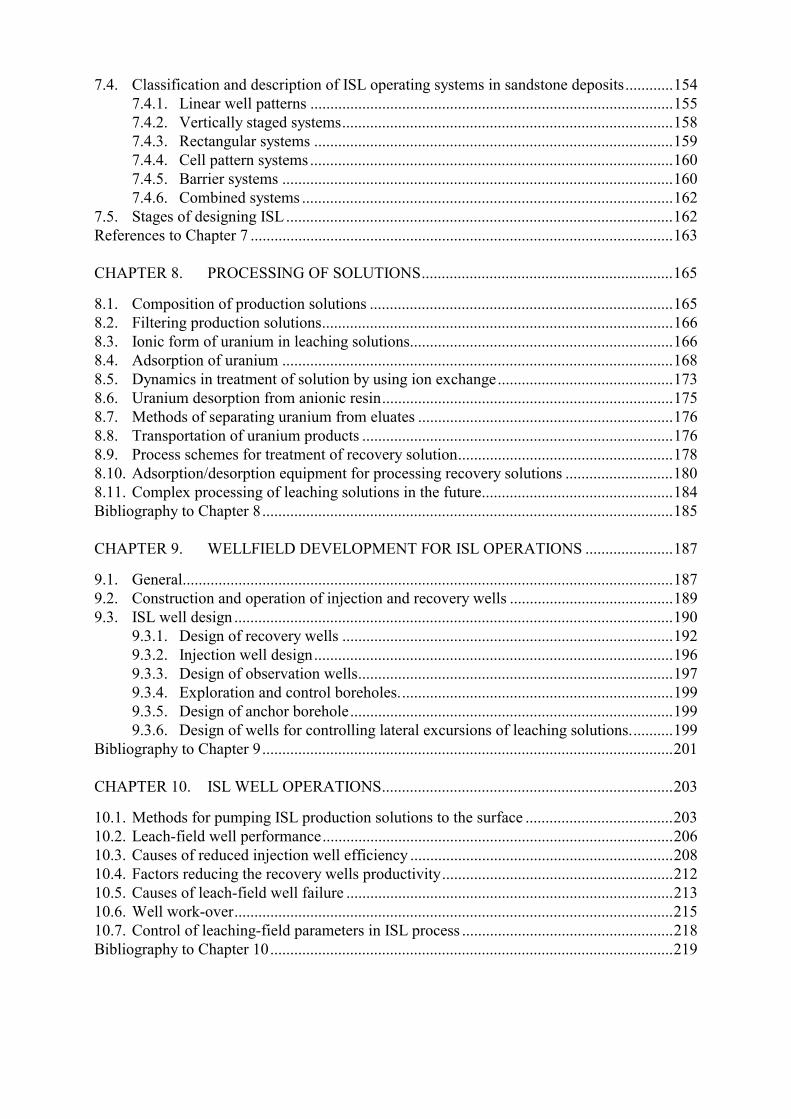
7.4. Classification and description of ISL operating systems in sandstone deposits............154 7.4.1. Linear well patterns ...........................................................................................155 7.4.2. Vertically staged systems...................................................................................158 7.4.3. Rectangular systems ..........................................................................................159 7.4.4. Cell pattern systems ...........................................................................................160 7.4.5. Barrier systems ..................................................................................................160 7.4.6. Combined systems .............................................................................................162
7.5. Stages of designing ISL .................................................................................................162 References to Chapter 7 ..........................................................................................................163 CHAPTER 8. PROCESSING OF SOLUTIONS...............................................................165
8.1. Composition of production solutions ............................................................................165 8.2. Filtering production solutions........................................................................................166 8.3. Ionic form of uranium in leaching solutions..................................................................166 8.4. Adsorption of uranium ..................................................................................................168 8.5. Dynamics in treatment of solution by using ion exchange............................................173 8.6. Uranium desorption from anionic resin.........................................................................175 8.7. Methods of separating uranium from eluates ................................................................176 8.8. Transportation of uranium products ..............................................................................176 8.9. Process schemes for treatment of recovery solution......................................................178 8.10. Adsorption/desorption equipment for processing recovery solutions ...........................180 8.11. Complex processing of leaching solutions in the future................................................184 Bibliography to Chapter 8.......................................................................................................185 CHAPTER 9. WELLFIELD DEVELOPMENT FOR ISL OPERATIONS ......................187
9.1. General...........................................................................................................................187 9.2. Construction and operation of injection and recovery wells .........................................189 9.3. ISL well design ..............................................................................................................190
9.3.1. Design of recovery wells ...................................................................................192 9.3.2. Injection well design..........................................................................................196 9.3.3. Design of observation wells...............................................................................197 9.3.4. Exploration and control boreholes.....................................................................199 9.3.5. Design of anchor borehole.................................................................................199 9.3.6. Design of wells for controlling lateral excursions of leaching solutions...........199
Bibliography to Chapter 9.......................................................................................................201 CHAPTER 10. ISL WELL OPERATIONS.........................................................................203
10.1. Methods for pumping ISL production solutions to the surface .....................................203 10.2. Leach-field well performance........................................................................................206 10.3. Causes of reduced injection well efficiency ..................................................................208 10.4. Factors reducing the recovery wells productivity..........................................................212 10.5. Causes of leach-field well failure ..................................................................................213 10.6. Well work-over..............................................................................................................215 10.7. Control of leaching-field parameters in ISL process .....................................................218 Bibliography to Chapter 10.....................................................................................................219

CHAPTER 11. INVESTIGATION AND ACTIONS FOR ENVIRONMENTAL PROTECTION........................................................221
11.1. General (concept) ..........................................................................................................221 11.2. Contamination of surface and recultivation of land ......................................................221 11.3. General information on contamination of underground water in ISL ...........................223 11.4. Evaluation of groundwater contamination ....................................................................228
11.4.1. General (conception) .......................................................................................228 11.4.2. Calculation of contaminated groundwater halo after ISL termination ............230 11.4.3. Likelihood of water supply contamination......................................................231
11.5. Research on groundwater environmental protection .....................................................234 11.5.1. General ............................................................................................................234 11.5.2. Methodology for evaluating interacting parameters in field conditions..........235
11.6. Processes for groundwater restoration...........................................................................236 11.6.1. Cleaning by precipitation with reagents ..........................................................238 11.6.2. Cleaning via electrical adsorption technology.................................................238 11.6.3. Cleaning solutions by compressed air .............................................................238 11.6.4. Washing with formation water ........................................................................239 11.6.5. Method of natural attenuation .........................................................................239 11.6.6. Method for accelerating groundwater natural attenuation...............................240
References to Chapter 11 ........................................................................................................241 Bibliography to Chapter 11.....................................................................................................242 CHAPTER 12. DESIGNING IN SITU LEACHING FACILITIES.....................................243
12.1. Summary feasibility report ............................................................................................243 12.2. Major technological decisions .......................................................................................244 12.2.1. Geotechnology of mining ................................................................................244 12.3. Processing of solutions ..................................................................................................247 12.4. Wells and pumping equipment ......................................................................................248 12.5. Transportation of injection and recovery solutions .......................................................249 12.6. General purpose services, power supply, operational organization...............................256
12.6.1. Central research laboratory..............................................................................256 12.6.2. Maintenance, garage and storage services.......................................................257 12.6.3. Industrial engineering and management..........................................................258
12.7. General construction decisions, construction engineering ............................................259 12.7.1. General construction decisions........................................................................259 12.7.2. Construction engineering ................................................................................259
12.8. Protection of the environment .......................................................................................259 12.8.1. Protection of the atmosphere...........................................................................259 12.8.2. Protection and utilization of water resources ..................................................259 12.8.3. Protection and utilization of land ....................................................................260
12.9. General layout and transport..........................................................................................260 12.9.1. General layout .................................................................................................260 12.9.2. Transportation .................................................................................................260
12.10. Calculated cost of construction ...................................................................................260 CHAPTER 13. BY-PRODUCT RECOVERY FROM IN SITU LEACHING OF
SANDSTONE URANIUM DEPOSITS IN UZBEKISTAN......................261
13.1. Identifying by-product components.............................................................................262

13.2. Valuing of each product; present and future demand..................................................263 13.3. Investigating the analysis of distribution, concentration of rare elements in ores and enclosing rock.....................................................................263 13.4. Development of economic by-product recovery .........................................................266 Bibliography to Chapter 13.....................................................................................................266 ANNEX I. GLOSSARY....................................................................................................267 ANNEX II. THE IMPORTANCE OF ENVIRONMENTAL IMPACT ASSESSMENT FOR PLANNING ISL URANIUM MINING PROJECTS ...........................................................275 ANNEX III. BIBLIOGRAPHY ...........................................................................................280 ANNEX IV. UNITS OF HYDRAULIC CONDUCTIVITY, TRANSMISSIVITY, RECHARGE AND FLOW RATES.............................281 CONTRIBUTORS TO DRAFTING AND REVIEW ............................................................283

.

1
Chapter 1
INTRODUCTION AND THEORY OF IN SITU LEACH (ISL) URANIUM MINING TECHNOLOGY
1.1. INTRODUCTION
In situ leach (ISL) mining is defined as, the extraction of uranium from the host sandstone by chemical solutions and the recovery of uranium at the surface. ISL extraction is conducted by injecting a suitable leach solution into the ore zone below the water table; oxidizing, complexing, and mobilizing the uranium; recovering the pregnant solutions through production wells; and, finally, pumping the uranium bearing solution to the surface for further processing. Acid leach technology employs an acid based leaching system. Dilute sulfuric acid is normally used. A glossary of the terminology for in situ leach (ISL) mining is given in Annex I. In situ leach (ISL) uranium mining technology was developed independently in both the USSR and USA in the early 1960s. The method was conceived for extracting uranium from roll–front (infiltration) sandstone type deposits located in water saturated, permeable rocks that were not suitable for conventional mining. It was developed in both countries using similar engineering and technological approaches. However, the Soviets adopted the acid leach system, while the US specialists employed an alkaline, primarily carbonate based system. In following years the acid ISL technology was also applied in Bulgaria, Czechoslovakia, the German Democratic Republic and China. By 1998 and 1999 new acid leach projects were being developed in Australia. This manual addresses acid leach technology as developed in the former USSR and the Russian Federation. However, it also addresses many of the issues of planning and operating of ISL facilities in general. It also provides a substantial amount of information that is not otherwise available in the English language. As with all of technology, ISL is changing and developing to meet new economic, site, operational and regulatory circumstances. Examples are the recent development of the use of low acid technology in Uzbekistan and the implementation of acid leaching in South Australia. Reference is made to information on the Australian developments in Annex II of the report. The importance of ISL technology has increased to the level that it contributed 13 to 15% of world uranium production through much of the 1990s. In the late 1990s 65% or more of the ISL production was recovered using acid technology. Because of the potential for economic, as well as environmental advantages of properly planned and operated projects, the use of ISL technology is projected to significantly increase in the future. The first field tests of acid ISL technology for extracting uranium took place in 1962 at the Devladovo deposit, Ukraine and the Uchkuduk deposit, Uzbekistan. The geological and hydrogeological characteristics of these deposits are quite different.

2
Development at Devladovo is confined to Mesozoic sediments, and occurs immediately above the crystalline Paleozoic basement in basal channel sandstone (valley–type) deposits. The ore–bearing horizon of Upper Turonian sediments consists of a sequence of alluvial gravel, sandstone and mudstone, containing minor amounts of clay cement. These rocks are inter–bedded with clay and silt. The evenly bedded horizon is 15–20 meters thick. The entire sequence occurs in six, more or less independent groundwater aquifers. The third horizon from the bottom, which hosts the orebody is located 20–50 meters from the surface. The average permeability of this formation is 0.5 m/day, and the average uranium content in the ores is about 0.06% U. Based on favourable pilot test results, a commercial operation was started and continued to 1975. By the end of leaching the total uranium recovery was 77.6%. During operation the metal content in the leach solutions and the flow rate coefficients did not significantly differ from those observed in many sulphuric acid ISL operations that followed. The leach solutions usually contained from 30–100 mg/L uranium, with acid consumption of 70–120 kg per kilogram of recovered uranium. For several years (especially during the active leach period) the cost of the recovered uranium was much lower than at all other uranium–producing facilities in the USSR. At Uchkuduk, the leach field was located directly in the roll front of the 2–3 meter thick ore horizon, which also included some barren rock. The orebody depth is 20–25 meters. The three year active leaching period produced extraordinarily successful results. For several months after the introduction of acid into the orebody the uranium content in the recovered solution was 6–7 g/L. During the second year of leaching, the average uranium content was 0.380 g/L. The consumption coefficients of acid of 20–40 kg/kg U recovered were rather low. These early results were sufficiently encouraging that a number of uranium deposits where conventional mining was initially planned, were re–designed for ISL mining. The innovative ISL extraction technology was also applied to newly discovered deposits. The deposits selected for ISL extraction were usually unsuitable for conventional mining because of the low rock strength, water saturation and the distribution of ore over several different elevations in the formation. In the USSR sulphuric acid ISL technology was tested and improved at a group of large uranium deposits of roll–front type situated in the Central Kyzilkum province, Uzbekistan, and the Syr–Darya and Chu–Sarysu provinces, Kazakhstan. Sulphuric acid ISL tests were initially conducted at most of these deposits, and several of them were subsequently developed as commercial facilities. Within a few years the acid ISL method went through all stages of research, development and industrial implementation. During this period it was learned that because of the unique and variable characteristics of each uranium deposit, much attention and creative problem solving is required to successfully implement and operate ISL technology. Based on a comparison of experience between conventional and ISL uranium mining (both acid and alkaline), ISL mining was found to have the following advantages: – low capital and operational project costs; – high cash flow within one year; – rapid payback of investment; – reduced length of project development and startup; – low power consumption and less equipment required;

3
– reduced labour per unit produced; – reduced radiation exposure and lower environmental impacts (contamination, etc.); – greatly reduced solid waste (no tails); – economic recovery of low–grade ores, thus increasing resource utilization; – possibility of recovering uranium from deposits inaccessible by other extraction
methods. In addition to the extensive application of acid ISL, carbonate (alkaline) leaching was conducted by the Soviet specialists at the Sugraly and Kanimekh deposits, Uzbekistan. Based on a comparison of the results from these operations it is possible to list the advantages and disadvantages of the acid and carbonate ISL technologies. The merits of acid ISL are as follows: – a higher degree of uranium recovery from ore (70–90%); – favourable leaching kinetics (at 80% recovery the number of pore volumes of leach
solution circulated is 3–4, compared to 10–12 for carbonate solutions); – a comparatively short leaching period of 2–5 years for acid (depending on the wellfield
size, ore permeability, well pattern, etc.); – possibility of recovering by–products; – limited seepage beyond the leach field limit due to the formation of low permeable
chemical precipitates that block flow; – addition of oxidants is not required due to widespread presence of iron oxide in the
recycled solutions; – possibility of self–restoration (or self attenuation) of the remaining leach solution due to
self–cleaning or “re–circulation” of the contaminated solutions through adjacent barren rocks.
The disadvantages of the acid process are: – acid consumption in carbonate–bearing ores (i.e. C02 content over 1.5–2.0%) increases
chemical costs and may make the process non–economic; – the risk of pore plugging (i.e. by chemical and gas bubbles); – increased concentration of dissolved solids in recycled leach solutions (to 15–25 g/L); – mandatory use of corrosion–resistant materials and equipment, and; comparatively high
reagent cost. 1.2. GEOCHEMICAL CHARACTERISTICS OF ISL SITES
The ISL method proves to be the most advantageous technique for recovering uranium when applied to sandstone stratiform deposits confined by geochemical barriers with distinct alteration of the reduced environment by oxidizing media. The largest of such deposits are genetically akin to sandstone deposits of artesian basin aquifers, and have been most studied in arid zones.
Besides uranium, these aquifers may contain Se, Mo and other metals which migrate in oxidizing groundwater and are deposited at geochemical barriers. These metals form a series of epigenetic zones.
The geochemical properties of the host rocks are determined by their primary composition and particle size distribution, as well as by their permeability and other hydrologic characteristics. The reduced chemical state of the host rocks may develop during diagenesis following

4
deposition, or possibly as the result of some event or events taking place later in the geologic history. This includes reducing agents such as hydrogen sulphide, hydrocarbon gases and petroleum entering the stratum.
The reduction processes are accompanied by the development of grey, dark-grey and greenish-grey coloured host rocks. Epigenetic alteration taking place during reduction, include bituminization, carbonation, sulphidation, argillization and decomposition of Fe3+ minerals (bleaching of the rock).
In deposits exhibiting stratabound roll-front oxidation, the following zoning is observed (Fig. 1.1):
FIG. 1.1. Epigenetic zoning of a partially oxidized ore-bearing sedimentary sequence: 1 — soil-vegetation layer; 2 — clay; 3 — marl; 4 — sandstone; 5 — oxidized zone with boundaries; 6 — subzone of complete oxidation of sandstone unit; 7 — subzone of hematitic alteration; 8 — subzone of partially oxidized sandstone unit; 9 — roll-type ore deposit.
Zone of limonitization is divided into two sub-zones — complete and partial oxidation. Siderite, pyrite, biotite, chlorite and glauconite are absent in the completely oxidized zone. The ore minerals are replaced by iron hydroxides. The granular fraction includes some kaolinized feldspars. The predominant colour of the rock is yellow, ochre-yellow and orange. In the sub-zone of incomplete oxidation, iron hydroxides occur locally resulting in the rock having a mottled appearance. Minor quantities of plant detritus, siderite, and glauconite may be present. The predominant colours are yellowish-green and whitish-yellow. Between the zone of complete and partial oxidation one sometimes observes a sub-zone of redeposited red hematite ochres (Fig. 1.1). The completely oxidized subzone can extend for tens and hundreds of kilometres into the basin, measured from the outcrop at the basin margin. The subzone of incomplete oxidation can extend from a few kilometres to some tens and hundreds of kilometres.
The zone of uranium mineralization is located along the geochemical barrier marked by the contact zone of the incompletely oxidized rock and the primary grey-coloured rock. Iron
5
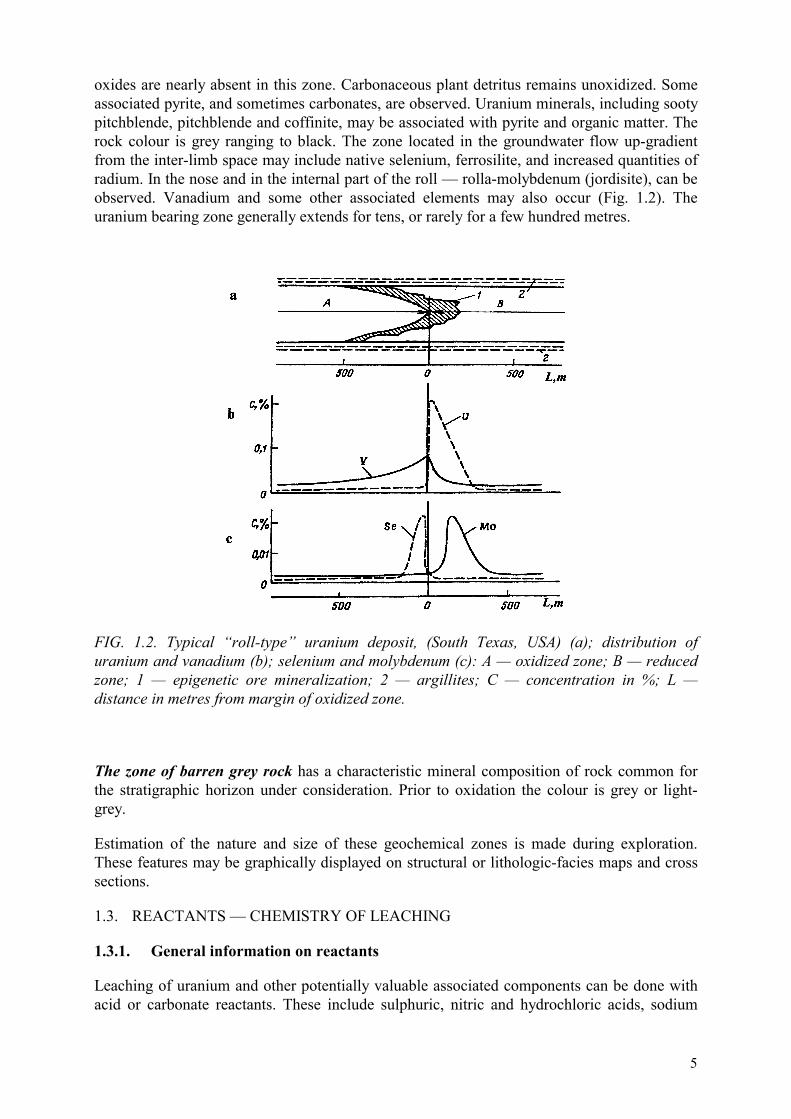
oxides are nearly absent in this zone. Carbonaceous plant detritus remains unoxidized. Some associated pyrite, and sometimes carbonates, are observed. Uranium minerals, including sooty pitchblende, pitchblende and coffinite, may be associated with pyrite and organic matter. The rock colour is grey ranging to black. The zone located in the groundwater flow up-gradient from the inter-limb space may include native selenium, ferrosilite, and increased quantities of radium. In the nose and in the internal part of the roll — rolla-molybdenum (jordisite), can be observed. Vanadium and some other associated elements may also occur (Fig. 1.2). The uranium bearing zone generally extends for tens, or rarely for a few hundred metres.
FIG. 1.2. Typical “roll-type” uranium deposit, (South Texas, USA) (a); distribution of uranium and vanadium (b); selenium and molybdenum (c): A — oxidized zone; B — reduced zone; 1 — epigenetic ore mineralization; 2 — argillites; C — concentration in %; L — distance in metres from margin of oxidized zone.
The zone of barren grey rock has a characteristic mineral composition of rock common for the stratigraphic horizon under consideration. Prior to oxidation the colour is grey or light-grey.
Estimation of the nature and size of these geochemical zones is made during exploration. These features may be graphically displayed on structural or lithologic-facies maps and cross sections.
1.3. REACTANTS — CHEMISTRY OF LEACHING
1.3.1. General information on reactants
Leaching of uranium and other potentially valuable associated components can be done with acid or carbonate reactants. These include sulphuric, nitric and hydrochloric acids, sodium
6
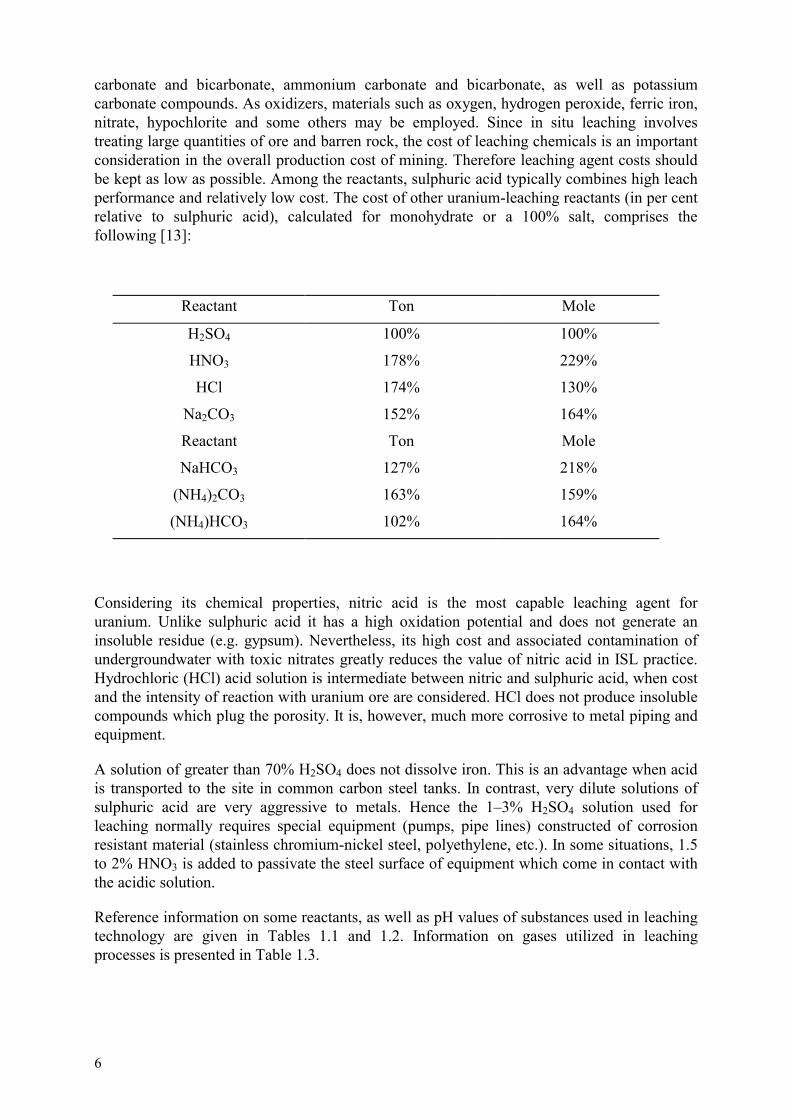
carbonate and bicarbonate, ammonium carbonate and bicarbonate, as well as potassium carbonate compounds. As oxidizers, materials such as oxygen, hydrogen peroxide, ferric iron, nitrate, hypochlorite and some others may be employed. Since in situ leaching involves treating large quantities of ore and barren rock, the cost of leaching chemicals is an important consideration in the overall production cost of mining. Therefore leaching agent costs should be kept as low as possible. Among the reactants, sulphuric acid typically combines high leach performance and relatively low cost. The cost of other uranium-leaching reactants (in per cent relative to sulphuric acid), calculated for monohydrate or a 100% salt, comprises the following [13]:
Reactant Ton Mole
H2SO4 100% 100%
HNO3 178% 229%
HCl 174% 130%
Na2CO3 152% 164%
Reactant Ton Mole
NaHCO3 127% 218%
(NH4)2CO3 163% 159%
(NH4)HCO3 102% 164%
Considering its chemical properties, nitric acid is the most capable leaching agent for uranium. Unlike sulphuric acid it has a high oxidation potential and does not generate an insoluble residue (e.g. gypsum). Nevertheless, its high cost and associated contamination of undergroundwater with toxic nitrates greatly reduces the value of nitric acid in ISL practice. Hydrochloric (HCl) acid solution is intermediate between nitric and sulphuric acid, when cost and the intensity of reaction with uranium ore are considered. HCl does not produce insoluble compounds which plug the porosity. It is, however, much more corrosive to metal piping and equipment.
A solution of greater than 70% H2SO4 does not dissolve iron. This is an advantage when acid is transported to the site in common carbon steel tanks. In contrast, very dilute solutions of sulphuric acid are very aggressive to metals. Hence the 1–3% H2SO4 solution used for leaching normally requires special equipment (pumps, pipe lines) constructed of corrosion resistant material (stainless chromium-nickel steel, polyethylene, etc.). In some situations, 1.5 to 2% HNO3 is added to passivate the steel surface of equipment which come in contact with the acidic solution.
Reference information on some reactants, as well as pH values of substances used in leaching technology are given in Tables 1.1 and 1.2. Information on gases utilized in leaching processes is presented in Table 1.3.

7
TABLE 1.1. REACTANT COMPOSITION [3]
Reactant Formula Molecular weight
Normality of concentr.
Reactant
Content, mass %
Density, g/dm3
Quantity for 1 L of 1N
solution
Nitric acid HNO3 63.012 15.9 70 1.42 63
Ammonia NH3 17.031 14.8 29 0.90 65
Potassium hydroxide
KOH 56.11 11.7 45 1.46 85
Sodium hydroxide
NaOH 40.00 19.1 50 1.53 52
Sulphuric acid H2SO4 98.07 36 96 1.84 56
Hydrochloric acid
HCl 36.461 12 37 1.14 83
Acetic acid CH3COOH 60.052 17.4 99.8 1.05 57
Phosphoric acid
H3PO4 97.994 14.7 85 1.70 69
Perchloric acid HClO4 100.457 11.7
9.5
70
60
1.67
1.54
86
110
TABLE 1.2. PH VALUES FOR CHEMICALS USED IN LEACHING [3]
Material 1N 0.1N 0.01N 0.001N
Ammonia 11.8 11.3 10.8 10.3
Sodium bicarbonate - 8.4 - -
Potassium hydroxide 14.0 13.0 12.0 11.0
Sodium hydroxide 14.05 13.07 12.12 11.13
Sodium carbonate - 11.5 11.0 -
Sulphuric acid 0.3 1.2 2.1 -
Acetic acid 2.4 2.9 3.4 3.9
Hydrogen chloride - 5.1 - -
8
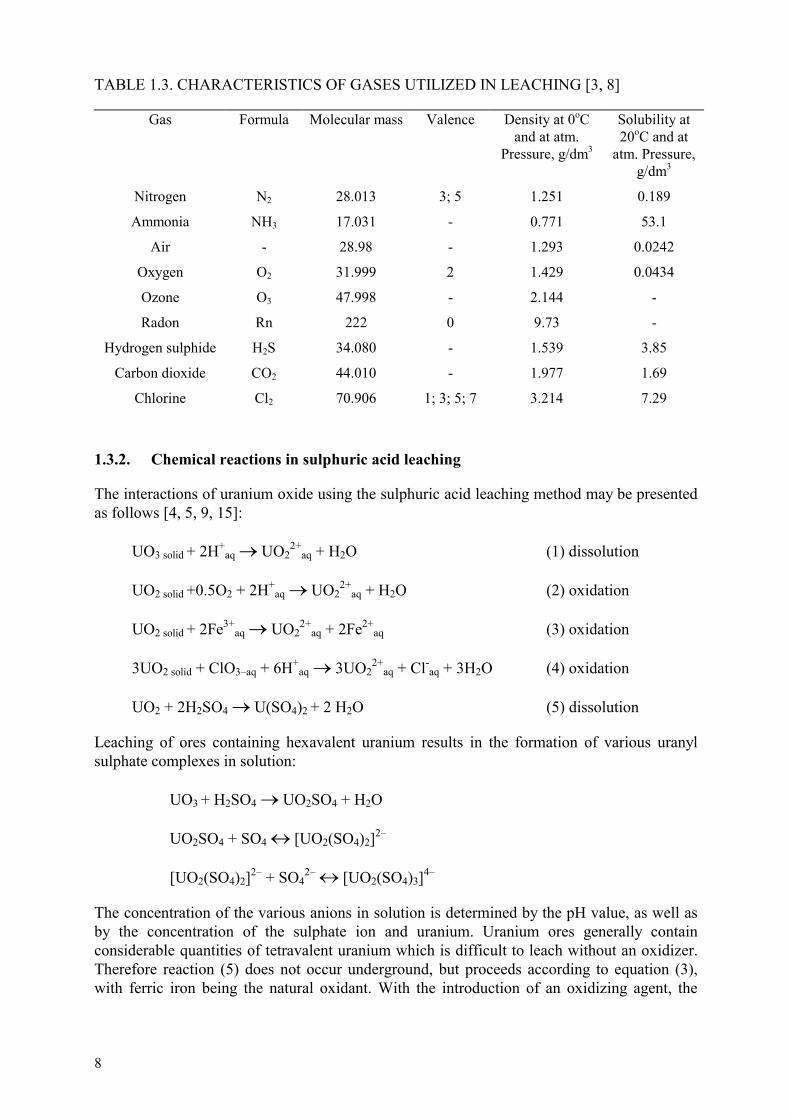
TABLE 1.3. CHARACTERISTICS OF GASES UTILIZED IN LEACHING [3, 8]
Gas Formula Molecular mass Valence Density at 0oC and at atm.
Pressure, g/dm3
Solubility at 20oC and at
atm. Pressure, g/dm3
Nitrogen N2 28.013 3; 5 1.251 0.189
Ammonia NH3 17.031 - 0.771 53.1
Air - 28.98 - 1.293 0.0242
Oxygen O2 31.999 2 1.429 0.0434
Ozone O3 47.998 - 2.144 -
Radon Rn 222 0 9.73 -
Hydrogen sulphide H2S 34.080 - 1.539 3.85
Carbon dioxide CO2 44.010 - 1.977 1.69
Chlorine Cl2 70.906 1; 3; 5; 7 3.214 7.29
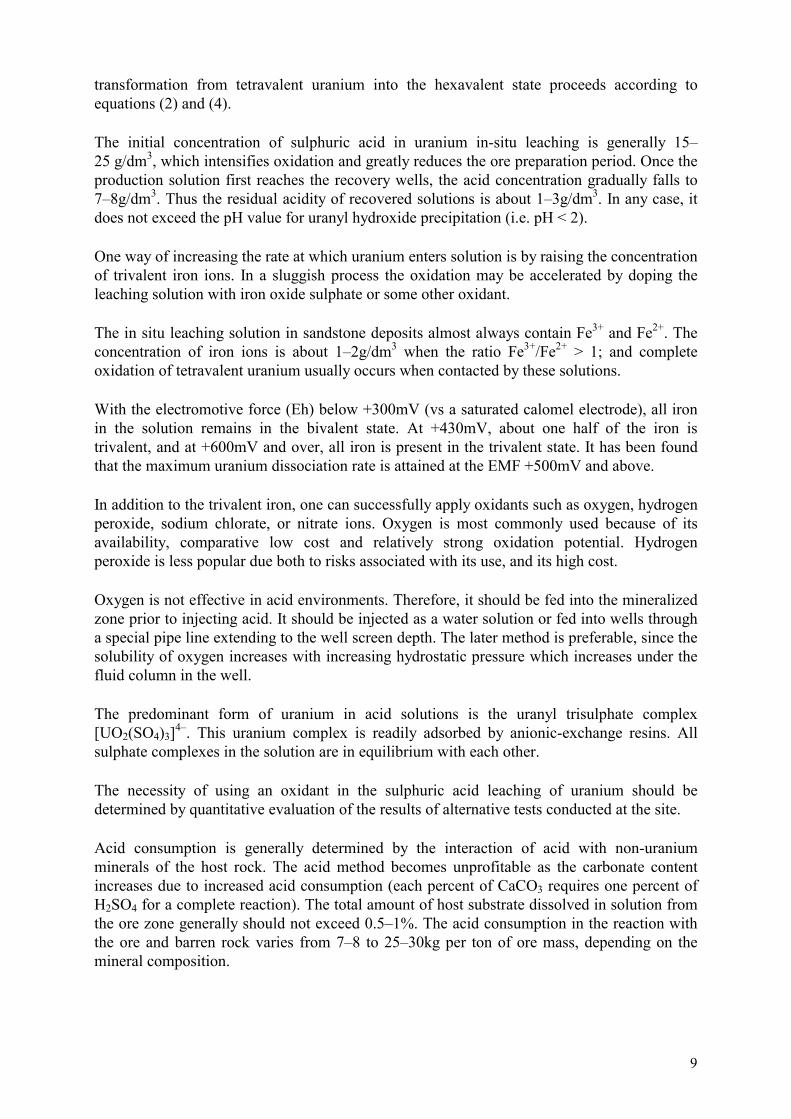
1.3.2. Chemical reactions in sulphuric acid leaching
The interactions of uranium oxide using the sulphuric acid leaching method may be presented as follows [4, 5, 9, 15]:
UO3 solid + 2H+aq � UO2
2+aq + H2O (1) dissolution
UO2 solid +0.5O2 + 2H+aq � UO2
2+aq + H2O (2) oxidation
UO2 solid + 2Fe3+aq � UO2
2+aq + 2Fe2+
aq (3) oxidation
3UO2 solid + ClO3–aq + 6H+aq � 3UO2
2+aq + Cl-
aq + 3H2O (4) oxidation
UO2 + 2H2SO4 � U(SO4)2 + 2 H2O (5) dissolution
Leaching of ores containing hexavalent uranium results in the formation of various uranyl sulphate complexes in solution:
UO3 + H2SO4 � UO2SO4 + H2O
UO2SO4 + SO4 � [UO2(SO4)2]2–
[UO2(SO4)2]2– + SO42– � [UO2(SO4)3]4–
The concentration of the various anions in solution is determined by the pH value, as well as by the concentration of the sulphate ion and uranium. Uranium ores generally contain considerable quantities of tetravalent uranium which is difficult to leach without an oxidizer. Therefore reaction (5) does not occur underground, but proceeds according to equation (3), with ferric iron being the natural oxidant. With the introduction of an oxidizing agent, the
9
transformation from tetravalent uranium into the hexavalent state proceeds according to equations (2) and (4).
The initial concentration of sulphuric acid in uranium in-situ leaching is generally 15–25 g/dm3, which intensifies oxidation and greatly reduces the ore preparation period. Once the production solution first reaches the recovery wells, the acid concentration gradually falls to 7–8g/dm3. Thus the residual acidity of recovered solutions is about 1–3g/dm3. In any case, it does not exceed the pH value for uranyl hydroxide precipitation (i.e. pH < 2).
One way of increasing the rate at which uranium enters solution is by raising the concentration of trivalent iron ions. In a sluggish process the oxidation may be accelerated by doping the leaching solution with iron oxide sulphate or some other oxidant.
The in situ leaching solution in sandstone deposits almost always contain Fe3+ and Fe2+. The concentration of iron ions is about 1–2g/dm3 when the ratio Fe3+/Fe2+ > 1; and complete oxidation of tetravalent uranium usually occurs when contacted by these solutions.
With the electromotive force (Eh) below +300mV (vs a saturated calomel electrode), all iron in the solution remains in the bivalent state. At +430mV, about one half of the iron is trivalent, and at +600mV and over, all iron is present in the trivalent state. It has been found that the maximum uranium dissociation rate is attained at the EMF +500mV and above.
In addition to the trivalent iron, one can successfully apply oxidants such as oxygen, hydrogen peroxide, sodium chlorate, or nitrate ions. Oxygen is most commonly used because of its availability, comparative low cost and relatively strong oxidation potential. Hydrogen peroxide is less popular due both to risks associated with its use, and its high cost.
Oxygen is not effective in acid environments. Therefore, it should be fed into the mineralized zone prior to injecting acid. It should be injected as a water solution or fed into wells through a special pipe line extending to the well screen depth. The later method is preferable, since the solubility of oxygen increases with increasing hydrostatic pressure which increases under the fluid column in the well.
The predominant form of uranium in acid solutions is the uranyl trisulphate complex [UO2(SO4)3]4–. This uranium complex is readily adsorbed by anionic-exchange resins. All sulphate complexes in the solution are in equilibrium with each other.
The necessity of using an oxidant in the sulphuric acid leaching of uranium should be determined by quantitative evaluation of the results of alternative tests conducted at the site.
Acid consumption is generally determined by the interaction of acid with non-uranium minerals of the host rock. The acid method becomes unprofitable as the carbonate content increases due to increased acid consumption (each percent of CaCO3 requires one percent of H2SO4 for a complete reaction). The total amount of host substrate dissolved in solution from the ore zone generally should not exceed 0.5–1%. The acid consumption in the reaction with the ore and barren rock varies from 7–8 to 25–30kg per ton of ore mass, depending on the mineral composition.

10
1.3.3. Chemical reactions in alkaline leaching
Alkaline (carbonate) leaching is based on the ability of the hexavalent uranium to form very soluble complexes in weakly alkaline media. The ions Na+, K+, NH4
+, Ca2+ and Mg2+ act as cations. The anion is present as uranyl tricarbonate [UO2(CO3)3]4– or uranyl dicarbonate [UO2(CO3)2]2-. The tetravalent uranium compounds cannot be recovered by carbonate reactants without adding an oxidant. This should be directly introduced into the ore zone together with the carbonate solution. The leaching is generally carried out by addition of bicarbonate (HCO3) salts and carbon dioxide gas. The carbon dioxide reacts with the natural carbonates in the host rock to generate dissolved bicarbonates and carbonates at a neutral or slightly alkaline pH. The equations of the reactions for the leaching of uranium with sodium salts are presented below:
UO2 + 1/2O2 = UO3
UO3 + 2Na4CO3 = (Na4)2 [UO2(CO3)2] + H2O
UO3 + 2Na4CO3 = (Na4)4[UO2(CO3)3] + H2O
The application of sodium and potassium salts is limited due to swelling of some clay minerals which reduce permeability. Hence, preference is primarily given to addition of carbon dioxide without controlling pH.
Alkaline (bicarbonate) leaching is generally used in carbonate rock where acid consumption is high and, as a result, sulphuric acid leaching is unprofitable. The presence of sulphides, for example pyrite, may result in harmful impurities entering the carbonate leaching solution:
2FeS2 + 8 Na2CO3 + 7 1/2 O2 + 7H2O � 2Fe(OH)3� + 4 Na2SO4 + 8NaHCO3
If the sulphide concentration exceeds 2–4%, carbonate leaching becomes unprofitable, and the risk of gypsum (CaSO4•2H2O) precipitation becomes very high. This can cause irreversible plugging of the host rock.
In contrast to an acid system, oxygen slowly oxidizes tetravalent uranium in an alkaline environment. The dissolved oxygen concentration in the injection fluid is limited by its solubility, and hence, by the available hydrostatic pressure on the host rock. As a result, the carbonate leaching can benefit from using hydrogen peroxide (H2O2) as a means to increase the concentration of oxygen delivered to the ore deposit. In the carbonate environment, this compound easily decomposes and releases oxygen, which oxidizes tetravalent uranium to the hexavalent state. (However, the high cost of H2O2 may make its use uneconomic). The alkaline reactants are not consumed in the reaction with carbonate minerals. Neither do they react in significant amounts with silicate and alumo-silicate minerals, which commonly form the main ore host. In addition to the sulphides, the carbonate reactants are consumed (except the uranium carbonate complexes) by interactions with sulphates (gypsum, anhydride), phosphates, organic matter, and other minerals. During leaching, carbonate is partially transforms to bicarbonate — another complexing agent for hexavalent uranium. Oxygen, in interaction with minerals of barren rock, is mainly consumed by oxidizing pyrite and other sulphide minerals. However, such metals as molybdenum and vanadium, if present, will also consume substantial quantities of oxygen.
11
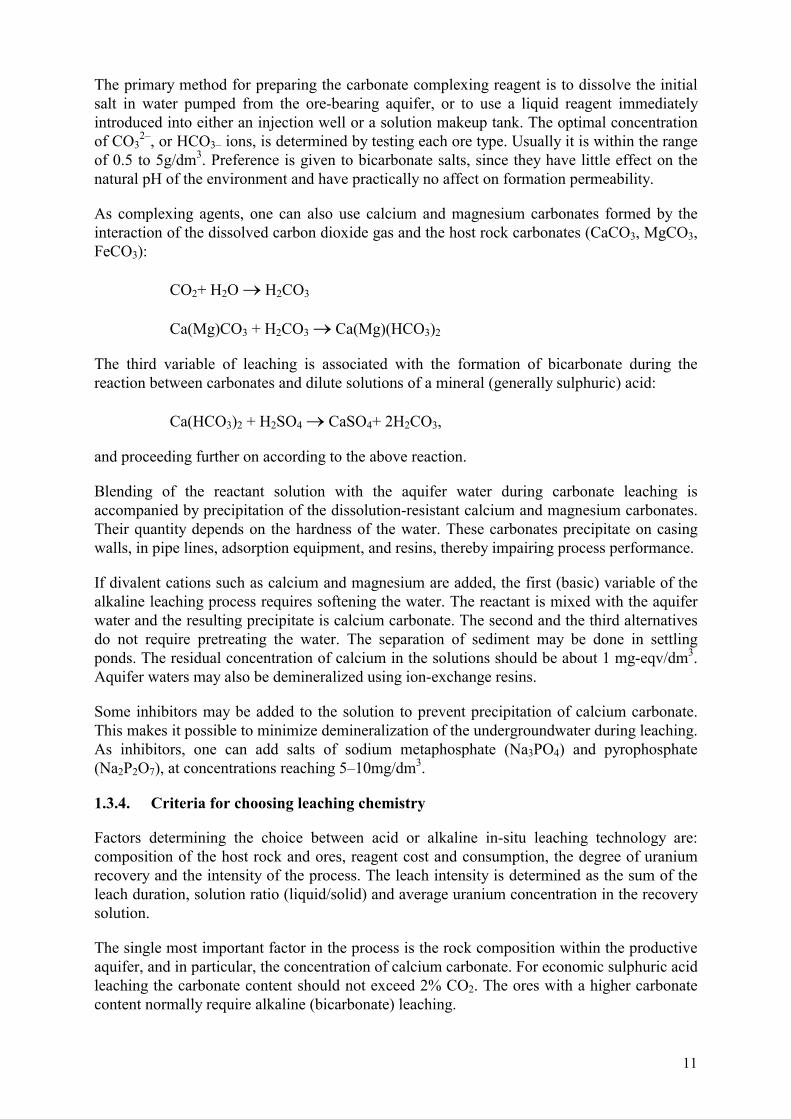
The primary method for preparing the carbonate complexing reagent is to dissolve the initial salt in water pumped from the ore-bearing aquifer, or to use a liquid reagent immediately introduced into either an injection well or a solution makeup tank. The optimal concentration of CO3
2–, or HCO3– ions, is determined by testing each ore type. Usually it is within the range of 0.5 to 5g/dm3. Preference is given to bicarbonate salts, since they have little effect on the natural pH of the environment and have practically no affect on formation permeability.
As complexing agents, one can also use calcium and magnesium carbonates formed by the interaction of the dissolved carbon dioxide gas and the host rock carbonates (CaCO3, MgCO3, FeCO3):
CO2+ H2O � H2CO3
Ca(Mg)CO3 + H2CO3 � Ca(Mg)(HCO3)2
The third variable of leaching is associated with the formation of bicarbonate during the reaction between carbonates and dilute solutions of a mineral (generally sulphuric) acid:
Ca(HCO3)2 + H2SO4 � CaSO4+ 2H2CO3,
and proceeding further on according to the above reaction.
Blending of the reactant solution with the aquifer water during carbonate leaching is accompanied by precipitation of the dissolution-resistant calcium and magnesium carbonates. Their quantity depends on the hardness of the water. These carbonates precipitate on casing walls, in pipe lines, adsorption equipment, and resins, thereby impairing process performance.
If divalent cations such as calcium and magnesium are added, the first (basic) variable of the alkaline leaching process requires softening the water. The reactant is mixed with the aquifer water and the resulting precipitate is calcium carbonate. The second and the third alternatives do not require pretreating the water. The separation of sediment may be done in settling ponds. The residual concentration of calcium in the solutions should be about 1 mg-eqv/dm3. Aquifer waters may also be demineralized using ion-exchange resins.
Some inhibitors may be added to the solution to prevent precipitation of calcium carbonate. This makes it possible to minimize demineralization of the undergroundwater during leaching. As inhibitors, one can add salts of sodium metaphosphate (Na3PO4) and pyrophosphate (Na2P2O7), at concentrations reaching 5–10mg/dm3.
1.3.4. Criteria for choosing leaching chemistry
Factors determining the choice between acid or alkaline in-situ leaching technology are: composition of the host rock and ores, reagent cost and consumption, the degree of uranium recovery and the intensity of the process. The leach intensity is determined as the sum of the leach duration, solution ratio (liquid/solid) and average uranium concentration in the recovery solution.
The single most important factor in the process is the rock composition within the productive aquifer, and in particular, the concentration of calcium carbonate. For economic sulphuric acid leaching the carbonate content should not exceed 2% CO2. The ores with a higher carbonate content normally require alkaline (bicarbonate) leaching.

12
Where the carbonate content is less than 2%, H2SO4 leaching technology may be preferred due to the accelerated kinetics of leaching (with the uranium recovery being 80-90%, versus 60-70% for carbonate reactants), a liquid to solids ratios of 1 to 3 for acid, as compared with ratios of 4 to 6 in alkaline systems, and a higher uranium concentration in the recovered solution. In addition, use of chemical oxidants can be minimized if sufficient natural ferric ion (Fe+3) is available. There are also a number of other elements that may be recovered, provided such recovery is economically justified. The presence of these other metals may, however, interfere with the recovery of a clean, saleable uranium product.
One serious drawback of sulphuric acid leaching is the necessity to use corrosion-resistant equipment and pipelines. This is especially costly when the mineralization occurs in deep deposits. Other advantages and disadvantages specific for both leaching methods are given at the beginning of this chapter. From the point of view of environmental impacts, it is difficult to give preference to either leaching system without first conducting an environmental impact assessment. Sulphuric acid leaching leads to formation of several compounds in the groundwater. Their migration, however, is limited by the neutralization of acid and also by other processes related to natural attenuation. Carbonate leaching introduces substances (e.g. Ra and Se) to the solution which could migrate for fairly long distances in the weakly alkaline media. However, in the USA, where only oxygen and CO2 technology is used, this risk is controlled by the regulatory requirement of restoring groundwater to pre-mine conditions following mining.
In ISL practice there are some examples (i.e. in Uzbekistan) of successful application of weak sulphuric acid solutions (as low as .3 g/dm3 H2SO4) for leaching carbonate-bearing ores. The leaching is possible due to the bicarbonate effect taking place in reactions of the acid with the rock carbonates. At present, the method is not well documented.
When choosing a leaching system, one should consider the possibility of the recovery of associated by-products (rhenium, vanadium, molybdenum, selenium, etc.). If necessary, a feasibility study may be carried out and the production cost determined for each of the potential by-products.
The influence of geological and hydrogeological factors on the potential and efficiency of the sulphuric acid leaching method are described in Section 2.2.
1.4. THEORETICAL BACKGROUND OF THE URANIUM ISL PROCESS
1.4.1. Principal processes for ISL
Unlike conventional mining of uranium, ISL recovers the uranium in a solution rather than in ore. In contrast to hydrometallurgical processing of ore in specialized plants, ISL is conducted in the natural environment. This does not involve elevated temperatures and pressures, concentrated reactants, and other controlled conditions used to intensify the transfer of the metals into solution.
The only viable application of ISL is uranium recovery from ores confined to water saturated unconsolidated sandstone sediments. A diagram showing a process flow sheet for uranium leaching is given in Figure 1.3.

13
FIG. 1.3. Flow sheet for in situ leaching of uranium from water saturated, permeable sandstone deposits.
To provide a stable rate of uranium production, the ISL wellfield units should be placed in production in a systematic order. While some units are being leached, others are being prepared for production. When one unit is undergoing passive oxidation, another is in the terminal leach phase and another is in reclamation. Figure 1.4 shows a simplified flow sheet with stage-wise introduction of the wellfield blocks into the operating, leaching and decommissioning phases.
1.4.2. General mechanism of ISL in unconsolidated sedimentary deposits
1.4.2.1. ISL as a heterogeneous process
In-situ leaching by its nature involves a heterogeneous reaction proceeding at the interface of a solid (ore) and a liquid (leaching solution). It is the combination of several interrelated stages: “transport” of the leaching solution in the aquifer to the site of reaction; the chemical interaction; the transport of the ensuing products to the recovery well; and then pumping the fluid to the surface for subsequent treatment.
The absence of any of the stages (chemical or hydrodynamic) prevents the heterogeneous process from taking place. The process rate is dependent on the rate of the slowest stage. The reaction proceeds according to diffusion kinetics if the slowest stage is the mass transfer of the material into the fluid. If the chemical interaction between the materials is slower, then the reaction proceeds under the control of chemical kinetics.

14
FIG.1.4. Flow sheet for the in situ leach process.
When leaching with sulphuric acid solution, one has to deal with a heterogeneous process controlled by diffusion, where the convective diffusion of the solution along the ore bed is a determining value. For alkaline solutions, the reaction takes place in the mixed area of control between diffusion and kinetic mechanisms. Should the diffusion distance increase, the process would gradually shift toward diffusion rather than kinetic control.
Migration of the material from the leaching solution to the mineral surface and then into an ore particle, as well as along the reverse path, is determined by the laws of molecular diffusion (Fick’s first and second laws). Thus, the material transfer in ISL is controlled by two simultaneous processes — molecular diffusion and convection of a fluid within a layer.
15
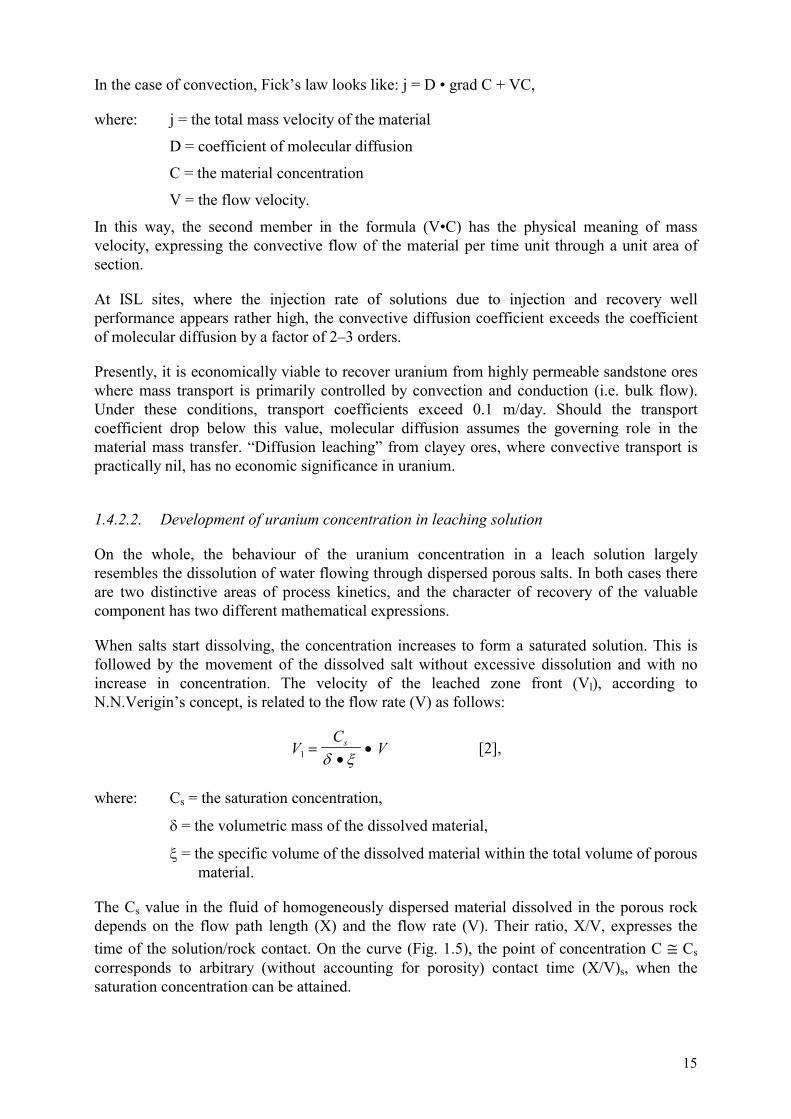
In the case of convection, Fick’s law looks like: j = D • grad C + VC,
where: j = the total mass velocity of the material
D = coefficient of molecular diffusion
C = the material concentration
V = the flow velocity.
In this way, the second member in the formula (V•C) has the physical meaning of mass velocity, expressing the convective flow of the material per time unit through a unit area of section.
At ISL sites, where the injection rate of solutions due to injection and recovery well performance appears rather high, the convective diffusion coefficient exceeds the coefficient of molecular diffusion by a factor of 2–3 orders.
Presently, it is economically viable to recover uranium from highly permeable sandstone ores where mass transport is primarily controlled by convection and conduction (i.e. bulk flow). Under these conditions, transport coefficients exceed 0.1 m/day. Should the transport coefficient drop below this value, molecular diffusion assumes the governing role in the material mass transfer. “Diffusion leaching” from clayey ores, where convective transport is practically nil, has no economic significance in uranium.
1.4.2.2. Development of uranium concentration in leaching solution
On the whole, the behaviour of the uranium concentration in a leach solution largely resembles the dissolution of water flowing through dispersed porous salts. In both cases there are two distinctive areas of process kinetics, and the character of recovery of the valuable component has two different mathematical expressions.
When salts start dissolving, the concentration increases to form a saturated solution. This is followed by the movement of the dissolved salt without excessive dissolution and with no increase in concentration. The velocity of the leached zone front (Vl), according to N.N.Verigin’s concept, is related to the flow rate (V) as follows:
VC
Vs1 �
�
�
� � [2],
where: Cs = the saturation concentration,
� = the volumetric mass of the dissolved material,
� = the specific volume of the dissolved material within the total volume of porous material.
The Cs value in the fluid of homogeneously dispersed material dissolved in the porous rock depends on the flow path length (X) and the flow rate (V). Their ratio, X/V, expresses the time of the solution/rock contact. On the curve (Fig. 1.5), the point of concentration C � Cs corresponds to arbitrary (without accounting for porosity) contact time (X/V)s, when the saturation concentration can be attained.

16
FIG. 1.5. Concentration (C) of dissolved substance versus time (X/V) from initial solution/rock contact.
A similar situation is observed when uranium is leached from unconsolidated sediments by a reacting solution based on chemical interaction. This process is complicated by a host of other physical and chemical phenomena. This is however, a far more complex process than the simple dissolution of salts. Therefore in this case, it is more nearly correct to speak of attaining an equilibrium or steady state uranium concentration, Ceq in the leaching solution, rather than saturation.
At the initial stage of leaching, when the ratio X/V < (X/V)eq is observed, the process is largely determined by diffusion (the reactant diffusion from the fluid flowing through the ore followed with migration of the leached material to the ore surface). The uranium concentration in the solution is constantly increasing, the leaching zones have not yet been formed and the linear dependence of Vl on V are not established, the process parameters (liquid/solid ratio and specific reactant consumption) are much higher in comparison with the average values for the ore type (Fig. 1.6).
FIG. 1.6. Relation of liquid/solid (L:S) ratio and consumption of acid (P) in kg/t, versus flow distance (L) in ore. Shaded area is zone of unstable performance: solid line — P; dashed line — L:S; 1 and 2 are for Sample 1; 3 and 4 are for Sample 2.
17
When the concentration reaches equilibrium (C � Ceq) within the range X/V > (X/V)eq, the dependence of Vl on the flow rate V becomes linear, and the process parameters generally stabilize.
In view of the above, it is recommended that laboratory investigation carried out to establish process leaching parameters be conducted on large-scale models (columns, ground trays), where the process goes on within the range X/V > (X/V)eq (see chapter 5 for discussion). Experience shows that the optimal model length for the initial H2SO4 concentration of 10g/dm3 is 1–2 metres. In this case, inaccuracies will not exceed 5 to 10%. If the initial acid concentration is decreased to 5g/dm3, the column height can be reduced to 0.5–1.0m. At higher concentrations it should be increased accordingly.
The shortest period required to establish the uranium equilibrium concentration and leaching zones is generally 2 to 6 days (depending on the mineral composition of the ore, acid concentration and flow rate). For instance, the total leach time for a 10 g/dm3 H2SO4 solution, at L/S = 2 in a 2 metre long column, will be about 25 days. Under wellfield conditions, the leaching time should be extended in proportion to the travel distance of the solutions between the injection and recovery wells.
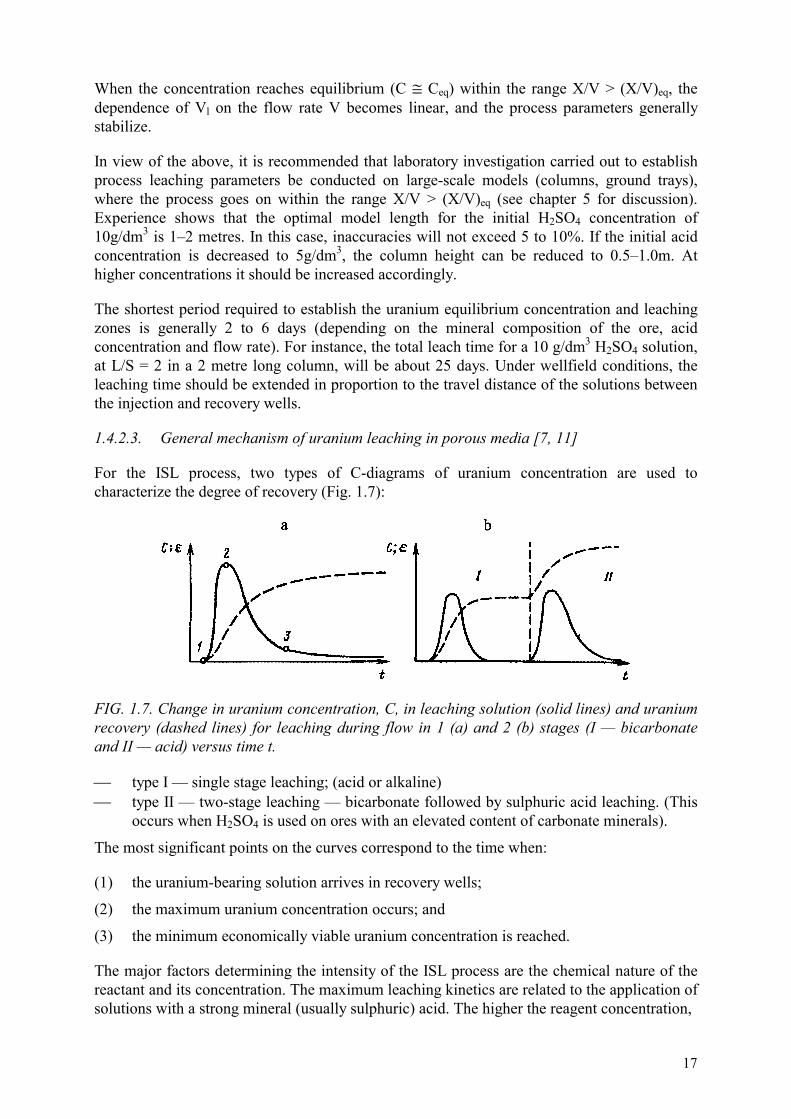
1.4.2.3. General mechanism of uranium leaching in porous media [7, 11]
For the ISL process, two types of C-diagrams of uranium concentration are used to characterize the degree of recovery (Fig. 1.7):
FIG. 1.7. Change in uranium concentration, C, in leaching solution (solid lines) and uranium recovery (dashed lines) for leaching during flow in 1 (a) and 2 (b) stages (I — bicarbonate and II — acid) versus time t.
�� type I — single stage leaching; (acid or alkaline) �� type II — two-stage leaching — bicarbonate followed by sulphuric acid leaching. (This
occurs when H2SO4 is used on ores with an elevated content of carbonate minerals).
The most significant points on the curves correspond to the time when:
(1) the uranium-bearing solution arrives in recovery wells;
(2) the maximum uranium concentration occurs; and
(3) the minimum economically viable uranium concentration is reached.
The major factors determining the intensity of the ISL process are the chemical nature of the reactant and its concentration. The maximum leaching kinetics are related to the application of solutions with a strong mineral (usually sulphuric) acid. The higher the reagent concentration,
18
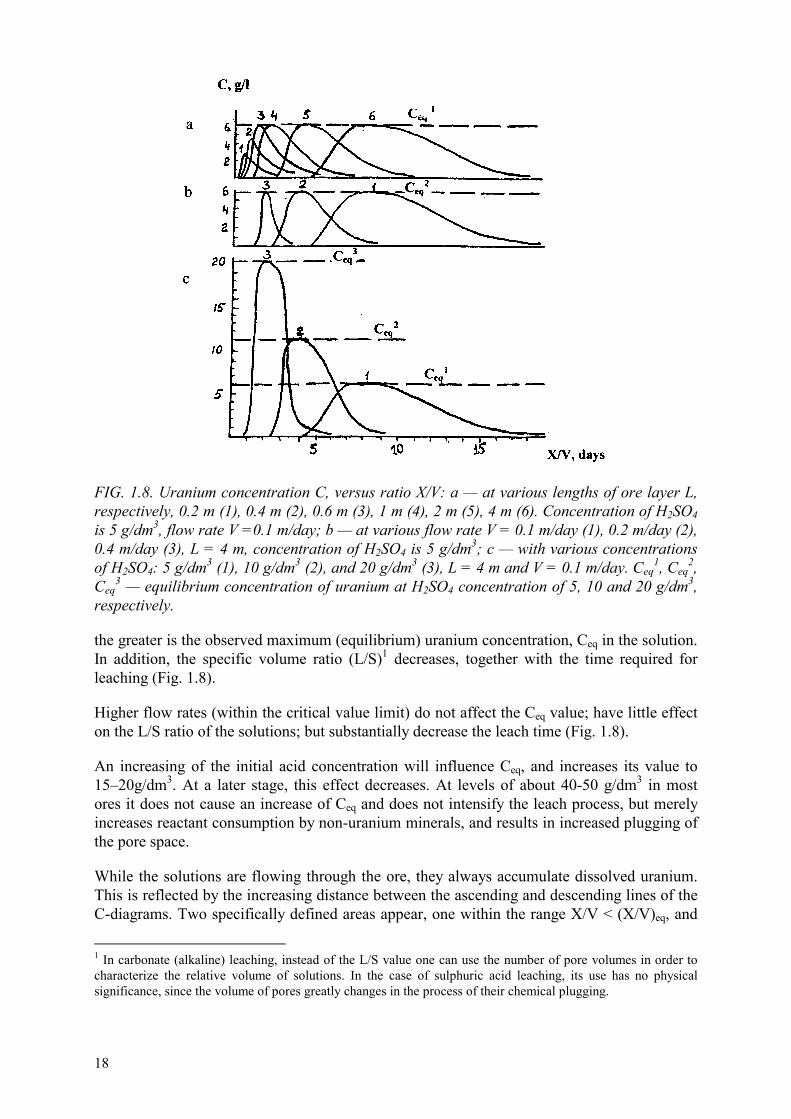
FIG. 1.8. Uranium concentration C, versus ratio X/V: a — at various lengths of ore layer L, respectively, 0.2 m (1), 0.4 m (2), 0.6 m (3), 1 m (4), 2 m (5), 4 m (6). Concentration of H2SO4 is 5 g/dm3, flow rate V =0.1 m/day; b — at various flow rate V = 0.1 m/day (1), 0.2 m/day (2), 0.4 m/day (3), L = 4 m, concentration of H2SO4 is 5 g/dm3; c — with various concentrations of H2SO4: 5 g/dm3 (1), 10 g/dm3 (2), and 20 g/dm3 (3), L = 4 m and V = 0.1 m/day. Ceq
1, Ceq2,
Ceq3 — equilibrium concentration of uranium at H2SO4 concentration of 5, 10 and 20 g/dm3,
respectively.
the greater is the observed maximum (equilibrium) uranium concentration, Ceq in the solution. In addition, the specific volume ratio (L/S)1 decreases, together with the time required for leaching (Fig. 1.8).
Higher flow rates (within the critical value limit) do not affect the Ceq value; have little effect on the L/S ratio of the solutions; but substantially decrease the leach time (Fig. 1.8).
An increasing of the initial acid concentration will influence Ceq, and increases its value to 15–20g/dm3. At a later stage, this effect decreases. At levels of about 40-50 g/dm3 in most ores it does not cause an increase of Ceq and does not intensify the leach process, but merely increases reactant consumption by non-uranium minerals, and results in increased plugging of the pore space.
While the solutions are flowing through the ore, they always accumulate dissolved uranium. This is reflected by the increasing distance between the ascending and descending lines of the C-diagrams. Two specifically defined areas appear, one within the range X/V < (X/V)eq, and
1 In carbonate (alkaline) leaching, instead of the L/S value one can use the number of pore volumes in order to characterize the relative volume of solutions. In the case of sulphuric acid leaching, its use has no physical significance, since the volume of pores greatly changes in the process of their chemical plugging.

19
the other X/V > (X/V)eq. In the first area, where the equilibrium concentration has not been reached, the curve maximum continuously increases. In the second — it remains constant throughout the whole period. The Ceq value is characteristic for the given ore and the initial concentration of the reactant.
The points on the C-diagrams corresponding to the beginning, maximum and completion of leaching, were used to obtain the relationship between their migration path (L) and time (t) (Fig. 1.9). The angle of slope of each plot reflects the velocity of corresponding leaching zones. Lines with a lower slope are numbered 3 and 4. They reflect the migration velocity of the leaching zone (in Fig. 1.9) with a uranium recovery of 80 and 90%. The time intervals shown on the X-axis as to
’ and to’’ correspond to the uranium leaching time in the initial
section of the ore layer. Thus, the movement rate of the leaching zone border (solution front) (Vl�), with a predetermined recovery degree (�), will comprise: Vl� = L/(t — to).
FIG. 1.9. Distance of solution movement L, with initial (1), maximum (2) and final concentration of uranium in the solution, corresponding to recovery of 80% (3), and 90% (4), of uranium versus time t.
From this relation, the length of the leached zone at the moment t after the beginning of the process will be determined as L = Vl�/(t – to). The value to is generally measured in hours or a few days, and is therefore applied only under laboratory conditions. For ISL wellfields, where the process continues for months and years, a simplified equation is applied: L = Vl� • t. The leaching site is subdivided into three zones: non-leached, active leaching, and depleted [7, 11.].
In sulphuric acid leaching, the precipitation of the dissolved uranium can occur due to acid neutralization. This creates a mobile zone of secondary enrichment behind the leach solution front. The uranium is repeatedly dissolved as fresh acid arrives and is again precipitated, and so on. As a result, the uranium enriched leach solutions can noticeably lag behind the solution flow in the ore-bearing layer.

20
FIG. 1.10. Changing uranium concentration C, in H2SO4 solution during progressive movement of leaching zone through ore-bearing sands: 1 — uranium bearing zone; 2 — zone of secondary enrichment; 3 — zone with equilibrium concentration of uranium in solution, 4 — zone of active leaching, 5 — zone depleted in uranium. Arrow indicates flow direction.
FIG. 1.11. Rate of movement of leach zone boundaries (vl) versus fictitious (without accounting for porosity) flow rate (v) of the solution for various levels of recovery (%): 1–0 (start of leaching), 2–10, 3–30, 4–50, 5–70, 6–90.
The solutions with a concentration equal to Ceq, gradually permeate the ore without capturing any additional uranium. Active leaching takes place due to the passage of succeeding acid-bearing solutions. In the diagram, this is shown by the increasing lag of the descending line representing the uranium concentration on the C-diagram (Fig. 1.10).
Figure 1.11 shows the relationship of the velocity of the border at the predetermined recovery level and arbitrary flow rate (without accounting for media porosity). The latter is mathematically expressed as a bundle of straight lines originating at the origin: Vl� = ���• V, where �� is the proportionality factor. It is a constant value for the given ore with fixed
21
uranium content and uniform concentration of acid. The linear dependence remains unchanged for other reactants, as well as for both stages of bicarbonate-acid leaching (type II above). The mineral composition of the ores and barren rock notably affects the rate of sulphuric acid leaching and the parameters of the process. The most favourable results are observed in ore-bearing sands composed of quartz and feldspar/quartz; and the least favourable — in acid-consuming sands with an elevated CaCO3 content. The above relationships have been established under controlled laboratory tests of composite core samples of sandstone type deposits of major uranium provinces [7].
In natural environments one has to deal with non-uniform media. This influences the geologic-hydrogeologic parameters with respect to both the horizontal and vertical sections of mineralized horizons. Any estimate related to the natural environment (including geotechnological evaluation) requires simple assumptions of these conditions and requires that average parameters are adopted.
For instance, the average concentration of ISL recovered metal in the solution, Cav is determined by the formula [7, 11]:
CM K T
KT L Smg dmav
o o
o�
� � �
�
�
�
/( / )102 3
where: � = the recovery degree (%)
M = the metal content in the ore (%)
Ko = the permeability conductivity of the ore (m/day)
K = the permeability conductivity of the host formation (m/day)
To = the ore thickness (m)
T = the effective thickness of aquifer (m)
L/So = the liquid/solid ratio adopted for the given ore.
For the case where the ore fills the mineralized aquifer thickness (To = T and Ko = K) the formula is simple:
CM SL
mg dmavo
�
� �
�
�
102 3( / )
Here the uranium concentration in the solution corresponds to the experimental value obtained in columns loaded with average ore X/V > (X/V)eq. Generally, however, ore comprises only a small portion of a host aquifer, and the solution is diluted. The above formula makes it possible to estimate the amount of dilution. Some examples are known where the ore deposit has been successfully divided into separate zones. The above form may then account for leaching portions of the uranium ore zone.
22
1.5. CHARACTERISTIC FEATURES OF SOLUTION FLOW IN ISL
1.5.1. Physical properties of solutions affecting migration in the aquifer; density stratification in the aquifer
The solution flow in porous media is governed by the basic law of underground hydrodynamics (Darcy’s law) [14]:
Q F S H L� � �
�
�/
where: Q = the flow rate, F = the cross section area, S = the medium penetration coefficient, � and � = density and viscosity of the fluid, H = the pressure drop across length L,
S K hydraulic conductivity�
�� �( )
According to Darcy’s equation, the physical properties of a fluid which influence flow in a porous medium are described by its density (�) and viscosity (�). The combined effect of density and viscosity is kinematic viscosity = �/� The value in the ISL process is mainly determined by the content of total dissolved solids (TDS) in the solution, which, in turn, affects the density and viscosity. During the ISL process considerable changes to the TDS take place. This is particularly true at the beginning of leaching when the pore water is replaced by the reactant (acid) solution. Therefore, the physical properties of fluid are variable.
The effect of temperature, and especially pressure, on the physical properties of a liquid are of less importance than the amount of TDS. The TDS is determined by the initial reactant (acid) concentration and mainly influences the solution viscosity (see Table 1.4). The density of the fluid is little affected by temperature and pressure. For instance, when the temperature increases from 5o to 20oC, the solution density decreases by only 0.2%.
When the temperature rises from 10o to 40oC the kinematic viscosity decreases by a factor of 2. As a result, the solution flow rate through porous media proportionately increase and the leaching process becomes more intensive. Thus, a higher groundwater temperature or artificial heating of the solutions will favourably affect the entire process.
Because of density and viscosity changes, the temperature factor can change the effective permeability of the productive horizon. The temperature correction (TC) used to relate the hydraulic conductivity (K) from the laboratory settings to the natural environment is calculated by Poiseuille’s formula:
TC = I + 0.0337t + 0.000221t2
where: t = temperature, oC.
The tests results relate to the initial aquifer temperature as in the formula:
Kinitial = Ktest • TCinitial/TCtest
where Kinitial and Ktest are respectively the hydraulic conductivities at the required and tested
absolute temperatures, TCinitial and TCtest = temperature corrections for the same conditions.
23
For convenience, temperature correction values, determined with Poiseuille’s formula in the temperature range to from 0 to 50oC, are given in Table 1.5.
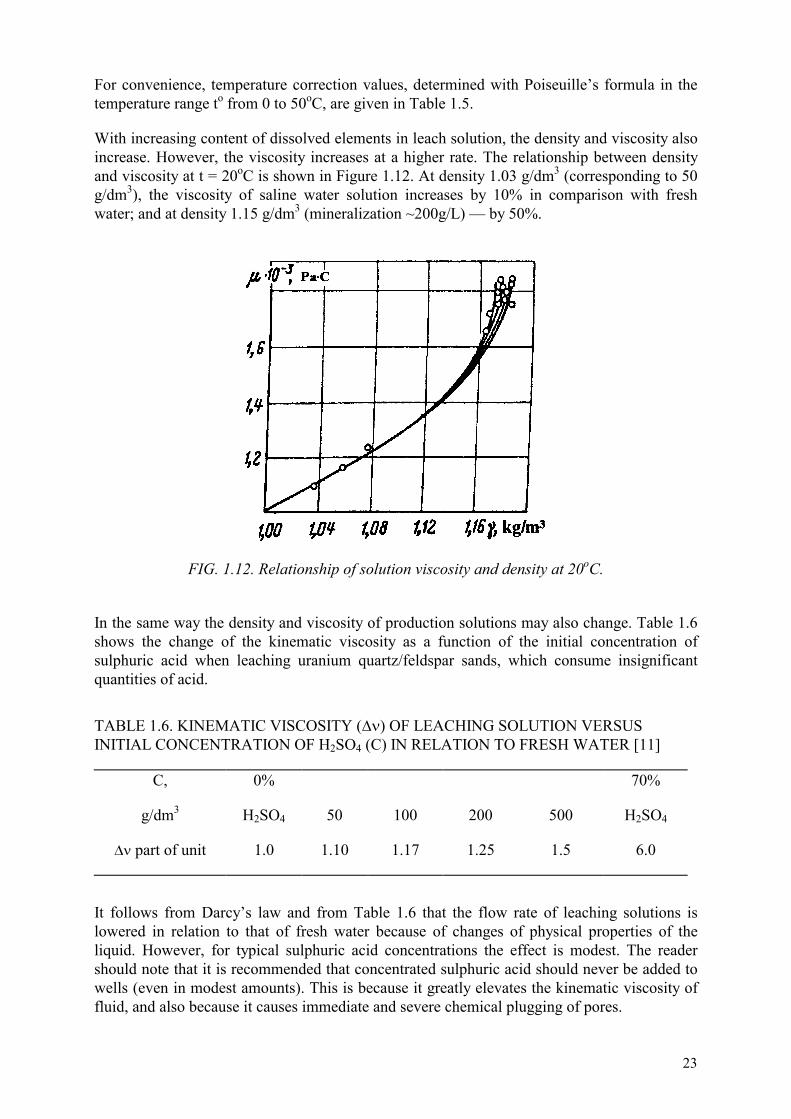
With increasing content of dissolved elements in leach solution, the density and viscosity also increase. However, the viscosity increases at a higher rate. The relationship between density and viscosity at t = 20oC is shown in Figure 1.12. At density 1.03 g/dm3 (corresponding to 50 g/dm3), the viscosity of saline water solution increases by 10% in comparison with fresh water; and at density 1.15 g/dm3 (mineralization ~200g/L) — by 50%.
FIG. 1.12. Relationship of solution viscosity and density at 20oC.
In the same way the density and viscosity of production solutions may also change. Table 1.6 shows the change of the kinematic viscosity as a function of the initial concentration of sulphuric acid when leaching uranium quartz/feldspar sands, which consume insignificant quantities of acid.
TABLE 1.6. KINEMATIC VISCOSITY (�) OF LEACHING SOLUTION VERSUS INITIAL CONCENTRATION OF H2SO4 (C) IN RELATION TO FRESH WATER [11]
C,
g/dm3
0%
H2SO4
50
100
200
500
70%
H2SO4
�� part of unit 1.0 1.10 1.17 1.25 1.5 6.0
It follows from Darcy’s law and from Table 1.6 that the flow rate of leaching solutions is lowered in relation to that of fresh water because of changes of physical properties of the liquid. However, for typical sulphuric acid concentrations the effect is modest. The reader should note that it is recommended that concentrated sulphuric acid should never be added to wells (even in modest amounts). This is because it greatly elevates the kinematic viscosity of fluid, and also because it causes immediate and severe chemical plugging of pores.

TAB
LE 1
.4. D
YN
AM
IC (�
) AN
D K
INEM
ATI
C (�
) VIS
CO
SITY
VER
SUS
TEM
PER
ATU
RE
(to ) AN
D P
RES
SUR
E [1
3]
Pr
essu
re, (
atm
)
1
50
100
to C
� ���
10-3
. Pa. C
�
10-6
m2 /c
�
10
-3. Pa
. C
�
10-6
m2 /c
�
10
-3. Pa
. C
�
10-6
m2 /c
0 1.
792
1.79
2 1.
781
1.77
6 1.
770
1.76
1
10
1.30
7 1.
307
1.30
1 1.
299
1.29
6 1.
290
20
1.00
2 1.
004
1.00
1 1.
001
1.00
0 0.
997
30
0.79
7 0.
801
0.79
7 0.
799
0.79
8 0.
798
40
0.65
3 0.
658
0.65
3 0.
657
0.65
4 0.
656
50
0.54
6 0.
553
0.54
7 0.
553
0.54
9 0.
553
60
0.46
6 0.
474
0.46
8 0.
475
0.46
9 0.
475
70
0.40
4 0.
413
0.40
6 0.
414
0.40
8 0.
415
80
0.35
5 0.
365
0.35
8 0.
367
0.36
1 0.
370
90
0.31
5 0.
326
0.31
9 0.
329
0.32
4 0.
334
100
0.28
2 0.
295
0.28
7 0.
299
0.29
3 0.
303
24

TAB
LE 1
.5. T
EMPE
RA
TUR
E C
OR
REC
TIO
NS
(TC
) FO
R D
ETER
MIN
ING
TH
E H
YD
RA
ULI
C C
ON
DU
CTI
VIT
Y [1
4]
to C
TC
to C
TC
to C
TC
to C
TC
to C
TC
1 1.
03
11
1.40
21
1.
80
31
2.26
41
2.
75
2 1.
07
12
1.44
22
1.
84
32
2.30
42
2.
80
3 1.
10
13
1.48
23
1.
88
33
2.35
43
2.
86
4 1.
14
14
1.52
24
1.
92
34
2.40
44
2.
91
5
1.17
15
1.
56
25
1.96
35
2.
45
45
2.96
6 1.
21
16
1.60
26
2.
00
36
2.50
46
3.
02
7 1.
25
17
1.64
27
2.
04
37
2.55
47
3.
07
8 1.
28
18
1.68
28
2.
08
38
2.60
48
3.
13
9 1.
32
19
1.72
29
2.
16
39
2.65
49
3.
18
10
1.40
20
1.
76
30
2.21
40
2.
70
50
3.24
25
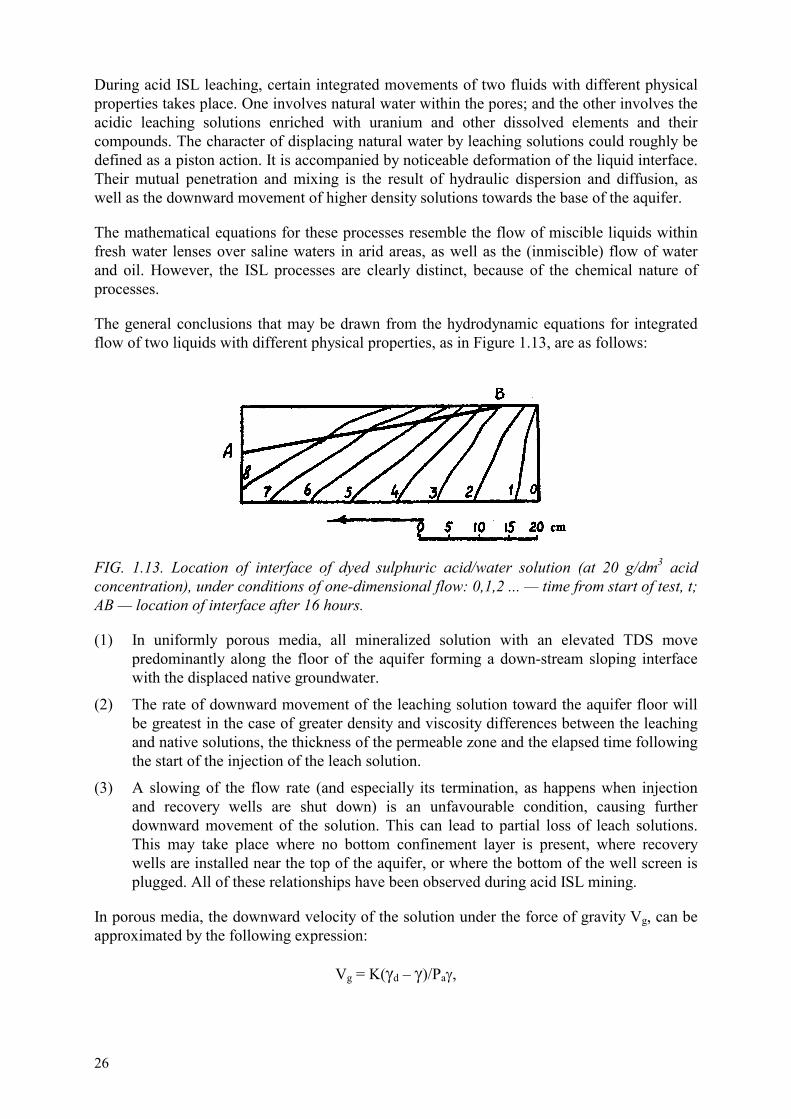
26
During acid ISL leaching, certain integrated movements of two fluids with different physical properties takes place. One involves natural water within the pores; and the other involves the acidic leaching solutions enriched with uranium and other dissolved elements and their compounds. The character of displacing natural water by leaching solutions could roughly be defined as a piston action. It is accompanied by noticeable deformation of the liquid interface. Their mutual penetration and mixing is the result of hydraulic dispersion and diffusion, as well as the downward movement of higher density solutions towards the base of the aquifer.
The mathematical equations for these processes resemble the flow of miscible liquids within fresh water lenses over saline waters in arid areas, as well as the (inmiscible) flow of water and oil. However, the ISL processes are clearly distinct, because of the chemical nature of processes.
The general conclusions that may be drawn from the hydrodynamic equations for integrated flow of two liquids with different physical properties, as in Figure 1.13, are as follows:
FIG. 1.13. Location of interface of dyed sulphuric acid/water solution (at 20 g/dm3 acid concentration), under conditions of one-dimensional flow: 0,1,2 ... — time from start of test, t; AB — location of interface after 16 hours.
(1) In uniformly porous media, all mineralized solution with an elevated TDS move predominantly along the floor of the aquifer forming a down-stream sloping interface with the displaced native groundwater.
(2) The rate of downward movement of the leaching solution toward the aquifer floor will be greatest in the case of greater density and viscosity differences between the leaching and native solutions, the thickness of the permeable zone and the elapsed time following the start of the injection of the leach solution.
(3) A slowing of the flow rate (and especially its termination, as happens when injection and recovery wells are shut down) is an unfavourable condition, causing further downward movement of the solution. This can lead to partial loss of leach solutions. This may take place where no bottom confinement layer is present, where recovery wells are installed near the top of the aquifer, or where the bottom of the well screen is plugged. All of these relationships have been observed during acid ISL mining.
In porous media, the downward velocity of the solution under the force of gravity Vg, can be approximated by the following expression:
Vg = K(�d – �)/Pa�,
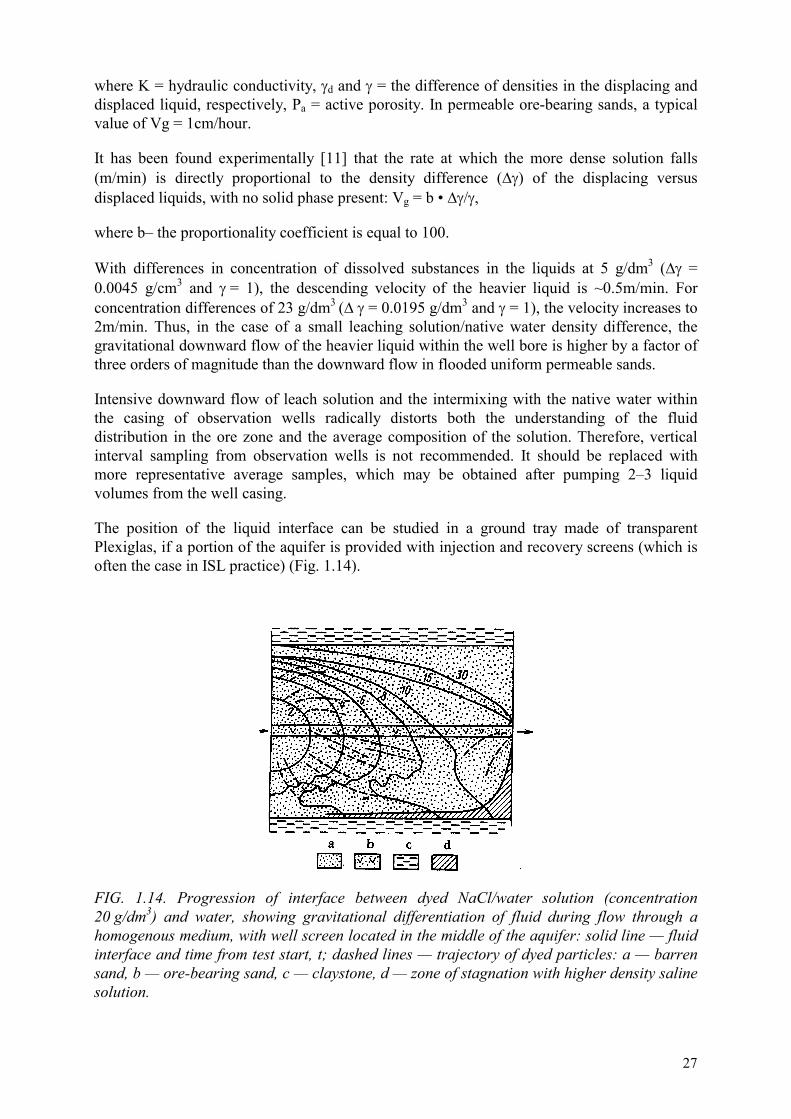
27
where K = hydraulic conductivity, �d and � = the difference of densities in the displacing and displaced liquid, respectively, Pa = active porosity. In permeable ore-bearing sands, a typical value of Vg = 1cm/hour.
It has been found experimentally [11] that the rate at which the more dense solution falls (m/min) is directly proportional to the density difference (��) of the displacing versus displaced liquids, with no solid phase present: Vg = b • ��/�,
where b– the proportionality coefficient is equal to 100.
With differences in concentration of dissolved substances in the liquids at 5 g/dm3 (�� = 0.0045 g/cm3 and ��= 1), the descending velocity of the heavier liquid is ~0.5m/min. For concentration differences of 23 g/dm3 (��� = 0.0195 g/dm3 and � = 1), the velocity increases to 2m/min. Thus, in the case of a small leaching solution/native water density difference, the gravitational downward flow of the heavier liquid within the well bore is higher by a factor of three orders of magnitude than the downward flow in flooded uniform permeable sands.
Intensive downward flow of leach solution and the intermixing with the native water within the casing of observation wells radically distorts both the understanding of the fluid distribution in the ore zone and the average composition of the solution. Therefore, vertical interval sampling from observation wells is not recommended. It should be replaced with more representative average samples, which may be obtained after pumping 2–3 liquid volumes from the well casing.
The position of the liquid interface can be studied in a ground tray made of transparent Plexiglas, if a portion of the aquifer is provided with injection and recovery screens (which is often the case in ISL practice) (Fig. 1.14).
FIG. 1.14. Progression of interface between dyed NaCl/water solution (concentration 20 g/dm3) and water, showing gravitational differentiation of fluid during flow through a homogenous medium, with well screen located in the middle of the aquifer: solid line — fluid interface and time from test start, t; dashed lines — trajectory of dyed particles: a — barren sand, b — ore-bearing sand, c — claystone, d — zone of stagnation with higher density saline solution.
28
The results indicate the following:
(1) Because of its higher density the solution flows to the drainage hole (the screen) and has a clear tendency to descend.
(2) After the dense solution reaches the water-confining bed, the formation of the sloping liquid interface takes place. The latter looks similar to the one in Figure 1.13.
(3) After some time, the upper portion of the flooded rock is filled with the dense solution.
(4) The most intensively coloured zone, corresponding to the concentrated solution, is formed at the bottom of the tray and adjacent to the discharge screen.
The study implies that using well screens where the completion interval is limited to the ore interval, makes it possible to decrease the acid consumption associated with treating the barren rock overlaying the orebody. Still, in this case, the bottom zone of the aquifer will be involved and some loss of solution may take place. This solution may have the highest uranium content.
Therefore, if the ISL site has no clearly indicated water-confining horizon below the ore zone, recovery well screens may be placed not only in the ore interval, but also in the aquifer below the ore zone. For the same reason, should there be no suitable lower water-confining strata, the injection and recovery wells should be arranged to accommodate this tendency for downward flow at 10 to 20m below the ore zone.
Where unfavourable hydrogeological conditions are present, the descending movement of leaching solutions under the force of gravity may require that special procedures be taken. Among such measures are the injection of various impermeable barriers using chemically active substances, or of salt solutions of higher density than that of the leaching solution [7, 11].
1.5.2. Solution flow with pore plugging
In ISL the movement of leaching solutions through porous pathways is, as a rule, accompanied by changing permeability of the formation. The extent and character of this change depends on the nature and concentration of the reactant, as well as on the mineralogical composition of rock. Unlike the native waters, which move under natural conditions of constant flow, the active chemical solution flows through a porous medium with changing permeability.
The evolution of a gas may also result in pore plugging by gas bubbles. Carbon dioxide, liberated in the reaction of acids with carbonates, is the most common gas to cause plugging.
Considering its effect on rock permeability, gas plugging can be quite noticeable. Even a small release of gas may lead to a noticeable deterioration of the flow properties of the formation. Figure 1.15 is a diagram of relative gas permeability [7, 11]. The curve shows, that with 50% of pore space filled with liquid, the phase permeability drops to 15% of the initial value, i.e. is reduced by a factor of 7. If the liquid fills less than 30% of the pore space, its flow stops entirely, and only gas can move.
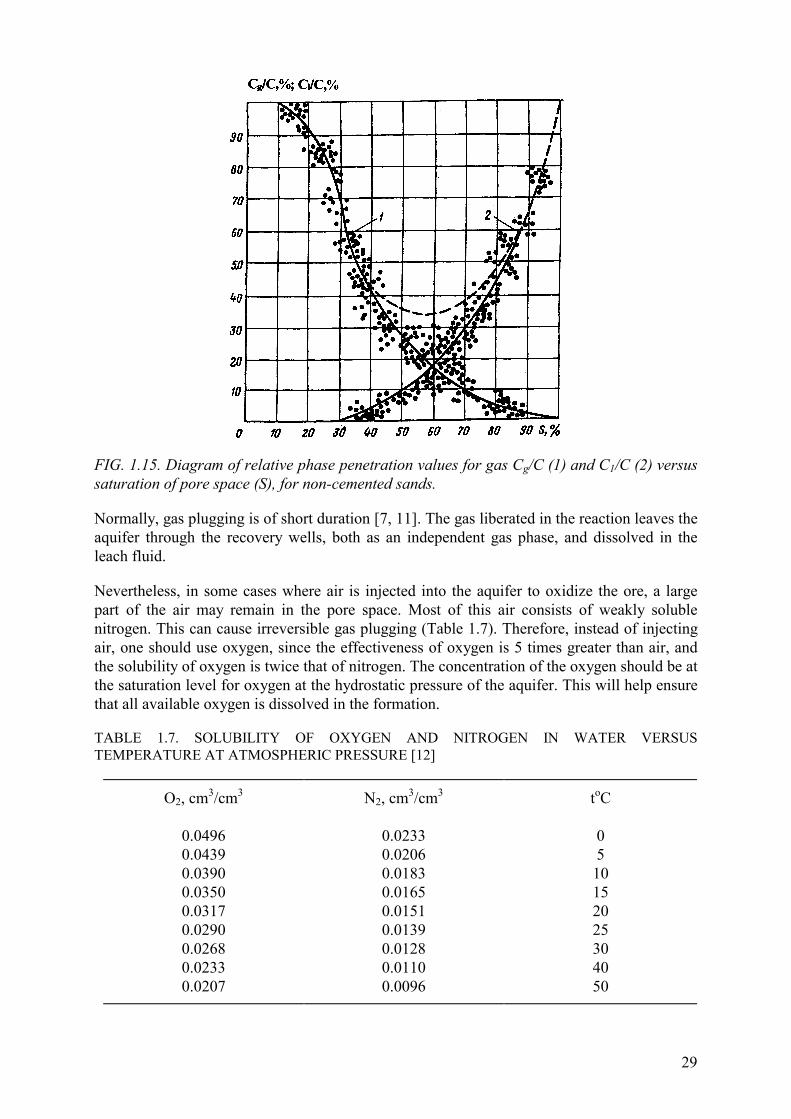
29
FIG. 1.15. Diagram of relative phase penetration values for gas Cg/C (1) and C1/C (2) versus saturation of pore space (S), for non-cemented sands.
Normally, gas plugging is of short duration [7, 11]. The gas liberated in the reaction leaves the aquifer through the recovery wells, both as an independent gas phase, and dissolved in the leach fluid.
Nevertheless, in some cases where air is injected into the aquifer to oxidize the ore, a large part of the air may remain in the pore space. Most of this air consists of weakly soluble nitrogen. This can cause irreversible gas plugging (Table 1.7). Therefore, instead of injecting air, one should use oxygen, since the effectiveness of oxygen is 5 times greater than air, and the solubility of oxygen is twice that of nitrogen. The concentration of the oxygen should be at the saturation level for oxygen at the hydrostatic pressure of the aquifer. This will help ensure that all available oxygen is dissolved in the formation.
TABLE 1.7. SOLUBILITY OF OXYGEN AND NITROGEN IN WATER VERSUS TEMPERATURE AT ATMOSPHERIC PRESSURE [12]
O2, cm3/cm3 N2, cm3/cm3 toC
0.0496 0.0439 0.0390 0.0350 0.0317 0.0290 0.0268 0.0233 0.0207
0.0233 0.0206 0.0183 0.0165 0.0151 0.0139 0.0128 0.0110 0.0096
0 5 10 15 20 25 30 40 50

30
The present chapter gives a more detailed description of the plugging caused by the most common gas encountered in ISL practice — carbon dioxide (CO2).
Its solubility in water at 20oC, expressed as a unit of mass, is 1.901g/dm3. In a 2.5% sulphuric acid solution, the CO2 solubility at 15.5oC is 1.7 g/dm3; and in a 5% sulphuric acid solution: 1.437 g/dm3.
With increasing temperature, gas solubility decreases (Tables 1.7, 1.8). Thus, at 19oC the CO2 solubility in a 9.25% H2SO4 solution is 0.84 cm3/cm3. The solubility is only 0.720 cm3/cm3 — at 25oC (atmospheric pressure).
The solubility of gas increases with increasing pressure, and approximately follows Henry’s law (Table 1.9). For most gases the noticeable deviation from the direct relationship is only observed at hydrostatic pressures of ten or more times atmospheric pressure.
TABLE 1.8. SOLUBILITY OF CO2 IN WATER VERSUS TEMPERATURE AT ATMOSPHERIC PRESSURE [12]
CO2, cm3/cm3 toC
0.89
0.72
0.54
0.44
20
28
40
50
TABLE 1.9. SOLUBILITY OF CO2 IN WATER VERSUS PRESSURE (P) AT TEMPERATURE +15oC [12]
CO2, cm3/cm3 P, (atm)
1.00
4.59
8.39
11.89
15.21
17.64
20.31
22.52
22.44
25.59
27.06
1
5
10
15
20
25
30
35
49
45
50
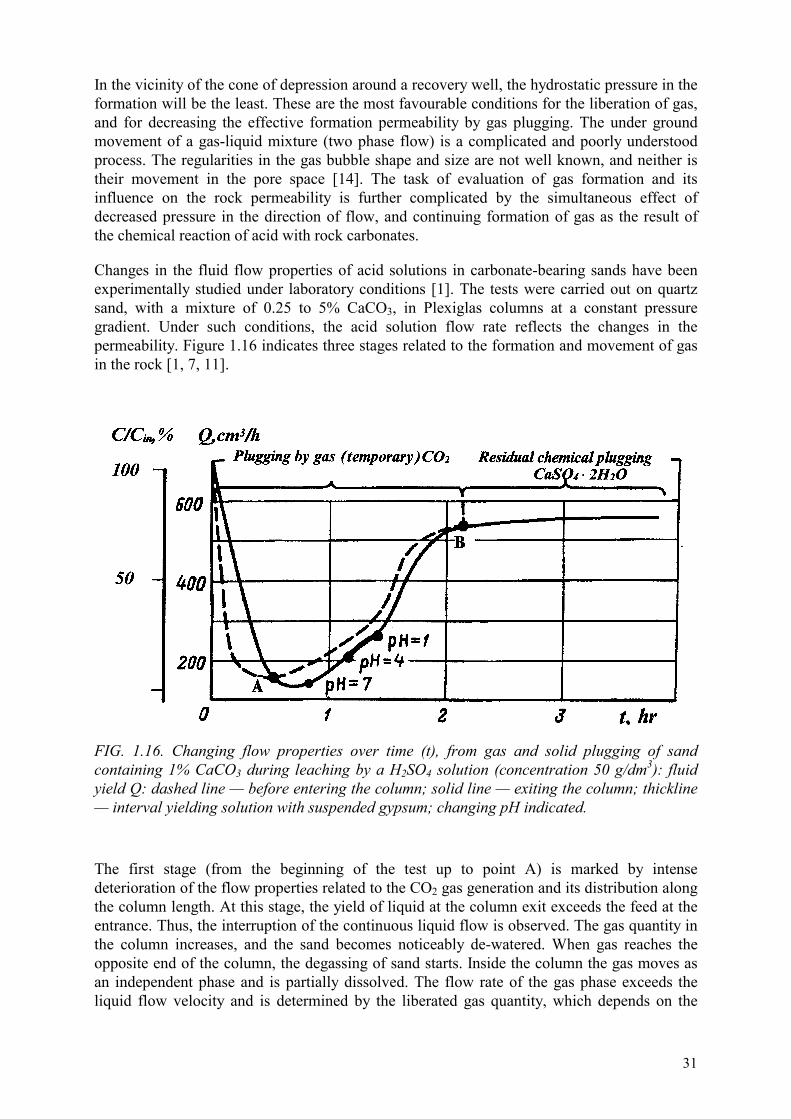
31
In the vicinity of the cone of depression around a recovery well, the hydrostatic pressure in the formation will be the least. These are the most favourable conditions for the liberation of gas, and for decreasing the effective formation permeability by gas plugging. The under ground movement of a gas-liquid mixture (two phase flow) is a complicated and poorly understood process. The regularities in the gas bubble shape and size are not well known, and neither is their movement in the pore space [14]. The task of evaluation of gas formation and its influence on the rock permeability is further complicated by the simultaneous effect of decreased pressure in the direction of flow, and continuing formation of gas as the result of the chemical reaction of acid with rock carbonates.
Changes in the fluid flow properties of acid solutions in carbonate-bearing sands have been experimentally studied under laboratory conditions [1]. The tests were carried out on quartz sand, with a mixture of 0.25 to 5% CaCO3, in Plexiglas columns at a constant pressure gradient. Under such conditions, the acid solution flow rate reflects the changes in the permeability. Figure 1.16 indicates three stages related to the formation and movement of gas in the rock [1, 7, 11].
FIG. 1.16. Changing flow properties over time (t), from gas and solid plugging of sand containing 1% CaCO3 during leaching by a H2SO4 solution (concentration 50 g/dm3): fluid yield Q: dashed line — before entering the column; solid line — exiting the column; thickline — interval yielding solution with suspended gypsum; changing pH indicated.
The first stage (from the beginning of the test up to point A) is marked by intense deterioration of the flow properties related to the CO2 gas generation and its distribution along the column length. At this stage, the yield of liquid at the column exit exceeds the feed at the entrance. Thus, the interruption of the continuous liquid flow is observed. The gas quantity in the column increases, and the sand becomes noticeably de-watered. When gas reaches the opposite end of the column, the degassing of sand starts. Inside the column the gas moves as an independent phase and is partially dissolved. The flow rate of the gas phase exceeds the liquid flow velocity and is determined by the liberated gas quantity, which depends on the
32
content of the interacting materials (CaCO3 and H2SO4). At the end of the first stage, the quantity of solution fed into the column becomes equal to the column discharge. This time (point A) corresponds to the maximum volume of the liberated gas within the rock. The pH value of the solution at the column exit is about 7.
During the second stage (i.e. between A and B), a gradual restoration of sand permeability takes place. The feed of liquid into the column exceeds the discharge. The pore space is filled with the solution. The rate of degassing exceeds the rate of gas generation. The reaction of the medium gradually becomes acid.
The third stage (to the right of point B) is characterised by no gas being present. The acid concentration reaches the initial value, and its interaction with the rock is over. The feed and discharge values coincide and become stabilized. At the end of the test, the final flow rate is a little lower than the initial rate, indicating an irreversible chemical plugging has occurred, relating to the precipitation of the nearly insoluble gypsum residue.
Among the carbonates, calcite (CaCO3) reacts most actively with sulphuric acid. Other carbonates interact more slowly with acid, which generally results in the liberation of less gas.
With the CaCO3 content below 0.2%, or by utilizing H2SO4 solutions with concentrations of less than 2 g/dm3, there should be no gas formation at atmospheric pressure. Under the aquifer conditions (especially under hydrostatic pressure conditions), the gas solubility increases in accordance to Henry’s law, or in direct proportion to the hydrostatic liquid pressure in the formation. Therefore, at a pressure of 10 atmospheres, the minimum concentration of sulphuric acid and calcium carbonate, which would not lead to any liberation of gas, can safely be raised by about 8.4 times. It should also be noted, that the gas remaining as an independent phase, under pressure (P), takes a smaller volume (V), in accordance to Boyle’s law (P • V=const). Using the relative value of pore space filled with gas and the diagram in Figure 1.15, one can obtain a general impression of the expected degradation of underground flow properties.
Chemical plugging usually results from the precipitation of chemical residues produced by sulphuric acid interacting with the host rock. The effect on the rock can be either reversible or irreversible. As a reversible (temporal) event, one can consider the plugging resulting from precipitation of aluminium and iron hydroxides.
As the pH value of the solution falls, the previously formed residue becomes soluble (first the iron hydroxide 2 + at pH<6, then the aluminium hydroxide at pH < 4–5, and then iron 3 + at pH<3), and the permeability of rock is restored. Still, cases have been observed, where under conditions of high iron contents in the rock and solutions (10–12g/dm3), and long distances between the injection and recovery wells, the hydroxide residue completely blocks the formation around the recovery well screens, thus causing their complete failure.
The irreversible chemical plugging is from the precipitation of gypsum. Gypsum has a very low solubility (about 2 g/dm3), which is practically independent of the pH value in diluted sulphuric acid solutions (Table 1.10).

33
TABLE 1.10. SOLUBILITY OF GYPSUM (CaSO4) IN H2SO4 SOLUTION AT +25oC [12]
H2SO4, g/dm3 CaSO4, g/dm3
0.0 (H2O only)
0.48
4.87
8.11
16.22
48.67
2.126
2.128
2.144
2.203
2.382
2.727
Any significant deposition of gypsum can be deferred until after some prolonged period of leaching. The plugging by gypsum occurs later than gas plugging. Its extent can be determined at the completion of leaching, after the liberation of CO2 and precipitation of metal hydroxides has stopped (see Fig. 1.16).
An evaluation of gas and chemical plugging (by gypsum) can be carried out under laboratory conditions using H2SO4 and HCl solutions of equivalent concentration (Fig. 1.17). The influence of gypsum residues on plugging is not great at the beginning of the test. During the first two stages it mainly occurs as a thin film of particles accumulated on the surface of the carbonate grains. This slows both the reaction and gas generation. During the third stage gypsum precipitation noticeably affects the reaction rate. The reaction of hydrochloric acid with the rock carbonates, which produces no gypsum, stops earlier than that of sulphuric acid (in Fig. 1.17 at 3 hours 45 minutes and 4 hours 45 minutes, accordingly).
FIG. 1.17. Changing flow properties of sand containing 1% CaCO3, with introduction of HCl (dashed line), or H2SO4 (solid line) of equivalent concentration: Q — yield at constant head gradient, t — time, at pH indicated in diagram.
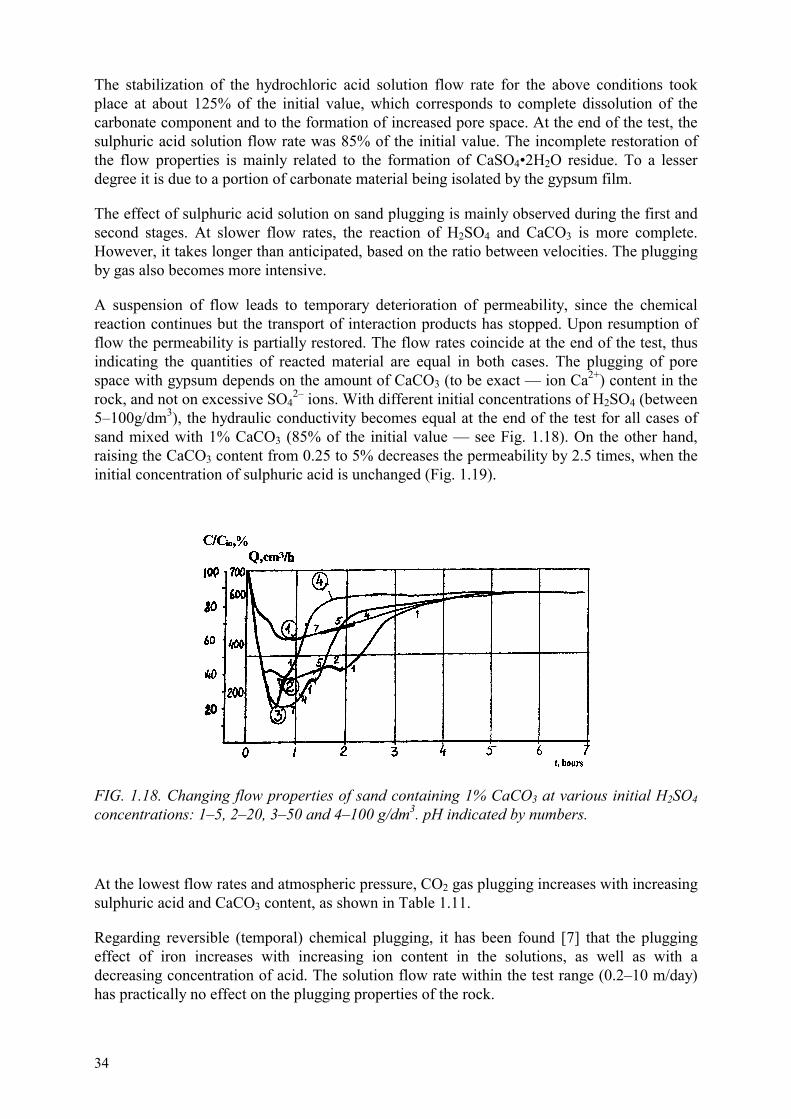
34
The stabilization of the hydrochloric acid solution flow rate for the above conditions took place at about 125% of the initial value, which corresponds to complete dissolution of the carbonate component and to the formation of increased pore space. At the end of the test, the sulphuric acid solution flow rate was 85% of the initial value. The incomplete restoration of the flow properties is mainly related to the formation of CaSO4•2H2O residue. To a lesser degree it is due to a portion of carbonate material being isolated by the gypsum film.
The effect of sulphuric acid solution on sand plugging is mainly observed during the first and second stages. At slower flow rates, the reaction of H2SO4 and CaCO3 is more complete. However, it takes longer than anticipated, based on the ratio between velocities. The plugging by gas also becomes more intensive.
A suspension of flow leads to temporary deterioration of permeability, since the chemical reaction continues but the transport of interaction products has stopped. Upon resumption of flow the permeability is partially restored. The flow rates coincide at the end of the test, thus indicating the quantities of reacted material are equal in both cases. The plugging of pore space with gypsum depends on the amount of CaCO3 (to be exact — ion Ca2+) content in the rock, and not on excessive SO4
2– ions. With different initial concentrations of H2SO4 (between 5–100g/dm3), the hydraulic conductivity becomes equal at the end of the test for all cases of sand mixed with 1% CaCO3 (85% of the initial value — see Fig. 1.18). On the other hand, raising the CaCO3 content from 0.25 to 5% decreases the permeability by 2.5 times, when the initial concentration of sulphuric acid is unchanged (Fig. 1.19).
FIG. 1.18. Changing flow properties of sand containing 1% CaCO3 at various initial H2SO4 concentrations: 1–5, 2–20, 3–50 and 4–100 g/dm3. pH indicated by numbers.
At the lowest flow rates and atmospheric pressure, CO2 gas plugging increases with increasing sulphuric acid and CaCO3 content, as shown in Table 1.11.
Regarding reversible (temporal) chemical plugging, it has been found [7] that the plugging effect of iron increases with increasing ion content in the solutions, as well as with a decreasing concentration of acid. The solution flow rate within the test range (0.2–10 m/day) has practically no effect on the plugging properties of the rock.
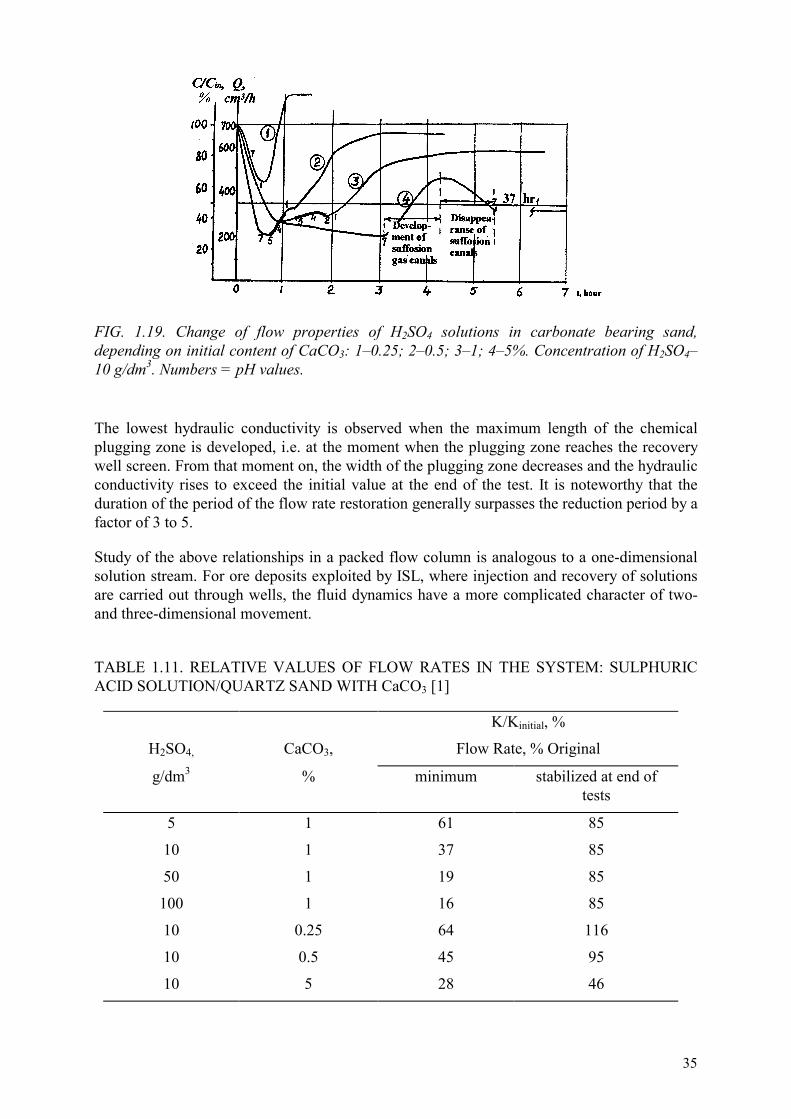
35
FIG. 1.19. Change of flow properties of H2SO4 solutions in carbonate bearing sand, depending on initial content of CaCO3: 1–0.25; 2–0.5; 3–1; 4–5%. Concentration of H2SO4–10 g/dm3. Numbers = pH values.
The lowest hydraulic conductivity is observed when the maximum length of the chemical plugging zone is developed, i.e. at the moment when the plugging zone reaches the recovery well screen. From that moment on, the width of the plugging zone decreases and the hydraulic conductivity rises to exceed the initial value at the end of the test. It is noteworthy that the duration of the period of the flow rate restoration generally surpasses the reduction period by a factor of 3 to 5.
Study of the above relationships in a packed flow column is analogous to a one-dimensional solution stream. For ore deposits exploited by ISL, where injection and recovery of solutions are carried out through wells, the fluid dynamics have a more complicated character of two- and three-dimensional movement.
TABLE 1.11. RELATIVE VALUES OF FLOW RATES IN THE SYSTEM: SULPHURIC ACID SOLUTION/QUARTZ SAND WITH CaCO3 [1]
K/Kinitial, %
H2SO4, CaCO3, Flow Rate, % Original
g/dm3 % minimum stabilized at end of tests
5 1 61 85
10 1 37 85
50 1 19 85
100 1 16 85
10 0.25 64 116
10 0.5 45 95
10 5 28 46

36
Figure 1.20 shows the location of a zone chemically plugged with iron hydroxides in a ground tray model of a hexagonal cell comprising three recovery (in the centre) and eight injection (along the periphery) wells. Because of symmetry, only one quarter of the test field was simulated. The relationships obtained can be extrapolated to natural conditions, taking into account local flow rates and mineralogical non-uniformity. The above relationships are expanded for a two-dimension flow regime as follows:
FIG. 1.20. Location of zone of chemical plugging of porous rock by formation of iron hydroxide, when it first reaches the recovery well (1), and at test end (2). The network shown is for flow through a homogeneous medium (without plugging).
In the test process, the zone of temporary chemical plugging by iron hydroxides moves in the flow direction. The location of the zone, as indicated by brownish Fe3+ hydroxides, at the moment it reaches the drainage holes (1), and at the end of the test (2), is shown in Figure 1.20. With the test going on, the plugged zone gradually increases and its rate of progress noticeably decreases as it leaves the outer boundary of the field.
By the end of the test, three clearly defined sites are delineated:
�� unleached rock with the initial hydraulic conductivity K1; �� partially plugged rock (at a pH~5–3) with a lower permeability K2; and �� leached rock with a higher than initial permeability K3. It should be noted that under natural conditions, the plugged zone width determined by the iron content of the rock and the solution, as well as by pH value, is generally much wider than is observed in the above experiment.
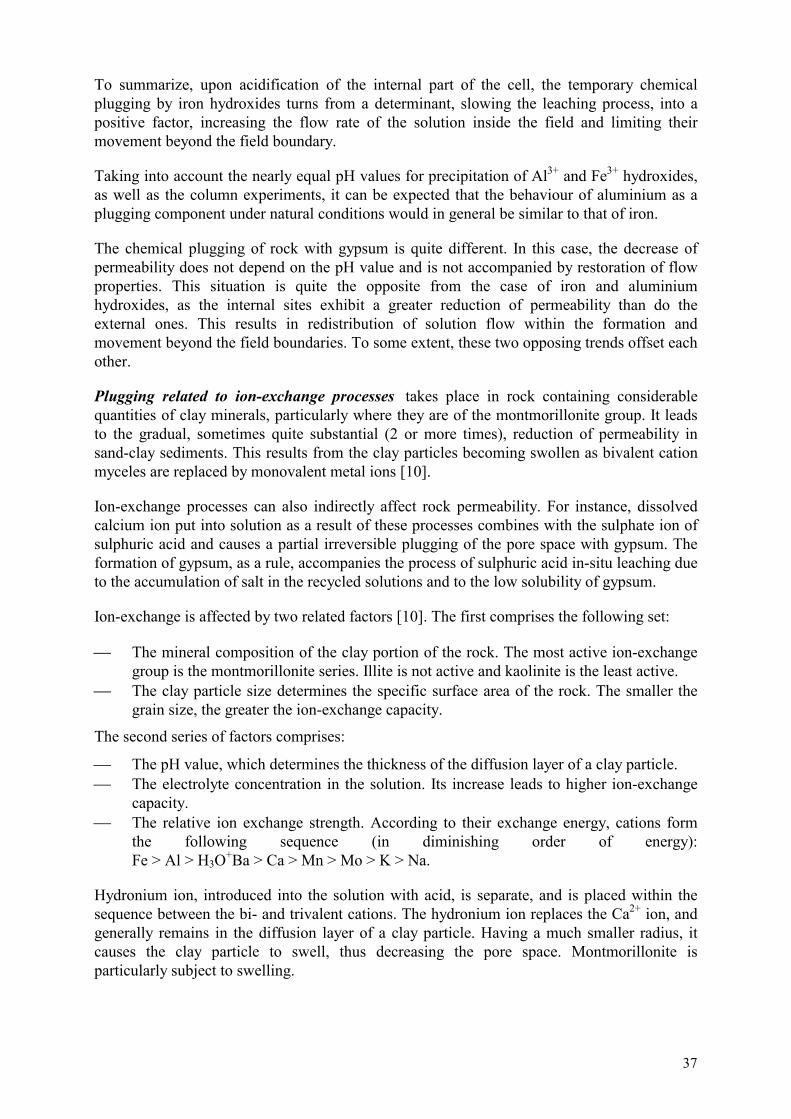
37
To summarize, upon acidification of the internal part of the cell, the temporary chemical plugging by iron hydroxides turns from a determinant, slowing the leaching process, into a positive factor, increasing the flow rate of the solution inside the field and limiting their movement beyond the field boundary.
Taking into account the nearly equal pH values for precipitation of Al3+ and Fe3+ hydroxides, as well as the column experiments, it can be expected that the behaviour of aluminium as a plugging component under natural conditions would in general be similar to that of iron.
The chemical plugging of rock with gypsum is quite different. In this case, the decrease of permeability does not depend on the pH value and is not accompanied by restoration of flow properties. This situation is quite the opposite from the case of iron and aluminium hydroxides, as the internal sites exhibit a greater reduction of permeability than do the external ones. This results in redistribution of solution flow within the formation and movement beyond the field boundaries. To some extent, these two opposing trends offset each other.
Plugging related to ion-exchange processes takes place in rock containing considerable quantities of clay minerals, particularly where they are of the montmorillonite group. It leads to the gradual, sometimes quite substantial (2 or more times), reduction of permeability in sand-clay sediments. This results from the clay particles becoming swollen as bivalent cation myceles are replaced by monovalent metal ions [10].
Ion-exchange processes can also indirectly affect rock permeability. For instance, dissolved calcium ion put into solution as a result of these processes combines with the sulphate ion of sulphuric acid and causes a partial irreversible plugging of the pore space with gypsum. The formation of gypsum, as a rule, accompanies the process of sulphuric acid in-situ leaching due to the accumulation of salt in the recycled solutions and to the low solubility of gypsum.
Ion-exchange is affected by two related factors [10]. The first comprises the following set:
�� The mineral composition of the clay portion of the rock. The most active ion-exchange group is the montmorillonite series. Illite is not active and kaolinite is the least active.
�� The clay particle size determines the specific surface area of the rock. The smaller the grain size, the greater the ion-exchange capacity.
The second series of factors comprises:
�� The pH value, which determines the thickness of the diffusion layer of a clay particle. �� The electrolyte concentration in the solution. Its increase leads to higher ion-exchange
capacity. �� The relative ion exchange strength. According to their exchange energy, cations form
the following sequence (in diminishing order of energy): Fe > Al > H3O+Ba > Ca > Mn > Mo > K > Na.
Hydronium ion, introduced into the solution with acid, is separate, and is placed within the sequence between the bi- and trivalent cations. The hydronium ion replaces the Ca2+ ion, and generally remains in the diffusion layer of a clay particle. Having a much smaller radius, it causes the clay particle to swell, thus decreasing the pore space. Montmorillonite is particularly subject to swelling.

38
The ion-exchange processes have little effect on the permeability of sandy-clay deposits, if the clay fraction is predominately kaolinite. However, the monovalent cations (Na+ in particular), when leached in sufficient quantity from rock by an acid solution, can also cause clay particle swelling.
On the other hand, the presence of a large number of trivalent cations (e.g. Fe3+) in the solution, decreases the thickness of the diffusion zone, thus maintaining the permeability of sand-clay rock in acid media (where no other form of plugging is taking place).
The utilization of Na2CO3 as a leaching agent can lead to significant plugging in sandy-clay sediments because the clay fraction swells under the influence of high concentrations of Na+ ion.
Mechanical plugging is generally observed in sandy sediments as the result of fines migration, or the feeding of solutions containing suspended particles, into the formation. Fines migration may result in both a greater permeability of rocks (by removal of particles) and its deterioration (by blocking the pores). When assessing the probability of fines plugging, one has to determine the critical values of the fluid flow rate, or the head gradient, at which the migration of formation particles starts.
In the case of highly-permeable rocks (sands), one often uses the critical or fracture pressure gradient, which is more convenient to determine.
The critical pressure gradient can be calculated from the formula: Jcr = (�–1)(1–p).
where: � = the density of the rock skeleton; p = porosity, fractions of unit.
For quartz sands with � = 2.68g/cm3 and p = 0.3, Jcr = 1.2.
Figure 1.21 shows that at the pressure gradient below critical, the flow properties remain unchanged. At higher Jcr values, they progressively deteriorate. Still, this formula does not take into account the particle size distribution and mineral composition of sands. The broader the range of particle size in the rock, the lower value it takes for fines migration to start (Fig. 1.22).
FIG. 1.21. Changing flow properties of sand at constant head gradient J, the value of which is both less, and greater than, that of the critical gradient (Jcr = 1.2).
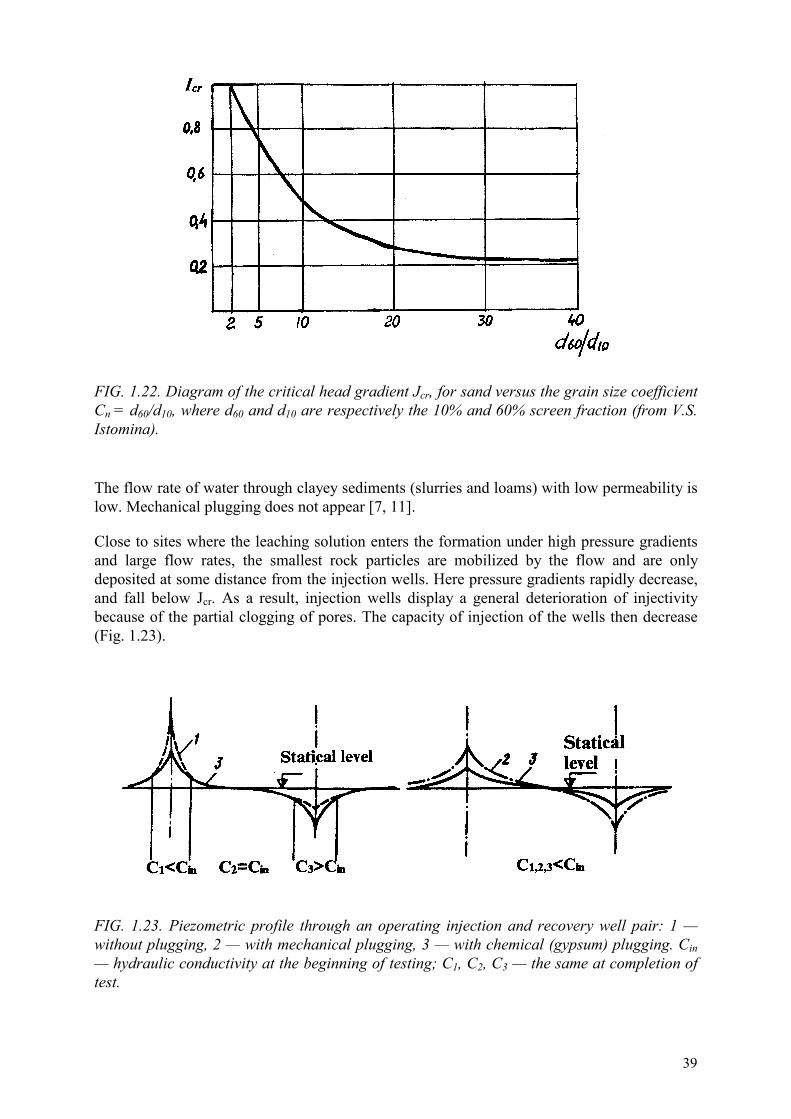
39
FIG. 1.22. Diagram of the critical head gradient Jcr, for sand versus the grain size coefficient Cn = d60/d10, where d60 and d10 are respectively the 10% and 60% screen fraction (from V.S. Istomina).
The flow rate of water through clayey sediments (slurries and loams) with low permeability is low. Mechanical plugging does not appear [7, 11].
Close to sites where the leaching solution enters the formation under high pressure gradients and large flow rates, the smallest rock particles are mobilized by the flow and are only deposited at some distance from the injection wells. Here pressure gradients rapidly decrease, and fall below Jcr. As a result, injection wells display a general deterioration of injectivity because of the partial clogging of pores. The capacity of injection of the wells then decrease (Fig. 1.23).
FIG. 1.23. Piezometric profile through an operating injection and recovery well pair: 1 — without plugging, 2 — with mechanical plugging, 3 — with chemical (gypsum) plugging. Cin — hydraulic conductivity at the beginning of testing; C1, C2, C3 — the same at completion of test.
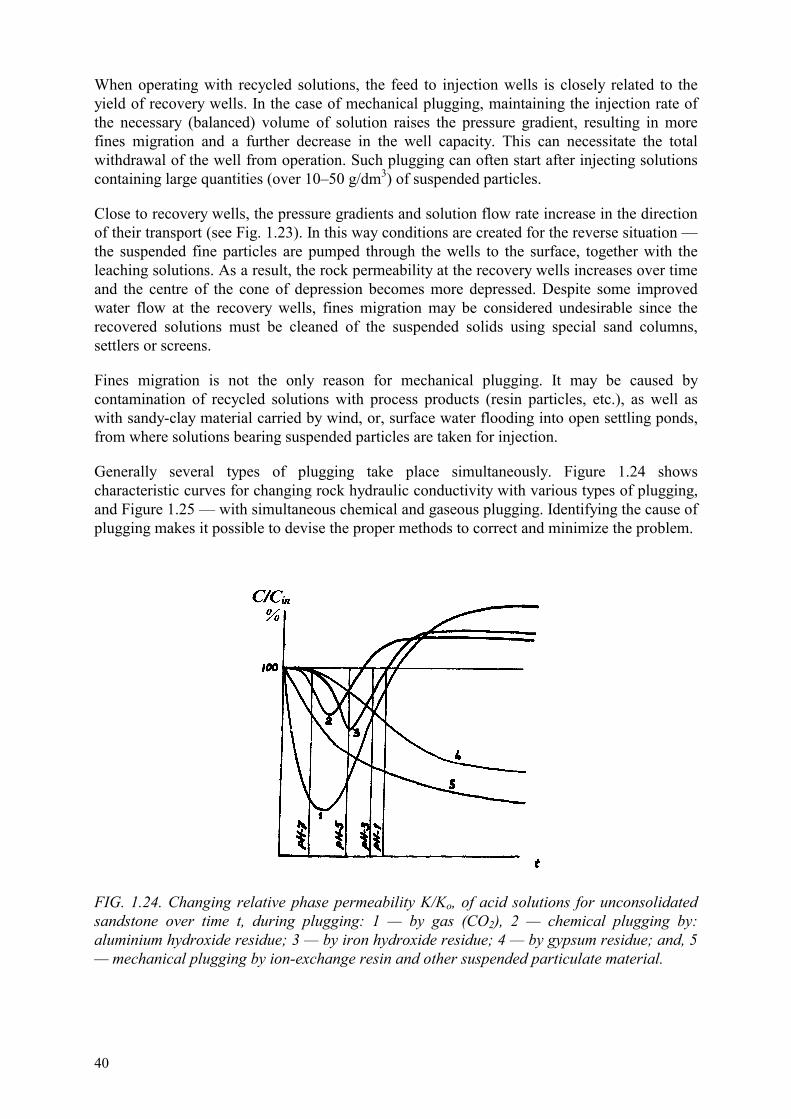
40
When operating with recycled solutions, the feed to injection wells is closely related to the yield of recovery wells. In the case of mechanical plugging, maintaining the injection rate of the necessary (balanced) volume of solution raises the pressure gradient, resulting in more fines migration and a further decrease in the well capacity. This can necessitate the total withdrawal of the well from operation. Such plugging can often start after injecting solutions containing large quantities (over 10–50 g/dm3) of suspended particles.
Close to recovery wells, the pressure gradients and solution flow rate increase in the direction of their transport (see Fig. 1.23). In this way conditions are created for the reverse situation — the suspended fine particles are pumped through the wells to the surface, together with the leaching solutions. As a result, the rock permeability at the recovery wells increases over time and the centre of the cone of depression becomes more depressed. Despite some improved water flow at the recovery wells, fines migration may be considered undesirable since the recovered solutions must be cleaned of the suspended solids using special sand columns, settlers or screens.
Fines migration is not the only reason for mechanical plugging. It may be caused by contamination of recycled solutions with process products (resin particles, etc.), as well as with sandy-clay material carried by wind, or, surface water flooding into open settling ponds, from where solutions bearing suspended particles are taken for injection.
Generally several types of plugging take place simultaneously. Figure 1.24 shows characteristic curves for changing rock hydraulic conductivity with various types of plugging, and Figure 1.25 — with simultaneous chemical and gaseous plugging. Identifying the cause of plugging makes it possible to devise the proper methods to correct and minimize the problem.
FIG. 1.24. Changing relative phase permeability K/Ko, of acid solutions for unconsolidated sandstone over time t, during plugging: 1 — by gas (CO2), 2 — chemical plugging by: aluminium hydroxide residue; 3 — by iron hydroxide residue; 4 — by gypsum residue; and, 5 — mechanical plugging by ion-exchange resin and other suspended particulate material.

41
FIG. 1.25. Curves of changing phase permeability K/Ko, of fluid over time t, with chemical plugging by CO2 gas (1); and precipitation of hydroxides: Fe3+ (2), and Al3+ (3); and gypsum (4).
The plugging of pore space may be offset by other processes taking place during in-situ leaching. Furthermore, some material may be removed as mechanical suspensions or released gas coming from the recovered solution.
The cumulative effect of the various plugging mechanisms — precipitation on the one hand, and removal on the other, ultimately determine the effective permeability of the ore-bearing stratum.
Gas plugging can be overcome by regular pumping of the wells, resulting in temporary and partial degassing of the formation.
The chemical plugging by aluminium and iron hydroxides is reversed by acid treatment of the well (generally with H2SO4). When the plugging is serious and results in the entire withdrawal of production wells from operation, it is useful to shorten the flow distance of the solutions, i.e. install a more closely spaced well pattern.
In the case of substantial loss of flow due to irreversible chemical plugging by gypsum, one could use saline baths [6] such as a solution of hydrochloric acid (sometimes blended with hydrofluoric acid for a better result to clean the formation and well screen). A HC1-HF mixture of 15%–2% is often used. It is referred to as “Mud-Acid” in the oil and gas production industry. Hydrofluoric acid is extremely dangerous. It should only be handled by following appropriate safety measures and wearing protective clothing.
Mechanical plugging of injection wells can be avoided using the following measures:
�� regular cleaning of wells by pumping (up to the point of complete clarification of the solutions);
�� thorough removal of suspended particles (using sand screens, and settlers) and from recycled solutions using flocculants;
�� treating the formation around the wells with polyphosphate solutions to remove clay particles from this zone;
�� replacing airlifts with electric pumps (to create a more uniform and controlled hydrodynamic regiment of pumping without entraining fine particles);
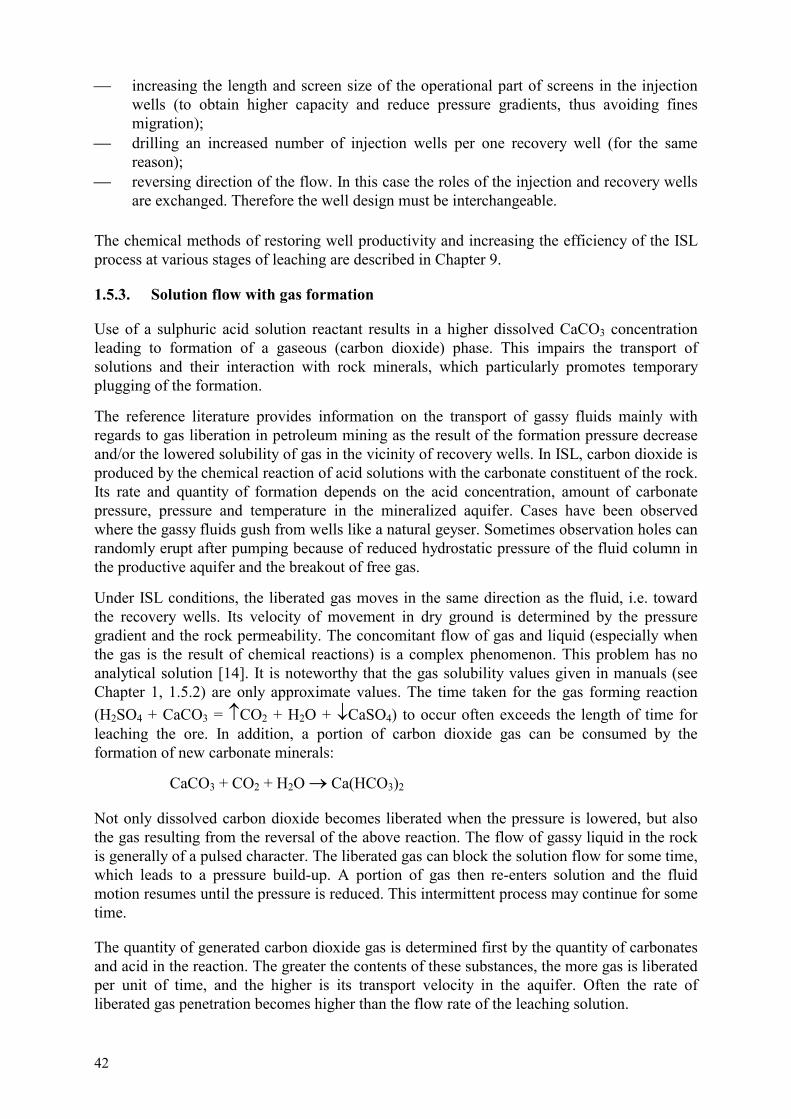
42
�� increasing the length and screen size of the operational part of screens in the injection wells (to obtain higher capacity and reduce pressure gradients, thus avoiding fines migration);
�� drilling an increased number of injection wells per one recovery well (for the same reason);
�� reversing direction of the flow. In this case the roles of the injection and recovery wells are exchanged. Therefore the well design must be interchangeable.
The chemical methods of restoring well productivity and increasing the efficiency of the ISL process at various stages of leaching are described in Chapter 9.
1.5.3. Solution flow with gas formation
Use of a sulphuric acid solution reactant results in a higher dissolved CaCO3 concentration leading to formation of a gaseous (carbon dioxide) phase. This impairs the transport of solutions and their interaction with rock minerals, which particularly promotes temporary plugging of the formation.
The reference literature provides information on the transport of gassy fluids mainly with regards to gas liberation in petroleum mining as the result of the formation pressure decrease and/or the lowered solubility of gas in the vicinity of recovery wells. In ISL, carbon dioxide is produced by the chemical reaction of acid solutions with the carbonate constituent of the rock. Its rate and quantity of formation depends on the acid concentration, amount of carbonate pressure, pressure and temperature in the mineralized aquifer. Cases have been observed where the gassy fluids gush from wells like a natural geyser. Sometimes observation holes can randomly erupt after pumping because of reduced hydrostatic pressure of the fluid column in the productive aquifer and the breakout of free gas.
Under ISL conditions, the liberated gas moves in the same direction as the fluid, i.e. toward the recovery wells. Its velocity of movement in dry ground is determined by the pressure gradient and the rock permeability. The concomitant flow of gas and liquid (especially when the gas is the result of chemical reactions) is a complex phenomenon. This problem has no analytical solution [14]. It is noteworthy that the gas solubility values given in manuals (see Chapter 1, 1.5.2) are only approximate values. The time taken for the gas forming reaction (H2SO4 + CaCO3 = �CO2 + H2O + �CaSO4) to occur often exceeds the length of time for leaching the ore. In addition, a portion of carbon dioxide gas can be consumed by the formation of new carbonate minerals:
CaCO3 + CO2 + H2O � Ca(HCO3)2
Not only dissolved carbon dioxide becomes liberated when the pressure is lowered, but also the gas resulting from the reversal of the above reaction. The flow of gassy liquid in the rock is generally of a pulsed character. The liberated gas can block the solution flow for some time, which leads to a pressure build-up. A portion of gas then re-enters solution and the fluid motion resumes until the pressure is reduced. This intermittent process may continue for some time.
The quantity of generated carbon dioxide gas is determined first by the quantity of carbonates and acid in the reaction. The greater the contents of these substances, the more gas is liberated per unit of time, and the higher is its transport velocity in the aquifer. Often the rate of liberated gas penetration becomes higher than the flow rate of the leaching solution.
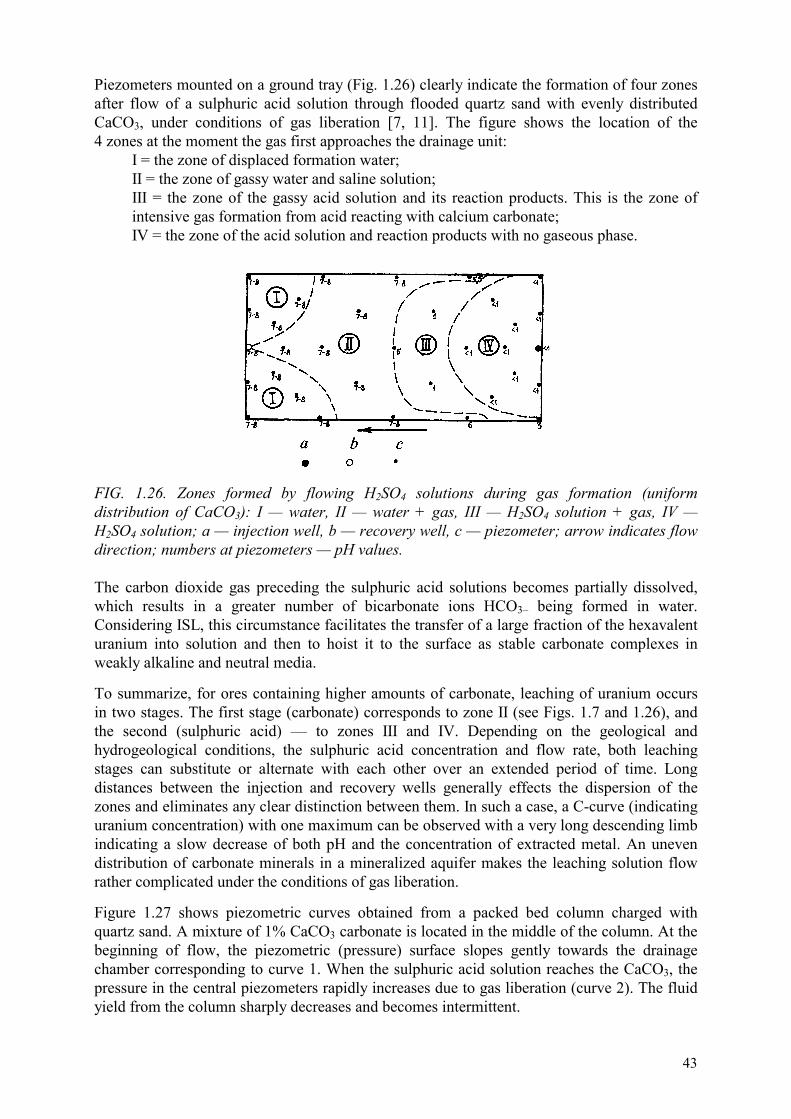
43
Piezometers mounted on a ground tray (Fig. 1.26) clearly indicate the formation of four zones after flow of a sulphuric acid solution through flooded quartz sand with evenly distributed CaCO3, under conditions of gas liberation [7, 11]. The figure shows the location of the 4 zones at the moment the gas first approaches the drainage unit:
I = the zone of displaced formation water; II = the zone of gassy water and saline solution; III = the zone of the gassy acid solution and its reaction products. This is the zone of intensive gas formation from acid reacting with calcium carbonate; IV = the zone of the acid solution and reaction products with no gaseous phase.
FIG. 1.26. Zones formed by flowing H2SO4 solutions during gas formation (uniform distribution of CaCO3): I — water, II — water + gas, III — H2SO4 solution + gas, IV — H2SO4 solution; a — injection well, b — recovery well, c — piezometer; arrow indicates flow direction; numbers at piezometers — pH values. The carbon dioxide gas preceding the sulphuric acid solutions becomes partially dissolved, which results in a greater number of bicarbonate ions HCO3– being formed in water. Considering ISL, this circumstance facilitates the transfer of a large fraction of the hexavalent uranium into solution and then to hoist it to the surface as stable carbonate complexes in weakly alkaline and neutral media.
To summarize, for ores containing higher amounts of carbonate, leaching of uranium occurs in two stages. The first stage (carbonate) corresponds to zone II (see Figs. 1.7 and 1.26), and the second (sulphuric acid) — to zones III and IV. Depending on the geological and hydrogeological conditions, the sulphuric acid concentration and flow rate, both leaching stages can substitute or alternate with each other over an extended period of time. Long distances between the injection and recovery wells generally effects the dispersion of the zones and eliminates any clear distinction between them. In such a case, a C-curve (indicating uranium concentration) with one maximum can be observed with a very long descending limb indicating a slow decrease of both pH and the concentration of extracted metal. An uneven distribution of carbonate minerals in a mineralized aquifer makes the leaching solution flow rather complicated under the conditions of gas liberation.
Figure 1.27 shows piezometric curves obtained from a packed bed column charged with quartz sand. A mixture of 1% CaCO3 carbonate is located in the middle of the column. At the beginning of flow, the piezometric (pressure) surface slopes gently towards the drainage chamber corresponding to curve 1. When the sulphuric acid solution reaches the CaCO3, the pressure in the central piezometers rapidly increases due to gas liberation (curve 2). The fluid yield from the column sharply decreases and becomes intermittent.
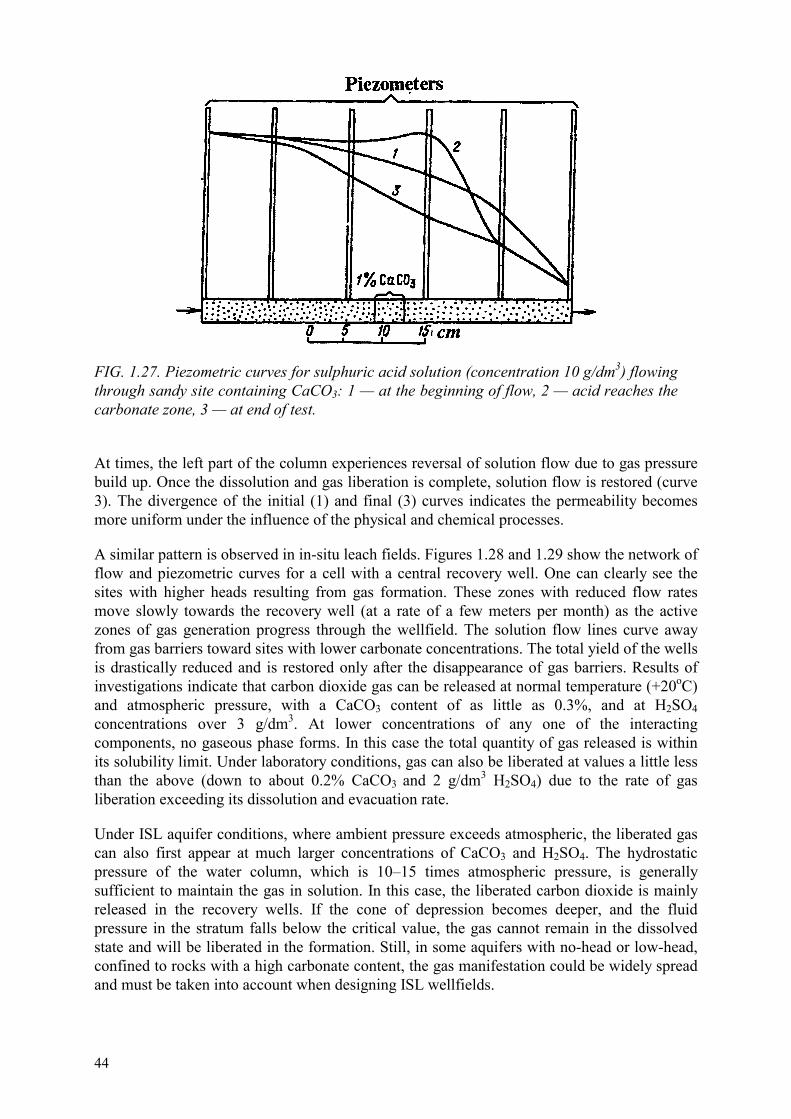
44
FIG. 1.27. Piezometric curves for sulphuric acid solution (concentration 10 g/dm3) flowing through sandy site containing CaCO3: 1 — at the beginning of flow, 2 — acid reaches the carbonate zone, 3 — at end of test.
At times, the left part of the column experiences reversal of solution flow due to gas pressure build up. Once the dissolution and gas liberation is complete, solution flow is restored (curve 3). The divergence of the initial (1) and final (3) curves indicates the permeability becomes more uniform under the influence of the physical and chemical processes.
A similar pattern is observed in in-situ leach fields. Figures 1.28 and 1.29 show the network of flow and piezometric curves for a cell with a central recovery well. One can clearly see the sites with higher heads resulting from gas formation. These zones with reduced flow rates move slowly towards the recovery well (at a rate of a few meters per month) as the active zones of gas generation progress through the wellfield. The solution flow lines curve away from gas barriers toward sites with lower carbonate concentrations. The total yield of the wells is drastically reduced and is restored only after the disappearance of gas barriers. Results of investigations indicate that carbon dioxide gas can be released at normal temperature (+20oC) and atmospheric pressure, with a CaCO3 content of as little as 0.3%, and at H2SO4 concentrations over 3 g/dm3. At lower concentrations of any one of the interacting components, no gaseous phase forms. In this case the total quantity of gas released is within its solubility limit. Under laboratory conditions, gas can also be liberated at values a little less than the above (down to about 0.2% CaCO3 and 2 g/dm3 H2SO4) due to the rate of gas liberation exceeding its dissolution and evacuation rate.
Under ISL aquifer conditions, where ambient pressure exceeds atmospheric, the liberated gas can also first appear at much larger concentrations of CaCO3 and H2SO4. The hydrostatic pressure of the water column, which is 10–15 times atmospheric pressure, is generally sufficient to maintain the gas in solution. In this case, the liberated carbon dioxide is mainly released in the recovery wells. If the cone of depression becomes deeper, and the fluid pressure in the stratum falls below the critical value, the gas cannot remain in the dissolved state and will be liberated in the formation. Still, in some aquifers with no-head or low-head, confined to rocks with a high carbonate content, the gas manifestation could be widely spread and must be taken into account when designing ISL wellfields.

45
FIG. 1.28. Changed flow direction of sulphuric acid solution with gas liberation at sites with elevated carbonate content after (a) — 12 and (b) — 16 months of leaching; wells: 1 — injection, 2 — recovery, 3 — observation, 4 — lines of equal head, 5 — flow lines, 6 — outline of geometric cell, 7 — barriers formed by gas, 8 — direction of solution movement (arrows). Numbers — piezometric elevation.
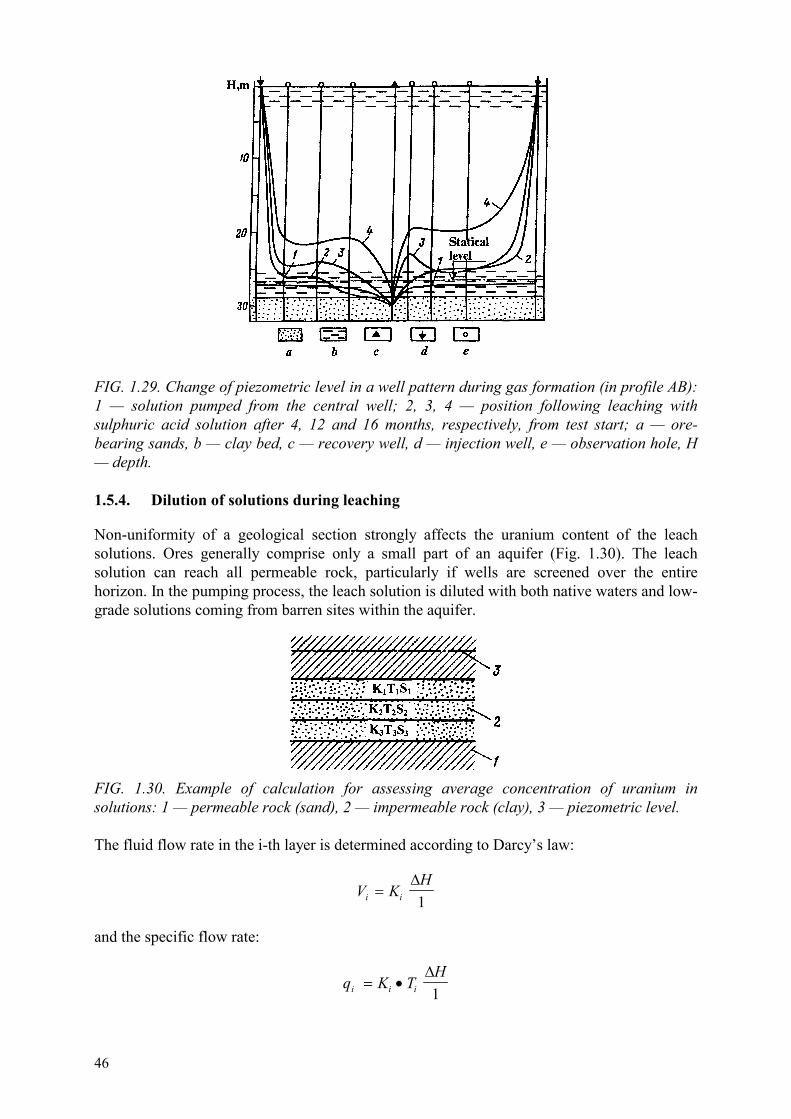
46
FIG. 1.29. Change of piezometric level in a well pattern during gas formation (in profile AB): 1 — solution pumped from the central well; 2, 3, 4 — position following leaching with sulphuric acid solution after 4, 12 and 16 months, respectively, from test start; a — ore-bearing sands, b — clay bed, c — recovery well, d — injection well, e — observation hole, H — depth. 1.5.4. Dilution of solutions during leaching
Non-uniformity of a geological section strongly affects the uranium content of the leach solutions. Ores generally comprise only a small part of an aquifer (Fig. 1.30). The leach solution can reach all permeable rock, particularly if wells are screened over the entire horizon. In the pumping process, the leach solution is diluted with both native waters and low-grade solutions coming from barren sites within the aquifer.
FIG. 1.30. Example of calculation for assessing average concentration of uranium in solutions: 1 — permeable rock (sand), 2 — impermeable rock (clay), 3 — piezometric level. The fluid flow rate in the i-th layer is determined according to Darcy’s law:
V KH
i i��
1
and the specific flow rate:
q K TH
i i i� ��
1

47
The total specific flow rate for the whole horizon:
q K TH
i average� ��
1
where: KK T K T K T
T T Taveragen n
n�
� � �
� � �
1 1 2 2
1 2
......
and K1, K2,... Kn; hydraulic conductivity and T1 ,T2,... Tn thickness of single strata, respectively.
According to hydrodynamic laws, the flow rate is distributed throughout a single rock layer in relation to its water conductivity. In another way, q1 : q2 : q3 ... = K1T1 : K2T2 : K3T3.
Thus, dilution of the productive solution in the vertical direction is the most simple case for a two-layered structure to be leached (ore and barren rock). It is determined in the following way:
NKT
K TK T K T
K TK TK To o
n n o o
o o
n n
o o� �
�
� �1,
where K, Ko and Kn are the hydraulic conductivities of the aquifer in ore- and non-ore layers, and T, To and Tn — their respective thickness.
In this case the mined metal concentration in the recovery well will comprise:
CC
K T KTo
n n�
�( / ) 1
where Co = concentration of mined metal in the solution from the ore-bearing layer.
If the section is multilayered, then:
CK T C K T C K T C
K T K T K TK T CKT
n n n
i i n n
ii n
i i i�
� � �
� � ��
�
�
1 1 1 2 2 2
2 2
1......
�
where C1, C2 ... Cn are the concentrations of metal recovered in the layers (Fig. 1.30).
The arrangement of well screens in the ore-bearing layer may sometimes succeed in limiting the solution leakage through the thickness (with water-confining rock layers present and the confinement of ore bodies to certain parts of aquifer section). But such favourable conditions rarely appear, and as a rule the leaching solution is substantially diluted by vertical flare.
Proper evaluation of the volume of leach solution is important for forecasting field test results based on laboratory data. Similarly, field test data must be analyzed to develop Initial Design data for commercial facilities.
The relative volume of leach solution per unit of ore mass to be leached (L/S) depends on the leach time, acid consumption, the average concentration of the metal to be recovered in the solution, and the capacity of the surface processing facility, etc.
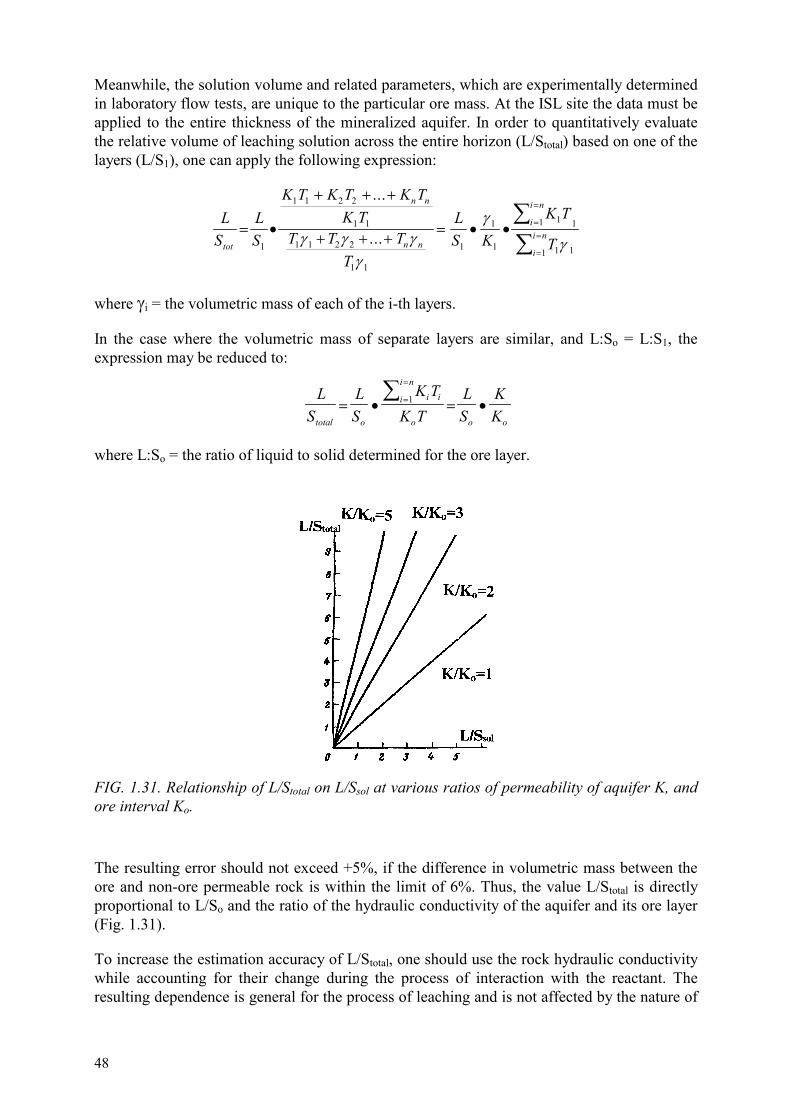
48
Meanwhile, the solution volume and related parameters, which are experimentally determined in laboratory flow tests, are unique to the particular ore mass. At the ISL site the data must be applied to the entire thickness of the mineralized aquifer. In order to quantitatively evaluate the relative volume of leaching solution across the entire horizon (L/Stotal) based on one of the layers (L/S1), one can apply the following expression:
LS
LS
K T K T K TK T
T T TT
LS K
K T
Ttot
n n
n n
i
i n
i
i n� �
� � �
� � �� � �
�
�
�
�
�
�1
1 1 2 2
1 1
1 1 2 2
1 1
1
1
1
11 1
1 11
...
...� � �
�
�
�
where �i = the volumetric mass of each of the i-th layers.
In the case where the volumetric mass of separate layers are similar, and L:So = L:S1, the expression may be reduced to:
LS
LS
K TK T
LS
KKtotal o
i ii
i n
o o o� � � �
�
�
� 1
where L:So = the ratio of liquid to solid determined for the ore layer.
FIG. 1.31. Relationship of L/Stotal on L/Ssol at various ratios of permeability of aquifer K, and ore interval Ko.
The resulting error should not exceed +5%, if the difference in volumetric mass between the ore and non-ore permeable rock is within the limit of 6%. Thus, the value L/Stotal is directly proportional to L/So and the ratio of the hydraulic conductivity of the aquifer and its ore layer (Fig. 1.31).
To increase the estimation accuracy of L/Stotal, one should use the rock hydraulic conductivity while accounting for their change during the process of interaction with the reactant. The resulting dependence is general for the process of leaching and is not affected by the nature of
49
the reactant and the recovered component. It affirms the necessity to determine the hydraulic conductivity, as well as the thickness of both the ore and the entire host aquifer for the deposits targeted for ISL.
In addition to vertical dilution, some lateral dilution by native water also occurs. They enter the leach zone from outside the wellfield limits to compensate for reactant solutions escaping beyond the limits of the field when the wellfield is operated in balance (i.e. injected solution = recovered solution). With two rows of injection wells and one of recovery wells between them, about one third of injected fluid is lost through horizontal seepage. The same amount of native water enters from outside the wellfield. This maintains the balance, and dilutes the production solution.
Where a large number of alternating lines of injection and recovery wells are employed, the excursion and dilution occur only along the external boundaries. In this case, dilution is much less.
The procedure of deliberately maintaining an imbalance of fluid, where the amount of the recovered solution exceeds the amount of injected recycle solution results in the formation of a local cone of depression. This helps to reduce solution leakage beyond the working limit of the wellfield. However, use of this procedure increases inflow of the native water and increases dilution of the leach solutions.
A negative balance of wellfield fluids may also occur during the cleanup, disposal and wellfield operations. For example, solution from an operating ISL field may be recycled and injected into a new field in preparation for leaching. The injected solution is used for passive acidification of the new field and may be left in the field for some time before pumping is started. This practice also results in a negative fluid balance in the initial wellfield.
1.5.5. Lag of production solutions behind flow
An important feature of sulphuric acid leach solution flow, is that they lag behind the general fluid flow. This results from the partial neutralization of the acid in reactions with minerals, and the formation of a higher pH zone ahead of the leach solution front. This high pH value can cause uranium compounds to precipitate, thus forming a mobile zone of secondary enrichment (see Chapter 1.4.).
Sometimes in the hydrogeological calculation of non-reacting fluids (e.g. water-petroleum) movement, one uses a scheme of piston-like displacement, changing one pore volume. In these very simplified conditions, the actual flow rate will be v:pa,
where v = the rate determined according to Darcy, and pa = the active porosity.
The rate of movement of the leach reactant front within the layer can be described by the ratio V/Pe, where Pe = effective porosity taking into account the chemical interaction of the leach solution and the rock.
The lag of the leaching solution behind the general flow is described as:
V/Pa • t – V/Pe • t = Vt(1/Pa–1/Pe)
and the lag time L/V:Pa–L/V:Pe = L/V(Pa–Pe).
50
The lag time depends on the acid concentration and acid consumption of the rock. The lower the acid concentration and higher the consumption, the greater is the difference between the velocities of the solution and native waters. Still, in practice one can observe deviations from the piston displacement scheme due to micro dispersion in the porous medium. The diverse physical properties of the leach solution and the displaced native water brings about added complications, such as their gravitational differentiation. In addition, lamination and non-uniform permeable rocks result in the development of strong macro hydraulic dispersion, leading to smearing of the leach solution border. At the time, when the leach solution moves slower than the fluid flow within the layer, some portion may accelerate and arrive earlier.
The integrated effect of all of these processes is taken into account in the experimental evaluation of the movement rate of the border with the initial working concentration of leach solutions for each particular ore type and reactant of fixed concentration, as well as its dependence on the fluid flow rate in accordance with the characterisation of the deposit under study (see Section 1.4).
REFERENCES TO CHAPTER 1
[1] BELETSKY, V.I., BAKHUROV, B.G., SADYKOV, R.K.H., On alteration of permeable properties of rock in uranium ISL by sulphuric acid, Atomnaja Energija 31 5 (1971) 518–520.
[2] VERIGIN, N.N., “On kinetics in dissolution of salts at filtration through soil”, Dissolution and Leaching of Rock, M. Gosstroyizdat (1957).
[3] SMIRNOV, I.V., EFIMOVA, Z.A., SKOROVAROV, J.I., et al., Hydrometallurgical Treatment of Uranium Minerals (J.I. Skorovarov, Ed.), M. Atomizdat (1979).
[4] Uranium Mining by ISL (V.A.Mamilov, Ed.), M. Atomizdat (1980). [5] ISTOMINA, V.S.b, Filtration Stability of Soil. [6] LOGINOV, V.G., MALYSHEV, L.G., GARIFULLIN, SH.L., Manual for Acid
Treatment of Wells. M. Nedra (1966). [7] LUTSENKO, I.K., BELETSKY, V.I., DAVYDOVA, L.G., No-Mine Development of
Ore Deposits, M. Nedra (1986). [8] PERELMAN, V.I., Concise Manual for Chemists, M.:Goskhimizdat (1963). [9] POL’KIN, S.I., Enrichment of Rare Earth Ores and Placers, M. Nedra (1967). [10] PRIKLONSKI, V.A., Science of Soils, M. Gosgeolizdat 1 (1955). [11] PYKHACHEV, G.B., ISAEV, R.G., Underground Hydraulics, M. Nedra (1983). [12] Manual on Solubility, L. Nauka 1,2,3, Binary, Ternary and Multicomponent Systems
(1969–1970). [13] Manual on Uranium Geotechnology (J.I. Skorovarov, Ed.), M.: Energoatomizdat
(1997). [14] Chemist’s Manual, L/M. Goskhimizdat 1, 2nd edn (1962). [15] Hydrogeologist’s Manual (V.M. Maksimov, L.:Nedra, Eds), 1&2 (1979).

51
Chapter 2
GEOLOGIC AND HYDROGEOLOGIC CONDITIONS FOR IN SITU LEACH (ISL) MINING
2.1. CLASSIFICATION OF DEPOSITS AMENABLE TO ISL MINING
Several systems for classifying uranium deposits have been developed based on the deposit genesis, host formation, lithological-geochemical, hydrogeological, structural and other criteria [2, 3–7, 10–13, 15, 17, 18]. For this report the most practical classification type includes the group of deposits being commercially mined using ISL technology. Commercial evaluation of minable uranium deposits using ISL technology is based on accounting for several geological and hydrogeological factors which determine the interrelations of leach solutions, host rock and ores. The geochemical conditions of deposit formation are most important in this respect.
Uranium deposits being extracted using wells drilled from the surface are mainly exogenic sandstone hosted deposits occurring in aquifers of sedimentary basins. Based on their genesis and ore formation, the deposits belong to two groups: roll-type and tabular. The groups have much in common including the ore and host rock composition. They do, however, differ in orebody morphology and size, as well as permeability and hydrogeologic conditions. They are therefore considered as two independent deposit types with respect to ISL technology [14]. Both types occur at a geochemical interface where uranium-bearing groundwaters cross from oxidized to reduced rocks (see Section 1.2). The boundaries of the oxidation zone, as well as lithologic and permeability characteristics of the aquifer determine the morphology of ore bodies, as well as the details of their vertical and horizontal extent.
Roll-type deposits are the most important uranium deposit-type being extracted by ISL technology. Ore bodies with the most simple form occur as classical rolls formed in sands of uniform lithology and permeability. These aquifers hosts generally consist of fine grained, well-graded sands that were deposited in marine or in-shore/marine environments. The water-bearing, Grey-coloured horizons with inhomogeneous lithology and variable permeability, as a rule, consist of variable grain size alluvial sediments.
The ore deposits display the most complex forms in aquifers occurring in mottled sediments deposited in alluvial-deluvial and proluvial complexes.
All three of the above uranium deposit-types occur in large roll-type deposits where multiple aquifers are hosted in rocks of varying faces and under varying conditions of oxidation-reduction.
The aquifer related characteristics of sandstone hosted uranium deposits regarding the composition of ore-bearing sediments, orebody morphology and lithological-permeability characteristics of the host horizon are presented in Table 2.1. This type of deposit classification is the most useful one in accounting for the requirements for commercial ISL operation.
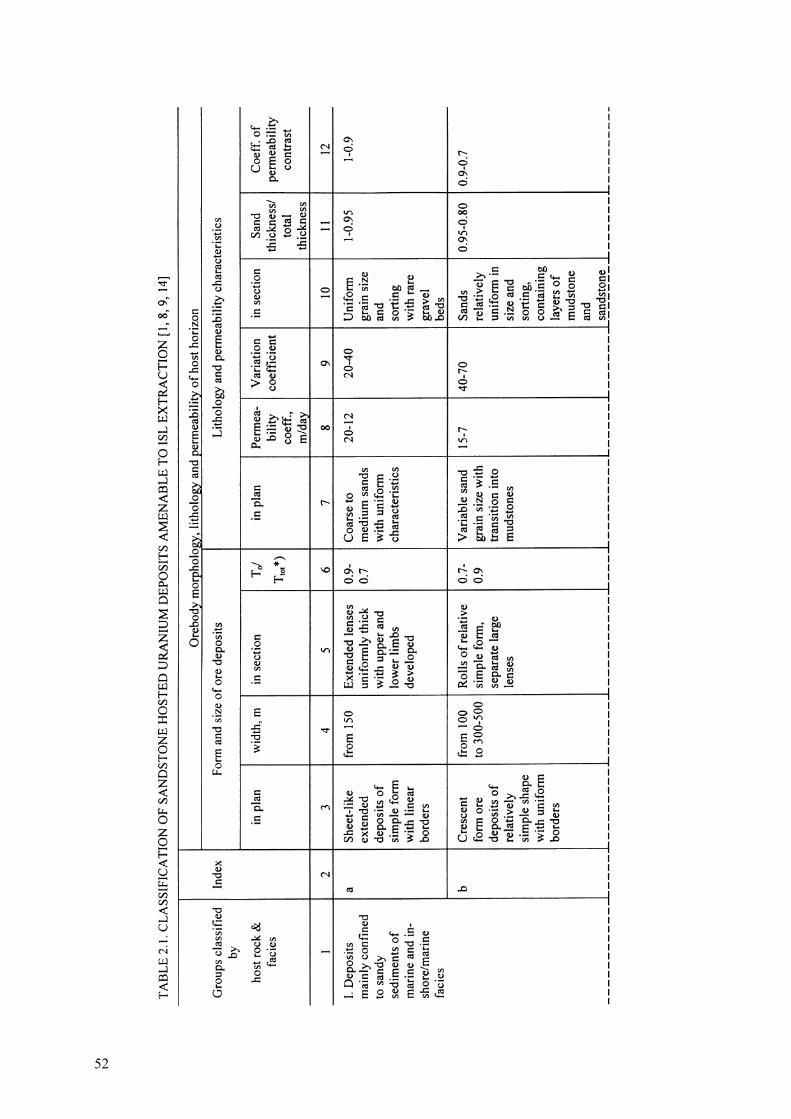
52

53

54
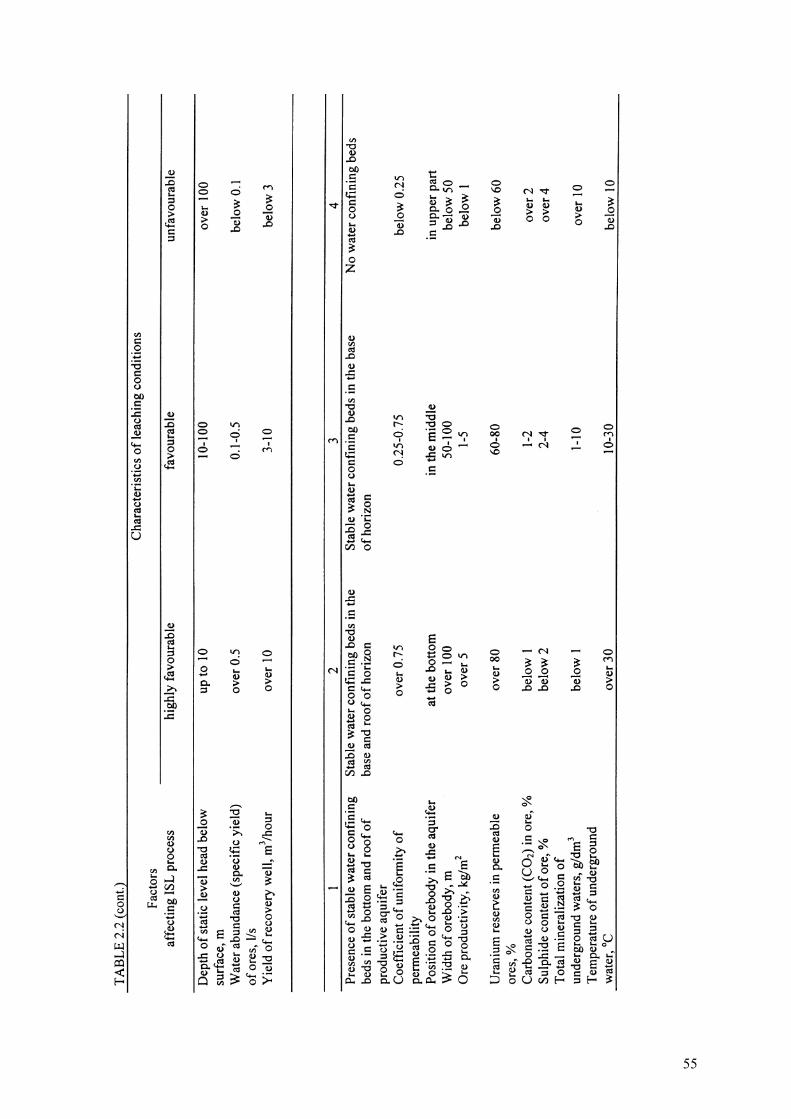
55

56
2.2. HYDROGEOLOGICAL CONDITIONS FOR ISL
One of the most important factors determining the amenability of the deposit for underground leaching is a favourable hydrogeological environment. The hydrogeological factors affecting ISL processes are: hydrogeological structures, the number and character of aquifers, their water supply, the depth of static water levels from the earth surface and their position (head) above the top of the aquifer, the direction and velocity of the groundwater movement, water conducting properties of the host rock and ores, and their bed thickness. The hydraulic connection between aquifers, the presence of weathered water-confining strata, chemical composition and temperature of the groundwater may also be important. These important factors influencing ISL practice are summarized in Table 2.2.
The most favourable uranium deposits for ISL extraction are water saturated sandstone type deposits. The highest concentration of uranium in roll-type deposits generally occurs in the middle (vertical) of the ore-bearing host rock horizon. As a rule, this zone is more permeable than are the rocks hosting the deposit limbs, which commonly occur in rocks with a higher concentration of fine grained material such as clay. Because of the genesis of the ore, most of the reserves (i.e. from 70 to 90% or more) are located in permeable rock and can be successfully recovered by ISL.
The complexity of extracting uranium from sandstone type deposits results from several factors. Some of these are the: low uranium content in the ore; abundance of water in the ore and overlying rocks; substantial depths of occurrence (up to 500 metres and more); groundwater head, (reaching as much as a few tens of atmospheres); and the presence of non-cemented, unstable, often running sand-clay sediments. All of these factors would require special measures to be taken if conventional mining were used to extract the ore. This would include such activities as dewatering prior to mining, sinking wells and special shaft support.
Therefore conventional mining is both uneconomic and technically difficult. The problem can be successfully resolved using ISL technology.
The permeability of ore and rocks is the major hydrogeological factor determining the efficiency of ISL technology. Deposits developed in unconsolidated sediments are suitable for ISL mining only in those cases where the orebody occurs in water bearing, permeable sands. The flow rate of recovery wells, the leach rate and degree of recovery achieved are all dependent on the permeability of the ore.
Based on hydraulic conductivity (C), rocks and soils may be subdivided into those that are: practically impermeable (clays, loams, argillites, clayey schists and solid rocks), where C = 0 to 0.1 m/day; semi-permeable (sandy loams, clayey sands, some mudstones) with C = 0.1 to 1 m/day; permeable (sands) with C = 1 to 10 m/day; and highly permeable (sandy-gravel deposits) with C > 10 m/day. The most favourable deposits for ISL extraction are those of the last two groups (with C > 1 m/day). In some cases, the minimum acceptable hydraulic conductivity may be below 0.5 and even 0.1 m/day. Evaluating these deposits for ISL extraction requires a special feasibility study.
For acid ISL extraction almost all ores require some degree of pre-treatment, depending on their permeability. Practically all relatively impermeable mineralization also becomes leachable by diffusion processes up to a distance of 20–50 centimetres from more permeable formations, depending on certain conditions. The conditions are the reaction period of the solutions and nature of the ores. However, their contribution to the total recovery is not great.

57
At C < 1 m/day, both the well yield and solution flow rate require a higher pressure gradient. This is an unfavourable circumstance, since it can lead to flushing of fine particles (i.e. suffusion) and mechanical plugging of porosity. Under high flow rates, the highly permeable sandy-gravel ores are predisposed to form channels (“channelling effect”), thus impairing the uniformity of the leaching process in the ore mass.
Differences in the permeability throughout the orebody are characterized by the coefficient of uniformity of permeability. This helps indicate which parts of production aquifer consist of sediments with a uniform permeability.
The group of very uniform deposits comprise rock units with uniform coefficients of hydraulic conductivity throughout the entire deposit. The group of uniform deposits consist of deposits with a uniform hydraulic conductivity over 75% of the deposit volume. The non-uniform deposit group consists of those including 50% of the volume with a similar hydraulic conductivity. Rather non-uniform deposits contain only 25% of the deposits with a similar hydraulic conductivity, and the remaining 75% are rocks with a hydraulic conductivity that is above or below the predominant value [8].
An important factor in ISL is the relative contrast in permeability between the ore bodies and the host rocks. The most unfavourable cases occur where ores are confined to rocks with a low permeability, and are surrounded with permeable barren sands. In such case the leach solution will mainly by-pass the orebody at the ratio determined by the relative conductivity of the ore-bearing and barren parts of the section. A relative water conductivity contrast below 0.1 is considered unfavourable, since it results in substantial dilution of the production solution.
An indication of the relative permeability of ores and ore-bearing rocks can be obtained from their respective particle size distribution. The leading role in the permeability of unconsolidated rock belongs to the content of the small grain size fractions. When the content of particles sized below 0.005 mm exceeds 30%, the sand-clay sediments become completely impermeable. Sands containing less than a 20–30% mud-clayey fraction (smaller than 0.05 mm) can be suitable for leaching with C = 1 m/day (at temperature +20oC). This parameter should be established for each deposit using laboratory permeability tests on drill core material (with temperature corrections for difference between the laboratory and the ore deposit). A higher content of mudstone-clay fraction will result in such a loss of water conductivity that the ores move into the category of technological off-grade (non-leachable), independent of the uranium content.
Besides serving to classify ores into economic and non-economic ores, particle size distributions are widely used for quantitative evaluation of flow properties in rocks and ores. In most cases, a close correlation exists between the particle size distribution of sandy-clay deposits and their fluid flow properties. This relationship permits the development of empirical correlations to estimate coefficients for ore layers and barren rock in a mineralized horizon, using only the data from sieve analyses.
The thickness of a mineralized horizon should not be great (up to 10 m). At a thickness exceeding 30 m, extensive dilution of production solutions by native water is generally observed. The degree of dilution depends both on the permeability and the thickness of the ore and barren layers making up the complete sand horizon. A more than ten-fold ratio of
58
effective thickness for permeable rocks and ore should be avoided. Where the entire section consists of ore the ratio is equal to 1, and there is no vertical dilution.
The ore depth should not be too great, since the cost of wells increases with the depth.
Large yields from injection and recovery wells, as determined by the horizon water conductivity, accelerate the leaching process and improve the economic performance of uranium recovery. The optimal yield of recovery wells is within the range of 10 to 30 m3/h. The productivity of injection wells depends on the yield of the recovery wells and their pattern arrangement. In linear systems, with equal number of injection and recovery wells, the respective yields must be about the same if the total balance of fluid in the recycling system is maintained constant. In hexagonal cells, the number of injection wells exceeds that of the recovery wells. The ratio of recovery and injection wells determine the average yield of one injection well, i.e. 1/6 of the recovery well for one isolated operating cell, and up to 1/2 — for a large field.
The depth limit of the static level depends on the design limitations of the water hoisting system (pumps). In the case of airlifts, a deep static level will result in high consumption of compressed air per 1 m3 of hoisted fluid. This increases production costs and may make the operation uneconomic.
The native hydrostatic water pressure may vary over a broad range. A high head over the top of the aquifer creates a high fluid pressure within the formation. The solubility of entrained gas is increased by the pressure. Larger concentrations of gases, such as carbon dioxide and oxygen, can be tolerated. This reduces the chance of blocking pores with gas bubbles, thereby promoting fluid flow. Working with high-pressure aquifers reduces energy requirements for pumping the leach solution to the surface. In the cases where the aquifer head is above the ground level, it would be possible to carry out the ISL process without pumping due to the spontaneous outflow of the solutions. One must bear in mind, however, that the increased density of sulphuric acid leaching solutions reduces the effective static level of the mining aquifer by about 2 m per 100 m of head. Thus, at a 300 m head, this reduction reaches about 6 m.
On the whole, the presence of a pressurized aquifer is preferable to a very head, since pumping does not de-water the orebody, but only reduces the head. However, if the head is much higher than the earth surface level, difficulties could arise in carrying out maintenance on the injection and recovery wells unless sealing devices are used at the wellheads.
An important condition for successful underground leaching performance is the presence of a reliable confinement or aquiclude, particularly at the base of the productive aquifer.
The presence of impermeable beds over long distances along strike should be taken into account when designing well screen installations. Otherwise, the hydraulic connection between the injection and recovery wells can be broken and productive solutions may be lost.
The preferable position of the orebody in the aquifer is in the vicinity of the lower confining bed, because of the tendency for the more dense acid solutions to move downward under gravity. In this case the well screens should be located in the lower part of the horizon, so that the overlying barren rocks are not contacted by the leach solutions. This helps maintain a higher uranium concentration in the solution, as well as reducing reagent consumption.
59
The optimal orebody width is greater than 100 metres. This provides for the installation of at least three lines of production wells. Where the deposit is less than 50 metres wide, leaching is done in one line of wells with alternating injection and recovery wells. However, this type of operation is accompanied by dilution of the leaching solutions by the influx of barren native water entering from outside the horizontal limits of the orebody.
When evaluating the hydrogeologic conditions of deposits, one has to account for any water intake and hydraulic links of the ore bearing horizon with other aquifers. Depending on chemical composition, the native waters of uranium deposits can be classified as fresh, brackish, or brine. In view of the ion exchange adsorption processing, it is highly desirable that the total native water mineralization total dissolved solids not exceed 5–10 g/dm3, when sulphuric acid is used as the reactant.
Application of sulphuric acid is generally accompanied by a decrease of permeability resulting from pore plugging (see Section 1.5.2). This factor should be taken into account when making hydrogeological estimates (see section 5.2.).
Elevated groundwater temperatures should be considered as a favourable factor. In most cases it accelerates the heterogeneous kinetic reactions in the rock mass and increases the penetration (diffusion) of solutions into the ore. Lower temperatures (below 10oC) can make the process unprofitable or impossible (below 0oC).
In summary, the most suitable deposits for underground leaching occur in unconsolidated sediments deposits with the following hydrogeological conditions:
�� no hydraulic connection of the ore bearing formation to other underground aquifers or surface water sources;
�� the underlying rock should be impermeable (presence of an impermeable overlying layer is advantageous, though not compulsory);
�� the permeability of the ore should be higher than that of the host rock within the host formation or the permeability variance should be minimal;
�� the permeability of the ore should be at the least 0.5 to 1 m/day; �� the ratio of the ore bearing rock thickness to the barren rock thickness in the host
formation should be greater than 1/10; �� the native formation water should have an elevated temperature (over 20oC) and low
total dissolved solids of 5 to 10 g/dm3; �� there should be no communal potable water supply drawn from the host formation
adjacent to and within the area of the uranium ore.
2.3. INFLUENCE OF COMPOSITION OF ORES AND ROCKS ON THE ISL PROCESS
2.3.1. General
The material composition of uranium ores and rocks in the host formation is an important consideration regarding the potential for and conditions of uranium recovery by ISL. It also determines the choice between selecting a sulphuric acid or carbonate scheme for leaching. To a large extent the mineral composition of the ores and ore-bearing rocks affects the intensity of the process, the uranium concentration in the solution, its degree of recovery, the specific

60
reactant consumption and other geotechnological parameters, as well as pore plugging and related changes in the host formation.
2.3.2. Influence of mineral composition of ores on the ISL process
The efficiency of in situ leaching is affected by the type of uranium mineralization, the ratio of easily leached and leach resistant minerals, the uranium concentration in the ore, any intergrowth between uranium and associated minerals, their degree of dispersion and the dissolution rate.
The influence of the uranium mineralization on the leaching process is most clearly revealed through the relative proportion of oxidized and reduced species (i.e. respectively U6+ and U4+). At the initial stage of sulphuric acid leaching, the hexavalent form of uranium is by far the dominant species to enter solution. Should the pH value be reduced below 2, then U4+ ions enter solution, though to a much reduced degree than U6+ ions. The presence of natural oxidants in the host formation or their purposeful introduction, will noticeably improve leach performance. The presence of leach resistant uranium minerals (i.e. titanates, tantalum-niobates, zirconium and thorium minerals) in the ore, reduce leaching efficiency, and can make the process unprofitable.
In addition to mineral type, the leaching performance is affected by the uranium content in the ore. Higher concentrations of uranium in the ore generally result in a larger surface area of uranium minerals accessible for the leach solution. With all other conditions being equal, a higher grade ore takes longer to leach. Therefore, it will require a higher ratio of liquid to solid (L/S) (i.e. an increase in the number of pore volumes and of acid consumption) to obtain the same degree of recovery.
2.3.3. Effect of host rock composition on the ISL process
All rocks within the host formation are more or less affected by the leach solution. The ore minerals generally comprise the smallest part of a rock mass. Therefore, a mandatory condition of a successful ISL application should be the low solubility of the host rock formation and gangue minerals in the chosen reactant.
Based on their solubility in dilute sulphuric acid solutions, minerals are subdivided into three groups: 1) insoluble: quartz, accessory minerals and solid bitumen; 2) solubility resistant: feldspars, hydromicas, montmorillonite, kaolinite, muscovite, sericite, as well as relics of metamorphic and clay rock; 3) soluble: calcite, dolomite, limonite, biotite and epidote. The majority of uranium minerals occurring in sandstone deposits are in the soluble group.
As a rule, the ore-bearing rocks of these deposits are characterized as sandy-clay sediments of mica-quartz-feldspar composition, i.e. generally leach-resistant clastic minerals. However, some acid soluble minerals are always present. During leaching they react with the acid thus consuming a large part of it. In addition, some new minerals are formed that can cause plugging. Gas bubbles that impair the ISL process may also develop.
The efficiency of leaching is affected by both the mineral composition of the “framework grains” and the cement between the grains. It is affected by the degree of oxidation, adsorption and ion-exchange properties of the rock-forming minerals, as well as the presence of carbonate minerals, sulphides, organics, phosphates, zirconium, etc. Each of these factors influences the ISL process to some degree, either reducing or improving its effectiveness.
61
Some of the rock forming minerals in the host formation react to alter the hydrologic properties of the formation (permeability, porosity), its acid consumption and the recovery of uranium.
The mineral and chemical composition of the host rock and uranium ore forms the basis for classifying the ore into special ore types (silicate, carbonate or some other type).
The amount of clay in the rock affects its active porosity as well as its permeability to leach solutions. Where the clay fraction (<0.005 mm) exceeds 30%, sandy-clay deposits become impermeable to solutions. These rocks are classified as clays according to engineering-geological criteria. Ores with lower amounts of clay and mudstone particles (up to 20 to 30%) are considered only marginally suitable for leaching due to their low permeability. The mineralogical composition of clays may also influence their swelling properties when native water is replaced by an acid solution. This swelling significantly lowers the permeability of sandy-clay rock and may also lead to bulging of the clay rich interlayers.
The montmorillonite clays are the most suspectable to swelling as the cations present in the solution with a low valence and a small ionic diameter, replace cations with a higher valence and larger ionic radius, present on the clay micelles of the absorbed complex (such as Ca2+ replacement by H+ or Na+). In addition to montmorillonite, and halloysite, nontronite and vermiculite are also susceptible to swelling. The acid consumption in the interaction with clayey minerals increases from kaolinite to hydromica and even further to montmorillonite. The influence of clay on rock permeability may also be indirect. Clay and clayey fractions of sandstone, participating in ion-exchange processes, donate various cations, including those of Ca2+ ions. These react with the sulphate-ion of sulphuric acid to precipitate gypsum, thus plugging pore space.
The presence of carbonate minerals, their composition and location within the mineralized horizon, can greatly affect the ISL process. Calcite is the most reactive agent in acid solutions. The interaction of acid with dolomite, siderite and other carbonates is much less. The presence of carbonates in the cement of sandstone ores are considered the least favourable factor for ISL, when compared with the presence of carbonate layers or nodules. Such features are generally covered with a gypsum crust which develops following the start of leaching with sulphuric acid solutions. The crust prevents any further consumption of acid by the carbonates.
When the carbonate content in the cement exceeds 2% as CO2, acid leaching normally becomes unprofitable. Costs increase because of both excessive acid consumption, and plugging of the pore space by gypsum and carbon dioxide gas. In such deposits the viability of alkaline carbonate leaching should be considered.
Organic material is an important rock component which can negatively influence in situ leaching because of both its reduction and absorption properties. In carbonaceous sands with a high organic content (especially over 3% Corganic), the efficiency of acid leaching deteriorates. The permeability of such rocks depends not only on the amount of organic material, but also on its distribution in the horizon. The leaching of uranium and other associated valuable components from peat, brown coal and carbonaceous schists relies on the process of diffusion and proceeds at an extremely slow rate. When the leaching is done with a sodium bearing solution, a large quantity of organic humus may enter solution. This noticeably increases the

62
reducing properties and impairs uranium recovery from the ore, and also decreases formation permeability. Poor results are also observed where organics are present as bitumen.
Sulphide minerals commonly occur together with uranium minerals in sandstone-type deposits and can have a dual role in leaching. In an acidifying environment they decompose, forming sulphuric acid and iron sulphides, which facilitate oxidation and decomposition of uranium minerals. In a reducing medium, sulphides cause the precipitation of uranium. However, the sulphide content in roll-type sandstone deposits is generally low and has little affect on the ISL process.
Mineral composition of the ore is especially significant for reagent consumption in sulphuric acid leaching. With alkaline solutions there is much less interaction with the ore and host rock. For alkaline solutions the reagent is mostly consumed by (in addition to the uranium mineralization) sulphides, organic material and hydroxides.
Based on decreasing reaction rates with sulphuric acid, the minerals form the following series (A.S. Saltykov’s data): calcite > dolomite > ankerite = uranium minerals > magnesite ≥ iron hydroxides > biotite > chlorite > vermiculite > carbonized organics >> muscovite > kaolinite > montmorillonite ≥ microcline > albite.
The habit or form of the ore minerals, as well as their grain size and distribution also effect their leach properties. Many minerals are essentially stable in aggressive media. However, in finely disseminated form these same minerals will completely dissolve in dilute acids. The size and shape of particles determine their specific as well as their reactionary surface areas. Thus, disseminated uranium minerals in sandstone deposits (even at low uranium concentrations of tenths and hundredths of one per cent) are generally leached sooner than the large carbonate particles. The formation of a shielding gypsum film on the calcite particles also contributes to the relatively slow dissolution of calcite.
Based on typical mineral reactivity and particle sizes found in sandstone hosted uranium deposits, the specific acid consumption of commonly occurring minerals is ranked as follows: carbonates > uranium minerals > iron hydroxides > trioctahedral hydromicas > biotite = chlorite > montmorillonite > organic material > kaolinite > muscovite >> microcline > albite.
The permeability of sandstone formations is also primarily determined by their composition. The type and quantity of clay minerals present affect the permeability of these rocks. The addition of 2% hydrobiotite, kaolinite or motmorillonite reduces the permeability of quartz sand by 2.4 and 10 times, respectively, and a 20% content of these mineral particles -by 100, 500 and 1000 times [16].
The effectiveness of uranium leaching depends not only on the ore grade and uranium mineral particle distribution, but also on the location of the mineral within the host formation. The most complete recovery of uranium is achieved when the uranium exists as a coating on the walls of pores, thus making it most accessible to solutions. In contrast, the mottled aggregates of uranium minerals in the rock or relic grains, are less accessible to the leachant, and are therefore unfavourable for ISL. Such rocks include uranium-bearing phosphorite concretions, phosphorized and carbonized fossils and plants, mineralized clay rolls and clay lenses in sands.
In rocks where the clay minerals are directly associated with uranium concentrations, the ISL process may be inefficient, as clay limits access of solutions to the uranium. On the other

63
hand, the most favourable circumstances occur when the ores are confined to highly permeable sands, and any clay is located only at, or near the top, and/or bottom, of the ore zone. At these locations the clays form impermeable, water-confining beds that help control the flow of leaching solutions.
2.4. URANIUM ORES AND ORE-FORMING MINERALS
In sandstone deposits, uranium mineralization generally consists of sooty pitchblende, pitchblende and coffinite. The ores and host rocks are subdivided into carbonate and non-carbonate, and are classified by lithology which determine permeability — gravel, sand, sandstone, clay, etc.
The ordinary U4+ oxides are the most widely known. The oxidized (hexavalent) uranium minerals occur within the oxidation zones and are represented by U-vanadates, U-phosphates, and uranyl hydroxides. The natural U4+ oxides consist of 3 major species — uraninite, pitchblende and sooty pitchblende. Uraninite is described as crystalline uranium dioxide, UO2. As a rule, a portion of it is oxidized to U3O8 (pitchblende). The colloform, kidney- or gel-like aggregates of the characteristic globular structure are called pitchblende. Sooty pitchblende appears as fine-grained powdery aggregates at sites where uranium minerals are oxidized, or as a black film on the ore-forming minerals.
The most probable uraninite composition is UO2.07 – UO2.25. The compounds with the oxygen coefficient exceeding 2.25 and low crystalline structure parameters, include tetragonal phases U3O7, U3O8 and up to UO3. In presence of water, hydrated oxides occur when uraninite becomes oxidized. Uraninite always contains ThO2 and PbO as impurities.
In the sandstone type uranium deposits, uranium oxides usually form finely dispersed particles ranging in size from tenths of one micron to visually discernible impregnated and nest-like accumulations. They occur in the cement as the finest spherulites and films on the surface of fractured grains. Along the grain margins they penetrate the clay and micaceous minerals, forming pseudomorphs after carbonized plant relics. Pitchblende is often concentrated in sites rich in organic material and iron sulphides. Pitchblende generally contains calcium and lead as impurities, and sometimes — zirconium and rare earths.
Coffinite is one of the most widespread minerals in sandstone uranium deposits. It generally occurs in association with uraninite and may also be the predominate ore mineral. The composition of coffinite is expressed by the formula U(SiO4)1-x•(OH)4x. Coffinite can form solid solutions with zircon and thorite. Coffinite occurs in various forms including small spindle-like crystals disseminated in clay cement material, as well as impregnations and mottled accumulations. Elevated concentrations of phosphorus, rare earths, calcium, zirconium have been found in coffinite of young generations. Ningionite — (U1-xCa1-x TR2xPO4)2•1-2 H2O may also occur in intimate intergrowths with coffinite.
The presence of coffinite in the ores is considered a favourable factor for ISL. The readily soluble sooty pitchblende and uranium micas (uranyl phosphates and arsenates) also contribute to successful leaching performance [9].
Uranium titanates are rarely spread in sandstone type deposits and are less amenable to ISL. All of them are resistant to acid leaching, and only impair the leaching process. However, in some cases the crystalline bonds of uranium oxides with titanium and other components are weak. These minerals may be suitable for successful leaching. The evaluation regarding

64
favourability for leaching can only be made based on the results of laboratory leach studies of core samples tested under flow conditions.
Besides mineral forms of precipitated uranium, adsorded variations on iron hydroxides, clay minerals and organic material also occur. In addition, urano-organic compounds may also occur. Uranium minerals can be found in association with sulphides of iron, zinc, molybdenum, lead, and with selenides of iron or other elements, as well as with native selenium.
In general, uranium has the characteristic of forming complex poly-element deposits with several chemical elements. Other components of practical significance in uranium ores include the following: molybdenum-uranium, vanadium-uranium, rare earth-uranium, selenium-uranium, etc. (Table 2.3).
The composition of the host rock mass in sandstone uranium deposits is usually about 70–90% quartz grains, feldspar (5–20%) and fragments of siliceous rock (up to 40%). All of these species have practically no effect on the ISL process. The same is true for accessory minerals, which normally comprise no more than 3% of the rock. Micaceous minerals can comprise from 1 to 8% of the rock. Of these, biotite and chlorite do noticeably affect acid consumption.
The affect of sulphides, organic material and clay minerals on the leaching process is considered in Section 2.3.
TABLE 2.3. LEACHABLE POLY-ELEMENT URANIUM ORES
Uranium forms Associated components Leachable uranium minerals and associated by-products
Uranium and other components occurring in uranium minerals
Vanadium-uranium, rare earth-titanium-uranium
Carnotite, tyuyamunite, brannerite, davidite
Uranium and other components occurring in ore-forming minerals
Phosphorus-uranium and uraniferous coals and bitumens
Fluoroapatite, francolite, kurskite. Brown coals, anthraxolite, carbonaceous and bituminous schists
Uranium and other components within the composition of various minerals
Molybdenum-uranium Molybdenum-copper-uranium Selenium-uranium
Pitchblende, coffinite, sooty pitchblende, molybdenite, femolite Pitchblende, coffinite, chalcopyrite, molybdenite, femolite (ferrous molybdenite), chalcosine, etc. Pitchblende, coffinite, sooty pitchblende, native selen, ferroselite and selenides

65
Table 2.4. presents experimental data on specific reactant consumption and dissolution rate of major rock forming minerals of sandstone. The static tests were done in a 10 g/dm3 sulphuric acid solution on ground material (less than 0.1 mm) at a temperature of 20 to 22oC. 2.5. MINERALS FORMED DURING ISL AND THEIR INFLUENCE ON THE PROCESS
Geochemical interactions between the host formation and leach solution result in the accumulation in the solution of a large number of elements (besides uranium) which are derived from the major rock-forming minerals. The quantity of, and rate of accumulation of these elements in the leaching solution depends on the leachant type, its concentration, redox potential, temperature, the solubility of the rock-forming minerals and the surface area of the mineral particles available for leaching. All of these parameters effect the intensity of mass transfer into the rock/solution system. The variety of components entering the solution is quite extensive, especially where sulphuric or other mineral acids are utilized as oxidants (see Section 11.3). The main minerals yielding Ca, Mg and Fe to leach solutions are carbonates, iron oxides and hydroxides, chlorites and dark-coloured micas. Al, Si, K, Na, Ti can be leached from micas, clay minerals, pyroxenes and amphiboles. The low concentration of phosphorus in the liquid phase is probably related to the limited dissolution of phosphate minerals.
TABLE 2.4. ACID CONSUMPTION AND ESTIMATED TIME TO COMPLETE DISSOLUTION OF MAJOR MINERAL PARTICLES OF SANDSTONE (GRAIN SIZE <0.1 mm AND 10 g/dm3 SULPHURIC ACID)
Minerals
Formula
Specific acid consumption, kg/t
Time for complete dissolution
1 day 250 days Albite Na[AlSi3O8] 0.3 1.6 100–150 years Microcline K[AlSi3O8] 0.6 0.2 100–150 years Muscovite KAl2(OH)2•[AlSi3O10] 1.6 7.0 about 100 years Biotite K(Mg, Fe)3•[AlSi3O10]•
(OH,F)2 20.1 140.2 2–8 years
Vermiculite (hydromica)
(Mg, Al, Fe)3 • (OH)2[Si,Al)4 O10]•4H2O
39.3 247.2 2–8 years
Kaolinite Al4(OH)8[Si4O10] 2.6 23.7 30–50 years Montmorillonite (Ca,Na)(Mg,Al,Fe)2 •
(OH)2 [(Si,Al)4O10]•nH2O 15.7 64.2 10–20 years
Chlorite (Mg,Fe)3-n(Al,Fe3+)n /OH/4Aln Si2-nO5 (n=0.3–1)
18.9 138.9 from 1 day to 7–8 years
Carbonized organics 33.6 60.5 over 10 years Pyrite FeS2 2.5 2.8 Calcite CaCO3 930 998 1–10 days Dolomite Ca, Mg[CO3]2 980 1065 up to 10 days Ankerite Ca(Mg,Fe)[CO3]2 940 1026 3–8 days Siderite FeCO3 262 920 8–10 days Magnesite MgCO3 114 1149 3–4 months Limonite Fe2O3•nH2O (n = 1–4) 1–7 months
66
In ISL one generally uses recycled solutions for better accumulation of elements leached from the rock. However, in the coarse of recycling, solutions may achieve relative equilibrium with respect to the major rock forming elements (Ca, Mg, Fe, Al and Si). This is also the case for chemical components added to replenish the recycled leach solution prior to reinjection (ions SO4
2-, NO3-, NH4
+, HCO3-, etc.)
Most chemical compounds formed during ISL are very soluble in an acid medium (pH < 3). The only exceptions (for sulphuric acid leaching) are weakly soluble sulphates of calcium. They rapidly form saturated solutions followed by precipitation of salts (CaSO4•2H2O, CaCO3, etc.).
The calcium ion, essential for gypsum generation, transfers into solution primarily from calcite and the absorbed clay mineral complex. The SO4
2- ion is always present in the sulphuric acid solution in quantities sufficient for gypsum production. The minimum Ca2+ content sufficient for precipitation is 0.5 to 0.6 g/dm3, while about 1.5 g/dm3 of SO4
2- is required. Gypsum has a tendency to supersaturate. Therefore the precipitation can occur at higher concentrations of calcium sulphate then would be anticipated from its theoretical solubility (2 g/dm3). The precipitation of gypsum from supersaturated solutions can be accelerated by a sharp decrease of flow rate, as occurs when pumping is stopped.
The interaction of calcium carbonate and sulphuric acid depends on the particle size of the calcite. In the case where it is part of the clay-mudstone fraction of a highly permeable deposit it generally fully reacts with the H2SO4 solution. A portion of the CaCO3, consisting of sand and larger sized grains, usually fails to completely react during ISL. The degree of dissolution depends on an impermeable gypsum film, which is specifically deposited over massive carbonate occurrences — nodules, limestone beds and lenses. This gypsum cover prevents the reaction of acid and the remaining carbonate material.
Another important group of new minerals formed in ISL consists of those species with pH dependent solubilities. They are first of all iron and aluminium hydroxides, sometimes of complex composition (generally in combination with sulphites). When acid solutions are neutralized as they flow through the formation, the pH value of the medium increases and the conditions become favourable for the precipitation of complex hydroxides of: Fe2+ (pH = 6 to 7); Al3+ (pH = 4 to 6); and Fe3+ (pH ~ 3). As the acid solution moves through the aquifer, a mobile zone of partially plugged rock is formed. As a result, the pore spaces located within the leaching zone becomes unplugged after their acidification and their permeability is partially restored. At the same time, the complex hydroxides form a zone of reduced permeability along the outer limit of the leach field. This zone is gradually stabilized in time and space and decreases solution seepage beyond the limits of the operational site. This process is considered in detail in 1.5.2.
In addition to the formation of these new minerals, other minerals may form at the margin of the zone where the neutralization of acid solutions occur. These additional minerals include: alunite — KAl3(SO4)2•2H2O, allophane — Al2O3•nSiO3•mH2O and jarosite — KFe3(SO4)2(OH)6. The chemical precipitation can be accompanied by co-precipitation of uranium compounds, thus impairing uranium recovery from the ore mass.
Special mention should be made of a group of evaporite minerals which can form as the result of evaporation in the pipe lines, settling ponds, airlifts, spillage, etc. The formation of these minerals usually begins with the appearance of white gypsum crystals separated from the
67
solutions at the liquid/gas phase interface. The solutions rise through the capillaries along the intercrystal boundaries in the gypsum aggregate and then evaporate, forming crusts of other sulphates, generally melanterite — FeSO4·7H2O and epsomite — MgSO4•7H2O. The colour of the new formation changes from blue at the solution boundary to green and yellow with a brown tint in less humid sites. In addition to the above new minerals, allophane, limonite and hydromuscovite may also occur among the evaporite minerals.
REFERENCES TO CHAPTER 2
[1] ARENS, V.J., GAIDIN, A.M., Geologic-Hydrogeologic Basis for Geotechnological Mineral Recovery Methods, M. Nedra (1978).
[2] BOITSOV, V.E., Workable Uranium Deposit Types and Conditions of their Genesis, General Scientific Directions in Development and Assimilation of Country’s Mineral Reserves. M. Nedra, 123–136 (1988).
[3] Geology and Genesis Problems of Endogenic Uranium Deposits (F.I. Volfson, Ed.), M. Nauka (1968).
[4] BOITSOV, V.E., et al., Geology and Uranium Deposits Exploration. M. MGRI (1984). [5] Hydrogenous Uranium Deposits (General Formation Theory) (A.I. Perelman, Ed.), M.
Atomizdat (1989). [6] GOTMAN, J.D., ZUBREV, I.N., Genetic Classification of Uranium Deposits, Sov.
Geology 3, 43–55 (1963). [7] DANCHEV, V.I., STRLJANOV, N.P., Stadial Ore Formation and Classification of
Exogenic Uranium Deposits, Geology of Ore Deposits 3, 11–24 (1976). [8] NOVIK-KACHAN, V.P., GUBKIN, N.V., DESJATNIKOV, D.T., CHESNOKOV,
N.I.M., Recovery of Metals by Leaching, Tsvetmetinformation (1970). [9] MAMILOV, V.A., PETROV, R.P, et al., Recovery of Uranium by In-Situ Leaching
Method, Atomizdat (1980). [10] KAZANSKI, V.I., LAVEROV, N.P., Uranium Deposits Ore Deposits of USSR, vol. 2
(V.I. Smirnov, Ed.), M. Nedra (1974). [11] KOTLAR, V.N., Geology and Genetic Types of Workable Uranium Deposits, M.
Gosgeoltekhiztat (1961). [12] LUTSENKO, I.K., BELETSKY, V.I., DAVYDOVA, L.G., Non-Mine Development of
Ore Deposits, M. Nedra (1986). [13] BAJUSHKIN, I.M., et al., M. Uranium and Rare Metal Deposits, Atomizdat (1976). [14] SHUMILIN, M.V., MUROMTSEV, N.N., BROVIN, K.G., et al., M. Exploration of
Uranium Deposits to be Worked by In-Situ Leaching Method, Nedra (1983). [15] HEINRICH, E.U., Mineralogy and Geology of Radioactive Minerals. M., Foreign Lit.
Publ. (1962). [16] TSVETKOVA, M.A., Effect of Mineralogical Composition on Filtration Properties and
Petroleum Yield, Tr. of Petroleum Institute, Academy of Sciences, USSR, vol. 3. (1954).
[17] SHMARIOVICH, E.M., Typization of Stratiform-Infiltration Deposits on Character of Artesian Basins, Sovetskaja Geologija 8 (1986).
[18] SHUMILIN, M.V., VIKENTJEV, V.A., Reserves Evaluation of Uranium Deposits. M. Nedra, 18–33 (1982).


69
Chapter 3
GEOLOGY OF SANDSTONE TYPE URANIUM DEPOSITS
3.1. LITHOLOGY AND FACIES OF DEPOSITS. CLASSIFICATION BY LITHOLOGY AND PERMEABILITY OF ORE AND HOST ROCKS [9]
The main objective of studying the lithology and facies of deposits amenable to ISL technology is classifying the ores and host rocks according to the characteristics affecting in situ leaching performance. These include lithologic features and permeability, and the distribution of these features in the horizontal and vertical directions in the orebody.
Maps and cross sections are prepared using the results of the analysis and testing of core samples, together with extensive geophysical surveying (primarily down hole logging). Both the laboratory and on-site hydrogeological and ISL investigations have an important role.
The lithologic and facies characteristics of the host rock have a major influence on the leaching parameters of the process. Studies are carried out at all stages of investigation starting with drilling and logging of stratigraphic holes. In this phase core samples are collected in at least 75% of the holes. These samples are used to establish the stratigraphic section of the sedimentary rocks. This includes the characteristics of the aquifer host, the material and mechanical composition of host rock and ores, their textural and structural characteristics, as well as the permeability.
Roll-type uranium deposits related to oxidation/reduction fronts are confined to inshore-marine, alluvial, and rarely — to proluvial facies generally presented by terrigenous (sands, gravels, mudstones, clays), sometimes — by terrigenous-chemical (i.e. marls and limestones) rock types. The tabular uranium deposits are developed in continental facies, predominantly alluvial, represented by terrigenous clayey sandstone sediments, rarely — by carbonaceous sediments such as peat, lignite and coal.
The rock strata hosting roll-type deposits characteristically consist of rhythmically graded sedimentary sequences. A single rhythmically graded sequence of rock may be subdivided into several (generally 4–5) graded beds with a base of coarse-grained sandy and gravely-sand sediments, grading to mudstones in the upper part.
The continental type is the most widespread among the roll-type uranium deposits. The basement is mainly covered by basal gravel and various sized, lens shaped sand bodies replaced along the strike by finer grained sandy deposits.
The fluvial facies predominate in the sequence. The ratio of graded alluvial sediments and flood plain boggy facies along the strike of the host horizon strongly influences the distribution of uranium and its amenability for leaching. The most massive ore deposits are confined to the alluvial facies. The flood plain facies usually contain low grade mineralization or barren rock. The upper part of graded section is mainly formed of medium and fine grained varieties. The extent of flood-plain facies increases, and the allevial facies completely disappear. The rhythmically graded section ends with claystone, often interbedded with dolomites and limestones. The rhythmically graded sequences typically have a thickness of 10 to 50 metres, sometimes, the upper part of a rhythmically graded sequence is eroded away and the upper horizon consists only of massive sand sediments.
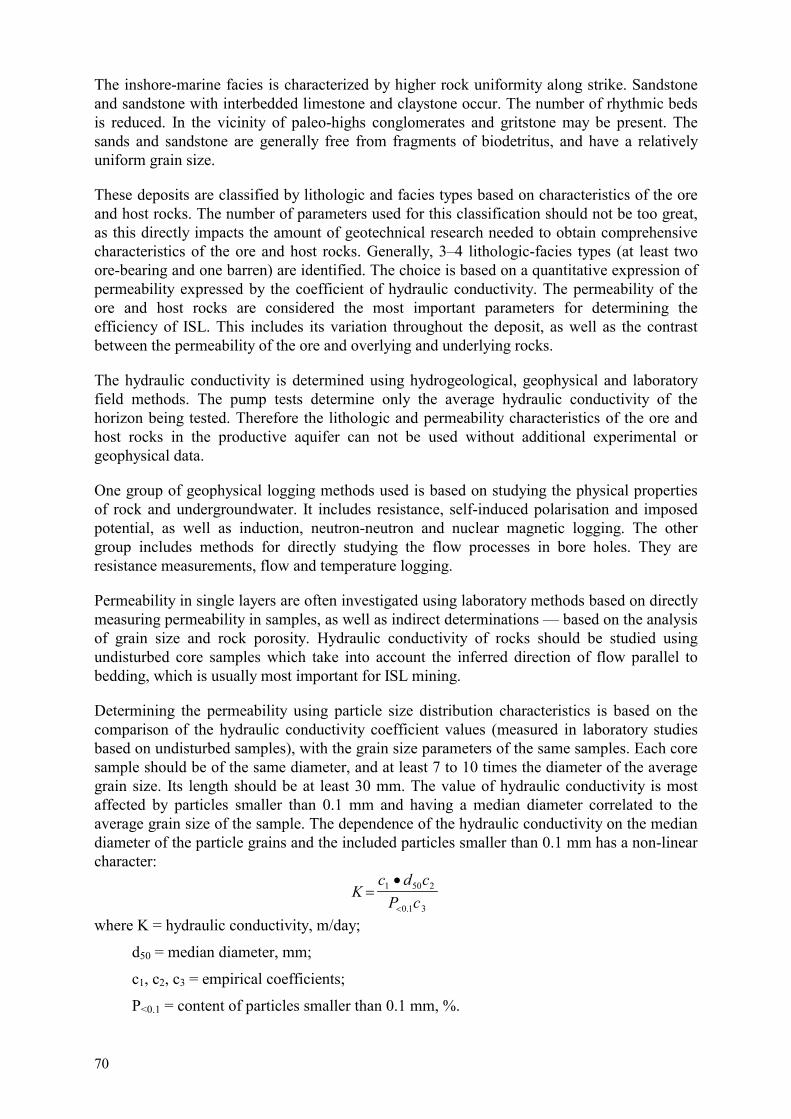
70
The inshore-marine facies is characterized by higher rock uniformity along strike. Sandstone and sandstone with interbedded limestone and claystone occur. The number of rhythmic beds is reduced. In the vicinity of paleo-highs conglomerates and gritstone may be present. The sands and sandstone are generally free from fragments of biodetritus, and have a relatively uniform grain size.
These deposits are classified by lithologic and facies types based on characteristics of the ore and host rocks. The number of parameters used for this classification should not be too great, as this directly impacts the amount of geotechnical research needed to obtain comprehensive characteristics of the ore and host rocks. Generally, 3–4 lithologic-facies types (at least two ore-bearing and one barren) are identified. The choice is based on a quantitative expression of permeability expressed by the coefficient of hydraulic conductivity. The permeability of the ore and host rocks are considered the most important parameters for determining the efficiency of ISL. This includes its variation throughout the deposit, as well as the contrast between the permeability of the ore and overlying and underlying rocks.
The hydraulic conductivity is determined using hydrogeological, geophysical and laboratory field methods. The pump tests determine only the average hydraulic conductivity of the horizon being tested. Therefore the lithologic and permeability characteristics of the ore and host rocks in the productive aquifer can not be used without additional experimental or geophysical data.
One group of geophysical logging methods used is based on studying the physical properties of rock and undergroundwater. It includes resistance, self-induced polarisation and imposed potential, as well as induction, neutron-neutron and nuclear magnetic logging. The other group includes methods for directly studying the flow processes in bore holes. They are resistance measurements, flow and temperature logging.
Permeability in single layers are often investigated using laboratory methods based on directly measuring permeability in samples, as well as indirect determinations — based on the analysis of grain size and rock porosity. Hydraulic conductivity of rocks should be studied using undisturbed core samples which take into account the inferred direction of flow parallel to bedding, which is usually most important for ISL mining.
Determining the permeability using particle size distribution characteristics is based on the comparison of the hydraulic conductivity coefficient values (measured in laboratory studies based on undisturbed samples), with the grain size parameters of the same samples. Each core sample should be of the same diameter, and at least 7 to 10 times the diameter of the average grain size. Its length should be at least 30 mm. The value of hydraulic conductivity is most affected by particles smaller than 0.1 mm and having a median diameter correlated to the average grain size of the sample. The dependence of the hydraulic conductivity on the median diameter of the particle grains and the included particles smaller than 0.1 mm has a non-linear character:
Kc d c
P c�
�
�
1 50 2
0 1 3.
where K = hydraulic conductivity, m/day;
d50 = median diameter, mm;
c1, c2, c3 = empirical coefficients;
P<0.1 = content of particles smaller than 0.1 mm, %.

71
The empirical coefficients are determined by regression analysis using the method of least squares.
Solving the linear equations system, such as:
� (lnC)1 = Lnc1 + c2(lnd50)1 – c3(lnP<0.1)1;
{.......................................................
� (lnC)i = Lnc1 + c2(lnd50)i – c3(lnP<0.1)i
determines the numerical values of the empirical coefficients.
Another common empirical formula for determining the hydraulic conductivity based on grain size data, is the more simple, though less rigorous, Hasen’s formula: K = P•deff, where K is the coefficient varying from 1200, for homogeneous sand, to 400, for clayey sand; deff is the effective diameter in millimetres corresponding to the 10% size fraction. Among the various empirical formulae there are those which take into account not only grain size analysis, but also porosity (Slichte’s, Krutcher’s formulae, etc.). All of them, however, only tentatively indicate the value of hydraulic conductivity or, in any case, must be confirmed by testing at the deposit under evaluation.
An important characteristic which affects the permeability of an aquifer is the heterogeneous structure of a rock resulting from facies variation. The study of the uniformity of ore and host rock permeability is directed at finding strata that have a relatively uniform hydraulic conductivity, and at mapping their distribution in both the horizontal and vertical directions. The location of ISL wells and well patterns must be planned taking into account these variations.
Due to natural heterogeneity of the sandy horizons, the permeability varies even over rock units of one lithologic type. Therefore, it is recommended the selection of beds or intervals included in a single unit should be made using the statistical average of permeability and its distribution. Sandstone units characterized by a stable statistical average can be considered homogeneous.
After determining the correlation between the hydraulic conductivity of the sediments and its granulometric composition, one can classify the sands using this information.
The selection and mapping of the variation of the hydraulic conductivity of the host rock should be carried out in the exploration stage. It should be done by mapping the grain size characteristics of samples taken from exploration boreholes and by using low permeability marker beds. Due to a high degree of variability, a unit with uniform permeability may include several sands with different grain size characteristics. Their hydraulic conductivity should differ from the adjacent lithologic and permeability types.
Thus, the summary data for the variation of hydraulic conductivity of the ores and host rock, their composition and geochemical characteristics form the basis for classification of the rock and ores under study.
Leaching parameters may be obtained based on the selected lithological and permeability classes of rock and ores after laboratory testing of representative samples in test columns (see
72
Chapter 5). The results of the investigations can be used to start classification of the rocks and ores based on such characteristics as permeability, cut-off grade, acid consumption and others parameters defining the leachability of the ore deposit.
3.2. INVESTIGATION OF GEOCHEMICAL FEATURES OF DEPOSITS AND EPIGENETIC ALTERATION [8, 9]
In the study of geochemical peculiarities and epigenetic alteration of sandstone hosted uranium deposits and their host rocks, the main task is selecting and mapping the border of the oxidation zone, both in plan and in vertical section. The border, or margin, determines the location and morphology of the ore bodies.
Epigenetic processes accompanying the formation of uranium mineralization (bitumization, carbonation, sulphidization, argilization and bleaching at sites of iron oxide decomposition) depend on the primary composition of the rocks, on their chemical characteristics, permeability and ability to interact with solutions flowing through them.
When studying the lithological and geochemical rock types, one should pay attention to rock colour. These include dark (to black), grey, green, white, mottled and red-coloured rock types. These colours may help indicate the geochemical conditions at the time of sediment deposition, as well as during subsequent alteration.
The rocks of the dark-coloured (or black) geochemical type usually contain abundant carbonaceous organic material (Corg > 0.1%), with sulphides and ferrous ions. Such sediments are formed under inshore-marine and subaqueous-deltaic conditions, in boggy sites along sea coasts and lacustrine-alluvial planes, as well as in the flood-plains of paleochannels.
The grey-coloured rock types are characterised by lower contents of organic material (Corg = 0.03 to 0.1%) and soluble ferrous and iron sulphides. These rocks are typical of marine and lacustrine-alluvial sedimentary complexes.
The other geochemical rock types are characterized by a near total absence of carbonaceous organic materials. These white rocks predominantly contain low concentrations (up to 0.3%) of ferrous iron.
The red coloured rocks predominantly contain ferric iron (oxidized) formed under arid and semiarid climate conditions in shallow-water sites (gulfs and lagoons) of marine basins, in drainage fans of piedmont plains and watershed areas of continental plains.
The mottled coloured geochemical type combines the properties of all of the above rock types.
Roll type uranium mineralization is located along the margins of the oxidized zone, where the zone pinches out within the limits of primary-dark-coloured and grey-coloured rocks. Uranium ores can also develop in rocks of other geochemical types that have undergone a secondary reduction. This can occur in sub-orogenic and inter-orogenic basins under the influence of ascending thermal solutions of abyssal circulation containing liquid and gaseous hydrocarbons, hydrogen sulphide and hydrogen. Sometimes, the rocks are subjected to epigenetic reduction due to argilization and silicification, and then to sulphidization and carbonation. In this case, the primary rocks retain their original character only in the most stable part of terrigenous material. The rest may take on entirely different lithologic, permeability and geochemical properties. This can affect the leaching performance depending
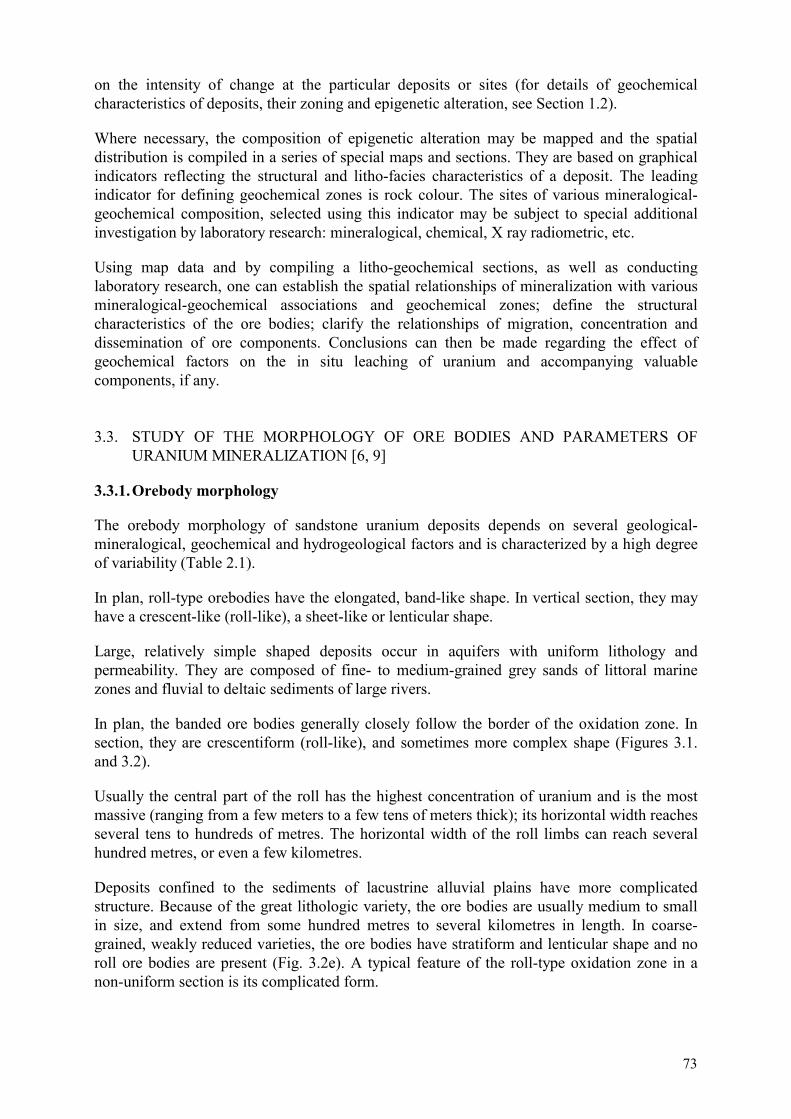
73
on the intensity of change at the particular deposits or sites (for details of geochemical characteristics of deposits, their zoning and epigenetic alteration, see Section 1.2).
Where necessary, the composition of epigenetic alteration may be mapped and the spatial distribution is compiled in a series of special maps and sections. They are based on graphical indicators reflecting the structural and litho-facies characteristics of a deposit. The leading indicator for defining geochemical zones is rock colour. The sites of various mineralogical-geochemical composition, selected using this indicator may be subject to special additional investigation by laboratory research: mineralogical, chemical, X ray radiometric, etc.
Using map data and by compiling a litho-geochemical sections, as well as conducting laboratory research, one can establish the spatial relationships of mineralization with various mineralogical-geochemical associations and geochemical zones; define the structural characteristics of the ore bodies; clarify the relationships of migration, concentration and dissemination of ore components. Conclusions can then be made regarding the effect of geochemical factors on the in situ leaching of uranium and accompanying valuable components, if any. 3.3. STUDY OF THE MORPHOLOGY OF ORE BODIES AND PARAMETERS OF
URANIUM MINERALIZATION [6, 9]
3.3.1. Orebody morphology
The orebody morphology of sandstone uranium deposits depends on several geological-mineralogical, geochemical and hydrogeological factors and is characterized by a high degree of variability (Table 2.1).
In plan, roll-type orebodies have the elongated, band-like shape. In vertical section, they may have a crescent-like (roll-like), a sheet-like or lenticular shape.
Large, relatively simple shaped deposits occur in aquifers with uniform lithology and permeability. They are composed of fine- to medium-grained grey sands of littoral marine zones and fluvial to deltaic sediments of large rivers.
In plan, the banded ore bodies generally closely follow the border of the oxidation zone. In section, they are crescentiform (roll-like), and sometimes more complex shape (Figures 3.1. and 3.2).
Usually the central part of the roll has the highest concentration of uranium and is the most massive (ranging from a few meters to a few tens of meters thick); its horizontal width reaches several tens to hundreds of metres. The horizontal width of the roll limbs can reach several hundred metres, or even a few kilometres.
Deposits confined to the sediments of lacustrine alluvial plains have more complicated structure. Because of the great lithologic variety, the ore bodies are usually medium to small in size, and extend from some hundred metres to several kilometres in length. In coarse-grained, weakly reduced varieties, the ore bodies have stratiform and lenticular shape and no roll ore bodies are present (Fig. 3.2e). A typical feature of the roll-type oxidation zone in a non-uniform section is its complicated form.
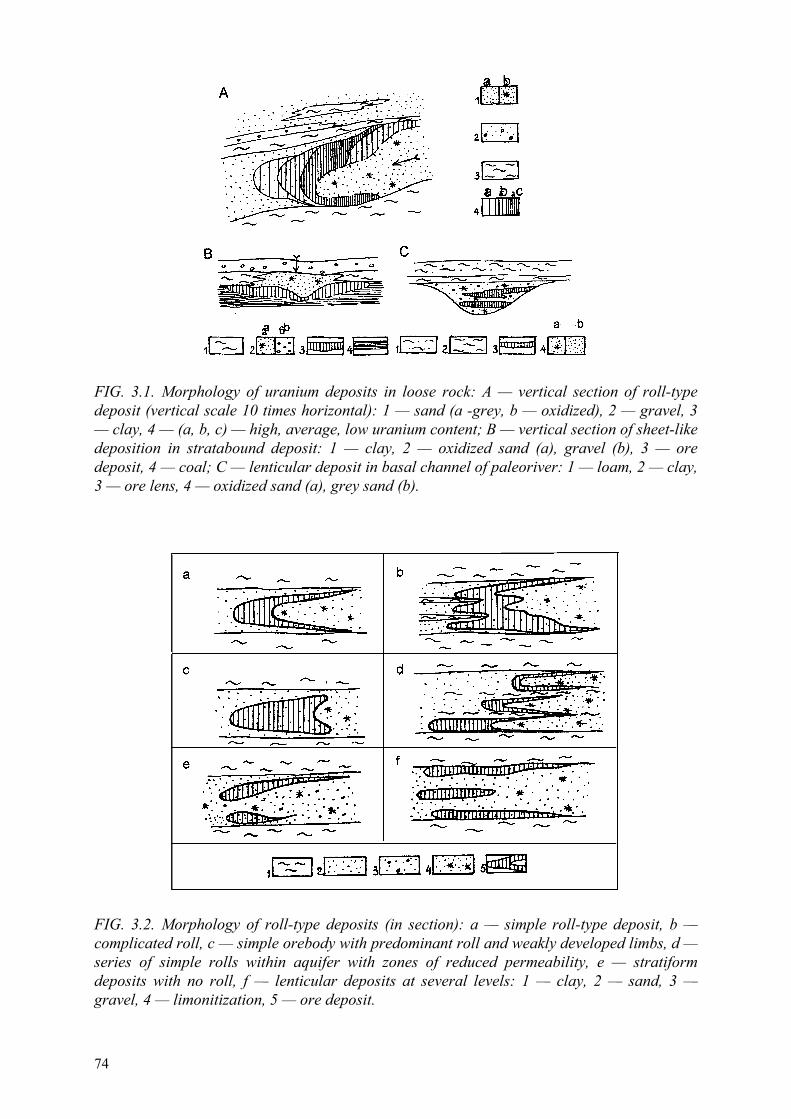
74
FIG. 3.1. Morphology of uranium deposits in loose rock: A — vertical section of roll-type deposit (vertical scale 10 times horizontal): 1 — sand (a -grey, b — oxidized), 2 — gravel, 3 — clay, 4 — (a, b, c) — high, average, low uranium content; B — vertical section of sheet-like deposition in stratabound deposit: 1 — clay, 2 — oxidized sand (a), gravel (b), 3 — ore deposit, 4 — coal; C — lenticular deposit in basal channel of paleoriver: 1 — loam, 2 — clay, 3 — ore lens, 4 — oxidized sand (a), grey sand (b).
FIG. 3.2. Morphology of roll-type deposits (in section): a — simple roll-type deposit, b — complicated roll, c — simple orebody with predominant roll and weakly developed limbs, d — series of simple rolls within aquifer with zones of reduced permeability, e — stratiform deposits with no roll, f — lenticular deposits at several levels: 1 — clay, 2 — sand, 3 — gravel, 4 — limonitization, 5 — ore deposit.
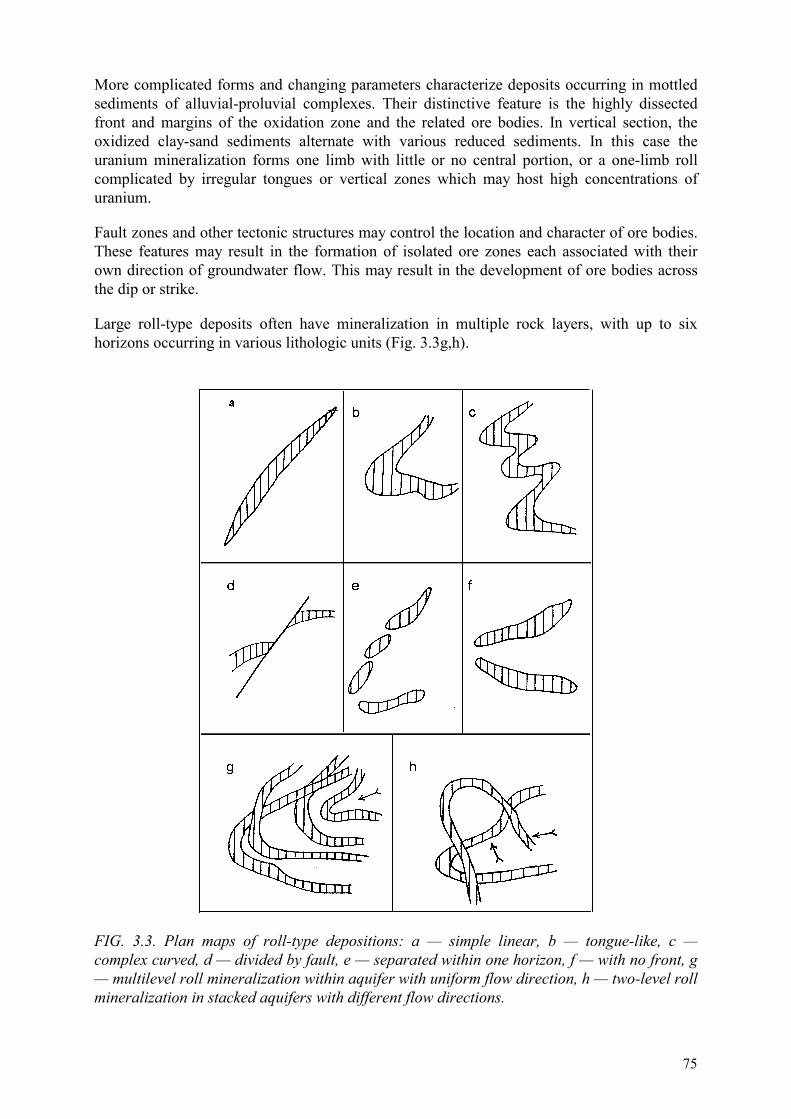
75
More complicated forms and changing parameters characterize deposits occurring in mottled sediments of alluvial-proluvial complexes. Their distinctive feature is the highly dissected front and margins of the oxidation zone and the related ore bodies. In vertical section, the oxidized clay-sand sediments alternate with various reduced sediments. In this case the uranium mineralization forms one limb with little or no central portion, or a one-limb roll complicated by irregular tongues or vertical zones which may host high concentrations of uranium.
Fault zones and other tectonic structures may control the location and character of ore bodies. These features may result in the formation of isolated ore zones each associated with their own direction of groundwater flow. This may result in the development of ore bodies across the dip or strike.
Large roll-type deposits often have mineralization in multiple rock layers, with up to six horizons occurring in various lithologic units (Fig. 3.3g,h).
FIG. 3.3. Plan maps of roll-type depositions: a — simple linear, b — tongue-like, c — complex curved, d — divided by fault, e — separated within one horizon, f — with no front, g — multilevel roll mineralization within aquifer with uniform flow direction, h — two-level roll mineralization in stacked aquifers with different flow directions.
76
Especially complicated structures occur in tabular uranium deposits related to basal channels incised in the basement (paleoriver beds). Small lenticular and stratiform bodies predominate. They may be up to 2 to 3 km in length, 300 to 600 m in width and 5 to 11 metres thick.
These sandstone uranium deposits (both roll-type and tabular) may have no clearly defined geological borders. Delineating the deposit limits is a difficult task requiring a highly qualified exploration geologist. Systematic organization of work helps to improve selection of the optimal leaching system, as well as the proper orientation of the well field network, spacing of the wells and planning the location of well screens.
Delineation of the ore bodies is done by taking into account the minimum grade cut-off, and minimum grade times thickness (GT cut-off), in meter percent.
This requires taking the following four groups of factors into account. The first group includes the most important factors used to divide deposits into zones taking into account the uniformity of lithology and permeability throughout the vertical extent of the deposit. They comprise: 1) the minimum acceptable hydraulic conductivity (Cmin = 0.5 to 1 m/day for most deposits); and 2) the maximum acceptable content of the clay-mudstone fraction (20 to 40% depending on the texture of the rock and ore); 3) the ratio of the ore thickness to the total sandstone thickness of the productive aquifer. This ratio helps determine the degree of dilution of the leachant (from 1:1 to 1:10), as well as the 4) ratio of the permeability of the ore to that of the enclosing rock (usually below 1:5).
The second group of factors is related to spatial changes in the composition of the ore and host rocks with regard to leaching characteristics. Attention should be paid to the composition and distribution of the ore mineralization, carbonate minerals, clay, sulphides and organic materials. The investigations should be accompanied by sampling of the various lithologic units to determine the permeability, leaching characteristics and geochemical properties of the host rock and ores. Maps of these characteristics should be compiled for each block or wellfield unit.
The third group of factors is directly related to the delineation of ore bodies according to the minimum economic cut-off parameters and the distribution of ore grade and thickness throughout the deposit, taking into account epigenetic zoning. These maps also indicate the distribution of any accompanying elements that may affect the leaching process.
The fourth group of factors relates to the environmental protection of any horizons supplying potable water. 3.3.2. Mapping uranium mineralization [1–4, 9, 10]
The main method of determining the parameters of uranium mineralization — the thickness and concentration of uranium in ore intersections — is gamma-logging of drill holes. The quantitative interpretation of gamma-logs is carried out in two stages: graphical — the immediate in-field assessment of mineralization, and the final — by personal computer (PC), taking into account any corrections required for radiometric disequilibrium and variation of the moisture content of the ore. During the process of preparing graphical logs, the mineralized interval should be displayed on a linear scale and compiled as detailed geological columns of the drill holes. These columnar sections are constructed throughout the interval of

77
the sandstone hosting the ore, generally at a scale of 1:50. The final quantitative interpretation by a PC is done using standard programmes for ten-centimetre beds.
The quantitative interpretation of gamma-logs requires the introduction of correction factors accounting for: absorption of gamma radiation by the drilling fluids (or muds) and hole casing (if any), the density and moisture content of ores, a calculation coefficient (c0), accounting for the any radioactive disequilibrium between chemical and radiometric uranium and radium and radon, as well as the contribution of thorium and potassium to the total gamma radiation.
Correction for absorption of gamma radiation by the drilling media and casing is determined using routine methods taking into account the actual drill hole diameter in the ore interval(s), the probe used, casing thickness and density of the drill media or mud. The customary diameter of drill holes used for exploring sandstone hosted deposits range from 76 to 112 mm. The actual hole diameter in the ore intervals is determined using a calliper tool to log 10 to 15% of the drill holes. The normal density of drilling mud is ~1.2g/cm3.
The calculation coefficient (co) relates the gamma count ratio with the uranium concentration assuming uranium is in radiometric equilibrium with the decay products. The primary gamma spectrum in gamma-logging is generally determined by measuring the gamma radiation of radium and its decay products. In roll-type sandstone hosted uranium deposits, where the ore composition primarily consists of silicates and alumino-silicates, and possible minor carbonate, the co value of 8.2 nA/kg per 0.01% of equilibrated uranium is used. In the interpretation of gamma-logs, the rock density and moisture content are considered to be constant. The thorium content in roll-type sandstone hosted deposits usually comprises a concentration of 3 to 6 × 10⁻⁴ weight % and potassium makes up 1.4 to 2.2%. At these concentrations no correction is necessary for these elements.
Radioactive decay of uranium results in the accumulation of radioactive isotopes of radium, 230Thorium, radon and others (Table 3.1).
TABLE 3.1. URANIUM AND RADIUM ISOTOPES DECAY CHARACTERISTICS
Isotope Half-life in years Half-life constant
Radiation type Isotope quantity equilibrated with 238U
238U
4.51 × 10⁹
4.88 × 10⁻¹⁸
alpha/gamma
1
234U 2.48 × 10⁵ 8.88 × 10⁻¹⁴ alpha 5.4 × 10⁻⁵ 230Th 7.52 × 10⁴ 2.92 × 10⁻¹³ alpha/gamma 1.61 × 10⁻⁵ 226Ra 1622 1.36 × 10⁻¹¹ alpha/gamma 3.49 × 10⁻⁷ 222Rn 3.8 days 2.10 × 10⁻⁶ alpha 2.17 × 10⁻¹²
Roll-type uranium deposits associated with undergroundwater flow are characterized by a disturbed radioactive equilibrium. Corrections made to the gamma-logging data for 230Thorium and radium have the most practical significance. Radium is insoluble in a sulphate and carbonate medium, but becomes mobile in a chloride or bicarbonate environment. 230Thorium is inert in the surficial weathering zone and does not migrate in an aqueous medium.
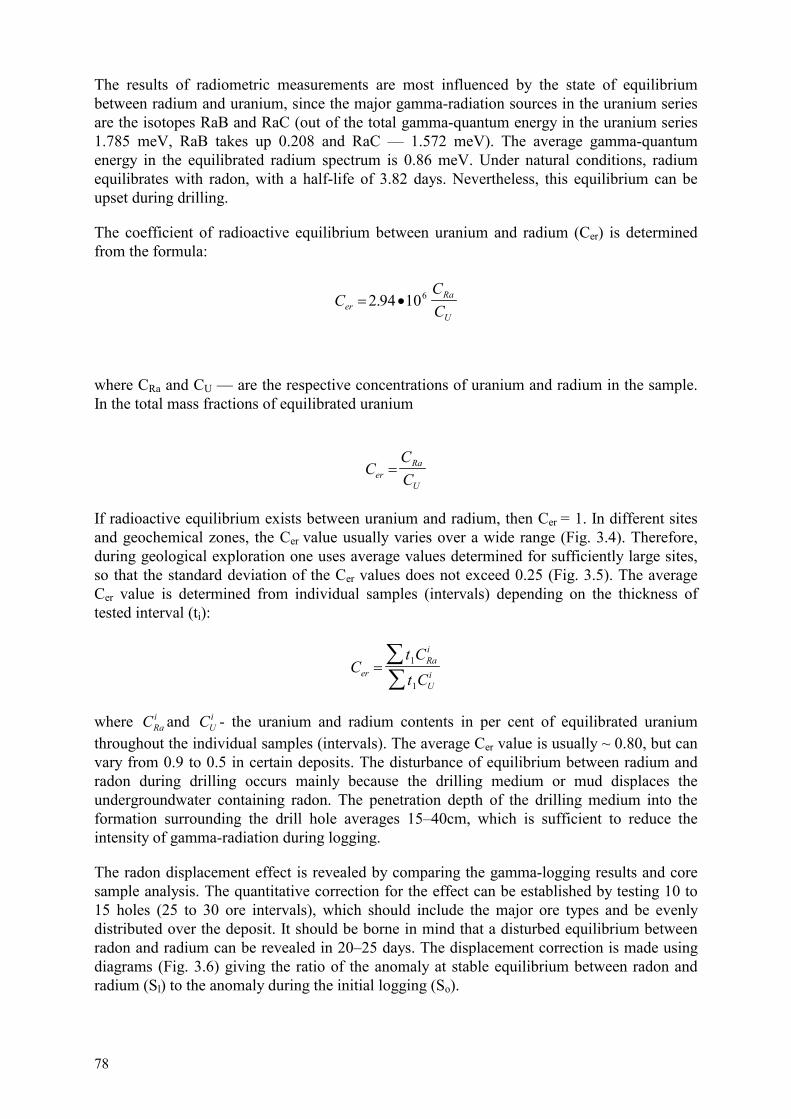
78
The results of radiometric measurements are most influenced by the state of equilibrium between radium and uranium, since the major gamma-radiation sources in the uranium series are the isotopes RaB and RaC (out of the total gamma-quantum energy in the uranium series 1.785 meV, RaB takes up 0.208 and RaC — 1.572 meV). The average gamma-quantum energy in the equilibrated radium spectrum is 0.86 meV. Under natural conditions, radium equilibrates with radon, with a half-life of 3.82 days. Nevertheless, this equilibrium can be upset during drilling.
The coefficient of radioactive equilibrium between uranium and radium (Cer) is determined from the formula:
CCCer
Ra
U� �2 94 106.
where CRa and CU — are the respective concentrations of uranium and radium in the sample. In the total mass fractions of equilibrated uranium
CCCer
Ra
U�
If radioactive equilibrium exists between uranium and radium, then Cer = 1. In different sites and geochemical zones, the Cer value usually varies over a wide range (Fig. 3.4). Therefore, during geological exploration one uses average values determined for sufficiently large sites, so that the standard deviation of the Cer values does not exceed 0.25 (Fig. 3.5). The average Cer value is determined from individual samples (intervals) depending on the thickness of tested interval (ti):
Ct Ct Cer
Rai
Ui�
�
�1
1
where CRai and CU
i - the uranium and radium contents in per cent of equilibrated uranium throughout the individual samples (intervals). The average Cer value is usually ~ 0.80, but can vary from 0.9 to 0.5 in certain deposits. The disturbance of equilibrium between radium and radon during drilling occurs mainly because the drilling medium or mud displaces the undergroundwater containing radon. The penetration depth of the drilling medium into the formation surrounding the drill hole averages 15–40cm, which is sufficient to reduce the intensity of gamma-radiation during logging.
The radon displacement effect is revealed by comparing the gamma-logging results and core sample analysis. The quantitative correction for the effect can be established by testing 10 to 15 holes (25 to 30 ore intervals), which should include the major ore types and be evenly distributed over the deposit. It should be borne in mind that a disturbed equilibrium between radon and radium can be revealed in 20–25 days. The displacement correction is made using diagrams (Fig. 3.6) giving the ratio of the anomaly at stable equilibrium between radon and radium (Sl) to the anomaly during the initial logging (So).

79
FIG. 3.4. Section showing relationship of radioactive equilibrium between uranium and radium in a roll-type uranium deposit: 1 — uranium ore deposit, 2 — sand, 3 — sandstone, 4 — clay, siltstone, 5 — zone of oxidation, 6 — leading radium halo, 7 — residual radium halo; numbers — Cer (= Cradium /Curanium) value in ore.
FIG. 3.5. Schematic plan view of radioactive disequilibrium in roll-type deposit: a — roll and upper limbl; b — roll and lower limb; 1 — border of oxidation zone, 2 — limit of ore deposit, 3 — Cer zone limits (S<0.25). Roman numerals — Nos. of Cer zones, numbers in boxes — average Cer value and standard deviation S.
FIG. 3.6. Change of radon/radium ratio as indicated by down-hole gamma logging following completion of drill hole. �S — gamma-anomaly increase So, for radon/radium equilibrium.
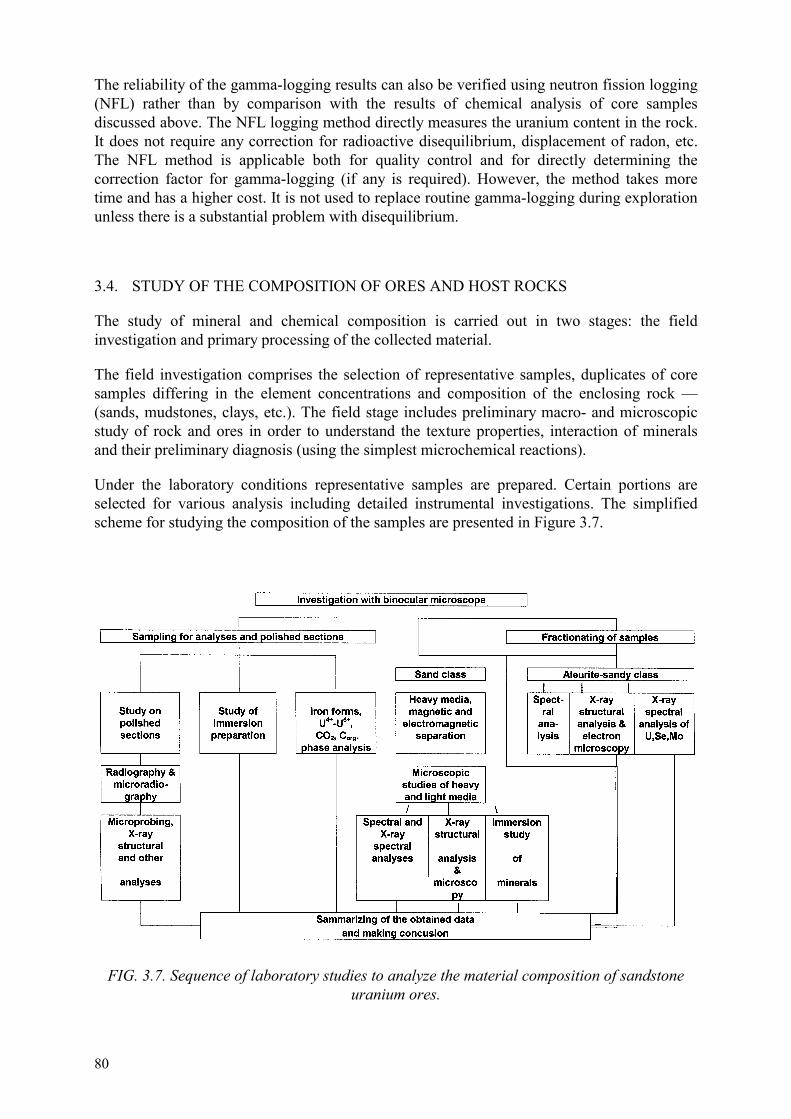
80
The reliability of the gamma-logging results can also be verified using neutron fission logging (NFL) rather than by comparison with the results of chemical analysis of core samples discussed above. The NFL logging method directly measures the uranium content in the rock. It does not require any correction for radioactive disequilibrium, displacement of radon, etc. The NFL method is applicable both for quality control and for directly determining the correction factor for gamma-logging (if any is required). However, the method takes more time and has a higher cost. It is not used to replace routine gamma-logging during exploration unless there is a substantial problem with disequilibrium.
3.4. STUDY OF THE COMPOSITION OF ORES AND HOST ROCKS
The study of mineral and chemical composition is carried out in two stages: the field investigation and primary processing of the collected material.
The field investigation comprises the selection of representative samples, duplicates of core samples differing in the element concentrations and composition of the enclosing rock — (sands, mudstones, clays, etc.). The field stage includes preliminary macro- and microscopic study of rock and ores in order to understand the texture properties, interaction of minerals and their preliminary diagnosis (using the simplest microchemical reactions).
Under the laboratory conditions representative samples are prepared. Certain portions are selected for various analysis including detailed instrumental investigations. The simplified scheme for studying the composition of the samples are presented in Figure 3.7.
FIG. 3.7. Sequence of laboratory studies to analyze the material composition of sandstone uranium ores.
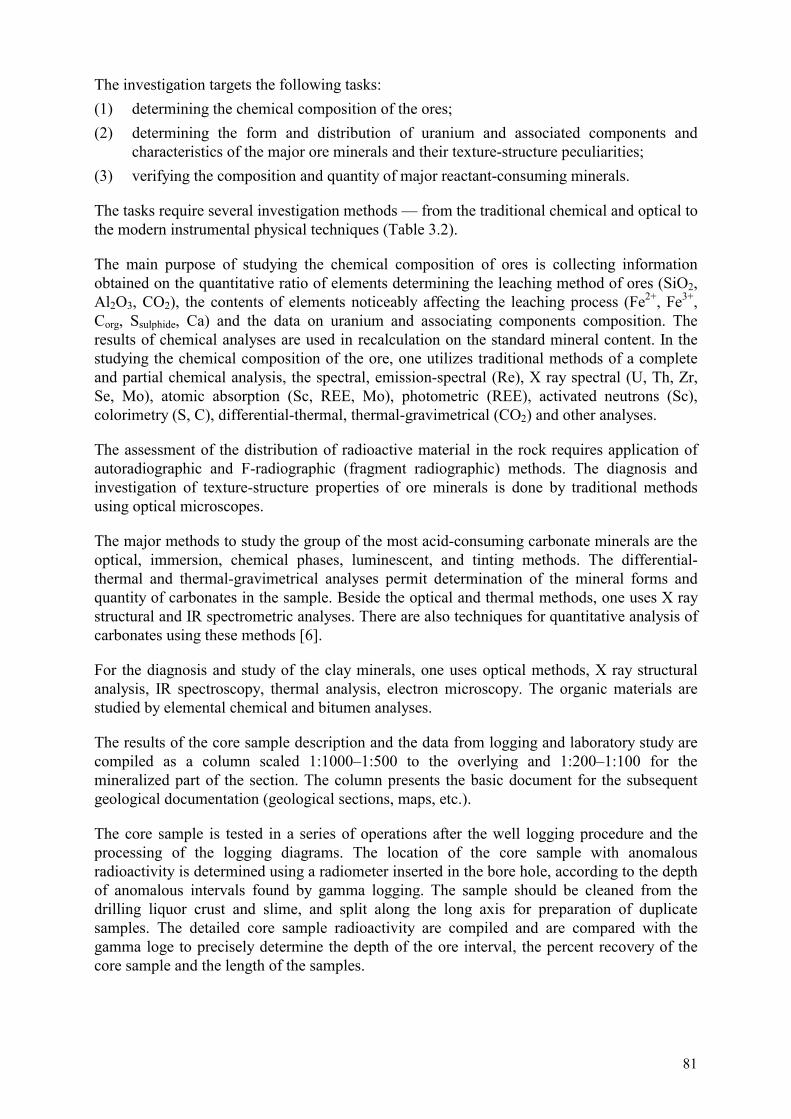
81
The investigation targets the following tasks: (1) determining the chemical composition of the ores; (2) determining the form and distribution of uranium and associated components and
characteristics of the major ore minerals and their texture-structure peculiarities; (3) verifying the composition and quantity of major reactant-consuming minerals.
The tasks require several investigation methods — from the traditional chemical and optical to the modern instrumental physical techniques (Table 3.2).
The main purpose of studying the chemical composition of ores is collecting information obtained on the quantitative ratio of elements determining the leaching method of ores (SiO2, Al2O3, CO2), the contents of elements noticeably affecting the leaching process (Fe2+, Fe3+, Corg, Ssulphide, Ca) and the data on uranium and associating components composition. The results of chemical analyses are used in recalculation on the standard mineral content. In the studying the chemical composition of the ore, one utilizes traditional methods of a complete and partial chemical analysis, the spectral, emission-spectral (Re), X ray spectral (U, Th, Zr, Se, Mo), atomic absorption (Sc, REE, Mo), photometric (REE), activated neutrons (Sc), colorimetry (S, C), differential-thermal, thermal-gravimetrical (CO2) and other analyses.
The assessment of the distribution of radioactive material in the rock requires application of autoradiographic and F-radiographic (fragment radiographic) methods. The diagnosis and investigation of texture-structure properties of ore minerals is done by traditional methods using optical microscopes.
The major methods to study the group of the most acid-consuming carbonate minerals are the optical, immersion, chemical phases, luminescent, and tinting methods. The differential-thermal and thermal-gravimetrical analyses permit determination of the mineral forms and quantity of carbonates in the sample. Beside the optical and thermal methods, one uses X ray structural and IR spectrometric analyses. There are also techniques for quantitative analysis of carbonates using these methods [6].
For the diagnosis and study of the clay minerals, one uses optical methods, X ray structural analysis, IR spectroscopy, thermal analysis, electron microscopy. The organic materials are studied by elemental chemical and bitumen analyses.
The results of the core sample description and the data from logging and laboratory study are compiled as a column scaled 1:1000–1:500 to the overlying and 1:200–1:100 for the mineralized part of the section. The column presents the basic document for the subsequent geological documentation (geological sections, maps, etc.).
The core sample is tested in a series of operations after the well logging procedure and the processing of the logging diagrams. The location of the core sample with anomalous radioactivity is determined using a radiometer inserted in the bore hole, according to the depth of anomalous intervals found by gamma logging. The sample should be cleaned from the drilling liquor crust and slime, and split along the long axis for preparation of duplicate samples. The detailed core sample radioactivity are compiled and are compared with the gamma loge to precisely determine the depth of the ore interval, the percent recovery of the core sample and the length of the samples.
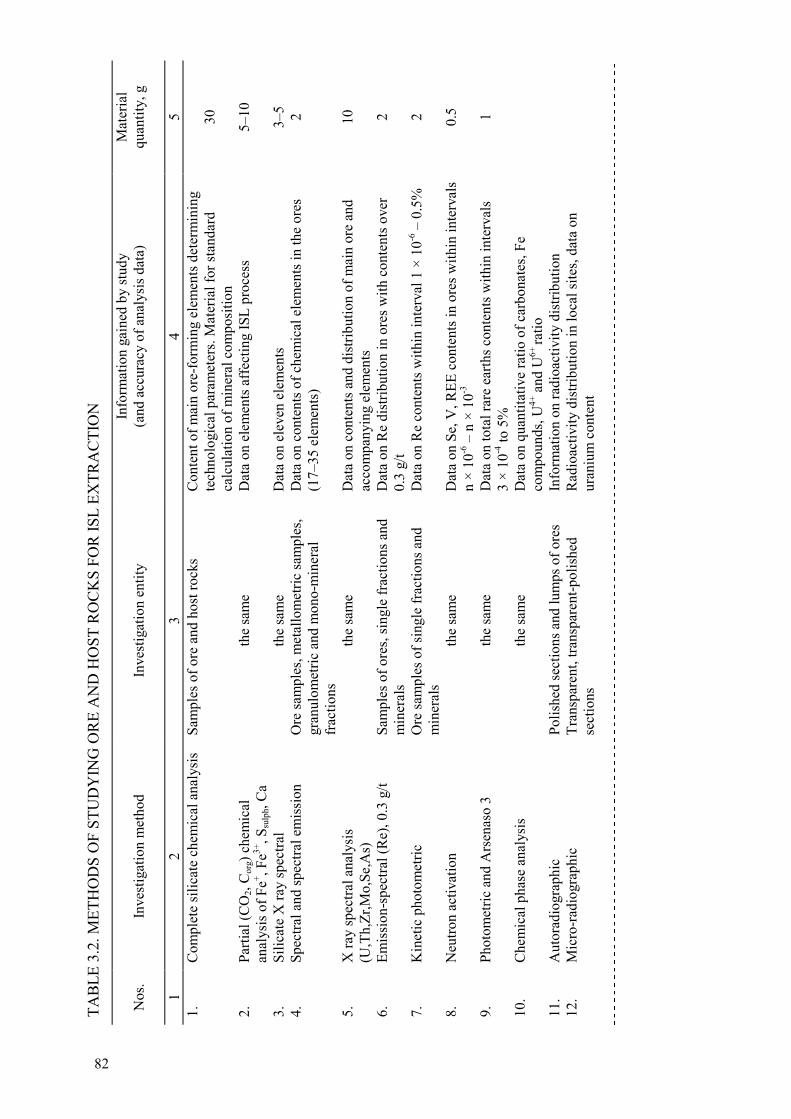
TAB
LE 3
.2. M
ETH
OD
S O
F ST
UD
YIN
G O
RE
AN
D H
OST
RO
CK
S FO
R IS
L EX
TRA
CTI
ON
N
os.
In
vest
igat
ion
met
hod
In
vest
igat
ion
entit
y In
form
atio
n ga
ined
by
stud
y
(and
acc
urac
y of
ana
lysi
s dat
a)
Mat
eria
l qu
antit
y, g
1 2
3 4
5 1.
C
ompl
ete
silic
ate
chem
ical
ana
lysi
s Sa
mpl
es o
f ore
and
hos
t roc
ks
Con
tent
of m
ain
ore-
form
ing
elem
ents
det
erm
inin
g te
chno
logi
cal p
aram
eter
s. M
ater
ial f
or st
anda
rd
calc
ulat
ion
of m
iner
al c
ompo
sitio
n
30
2.
Parti
al (C
O2,
Cor
g) ch
emic
al
anal
ysis
of F
e+ , Fe3+
, Ssu
lph,
Ca
the
sam
e D
ata
on e
lem
ents
aff
ectin
g IS
L pr
oces
s 5–
10
3.
Silic
ate
X ra
y sp
ectra
l th
e sa
me
Dat
a on
ele
ven
elem
ents
3–
5 4.
Sp
ectra
l and
spec
tral e
mis
sion
O
re sa
mpl
es, m
etal
lom
etric
sam
ples
, gr
anul
omet
ric a
nd m
ono-
min
eral
fr
actio
ns
Dat
a on
con
tent
s of c
hem
ical
ele
men
ts in
the
ores
(1
7–35
ele
men
ts)
2
5.
X ra
y sp
ectra
l ana
lysi
s (U
,Th,
Zr,M
o,Se
,As)
th
e sa
me
Dat
a on
con
tent
s and
dis
tribu
tion
of m
ain
ore
and
acco
mpa
nyin
g el
emen
ts
10
6.
Emis
sion
-spe
ctra
l (R
e), 0
.3 g
/t Sa
mpl
es o
f ore
s, si
ngle
frac
tions
and
m
iner
als
Dat
a on
Re
dist
ribut
ion
in o
res w
ith c
onte
nts o
ver
0.3
g/t
2
7.
Kin
etic
pho
tom
etric
O
re sa
mpl
es o
f sin
gle
frac
tions
and
m
iner
als
Dat
a on
Re
cont
ents
with
in in
terv
al 1
× 1
0-6 –
0.5
%
2
8.
Neu
tron
activ
atio
n th
e sa
me
Dat
a on
Se,
V, R
EE c
onte
nts i
n or
es w
ithin
inte
rval
s n
× 10
-6 –
n ×
10-3
0.
5
9.
Phot
omet
ric a
nd A
rsen
aso
3 th
e sa
me
Dat
a on
tota
l rar
e ea
rths c
onte
nts w
ithin
inte
rval
s 3
× 10
-4 to
5%
1
10.
Che
mic
al p
hase
ana
lysi
s th
e sa
me
Dat
a on
qua
ntita
tive
ratio
of c
arbo
nate
s, Fe
co
mpo
unds
, U4+
and
U6+
ratio
11.
Aut
orad
iogr
aphi
c Po
lishe
d se
ctio
ns a
nd lu
mps
of o
res
Info
rmat
ion
on ra
dioa
ctiv
ity d
istri
butio
n
12.
Mic
ro-ra
diog
raph
ic
Tran
spar
ent,
trans
pare
nt-p
olis
hed
sect
ions
R
adio
activ
ity d
istri
butio
n in
loca
l site
s, da
ta o
n ur
aniu
m c
onte
nt
82
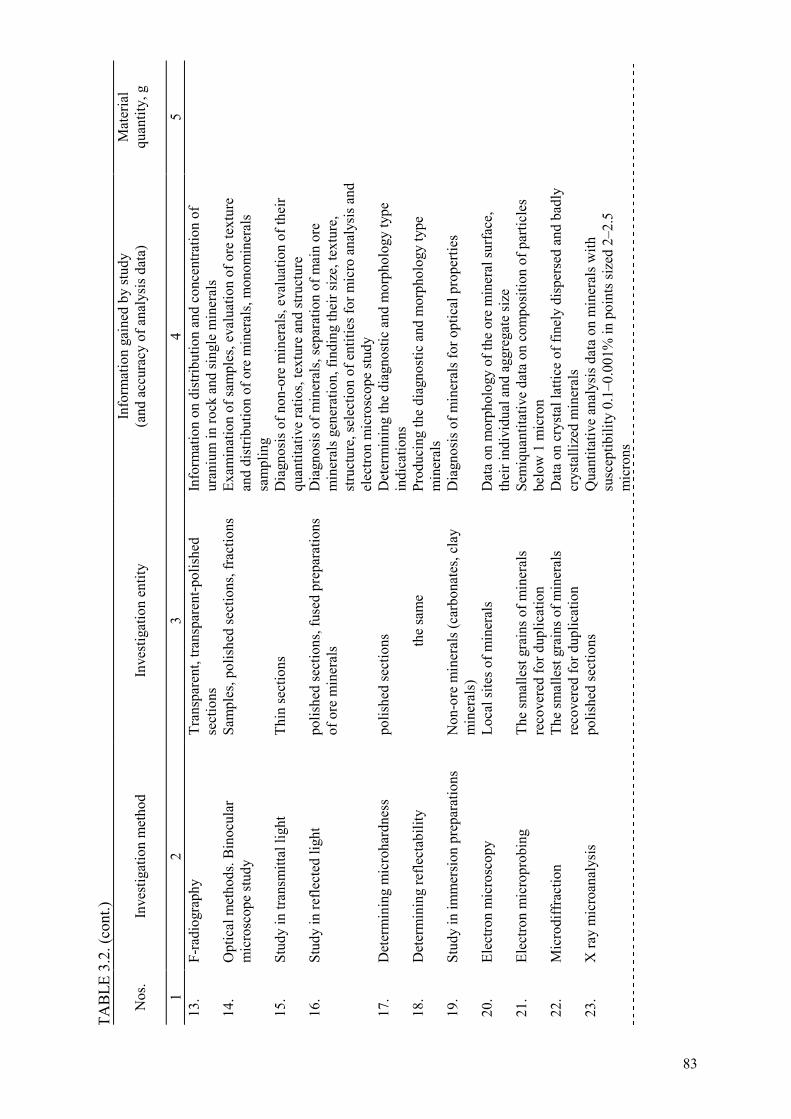
TAB
LE 3
.2. (
cont
.)
Nos
.
In
vest
igat
ion
met
hod
In
vest
igat
ion
entit
y In
form
atio
n ga
ined
by
stud
y
(and
acc
urac
y of
ana
lysi
s dat
a)
Mat
eria
l qu
antit
y, g
1 2
3 4
5 13
. F-
radi
ogra
phy
Tran
spar
ent,
trans
pare
nt-p
olis
hed
sect
ions
In
form
atio
n on
dis
tribu
tion
and
conc
entra
tion
of
uran
ium
in ro
ck a
nd si
ngle
min
eral
s
14.
Opt
ical
met
hods
. Bin
ocul
ar
mic
rosc
ope
stud
y Sa
mpl
es, p
olis
hed
sect
ions
, fra
ctio
ns
Exam
inat
ion
of sa
mpl
es, e
valu
atio
n of
ore
text
ure
and
dist
ribut
ion
of o
re m
iner
als,
mon
omin
eral
s sa
mpl
ing
15.
Stud
y in
tran
smitt
al li
ght
Thin
sect
ions
D
iagn
osis
of n
on-o
re m
iner
als,
eval
uatio
n of
thei
r qu
antit
ativ
e ra
tios,
text
ure
and
stru
ctur
e
16.
Stud
y in
refle
cted
ligh
t po
lishe
d se
ctio
ns, f
used
pre
para
tions
of
ore
min
eral
s D
iagn
osis
of m
iner
als,
sepa
ratio
n of
mai
n or
e m
iner
als g
ener
atio
n, fi
ndin
g th
eir s
ize,
text
ure,
st
ruct
ure,
sele
ctio
n of
ent
ities
for m
icro
ana
lysi
s and
el
ectro
n m
icro
scop
e st
udy
17.
Det
erm
inin
g m
icro
hard
ness
po
lishe
d se
ctio
ns
Det
erm
inin
g th
e di
agno
stic
and
mor
phol
ogy
type
in
dica
tions
18.
Det
erm
inin
g re
flect
abili
ty
the
sam
e Pr
oduc
ing
the
diag
nost
ic a
nd m
orph
olog
y ty
pe
min
eral
s
19.
Stud
y in
imm
ersi
on p
repa
ratio
ns
Non
-ore
min
eral
s (ca
rbon
ates
, cla
y m
iner
als)
D
iagn
osis
of m
iner
als f
or o
ptic
al p
rope
rties
20.
Elec
tron
mic
rosc
opy
Loca
l site
s of m
iner
als
Dat
a on
mor
phol
ogy
of th
e or
e m
iner
al su
rfac
e,
thei
r ind
ivid
ual a
nd a
ggre
gate
size
21.
Elec
tron
mic
ropr
obin
g Th
e sm
alle
st g
rain
s of m
iner
als
reco
vere
d fo
r dup
licat
ion
Sem
iqua
ntita
tive
data
on
com
posi
tion
of p
artic
les
belo
w 1
mic
ron
22.
Mic
rodi
ffra
ctio
n Th
e sm
alle
st g
rain
s of m
iner
als
reco
vere
d fo
r dup
licat
ion
D
ata
on c
ryst
al la
ttice
of f
inel
y di
sper
sed
and
badl
y cr
ysta
llize
d m
iner
als
23.
X ra
y m
icro
anal
ysis
po
lishe
d se
ctio
ns
Qua
ntita
tive
anal
ysis
dat
a on
min
eral
s with
su
scep
tibili
ty 0
.1–0
.001
% in
poi
nts s
ized
2–2
.5
mic
rons
83

TA
BLE
3.2
. (co
nt.)
N
os.
In
vest
igat
ion
met
hod
In
vest
igat
ion
entit
y In
form
atio
n ga
ined
by
stud
y
(and
acc
urac
y of
ana
lysi
s dat
a)
Mat
eria
l qu
antit
y, g
1 2
3 4
5 24
. Th
erm
al a
naly
sis
Ore
sam
ples
of o
re-e
nclo
sing
rock
D
iagn
osis
of c
arbo
nate
s, cl
ayey
min
eral
s, m
icas
. Q
uant
itativ
e an
d se
miq
uant
itativ
e da
ta o
n co
nten
ts
of c
arbo
nate
s, cl
ayey
min
eral
s, or
gani
cs, m
icas
, etc
.
3
25.
IR sp
ectro
met
ry
the
sam
e D
iagn
osis
of m
iner
als,
crys
talli
ne-c
hem
ical
ch
arac
ter o
f min
eral
s, da
ta o
n co
nten
ts o
f sin
gle
min
eral
s (ka
olin
ite, c
arbo
nate
s
0.5
26.
X ra
y st
ruct
ural
ana
lysi
s Sa
mpl
es o
f ore
s, fr
actio
ns a
nd
min
eral
s D
iagn
osis
of m
iner
als,
dete
rmin
ing
para
met
ers o
f cr
ysta
l lat
tice,
qua
ntita
tive
and
sem
iqua
ntita
tive
data
on
con
tent
s of s
ome
X ra
y ab
sorb
ing
min
eral
s (c
arbo
nate
s, ch
lorit
es, c
laye
y m
iner
als)
84

85
When the recovery of the core sample is above 70% of the ore interval, as determined by gamma-logging, the sample is analyzed for uranium. A few of the samples are analyzed for selenium and molybdenum content.
Using the geological description of the sample as a basis, together with the radiometry, selenium and molybdenum determinations, the interval of sample sections are indicated in the log with an assignment for each of them. The following rules are observed:
(1) The section should include rock homogeneous in composition and of the same geochemical type with similar values of radioactivity, selenium and molybdenum concentration. A section should not include both water-impermeable and permeable rocks, or both oxidized and reduced rocks.
(2) At an ore interval thickness below 1 metre, the recommended length of the section sample is 20–30 cm; for ore intervals 1–2 metres thick the section length is 30–50 cm, and with a thickness exceeding 2 metres, it can be increased to 1 metre.
(3) The length of the section characterizing the rock and ore at the ore boundary should not exceed 20 cm.
(4) The uranium and radium contents are to be determined by samples assigned in the intervals of abnormal radioactivity with the intensity logged above 3.5 nA/kg, as well as by two samples in the roof and at the bottom of each ore interval.
(5) The determination of selenium and molybdenum of the samples are taken independently of the core recovery, as well as in the roof and at the bottom of these ore intervals.
The results of testing, trials of samples and analyses are to be recorded in the test log.
The physical properties and material composition are determined using a test procedure including selection of samples for determining the volumetric mass, moisture content, grain size distribution, carbonate content, etc. are also determined. The same material taken as representative sections is used for studying the mineral-geochemical properties of ore and enclosing rock, concentrations of other impurities affecting the ISL process (Corg, bitumen, P2O5, clay composition, Fe forms, etc.), as well as the density and moisture content.
A reliable average of these values for each ore type in the deposit requires at least 30 to 40 samples of each lithologic variety. The samples are taken from fresh core of undisturbed structure and natural moisture content. In order to determine the water-physical properties at the laboratory, the core sample should be cleaned from slime and mud, wrapped in cheese cloth and coated in parafin. The water permeability of the rock is determined with the use of special cutting rings; the surplus rock at the ends is removed, after which the sample is tightly covered and sealed (see Chapter 5).
The sample testing for determining the grain size distribution of ores and host is conducted in sections throughout the ore-bearing aquifer. The sections are taken from a quartered sample across the diameter. The sample includes only one rock type. Some specimen are analyzed to determine the carbonate (CO2) content.
The sample network spacing for the analysis of the granulometric composition and carbonate content depends on the variation of these parameters over the ore deposit, the ore

86
bodies and the wellfield size. As the rule, the test bore hole sample network is 2–4 times less dense than the network for mapping uranium.
3.5. EXPLORATION FOR URANIUM DEPOSITS FOR ISL
3.5.1. Exploring and delineating uranium deposits for ISL extraction
Special factors must be taken into account while exploring for and delineating uranium deposits for ISL extraction because of the specific information required for planning leaching, as underground fluid flow is governed by the laws of hydrodynamics. Sandstone hosted deposits are leached using the ISL method though wells developed from the surface. The leach solutions may circulate through a rock volume that is significantly greater than the volume of the ore deposit.
An essential feature that makes ores suitable for ISL extraction is permeability to solutions. If the ore is not permeable the process will not work. Therefore the exploration of deposits for ISL mining must include a detailed investigation of permeability of the ore, both parallel to and at right angles to the bedding. Other hydrogeological characteristics must also be determined.
It is necessary to investigate the geotechnological parameters of both the ore and host rock. The need for precision in defining the limits of a leachable deposit in the plan view is high, since any major deviation between the deposit limit and the limits used in designing wellfields will result in several problems. This may require changing the operating scheme, as such deviations may reduce the amount of recoverable uranium and increase the cost of recovery. A high degree of precision is also required in estimating the average amount of uranium to be recovered from single wellfield units and individual well patterns.
On the whole there may be less strict requirements than for delineating recoverable ores for conventional mining, since the seepage of the solutions in the section, even with well screens installed in the ore interval, remains quite extensive and involves a large portion of the productive aquifer thickness. There are also special requirements for estimating the grade, delineating the ore bodies for leaching and evaluating reserves. ISL amenable ores are subdivided in the usual way — the economic and non-economic ores. However, the non-economic ores may include not only those ores with a below minimum grade and gradex thickness (GXT) cut-off and/or non-economic reserves, but also those with unacceptable low permeability (so called “non-leachable mineralization”).
The morphology of roll-type ore bodies makes it possible to delineate the ore by drilling lines of holes oriented perpendicular to the trend of the oxidation-reduction front hosting the ore. These more or less parallel lines of holes form a grid. The orientation of the drill grid is established during the stage of preliminary exploration taking into account the inferred location of the oxidation zone for roll-type deposits or the axis of the paleovalley for tabular deposits developed in basal channels. The orientation of the section is established perpendicular to the average trend of the orebodies.
The distance between the exploration drill hole sections is mainly determined by the configuration of the ore deposit in plan view. If necessary, the spacing of drill holes can be arbitrarily reduced to provide more detail, or some additional control sections can be added normal to the main net (Fig. 3.7). In the area where the oxidation zone pinches out and at the inferred location of the roll, the spacing between holes and sectuibs is sometimes
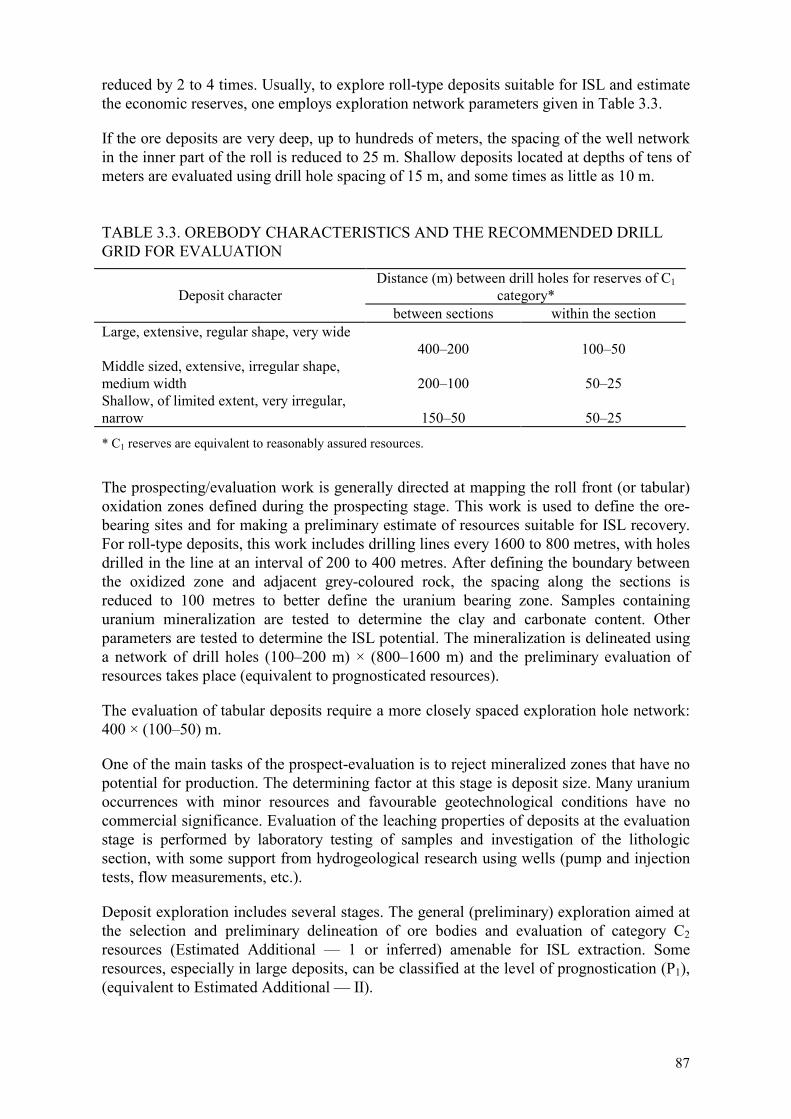
87
reduced by 2 to 4 times. Usually, to explore roll-type deposits suitable for ISL and estimate the economic reserves, one employs exploration network parameters given in Table 3.3.
If the ore deposits are very deep, up to hundreds of meters, the spacing of the well network in the inner part of the roll is reduced to 25 m. Shallow deposits located at depths of tens of meters are evaluated using drill hole spacing of 15 m, and some times as little as 10 m. TABLE 3.3. OREBODY CHARACTERISTICS AND THE RECOMMENDED DRILL GRID FOR EVALUATION
Deposit character
Distance (m) between drill holes for reserves of C1 category*
between sections within the section Large, extensive, regular shape, very wide
400–200
100–50 Middle sized, extensive, irregular shape, medium width
200–100
50–25
Shallow, of limited extent, very irregular, narrow
150–50
50–25
* C1 reserves are equivalent to reasonably assured resources.
The prospecting/evaluation work is generally directed at mapping the roll front (or tabular) oxidation zones defined during the prospecting stage. This work is used to define the ore-bearing sites and for making a preliminary estimate of resources suitable for ISL recovery. For roll-type deposits, this work includes drilling lines every 1600 to 800 metres, with holes drilled in the line at an interval of 200 to 400 metres. After defining the boundary between the oxidized zone and adjacent grey-coloured rock, the spacing along the sections is reduced to 100 metres to better define the uranium bearing zone. Samples containing uranium mineralization are tested to determine the clay and carbonate content. Other parameters are tested to determine the ISL potential. The mineralization is delineated using a network of drill holes (100–200 m) × (800–1600 m) and the preliminary evaluation of resources takes place (equivalent to prognosticated resources).
The evaluation of tabular deposits require a more closely spaced exploration hole network: 400 × (100–50) m.
One of the main tasks of the prospect-evaluation is to reject mineralized zones that have no potential for production. The determining factor at this stage is deposit size. Many uranium occurrences with minor resources and favourable geotechnological conditions have no commercial significance. Evaluation of the leaching properties of deposits at the evaluation stage is performed by laboratory testing of samples and investigation of the lithologic section, with some support from hydrogeological research using wells (pump and injection tests, flow measurements, etc.).
Deposit exploration includes several stages. The general (preliminary) exploration aimed at the selection and preliminary delineation of ore bodies and evaluation of category C2 resources (Estimated Additional — 1 or inferred) amenable for ISL extraction. Some resources, especially in large deposits, can be classified at the level of prognostication (P1), (equivalent to Estimated Additional — II).

88
The preliminary survey results are used for a feasibility study proving the expediency of and priorities in the commercial development of the deposit and the preparation of Technical Feasibility Report (TFR). The related calculations require information from leach field tests carried out at the potential ISL sites.
At the preliminary stage of exploration of roll type deposits, the bore hole profiles are at a spacing of 400–800 m and the holes along the profile are spaced at up to 100–200 m, or as little as 50 m. Prior to the field tests, the network spacing is arbitrarily reduced to 100–50 m, or less, to start development of the ISL site.
For stratabound deposits, the exploration network for the C2 (RAR) reserve category is generally arranged 200 by (50–25) m. It is also reduced at the sites of proposed ISL tests. At this stage hydrogeological conditions over the area are investigated by pump, injection and other tests using specially prepared wells.
The major task of the preliminary exploration is the selection of minable ore bodies that are recommended for detailed evaluation. The deposit reserves estimated more precisely, geotechnological section type and ores defined and a final decision is taken on the feasibility of the main ore zones to be extracted by ISL.
Detailed exploration is undertaken at the deposits following positive conclusions of the preliminary evaluation results and further development is recommended.
The detailed survey should provide all the necessary data on the ISL parameters of the deposit required for designing the project. These data are usually obtained during operation of an ISL pilot plant.
Information collected in the detailed survey is also used to upgrade the C2 reserves into the C1 category (RAR). Upgrading the resources to any higher category is usually not required for ISL operations because of the large areas effected by leaching solutions. The recommended network density required for classifying resources in the C1 category is presented in Table 3.3. 3.5.2. Parameters for resource evaluation for ISL extraction
The conditions required for the evaluation of ISL uranium reserves are to be determined from the feasibility study compiled taking into account the permeability of the ore and productivity of the ore, the thickness of the ore host horizon, carbonate content, depth of the ore and the hydrostatic level of ore aquifer. The main specific leach indices are: the L:S value for the desired degree of uranium recovery, the planned average uranium content in the recovered solution, and consumption of reactant.
On the basis of numerous data from analyzing the uranium content of drill core collected before and after ISL extraction a minimum cut-off of 0.01% U is used to prepare all resource estimates for ISL mining.
In the case where additional valuable associated components occur in a deposit, some additional minimum cut-off grades should be introduced to define their minimum content. This is taken into account as optional uranium content using recalculation coefficients. In some cases the resources and value of the accompanying elements (Mo, V, Se, Re, Sc, etc.)
89
are so significant, that they may permit evaluation of the deposit as a co or by-product producer.
The maximum allowable amount of clay and/or mudstone included in the ore interval is determined from experience based on the conditions facilitating a profitable operation. Therefore the results of laboratory experiments, field tests and pilot plant operations are used to establish this limit. Results of operational practice show that with a uranium content of 0.01–0.3% in a sequence with 20–40% clay-mudstone one can recover from 40 to 60% of the uranium in about 3–4 years of leaching. This 20–40% fraction of clay-mudstone provides a filtration coefficient of ~1 m/day, which is considered as the limit for the inclusion of the payable ores in the resource calculation.
The maximum thickness of the permeable barren rock layer within the ore intersection, limited to 5–6 m, is used for deposits with a complex distribution of ore intervals and in well network of 15–25 m × 50–70 m in horizons of medium (25–30 m) and greater (over 30 m) thickness. It could be reduced to 3–5 m when using a more closely spaced well network to mine thinner ore horizons.
The minimum grade × thickness cut-off (m × %U) or (mCmin) for orebody delineation in plan is determined using the variance between blocks. The mCmin values are selected in such a way that the reserves of neighbouring estimation blocks differ noticeably from the error in the reserve evaluation and the feasibility study.
The minimum size of a reserve calculation block is chosen on the basis of reliable evaluation of the reserve. For the C1 category. The area comprises about 60.000–80.000 m2.
The undergroundwater depth affects the conditions of the ascending solutions and the cost of pumping production solutions to the surface. When determining its value, a comparison between airlift and electric pumping should be made. The resources of deposits where the mineralization is located above the undergroundwater surface should not be included in recoverable resources for ISL. In Russian practice, the range of depths where solutions can be effectively pumped is presently within the limits +10–20 m to 100–120 m.
The minimum grade × thickness cut-off for a wellfield unit corresponds to the recovery of 1kg of uranium, the cost of which does not exceed the established limit. It is calculated by
the formula: mCE mC
Pmin �1
where: E is the total production cost for 1kg uranium including expenditures for recovery, treatment, environmental costs, etc.; mC is the average grade × thickness (m% U) cut-off; and Pl = minimum price of one kilogram of recovered product.
Off-grade (i.e. non-economic) ISL resources are those resources that could not be extracted using presently available technology (due to either technological properties or prevailing conditions), or for which extraction is not profitable. They are estimated in accordance with the conditions for non-economic resources. Leaching properties which make mineralization non-economic include such characteristics as those that do not meet the requirements for permeability, carbonate and sulphide contents, or contain a non-leachable form of mineralization under normal leaching conditions. In regard to the leaching conditions, the off-grade reserves are block reserves (ore bodies) with a static water table depth that is

90
greater than the acceptable level. With respect to economics, the non-economic blocks are those where the average grade is below the minimum cut-off.
When evaluating sub-economic (i.e. below cut-off) resources, one has to take into account the location in relation to the economic reserves to be leached: this includes below grade mineralization located within the orebody limits, outside the limits and immediately adjacent to blocks with calculated reserves.
The feasibility study should take into consideration the viability of leaching any associated or adjacent sub-economic resources.
An evaluation of non-economic resources, regarding the cut-off grade-thickness (mCmin), as well as a minimum acceptable hydraulic conductivity and maximum carbonate and sulphide content, to assure whether single ore sections should be rejected or included in the mixable resource.
During the identification of ore intervals, any mineralization in impermeable rock is excluded. The ore intervals separated by aquacludes are identified.
Prior to the selection of mineable ore units, significant leaching parameters should be identified and their distribution should be mapped and evaluated during all stages of exploration. The purpose of mapping any changes in geotechnical characteristics is the creation of an information base to be used in blocking out reserves. This information is also used for making decisions rational and economic extraction of the deposit as a whole, including those parts of the deposit with different natural conditions.
The mapping of any changes in geotechnological parameters is conducted using all geological, hydrogeological and geotechnological information obtained during the exploration and delineation process. This is supplemented by laboratory and field leach tests for uranium and any associated recoverable components.
The major geological and hydrogeological factors to be taken into account in selecting ores with homogeneous geotechnological characteristics are presented in Table 2.2.
The ore bodies, selected on the basis of positive overall characteristics required for ISL deposits, are subdivided into reserve blocks based on the homogeneous geotechnical characteristics and a uniform distribution of exploration drill holes. The central part of the roll, and the upper and lower limbs are assigned to different estimation blocks. The upper and lower part of the producing horizon are estimated separately. The elevation of the ore intervals and aquacludes (occurring) between the ore intervals, are to be taken into account.
As compared with estimating reserves for conventional mining, the calculation of reserves for the ISL extraction of saturated, roll-type deposits has some additional requirements. The factors to be considered in making the estimation include the following:
�� based on the amount of contained clay and mudstones, the sample intervals are divided into permeable and impermeable;
�� based on the test results and accounting for the maximum allowable thickness of barren permeable rock interlayer, the average uranium grade, mean thickness and Grade × Thickness, (G × T, in meter % U), are calculated over the section;
91
�� Grade × Thickness (G × T, in meter%), are calculated with the maximum allowable thickness of barren permeable interbedded rock included in the orebody limit, the orebody average: uranium content, ore thickness;
�� using the minimum G × T value, the ore intercepts included in the block are separated into ore grade and below ore grade;
�� the mean values of thickness, G × T, effective thickness (i.e. aquifer thickness discounting any intervals of low permeability) and ore-bearing coefficient ((ore block volume — internal barren volume)/(ore block volume)) are calculated for the blocks;
�� both the total area and ore-bearing area are determined for the block, as well as its relation to the area of the leachable and below grade material, ore-bearing coefficient, average hydraulic conductivity, and the limits of harmful impurities;
�� the reserves of ore, metal, and ore tonnage, as well as some other mineral-geological parameters, are calculated;
�� the total deposit reserve is calculated.
The calculations of average block parameters (area, effective thickness and productivity, or G × T) are done as follows:
�� the rock volume to be leached equals the product of area multiplied by the average effective thickness;
�� the rock mass, or tonnage, equals the product of the volume estimated above and the rock density;
�� the quantity of metal, or reserve, equals the product of the block area and the average uranium content in kg/m2 (ore productivity), or the average Grade × Thickness (meter %), and the rock density.
3.6. GEOPHYSICAL STUDIES USED IN URANIUM ISL [1, 3–5, 9, 10]
3.6.1. General
Geophysical research over ISL amenable ore bodies is to be carried out at all stages of exploration, surveying and operation of deposits, including decommissioning of the ISL sites. Geophysical methods are useful for addressing quite a number of geological, technological and engineering problems. In dealing with the problems requiring application of integrated geological, hydrogeological and some other investigation methods, geophysical information has an important auxiliary role.
The geophysical service system facilitating the activities at the ISL deposits has emerged in the process of activity of geophysical services in exploration and mining organizations as the result of specific methodological studies. Table 3.4 presents the directions, tasks and methods of geophysical research applied to the sites for sulphuric acid in situ leaching.
The suggested classification system for tasks and applied geophysical methods is still not complete due to the great variety of geological and technological peculiarities in each deposits and their mining schemes. Therefore it is constantly changing to meet local conditions.
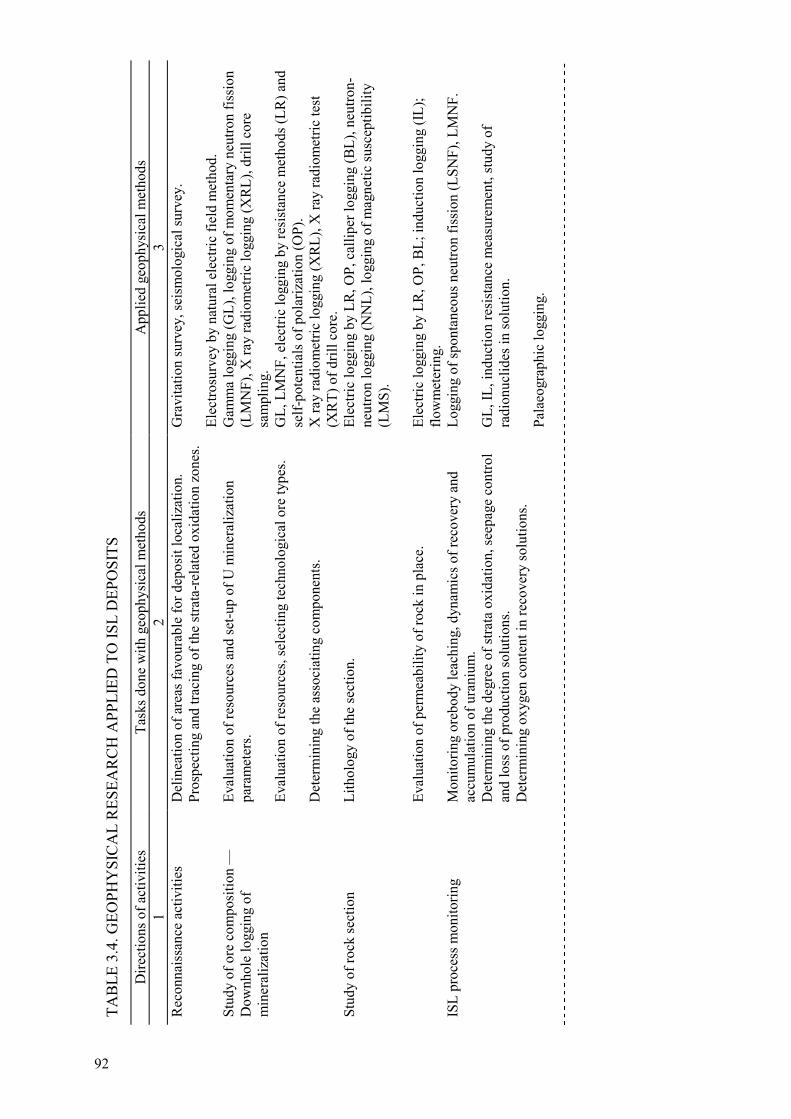
TAB
LE 3
.4. G
EOPH
YSI
CA
L R
ESEA
RC
H A
PPLI
ED T
O IS
L D
EPO
SITS
Dire
ctio
ns o
f act
iviti
es
Task
s don
e w
ith g
eoph
ysic
al m
etho
ds
App
lied
geop
hysi
cal m
etho
ds
1 2
3 R
econ
nais
sanc
e ac
tiviti
es
Del
inea
tion
of a
reas
favo
urab
le fo
r dep
osit
loca
lizat
ion.
Pr
ospe
ctin
g an
d tra
cing
of t
he st
rata
-rela
ted
oxid
atio
n zo
nes.
Gra
vita
tion
surv
ey, s
eism
olog
ical
surv
ey.
Elec
trosu
rvey
by
natu
ral e
lect
ric fi
eld
met
hod.
St
udy
of o
re c
ompo
sitio
n —
D
ownh
ole
logg
ing
of
min
eral
izat
ion
Eval
uatio
n of
reso
urce
s and
set-u
p of
U m
iner
aliz
atio
n pa
ram
eter
s. Ev
alua
tion
of re
sour
ces,
sele
ctin
g te
chno
logi
cal o
re ty
pes.
Det
erm
inin
g th
e as
soci
atin
g co
mpo
nent
s.
Gam
ma
logg
ing
(GL)
, log
ging
of m
omen
tary
neu
tron
fissi
on
(LM
NF)
, X ra
y ra
diom
etric
logg
ing
(XR
L), d
rill c
ore
sam
plin
g.
GL,
LM
NF,
ele
ctric
logg
ing
by re
sist
ance
met
hods
(LR
) and
se
lf-po
tent
ials
of p
olar
izat
ion
(OP)
. X
ray
radi
omet
ric lo
ggin
g (X
RL)
, X ra
y ra
diom
etric
test
(X
RT)
of d
rill c
ore.
St
udy
of ro
ck se
ctio
n Li
thol
ogy
of th
e se
ctio
n.
Eval
uatio
n of
per
mea
bilit
y of
rock
in p
lace
.
Elec
tric
logg
ing
by L
R, O
P, c
allip
er lo
ggin
g (B
L), n
eutro
n-ne
utro
n lo
ggin
g (N
NL)
, log
ging
of m
agne
tic su
scep
tibili
ty
(LM
S).
Elec
tric
logg
ing
by L
R, O
P, B
L; in
duct
ion
logg
ing
(IL);
flow
met
erin
g.
ISL
proc
ess m
onito
ring
Mon
itorin
g or
ebod
y le
achi
ng, d
ynam
ics o
f rec
over
y an
d ac
cum
ulat
ion
of u
rani
um.
Det
erm
inin
g th
e de
gree
of s
trata
oxi
datio
n, se
epag
e co
ntro
l an
d lo
ss o
f pro
duct
ion
solu
tions
. D
eter
min
ing
oxyg
en c
onte
nt in
reco
very
solu
tions
.
Logg
ing
of sp
onta
neou
s neu
tron
fissi
on (L
SNF)
, LM
NF.
G
L, IL
, ind
uctio
n re
sist
ance
mea
sure
men
t, st
udy
of
radi
onuc
lides
in so
lutio
n.
Pala
eogr
aphi
c lo
ggin
g.
92
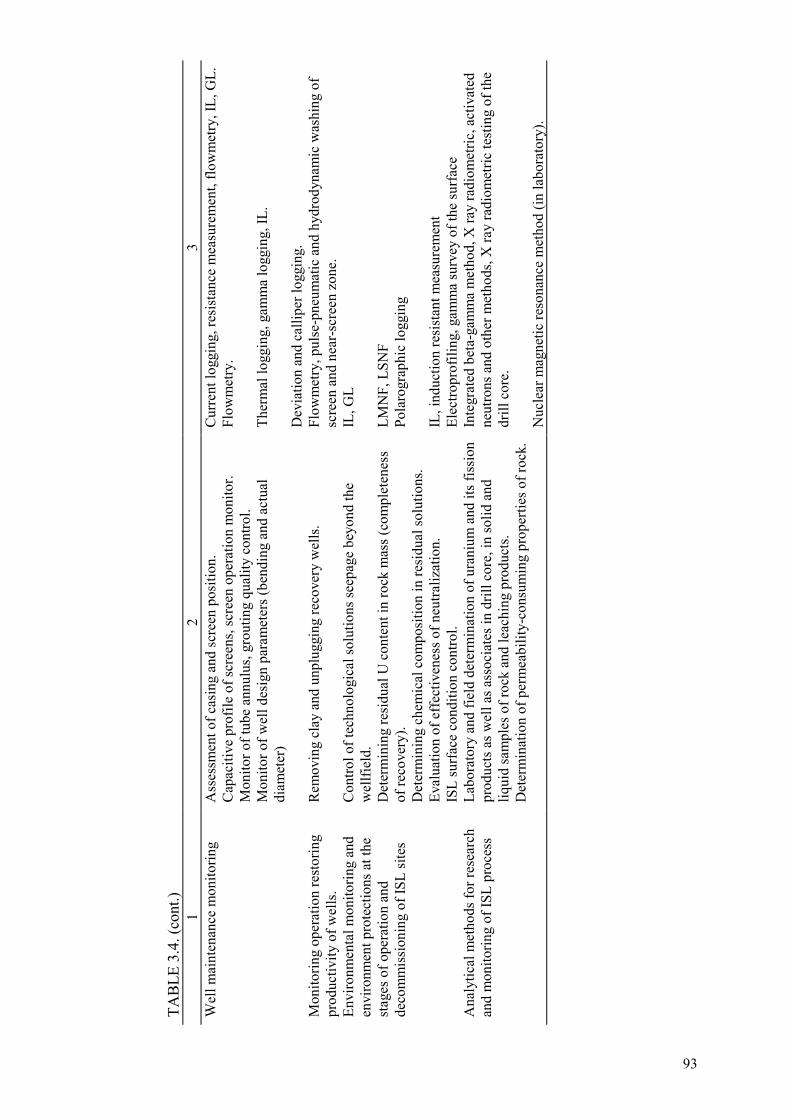
TAB
LE 3
.4. (
cont
.) 1
2 3
Wel
l mai
nten
ance
mon
itorin
g A
sses
smen
t of c
asin
g an
d sc
reen
pos
ition
. C
apac
itive
pro
file
of sc
reen
s, sc
reen
ope
ratio
n m
onito
r. M
onito
r of t
ube
annu
lus,
grou
ting
qual
ity c
ontro
l. M
onito
r of w
ell d
esig
n pa
ram
eter
s (be
ndin
g an
d ac
tual
di
amet
er)
Cur
rent
logg
ing,
resi
stan
ce m
easu
rem
ent,
flow
met
ry, I
L, G
L.
Flow
met
ry.
Ther
mal
logg
ing,
gam
ma
logg
ing,
IL.
Dev
iatio
n an
d ca
llipe
r log
ging
. M
onito
ring
oper
atio
n re
stor
ing
prod
uctiv
ity o
f wel
ls.
Rem
ovin
g cl
ay a
nd u
nplu
ggin
g re
cove
ry w
ells
. Fl
owm
etry
, pul
se-p
neum
atic
and
hyd
rody
nam
ic w
ashi
ng o
f sc
reen
and
nea
r-scr
een
zone
. En
viro
nmen
tal m
onito
ring
and
envi
ronm
ent p
rote
ctio
ns a
t the
st
ages
of o
pera
tion
and
deco
mm
issi
onin
g of
ISL
site
s
Con
trol o
f tec
hnol
ogic
al so
lutio
ns se
epag
e be
yond
the
wel
lfiel
d.
Det
erm
inin
g re
sidu
al U
con
tent
in ro
ck m
ass (
com
plet
enes
s of
reco
very
). D
eter
min
ing
chem
ical
com
posi
tion
in re
sidu
al so
lutio
ns.
Eval
uatio
n of
eff
ectiv
enes
s of n
eutra
lizat
ion.
IS
L su
rfac
e co
nditi
on c
ontro
l.
IL, G
L LM
NF,
LSN
F Po
laro
grap
hic
logg
ing
IL, i
nduc
tion
resi
stan
t mea
sure
men
t El
ectro
prof
iling
, gam
ma
surv
ey o
f the
surf
ace
Ana
lytic
al m
etho
ds fo
r res
earc
h an
d m
onito
ring
of IS
L pr
oces
s La
bora
tory
and
fiel
d de
term
inat
ion
of u
rani
um a
nd it
s fis
sion
pr
oduc
ts a
s wel
l as a
ssoc
iate
s in
drill
cor
e, in
solid
and
liq
uid
sam
ples
of r
ock
and
leac
hing
pro
duct
s. D
eter
min
atio
n of
per
mea
bilit
y-co
nsum
ing
prop
ertie
s of r
ock.
Inte
grat
ed b
eta-
gam
ma
met
hod,
X ra
y ra
diom
etric
, act
ivat
ed
neut
rons
and
oth
er m
etho
ds, X
ray
radi
omet
ric te
stin
g of
the
drill
cor
e.
Nuc
lear
mag
netic
reso
nanc
e m
etho
d (in
labo
rato
ry).
93
94
The technique of single geophysical observation is presented in a number of manuals and instructions [1, 3–5, 7–10]. The evaluation of uranium mineralization parameters is given in Section 3.3.2.
3.6.2. Investigations of ore and host rocks using logging methods [5, 9]
Lithologic mapping is done using standard electrical logging techniques — including electrical resistance and self potential. The probes measure the values of apparent electrical impedance (�a) for the formation. This type of probe has a good impedance when the drill media infiltrates into the formation.
Lithologic mapping of the section by electrical logging requires of a network of drill holes. The network is prepared during preliminary exploration by core drilling 2 to 5 holes through the entire section. In addition to the standard log suite, the gradient probing (GP) procedure is carried out in these bore holes. The GP complex comprises potential and gradient measurements with probes of various size; as well as resistance and calliper logging. On the basis of GP measurements, the optimal size and type of probe is selected based on the penetration depth of the drill solution filtrate into strata of various thickness and faces. A standard geoelectrical section is plotted, which then can be used in the lithological interpretation of electrical logging. The resistance logging is the most important method for lithologic interpretation. The other logging methods (OP, GL, calliper) are auxiliary to this task.
The rock unit overlying the ore is generally logged at scales 1:500 (1:1000) and the ore-enclosing rock — at the scale 1:50 (1:200). The lithological section plotting is to be done in the following way. First the rocks are divided into groups characteristic of contrasting physical properties, evident in the logs. The local marker horizons or strata, which readily correlate to the other logs throughout the survey profile, are selected. The lithological characteristics of the logged layers are verified by the core material. The information from each bore hole are presented in the geologic column as three lithologic graphs: the core section, the electrical log and combined section.
The combined section serves as the basis for plotting the geological cross sections.
3.6.3. Surveying drift, drill hole diameter and geothermal characteristics of measurements
The exploration of roll-type deposits is done using vertical drill holes. The deviation of the hole from the vertical can reach tens of meters, or more, for a deep deposit (400 to 700 m). It is important to minimize the deviation so that the location of the orebody is accurately determined. Because of the small angles involved in hole deviation it is important that the angles showing azimuth and hole inclination should be measured accurately.
Drill hole diameter (calliper) logging are carried out to determine correction factors for absorption of gamma-radiation by drill mud or for interpreting gamma-logs. It may also be used to make lithologic correlations between holes. The hole diameter survey results are recorded in geological columns [9]. Geothermal studies are conducted with electrical thermometers. They measure the temperature of the ore-bearing horizon. This usually affects the leaching process. Besides, thermometry may also be used for checking the grouting quality in hydrogeological, technological and other special purpose drill holes.
95
The temperature logs are recorded on the graphic geological sections. The zones of differential geothermal gradient provide additional material for the geologic sections. The underground temperature in deep roll-type deposits has been observed to reach 35–50oC in some areas such as Kazakhstan and Uzbekistan.
REFERENCES TO CHAPTER 3
[1] DAKHNOV, V.N., Interpretation of Geophysical Study Results on Bore Hole Section, M. Nedra (1972).
[2] Recovery of Uranium by Underground Leaching (V.A.Mamilov, Ed.), M. Atomizdat (1980).
[3] KHAIKOVICH, I.M., TATARNIKOV, A.A., UVAROV E.F., et al., L., Addendum to Manual on Gamma Logging in Exploration of Uranium Deposits (NPO Rudgeofisika) (1981).
[4] OVCHINNIKOV, A.K., IVASCHENKO, T.F., KHAIKOVICH, I.M., et al., M. Nedra, Manual of Gamma Logging In Uranium Deposits Exploration (1974).
[5] KIRILOV, P.I., KULAK, E.D., MASLOV, V.N., et al., Methodical Recommendations on Measuring Technological Properties of Ores and Rock by Logging, NPO Rudgeofisika (1980).
[6] Study Methods of Uranium Deposits in Sediments and Metamorphose Masses (J.N. Beljavtsev, V.I. Danchev, Eds), M., Nedra (1985).
[7] Data Base for Primary Processing Geological-Geophysical and Geochemical Field Documentation on a PC of Mir series, MinGeo of USSR (1981).
[8] PUKHALSKI, L.Ch., SHUMILIN, M.V., Exploration and Testing of Uranium Deposits, M., Nedra (1977).
[9] SHUMILIN, M.V., MUROMTSEV, N.N., BROVIN K.G., et al., Exploration of Uranium Deposits to be Worked by Underground Leaching, M., Nedra, (1985).
[10] KHAIKOVICH, I.M., SHASHKIN, V.L., Testing of Radioactive Ore by Gamma Radiation, M., Energoatomizdat, 1982.
BIBLIOGRAPHY TO CHAPTER 3
INTERNATIONAL ATOMIC ENERGY AGENCY, Borehole logging for Uranium Exploration — A Manual, Technical ReportS Series No. 212, Vienna (1982). INTERNATIONAL ATOMIC ENERGY AGENCY, Practical Borehole Logging Procedures for Mineral Exploration with Emphasis on Uranium, Technical ReportS Series No. 259, Vienna (1986)


97
Chapter 4
HYDROGEOLOGICAL EVALUATION OF URANIUM DEPOSITS
4.1. GENERAL
A hydrogeological research is the most important parts during the complex exploration of sandstone type deposits for ISL potential.
The objective of this investigation is to determine all the hydrogeological characteristics of the deposit and its host aquifer. This information will be used to assess the general potential of the deposit for uranium ISL, to discover any unique or special features and to contribute to the preparation of a feasibility study and the design of both a pilot test and a commercial operation.
The main elements of hydrogeological research are: an assessment of the potential and properties of the ore-bearing rock for fluid flow and re-circulation; determination of the main hydrological parameters of the ore-bearing horizon, including internal structural variations; determination of well pumping rates; the prediction of any progressive changes in hydrological conditions during ISL operation, including the extent of adjacent groundwater inflow; and finally, identification of possible contamination hazards to the land surface and nearby groundwater [4].
The investigation should also provide information on the depth, lithological composition, thickness and hydrologic parameters of the overlaying and underlaying confining rock layers and any adjacent aquifers. It should also address the relationship of the deposit to the regional hydrologic setting, the orientation and velocity of the natural groundwater gradient, the effect of any tectonic structures on the groundwater dynamics, the presence of hydraulic connections between aquifers and to the land surface, the baseline groundwater quality and any possible sources of water contamination.
4.2. HYDROLOGICAL STUDIES AT VARIOUS STAGES OF THE EVALUATION
4.2.1. Preliminary evaluation
The results of exploration drilling and geophysical surveys are used to construct cross-sections of the deposit in order to define the extent, of groundwater saturation and to identify individual aquifers and confining layers. Any existing information on the hydrology of the site is summarized and compared to the results of the exploration drilling.
Where they exist, any distinct lithologic, facies or tectonic domains within the study area should be delineated prior to the hydrological investigations. Within each domain, three to five test wells are installed in every ore-bearing horizon. Two or three wells are installed outside the mineralized area to help define the flow direction and velocity related to the groundwater gradient.
Core samples of the ore-bearing horizon are recovered from the pilot holes of all wells. The wells are completed using metal casing and screens, with the latter installed across the entire aquifer thickness. A suite of geophysical well logging surveys are conducted in each pilot hole before the casing is installed: natural gamma, electric (self potential (SP) and resistivity), borehole flow distribution, calliper and deviation logs.

98
Representative drill core samples should be recovered from all lithological rock types across the entire ore-bearing horizon and also from both upper and lower water-confining layers. Whole core and disaggregated samples are studied in the laboratory to determine grain size distribution, carbonate content and hydraulic properties, including porosity, permeability etc.
All of the test wells can be operated for either pumping or injection purposes in single well hydrology tests. Groundwater discharged from pumping wells is sampled for chemical analysis. When the pumping tests are finished, the well are used for monitoring water level stability and for periodic water quality sampling.
The review of the data collected by sampling and from the hydrologic test will determine the priority of further research. A negative decision is made in the following cases: 1) the permeability of the aquifer is too low to sustain adequate flow rates; 2) the aquifer is not completely saturated or has insufficient hydrostatic head to prevent excessive drawdown or dewatering during pumping; 3) the pumping flow rates appeared too low (less than 0.3–0.5l/s with the level lowered by 15–20m).
4.2.2. Further investigation
Additional information on hydrological properties of the aquifers is obtained by installing arrays, or patterns, of multiple test wells. Hydrological observations made using multiple well patterns can be extrapolated with more confidence across larger areas of the deposit than those based upon single well tests.
Determination of anisotropic variations in hydrological properties of the aquifer is recommended by using test well patterns consisting of one central recovery well and two radial lines of observations wells situated approximately parallel and perpendicular to the long axis of the orebody. The distance between observation wells along the radial lines can vary from 10–30m.
Several single wells and multiple well patterns should be installed within the exploration area of the deposit to obtain more representative information. Depending upon the results of the initial investigation, single wells should be separated by a distance of 800 to 2400m, while the multiple well patterns should be located at intervals of 3200–4800m.
The single wells and multiple well patterns are sued to determine the main hydrological parameters, namely: permeability and hydraulic conductivity, piezo-conductivity, recovery, specific yield (capacity), flow rate and radii, of influence etc. [3, 7].
Studies of grain size distribution and carbonate cement content are made using samples collected on a grid pattern of 800 to (50–25)m. Porosity and permeability measurements are made on undamaged whole core samples of ore and barren host rock collected at a frequency of one core hole every 800m or, more rarely, every 1600m, in each exploration drill hole profile.
For in situ leach deposits situated close to conventional mining sites, the relationship of the deposit under study to existing zones of active groundwater pumping (for process water supply or mine drainage) is assessed by installing one or several special hydrological wells, the spacing of which depends on the distance between the two entities and the volume of groundwater being removed. These wells are used for monitoring the groundwater gradient and for collecting samples to determine any changes in its chemical composition.

99
At the completion of the hydrological studies, the ore-bearing horizon can be classified into different lithological-flow zones (see Section 4.6). If it is decided that the hydrological properties of the deposit make it suitable for ISL, the deposit is then subjected to further detailed exploration.
4.2.3. Detailed exploration
This provides more information on the specific influence of the hydrological parameters on the performance of ISL operations. Zones of low permeability (below standard) should not be included in this stage of the investigation.
The locations of any additional single wells or multiple well patterns installed for purpose of conducting detailed information are based upon the distribution of previously defined hydrological or lithological zones, with each identified zone being provided with a separate array of wells.
The hydrogeological properties of ore-bearing horizon are determined by a single line of test wells arranged within the limits of the zone. The separation distance between single wells at the detailed study stage generally remains from 800 to 1600m, while the distance between multiple well patterns is also unchanged at 1600–2400m. An array of multiple wells designed for an ISL pilot-plant produces the most valuable information of all the pump tests. The ISL test period is characterized by a series of static observations of groundwater behaviour (water levels and chemical composition), which begins before the pumping starts and continues after it ends.
Core samples for analysis of grain size distribution and carbonate cement contents are collected from the exploration drill holes in the grid pattern with spacing which varies from 400 by (50–25) m, to 100 by (50–25) m in situations where the distance between drill hole profiles has been reduced to 200 m or less. Core samples are also collected from all hydrological test wells.
The existence an distribution of any hydrothermal (geothermal) fluids can be investigated by thermal logging of all hydrological test wells.
The hydrogeological study results, when used in combination with uranium reserve categories, serve as a basis for classification and verification of different lithological-flow domains within ore-bearing horizon and any relevant physical or chemical zoning of the ISL deposit. The data obtained are incorporated in the initial feasibility study which is produced for all new commercial ISL operations.
4.3. PUMP TESTS
Pump tests, which sometimes include injection (both natural head and pressurised) as well as pumping, are conducted to determining practical recirculation flow rates and other hydrologic properties of the aquifer (permeability and piezo-conductivity, the affect of lowered water level on well discharge, etc.).
The testing is conducted, using single wells, and multiple well patterns, pumped at difference flow rates to obtain one, and sometimes two, depressed/lowered constant water levels in a steady state operational mode (constant discharge and level lowering). The recommended

100
duration of pumping for a single well test is 2 days, while that for multiple well test is between 5 and 10 days.
During pumping, the rate of water discharge is recorded and the water levels in the central pumping well and all monitoring wells are measured. The discharged water is sampled for chemical analysis, the water temperature is measured and the volume and intervals of pumped sediment are noted. Frequent water level measurements (every 5–10 minutes)are made during the first hour of the test, after which the interval is increased to one reading every 1–3 hours. After the discharge rate has stabilised, the measurement interval in increased further to four times a day, with the result that the time scale for the entire test is approximately logarithmic.
Measurement of water level is not possible in wells where the fluid rises to the extent that it overflows at the surface. Instead, the fluid pressure is measured at the well head.
When the pumping (or surface flow) is over, the recovery of the water level or wellhead pressure is recorded with a series of observations made at a similar logarithmic frequency to those taken during the pumping stage of the test.
Pressurised injection tests provide valuable data which are sued to determine aquifer injectivity and other hydrological properties. The tests should be carried out at constant water levels or constant flow discharge rates, usually for a period of 24 hours. Surge tanks fitted with hoses provide a reservoir of water to feed the injection pumps, and flowmetres and pressure gauges are fitted to the piping at each wellhead. Separate observation wells are sued for measuring flow discharge and water levels. Frequent measurements are taken during the first hour of pumping, after which readings are taken only once every hour. At the end of the injection period, the recovery of the water levels in the wells is measured at the same frequency as those made during the injection procedure.
Tests consisting of simultaneous injection and pumping are generally conducted at all ISL sites to investigate the production potential of wells under conditions of balanced solution recirculation. The duration of this type of test varies from 8 hours to 3 days.
The data recorded during the various pumping tests are processed by standard methods involving plotting graphs of changing water levels versus time S = f(logn t) and area S = f(log r), as well as graphs which combined both lowering and recovering water levels. The detailed procedure for this data processing and calculation of the hydrological parameters is described in specialized publications [1–3, 5, 7]. When designing patterns of wells for pumping tests, the well screen of the central (pumping) well should be located in the middle of the aquifer which is being investigated, with the length of the well screen at least 1/3 of aquifer thickness. The radial lines of observation wells are arranged both in the direction of the flow (in case of a single line) and also perpendicular to it (when two lines are used).
4.4. STATIC MONITOR WELLS
Static monitoring observations have to be carried in all hydrological wells to provide information on slowly changing trends in the level and chemical composition of the groundwater. A measurement and sampling interval of once a month or once every two months is sufficient. Field personnel should occasionally measure the depth and checks the condition of the screens in all hydrological wells. If required, the screens can be cleaned by scrubbing (swabbing) or flushing. When collecting samples for chemical analysis, a volume of
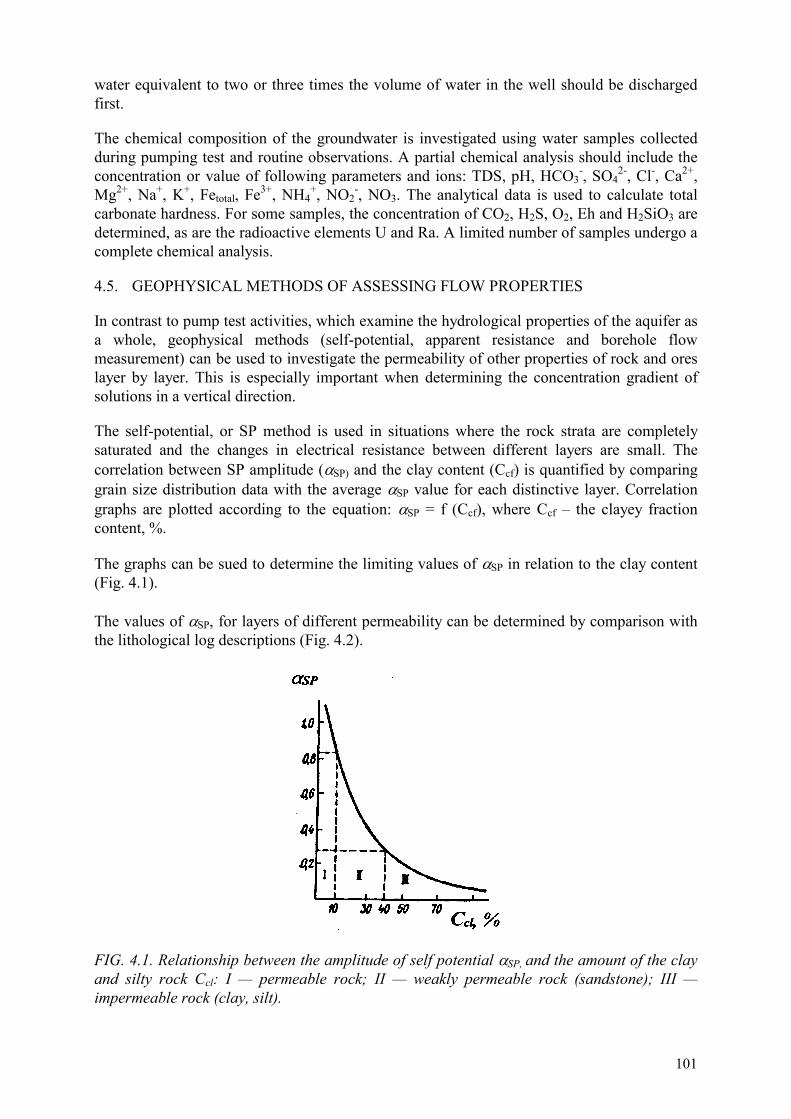
101
water equivalent to two or three times the volume of water in the well should be discharged first.
The chemical composition of the groundwater is investigated using water samples collected during pumping test and routine observations. A partial chemical analysis should include the concentration or value of following parameters and ions: TDS, pH, HCO3
-, SO42-, Cl-, Ca2+,
Mg2+, Na+, K+, Fetotal, Fe3+, NH4+, NO2
-, NO3. The analytical data is used to calculate total carbonate hardness. For some samples, the concentration of CO2, H2S, O2, Eh and H2SiO3 are determined, as are the radioactive elements U and Ra. A limited number of samples undergo a complete chemical analysis.
4.5. GEOPHYSICAL METHODS OF ASSESSING FLOW PROPERTIES
In contrast to pump test activities, which examine the hydrological properties of the aquifer as a whole, geophysical methods (self-potential, apparent resistance and borehole flow measurement) can be used to investigate the permeability of other properties of rock and ores layer by layer. This is especially important when determining the concentration gradient of solutions in a vertical direction.
The self-potential, or SP method is used in situations where the rock strata are completely saturated and the changes in electrical resistance between different layers are small. The correlation between SP amplitude (�SP) and the clay content (Ccf) is quantified by comparing grain size distribution data with the average �SP value for each distinctive layer. Correlation graphs are plotted according to the equation: �SP = f (Ccf), where Ccf – the clayey fraction content, %.
The graphs can be sued to determine the limiting values of �SP in relation to the clay content (Fig. 4.1). The values of �SP, for layers of different permeability can be determined by comparison with the lithological log descriptions (Fig. 4.2).
FIG. 4.1. Relationship between the amplitude of self potential �SP, and the amount of the clay and silty rock Ccl: I — permeable rock; II — weakly permeable rock (sandstone); III — impermeable rock (clay, silt).
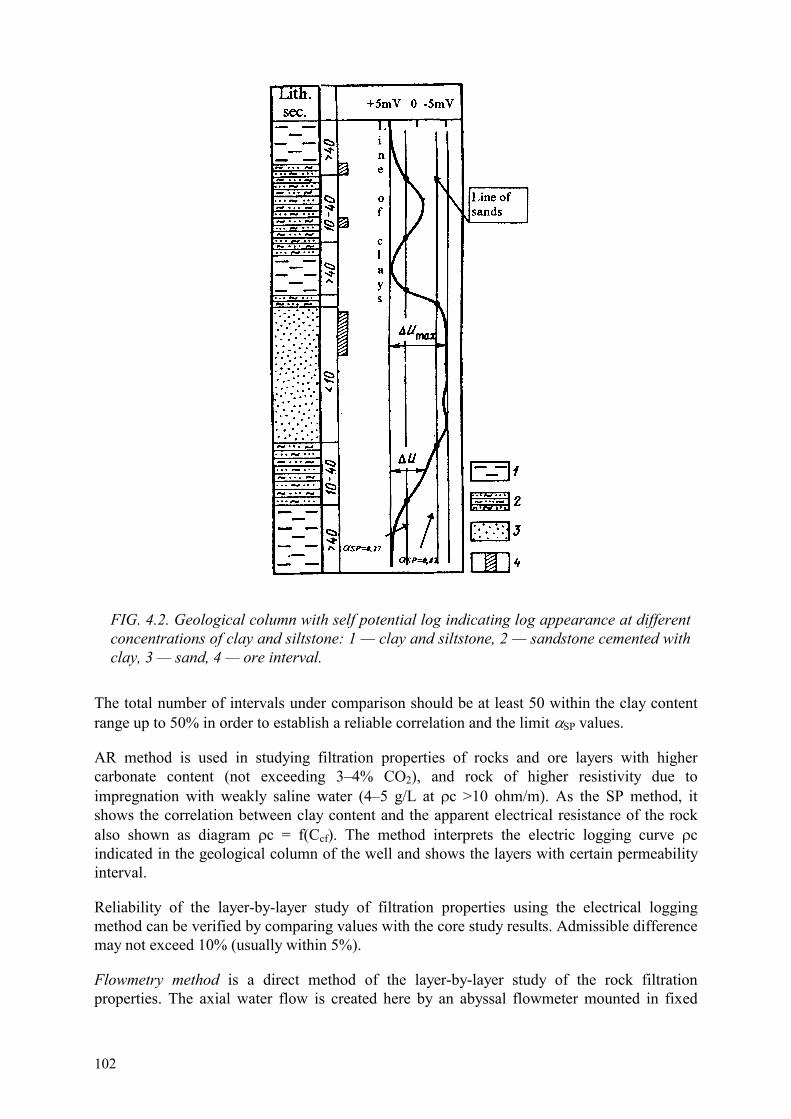
102
FIG. 4.2. Geological column with self potential log indicating log appearance at different concentrations of clay and siltstone: 1 — clay and siltstone, 2 — sandstone cemented with clay, 3 — sand, 4 — ore interval.
The total number of intervals under comparison should be at least 50 within the clay content range up to 50% in order to establish a reliable correlation and the limit �SP values.
AR method is used in studying filtration properties of rocks and ore layers with higher carbonate content (not exceeding 3–4% CO2), and rock of higher resistivity due to impregnation with weakly saline water (4–5 g/L at �c >10 ohm/m). As the SP method, it shows the correlation between clay content and the apparent electrical resistance of the rock also shown as diagram �c = f(Ccf). The method interprets the electric logging curve �c indicated in the geological column of the well and shows the layers with certain permeability interval.
Reliability of the layer-by-layer study of filtration properties using the electrical logging method can be verified by comparing values with the core study results. Admissible difference may not exceed 10% (usually within 5%).
Flowmetry method is a direct method of the layer-by-layer study of the rock filtration properties. The axial water flow is created here by an abyssal flowmeter mounted in fixed
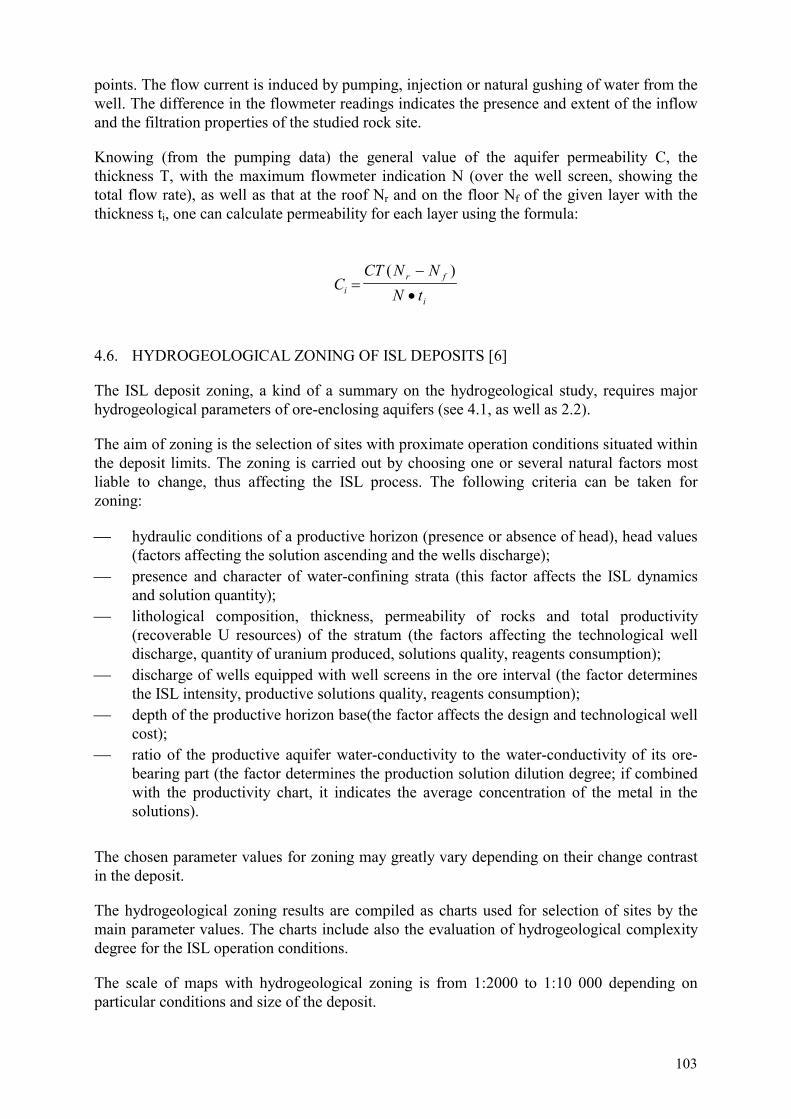
103
points. The flow current is induced by pumping, injection or natural gushing of water from the well. The difference in the flowmeter readings indicates the presence and extent of the inflow and the filtration properties of the studied rock site.
Knowing (from the pumping data) the general value of the aquifer permeability C, the thickness T, with the maximum flowmeter indication N (over the well screen, showing the total flow rate), as well as that at the roof Nr and on the floor Nf of the given layer with the thickness ti, one can calculate permeability for each layer using the formula:
CCT N N
N tir f
i�
�
�
( )
4.6. HYDROGEOLOGICAL ZONING OF ISL DEPOSITS [6]
The ISL deposit zoning, a kind of a summary on the hydrogeological study, requires major hydrogeological parameters of ore-enclosing aquifers (see 4.1, as well as 2.2).
The aim of zoning is the selection of sites with proximate operation conditions situated within the deposit limits. The zoning is carried out by choosing one or several natural factors most liable to change, thus affecting the ISL process. The following criteria can be taken for zoning:
�� hydraulic conditions of a productive horizon (presence or absence of head), head values (factors affecting the solution ascending and the wells discharge);
�� presence and character of water-confining strata (this factor affects the ISL dynamics and solution quantity);
�� lithological composition, thickness, permeability of rocks and total productivity (recoverable U resources) of the stratum (the factors affecting the technological well discharge, quantity of uranium produced, solutions quality, reagents consumption);
�� discharge of wells equipped with well screens in the ore interval (the factor determines the ISL intensity, productive solutions quality, reagents consumption);
�� depth of the productive horizon base(the factor affects the design and technological well cost);
�� ratio of the productive aquifer water-conductivity to the water-conductivity of its ore-bearing part (the factor determines the production solution dilution degree; if combined with the productivity chart, it indicates the average concentration of the metal in the solutions).
The chosen parameter values for zoning may greatly vary depending on their change contrast in the deposit.
The hydrogeological zoning results are compiled as charts used for selection of sites by the main parameter values. The charts include also the evaluation of hydrogeological complexity degree for the ISL operation conditions.
The scale of maps with hydrogeological zoning is from 1:2000 to 1:10 000 depending on particular conditions and size of the deposit.

104
REFERENCES TO CHAPTER 4
[1] BABUSHKIN, V.D., PLOTNIKOV, N.N., CHUIKO, V.M., Methods for Studying Filtration Properties of Heterogeneous Rock, M., Nedra (1974).
[2] BINDEMAN, N.N., JAZVIN, L.S., Evaluation of Operation Reserves of Groundwater. M. Nedra (1970).
[3] BOREVSKI, B.V., SAMSONOV, B.G., JAZVIN, L.S., Methodology for Determining Parameters of Aquifers by Pumping-Out Results, M. Nedra (1979).
[4] LUTSENKO, I.K., BELETSKY, V.I., DAVYDOVA, L.G., Mineless Working of Ore Deposits, M. Nedra (1986).
[5] Test Filtration (D.I. Bashkatov, V.M. Shestakov, Eds), M. Nedra (1974). [6] SHUMILIN, M.V., MUROMTSEV, N.N., BROVIN, K.G., et al., Exploration of
Uranium Deposits for In-Situ Leaching, M. Nedra (1985). [7] Hydrologist’s Manual (V.M. Maksimov, Ed.), L. Nedra 1–2 (1979).
105
Chapter 5
MODELLING AND LABORATORY INVESTIGATION
5.1. MODELLING THE ISL PROCESS
5.1.1. General concepts
Several characteristics of ISL make thorough preleach testing necessary. ISL takes place underground and cannot be directly observed and monitored. Control is limited to the inlet to injection wells and the discharge from recovery wells as well as to a limited number of observation wells. In homogeneity of the geology, the mineral and physical composition of the ore, and its permeability make it necessary to obtain characteristics of large ISL blocks by testing. Also, ISL is a time-consuming business, taking months or years, so short time laboratory tests provide an important means for estimating and evaluating these long term phenomena.
Therefore, to obtain a preliminary idea of technical and economic feasibility, to choose a leaching procedure, and to calculate the expected results, it is necessary to perform special laboratory research and modelling of the process [4]. The research and modelling are conducted before and during the ISL process, as well as after its termination. They make it possible to analyze the process dynamics, evaluate the volume and mass of ores and rock to be leached, and to predict the uranium recovery, the efficiency of leaching and its impact on the groundwater and rock.
ISL requires various kinds of modelling, both mathematical and physical. Mathematical ISL modelling includes calculations that determine the process hydrodynamics and kinetics of chemical reactions, solubility, and convective and diffusive movement of soluble components. The mathematical model of the process is derived from the system of differential equations describing the flow induced by the head difference of fluids (Darcy’s law), kinetic diffusion, and chemical kinetics.
Obtaining a general analytical solution of these differential equations would be impossible because there is no mathematical mechanism that would account for all the initial and limiting conditions. Besides, it would be difficult to determine the coefficients and functions for specific conditions of ISL. Solving the problem requires simplifying functional dependencies. Coefficients must be evaluated experimentally or estimated, using actual data for heads and discharge, and for the change in uranium, reactant, and major ironic composition in leaching solution with time.
ISL modelling deals primarily with equations for flow in porous media, producing a graphical image of the flow lines. Analytical solutions of hydrodynamic equations are available for simple cases. For example, there is the formula for drawdown in permeable media (Theis equation) for a continuous aquifer of uniform permeability [1, 8, 11]:
h0 – h(r, t) = (Q/4 �T)W(u)
where h0-h(r,t) = lowering of the head at distance r from the recovery well at time t after the start of pumping;
106
Q = well discharge rate; (m3/time)
T = transmissivity of the aquifer;(m2/time)
W(u) = well function of u;
u = r2 S/4Tt.
S = storativity; (m3/time).
The well function W is a special case of the exponential integral.
( / ) exp ( )1 u u duu
�
�
�
When u < 0.01, the integral function is approximately logarithmic. Then
h0-h(r,t) = (2.3Q/���) log(2.25Tt/r2S)
Thus, for sufficiently large time and small r satisfying
u = r2 S/4Tt < 0.01,
the simple logarithmic formula can be applied to the ISL method.
Using the superposition method, one can calculate the total effect of all injection and recovery wells. Software has been developed to calculate the flow in porous media for ISL sites. The programme determines the hydrostatic heads and piezometric surface (or flow rate field) for a site with many wells, so one can display the flow pattern and flow rates as diagrams (Chapter 6).
Using hydrodynamic diagrams, one can calculate the main parameters of the solutions moving along the flow lines. By superpositioning the kinetic equation on the solution movement along the flow lines, i.e. by simplifying the description to one-dimensional flow, it is possible of obtain a predictive model on the uranium concentration change in the recovery solutions and calculate leaching parameters.
The hydrodynamic and geochemical data needed for the calculations can be obtained empirically by leaching the core material with reactant in the laboratory or on-site. The laboratory and the hydrogeological test results provide the data necessary for calculations of the main leach field parameters of the process and feasibility study for the ISL deposit. Later, the laboratory data should be verified in the test field, when testing the uranium recovery.
The laboratory testing of core samples can determine the average permeability and its change during the leaching process, for more precise planning of leach field operation and for planning other tasks related to the application of the results in field conditions.
The basis for this studies is the methodology for studying fluid flow in porous medium, which is well-known in the laboratory practice of hydrogeological research [2, 8]. This methodology, with minor modification to account for the chemical process reactions, has gained popularity in laboratory studies on leaching metals from loose sand sediments.
107
The necessary relationships can be obtained in the laboratory under controlled conditions. Many variables related, for instance, to the unconformity of the medium are held constant. Thus, the natural mineralogical and permeability heterogeneity of ores and rock can be simplified by using averaged material composition and known permeability. Under these conditions, only a simple factor can be varied during the tests (e.g. the reactant concentration), one can obtain mathematical dependencies of the parameters under study. These relationships can then be incorporated into the modelling. The combined study of the two aspects of porous medium leaching (flow and reactions) can be carried out by “physical” modelling in ground trays or in columns. In spite of the limitations of the modelling complexity, the use of average permeabilities and mineral composition, as well as the difficulty in maintaining model flow rates similar to those in the field, ground trays and columns can provide useful data on the nature of the process and its major variable. An example for these limitation is the fact that the core material must be disaggregated so that it may be packed into the column. As a result the ore in the column will have permeability and porosity values which are different from it’s natural values. These differences must be considered when interpreting the results of the column tests. Initial laboratory studies yield the basic relationships observed leaching columns charged with ore-bearing sand. The columns can be regarded as stream lines for the solution flows of any pattern arrangement. The overall pattern flow can be obtained by simulation with personal computers or with special integrators or analogue units, commonly utilized in the hydrodynamic calculations. When testing core material to evaluate the potential for ISL at a site, one must realize that the main leaching parameters (uranium concentration in the solution, L:S (liquid/solid) ratio, specific reagent consumption) are largely determined by the host rock. Therefore, only basic leaching tests, mainly related to the reactant choice, its concentration, and the effect of the ore layer length or temperature, should be conducted in leaching tubes loaded with ore material. The laboratory studies should include additional testing in ground trays, simulating an average principal geological section of the site to be modelled under the recommended field operational conditions.
The basis for laboratory testing with core material is physical modelling with the conditions developed by V. M. Shestakov, N. N. Verjagin, L. Lukner, M. Macket et al. [2, 3, 6, 8, 10]. The core material should be similar to the density, porosity, pore volume filled with water, and permeability of the natural rock. The loading density is controlled by the volumetric mass of air-dry material used for the model. The filling degree can be estimated by the volume of water for wetting and total porosity (p) calculated by the formula p = (�-�)/� (where � — density, — � mass by volume). Permeability is determined using the hydraulic conductivity (in Darcy’s formula) after a complete washing of the leaching-ready model with water.
Water used for laboratory leach tests should be similar to the groundwater from the field site where the cores were obtained; ideally groundwater from the same formation. Using distilled laboratory water can cause clays to swell and result in plugging in the leach columns. Making the solution flow upward through the column helps to reduce plugging by trapped air and gas generated during leaching.
According to V.M. Shestakov, the quantitative relationship of the physical modelling with the natural conditions should meet the following scale ratio [6]:
(a1•aµ) : (at•ac) = 1,
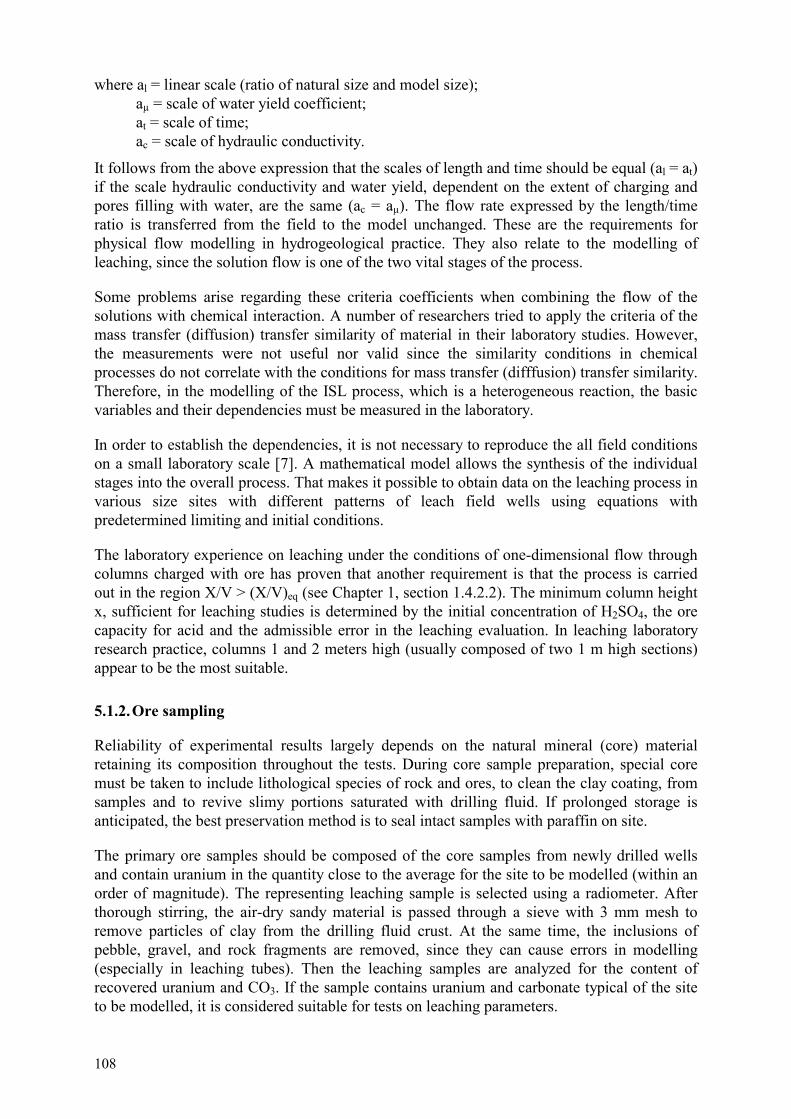
108
where al = linear scale (ratio of natural size and model size); aµ = scale of water yield coefficient; at = scale of time; ac = scale of hydraulic conductivity.
It follows from the above expression that the scales of length and time should be equal (al = at) if the scale hydraulic conductivity and water yield, dependent on the extent of charging and pores filling with water, are the same (ac = aµ). The flow rate expressed by the length/time ratio is transferred from the field to the model unchanged. These are the requirements for physical flow modelling in hydrogeological practice. They also relate to the modelling of leaching, since the solution flow is one of the two vital stages of the process.
Some problems arise regarding these criteria coefficients when combining the flow of the solutions with chemical interaction. A number of researchers tried to apply the criteria of the mass transfer (diffusion) transfer similarity of material in their laboratory studies. However, the measurements were not useful nor valid since the similarity conditions in chemical processes do not correlate with the conditions for mass transfer (difffusion) transfer similarity. Therefore, in the modelling of the ISL process, which is a heterogeneous reaction, the basic variables and their dependencies must be measured in the laboratory.
In order to establish the dependencies, it is not necessary to reproduce the all field conditions on a small laboratory scale [7]. A mathematical model allows the synthesis of the individual stages into the overall process. That makes it possible to obtain data on the leaching process in various size sites with different patterns of leach field wells using equations with predetermined limiting and initial conditions.
The laboratory experience on leaching under the conditions of one-dimensional flow through columns charged with ore has proven that another requirement is that the process is carried out in the region X/V > (X/V)eq (see Chapter 1, section 1.4.2.2). The minimum column height x, sufficient for leaching studies is determined by the initial concentration of H2SO4, the ore capacity for acid and the admissible error in the leaching evaluation. In leaching laboratory research practice, columns 1 and 2 meters high (usually composed of two 1 m high sections) appear to be the most suitable.
5.1.2. Ore sampling
Reliability of experimental results largely depends on the natural mineral (core) material retaining its composition throughout the tests. During core sample preparation, special core must be taken to include lithological species of rock and ores, to clean the clay coating, from samples and to revive slimy portions saturated with drilling fluid. If prolonged storage is anticipated, the best preservation method is to seal intact samples with paraffin on site.
The primary ore samples should be composed of the core samples from newly drilled wells and contain uranium in the quantity close to the average for the site to be modelled (within an order of magnitude). The representing leaching sample is selected using a radiometer. After thorough stirring, the air-dry sandy material is passed through a sieve with 3 mm mesh to remove particles of clay from the drilling fluid crust. At the same time, the inclusions of pebble, gravel, and rock fragments are removed, since they can cause errors in modelling (especially in leaching tubes). Then the leaching samples are analyzed for the content of recovered uranium and CO3. If the sample contains uranium and carbonate typical of the site to be modelled, it is considered suitable for tests on leaching parameters.
109
Part of uranium oxidized in the open air will be flushed away in the ore washing process (usually less than 5%, sometimes a little more, especially with stale ore). Therefore, it is recommended to accept higher than typical uranium contents while assembling the composit leaching sample. If the carbonate constituent greatly deviates from the typical value, the sample has to be rejected. If it is impossible to obtain fresh material, the test results should be reported with corresponding corrections.
The total number of permeable types of ores and rocks selected for the laboratory technological study should be at least two (ore-bearing and barren sands), but not more than four or five, or the test duration will sharply be increased. The minimum ore sample mass, sufficient for permeability columns tests, should be about 10 kg. When using the ground trays, the mass should be increased to 20–30 kg.
5.1.3. Preparation for column leaching
The hydrogeological and geochemical processes in leaching ore-bearing sands, as well as their parameters alteration in interaction with the rock minerals solution, require long tests, in which the pore volume liquid is replenished many times. This is why the column leaching device bears some specific features such as: corrosion-resistant construction material, minimal volume of the receptacle and drainage cell, a degassing device, and visual access to observe the rock behaviour. There should be sufficient residence time to develop the equilibrium uranium concentration in the solution. All these conditions for the initial leaching laboratory study are met in a transparent plastic tube with the optimal length of the operation cell of 100 cm and 3 cm in diameter (Fig. 5.1).
FIG. 5.1. Plastic column for flow testing: 1 — frame, 2 — screen, 3 — rubber ring, 4 — flange, 5 — coupling, 6 — drain cell, 7 — bolt holes, 8 — nut.
Prior to loading, a device like in Figure 5.2 is arranged with a column and a cubic centimetre-measuring dropper. The column is loaded with a bed of inert gravel (usually quartz) placed on a plastic filter. The gravel bed is covered with glass cloth serving as an underlayer for the ore-bearing sand (the other end of the column is loaded similarly, but in the reverse order).
The batches of dry ore-bearing sand are loaded into the columns while simultaneously pressing the charge and wetting it from the bottom with the field site groundwater (often called formation water) or specially prepared water of the same chemical composition. The fresh water aquifer species can be treated with boiled and degassed tap water held at ambient temperature for 24 hours. If the total mineralization exceeds 1 g/dm3, the formation water is normally used.
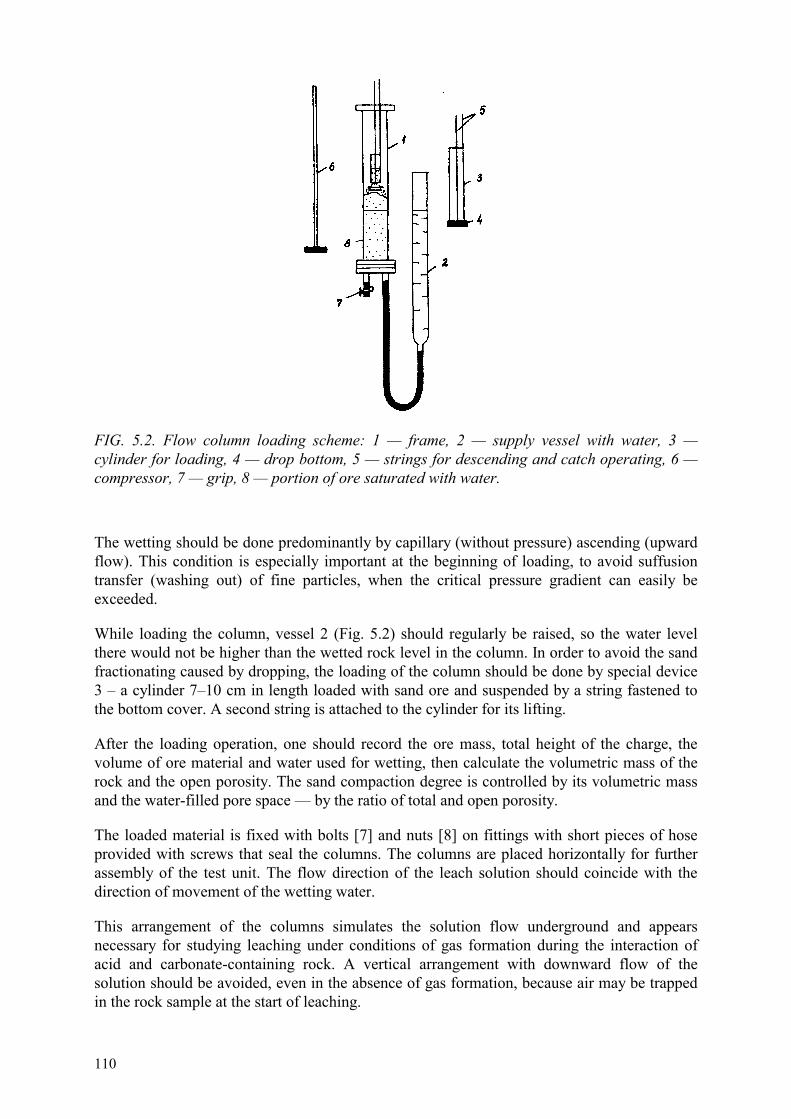
110
FIG. 5.2. Flow column loading scheme: 1 — frame, 2 — supply vessel with water, 3 — cylinder for loading, 4 — drop bottom, 5 — strings for descending and catch operating, 6 — compressor, 7 — grip, 8 — portion of ore saturated with water.
The wetting should be done predominantly by capillary (without pressure) ascending (upward flow). This condition is especially important at the beginning of loading, to avoid suffusion transfer (washing out) of fine particles, when the critical pressure gradient can easily be exceeded.
While loading the column, vessel 2 (Fig. 5.2) should regularly be raised, so the water level there would not be higher than the wetted rock level in the column. In order to avoid the sand fractionating caused by dropping, the loading of the column should be done by special device 3 – a cylinder 7–10 cm in length loaded with sand ore and suspended by a string fastened to the bottom cover. A second string is attached to the cylinder for its lifting.
After the loading operation, one should record the ore mass, total height of the charge, the volume of ore material and water used for wetting, then calculate the volumetric mass of the rock and the open porosity. The sand compaction degree is controlled by its volumetric mass and the water-filled pore space — by the ratio of total and open porosity.
The loaded material is fixed with bolts [7] and nuts [8] on fittings with short pieces of hose provided with screws that seal the columns. The columns are placed horizontally for further assembly of the test unit. The flow direction of the leach solution should coincide with the direction of movement of the wetting water.
This arrangement of the columns simulates the solution flow underground and appears necessary for studying leaching under conditions of gas formation during the interaction of acid and carbonate-containing rock. A vertical arrangement with downward flow of the solution should be avoided, even in the absence of gas formation, because air may be trapped in the rock sample at the start of leaching.
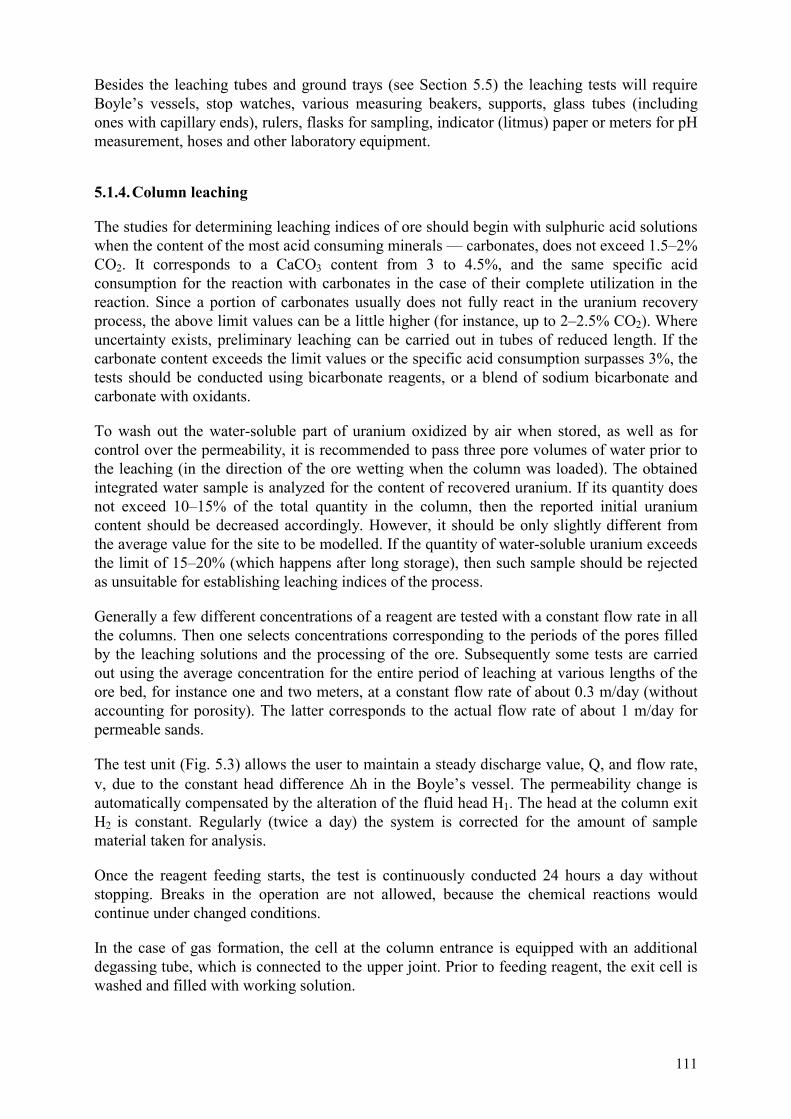
111
Besides the leaching tubes and ground trays (see Section 5.5) the leaching tests will require Boyle’s vessels, stop watches, various measuring beakers, supports, glass tubes (including ones with capillary ends), rulers, flasks for sampling, indicator (litmus) paper or meters for pH measurement, hoses and other laboratory equipment.
5.1.4. Column leaching
The studies for determining leaching indices of ore should begin with sulphuric acid solutions when the content of the most acid consuming minerals — carbonates, does not exceed 1.5–2% CO2. It corresponds to a CaCO3 content from 3 to 4.5%, and the same specific acid consumption for the reaction with carbonates in the case of their complete utilization in the reaction. Since a portion of carbonates usually does not fully react in the uranium recovery process, the above limit values can be a little higher (for instance, up to 2–2.5% CO2). Where uncertainty exists, preliminary leaching can be carried out in tubes of reduced length. If the carbonate content exceeds the limit values or the specific acid consumption surpasses 3%, the tests should be conducted using bicarbonate reagents, or a blend of sodium bicarbonate and carbonate with oxidants.
To wash out the water-soluble part of uranium oxidized by air when stored, as well as for control over the permeability, it is recommended to pass three pore volumes of water prior to the leaching (in the direction of the ore wetting when the column was loaded). The obtained integrated water sample is analyzed for the content of recovered uranium. If its quantity does not exceed 10–15% of the total quantity in the column, then the reported initial uranium content should be decreased accordingly. However, it should be only slightly different from the average value for the site to be modelled. If the quantity of water-soluble uranium exceeds the limit of 15–20% (which happens after long storage), then such sample should be rejected as unsuitable for establishing leaching indices of the process.
Generally a few different concentrations of a reagent are tested with a constant flow rate in all the columns. Then one selects concentrations corresponding to the periods of the pores filled by the leaching solutions and the processing of the ore. Subsequently some tests are carried out using the average concentration for the entire period of leaching at various lengths of the ore bed, for instance one and two meters, at a constant flow rate of about 0.3 m/day (without accounting for porosity). The latter corresponds to the actual flow rate of about 1 m/day for permeable sands.
The test unit (Fig. 5.3) allows the user to maintain a steady discharge value, Q, and flow rate, v, due to the constant head difference �h in the Boyle’s vessel. The permeability change is automatically compensated by the alteration of the fluid head H1. The head at the column exit H2 is constant. Regularly (twice a day) the system is corrected for the amount of sample material taken for analysis.
Once the reagent feeding starts, the test is continuously conducted 24 hours a day without stopping. Breaks in the operation are not allowed, because the chemical reactions would continue under changed conditions.
In the case of gas formation, the cell at the column entrance is equipped with an additional degassing tube, which is connected to the upper joint. Prior to feeding reagent, the exit cell is washed and filled with working solution.
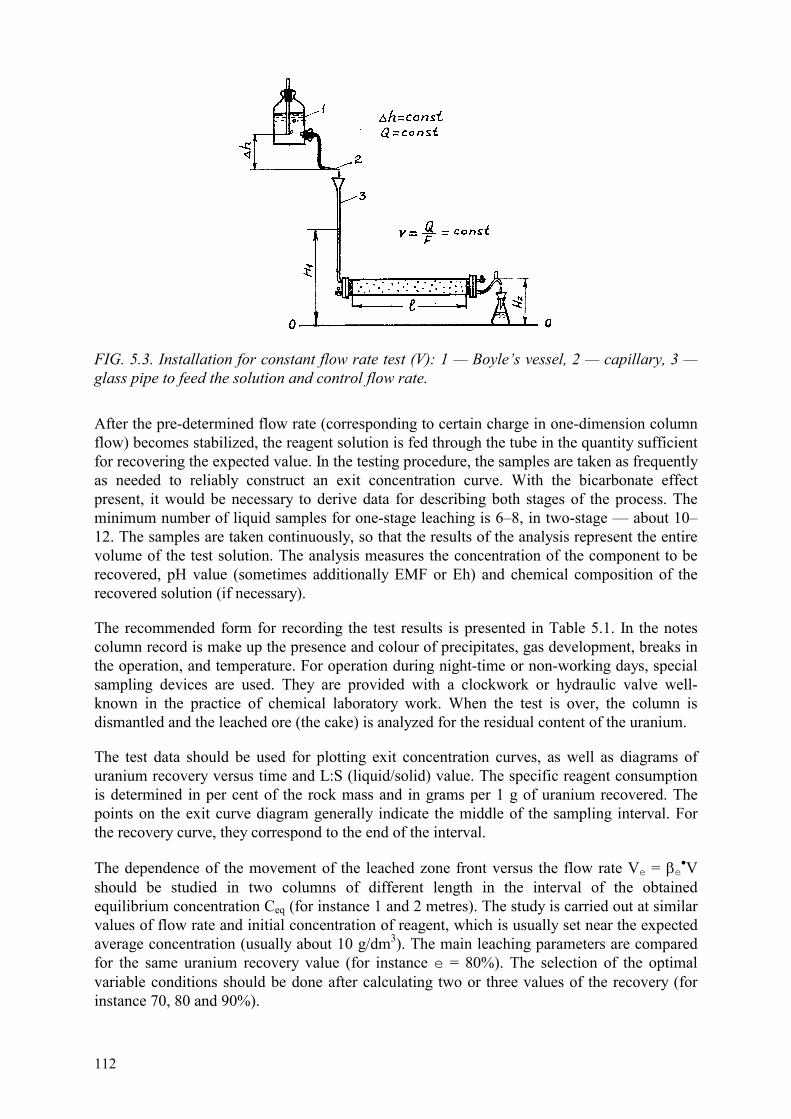
112
FIG. 5.3. Installation for constant flow rate test (V): 1 — Boyle’s vessel, 2 — capillary, 3 — glass pipe to feed the solution and control flow rate.
After the pre-determined flow rate (corresponding to certain charge in one-dimension column flow) becomes stabilized, the reagent solution is fed through the tube in the quantity sufficient for recovering the expected value. In the testing procedure, the samples are taken as frequently as needed to reliably construct an exit concentration curve. With the bicarbonate effect present, it would be necessary to derive data for describing both stages of the process. The minimum number of liquid samples for one-stage leaching is 6–8, in two-stage — about 10–12. The samples are taken continuously, so that the results of the analysis represent the entire volume of the test solution. The analysis measures the concentration of the component to be recovered, pH value (sometimes additionally EMF or Eh) and chemical composition of the recovered solution (if necessary).
The recommended form for recording the test results is presented in Table 5.1. In the notes column record is make up the presence and colour of precipitates, gas development, breaks in the operation, and temperature. For operation during night-time or non-working days, special sampling devices are used. They are provided with a clockwork or hydraulic valve well-known in the practice of chemical laboratory work. When the test is over, the column is dismantled and the leached ore (the cake) is analyzed for the residual content of the uranium.
The test data should be used for plotting exit concentration curves, as well as diagrams of uranium recovery versus time and L:S (liquid/solid) value. The specific reagent consumption is determined in per cent of the rock mass and in grams per 1 g of uranium recovered. The points on the exit curve diagram generally indicate the middle of the sampling interval. For the recovery curve, they correspond to the end of the interval.
The dependence of the movement of the leached zone front versus the flow rate Ve = �e�V should be studied in two columns of different length in the interval of the obtained equilibrium concentration Ceq (for instance 1 and 2 metres). The study is carried out at similar values of flow rate and initial concentration of reagent, which is usually set near the expected average concentration (usually about 10 g/dm3). The main leaching parameters are compared for the same uranium recovery value (for instance e = 80%). The selection of the optimal variable conditions should be done after calculating two or three values of the recovery (for instance 70, 80 and 90%).
113
If the temperature between laboratory tests and underground condition differs by more than 10oC, a temperature correction should be made. The correction should be based on experimental leaching data from flow in columns (usually 1 metre long) conducted in a constant temperature chamber. More reliable results will be obtained with duplicate columns. One of the viable methods, for the case where the temperature in the laboratory was lower than in nature, is given in Figure 5.4. Water was used as the constant temperature medium. Each test is carried out at constant temperature and leaching mode (CH2SO4 = const, V = const) for two or three temperature values. Any temperature increase generally results in an increased uranium concentration in the solution and reduces the leaching time, specific reagent consumption and L:S (liquid/solid) ratio. As an example, Figures 5.5 and 5.6 show the results of one such study at recoveries of 70 and 80%.
FIG.5.4. System for flow testing under controlled temperature conditions: 1 — column with ore, 2 — heated frame with water, 3 — electric heater, 4 — thermometer, 5 — relay, 6 — stirrer, 7 — laboratory autotransducer, 8 — degasser, 9 — capillary tube, 10 — Boyle’s vessel, 11 — Y-joint, 12 — measuring cylinder.
5.1.5. Leach modeling in ground trays
Upon conclusion of the ore column studies, one can undertake tests using ground trays that simulate a deposit section or a part of it (Fig. 5.7). The optimal size of such a tray is: cell length 100 cm, height 30–50 cm, width 2–5 cm. Larger dimensions result in excessive waste of the core sample material. With a smaller bulk, the errors in determining leach parameters become more significant. A smaller width makes it difficult to fill the tray. The permeability distribution in the ground tray will depend on how the tray is filled, and may not simulate subsurface permeability at the field site.
The uranium content in the test solution, as well as other leaching parameters of the process, are largely determined by the mineral composition of the rock types present, their ratio between hydraulic conductivity and thickness. They depend on several other factors related to the specific movement of the solutions with variable ion composition and physical properties
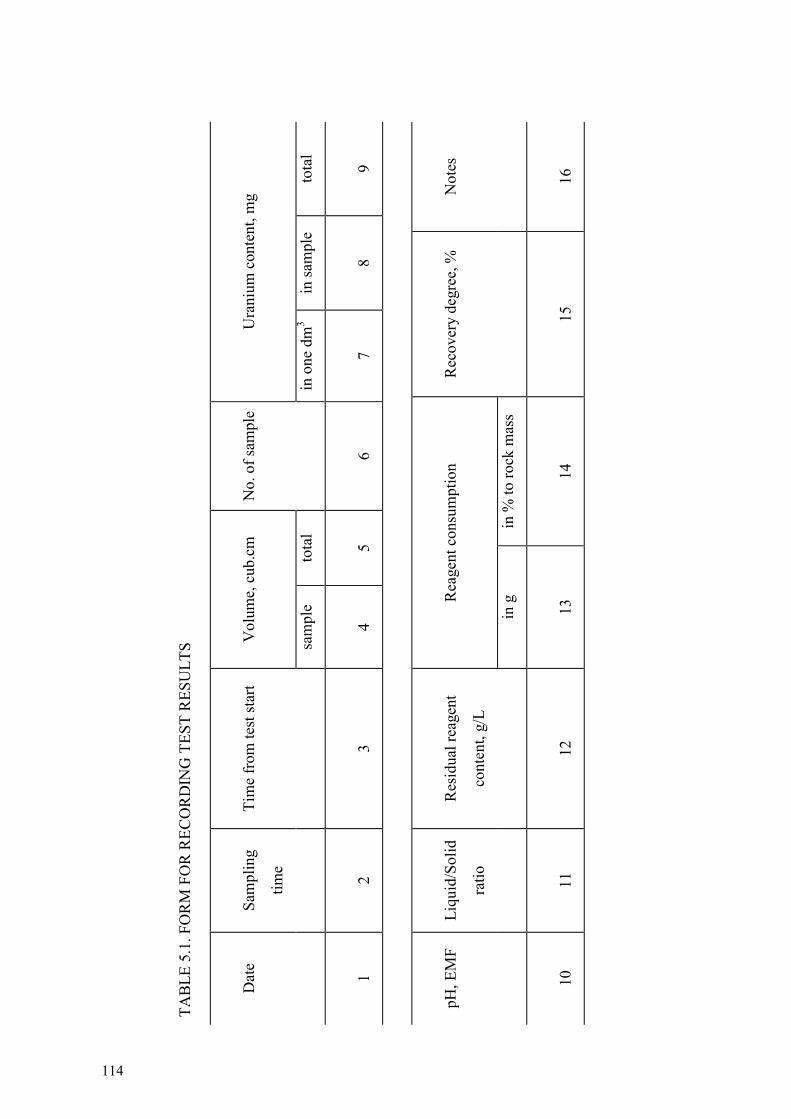
TAB
LE 5
.1. F
OR
M F
OR
REC
OR
DIN
G T
EST
RES
ULT
S
Dat
e
Sam
plin
g
time
Tim
e fr
om te
st st
art
Vol
ume,
cub
.cm
No.
of s
ampl
e
Ura
nium
con
tent
, mg
sa
mpl
e to
tal
in
one
dm
3 in
sam
ple
tota
l
1
2
3
4
5
6
7
8
9
pH, E
MF
Liqu
id/S
olid
ratio
Res
idua
l rea
gent
cont
ent,
g/L
Rea
gent
con
sum
ptio
n
Rec
over
y de
gree
, %
Not
es
in
g
in %
to ro
ck m
ass
10
11
12
13
14
15
16
114

115
FIG. 5.5. Change in sulphuric acid consumption Pp (concentration 10 g/L) versus temperature to for various uranium recovery degree (%): 1–70; 2–80.
FIG. 5.6. L:S value change versus temperature (toC) for various levels of uranium recovery (%): 1–70; 2–80. in layered media. The combined effect of all these factors can be taken into account only in laboratory conditions where the ground trays are filled with core sample material representative of the given deposit. A leaching column loaded with ore characterizes the leaching process in a homogeneous medium. The data obtained represent an ideal case that does not occur in the field. A ground tray partially compensates for the disadvantages of leaching columns, and may provide more reliable and more field-related parameters of ISL. The effect of gravitational differentiation on solution flow is modelled there, including factors such as those caused by non-uniform alteration of the rock permeability, and others related to the flow of solutions in a multilayered medium. These cannot be evaluated in leaching columns.
General requirements for model leaching, including those maintaining the scale coefficients, remain in force for the ground trays. The type section should maintain the thickness ratio of the selected lithological layers of rock and ores.
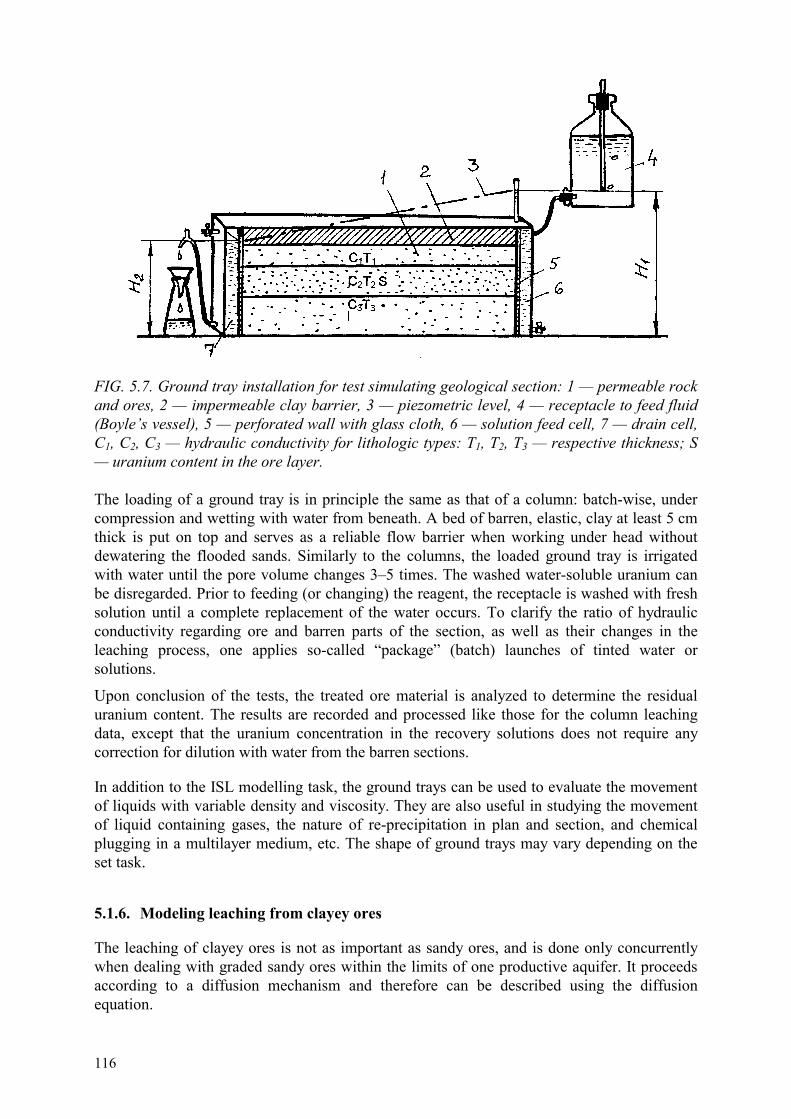
116
FIG. 5.7. Ground tray installation for test simulating geological section: 1 — permeable rock and ores, 2 — impermeable clay barrier, 3 — piezometric level, 4 — receptacle to feed fluid (Boyle’s vessel), 5 — perforated wall with glass cloth, 6 — solution feed cell, 7 — drain cell, C1, C2, C3 — hydraulic conductivity for lithologic types: T1, T2, T3 — respective thickness; S — uranium content in the ore layer. The loading of a ground tray is in principle the same as that of a column: batch-wise, under compression and wetting with water from beneath. A bed of barren, elastic, clay at least 5 cm thick is put on top and serves as a reliable flow barrier when working under head without dewatering the flooded sands. Similarly to the columns, the loaded ground tray is irrigated with water until the pore volume changes 3–5 times. The washed water-soluble uranium can be disregarded. Prior to feeding (or changing) the reagent, the receptacle is washed with fresh solution until a complete replacement of the water occurs. To clarify the ratio of hydraulic conductivity regarding ore and barren parts of the section, as well as their changes in the leaching process, one applies so-called “package” (batch) launches of tinted water or solutions.
Upon conclusion of the tests, the treated ore material is analyzed to determine the residual uranium content. The results are recorded and processed like those for the column leaching data, except that the uranium concentration in the recovery solutions does not require any correction for dilution with water from the barren sections.
In addition to the ISL modelling task, the ground trays can be used to evaluate the movement of liquids with variable density and viscosity. They are also useful in studying the movement of liquid containing gases, the nature of re-precipitation in plan and section, and chemical plugging in a multilayer medium, etc. The shape of ground trays may vary depending on the set task.
5.1.6. Modeling leaching from clayey ores
The leaching of clayey ores is not as important as sandy ores, and is done only concurrently when dealing with graded sandy ores within the limits of one productive aquifer. It proceeds according to a diffusion mechanism and therefore can be described using the diffusion equation.
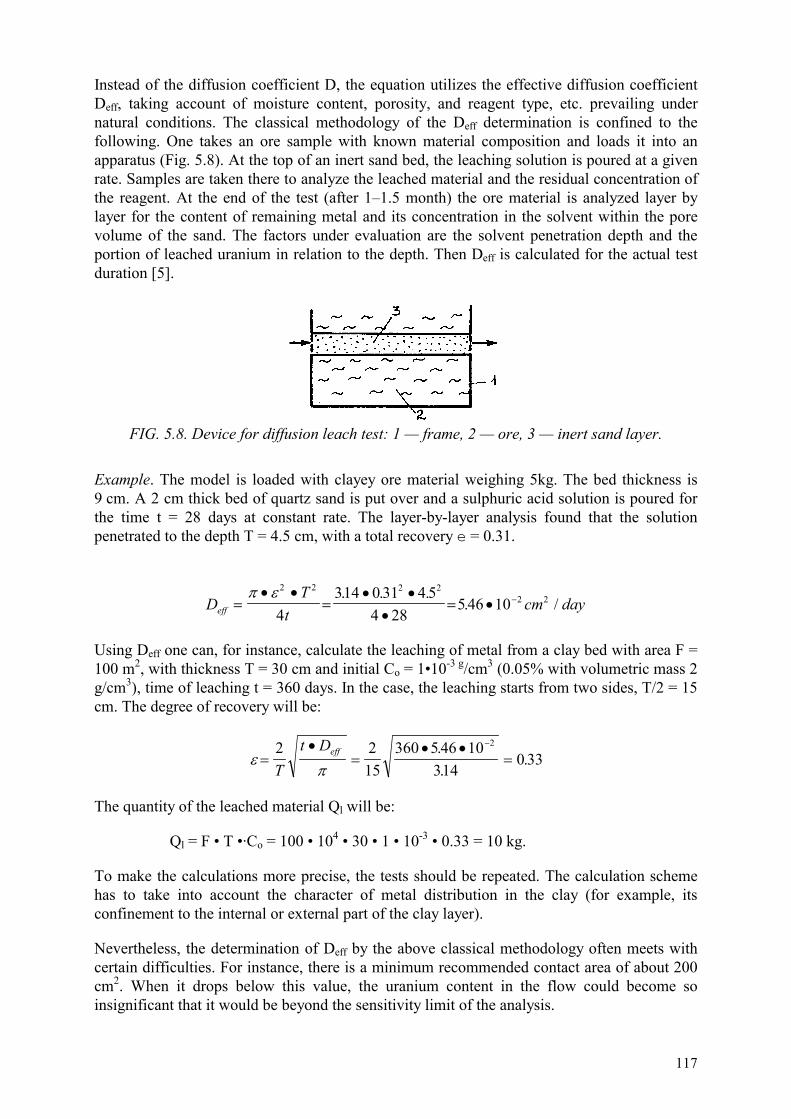
117
Instead of the diffusion coefficient D, the equation utilizes the effective diffusion coefficient Deff, taking account of moisture content, porosity, and reagent type, etc. prevailing under natural conditions. The classical methodology of the Deff determination is confined to the following. One takes an ore sample with known material composition and loads it into an apparatus (Fig. 5.8). At the top of an inert sand bed, the leaching solution is poured at a given rate. Samples are taken there to analyze the leached material and the residual concentration of the reagent. At the end of the test (after 1–1.5 month) the ore material is analyzed layer by layer for the content of remaining metal and its concentration in the solvent within the pore volume of the sand. The factors under evaluation are the solvent penetration depth and the portion of leached uranium in relation to the depth. Then Deff is calculated for the actual test duration [5].
FIG. 5.8. Device for diffusion leach test: 1 — frame, 2 — ore, 3 — inert sand layer.
Example. The model is loaded with clayey ore material weighing 5kg. The bed thickness is 9 cm. A 2 cm thick bed of quartz sand is put over and a sulphuric acid solution is poured for the time t = 28 days at constant rate. The layer-by-layer analysis found that the solution penetrated to the depth T = 4.5 cm, with a total recovery e = 0.31.
DT
tcm dayeff �
� �
�
� �
�
� ��
� �2 2 2 2
2 2
4314 0 31 4 5
4 285 46 10
. . .. /
Using Deff one can, for instance, calculate the leaching of metal from a clay bed with area F = 100 m2, with thickness T = 30 cm and initial Co = 1•10-3 g/cm3 (0.05% with volumetric mass 2 g/cm3), time of leaching t = 360 days. In the case, the leaching starts from two sides, T/2 = 15 cm. The degree of recovery will be:
�
�
�
�
�
� �
�
�2 215
360 5 46 10314
0 332
Tt Deff .
..
The quantity of the leached material Ql will be:
Ql = F • T •·Co = 100 • 104 • 30 • 1 • 10-3 • 0.33 = 10 kg.
To make the calculations more precise, the tests should be repeated. The calculation scheme has to take into account the character of metal distribution in the clay (for example, its confinement to the internal or external part of the clay layer).
Nevertheless, the determination of Deff by the above classical methodology often meets with certain difficulties. For instance, there is a minimum recommended contact area of about 200 cm2. When it drops below this value, the uranium content in the flow could become so insignificant that it would be beyond the sensitivity limit of the analysis.
118
Sufficient contact area is necessary to take the average of several core samples identical in the composition or destruction degree of the natural structure. When composing an artificial flexible ore bed from an averaged sample, one should replicate the natural humidity and mass by volume, as well. Since the natural behaviour of clay largely depends on the underground pressure, the above test method gives only a tentative idea of the actual value of Deff. According to published data, the Deff value for elastic clayey rock varies from 5•10-3 to 5•10-2 cm2/day. These values can be taken into account in evaluation of uranium recovery from clays.
Among the permeable sandy sediments, there are often practically impermeable layers of fissured or weakly fissured rocks, which completely defeat the above test scheme. In this case, the contact area for the diffusive leaching efficiency test is limited to the core cross section, comprising at the most 80–85 cm2 at a drill hole diameter of 110 mm. However, it should be reduced, since the sample should be tested over the entire length to evaluate the distribution of uranium before leaching.
For this case the following procedure of Deff evaluation can be suggested. The sample of pre-test undisturbed structure and natural humidity (after treating with paraffin) is longitudinally divided into two parts. One part is used in analysis of the initial uranium content. The second one is treated with paraffin all around, except for the top contact and is put into analytical ceramic glass. The space between the glass walls and the sample are also filled with paraffin.
Then over the upper surface of the sample some predetermined volume of reagent solution at a working concentration is poured. The concentration should on average be similar to that anticipated underground, so that the empirical uranium concentration in this volume would comprise (as usual in diffusion leaching) about 2–3 mg/dm3. The correction of concentration is done using a solution volume that should be replaced daily with a fresh one, analyzed for the residual quantity of the reagent and leached uranium. After 30–40 days, the sample is analyzed layer-by-layer for the content of metal recovered, and the degree of leaching is evaluated versus the depth. The further procedure of determining Deff is similar to that described above. In unfractured samples the diffusion coefficient can be a factor of one or two orders of magnitude lower than that for elastic clays.
5.2. DETERMINING PERMEABILITY PROPERTIES OF UNCONSOLIDATED ROCK AND ORES
5.2.1. General
The water permeability of loose rock is usually expressed by hydraulic conductivity which characterizes the suitability of the deposit for ISL (see Section 2.2). The initial value of hydraulic conductivity in saturated rock is determined by pumping groundwater from a well using special methodologies given in detail in hydrogeological literature on groundwater dynamics [1].
ISL may usually takes place over only a portion of an aquifer. Therefore, it is necessary to determine not only the average value of hydraulic conductivity obtained in a well drawdown test (pumping-test), but also to determine its change over the deposit. The evaluation taken throughout all permeable lithological species of rock and ores makes it possible to determine the anticipated dilution of the leach solution by undergroundwater or barren leach solution. This information is of great importance for economic assessment and for determining the feasibility of extracting a deposit using ISL.

119
The chemical interaction of the leach solution with the rock and ore minerals making up the productive aquifer results in permeability changes. Therefore, the investigation is divided into two stages. The first determines the initial values of the hydraulic conductivity of rock and ores using the normal methodology adopted for laboratory hydrogeological investigation [8, 9]. The second one deals with changes in the character and values of permeability in the selected lithological species during the process of chemical interaction with the leaching solution. This stage is described below.
5.2.2. Determination of initial hydraulic conductivities for rock and ores
Under laboratory conditions the hydraulic conductivity of unconsolidated (sand and loam) rock is determined for both the disturbed and undisturbed structure (artificially compressed average samples). The results can be similar. However, in layered rocks (especially when interbedded with clay) the differences can be substantial. The hydraulic conductivity of bound (clay and loam) rocks in hydrogeological practice is determined on samples with undisturbed structure.
One of the possible procedures for determining the hydraulic conductivity in samples of undisturbed structure is presented in Figure 5.9. The �h value can be adopted as the difference in heads (the loss for the resistance in hoses and filters is below 5%). The installation depicted in Figure 5.9 can be used for the samples with undisturbed structure (in this case instead of the cylinder, one takes a cutting ring filled with material and inserted in a fresh core sample) as well as for blended material. The main flow direction coincides with the dominant fluid flow, i.e. along the layer and perpendicular to the core sample. The hydraulic conductivities in the samples with undisturbed structure also serve for comparison of the initial (prior to leaching) permeability through the bed and perpendicular to it (along the core sample axis).
FIG. 5.9. Installation for determining initial value of hydraulic conductivity of undisturbed sandstone (for water): 1 — ring with rock, 2 — Boyle vessel, 3 — measuring cylinder, 4 — Y-joint, 5 — grip, 6 — rubber seal, 7 — fastening bolts.
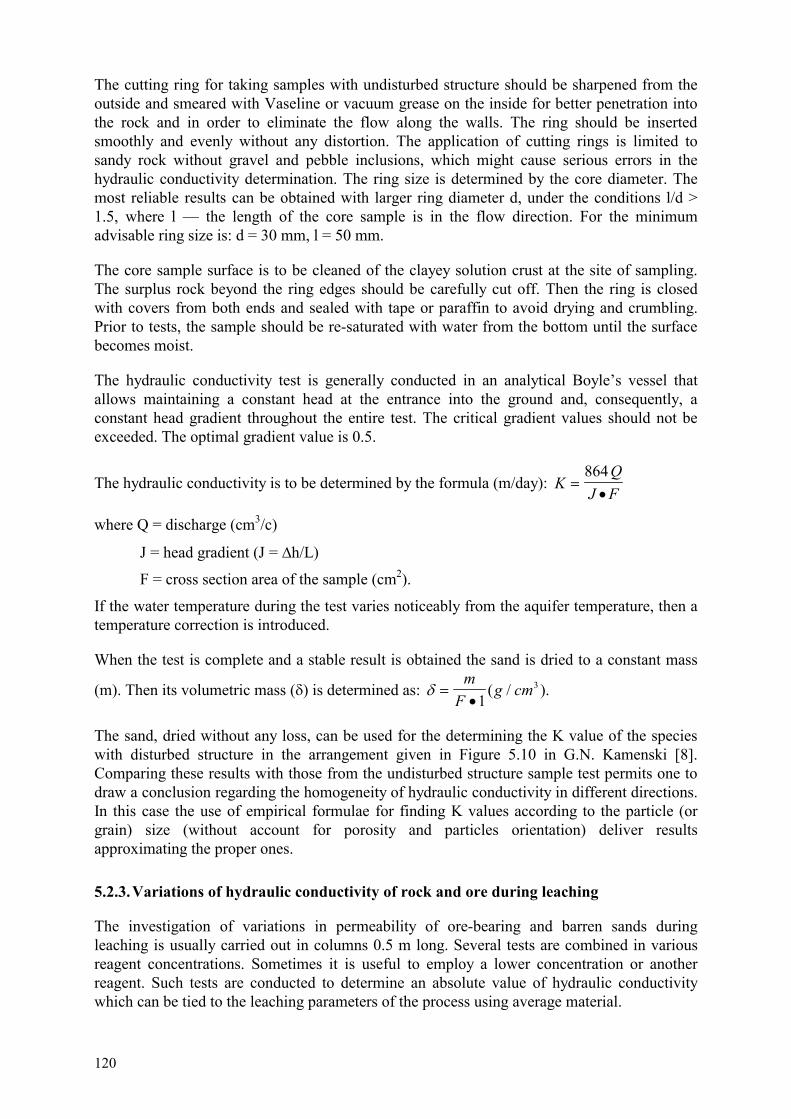
120
The cutting ring for taking samples with undisturbed structure should be sharpened from the outside and smeared with Vaseline or vacuum grease on the inside for better penetration into the rock and in order to eliminate the flow along the walls. The ring should be inserted smoothly and evenly without any distortion. The application of cutting rings is limited to sandy rock without gravel and pebble inclusions, which might cause serious errors in the hydraulic conductivity determination. The ring size is determined by the core diameter. The most reliable results can be obtained with larger ring diameter d, under the conditions l/d > 1.5, where l — the length of the core sample is in the flow direction. For the minimum advisable ring size is: d = 30 mm, l = 50 mm.
The core sample surface is to be cleaned of the clayey solution crust at the site of sampling. The surplus rock beyond the ring edges should be carefully cut off. Then the ring is closed with covers from both ends and sealed with tape or paraffin to avoid drying and crumbling. Prior to tests, the sample should be re-saturated with water from the bottom until the surface becomes moist.
The hydraulic conductivity test is generally conducted in an analytical Boyle’s vessel that allows maintaining a constant head at the entrance into the ground and, consequently, a constant head gradient throughout the entire test. The critical gradient values should not be exceeded. The optimal gradient value is 0.5.
The hydraulic conductivity is to be determined by the formula (m/day): KQ
J F�
�
864
where Q = discharge (cm3/c)
J = head gradient (J = �h/L)
F = cross section area of the sample (cm2).
If the water temperature during the test varies noticeably from the aquifer temperature, then a temperature correction is introduced.
When the test is complete and a stable result is obtained the sand is dried to a constant mass
(m). Then its volumetric mass (�) is determined as: � �
�
mF
g cm1
3( / ).
The sand, dried without any loss, can be used for the determining the K value of the species with disturbed structure in the arrangement given in Figure 5.10 in G.N. Kamenski [8]. Comparing these results with those from the undisturbed structure sample test permits one to draw a conclusion regarding the homogeneity of hydraulic conductivity in different directions. In this case the use of empirical formulae for finding K values according to the particle (or grain) size (without account for porosity and particles orientation) deliver results approximating the proper ones.
5.2.3. Variations of hydraulic conductivity of rock and ore during leaching
The investigation of variations in permeability of ore-bearing and barren sands during leaching is usually carried out in columns 0.5 m long. Several tests are combined in various reagent concentrations. Sometimes it is useful to employ a lower concentration or another reagent. Such tests are conducted to determine an absolute value of hydraulic conductivity which can be tied to the leaching parameters of the process using average material.
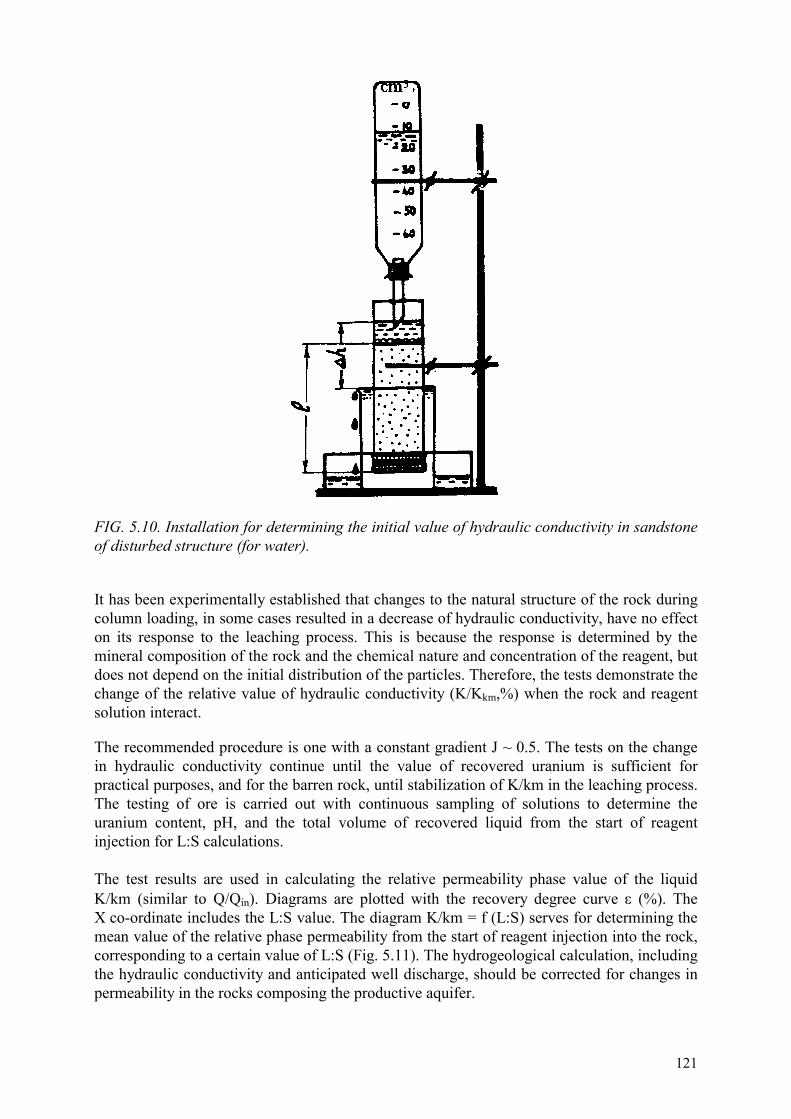
121
FIG. 5.10. Installation for determining the initial value of hydraulic conductivity in sandstone of disturbed structure (for water).
It has been experimentally established that changes to the natural structure of the rock during column loading, in some cases resulted in a decrease of hydraulic conductivity, have no effect on its response to the leaching process. This is because the response is determined by the mineral composition of the rock and the chemical nature and concentration of the reagent, but does not depend on the initial distribution of the particles. Therefore, the tests demonstrate the change of the relative value of hydraulic conductivity (K/Kkm,%) when the rock and reagent solution interact.
The recommended procedure is one with a constant gradient J ~ 0.5. The tests on the change in hydraulic conductivity continue until the value of recovered uranium is sufficient for practical purposes, and for the barren rock, until stabilization of K/km in the leaching process. The testing of ore is carried out with continuous sampling of solutions to determine the uranium content, pH, and the total volume of recovered liquid from the start of reagent injection for L:S calculations. The test results are used in calculating the relative permeability phase value of the liquid K/km (similar to Q/Qin). Diagrams are plotted with the recovery degree curve � (%). The X co-ordinate includes the L:S value. The diagram K/km = f (L:S) serves for determining the mean value of the relative phase permeability from the start of reagent injection into the rock, corresponding to a certain value of L:S (Fig. 5.11). The hydrogeological calculation, including the hydraulic conductivity and anticipated well discharge, should be corrected for changes in permeability in the rocks composing the productive aquifer.
122
FIG. 5.11. Example of the changing relative hydraulic conductivity (C/Cin) of ore during uranium leaching: 1 — % recovery, 2 — (C/Cin), 3 — the average value from the moment of first reagent feed.
REFERENCES TO CHAPTER 5
[1] BOREVSKI, B.V., SAMSONOV, B.G., JAZVIN, L.S., Methodology of Determining Aquifer Parameters Using Pumping-Out Data, M. Nedra (1979).
[2] GAVICH, I.K., Theory and Practice of Modelling Used in Hydrogeology, M. Nedra, (1980).
[3] LUKNER, L. SHESTAKOV, V.M., Geofiltration Modelling, M. Nedra (1976). [4] LUTSENKO, I.K., BELETSKY, V.I., DAVYDOVA, L.G., Non-Mining Working of
Ore Deposits, M. Nedra (1986). [5] BELETSKY, V.I., DAVYDOVA, L.G., DOLGIKH, P.F., et al., Research Methods in
Ores ISL. M. Publ. MGRI (1981). [6] BOCHEVER, F.M., GARMONOV, I.V., LEBEDEV, A.V., SHESTAKOV, V.M.,
Basics of Hydrogeological Estimation, M.Nedra (1969). [7] SLINKO, M.G., Modelling of Contact Processes, Kinetics and Catalysis, M. Acc. of
Sci. USSR 3 4, 481–492 (1962). [8] Manual of Hydrogeologist (V.I. Maksimov, Ed.), L. Nedra 1 & 2. [9] CHAPOVSKI, E.G., Laboratory Tests on Soils and their Mechanics, M. Nedra (1975). [10] SHESTAKOV, V.M., Underground Water Dynamics, M. MGU, (1973).
BIBLIOGRAPHY TO CHAPTER 5 FREEZE, R.A., CHERRY, J.A., Groundwater, Prentice Hall, 317, 347–349 (1979).
123
Chapter 6
WELLFIELD LEACH TESTS AT ISL DEPOSITS
6.1. GENERAL CONCEPTS AND THE SEQUENCE OF LEACH TESTS
Figure 6.1 is a summary of a typical programme of investigation to examine the suitability of uranium sandstone deposits for ISL operation. The investigation of a deposit begins with a study of its geological structure and hydrological conditions.
For deposits which appear favourable for extraction by ISL technology, the leaching process can be simulated in the laboratory by conducting leach tests on core samples. The results of these tests, when combined with mathematical modelling, are used in the design of ISL pilot wellfield tests at two scales, namely:
�� simplified (single well) tests — at an early stage of investigation �� multiple well tests — at a later, more detailed stage of investigation
The schedule given in Figure 6.l offers only a general outline for a programme of geotechnical research. Geological, mineralogical, hydrological, geophysical and laboratory studies, at varying levels of detail, should be carried out at every stage of the programme, depending upon the objectives of each individual stage. The laboratory-scale tests on core samples should include both mineralized and unmineralized rock from all the main lithological and permeability zones present in the deposit.
Research conducted during the earlier stages of an investigation consists mainly of laboratory tests on core samples with the possibility of an occasional geotechnical field test, although these are usually planned for later, more detailed stages. The first field tests do not incorporate any leaching solutions, but subsequent multi-well pilot-plant scale field tests do involve leaching of ore and recovery of uranium from recirculating solutions. The objective of all of these tests is to collect sufficient data for the design of a commercial ISL operation and to be able to forecast leaching performance.
Table 6.1 is a summary of the typical activities at each of three general stages of a geotechnical investigation, although not all of the procedures may be required in each case and changes to this sequence are possible. For instance, in some situations, the results of underground (in-situ) leaching tests might be required at an earlier stage, while in other cases, the known leaching performance of adjacent deposits in the same geological formation may render further testing unnecessary.
Sites for geotechnical field tests should be selected so that the results are representative of all rock types in the geological cross-section. In general, the pilot-plant tests are conducted on the largest zone or most frequently occurring ore type of economic significance. If there are two different ore types which are present in similar amounts, both of which are of economic interest, then two tests will be required. Conversely, pilot-plant testing may be simplified if the orebody is similar to an existing operating ISL wellfield which has comparable geological and hydrological properties.

124
FIG. 6.1. Summary outline of a leach test investigation for the application of ISL technology. 6.2. WELL PATTERNS AT ISL TEST SITES
If the geological and hydrological properties of a deposit are favourable for an ISL operation, and these research results have been verified by laboratory testing and simulation, then the investigation is continued by conducting uranium leaching in test wellfields. These field tests should reliably determine the leaching performance and provide initial design data for a commercial uranium producing facility.
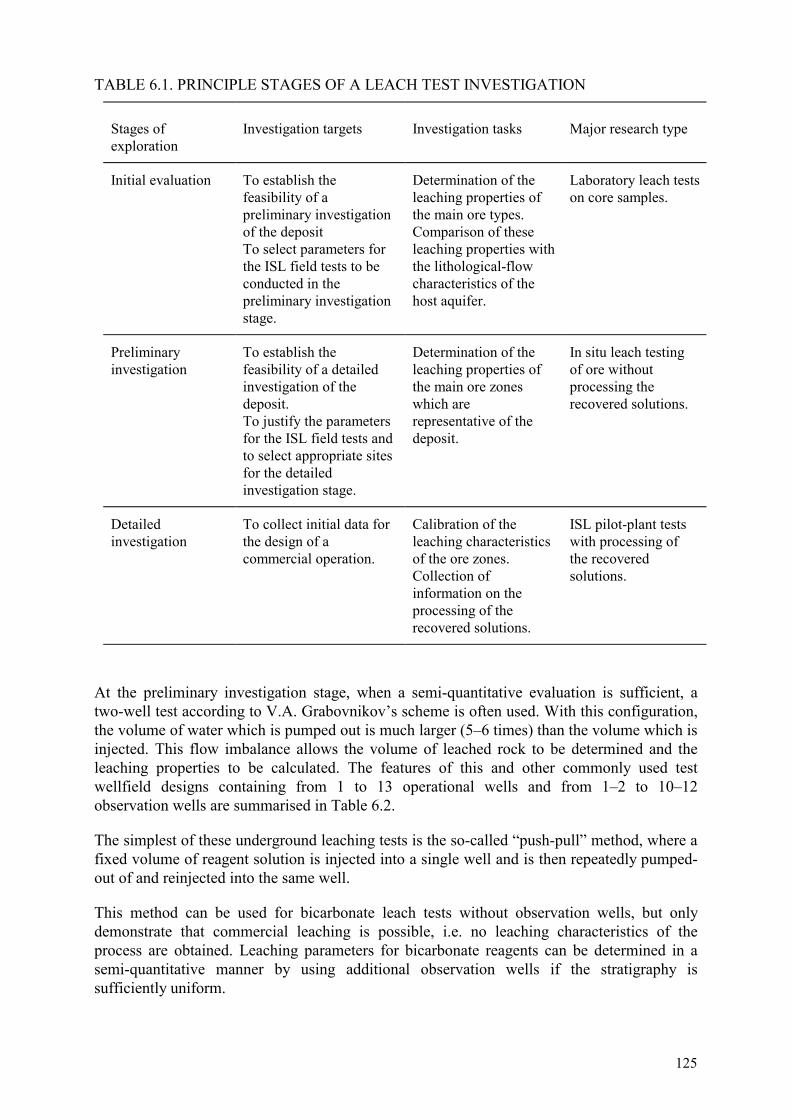
125
TABLE 6.1. PRINCIPLE STAGES OF A LEACH TEST INVESTIGATION
Stages of exploration
Investigation targets
Investigation tasks
Major research type
Initial evaluation To establish the feasibility of a preliminary investigation of the deposit To select parameters for the ISL field tests to be conducted in the preliminary investigation stage.
Determination of the leaching properties of the main ore types. Comparison of these leaching properties with the lithological-flow characteristics of the host aquifer.
Laboratory leach tests on core samples.
Preliminary investigation
To establish the feasibility of a detailed investigation of the deposit. To justify the parameters for the ISL field tests and to select appropriate sites for the detailed investigation stage.
Determination of the leaching properties of the main ore zones which are representative of the deposit.
In situ leach testing of ore without processing the recovered solutions.
Detailed investigation
To collect initial data for the design of a commercial operation.
Calibration of the leaching characteristics of the ore zones. Collection of information on the processing of the recovered solutions.
ISL pilot-plant tests with processing of the recovered solutions.
At the preliminary investigation stage, when a semi-quantitative evaluation is sufficient, a two-well test according to V.A. Grabovnikov’s scheme is often used. With this configuration, the volume of water which is pumped out is much larger (5–6 times) than the volume which is injected. This flow imbalance allows the volume of leached rock to be determined and the leaching properties to be calculated. The features of this and other commonly used test wellfield designs containing from 1 to 13 operational wells and from 1–2 to 10–12 observation wells are summarised in Table 6.2.
The simplest of these underground leaching tests is the so-called “push-pull” method, where a fixed volume of reagent solution is injected into a single well and is then repeatedly pumped-out of and reinjected into the same well.
This method can be used for bicarbonate leach tests without observation wells, but only demonstrate that commercial leaching is possible, i.e. no leaching characteristics of the process are obtained. Leaching parameters for bicarbonate reagents can be determined in a semi-quantitative manner by using additional observation wells if the stratigraphy is sufficiently uniform.

126
TABLE 6.2. CHARACTERISTICS OF THE MOST COMMONLY USED DESIGNS FOR ISL TEST FIELDS
Wellfield
design
Number of
auxiliary wells
Exploration
stage
Reliability of leaching
results
Reagent type
Recommendations
Bicarbon. H2S04 leaching
Bicarbon H2S04 leaching.
One-well (push-pull)
up to 2–4
Initial evaluation
Qualitative or semi-qualitative
+ –
+ –
3–6 angular with one recovery well
up to 6–10
The same
The same
– –
+ +
Two wells with pumping
2–3 observation + one for water supply + for waste disposal
Preliminary investigation
Semi quantitative
+ + +
+ imbalance
Rectangular 3 recovery wells (one central cell)
8–12
Detailed investigation
Quantitative
+ +
+ +
Hexagonal 3 recovery wells (one central cell)
8–12
The same
The same
+ +
+ +
The push-pull method is useless, however, for acid leaching tests due to the reprecipitation of dissolved uranium underground as the solutions become neutralised. There will also be some uncertainty about the aerial distribution of the leaching zone.
The two-well system with solution imbalance (over-pumping) [2] has an advantage compared to other simplified tests which have only one recovery well because it is possible to calculate the performance of this system using an algorithm. The quality and quantity of information obtained with this test is still not as valuable as the multi-well arrays which have a central cell, but the observation wells can be used to locate the edges of the reaction zone. Because of the imbalance in the flow distribution, this coincides with the leaching zone underground.
The main disadvantage of this method is the limited accuracy of the leaching performance calculations. In particular, underestimation of the volume of the leached zone can be caused by variations in rock permeability and by deviations in the bottom-hole well locations which occurred during drilling. Furthermore, safe disposal of reagents and solutions collected at the ground surface by over-pumping during the tests can also be a problem.
The diagrams in Figure 6.2 show the position of the leaching zones in various designs of test polygons. The distribution of flow lines associated with each design are presented in Figures 6.3–6.8. In each case, the boundaries of the partially leached zones should be clearly differentiated from the completely leached ores when attempting to derive the leaching properties and efficiency.

127
FIG. 6.2. Zones of leaching for various ISL well patterns: a — one-well (push-pull), b — two-well (V.A. Grabovnikov's), c — 5-well (“square”), d — 11-well (hexagonal with a central cell), e — 9-well (tetragonal with a central cell). Leach zone: 1- underground (confined aquifer), 2 — on the surface (unconfined aquifer). Well: 3 — injection, 4 — recovery, 5 — alternating, 6 — geometric site limit defined by wells, 7 — flow line, 8 — equipotential lines and their marks, 9 — area of central cell, 10 — direction of dilution by native groundwater.
FIG. 6.3. 2 — well test pattern operating with 5-fold solution imbalance (V.A. Grabovnikov’s method): 1 — observation hole. (See FIG. 6.2 for rest of legend).

128
FIG. 6.4. Hydrodynamic scheme for triangular test pattern with one central recovery well and, equal flow rate of injection wells. (See FIG. 6.2 for legend).
FIG. 6.5. Hydrodynamic scheme for tetragonal test pattern with one recovery well and equal flow rate of injection wells. (See FIG. 6.2 for legend).
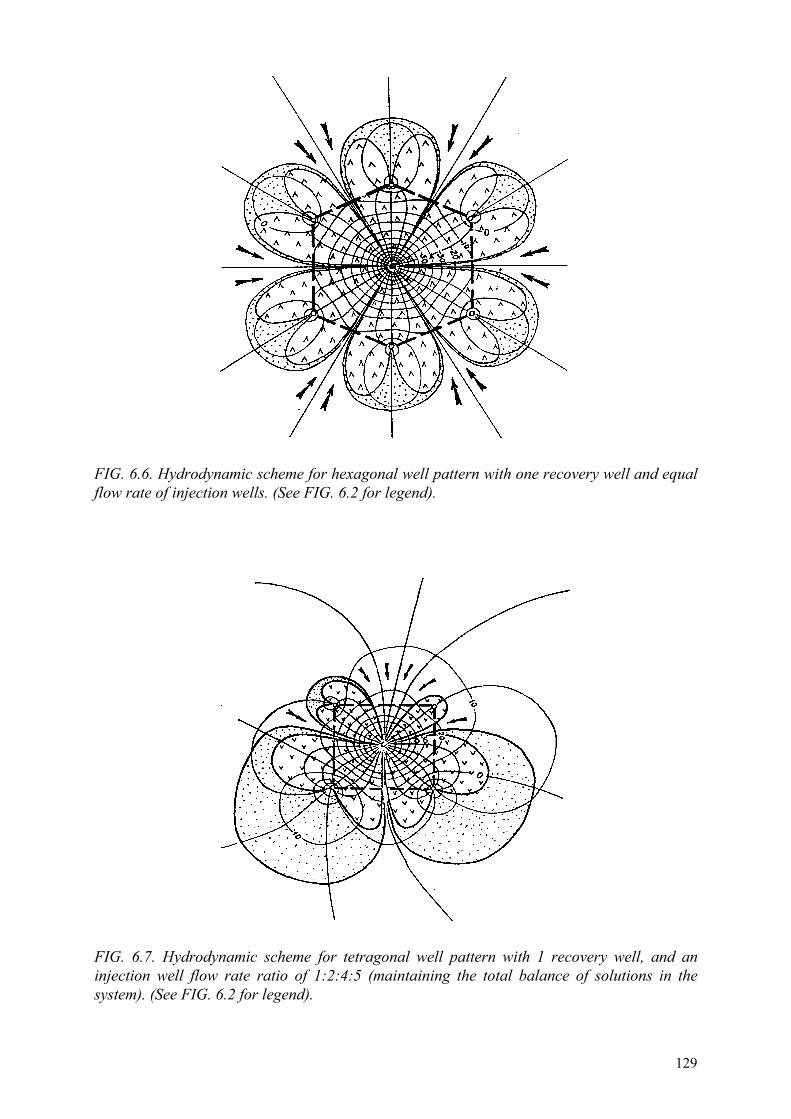
129
FIG. 6.6. Hydrodynamic scheme for hexagonal well pattern with one recovery well and equal flow rate of injection wells. (See FIG. 6.2 for legend).
FIG. 6.7. Hydrodynamic scheme for tetragonal well pattern with 1 recovery well, and an injection well flow rate ratio of 1:2:4:5 (maintaining the total balance of solutions in the system). (See FIG. 6.2 for legend).

130
FIG. 6.8. Hydrodynamic scheme for hexagonal well pattern with 3 recovery wells. (See FIG. 6.2 for legend).
The limits of the completely leached zones are derived from the theoretical flow paths of injected solutions which reach the recovery wells. The actual volume of underground leaching is usually much larger, however, since it includes a peripheral halo of ore which may be only partially leached and which may contain dissolved uranium which has re-precipitated or is still in solution but not has yet reached the recovery wells. Only the ore reserve contained within the arbitrarily defined zone of complete leaching is used for comparing with the quantity of recovered uranium to estimate the efficiency of leaching. It is much smaller in size than the total volume of rock which is contacted by leaching solutions.

131
The most important aspect of test wellfield designs which contain only one recovery well (Figures 6.4–6.6) is the absence of a closed central cell through which only injected solutions flow, undiluted by any surrounding groundwater. The absence of such a zone of maximum leaching in these wellfield pattern designs results in continuous and increasing dilution of leaching solutions by groundwater during leach tests.
Differences in flow rate at injection wells, which are commonly observed in practice, can lead to irregular distribution of dilution zones in a manner which controlled by the ratio of injection flows at these wells. An example of such a wellfield pattern is shown in Figure 6.7, where the injection flow rate ratio is 1:2:4:5. After two years of operation, the dilution factor of the leaching fluids will be 22%, compared to a factor of 5% if the injection flow rates had been equal.
The inability to plot contoured zones of progressive leaching in simple test wellfield designs limits the accuracy of the leaching reaction calculations, including the percentage of recovered uranium, the L:S value and the consumption of the reagent. Even the additional information on the extent of leaching provided by observation wells is insufficient for the exact calculation of uranium recovery.
The difference in the path length between the shortest and longest solution flow lines in test wellfields containing only one central recovery well causes slower leaching rates when compared to the efficiency of the central cells in traditional test wellfield designs. It has been found in one deposit under evaluation that, after two years of operation, a square wellfield pattern had recovered only 44% of the contained uranium reserve, whereas a hexagonal pattern with a central cell (Fig. 6.2d) recovered 80% of its reserve in the same time (distance between wells L = 50 m).
The leaching characteristics to be expected with different types of test wellfield designs which contain only one recovery well are listed in Table 6.3.
The data presented in Table 6.3 show that significant errors can occur if a leaching area based upon the geometric shape of the wellfield pattern (F1) is used for calculating parameters such as the percentage of recovered uranium, the liquid to solid ratio (L:S) and the specific reagent consumption.
All these simple wellfield designs are characterised by lower percentage recovery values (44 ~ 58%) calculated from the geometric shape of the wellfield pattern. The data also shows that the total area of rock contacted by the leaching solutions increases as the number of injection wells in the pattern decreases. This results in a loss of reagent because a larger proportion of the solution is not recovered at the pumping well. In the triangular design, the ratio between the total area of rock contacted by leaching fluids and the area inside the geometric pattern shape is three times larger than the hexagonal design and twice that of the square design. This phenomenon is related to the fact that the injection velocity in pattern designs with fewer injection wells is higher at constant recovery flow rate (Qrecovery).
The flow rate at the injection wells is the limiting factor with the greatest impact on the total production of the wellfield. Therefore, with fewer injection wells, operation of the triangular design is less efficient than the hexagonal design. When all of these considerations are taken

132
TABLE 6.3. COMPARISON OF LEACHING CHARACTERISTICS FOR TEST WELLFIELD DESIGNS CONTAINING ONE RECOVERY WELL
Parameter
Unit of
measurement
Triangular
design
Square design
Hexagonal
design
Uranium recovery
In leached zone In pattern geometric shape
% %
38 58
32 44
38 56
Leaching area I. Absolute values Inside test pattern edges (F1) Completely leached zone (F2) Total contacted zone (F3)
m2
m2
m2
1591 6342
15284
2450 7264
10856
3183 7824
10227 II. Relative values F1 F2 F3
1 4.0 9.6
1 3.0 4.4
1 2.5 3.2
Notes: t = 2 years; L = 35m; Qrecovery = 10 m3/hr (= 44 US gpm).
into account, it can be concluded that the hexagonal design is the most efficient geometric pattern shape of the single recovery-well types. However, the hexagonal pattern requires seven operational wells, only two less than a traditional test wellfield of the type shown in Figure 6.2d. This has nine wells but it permits more accurate quantification of all the leaching characteristics.
Unequal flow rates at injection wells, even with the combined solution flow rates in balance, results in increased dilution of the reagents and slower leaching rates. Similar dilution problems can also be caused by horizontal displacement of well screens, more than 1–2 meters from their planned locations, due to deviation of the pilot holes during drilling. This causes loss of pattern symmetry and changes the solution flow paths across the leaching zone. Both of these factors need to be addressed, therefore, to ensure efficient leaching and to improve the accuracy of the calculations.
The time required to reach the target recovery percentage (usually 80% of the estimated ore reserve) can be reduced, either by decreasing the spacing of the injection and recovery wells or by increasing their flow rates. Potential technical problems could arise in both of these situations. In the first case, it is very difficult to drill pilot holes to depths of 400 to 700 metres without incurring at least 3–5 metres of deviation from the planned location of the well screens. As a consequence, a minimum separation distance of 20–25 metres between pairs of injection and recovery wells is generally recommended, depending upon the final drilling depth. Increases in well productivity can also be difficult to achieve, with the aquifer transmissivity usually being limiting factor, as well as engineering problems and increases in pumping costs.
It follows from this discussion that a leach test using wellfields without central cells will be expected to achieve the target recovery percentage in approximately three years of operational

133
time. This could be extended to 4 or 5 years if the flow rates are degraded by plugging of the well screens and the ore-bearing formation. It should be concluded, therefore, that investigation of underground leaching performance using test wellfield designs with one pumping well are of qualitative value only (Table 6.2, second wellfield design).
Quantitative evaluation of leaching performance is best achieved using test wellfields (Table 6.2, wellfield design nos. 4 and 5) containing three pumping wells. The central pumping well and the surrounding injection wells form a central cell which operates without dilution of the leaching solutions by normal groundwater (indicated by oblique shading on Figures 6.2d and 6.2e). The performance data from such a cell are utilised for calculating the leaching parameters of a deposit for commercial exploitation [4].
The shape and size of the central cell does not vary significantly with changes in the ratios of the well flow rates, and the assumption that the area of leached ore remains constant is reasonable for the level of the accuracy of the calculation. The two outer pumping wells form a “barrier” of production solutions which prevents dispersion of fluids from the cell and maintains a steady state condition throughout the testing period. Any changes in the permeability of the central and neighbouring cells take place simultaneously and should not result in any displacement of cell leaching boundary.
In wellfield pattern designs where this hydraulic barrier is formed by natural groundwater, changes in aquifer permeability will only occur inside the boundary of the leaching zone (e.g. the two-well system of V.A. Grabovnikov and some other rare schemes). As a result, the shape of the leaching boundary will change with time and the leaching performance calculations will be less accurate.
In summary, based upon the above:
�� At the preliminary investigation stage, the most appropriate test wellfield design is the variety with a two-well arrangement and over-recovery of pumped solutions, although correctly executed laboratory tests (see Chapter 5) could yield similar or, in some cases, more reliable results. When combined with a favourable geological and hydrological evaluation, successful laboratory tests can become the basis for conventional multi-well tests which eliminate the need for a semi-quantitative two-well testing stage.
�� At the detailed investigation stage, a test wellfield design with a central undiluted leaching cell should be used (e.g. Figure 6.8). This is the only arrangement of wells which produces leaching performance calculations which are sufficiently reliable for the design of a commercial operation at the deposit. Any remaining errors in the leaching performance parameters calculated by this method are caused by inaccuracies in the estimation of underground ore reserves. The triangular and hexagonal wellfield designs with one recovery well should not be used at the detailed investigation stage, nor are they of great value at the preliminary investigation stage either.
Of all the conventional designs for test wellfields with a central undiluted leaching cell, the most economically attractive is the rectangular array of three recovery and six injection wells shown in Figure 6.2e, since any additional wells cannot be justified on a theoretical basis. Extra injection wells, as shown in the designs in Figures 6.2d and 6.8, can increase the productivity of the wellfield but they do not prevent dilution of leaching solutions, although they can decrease it. It is possible to avoid installing additional injection wells by ensuring
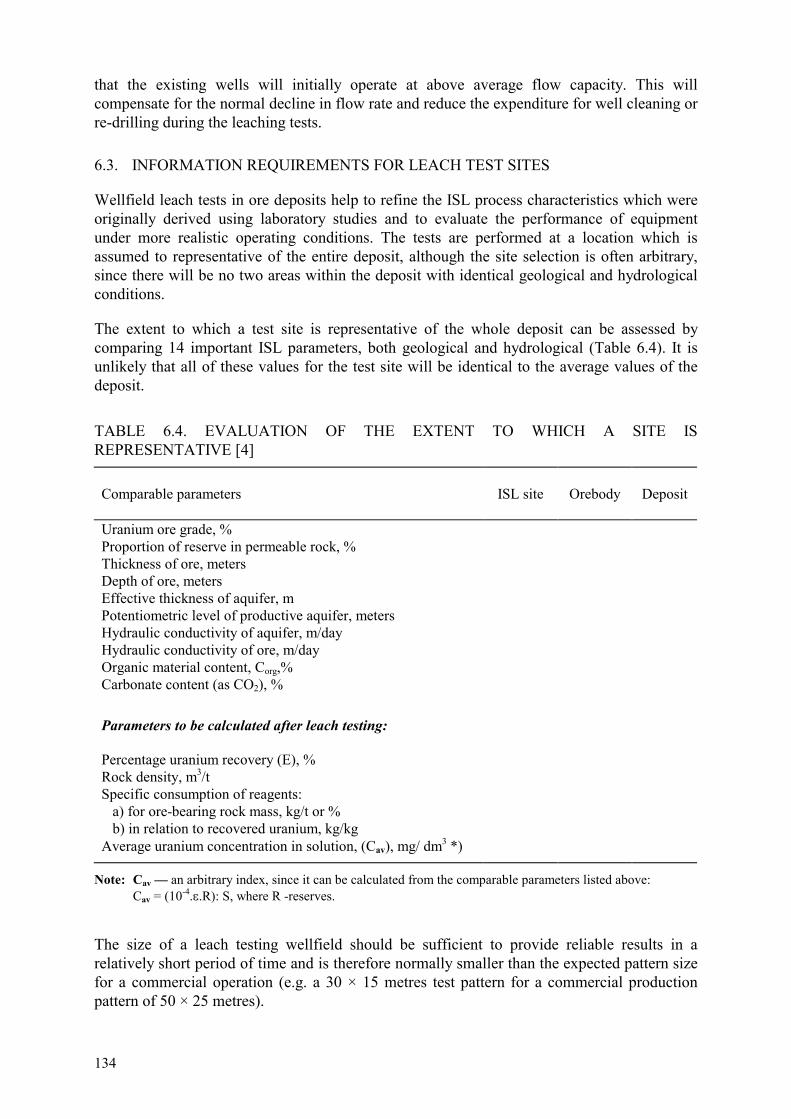
134
that the existing wells will initially operate at above average flow capacity. This will compensate for the normal decline in flow rate and reduce the expenditure for well cleaning or re-drilling during the leaching tests.
6.3. INFORMATION REQUIREMENTS FOR LEACH TEST SITES
Wellfield leach tests in ore deposits help to refine the ISL process characteristics which were originally derived using laboratory studies and to evaluate the performance of equipment under more realistic operating conditions. The tests are performed at a location which is assumed to representative of the entire deposit, although the site selection is often arbitrary, since there will be no two areas within the deposit with identical geological and hydrological conditions.
The extent to which a test site is representative of the whole deposit can be assessed by comparing 14 important ISL parameters, both geological and hydrological (Table 6.4). It is unlikely that all of these values for the test site will be identical to the average values of the deposit.
TABLE 6.4. EVALUATION OF THE EXTENT TO WHICH A SITE IS REPRESENTATIVE [4]
Comparable parameters
ISL site
Orebody
Deposit
Uranium ore grade, % Proportion of reserve in permeable rock, % Thickness of ore, meters Depth of ore, meters Effective thickness of aquifer, m Potentiometric level of productive aquifer, meters Hydraulic conductivity of aquifer, m/day Hydraulic conductivity of ore, m/day Organic material content, Corg,% Carbonate content (as CO2), %
Parameters to be calculated after leach testing: Percentage uranium recovery (E), % Rock density, m3/t Specific consumption of reagents: a) for ore-bearing rock mass, kg/t or % b) in relation to recovered uranium, kg/kg Average uranium concentration in solution, (Cav), mg/ dm3 *)
Note: Cav — an arbitrary index, since it can be calculated from the comparable parameters listed above: Cav = (10-4.�.R): S, where R -reserves. The size of a leach testing wellfield should be sufficient to provide reliable results in a relatively short period of time and is therefore normally smaller than the expected pattern size for a commercial operation (e.g. a 30 × 15 metres test pattern for a commercial production pattern of 50 × 25 metres).
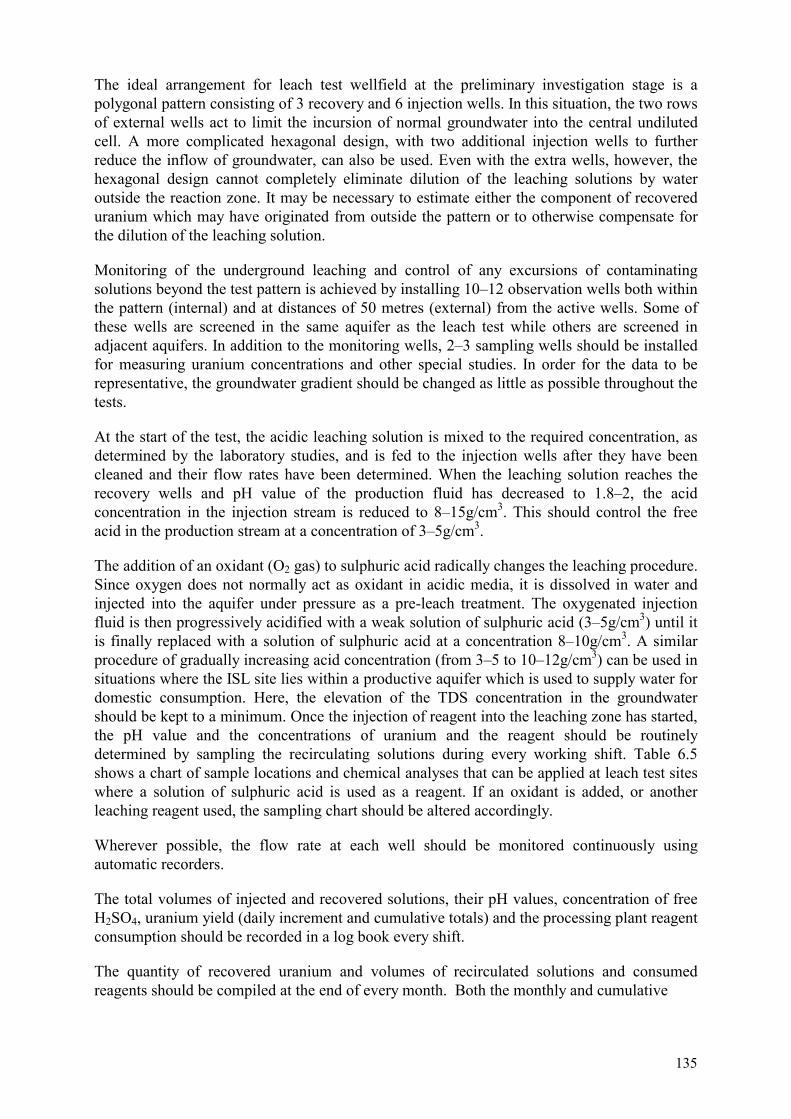
135
The ideal arrangement for leach test wellfield at the preliminary investigation stage is a polygonal pattern consisting of 3 recovery and 6 injection wells. In this situation, the two rows of external wells act to limit the incursion of normal groundwater into the central undiluted cell. A more complicated hexagonal design, with two additional injection wells to further reduce the inflow of groundwater, can also be used. Even with the extra wells, however, the hexagonal design cannot completely eliminate dilution of the leaching solutions by water outside the reaction zone. It may be necessary to estimate either the component of recovered uranium which may have originated from outside the pattern or to otherwise compensate for the dilution of the leaching solution.
Monitoring of the underground leaching and control of any excursions of contaminating solutions beyond the test pattern is achieved by installing 10–12 observation wells both within the pattern (internal) and at distances of 50 metres (external) from the active wells. Some of these wells are screened in the same aquifer as the leach test while others are screened in adjacent aquifers. In addition to the monitoring wells, 2–3 sampling wells should be installed for measuring uranium concentrations and other special studies. In order for the data to be representative, the groundwater gradient should be changed as little as possible throughout the tests.
At the start of the test, the acidic leaching solution is mixed to the required concentration, as determined by the laboratory studies, and is fed to the injection wells after they have been cleaned and their flow rates have been determined. When the leaching solution reaches the recovery wells and pH value of the production fluid has decreased to 1.8–2, the acid concentration in the injection stream is reduced to 8–15g/cm3. This should control the free acid in the production stream at a concentration of 3–5g/cm3.
The addition of an oxidant (O2 gas) to sulphuric acid radically changes the leaching procedure. Since oxygen does not normally act as oxidant in acidic media, it is dissolved in water and injected into the aquifer under pressure as a pre-leach treatment. The oxygenated injection fluid is then progressively acidified with a weak solution of sulphuric acid (3–5g/cm3) until it is finally replaced with a solution of sulphuric acid at a concentration 8–10g/cm3. A similar procedure of gradually increasing acid concentration (from 3–5 to 10–12g/cm3) can be used in situations where the ISL site lies within a productive aquifer which is used to supply water for domestic consumption. Here, the elevation of the TDS concentration in the groundwater should be kept to a minimum. Once the injection of reagent into the leaching zone has started, the pH value and the concentrations of uranium and the reagent should be routinely determined by sampling the recirculating solutions during every working shift. Table 6.5 shows a chart of sample locations and chemical analyses that can be applied at leach test sites where a solution of sulphuric acid is used as a reagent. If an oxidant is added, or another leaching reagent used, the sampling chart should be altered accordingly.
Wherever possible, the flow rate at each well should be monitored continuously using automatic recorders.
The total volumes of injected and recovered solutions, their pH values, concentration of free H2SO4, uranium yield (daily increment and cumulative totals) and the processing plant reagent consumption should be recorded in a log book every shift.
The quantity of recovered uranium and volumes of recirculated solutions and consumed reagents should be compiled at the end of every month. Both the monthly and cumulative

136
TABLE 6.5. CHART OF RECOMMENDED SAMPLE LOCATIONS AND CHEMICAL ANALYSES FOR LEACH TESTS USING SULPHURIC ACID SOLUTION [4, 5] Sample location
Parameters to analyse
Sample frequency
Analytical method
Sulphuric acid solution fed into injection wells
Uranium, H2SO4, conductivity, Flow volume Suspended solids
Continuous Once a day (daily average sample)
Automatic Chemical analysis
Injection wells Flow rate Fluid level Solution flow volume Uranium, pH/H2SO4, conductivity, Eh
Once every shift Once in ten days Constantly Once every shift
Automatic Electric level meter Automatic Automatic
Recovery wells Dry residue, SO42~(or
other anion-indicator) Cationic impurities (Fe, Al, Ca, etc.)
Once every 5 days (acidification period) Once every 30 days (working period)
Chemical analysis
Observation wells: (internal)
Fluid level Uranium, pH/H2SO4, Eh conductivity, SO4
2
Uranium, pH/H2SO4, conductivity, cations
Once every 10 days Once every 10 days (period of acidification) Once a month (working period)
Electric level meter Chemical analysis, automatic Automatic, chemical analysis
Observation wells: (external)
Fluid level Uranium, pH/H2SO4 conductivity, cations
Once a month Once a month (working period)
Electric level meter Automatic, chemical analysis
Production solution before adsorption
Uranium, pH/H2SO4 conductivity, HCO3
2-. (at the acidification stage)
Once every shift Chemical analysis
Al3+, Fe2+, Fe3+,Ca2+, Mg2+, SiO2, SO4
2-, NO3-,
K, Na, dry residue
Once a month Chemical analysis of monthly composite sample
statistics are recorded for each production and injection well and also for the entire test site. These data form the basis of all subsequent calculations of leaching characteristics and performance.
The ISL process at an individual test wellfield should be documented by means of the following diagrams and tables:
�� Time vs. concentration graphs of uranium and SO42- for all recovery and internal
monitoring wells. Changes in pH value with time should be plotted on the same graphs. �� A summary table listing the changing concentration of uranium, its mass in kg
(including cumulative totals), sulphuric acid concentration in the injection and production solutions, the cumulative volume of production solutions pumped since the start of acid injection, the L:S ratio, the total amount of acid consumed, its specific consumption per kg of recovered uranium and in comparison to the total rock mass within the wellfield leaching zone.
137
�� Contour maps of uranium recovery and pH values. �� Time vs. concentration graphs of the following elements and parameters for each
production well: Ca2+, Mg2+, Fe2+, Fe3+, Al3+, SiO2, conductivity, dissolved O2 (if oxygen is used as oxidant) and Eh (redox potential).
When the fluid recirculation stage of the leach test is finished, several more boreholes are drilled within and around the ISL pattern to determine the extent of reagent seepage beyond the leaching zone. Samples are also collected to examine the degree of rock acidification, the nature of any mineralogical alteration and to provide more data to improve the calculation of recovered uranium.
Every six months during the test, and again at the end of the test, potentiometric contour maps and solution flow models are constructed using averaged flow rate data from the operating wells to help interpret the progress of underground leaching. Adjustments can be made to the flow balance at individual wells if it appears from the modelled flow patterns that injected solutions are migrating away from the leaching zone or the inflow of diluting groundwater into the central cell is increasing.
The results of leaching tests on the ore deposit, both in the laboratory and the wellfield, form the basis of the design of a new ISL facility. All of the geological, hydrological and leach testing data is summarised as indicated in Table 6.4. Estimates of recoverable uranium reserves are also listed, classified in categories according to the economics of different ISL operating conditions.
The size, morphology and spatial relationship of the ore bodies are also evaluated, with the ore and host rocks separated into different classes depending upon their lithology and permeability. During the mineralogical study, particular attention is given to the carbonate content and the presence of organic matter and other impurities which might impact the leaching process.
The evaluation of an ore deposit for commercial ISL operation should incorporate a number of hydrological studies in addition to the general information provided in Table 6.4 (depth of orebody, permeability of rock and ore, hydrostatic head in the production aquifer). These include an examination of the integrity, conformity and thickness of the upper and the lower water-confining layers, determination of the orientation and velocity of the natural groundwater gradient, determination of the chemical composition of the groundwater and the location and uses of any water supplies produced from the same aquifer. Information about the productive uses of any adjacent aquifers should be noted and the probability of any adverse environment impact assessed.
Beside the geological and hydrological data, other operational aspects of the ISL process are determined on the basis of laboratory and field tests, as follows:
�� Composition and concentration of the leaching solution; �� Adjustments to leaching procedures to compensate for different ore types with varying
lithology and permeability, the L:S ratio, percentage recovery and reagent consumption; �� Chemical composition of the production solutions and the maximum permissible
concentration of TDS in the solutions being recirculated; �� The presence of any potentially valuable by-products and methods for their recovery.
138
6.4. CALCULATION OF LEACHING CHARACTERISTICS AND EVALUATING THEIR RELIABILITY
Leaching performance data obtained from wellfield tests are used during the design of facilities for commercial exploitation of ISL deposits. Determination of leaching characteristics for a test pattern requires the construction of a hydrologic flow model, without which reliable calculations are not possible.
The output from mathematical flow modelling, which is normally displayed as a map of flow lines, is sufficient for fluid volume calculations, but cannot be used for leach simulation without additional equations which link the flow parameters to the process chemistry. Normal flow modelling only addresses the movement of an inert fluid through an aquifer and ignores any chemical reaction between the fluid and the host rock. Factors such as the dissolution and re-precipitation of metals, dilution, retardation of solution fronts, two phase flow (gas generation), occlusion of pore throats and density stratification of non-uniform liquids, all of which occur during leaching, require specialised modelling.
A solution flow net for the test wellfield is constructed by using a flow model which calculates hydraulic heads for a series of grid nodes across the site. A grid spacing is chosen which is appropriate for the scale of the map, but a 5 × 5 metre grid is usually sufficiently accurate. The calculations are normally based upon the logarithmic approximation of Taise's formula (see 5.1.1).
The total change in the value of S at each grid node i is calculated by summing the S values for every operating well within the zone of influence:
S Sii
i n
�
�
�
�1
Computer programmes exist to calculate head values and create contour maps with flow trajectories on a plotter. However, the capability of these programmes is limited because they assume that the aquifer is homogeneous and that the fluid flow is advective. No account is taken of any variations in rock permeability or chemical reactions between the fluid and the host rock. The output does not contain any lines depicting the location and extent of the leaching zone.
Detailed procedures for the construction of solution flow nets have been published in general literature on modelling of undergroundwater flow [1, 2, 3, 7]. Some of these contain descriptions of methods which are specific to underground leaching.
Maps of solution flow nets for wellfield test sites should be prepared using average flow rates for the injection and production wells during the period when leaching reagent was being added to the fluids recirculating through the aquifer. The average flow rates are calculated from the total volume of solutions injected into, or pumped from a well, divided by the total time of the test. Shut-down time during the test should be included in the total because leaching reactions continue underground, even if there is no flow.
The number of the flow lines radiating from each well is derived from the ratio of the individual flow rate to the total flow rate of the recirculating solution. Flow nets constructed in this way, with proportional flow line density, give a visual impression of the volume of solution moving through any area of the test pattern and its immediate vicinity.

139
When the solution flow in the pattern is balanced, the number of flow lines leaving the injection wells should be equal to the number of flow lines converging at the recovery wells. Interpretation of a solution flow net should begin by defining the interface between internal and external flow zones in a wellfield and by differentiating between injection and recovery wells. So-called “dead zones”, where the flow velocity is very low, should be indicated, and then the required number of flow lines at each well, in proportion to the flow rate, are drawn at equal angular intervals around the well. Construction of the flow lines continues according to the principles of hydrodynamics, i.e. perpendicular to the lines of equal heads, from the injection well to the recovery well.
Calculation of the basic parameters of percentage uranium recovery, specific reagent consumption and the L:S ratio depend upon defining the boundary of the leaching zone.
During operation of small ISL test patterns, a significant proportion of the solutions disperses beyond the boundary of the pattern due to normal hydrodynamic behaviour. The leaching process, therefore, can affect an area several times larger than the area inside the perimeter of the pattern (commonly known as “flare”).
If the natural groundwater flow rate is so small that it can be ignored during ISL operations, i.e. it is approximately two orders of magnitude lower than the induced ISL flow rate, then a test wellfield can be operated under balanced conditions almost independently of the aquifer. Any dispersion of solution beyond the pattern edges can be recovered by pumping from the external wells.
Dispersed solutions recovered in this way may also contain small quantities of uranium leached from outside of the pattern. Other unleached ore beyond the pattern will eventually be recovered when the deposit is brought into production. The outer limit of dispersion of the solutions can be determined from the observation wells or by calculation, but estimates of the leaching performance should only be done using data from the central cell (Fig. 6.9).
FIG. 6.9. Flow net pattern with 6 injection and 3 recovery wells: lmd — length of middle flow line of the central cell. Hydrodynamic limits of the cell are cross hatched.
140
This evaluation method, having been tested on many deposits, seems to be the most reliable, since the central cell, which contains two recovery wells, operates without the loss of any solutions beyond the pattern perimeter and without dilution by external groundwater. After the expected percentage of uranium recovery of 80% for sandstone deposits has been attained, the boundary of the complete leaching zone can be calculated using the data obtained from the central cell. Leaching calculations can then be made for the entire pattern.
Leaching calculations are derived by combining the flow line diagram compiled from the actual well flow rates of the operating wells, together with the area productivity map, the known uranium recovery from each production well, the volume of leaching solution injected underground and the reagent consumption since the beginning of the test.
The average uranium concentration in solution (Cav) is calculated from the total recovered quantity of uranium (A) divided by the total volume of recovered solution V: Cav = A/V.
Value V can be determined directly from the well flowmeter data or calculated using the solutions streamlines: V = qNt,
where: q = elementary streamline flow rate;
N = streamline number in calculated contour;
t = time from the beginning of uranium leaching.
The L:S value for the central cell can also be estimated using the flow diagram.
The specific reagent consumption Cr can be calculated in relation to either the quantity of recovered uranium or the processed ore rock mass T.
In the first case (kg/kg):
C C V C V C Vr in
n n
rec
n
uc� � � �( ) : ,�� � � � �
where: Cin and Crec = reagent content in the injected and recovered solutions, respectively;
Cuc = concentration of uranium in the production solution;
�V = volume of solution containing uranium.
In the second case:
C C V C V Tr in
n n
rec� � ��� � � ): .
Other leaching parameters are determined periodically throughout the duration of the test using the data from central cell, although the calculations should be extended to the whole pattern by utilising all of the data at the end of test. The basis of these calculations, besides the flow line diagram and the productivity chart, is the uranium recovery curve obtained from the central cell (Fig. 6.10). Individual zones of progressive leaching with varying degrees of recovery VB� are found from the uranium recovery curve using the formula VB = lav/t, where
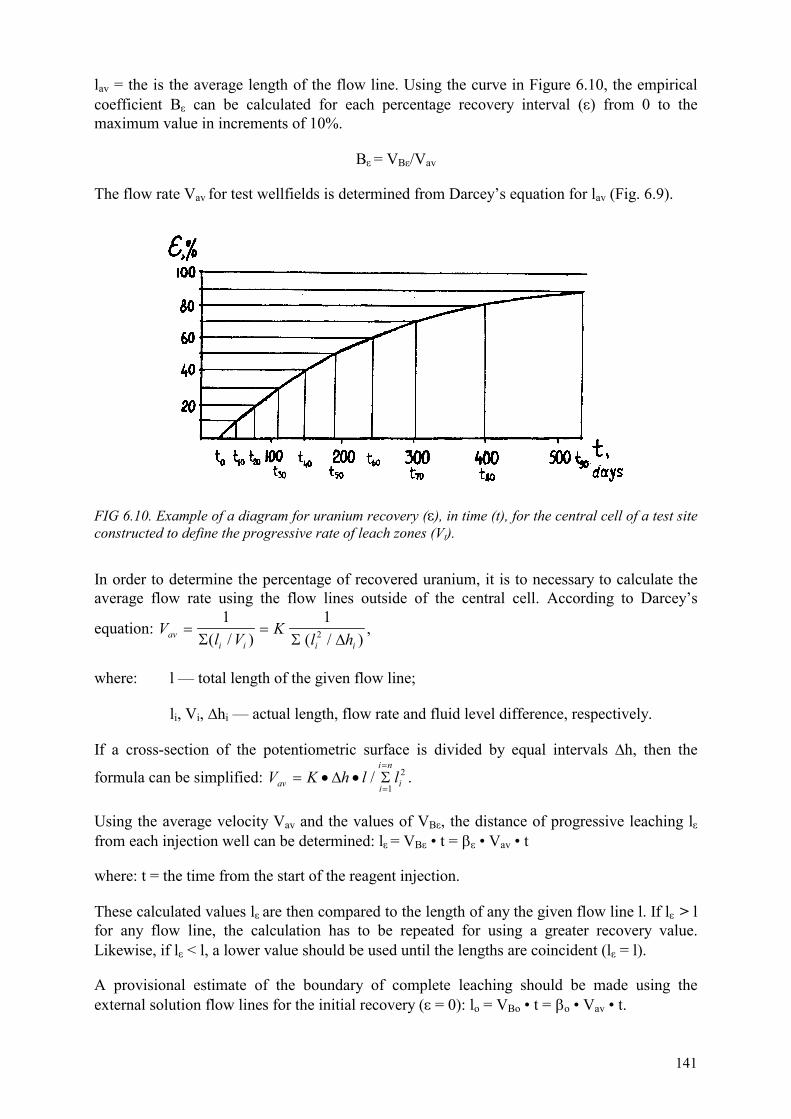
141
lav = the is the average length of the flow line. Using the curve in Figure 6.10, the empirical coefficient B� can be calculated for each percentage recovery interval (�) from 0 to the maximum value in increments of 10%.
B� = VB�/Vav
The flow rate Vav for test wellfields is determined from Darcey’s equation for lav (Fig. 6.9).
FIG 6.10. Example of a diagram for uranium recovery (�), in time (t), for the central cell of a test site constructed to define the progressive rate of leach zones (Vt). In order to determine the percentage of recovered uranium, it is to necessary to calculate the average flow rate using the flow lines outside of the central cell. According to Darcey’s
equation: Vl V
Kl hav
i i i i� �
1 12
� � �( / ) ( / ),
where: l — total length of the given flow line;
li, Vi, �hi — actual length, flow rate and fluid level difference, respectively.
If a cross-section of the potentiometric surface is divided by equal intervals �h, then the
formula can be simplified: V K h l lav i
i n
i� � ��
�
� �/1
2 .
Using the average velocity Vav and the values of VB�, the distance of progressive leaching l� from each injection well can be determined: l� = VB� • t = �� • Vav • t
where: t = the time from the start of the reagent injection.
These calculated values l� are then compared to the length of any the given flow line l. If l� > l for any flow line, the calculation has to be repeated for using a greater recovery value. Likewise, if l� < l, a lower value should be used until the lengths are coincident (l� = l).
A provisional estimate of the boundary of complete leaching should be made using the external solution flow lines for the initial recovery (� = 0): lo = VBo • t = �o • Vav • t.
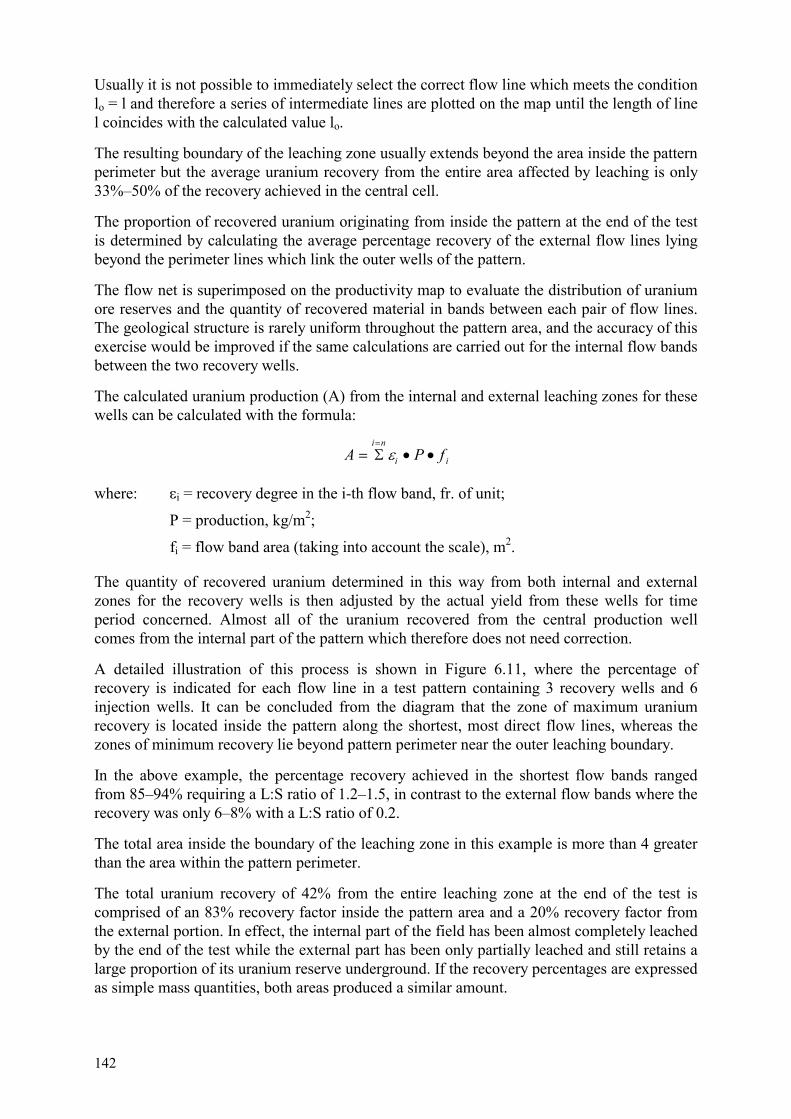
142
Usually it is not possible to immediately select the correct flow line which meets the condition lo = l and therefore a series of intermediate lines are plotted on the map until the length of line l coincides with the calculated value lo.
The resulting boundary of the leaching zone usually extends beyond the area inside the pattern perimeter but the average uranium recovery from the entire area affected by leaching is only 33%–50% of the recovery achieved in the central cell.
The proportion of recovered uranium originating from inside the pattern at the end of the test is determined by calculating the average percentage recovery of the external flow lines lying beyond the perimeter lines which link the outer wells of the pattern.
The flow net is superimposed on the productivity map to evaluate the distribution of uranium ore reserves and the quantity of recovered material in bands between each pair of flow lines. The geological structure is rarely uniform throughout the pattern area, and the accuracy of this exercise would be improved if the same calculations are carried out for the internal flow bands between the two recovery wells.
The calculated uranium production (A) from the internal and external leaching zones for these wells can be calculated with the formula:
A P fi n
i i� � �
�
� �
where: �i = recovery degree in the i-th flow band, fr. of unit;
P = production, kg/m2;
fi = flow band area (taking into account the scale), m2.
The quantity of recovered uranium determined in this way from both internal and external zones for the recovery wells is then adjusted by the actual yield from these wells for time period concerned. Almost all of the uranium recovered from the central production well comes from the internal part of the pattern which therefore does not need correction.
A detailed illustration of this process is shown in Figure 6.11, where the percentage of recovery is indicated for each flow line in a test pattern containing 3 recovery wells and 6 injection wells. It can be concluded from the diagram that the zone of maximum uranium recovery is located inside the pattern along the shortest, most direct flow lines, whereas the zones of minimum recovery lie beyond pattern perimeter near the outer leaching boundary.
In the above example, the percentage recovery achieved in the shortest flow bands ranged from 85–94% requiring a L:S ratio of 1.2–1.5, in contrast to the external flow bands where the recovery was only 6–8% with a L:S ratio of 0.2.
The total area inside the boundary of the leaching zone in this example is more than 4 greater than the area within the pattern perimeter.
The total uranium recovery of 42% from the entire leaching zone at the end of the test is comprised of an 83% recovery factor inside the pattern area and a 20% recovery factor from the external portion. In effect, the internal part of the field has been almost completely leached by the end of the test while the external part has been only partially leached and still retains a large proportion of its uranium reserve underground. If the recovery percentages are expressed as simple mass quantities, both areas produced a similar amount.
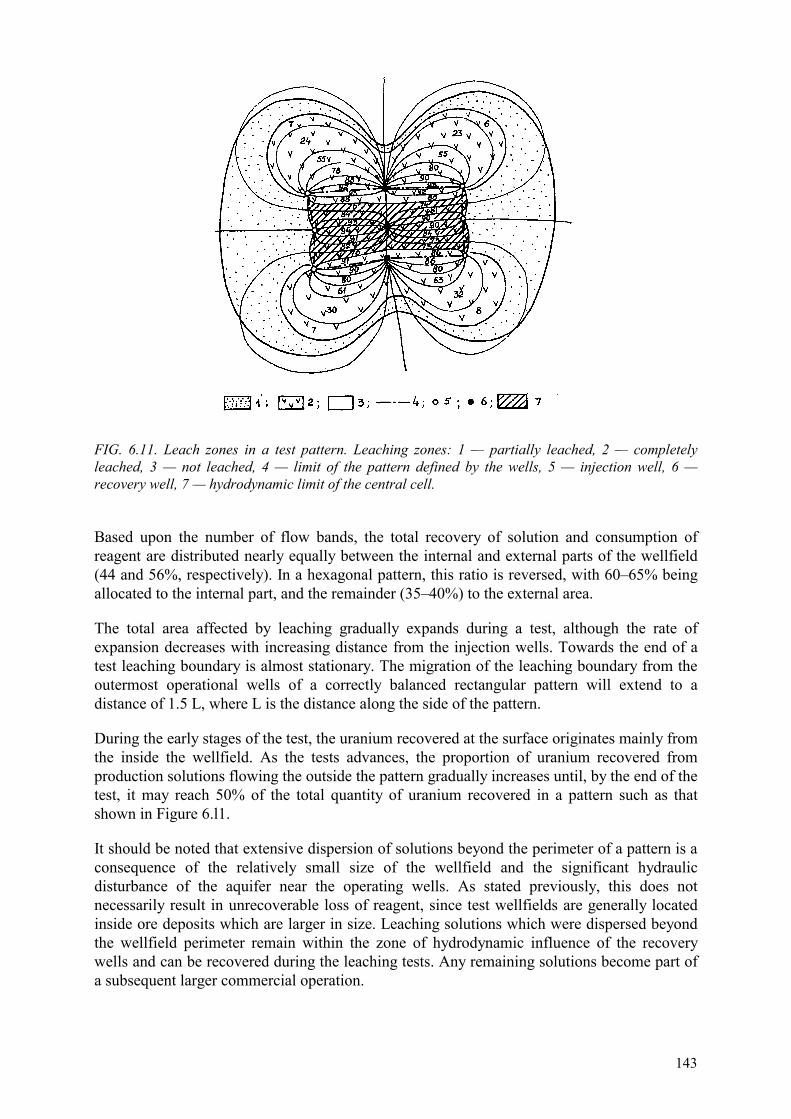
143
FIG. 6.11. Leach zones in a test pattern. Leaching zones: 1 — partially leached, 2 — completely leached, 3 — not leached, 4 — limit of the pattern defined by the wells, 5 — injection well, 6 — recovery well, 7 — hydrodynamic limit of the central cell.
Based upon the number of flow bands, the total recovery of solution and consumption of reagent are distributed nearly equally between the internal and external parts of the wellfield (44 and 56%, respectively). In a hexagonal pattern, this ratio is reversed, with 60–65% being allocated to the internal part, and the remainder (35–40%) to the external area.
The total area affected by leaching gradually expands during a test, although the rate of expansion decreases with increasing distance from the injection wells. Towards the end of a test leaching boundary is almost stationary. The migration of the leaching boundary from the outermost operational wells of a correctly balanced rectangular pattern will extend to a distance of 1.5 L, where L is the distance along the side of the pattern.
During the early stages of the test, the uranium recovered at the surface originates mainly from the inside the wellfield. As the tests advances, the proportion of uranium recovered from production solutions flowing the outside the pattern gradually increases until, by the end of the test, it may reach 50% of the total quantity of uranium recovered in a pattern such as that shown in Figure 6.l1.
It should be noted that extensive dispersion of solutions beyond the perimeter of a pattern is a consequence of the relatively small size of the wellfield and the significant hydraulic disturbance of the aquifer near the operating wells. As stated previously, this does not necessarily result in unrecoverable loss of reagent, since test wellfields are generally located inside ore deposits which are larger in size. Leaching solutions which were dispersed beyond the wellfield perimeter remain within the zone of hydrodynamic influence of the recovery wells and can be recovered during the leaching tests. Any remaining solutions become part of a subsequent larger commercial operation.

144
The leaching performance calculations are tabulated as shown in Table 6.6, with the values for the main parameters from the central cell and the remaining area within the pattern perimeter being reported separately.
The calculated values of these parameters from inside the wellfield can be compared to any subsequent data which may be obtained from additional drilling to improve the confidence of the estimates of remaining ore reserves, or any other direct determination of uranium by geophysical means. These leaching performance from the central cell are the basic values which will be used in all later calculations.
It is not unusual for the selected ISL test wellfield to have slightly different geological or hydrological characteristics when compared to the entire deposit or its individual ore bodies. Therefore, the results of a leach test invariably require some adjustment before being incorporated into the initial design of a full-scale commercial operation for the entire deposit or even a part of it.
TABLE 6.6. REPORTING LEACHING PERFORMANCE PARAMETERS FROM AN UNDERGROUND ISL TEST WELLFIELD
No Leaching parameters Central cell of ISL pattern as defined by its hydrodynamic boundary
Internal part of ISL pattern within the perimeter
Zone of complete leaching
1 Recovery %
2 Value of L:S ratio
3 Specific reagent consumption (kg per kg of U and % of rock mass)
The obtained numeric values
4 Average uranium concentration in solution (mg/dm3)
A forecast of the average uranium concentration in the recovered solutions (mg/dm3) from a commercial operation at the deposit can be determined by the formula:
Cav = � • Or • 103/Vrec
where: � — percentage recovery, by fraction of unit;
Or — uranium reserves in the orebody area or deposit, kg;
Vrec — volume of recovered solutions determined by the L:S ratio found in practice and ore/rock mass to be treated, m3.
145
If there is a significant difference between the permeability of the ore in the test wellfield and the main deposit (C/Cr)d, the L:S value can be corrected using the formula [4]:
L:S = (L:S)ts • (C /Cr)d/(C/Cr)ts,
where : C and Cr = hydraulic conductivity of aquifer and the ore zone;
(L:S)ts = L:S value obtained from the test wellfield.
The specific reagent consumption (kg/kg uranium) is calculated using the formula:
Rc = Vrec • (Cin – Crec)/(� • Or)
Caution should be exercised when evaluating the results of certain preliminary test wellfields where the reliability of the leaching performance parameters may be limited by other factors, such as errors in the uranium ore reserve estimates. Inaccuracies in the calculated parameters in these cases can reach 100% or more.
Even in carefully controlled wellfield leach tests, errors can be introduced into the calculations by variations in the permeability of the ore or the host rock which will distort the boundary of the leaching zone. Estimates of percentage uranium recovery, the value of the L:S ratio and specific reagent consumption can be similarly affected. These factors may require the installation of additional observation wells for the purpose of correcting the leaching zone boundary. Alternatively, useful information could to obtained from wells which are installed to replace solutions with fresh reagent or for subsequent disposal of effluent (see Section 6.2). In the latter case, however, the disposal of the excess solutions by injection can lead to problems with balancing the recovery flows.
Wellfield sites that are known to contain with hydrological barriers are not recommended for leach tests because of the higher cost of the recovered products, difficulties in operating the predetermined ideal flow rates for an extended period of time and the risk of solution excursions [4].
In contrast to the preliminary tests, wellfield leach tests provide results which are reliable enough for the design of a commercial ISL operation. The leaching performance parameters can be considered in two groups [2, 6] according to their level of accuracy. The quantity of recovered uranium, the total reagent consumption and the volume of recovered solutions can be accurately calculated. The accuracy of the derived values of average uranium concentration in solution and the specific reagent consumption per unit of recovered product are also acceptable, although they may contain minor errors arising from sources such as flow meters and chemical analyses.
The second group of leaching performance parameters is represented by percentage of uranium recovery, the L:S ratio and the specific reagent consumption for ore-rock mass. Their accuracy depends upon factors which cannot be directly measured, but only estimated. These include the volume of leached rock and the uranium reserves contained within this zone prior to leaching.
An ore reserve estimate or average grade × thickness value derived from 14 intercepts in a 15x30 meter grid within the wellfield boundary is likely to contain a 10% error at the 90% probability level [4]. If the inaccuracy associated with the estimation of the volume of leached
146
rock, as revealed by later control drilling, is also taken into account, the combined error in the second group of leaching parameters will increase and, in non-uniform orebodies, may range from l5% to 30% throughout the wellfield. For the most stratiform sedimentary uranium deposits, however, especially those hosted by marine sediments, this value is probably an overestimate.
REFERENCES TO CHAPTER 6
[1] GAVICH, I.K., Theory and Practice of Modelling in Hydrogeology, M. Nedra, 1980. [2] GRABOVNIKOV, V.A., Geotechnical Investigation in Metal Exploration. M. Nedra,
1985. [3] LUKNER, I., SHESTAKOV, B.M., Modelling of Geofiltration. M. Nedra, 1976. [4] LUTSENKO, I.K., BELETSKY, V.I., DAVYDOVA, L.G., No-Mine Working of Ore
Deposits. M.Nedra, 1986. [5] BELETSKY, V.I., DAVYDOVA, L.G., DOLGIKH, P.F., et al., Research Methods in
ISL of Ores. Textbook. M. publ. MGRI, 1981. [6] SHUMILIN, M.V., MUROMTSEV, N.N., BROVIN, K.G. et al., Exploration of
Uranium Deposits to be Worked by ISL, M. Nedra, 1985. [7] Hydrogeologist's Manual. Under editorship of V.M. Maksimov, L. Nedra l&2, 1979.
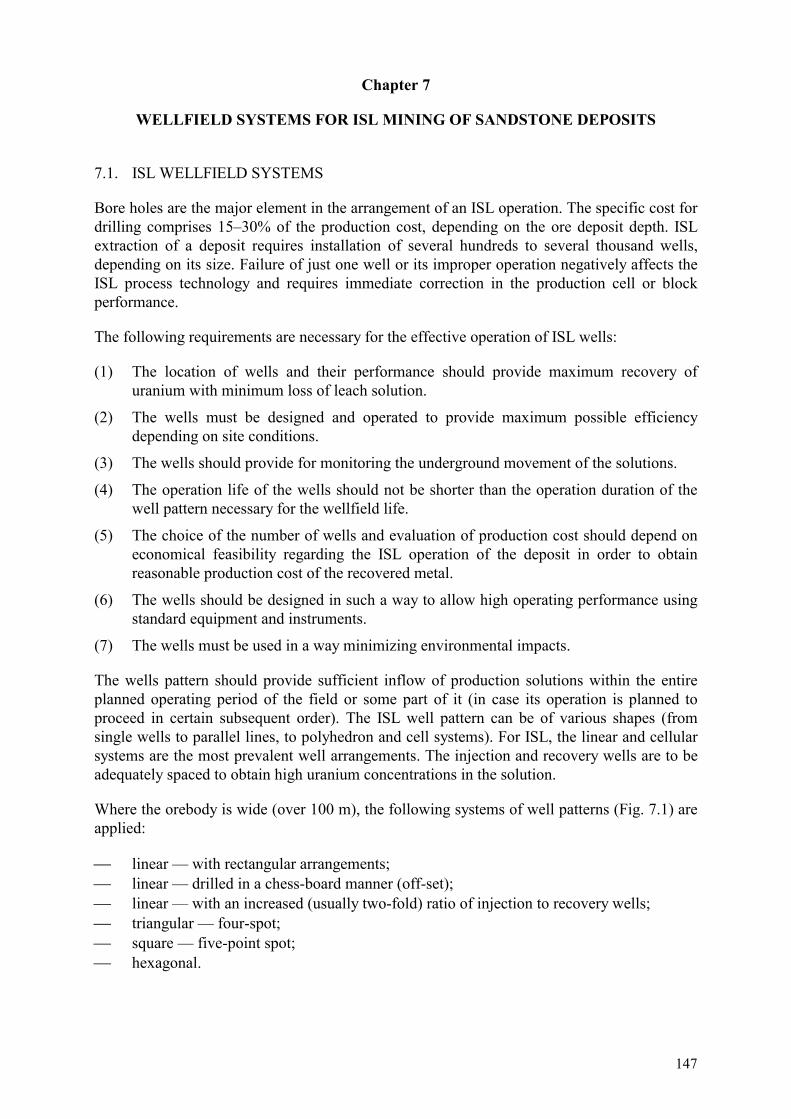
147
Chapter 7
WELLFIELD SYSTEMS FOR ISL MINING OF SANDSTONE DEPOSITS
7.1. ISL WELLFIELD SYSTEMS
Bore holes are the major element in the arrangement of an ISL operation. The specific cost for drilling comprises 15–30% of the production cost, depending on the ore deposit depth. ISL extraction of a deposit requires installation of several hundreds to several thousand wells, depending on its size. Failure of just one well or its improper operation negatively affects the ISL process technology and requires immediate correction in the production cell or block performance.
The following requirements are necessary for the effective operation of ISL wells:
(1) The location of wells and their performance should provide maximum recovery of uranium with minimum loss of leach solution.
(2) The wells must be designed and operated to provide maximum possible efficiency depending on site conditions.
(3) The wells should provide for monitoring the underground movement of the solutions.
(4) The operation life of the wells should not be shorter than the operation duration of the well pattern necessary for the wellfield life.
(5) The choice of the number of wells and evaluation of production cost should depend on economical feasibility regarding the ISL operation of the deposit in order to obtain reasonable production cost of the recovered metal.
(6) The wells should be designed in such a way to allow high operating performance using standard equipment and instruments.
(7) The wells must be used in a way minimizing environmental impacts.
The wells pattern should provide sufficient inflow of production solutions within the entire planned operating period of the field or some part of it (in case its operation is planned to proceed in certain subsequent order). The ISL well pattern can be of various shapes (from single wells to parallel lines, to polyhedron and cell systems). For ISL, the linear and cellular systems are the most prevalent well arrangements. The injection and recovery wells are to be adequately spaced to obtain high uranium concentrations in the solution.
Where the orebody is wide (over 100 m), the following systems of well patterns (Fig. 7.1) are applied:
�� linear — with rectangular arrangements; �� linear — drilled in a chess-board manner (off-set); �� linear — with an increased (usually two-fold) ratio of injection to recovery wells; �� triangular — four-spot; �� square — five-point spot; �� hexagonal.
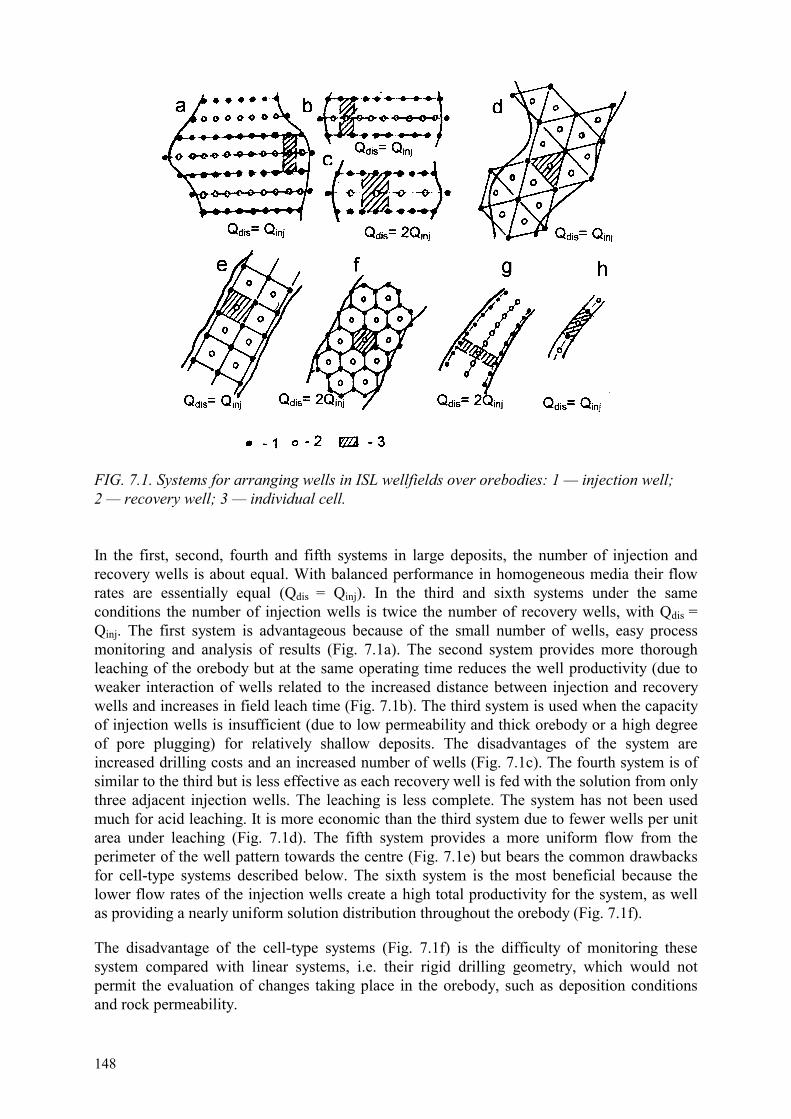
148
FIG. 7.1. Systems for arranging wells in ISL wellfields over orebodies: 1 — injection well; 2 — recovery well; 3 — individual cell. In the first, second, fourth and fifth systems in large deposits, the number of injection and recovery wells is about equal. With balanced performance in homogeneous media their flow rates are essentially equal (Qdis = Qinj). In the third and sixth systems under the same conditions the number of injection wells is twice the number of recovery wells, with Qdis = Qinj. The first system is advantageous because of the small number of wells, easy process monitoring and analysis of results (Fig. 7.1a). The second system provides more thorough leaching of the orebody but at the same operating time reduces the well productivity (due to weaker interaction of wells related to the increased distance between injection and recovery wells and increases in field leach time (Fig. 7.1b). The third system is used when the capacity of injection wells is insufficient (due to low permeability and thick orebody or a high degree of pore plugging) for relatively shallow deposits. The disadvantages of the system are increased drilling costs and an increased number of wells (Fig. 7.1c). The fourth system is of similar to the third but is less effective as each recovery well is fed with the solution from only three adjacent injection wells. The leaching is less complete. The system has not been used much for acid leaching. It is more economic than the third system due to fewer wells per unit area under leaching (Fig. 7.1d). The fifth system provides a more uniform flow from the perimeter of the well pattern towards the centre (Fig. 7.1e) but bears the common drawbacks for cell-type systems described below. The sixth system is the most beneficial because the lower flow rates of the injection wells create a high total productivity for the system, as well as providing a nearly uniform solution distribution throughout the orebody (Fig. 7.1f).
The disadvantage of the cell-type systems (Fig. 7.1f) is the difficulty of monitoring these system compared with linear systems, i.e. their rigid drilling geometry, which would not permit the evaluation of changes taking place in the orebody, such as deposition conditions and rock permeability.
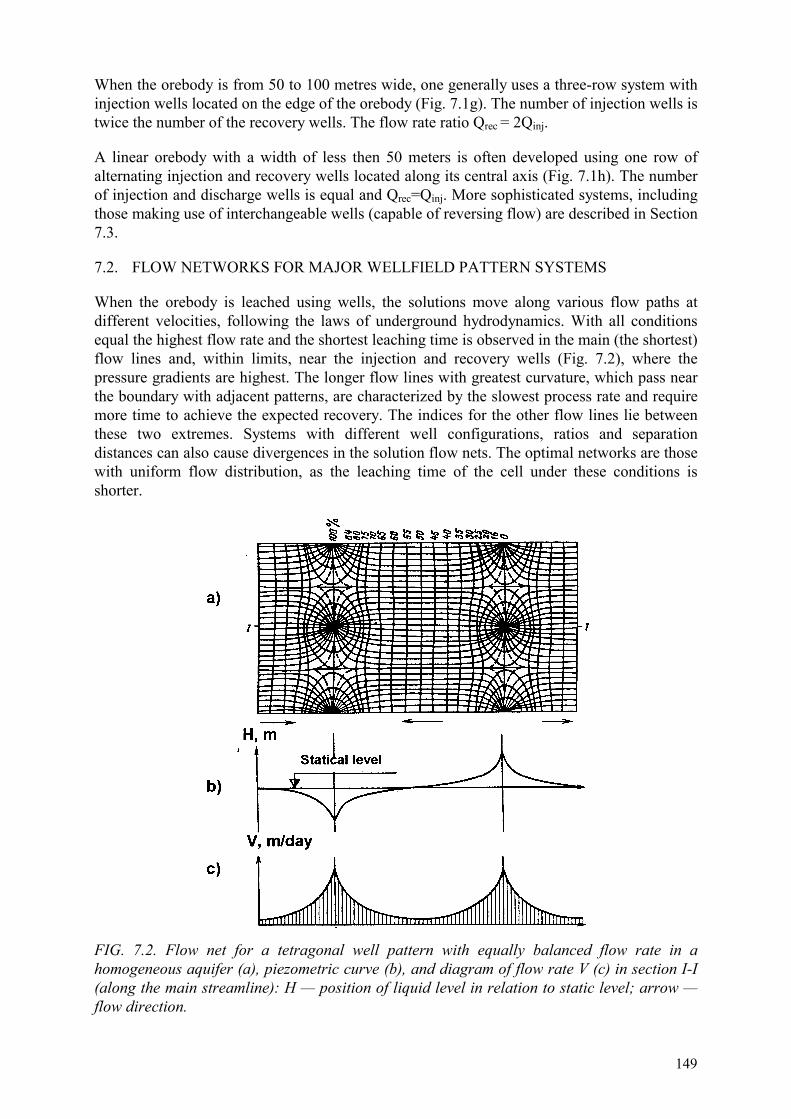
149
When the orebody is from 50 to 100 metres wide, one generally uses a three-row system with injection wells located on the edge of the orebody (Fig. 7.1g). The number of injection wells is twice the number of the recovery wells. The flow rate ratio Qrec = 2Qinj.
A linear orebody with a width of less then 50 meters is often developed using one row of alternating injection and recovery wells located along its central axis (Fig. 7.1h). The number of injection and discharge wells is equal and Qrec=Qinj. More sophisticated systems, including those making use of interchangeable wells (capable of reversing flow) are described in Section 7.3.
7.2. FLOW NETWORKS FOR MAJOR WELLFIELD PATTERN SYSTEMS
When the orebody is leached using wells, the solutions move along various flow paths at different velocities, following the laws of underground hydrodynamics. With all conditions equal the highest flow rate and the shortest leaching time is observed in the main (the shortest) flow lines and, within limits, near the injection and recovery wells (Fig. 7.2), where the pressure gradients are highest. The longer flow lines with greatest curvature, which pass near the boundary with adjacent patterns, are characterized by the slowest process rate and require more time to achieve the expected recovery. The indices for the other flow lines lie between these two extremes. Systems with different well configurations, ratios and separation distances can also cause divergences in the solution flow nets. The optimal networks are those with uniform flow distribution, as the leaching time of the cell under these conditions is shorter.
FIG. 7.2. Flow net for a tetragonal well pattern with equally balanced flow rate in a homogeneous aquifer (a), piezometric curve (b), and diagram of flow rate V (c) in section I-I (along the main streamline): H — position of liquid level in relation to static level; arrow — flow direction.
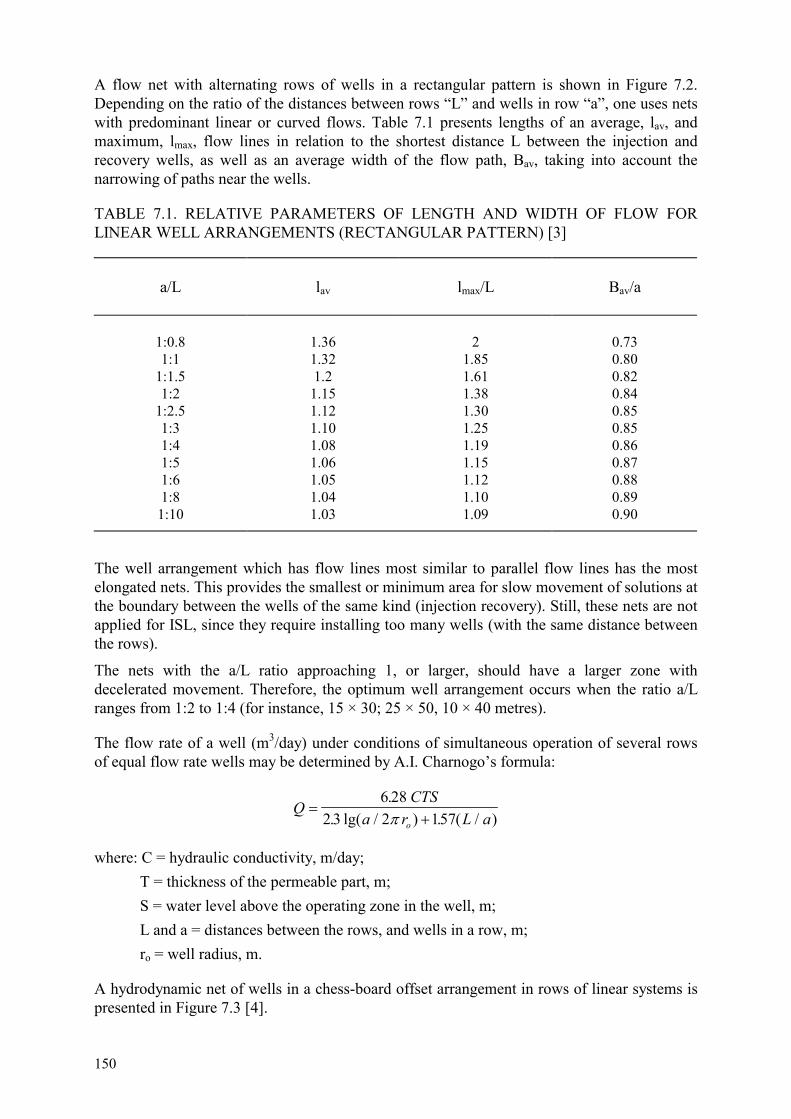
150
A flow net with alternating rows of wells in a rectangular pattern is shown in Figure 7.2. Depending on the ratio of the distances between rows “L” and wells in row “a”, one uses nets with predominant linear or curved flows. Table 7.1 presents lengths of an average, lav, and maximum, lmax, flow lines in relation to the shortest distance L between the injection and recovery wells, as well as an average width of the flow path, Bav, taking into account the narrowing of paths near the wells.
TABLE 7.1. RELATIVE PARAMETERS OF LENGTH AND WIDTH OF FLOW FOR LINEAR WELL ARRANGEMENTS (RECTANGULAR PATTERN) [3]
a/L
lav
lmax/L
Bav/a
1:0.8 1:1
1:1.5 1:2
1:2.5 1:3 1:4 1:5 1:6 1:8
1:10
1.36 1.32 1.2 1.15 1.12 1.10 1.08 1.06 1.05 1.04 1.03
2
1.85 1.61 1.38 1.30 1.25 1.19 1.15 1.12 1.10 1.09
0.73 0.80 0.82 0.84 0.85 0.85 0.86 0.87 0.88 0.89 0.90
The well arrangement which has flow lines most similar to parallel flow lines has the most elongated nets. This provides the smallest or minimum area for slow movement of solutions at the boundary between the wells of the same kind (injection recovery). Still, these nets are not applied for ISL, since they require installing too many wells (with the same distance between the rows).
The nets with the a/L ratio approaching 1, or larger, should have a larger zone with decelerated movement. Therefore, the optimum well arrangement occurs when the ratio a/L ranges from 1:2 to 1:4 (for instance, 15 × 30; 25 × 50, 10 × 40 metres).
The flow rate of a well (m3/day) under conditions of simultaneous operation of several rows of equal flow rate wells may be determined by A.I. Charnogo’s formula:
QCTS
a r L ao�
�
6 282 3 2 157
.. lg( / ) . ( / )�
where: C = hydraulic conductivity, m/day; T = thickness of the permeable part, m; S = water level above the operating zone in the well, m; L and a = distances between the rows, and wells in a row, m; ro = well radius, m.
A hydrodynamic net of wells in a chess-board offset arrangement in rows of linear systems is presented in Figure 7.3 [4].

151
The flow nets for single elements of rectangular and hexagonal operational cells with a central recovery well are given in Figures 7.4 and 7.5 [4]. The nets are constructed assuming a condition of uniform formation properties, recovery wells flow within the stratum in horizontal direction, strict symmetry in arrangement, and equal flow rates of wells of the same kind, as well as a total balance of injection and recovery.
FIG. 7.3. Flow net in a chess-board arrangement.
FIG. 7.4. Flow net for 1 cell of a tetragonal pattern with a centrally located recovery well.
FIG. 7.5. Flow net for 1 cell of hexagonal pattern with a central recovery well.
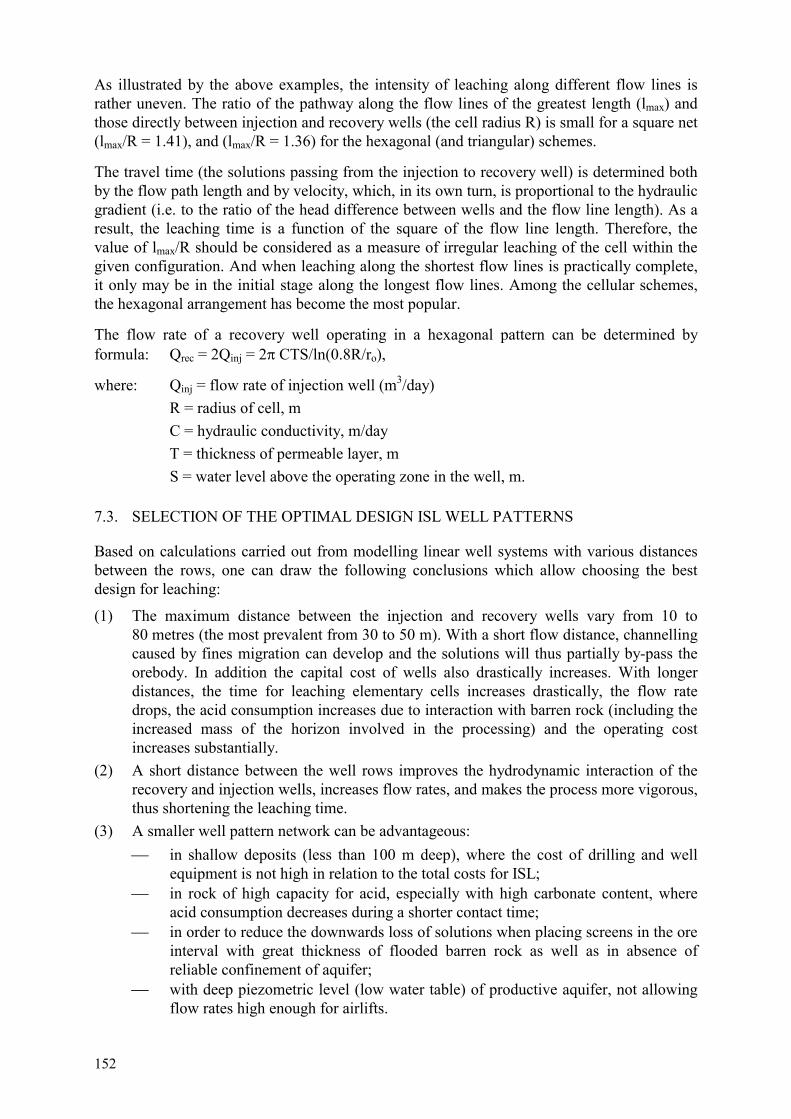
152
As illustrated by the above examples, the intensity of leaching along different flow lines is rather uneven. The ratio of the pathway along the flow lines of the greatest length (lmax) and those directly between injection and recovery wells (the cell radius R) is small for a square net (lmax/R = 1.41), and (lmax/R = 1.36) for the hexagonal (and triangular) schemes.
The travel time (the solutions passing from the injection to recovery well) is determined both by the flow path length and by velocity, which, in its own turn, is proportional to the hydraulic gradient (i.e. to the ratio of the head difference between wells and the flow line length). As a result, the leaching time is a function of the square of the flow line length. Therefore, the value of lmax/R should be considered as a measure of irregular leaching of the cell within the given configuration. And when leaching along the shortest flow lines is practically complete, it only may be in the initial stage along the longest flow lines. Among the cellular schemes, the hexagonal arrangement has become the most popular.
The flow rate of a recovery well operating in a hexagonal pattern can be determined by formula: Qrec = 2Qinj = 2� CTS/ln(0.8R/ro),
where: Qinj = flow rate of injection well (m3/day) R = radius of cell, m C = hydraulic conductivity, m/day T = thickness of permeable layer, m
S = water level above the operating zone in the well, m.
7.3. SELECTION OF THE OPTIMAL DESIGN ISL WELL PATTERNS
Based on calculations carried out from modelling linear well systems with various distances between the rows, one can draw the following conclusions which allow choosing the best design for leaching:
(1) The maximum distance between the injection and recovery wells vary from 10 to 80 metres (the most prevalent from 30 to 50 m). With a short flow distance, channelling caused by fines migration can develop and the solutions will thus partially by-pass the orebody. In addition the capital cost of wells also drastically increases. With longer distances, the time for leaching elementary cells increases drastically, the flow rate drops, the acid consumption increases due to interaction with barren rock (including the increased mass of the horizon involved in the processing) and the operating cost increases substantially.
(2) A short distance between the well rows improves the hydrodynamic interaction of the recovery and injection wells, increases flow rates, and makes the process more vigorous, thus shortening the leaching time.
(3) A smaller well pattern network can be advantageous: �� in shallow deposits (less than 100 m deep), where the cost of drilling and well
equipment is not high in relation to the total costs for ISL; �� in rock of high capacity for acid, especially with high carbonate content, where
acid consumption decreases during a shorter contact time; �� in order to reduce the downwards loss of solutions when placing screens in the ore
interval with great thickness of flooded barren rock as well as in absence of reliable confinement of aquifer;
�� with deep piezometric level (low water table) of productive aquifer, not allowing flow rates high enough for airlifts.

153
(4) Long distances between the well lines (50 m and longer) are best used in deep deposits (over 200 m), especially when small amounts of acid are consumed by the rock (up to 1% carbonate), and where the cost of drilling and equipment is a substantial part of the production cost of the recovered metal.
(5) The best well pattern design can be obtained by comparing several possibilities calculated using the results of laboratory and field investigations.
Figure 7.6 [3] shows curves plotted by using calculated data on a certain deposit leached through wells arranged in lines over the entire deposit. In all cases the wells have equal flow rates, so the quantity of recovered solution is in direct proportion to the number of wells used.
FIG. 7.6. Diagram of variation in ISL parameters: number of wells N (1), total flow rate of recovered solution Q (2), average uranium concentration C, in recovered solutions (3), time period of leaching T (4); specific reagent consumption R, per unit of rock mass (5) and field productivity F (6) at various distances between the well rows and equal working area.
The diagram shows that, under the given conditions, increasing the distance between the lines (the spacing between the holes in the lines remains unchanged) sharply increases the leaching time, but decreases the number of wells, the total solution flow rate and the degree of recovery from the field. With the distance between the lines increased 10-fold, the specific reagent consumption increases only by 10–20% due to the extended contact time. The average concentration of uranium in the solution changes very little (generally increases within 10%) due to added recovery from the ores not included in the reserve calculation.
Feasibility analysis of the ISL field operations indicates that the production cost varies over a wide range. With the increasing productivity in the fields using a close spaced network, the leaching time for an orebody decreases, as well as the expenditures for wages, shops and other operational costs (for instance, the cost of reagent).
From the point of view of capital cost (drilling of wells, construction of a surface processing facility) a well pattern with extended distance between the rows seems preferable. The productivity of the field would decrease drastically. The deep deposits, where the drilling

154
expenditures for each well are high, will benefit from using a wider spaced pattern, the shallow deposits — from a closely spaced one.
Still, maximum productivity is not the decisive factor for choosing a closely space well network. An excessive productivity of a field may result in higher costs for the processing facility, drilling and well equipment, thus affecting the recovered metal production cost. So to make a final decision on the optimum well pattern and the sequence for leaching the orebody, one should compare feasibility studies of several alternatives.
The evaluation results are compiled in a combined table used for a large-scale economic evaluation of the alternatives (Table 7.2.). Then the most profitable design is chosen.
TABLE 7.2. MAIN PARAMETERS OF DIFFERENT WORKING SYSTEMS
Well network Number of wells
Flow rate of recovery well
Total flow rate of wells
Quantity of recovery wells
1 2 3 4 5
Metal content in solutions
Time of the orebody working
Reagent consumption
Annual productivity of
the facility
Production cost of recovered metal
6 7 8 9 10
7.4. CLASSIFICATION AND DESCRIPTION OF ISL OPERATING SYSTEMS IN
SANDSTONE DEPOSITS
The most complete classification of well systems for ISL (taking into account the interchange of wells and leaching sequences) was proposed by V.V. Novoseltsev. It however has certain drawbacks that can be corrected and completed in the future (Table 7.3).
The following major classifications are used:
(1) The number of injection-production well pairs in one cell and the relative position of the cells (by row for one-well arrangement, staggered for two-wells, three-wells — rectangular, multi-well — cellular);
(2) The vertical position of the screened zone in relation to the ore-bearing horizon (in the ore, staggered, etc.);
(3) Arrangement of well lines in relation to the length of the orebody (along/across the length);
(4) Development in leaching a wide orebody (starting from the border or from the middle).
The most important factors, determining the conditions for using the above systems, are the following:
�� width of the orebody; �� thickness of the ore-bearing horizon;
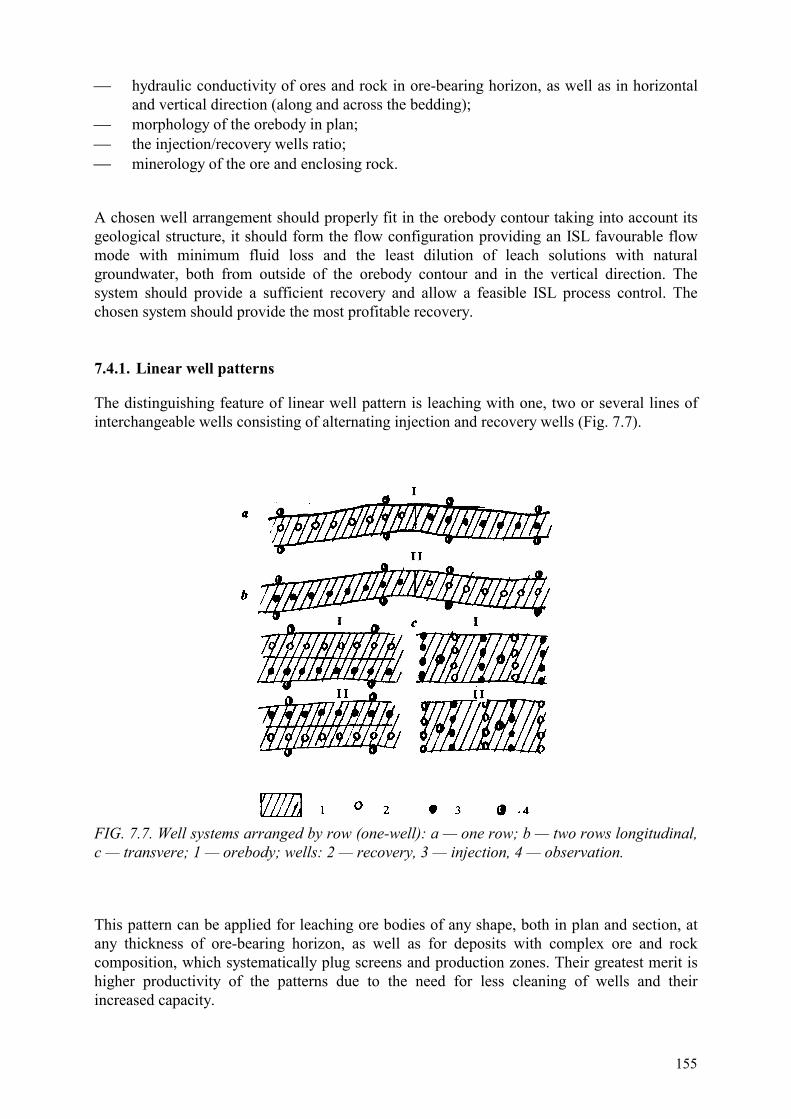
155
�� hydraulic conductivity of ores and rock in ore-bearing horizon, as well as in horizontal and vertical direction (along and across the bedding);
�� morphology of the orebody in plan; �� the injection/recovery wells ratio; �� minerology of the ore and enclosing rock.
A chosen well arrangement should properly fit in the orebody contour taking into account its geological structure, it should form the flow configuration providing an ISL favourable flow mode with minimum fluid loss and the least dilution of leach solutions with natural groundwater, both from outside of the orebody contour and in the vertical direction. The system should provide a sufficient recovery and allow a feasible ISL process control. The chosen system should provide the most profitable recovery. 7.4.1. Linear well patterns
The distinguishing feature of linear well pattern is leaching with one, two or several lines of interchangeable wells consisting of alternating injection and recovery wells (Fig. 7.7).
FIG. 7.7. Well systems arranged by row (one-well): a — one row; b — two rows longitudinal, c — transvere; 1 — orebody; wells: 2 — recovery, 3 — injection, 4 — observation.
This pattern can be applied for leaching ore bodies of any shape, both in plan and section, at any thickness of ore-bearing horizon, as well as for deposits with complex ore and rock composition, which systematically plug screens and production zones. Their greatest merit is higher productivity of the patterns due to the need for less cleaning of wells and their increased capacity.

TAB
LE 7
.3. O
REB
OD
Y C
HA
RA
CTE
RIS
TIC
S FO
R S
ELEC
TIO
N O
F IS
L W
ELL
PATT
ERN
DES
IGN
Wel
l Pa
ttern
Sy
stem
O
rebo
dy
wid
th, m
Th
ickn
ess o
f ore
-be
arin
g ho
rizon
, m
Thic
knes
s rat
io o
f or
e an
d en
clos
ing
rock
Mor
phol
ogy
of o
rebo
dy
Rat
io o
f rec
over
y an
d in
ject
ion
wel
ls
1 2
3 4
5 6
7
Row
s (o
ne-w
ell)
1 —
one
-row
2
— m
ultip
le ro
w
3 —
mul
tiple
cro
ss-w
ise
4 —
mul
tiple
blo
ck-w
ise
to 5
0 >5
0 >1
50
shar
ply
chan
geab
le
any
any
any
any
>1:5
th
e sa
me
the
sam
e th
e sa
me
sim
ple
sim
ple
any
com
plex
- - - -
Stag
es
(two-
wel
l)
1 —
one
-row
com
bine
d w
ith
stag
ed w
ells
arr
ange
men
t 2
— sq
uare
com
bine
d w
ith
stag
ed w
ell a
rran
gem
ent
3 —
rect
angu
lar s
epar
ated
st
aged
wel
l arr
ange
men
t
up to
50
>50
>50
>15
>15
>10
<1:5
<1
:5
from
1:2
to 1
:5
sim
ple
any
any
≤ 1:1
≤ 1
:1
≤ 1:1
Tetra
gona
l (th
ree-
stag
e)
1 —
long
itudi
nal
2 —
tran
sver
sal
3 —
initi
ally
wor
king
mar
gins
of
ore
body
site
s 4
— in
itial
ly w
orki
ng c
entre
of
oreb
ody
site
s
50–1
00
150–
300
>300
>3
00
mos
tly u
p to
30
the
sam
e th
e sa
me
the
sam
e
>1:5
>1
:5
>1:5
>1
:5
sim
ple
any
sim
ple
sim
ple
to 1
:3 <
1:2
th
e sa
me
the
sam
e th
e sa
me
156

TAB
LE 7
.3. (
cont
.)
1 2
3 4
5 6
7
Cel
lula
r (m
ultip
le
wel
ls)
1 —
tria
ngul
ar c
ell (
four
-wel
l) 2
— re
ctan
gula
r cel
l (fiv
e-w
ell)
3 —
hex
agon
al c
ell (
seve
n-w
ell)
4 —
hex
agon
al c
ell (
13-w
ell
with
one
ext
ra in
ject
ion
wel
l at
each
face
>150
>1
50
>150
>1
50
any
any
any
any
>1:5
>1
:5
>1:5
>1
:5
any
any
any
any
≤ 1:1
≤ 1
:1
≤ 1:1
≤ 1
:1
Bar
rage
1
— w
ith v
ertic
al
hydr
oiso
latio
n 2
— h
oriz
onta
l hyd
rois
olat
ion
3 —
with
arti
ficia
l ver
tical
or
horiz
onta
l wat
er c
onfin
emen
t
>300
>1
00
any
num
ber
- ”-
>20
>10
- ”-
- ”-
- ”-
sim
ple
- ”-
- ”-
vario
us fo
r diff
eren
t sy
stem
s th
e sa
me
the
sam
e
Com
bine
d
co
mpl
ex
157
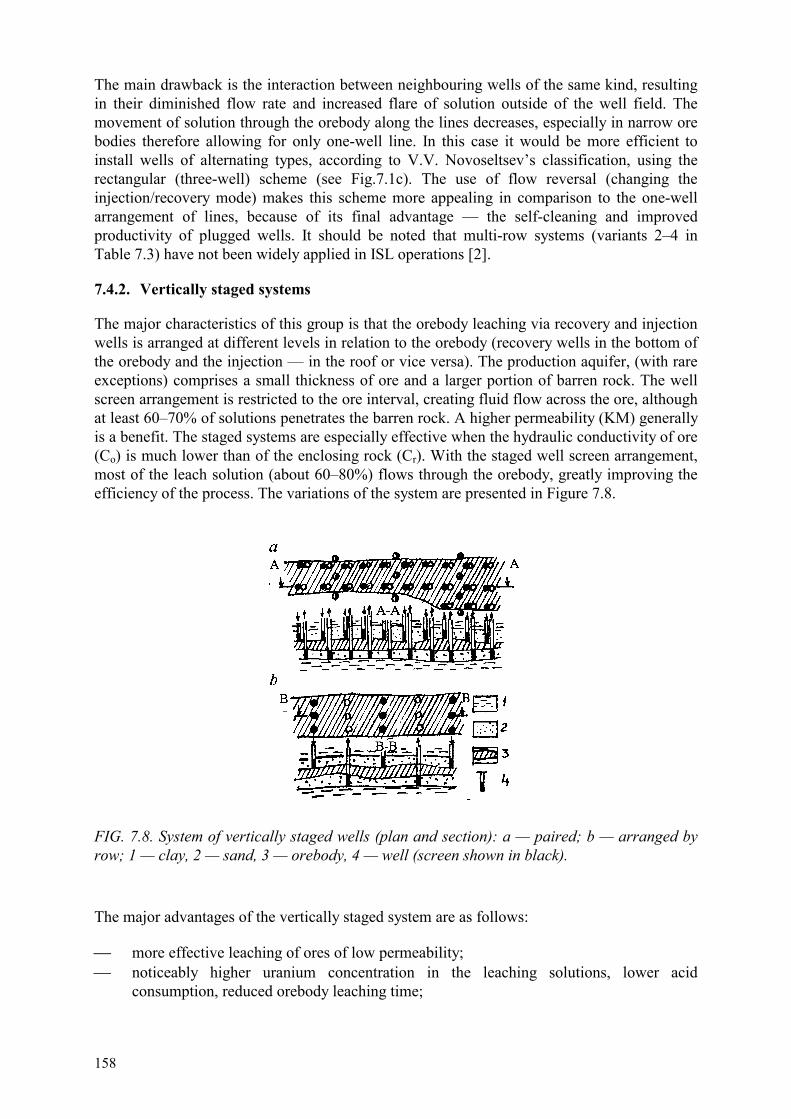
158
The main drawback is the interaction between neighbouring wells of the same kind, resulting in their diminished flow rate and increased flare of solution outside of the well field. The movement of solution through the orebody along the lines decreases, especially in narrow ore bodies therefore allowing for only one-well line. In this case it would be more efficient to install wells of alternating types, according to V.V. Novoseltsev’s classification, using the rectangular (three-well) scheme (see Fig.7.1c). The use of flow reversal (changing the injection/recovery mode) makes this scheme more appealing in comparison to the one-well arrangement of lines, because of its final advantage — the self-cleaning and improved productivity of plugged wells. It should be noted that multi-row systems (variants 2–4 in Table 7.3) have not been widely applied in ISL operations [2].
7.4.2. Vertically staged systems
The major characteristics of this group is that the orebody leaching via recovery and injection wells is arranged at different levels in relation to the orebody (recovery wells in the bottom of the orebody and the injection — in the roof or vice versa). The production aquifer, (with rare exceptions) comprises a small thickness of ore and a larger portion of barren rock. The well screen arrangement is restricted to the ore interval, creating fluid flow across the ore, although at least 60–70% of solutions penetrates the barren rock. A higher permeability (KM) generally is a benefit. The staged systems are especially effective when the hydraulic conductivity of ore (Co) is much lower than of the enclosing rock (Cr). With the staged well screen arrangement, most of the leach solution (about 60–80%) flows through the orebody, greatly improving the efficiency of the process. The variations of the system are presented in Figure 7.8.
FIG. 7.8. System of vertically staged wells (plan and section): a — paired; b — arranged by row; 1 — clay, 2 — sand, 3 — orebody, 4 — well (screen shown in black).
The major advantages of the vertically staged system are as follows:
�� more effective leaching of ores of low permeability; �� noticeably higher uranium concentration in the leaching solutions, lower acid
consumption, reduced orebody leaching time;

159
�� higher productivity of recovery and injection wells due to improved hydrodynamic interaction of neighboring wells of different kind.
Nevertheless, the group is limited in application due to natural factors which are specific to sandstone deposits. The most important of these is the presence of uniformly impermeable layers in the ore-bearing zone which restrict the vertical flow of solutions. A narrow ore-bearing horizon and ore located at the boundaries of the aquifer with the water confining layers can also make the operation unprofitable.
7.4.3. Rectangular systems
The major element of the group is a simple cell consisting of one recovery and two injection wells. This system has found the broadest application in practically all ISL facilities due to its simple design, the ease of arranging the surface equipment, drilling and well construction, as well as the ease of controlling the uranium recovery process.
One limitation of this system is that the ratio of injection and recovery wells is about 1:1 (especially in large ore bodies). Since the flow rate of injection wells relative to the recovery wells generally becomes reduced during operation due to plugging, the uranium production from the system decreases with time. The injection wells require periodic shut-down for cleaning particulate matter and chemical residue from the screens. Other disadvantages of this system are related to higher dilution at the marginal parts of ore bodies with groundwater entering from the perimeter of the production well lines.
To overcome the above disadvantages the following remedies are recommended:
�� comparatively narrow deposits, 50–100 metres wide, should be leached using rectangular systems with the well rows located inside the orebody at distance 10–20 metres from the boundary;
�� deposits wider than 150 m are exploited with both longitudinal and transverse rectangular systems; 2–3 injection wells should be drilled at the edges rather than a single one. This will result in more solution escaping beyond the ore limit and will increase reagent losses;
�� use systems with a transverse rectangular arrangement with few (1.5–2 times) recovery wells in relation to the injection wells;
�� when leaching wide deposits, account should be taken of the inclusion of new leach blocks in the direction from the margins to the center, or vice versa.
The alternative designs are shown in Table 7.3 and Figure 7.9.
FIG. 7.9. Tetragonal well systems: a — trigonal; b — multi-row, longitudinal and transverse.

160
The main characteristic of the third alternative regarding the rectangular system is completing a preliminary leaching (recovering up to 40–50% of the uranium) at the orebody margins using longitudinal blocks, followed by leaching of the central blocks. This would allow:
�� avoiding the need to drill extra holes in the injection rows (the ratio of recovery and injection wells remains 1:2 until 40–50% of the uranium is recovered from the leach block);
�� completing the leaching of the marginal blocks using the recovery line of the central block using underbalanced flow. This accelerates the leaching and permits the displacement the leaching solutions from the block margin by native groundwater from the outside;
�� leaching the central blocks under the most suitable conditions without loss or dilution of the leaching solution.
The major feature of the fourth alternative in rectangular system is preliminary leaching of the central part of the orebody by longitudinal blocks with the maximum possible distance between the rows. When 40–50% of the reserves have been recovered from the central blocks (at a recovery to injection well ratio 1:2), the marginal blocks become involved in the leaching process. The acidification of the latter by leaching solutions flowing beyond the limits of the central blocks has already been completed by this time. The space between the rows in the marginal blocks should be large enough to allow for their leaching together with the central blocks. In this case, the escape of solutions beyond the limits of the marginal block will be minimal and complete leaching will be done via the recovery line of the central block followed by compulsory (from the environmental point of view) displacement of the leaching solution with native groundwater from outside the wellfield.
The chief drawback of the third and fourth alternatives is the necessity to strictly observe the sequence of operating the central and marginal blocks.
7.4.4. Cell pattern systems
These groups are used in wider deposits (over 150 m). Unlike the linear systems, they are characterised by a converging solution flow to the cell centre from all sides. This is especially important in the case of a non-uniform productive horizon throughout the deposit area (considering both ore grade and rock composition). There are known variations with triangular, rectangular and hexagonal cells (Table 7.3, Fig. 7.1f). The most widely used is the hexagonal system which facilitates a more homogeneous leaching of ore and raises the total productivity of the system due to the high density of injection and recovery wells. Cellular systems allow the operator to individually treat single sites of a deposit which has complex orebody morphology and rock composition by injecting the cells with solutions of a specific reagent concentration.
7.4.5. Barrier systems
When exploiting ore deposits, it is important to limit the flare of leaching solutions both laterally and vertically in the ore-bearing aquifers. This is necessary because of the high cost of leaching reagent for treating the barren rock as well as the regulations protecting the environment.
161
The highest reagent loss and the greatest dilution of leaching solution with groundwater generally takes place in the vertical direction, because the ore usually constitutes only a small portion of the aquifer. These harmful effects can be partially limited well screens placed in the ore interval and by arranging a denser net of operating wells. The relative loss of leaching solutions in the horizontal direction is less important, especially in wide ore deposits, where the proportion of perimeter wells is not great when compared with the number in the wellfield. If the losses are substantial, various isolation devices (mechanical and hydraulic) can be used to limit solution flow in the vertical or horizontal direction.
The set-up for a mechanical isolation barrier is to inject some gradually grouting material (cement, liquid glass, bitumen, etc.) into barren permeable rocks through specially drilled holes. This forms a permanent artificial barrier of impermeable (or weakly permeable) rock. The application of mechanical vertical isolation in sandstone deposits is limited due to difficulties in their installation in a given rock interval and their possible damage to an ore zone. The horizontal mechanical isolation devices do not find much use either, since the result does not justify the expenditures.
Therefore, hydraulic isolation (water barrier) is chiefly employed in the ISL industry. Its principal feature lies in its temporary nature. If the water barrier is stopped or fails, the isolation effect is quickly dissipated.
There also must be strict control on the hydraulic balance of the barrier system. This is its main drawback (beside the power spent on drilling and operation of the wells) and is the reason for its limited application in the industry.
The best known examples of hydroisolation are single injection and recovery wells drilled at the edges of corresponding lines of operating wells beyond the margin of the orebody. There are known cases of drilling single lines of injection barrier wells in order to prevent solutions escaping into rivers as well as into the neighbouring underground mines. An example of vertical hydroisolation restricting the solution flow from underneath is presented in Figure 7.10.
FIG. 7.10. Barrage well systems: a — outside orebody (horizontal barrage); b — paired inside contour (to prevent vertical flow).
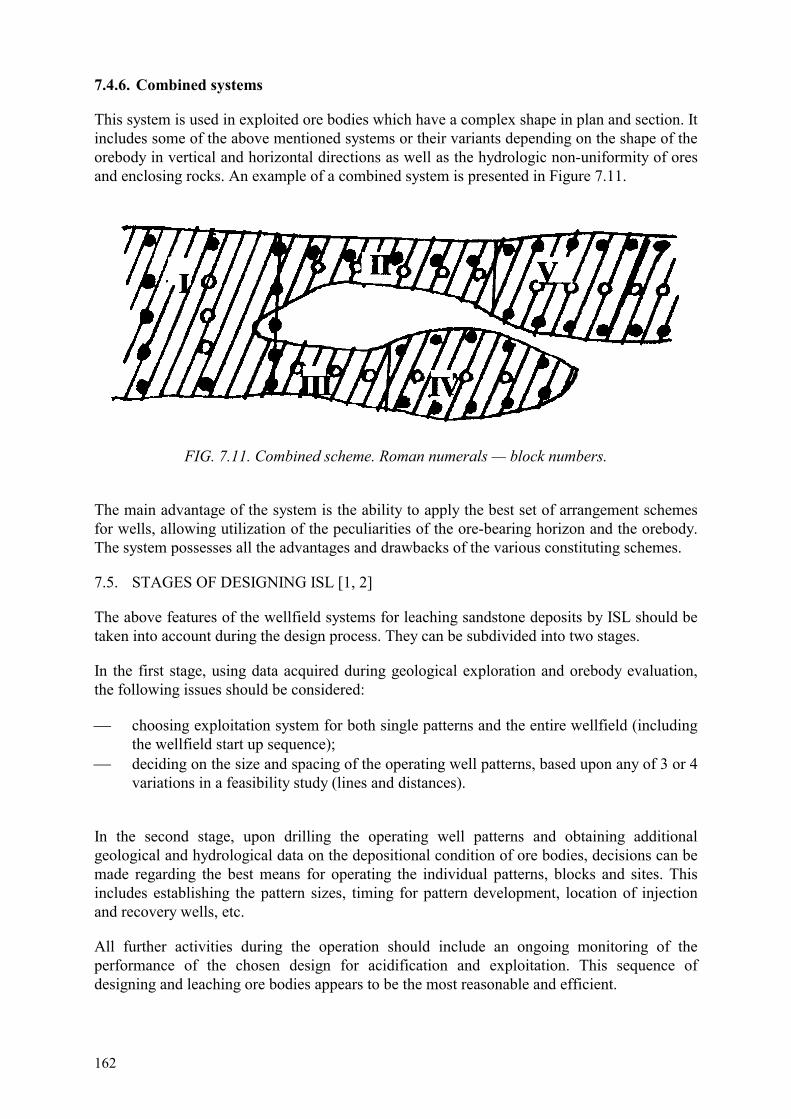
162
7.4.6. Combined systems
This system is used in exploited ore bodies which have a complex shape in plan and section. It includes some of the above mentioned systems or their variants depending on the shape of the orebody in vertical and horizontal directions as well as the hydrologic non-uniformity of ores and enclosing rocks. An example of a combined system is presented in Figure 7.11.
FIG. 7.11. Combined scheme. Roman numerals — block numbers.
The main advantage of the system is the ability to apply the best set of arrangement schemes for wells, allowing utilization of the peculiarities of the ore-bearing horizon and the orebody. The system possesses all the advantages and drawbacks of the various constituting schemes.
7.5. STAGES OF DESIGNING ISL [1, 2]
The above features of the wellfield systems for leaching sandstone deposits by ISL should be taken into account during the design process. They can be subdivided into two stages.
In the first stage, using data acquired during geological exploration and orebody evaluation, the following issues should be considered:
�� choosing exploitation system for both single patterns and the entire wellfield (including the wellfield start up sequence);
�� deciding on the size and spacing of the operating well patterns, based upon any of 3 or 4 variations in a feasibility study (lines and distances).
In the second stage, upon drilling the operating well patterns and obtaining additional geological and hydrological data on the depositional condition of ore bodies, decisions can be made regarding the best means for operating the individual patterns, blocks and sites. This includes establishing the pattern sizes, timing for pattern development, location of injection and recovery wells, etc.
All further activities during the operation should include an ongoing monitoring of the performance of the chosen design for acidification and exploitation. This sequence of designing and leaching ore bodies appears to be the most reasonable and efficient.

163
REFERENCES TO CHAPTER 7
[1] Working of Uranium by ISL. Under editorship of V.A. Mamilov. M. Atomizdat, (1980). [2] Complexes for Underground Leaching, O.L. Kedrovski, I.G. Abdulmanov, M.I.
Fazlullin, A.F. Mosev et al., Eds), M.: Nedra (1992). [3] LUTSENKO, I.K., BELETSKY, V.I., DAVYDOVA, L.G., No-Mine Working of Ore
Deposits M. Nedra (1986). [4] MASKAT, M., Flow of Uniform Liquids in Porous Medium, .L., Gostoptekhizdat
(1949).

165
Chapter 8
PROCESSING OF SOLUTIONS
8.1. COMPOSITION OF PRODUCTION SOLUTIONS
The production solutions recovered from ISL, contrary to the liquid phase from milling plant technology, are characterized as follows:
�� a relatively low uranium concentration due to two or three dimensional flow with different flow line lengths underground and the presence of barren rock interbedded within the ore-bearing horizon, which may become involved with the process and dilute the solutions;
�� a more complicated chemical composition, especially in the case of sulphuric acid leach due to practically complete closed mode of solution recycling without any remove of salts.
As in the traditional technology, the elemental composition of solution is determined by the result of chemical interaction between uranium and other minerals of the host formation and the solvent. During each cycle the content of TDS increases. Depending on the stripping agent used in the ion-exchanging process, additional anions can appear in the recirculating solutions. The continued increase of TDS content can influence the efficiency of uranium loading on the resin and the future groundwater cleanup. Therefore the process for uranium desorption from the resin should be designed for an eluate similar to the leaching reagent. Thus, the use of the sulphuric acid solution as the eluate for uranium can be recommended in the treatment of sulphuric acid leaching solutions. This would prevent extra contamination of the recycling solutions and the environment, which would happen in the case of a nitrate and especially chloride eluent. An additional advantage is that it does not need extra capital and operational expenditures for regeneration of the resin into the sulphate form after desorption. The over balance volume of solution from adsorption-desorption process can easily be utilized in the leaching process.
The salt composition of the leaching solutions depends on the concentration of sulphuric acid and on the nature of its interaction with ores. The concentration of individual components in sulphuric acid solutions broadly varies (Table 8.1). Usually the leaching solutions composition in the most deposits stabilizes after a short period of start-up, what is important for a stable desorption performance. But there are known certain rare examples of sandstone ISL projects where the content of contaminants increased during the entire operation period (up to 50–70 g/L of TDS content) and the salts had periodically to be removed from the circuit. According to observations, the phenomenon took place when higher acid concentrations were used for leaching and there were noticeable quantities of finely dispersed material (clay, loam, etc.) present in the rocks.
Usually the chemical composition of leaching solutions after sulphuric acid leaching varies from 10–15 to 20–25 g/L.
The total content of radionuclides in the solutions may vary within the range from 5•10-7 to 1•10-10 Ci/dm3.

166
TABLE 8.1. AVERAGE CONTENT OF COMPONENTS RECOVERY SOLUTIONS OF ISL, g/dm3
Material Content Material Content
Uranium H2SO4
pH Fe2+ Fe3+ Ca Mg Al
SO42-
NO3-
Cl-
0.015-0.1 1–7
1.2–2 0.2–1.5 0.15-0.9 0.3-0.6 0.3-1.6 0.3-2.5 10–25
0.06-0.6 0.2–1.7
P SiO2
Solids Ti Mn Zn Pb Ni Sr Cu As
0.02–0.15 0.01–0.5 0.01–0.2
0.0002–0.005 0.0001–0.02 0.001–0.02
0.000006-0.00001 0.0001–0.015
0.00006-0.0002 0.00003-0.005
0.00005
8.2. FILTERING PRODUCTION SOLUTIONS
The separation of solid suspensions from the leaching solution is generally done before the adsorption stage. The total suspended solides (TSS) normally range from 50 to 200 mg/dm3 but at the initial operation stage and when introducing new blocks into operation, the TSS rises to 0.5–1.0 g/dm3. The separation takes place in settling ponds with the capacity from 2,000 to 10,000 m3, depending on local conditions (production level, settling rate, etc.). The cleaning degree is determined by the type of the processing plant adsorption and desorption equipment: the fixed bed columns require finer cleaning than the pressured upflow bed of resin. Therefore in the first case sand filters are most often used, sometimes cartridge, pressure or carbon filters, etc. In the case of expanded or compacted adsorption bed, the solution must also be cleaned, because the suspended solids fed into the injection cycle will gradually plug the wells. The necessary cleaning degree depends on the ability of the injection wells to tolerate fine suspended solids during the operation period without any significant decrease of the flow rate.
Besides solid impurities present as rock particles, there are some quantity of small resin particles in the solutions after adsorption. They have to be removed by filtration prior to re-injection of the fluid underground.
The removal of suspended solids is enhanced with flocculants. Flocculants manufactured on the polyacryl amine basis (of Seperan type) are fed into the main pipeline with recovery solution. They are particularly efficient in presence of finely dispersed clay particles. Consumed in the quantity of 20–50 g per m3 of the solution, they can reduce the settling time by a factor of 2–4 and the suspended solids content to the range of 2–10 mg/dm3.
8.3. IONIC FORM OF URANIUM IN LEACHING SOLUTIONS
Leaching with sulphuric acid with addition of an oxidant solubilizes and dissolves oxidized uranium minerals as well as compounds of tetravalent uranium as a hexavalent species. The
167
present theory predicts the existence of a number of interconnected aqua- and acidocomplexes in which the spatial position of ligands predetermines the efficiency of uranium recovery from the solutions. The composition of various complexing ions for hexavalent uranium was determined by physical and chemical methods. The formation constants for these ions in sulphuric acid media have been calculated, using various methods, for uranyl cations C1 = 5.0–6.5; for a neutral molecule of uranyl sulphate C2 = 50–96, for the uranyl disulphate anion C3 = 350–900, and for uranyl trisulphate anion C4 = 2500.
The ratio between simple and complex ions of uranium in sulphate solutions depends on the H2SO4, SO4
-, and U concentration. The dynamic equilibrium between the ionic forms of uranium allows recovery of both uranium forms on anionic and cationic resins by shifting the equilibrium towards the ion to be adsorbed. At the solution pH value over 2.5, the uranium ions polymerization becomes evident, making the complex of uranyl-sulphate ion look like U2O5(SO4)3, thus considerably increasing the anionic resin loading capacity.
The ore contains substantial amount of tetravalent uranium, which should be oxidized by ferric ions in the case of the sulphuric acid ISL. If the leaching is done with higher acid concentrations, the addition of ferric ions is not necessary, since the high redox potential (within 450–500 mV) is provided by the solutions recirculation and acidification during each cycle between the underground and surface facilities. The addition of oxidant could make the composition of leaching solutions still more complex.
The low uranium content in solutions recovered from the underground makes uranium recovery by direct precipitation unprofitable: after the neutralization of recovery solutions with ammonia to pH = 7-8, the solutions contain only 2–4% uranium. Solvent extraction methods are also not acceptable, since the low uranium concentration in the solutions will result in high specific cost of extractants and diluents. In addition, after the contact with the organic phase, the barren solutions require a thorough cleaning to remove all organics to avoid potential plugging of the ore zone near the injection wells.
The current practice of recovering uranium from low-grade ISL solutions is adsorption on strong base anionic resins. They are usually in the form of gelled or porous adsorbents manufactured on the basis of styrene/divinyl benzene or vinylpyridine/divinyl benzene copolymers. The trade marks and characteristics of the commercial resins are presented in Table 8.2.
The commercial anionic resins are usually delivered in Cl-form. In the process of treatment, the sulphuric acid leaching solutions convert the resins into the SO4
2- form. Anionic resins, aside of some other useful properties, do not adsorb the gangue impurities — iron, aluminium, calcium, magnesium, which do not form anionic complexes under the ISL conditions.
In addition to the gangue impurities, a number of uranium-associated valuable elements — molybdenum, rhenium, scandium, yttrium and rare earths elements are dissolved into the leaching solutions.
Molybdenum and rhenium are usually present in solutions as anions of molybdenum and rhenium acids, MoO4
- and ReO4-, scandium, yttrium and rare earths elements — in the form of trivalent cations Sc3+, Y3+, Re3+, vanadium — in the form of vanadic cations VO2
+ and meta-vanadate VO3
- anions.

168
8.4. ADSORPTION OF URANIUM
The process of uranium adsorption from leaching solutions onto strong base anionic resin is described by equations of ion-exchange and complexing:
(R4N+)2SO4 + UO22+ + SO4
2- = (R4N+)2 [UO2(SO4)2]
2(R4N+)2SO4 + UO22+ + 2SO4
2- = (R4N+)4 [UO2(SO4)3] + SO42-
or, if the anionite is in a non-sulphate form (e.g. in nitrate):
2(R4N+)NO3 + UO22+ + 2SO4
2- = (R4N+)2 [UO2(SO4)2 ] + 2NO3-.
4(R4N+)NO3 + UO22+ + 3SO4
2- = (R4N+)4 [UO2(SO4)3] + 4NO3-.
The ion-exchange process can be divided into several independent stages following one another in time and space:
�� The diffusion of the adsorbed ion through the interface (boundary layer) film. �� Its migration from the resin surface to any point within its volume. �� The ion-exchanging or adsorption interaction at an active site. �� The migration of the displaced ion from the exchange site to the contact surface. �� Diffusion of the displaced ion through the interface (boundary layer) film into the barren
solution. Applying the well-known principle of the limiting stage in the process kinetics by breaking the contact between the solution and resin, we have found the film diffusion to be controlling in the uranium adsorption from ISL leaching solutions, characteristic of low uranium concentration. It has been proven experimentally that film diffusion limits the process rate in solutions with concentration at or less than 0.01 N, i.e. it is the slow step of the adsorption process responsible for the recovery of uranium by adsorption. In this connection, the ability to decrease the film around the adsorbent particle, usually comprising 0.01–0.001 cm via intensification of hydrodynamic performance is an important consideration when choosing adsorption equipment.
The variables for adsorption of uranium: recovery completeness, and resin capacity — are dependent on the uranium concentration in the treated solution, resin characteristics. and the presence of the adsorption depressing ions such as sulphate, nitrate and chloride ions, ions of trivalent iron and sulphuric acid. For the strong and weak base anionic resins, the uranium distribution coefficients Cd in the range of its low concentration (1–25 mg/dm3) are an order of magnitude higher than in the high concentration range (0.1–1.0 g/dm3) as shown in Table 8.3. The same dependence is observed for the saturation of Amberlite IRA-400 with uranium (Table 8.4). The increase of acid concentration in production solutions (pH over 1.5-1.8) diminishes the adsorption parameters, especially in the case of the strong base anionic resin (Table 8.5).
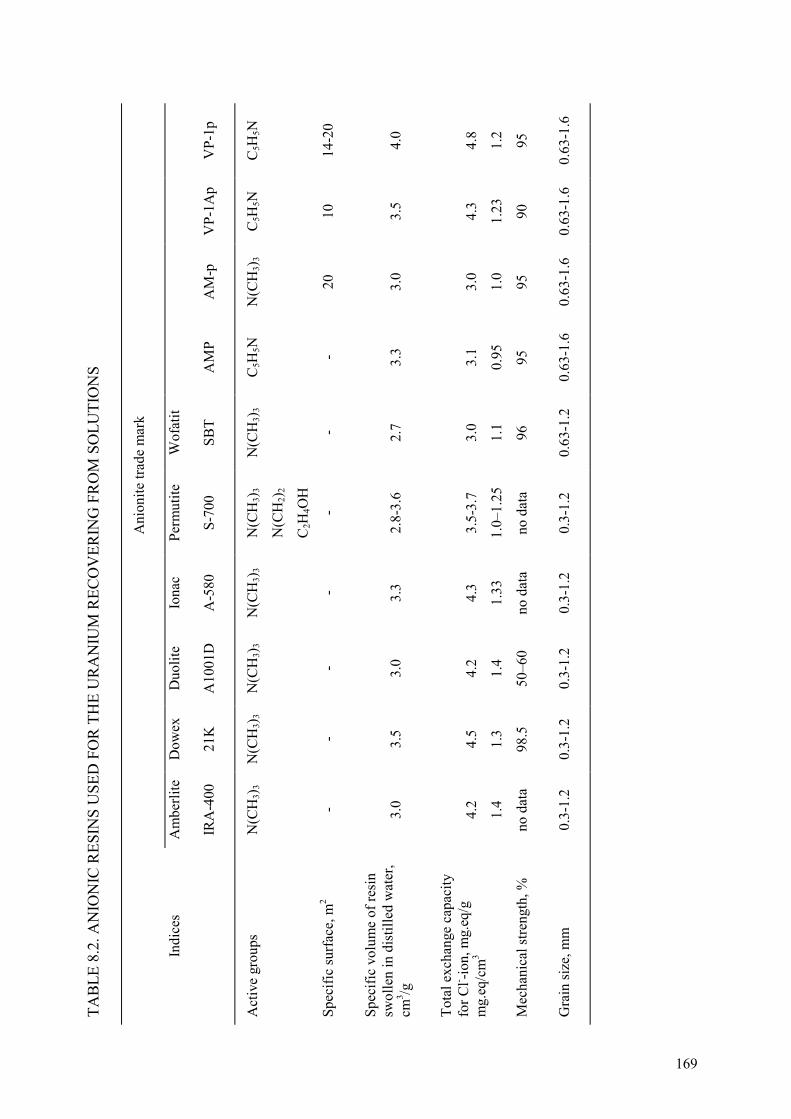
TAB
LE 8
.2. A
NIO
NIC
RES
INS
USE
D F
OR
TH
E U
RA
NIU
M R
ECO
VER
ING
FR
OM
SO
LUTI
ON
S
A
nion
ite tr
ade
mar
k
Indi
ces
Am
berli
te
IRA
-400
Dow
ex
21K
Duo
lite
A10
01D
Iona
c
A-5
80
Perm
utite
S-70
0
Wof
atit
SBT
AM
P
AM
-p
VP-
1Ap
VP-
1p
Act
ive
grou
ps
N(C
H3) 3
N
(CH
3) 3
N(C
H3) 3
N
(CH
3) 3
N(C
H3) 3
N(C
H2) 2
C2H
4OH
N(C
H3) 3
C
5H5N
N
(CH
3) 3
C5H
5N
C5H
5N
Spec
ific
surf
ace,
m2
- -
- -
- -
- 20
10
14
-20
Spec
ific
volu
me
of re
sin
swol
len
in d
istil
led
wat
er,
cm3 /g
3.0
3.5
3.0
3.3
2.8-
3.6
2.7
3.3
3.0
3.5
4.0
Tota
l exc
hang
e ca
paci
ty
for C
l- -ion,
mg.
eq/g
m
g.eq
/cm
3
4.2
1.4
4.5
1.3
4.2
1.4
4.3
1.33
3.5-
3.7
1.0–
1.25
3.0
1.1
3.1
0.95
3.0
1.0
4.3
1.23
4.8
1.2
Mec
hani
cal s
treng
th, %
no
dat
a 98
.5
50–6
0 no
dat
a no
dat
a 96
95
95
90
95
Gra
in si
ze, m
m
0.3-
1.2
0.3-
1.2
0.3-
1.2
0.3-
1.2
0.3-
1.2
0.63
-1.2
0.
63-1
.6
0.63
-1.6
0.
63-1
.6
0.63
-1.6
169
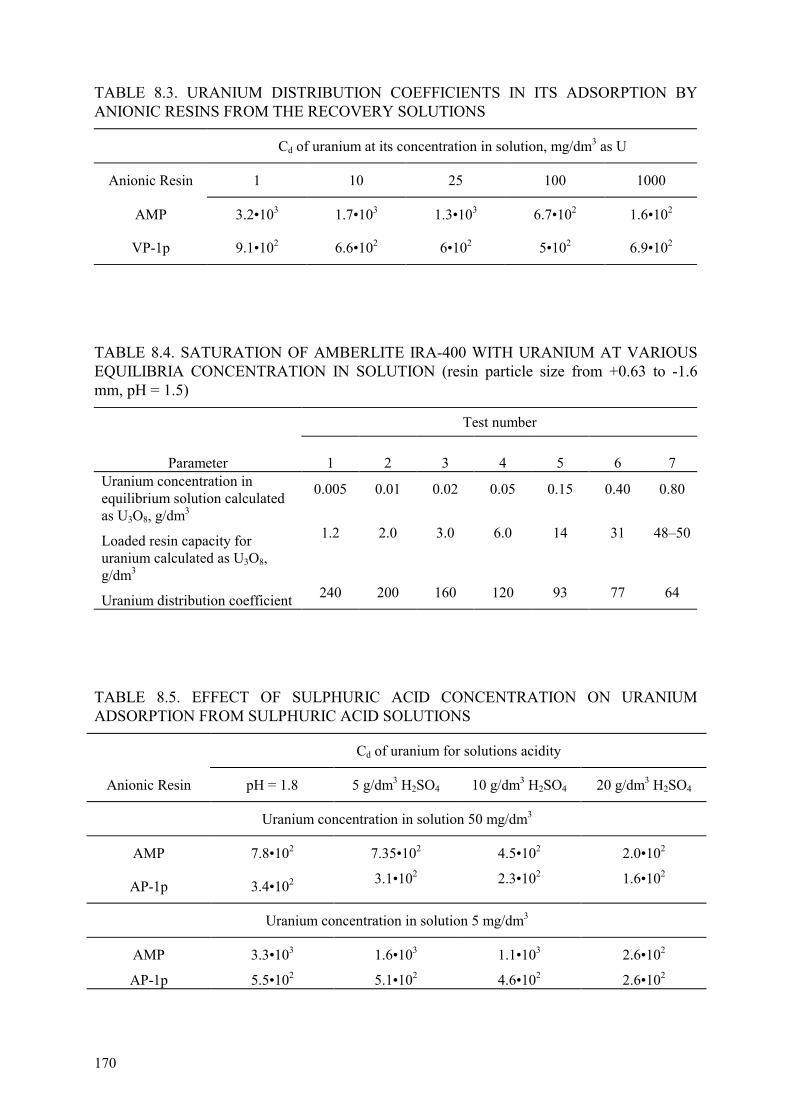
170
TABLE 8.3. URANIUM DISTRIBUTION COEFFICIENTS IN ITS ADSORPTION BY ANIONIC RESINS FROM THE RECOVERY SOLUTIONS
Cd of uranium at its concentration in solution, mg/dm3 as U
Anionic Resin 1 10 25 100 1000
AMP
VP-1p
3.2•103
9.1•102
1.7•103
6.6•102
1.3•103
6•102
6.7•102
5•102
1.6•102
6.9•102
TABLE 8.4. SATURATION OF AMBERLITE IRA-400 WITH URANIUM AT VARIOUS EQUILIBRIA CONCENTRATION IN SOLUTION (resin particle size from +0.63 to -1.6 mm, pH = 1.5)
Test number
Parameter 1
2
3
4
5
6
7
Uranium concentration in equilibrium solution calculated as U3O8, g/dm3
0.005 0.01 0.02 0.05 0.15 0.40 0.80
Loaded resin capacity for uranium calculated as U3O8, g/dm3
1.2 2.0 3.0 6.0 14 31 48–50
Uranium distribution coefficient 240 200 160 120 93 77 64
TABLE 8.5. EFFECT OF SULPHURIC ACID CONCENTRATION ON URANIUM ADSORPTION FROM SULPHURIC ACID SOLUTIONS
Cd of uranium for solutions acidity
Anionic Resin pH = 1.8 5 g/dm3 H2SO4 10 g/dm3 H2SO4 20 g/dm3 H2SO4
Uranium concentration in solution 50 mg/dm3
AMP
AP-1p
7.8•102
3.4•102
7.35•102
3.1•102
4.5•102
2.3•102
2.0•102
1.6•102
Uranium concentration in solution 5 mg/dm3
AMP
AP-1p
3.3•103
5.5•102
1.6•103
5.1•102
1.1•103
4.6•102
2.6•102
2.6•102
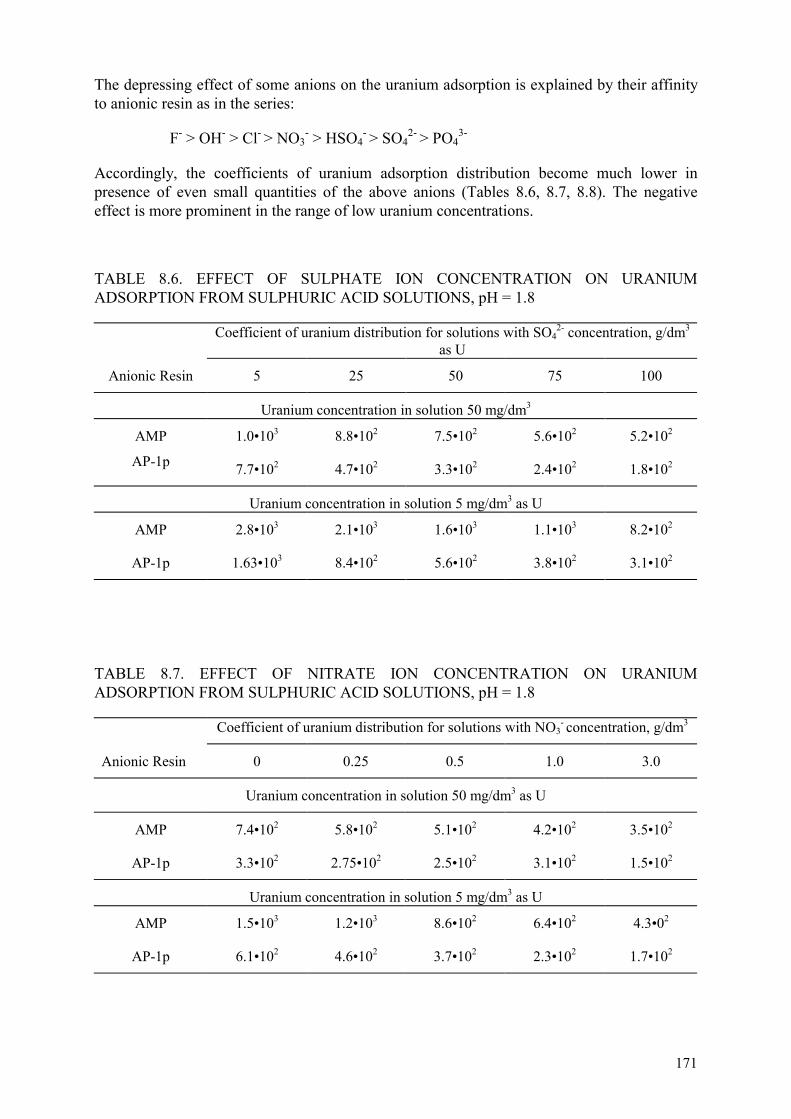
171
The depressing effect of some anions on the uranium adsorption is explained by their affinity to anionic resin as in the series:
F- > OH- > Cl- > NO3- > HSO4
- > SO42- > PO4
3-
Accordingly, the coefficients of uranium adsorption distribution become much lower in presence of even small quantities of the above anions (Tables 8.6, 8.7, 8.8). The negative effect is more prominent in the range of low uranium concentrations.
TABLE 8.6. EFFECT OF SULPHATE ION CONCENTRATION ON URANIUM ADSORPTION FROM SULPHURIC ACID SOLUTIONS, pH = 1.8
Coefficient of uranium distribution for solutions with SO42- concentration, g/dm3
as U
Anionic Resin 5 25 50 75 100
Uranium concentration in solution 50 mg/dm3
AMP
AP-1p
1.0•103
7.7•102
8.8•102
4.7•102
7.5•102
3.3•102
5.6•102
2.4•102
5.2•102
1.8•102
Uranium concentration in solution 5 mg/dm3 as U
AMP
AP-1p
2.8•103
1.63•103
2.1•103
8.4•102
1.6•103
5.6•102
1.1•103
3.8•102
8.2•102
3.1•102
TABLE 8.7. EFFECT OF NITRATE ION CONCENTRATION ON URANIUM ADSORPTION FROM SULPHURIC ACID SOLUTIONS, pH = 1.8
Coefficient of uranium distribution for solutions with NO3- concentration, g/dm3
Anionic Resin 0 0.25 0.5 1.0 3.0
Uranium concentration in solution 50 mg/dm3 as U
AMP
AP-1p
7.4•102
3.3•102
5.8•102
2.75•102
5.1•102
2.5•102
4.2•102
3.1•102
3.5•102
1.5•102
Uranium concentration in solution 5 mg/dm3 as U
AMP
AP-1p
1.5•103
6.1•102
1.2•103
4.6•102
8.6•102
3.7•102
6.4•102
2.3•102
4.3•02
1.7•102
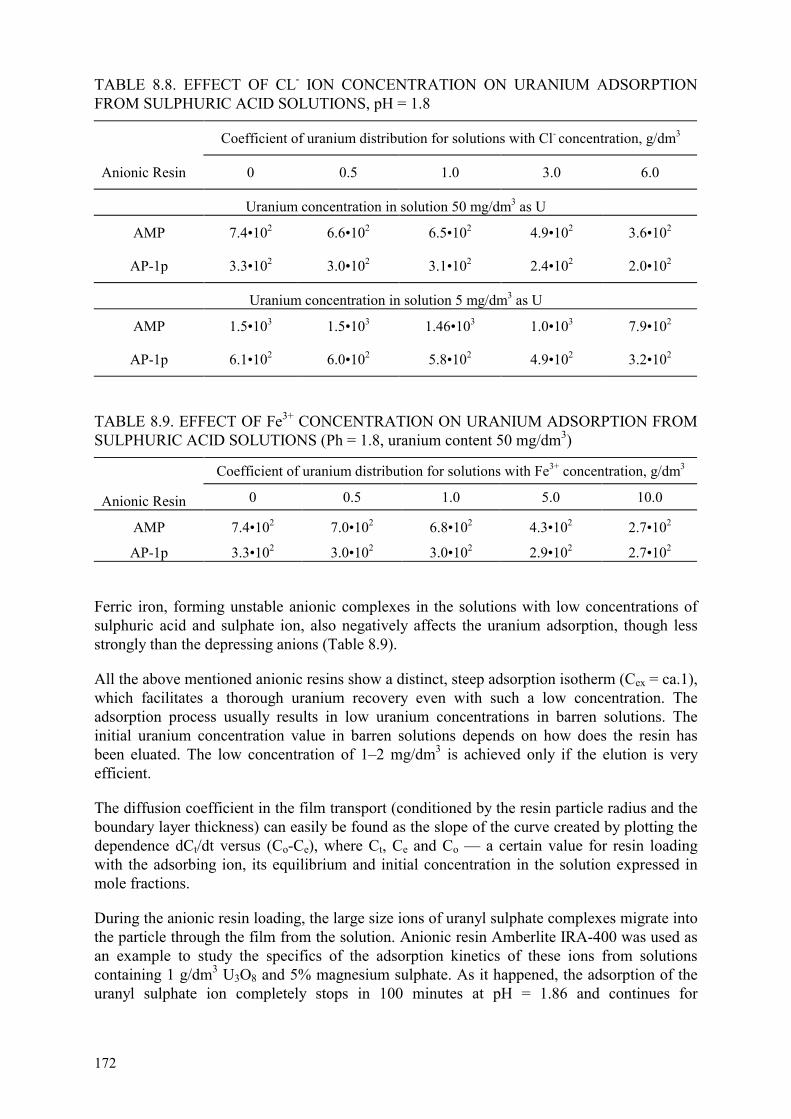
172
TABLE 8.8. EFFECT OF CL- ION CONCENTRATION ON URANIUM ADSORPTION FROM SULPHURIC ACID SOLUTIONS, pH = 1.8
Coefficient of uranium distribution for solutions with Cl- concentration, g/dm3
Anionic Resin 0 0.5 1.0 3.0 6.0
Uranium concentration in solution 50 mg/dm3 as U
AMP
AP-1p
7.4•102
3.3•102
6.6•102
3.0•102
6.5•102
3.1•102
4.9•102
2.4•102
3.6•102
2.0•102
Uranium concentration in solution 5 mg/dm3 as U
AMP
AP-1p
1.5•103
6.1•102
1.5•103
6.0•102
1.46•103
5.8•102
1.0•103
4.9•102
7.9•102
3.2•102
TABLE 8.9. EFFECT OF Fe3+ CONCENTRATION ON URANIUM ADSORPTION FROM SULPHURIC ACID SOLUTIONS (Ph = 1.8, uranium content 50 mg/dm3)
Coefficient of uranium distribution for solutions with Fe3+ concentration, g/dm3
Anionic Resin 0 0.5 1.0 5.0 10.0
AMP
AP-1p
7.4•102
3.3•102
7.0•102
3.0•102
6.8•102
3.0•102
4.3•102
2.9•102
2.7•102
2.7•102
Ferric iron, forming unstable anionic complexes in the solutions with low concentrations of sulphuric acid and sulphate ion, also negatively affects the uranium adsorption, though less strongly than the depressing anions (Table 8.9).
All the above mentioned anionic resins show a distinct, steep adsorption isotherm (Cex = ca.1), which facilitates a thorough uranium recovery even with such a low concentration. The adsorption process usually results in low uranium concentrations in barren solutions. The initial uranium concentration value in barren solutions depends on how does the resin has been eluated. The low concentration of 1–2 mg/dm3 is achieved only if the elution is very efficient.
The diffusion coefficient in the film transport (conditioned by the resin particle radius and the boundary layer thickness) can easily be found as the slope of the curve created by plotting the dependence dCt/dt versus (Co-Ce), where Ct, Ce and Co — a certain value for resin loading with the adsorbing ion, its equilibrium and initial concentration in the solution expressed in mole fractions.
During the anionic resin loading, the large size ions of uranyl sulphate complexes migrate into the particle through the film from the solution. Anionic resin Amberlite IRA-400 was used as an example to study the specifics of the adsorption kinetics of these ions from solutions containing 1 g/dm3 U3O8 and 5% magnesium sulphate. As it happened, the adsorption of the uranyl sulphate ion completely stops in 100 minutes at pH = 1.86 and continues for
173
500 minutes at pH = 3.6. The adsorption of uranyl trisulphate dimers at pH = 4.4–4.9 requires 10,000 minutes due to spatial obstacles: such ions would better be adsorbed on anionic resins with porous structure. In practice the duration of the contact between an anionic resin and sulphuric acid leaching solutions at the adsorption stage generally comprises 6-8 hours. In actuality, in the recovery of uranium via ion-exchange, one should bear in mind two factors: a wide range of uranium concentrations in production solutions (from 10–15 mg/dm3 to 1–2 g/dm3) and a rather changeable composition of gangue as well as the presence of depressing and stimulating impurities.
8.5. DYNAMICS IN TREATMENT OF SOLUTION BY USING ION EXCHANGE
An important index of adsorption treatment of solutions is the completeness of recovering the uranium at the highest saturation degree of the adsorbent. This can be achieved by a multistage contact between one and the same solution batch and various anionic resin portions. The concentration of adsorbed component in the solution gradually diminishes.
When the solutions pass through the resin bed in the column, the uranium concentration is observed to decrease. The part of resin bed, where the concentration drops from the initial value to the residual content, is called the length of the operational bed, Zo. The mathematical description of the operational bed is easily derived from the equation of Fick and Nernst and can be presented as a general expression:
ZW
nC CC C
WD F
nC CC Co
o r
r f
o f
r f� �
�
�
�
�
�
�
�
��
�1 1
where: W = the flow rate of the solution; � = kinetic coefficient of adsorption equal to D.F/���D = coefficient of diffusion in the anionic resin; F = total area of the anionic resin particles or adsorbent; Co, Cr = initial and residual concentration of the valuable component; Cf = concentration of valuable component in the boundary film; � = thickness of the boundary film, mm.
If the film diffusion predominates, the adsorbed ions move inside the anionic resin grain or adsorbent faster than through the film. Therefore the equation for the conditions of adsorbing dilute ISL production solutions is simplified:
Zo = (�W/DF) • ln (Co/Cr)
Upon formation of the operational bed or the adsorption front, its parallel dispersion takes place. The excessive height of the bed facilitates a long operating cycle of the equipment without the uranium concentration appearing in the effluent. Therefore, the length of the operating bed Z is composed of the operational bed length Zo and the excess of the adsorbent bed h: Z = Zo + h.
The efficiency of a single load of anionic resin in this case is characterized by: � �
�Z hZ
The highest efficiency is obtained in equipment of continuous operational mode.
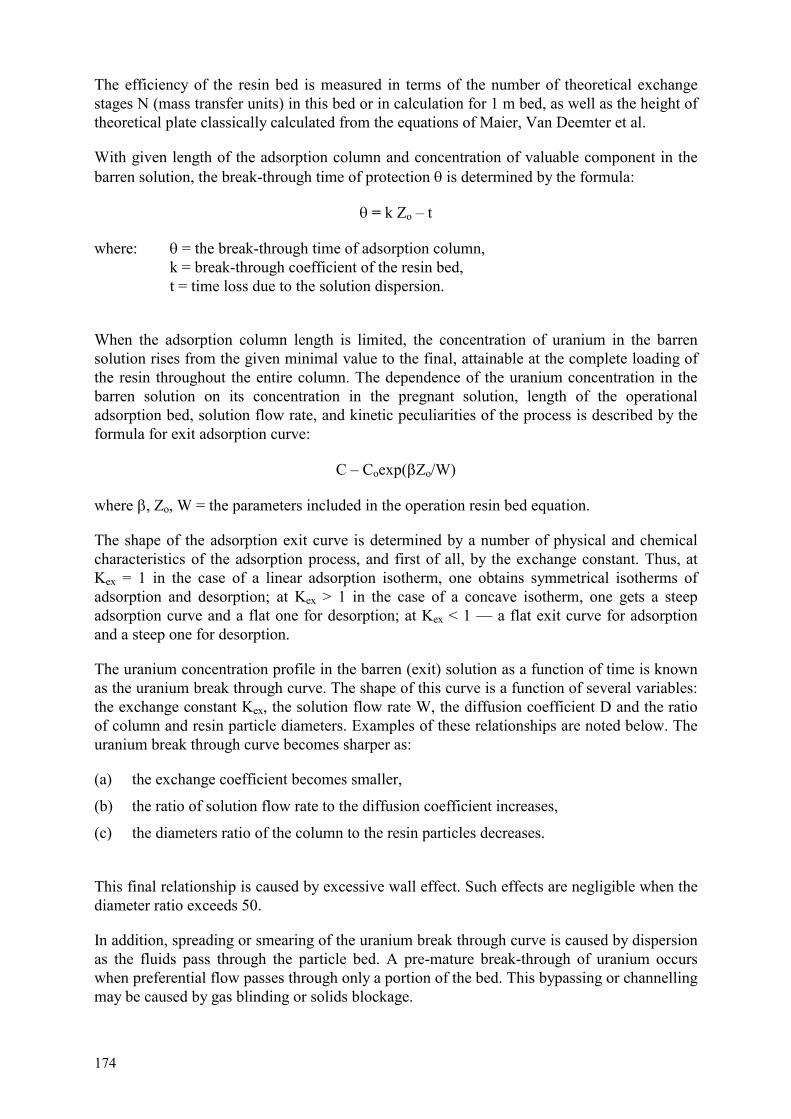
174
The efficiency of the resin bed is measured in terms of the number of theoretical exchange stages N (mass transfer units) in this bed or in calculation for 1 m bed, as well as the height of theoretical plate classically calculated from the equations of Maier, Van Deemter et al.
With given length of the adsorption column and concentration of valuable component in the barren solution, the break-through time of protection � is determined by the formula:
� = k Zo – t
where: � = the break-through time of adsorption column, k = break-through coefficient of the resin bed, t = time loss due to the solution dispersion.
When the adsorption column length is limited, the concentration of uranium in the barren solution rises from the given minimal value to the final, attainable at the complete loading of the resin throughout the entire column. The dependence of the uranium concentration in the barren solution on its concentration in the pregnant solution, length of the operational adsorption bed, solution flow rate, and kinetic peculiarities of the process is described by the formula for exit adsorption curve:
C – Coexp(�Zo/W)
where �, Zo, W = the parameters included in the operation resin bed equation.
The shape of the adsorption exit curve is determined by a number of physical and chemical characteristics of the adsorption process, and first of all, by the exchange constant. Thus, at Kex = 1 in the case of a linear adsorption isotherm, one obtains symmetrical isotherms of adsorption and desorption; at Kex > 1 in the case of a concave isotherm, one gets a steep adsorption curve and a flat one for desorption; at Kex < 1 — a flat exit curve for adsorption and a steep one for desorption.
The uranium concentration profile in the barren (exit) solution as a function of time is known as the uranium break through curve. The shape of this curve is a function of several variables: the exchange constant Kex, the solution flow rate W, the diffusion coefficient D and the ratio of column and resin particle diameters. Examples of these relationships are noted below. The uranium break through curve becomes sharper as:
(a) the exchange coefficient becomes smaller,
(b) the ratio of solution flow rate to the diffusion coefficient increases,
(c) the diameters ratio of the column to the resin particles decreases.
This final relationship is caused by excessive wall effect. Such effects are negligible when the diameter ratio exceeds 50.
In addition, spreading or smearing of the uranium break through curve is caused by dispersion as the fluids pass through the particle bed. A pre-mature break-through of uranium occurs when preferential flow passes through only a portion of the bed. This bypassing or channelling may be caused by gas blinding or solids blockage.

175
8.6. URANIUM DESORPTION FROM ANIONIC RESIN
Desorption of uranium from anionic resin is done by solutions of various chemical reagents. Uranyl sulphate complexes are eluated from the anionic resin phase with concentrated solutions of sulphuric acid (often with additions of small quantities of nitric acid as an anti-corrosion measure) or with solutions of nitrate, chloride and ammonium carbonate salts or sodium chloride with addition of soda or alkali.
When the desorption is done with sulphuric acid solutions, the resin can directly be contacted with recovery solutions. The use of other eluting reagents requires regeneration, i.e. conversion of the resin into a form corresponding to the treated solution in order to prevent depressing anions (Cl-, NO3
-) entering into these solutions. Therefore uranium should be stripped from the resin loaded with sulphuric acid solutions with sulphuric acid despite more effective elution of uranium with solutions of nitrate and chloride salts.
In the desorption process, the concentration of uranium on the resin decreases to some lowest acceptable value. This concentration is called the residual capacity; it should not exceed 10–20% of the resin equilibrium capacity for uranium.
During the elution the effluent from the anionic resin bed contains a variable concentration of uranium. A graph of this concentration versus the volume of eluant used is the differential desorption curve for uranium and will resemble a Gaussian distribution curve. The area within the boundary of the curve and the X-axis is numerically equal to the usable uranium loading capacity of the resin. This is the uranium working capacity of the resin and is described by formula:
Uranium Working Capacity C dVuranV
V
� �1
2
where Curan is the uranium concentration in the eluate at any volume from V1 to V2 and V1, V2 are corresponding volumes of eluate at the start and finish of the usable uranium stripping. Other fractions of the eluate may contain low concentrations of uranium. These fractions are recycled for further elution.
The desorption of uranyl sulphate ions from anionic resin like AM, AMP, Dowex-1, Amberlite Ira-400 is done with 2–3N or 10–15% sulphuric acid solutions. The eluate yield usually comprises 3.5-4.5 volume per volume of resin with counter current movement of the solution and the resin. The uranium desorption process time from anionic resins Dowex-1, AM and AMP varies from 30 to 40 hours at ambient temperature. When the sulphuric acid eluate temperature is increased to 50–60oC it not only decreases the required duration of the resin/solution contact by 20–30%, but cuts down the volume of the eluate and raises the uranium concentration there by 10–15%.
The adsorption process indices
�� residual capacity of the resin for uranium, �� yield of the eluate, �� the uranium concentration in eluates, are determined by a set of parameters: the nature of desorbing agent, its concentration, temperature of the process, as well as by physical and chemical characteristics of the process (Table 8.9).

176
8.7. METHODS OF SEPARATING URANIUM FROM ELUATES
Depending on the method of uranium desorption, the facilities apply various techniques for its concentration and separation from eluates. In the case of desorption with the use of salt solutions (ammonium nitrate, sodium chloride, ammonium chloride) uranium is usually precipitated with aqueous solutions of ammonia as ammonium polyuranate. When the sodium hydrate solution is used, sodium polyuranate is precipitated. The polyuranates are separated on filters and the cake is further refined in hydrometallurgical plants. A higher quality product can be obtained by uranium precipitation in steps at various pH values. At first, the eluate is neutralized by ammonia, calcium or magnesium oxide to pH = 3.5-3.8 at 80oC in order to remove iron hydroxides and, partially, sulphates. After filtration of the solution, the pH value of the solution is raised to 6.5–7.5 for uranium precipitation. The scheme may provide uranium concentrates with the content from 40 to 64% depending on the ore composition and effectiveness of impurity removal. The mother solution after the polyuranate precipitation and separation is used for eluents preparation.
Sometimes uranium is precipitated from acidified chloride eluates as uranyl peroxide. In some cases the polyuranate cake is dissolved in sulphuric acid and delivered to hydrometallurgical treatment in stainless steel tanks as a concentrated (to 200 g/dm3 of U) solution. The hydrolytic method, though so simple and efficient for uranium recovery, has a serious drawback: the accumulation of excessive volumes of nitrate or chloride solutions, which after utilization in eluting mixtures, should be disposed or injected.
Uranium desorption with sulphuric acid has no such disadvantage. Uranium can be concentrated from eluates by adsorption or extraction and separated as sodium eluate/re-extract with concentration 80–100 g/dm3 of U. The cleaned sulphuric acid solutions can be returned to desorption process or used in the underground leaching process. The concentration and separation of uranium from sulphuric acid and nitrate eluates can be done successfully via electrodyalysis on anionic membranes. The reagent recovery (sulphuric acid or nitrate salts) in the electrodyalysis process can reach 70–80%. Uranium is recovered in a highly concentrated form (hydrated uranium dioxide).
The end products and corresponding solutions which can be obtained using different methods in the uranium concentration process from various compositions eluates are presented in Table 8.11.
Usually the end product at ISL facilities is ammonium or sodium polyuranate as filtered product or condensed pulp which is transported to the hydrometallurgical plant to further processing.
8.8. TRANSPORTATION OF URANIUM PRODUCTS
The transportation methods of the end uranium products the ISL facilities depend on the kind of commodity. The condensed pulp of uranium chemical concentrates is transported by motor cars or railway in tanks made of low-grade or black steel. When the product is dissolved in acid, the acidic (generally sulphuric acid) uranium solutions are transported in stainless steel tanks. All containers for transportation of uranium products must be sealed and subjected to regular inspection.

TAB
LE 8
.10.
PA
RA
MET
ERS
OF
UR
AN
IUM
DES
OR
PTIO
N F
RO
M A
NIO
NIC
RES
IN A
T A
UN
IFO
RM
WO
RK
ING
CA
PAC
ITY
OF
40
KG
OF
U P
ER T
ON
OF
DR
Y R
ESIN
Proc
ess p
aram
eter
s of d
esor
ptio
n by
var
ious
solu
tions
A
nion
ic R
esin
H2S
O4
N
H4N
O3 +
HN
O3 (
H2S
O4)
N
aCl,
NH
4Cl
Type
Cd
L r
es
V
p/Vc
t d
Cd
L r
es
V
p/Vc
Cu
t d Cd
L r
es
V
p/Vc
Cu
t d G
el ty
pe
(AM
P, A
M)
15
-18
+
12–1
5 *)
1.
5-2.
5
3-4
5-7
30
–36
8-
10
NH
4NO
3 +
1–
2 ac
id
0.
5-1
1.
5-2.
5
8-13
16-2
0 6-8
0.
5-1
1–
1.5
13
-20
10
–12
Poro
us
(VP-
1Ap,
A
M-p
VP-
1p)
15
-18
1–
2
2–3
5-7
20
–24
8-
10
NH
4NO
3 +
1–
2 ac
id
0.
5-1
1.
5-2
7.
5-10
12–1
6 6-8
0.
5-1
0.
8-1.
2
12–1
8
8-10
Cd –
reag
ent c
once
ntra
tion
in e
luan
t, w
eigh
t %;
L res
– re
sidu
al c
apac
ity o
f res
in fo
r ura
nium
, kg/
t;
Vs/V
a – sp
ecifi
c vo
lum
e of
elu
ate,
vol
./vol
. of r
esin
;
Cu –
con
cent
ratio
n of
ura
nium
elu
ate,
kg/
m3 ;
t d –
nece
ssar
y de
sorp
tion
time,
h.
*) –
10–
15 g
/dm
3 HN
O3 a
dded
.
177

178
TABLE 8.11. END PRODUCTS OBTAINED IN URANIUM CONCENTRATION FROM ELUATES USING DIFFERENT METHODS
Characteristics of
eluate
Method of uranium
concentration
Obtained products
End uranium product
Technological products
1. Sulphuric acid, 100–150 g/dm3 H2SO4
1. Adsorption 2. Extraction 3. Electrodialysis on anionic membranes
Sodium eluate with U concentration 80–100 g/dm3 Sodium commercial reextract with U concentration 80–100 g/dm3 Ammonium polyuranates
Sulphuric acid solution, 90–140 g/dm3 H2SO4 Sulphuric acid solution, 90–140 g/dm3 H2SO4 Sulphuric acid solution, 80–120 g/dm3 H2SO4
2. Nitrate/sulphuric acid 80–100 g/dm3
NH4NO3 + 10–20 g/dm3 (NH4)2SO4 + 10–20 g/dm3 acid
1. Hydrolytic precipitation 2. Electrodialysis on anionic membranes
Ammonium polyuranates Ammonium polyuranates
Ammonia nitrate (10% by w.) and ammonia sulphate (1–2% by w.) solution, pH = 8.5-9 Solution of sulphuric and nitric acids, 10–20 g/dm3 Solution of ammonium nitrate
3. Chloride (6-8% NaCl or NH4Cl)
Ammonium or sodium polyuranates
Alkaline or ammonia solution of sodium chloride
4. Chloride-alkaline (6-8% NaCl + 1–2% NaOH)
Hydrolytic precipitation Uranium peroxide Sodium chloride solution
8.9. PROCESS SCHEMES FOR TREATMENT OF RECOVERY SOLUTION
Process schemes for adsorption treatment of recovery solutions include the following major operations: solutions pre-treatment (settling, filtration), uranium adsorption on anionic resin, uranium desorption, concentration and separation of uranium from eluates. Depending on the recovery solution type (sulphuric acid or carbonates) and the eluates used (sulphuric acid, solutions of nitrate, chloride or ammonium carbonate salts), the process scheme includes some additional operations of washing, re-saturation and conversion of the resin. The desorption of uranium by concentrated solutions of reagents that are used in ISL do not need to wash the resin before the next adsorption. A simplified process scheme is presented for such treatment of sulphuric acid solutions (Fig. 8.1).
When uranium desorption is done with reagents that do not find application in ISL (acidified solutions of nitrate salts, solutions of chloride salts or their mixtures with alkali), the process scheme should include one extra operation to prepare the resin for adsorption.

179
FIG. 8.1. Schematic system for processing sulphuric acid leach solutions with sulphuric acid adsorption of uranium: _____ - solutions; ------ - adsorbent.
The operation converts the resin into a form corresponding to the recovery solution (sulphate or bicarbonate) and is done with solutions of sulphuric acid or ammonium bicarbonate (in concentration 10–20%). The obtained solution is contaminated with the environmental impurities (nitrate and chloride ions), which are also depressors for the uranium adsorption. The impurities concentration may vary from 10 to 30 g/dm3. In addition, the hydrolytic precipitation of uranium concentrate used in such schemes is also the source of excessive process solutions. Certain mother liquor volumes steadily increase from cycle to cycle and must also be disposed into the underground or treated.
An additional operation often used in the scheme prior to the uranium desorption is a preliminary conversion of the anionic resin into the form compatible with the desorption solution composition. To do this, the anionic resin saturated with the production solutions should be treated with a portion of commercial desorbate. In the process of the conversion, the anionic resin is re-saturated with more uranium (by 10–25% of the initial loading capacity). A simplified process flow sheet for the production solutions treatment, including the additional operations is presented in Figure 8.2.

180
FIG. 8.2. Schematic system for processing leach solutions with ionite treatment before and after adsorption: _____ - solutions; ------ - adsorbent.
8.10. ADSORPTION/DESORPTION EQUIPMENT FOR PROCESSING RECOVERY SOLUTIONS
Specific production-scale equipment of batch and continuous operation mode has been developed for ion-exchange technology. The processing of recovery solutions throughout all steps (adsorption, washing, desorption, conversion) is presently carried out in columns with counter current flow of the resin and solution. The multi-staged operation consists of an adsorption column (usually in series of several) with a fixed bed of the resin (Fig. 8.3) operating on the principle of a “drifting” or “floating” mode. It has a supply system, flow meters to set rates of the washing water and eluent as well as capacities for preparing regenerating solutions. The columns are used for adsorption, washing and regeneration steps. The efficiency is optimized by fractionating of the washing water and regenerates, considerably raising the profitability of the processing. The most rational scheme which provides the maximum loading capacity of the resin is the one with “roaming” column. The production solution is stage-wise passed through two (or three) columns and at the moment the uranium is detected in the effluent of the second (or third) column, a freshly regenerated column is connected to the circuit end. The whole resin bed becomes loaded, contrary to the case of a single stage column, where a substantial part of anionic resin is partially (not fully) loaded. The scheme yields a high concentration of uranium in the eluate. When the uranium concentration in the barren solution reaches the control value (2–5 mg/L), the lead column with loaded resin is disconnected from the adsorption circuit and set up for the washing and desorption.

181
FIG. 8.3. Down flow ion-exchange column.
The frequency of the columns switch-over is once every one or two days. The specific volumetric flow rate for recovery solution through the column does not exceed 7-15 m3/m2 (volume of liquid/cross sectional area of column) per hour and the solution volume processed in one adsorption cycle comprises 300–500 volumes per one volume of resin depending on the uranium concentration in the solution. The drawbacks of the fixed bed columns are their low specific productivity, multiple auxiliary equipment, large volume of the resin. The advantages are the simplicity of operation and possibility of automation.
The columns of continuous operation mode include the columns with expanded resin bed, e.g. KDS (Fig. 8.4) as well as columns of pressured type with a compacted bed of resin such as SNK, PIK, KISPR (Figs. 8.7, 8.8, 8.9). In the first case, the fixed bed of resin becomes only slightly expanded by the solutions fed in through the bottom, especially if the flow rate is not so high. By airlift the loaded resin is taken from the bottom of the column. A corresponding quantity of fresh resin is simultaneously fed into the upper end. A progressing movement from top to the bottom is established in such a way that the airlifts regulate the flow rates within the limit 0.3–1.0 m/h for the downflow of resin and 6.5–7.5 m/h for the upflow of the treated solution. By the airlift transport not only the resin is removed, but also significant volume of solution. Therefore the resin should be dewatered prior to the feeding into the column on fixed sieves (portable net drainage with inclination 30o) or on any screen type.
FIG. 8.4. Ion-exchange column with fluidized bed (KDS).
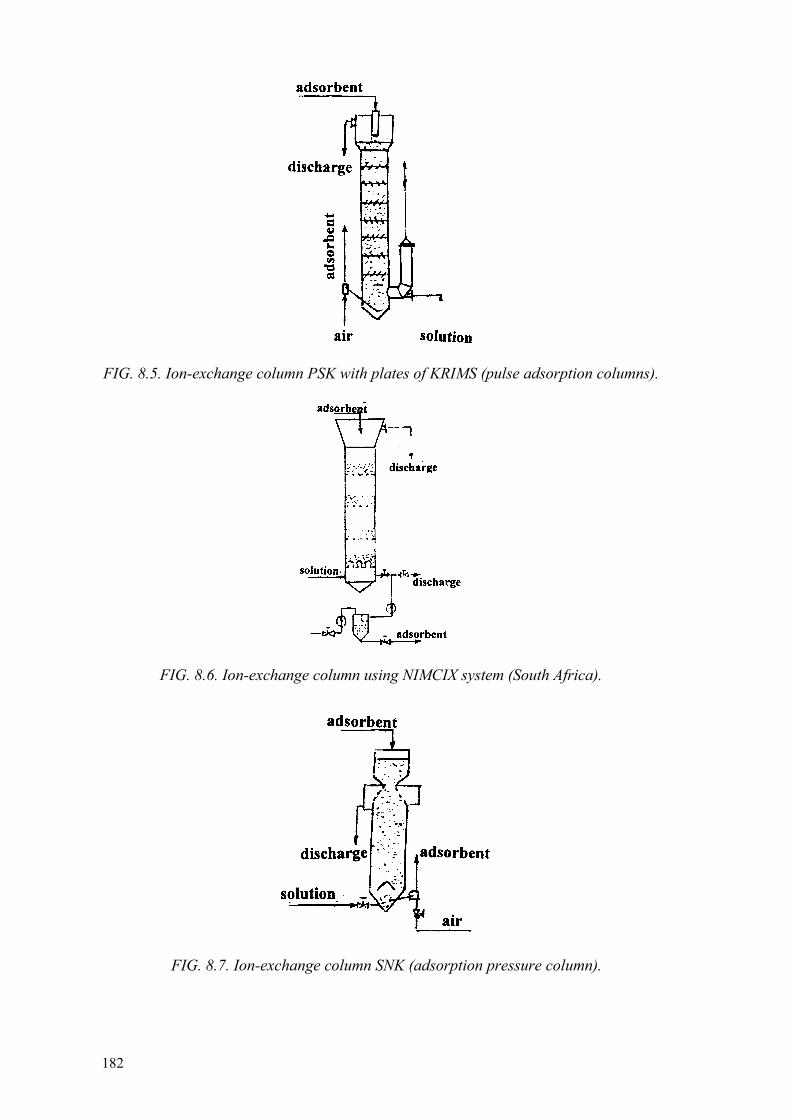
182
FIG. 8.5. Ion-exchange column PSK with plates of KRIMS (pulse adsorption columns).
FIG. 8.6. Ion-exchange column using NIMCIX system (South Africa).
FIG. 8.7. Ion-exchange column SNK (adsorption pressure column).
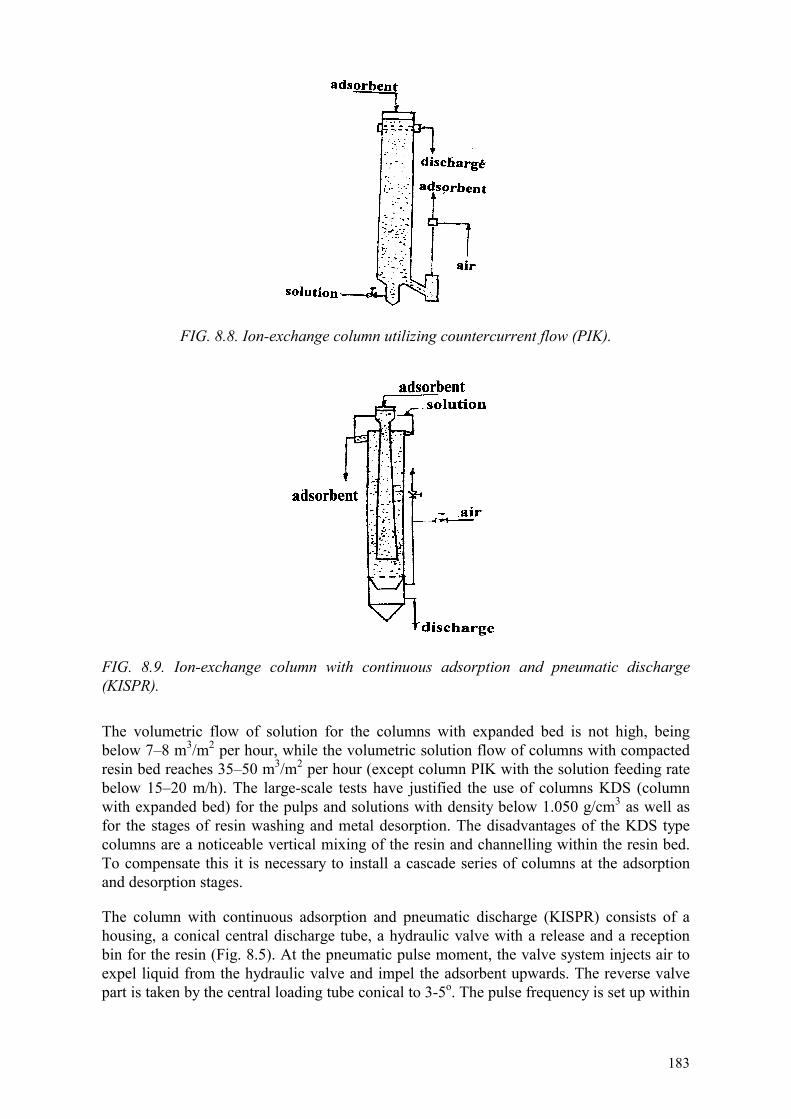
183
FIG. 8.8. Ion-exchange column utilizing countercurrent flow (PIK).
FIG. 8.9. Ion-exchange column with continuous adsorption and pneumatic discharge (KISPR).
The volumetric flow of solution for the columns with expanded bed is not high, being below 7–8 m3/m2 per hour, while the volumetric solution flow of columns with compacted resin bed reaches 35–50 m3/m2 per hour (except column PIK with the solution feeding rate below 15–20 m/h). The large-scale tests have justified the use of columns KDS (column with expanded bed) for the pulps and solutions with density below 1.050 g/cm3 as well as for the stages of resin washing and metal desorption. The disadvantages of the KDS type columns are a noticeable vertical mixing of the resin and channelling within the resin bed. To compensate this it is necessary to install a cascade series of columns at the adsorption and desorption stages.
The column with continuous adsorption and pneumatic discharge (KISPR) consists of a housing, a conical central discharge tube, a hydraulic valve with a release and a reception bin for the resin (Fig. 8.5). At the pneumatic pulse moment, the valve system injects air to expel liquid from the hydraulic valve and impel the adsorbent upwards. The reverse valve part is taken by the central loading tube conical to 3-5o. The pulse frequency is set up within

184
4-60 pulses per hour depending on the capacity for adsorbent and character of the material under treatment. The air consumption is below 10–12 m3/h per 1 m3 adsorbent. Vessels have been tested with the operation volume 10–12 and 30 m3, 1.5 and 2.5 m in diameter, respectively. The process duration in KISPR column is half than in KDS, which allows to decrease the initial resin volume in the process and the capital cost of construction. The drawback is related to the complicated automation system.
The pressure column compacted resin bed (PIK, SNK) can treat only clean solutions with the solid suspensions content below 1 g/L. Such columns usually operate independently. Some of them, e.g. PIK (counter current ion-exchange column) can combine several unit operations (adsorption, desorption, re-saturation), though the process automation becomes problematic.
In comparison with the KISPR column, columns of such type preserve the traditional adsorbent motion from the top towards the bottom, and have a simpler automation scheme. The columns can operate both autonomously or connected in a series with each other.
Generally, the continuous processing of recovery solution in adsorption columns of both types is characteristic of smaller single batches of resin and less equipment as well as of high productivity, though the anionic resin consumption would be higher due to mechanical attrition during transportation.
The simplified views and operation principle are given in Figure 8.10 together with two apparatus types developed abroad.
FIG. 8.10. Adsorption column CHICCNIIS.
8.11. COMPLEX PROCESSING OF LEACHING SOLUTIONS IN THE FUTURE
In addition to uranium, the recovery solutions can contain highly valuable metals as impurities. This may include rhenium, scandium, REE, yttrium, vanadium, and molybdenum. Concentration of these elements in the solutions varies from tenths of a gram to tens of grams in one cubic meter of solution, depending on the kind of the ore (Table 8.12).

185
TABLE 8.12. CONTENT OF VALUABLE METALLIC IMPURITIES IN ISL RECOVERY SOLUTIONS, g/m3
Re Sc Retotal Y Mo V Se
to 0.3 to 0.5 5-30 0.5-3.0 1–10 5-100 0.01–10 Despite such low concentration, the by-product recovery of these elements can prove profitable in large-scale processing of recovery solutions, since the basic capital and operational expenditures in the ISL are included in the production cost of the major component recovered — uranium (2). The incremental cost for by-product recovery of the valuables from uranium ores will comprise only operational and capital costs of the additional processing, which may be 10–15% of the overall end product manufacturing cost.
The adsorption technology applied for the recovery of the by-products can increase their concentration on the resin (depending on the adsorbent type) by factors of: 55-3500 for rhenium, 30–100 for REE, 100–1200 for vanadium, 750–1500 for molybdenum. Some of elements can be adsorbed on anionic resin jointly with uranium and require only a selective desorption (molybdenum, rhenium), the other would need some other adsorbent type and the arrangement of separate technological circuits.
The desorbate can be processed to further concentration of various by-products via adsorption, extraction or membrane methods and then various compounds (salts, hydroxides, oxides, etc.) can be separated.
BIBLIOGRAPHY TO CHAPTER 8
GROMOV, B.V., Introduction into Technology of Uranium, M. Moscow Chem. Technol. Inst. named after D.I.Mendeleev (1972).
Uranium Mining by In-Situ Leaching (V.A. Mamilov, Ed.), M.:Atomizdat (1980).
ZAKHAROV, E.I., RJABCHIKOV, B.E., DJAKOV, V.S., Ion-Exchange Equipment in Atomic Industries, M. Energoatomizdat (1987).
ZELIKMAN, A.N., VOLDMAN, G.M., BELJAVSKAJA, L.V., Theory of Hydrometallurgical Processes, M. Metallurgija (1975).
ZEFIROV, A.P., LASKORIN, B.N., NEVSKI, B.V., Present State in Technology of Uranium Ores Processing, M. Atomnaja Energija 11 2 (1961).
ZEFIROV, A.P., NEVSKI, B.V., BAKHUROV, V.G., LUTSENKO, I.K., In-Situ Leaching of Uranium (Proc. 4th Int. UN Conf. on Peaceful Use of Nuclear Energy, Geneva), 49 (1978*) 45.
Ion-Exchanging Materials for Hydrometallurgy, Effluents Cleaning and Water Treatment (Manual), (B.N.Laskorin, M.:ARRICT, Eds) (1983).
LILIPINA, I.I., Uranyl and its Compounds, M. PH Ac.Sci.USSR (1959).
LURIE, A.A., Adsorbents and Chromatographic Carriers (Manual), M. Khimija (1972).
Ref. Jour. Gornoe Delo, 3B560 (1986).
186
SADYKOV, R.Kh., Uranium In-Situ Leaching Abroad. Review, M. TsNIIAtominform, 1987, 87 (397).
Proceedings of First Int.Conf. on Peaceful Use of Nuclear Energy, Geneva, 1955, M. Metallurgizdat 8 (1958).
FEDULOV, Y.N., ALEKSEEVA, V.V., VODOLASOV, L.I., LASKORIN B.N., Adsorption Column of Continuous Operation with Fixed Ionite Bed, M. Tsvetnaja Metallurgija 2 (1970).
SHEVCHENKO, B.V., SUDARIKOV, B.N., Technology of Uranium, M. Gosatomizdat (1961).
AHRLAND, S., Acta Chemica Scandinavica 5 7 (1951) 1151.
ARDEN, T.V., WOOD, G.A., Adsorption of Complex Anions from Uranyl Sulphate Solution by Anion-Exchange Resins, J.Chemical Society 91,p (1956) 1596-1603.
In-Situ Uranium Extraction Dominates Texas Meeting. Engng. and Mining J. 181 12, (1980) 92–93.
NADEN, D., PILOT, I., RENNER, C.W., Solvent Extraction and Ion-Exchange Nuclear Fuel Cycle, Chichester, p.17-33 (1985).
WAADSWORTH, M.E., Review of Developments In Hydrometallurgy — 1980, J. Metals 33 4 (1981) 36–40.
Mining of Uranium by In-Situ Leaching (V.A.Mamilov, Ed.), M. Atomizdat, 1980.

187
Chapter 9
WELLFIELD DEVELOPMENT FOR ISL OPERATIONS
9.1. GENERAL
The installation of wells is an important component of the development of an ISL production facility. Depending upon the depth of the deposit, the drilling cost associated with well installation can comprise 15% to 30% of the total uranium production cost.
Uncased drill holes are used in exploration and delineation of an orebody to define its shape and to evaluate ore reserves. Wells are cased holes which are required during the leaching process for injecting and recovering leaching solutions, for sampling solutions which contain uranium, for monitoring the leaching solution in the production zone and for estimating percentage recovery. Wells also play a role in preventing or limiting environmental contamination. The number of wells required for extraction of a uranium deposit by ISL may range from a few hundred to several thousand.
Partial failure or impaired operation of even one well may affect the efficiency of the ISL process and require readjustment of flows in the wellfield pattern in which it is located.
Technical and economic factors concerning the recovery uranium by ISL are dependent upon the configuration of wells, their installation costs, and their performance during production.
In ISL uranium production, the wells have to meet the following requirements:
(1) The arrangement of wells and their performance should provide maximum uranium recovery from the ore with a minimum loss of leaching solution.
(2) The wells should be designed to operate at the maximum possible productivity under the existing conditions at the site.
(3) The arrangement of wells should enable the movement of solutions underground to be controlled.
(4) The operating life of the wells should last as long as required for complete extraction of the wellfield.
(5) The number and cost of wells required for technical recovery of the ore should also be consistent with the economic parameters which are defined by the feasibility study.
(6) The standard of quality attained during well installation should be sufficient to meet all the expected operational requirements, including the specified equipment and instrumentation.
(7) The wells must not be allowed to become a source of environmental contamination.
All wells used in developing and extraction of uranium deposits by ISL are involved in the leaching process and therefore are called operational wells. Depending on their function, operational wells are divided into two types: injection and recovery wells in the first group, and auxiliary wells in the second.

188
The first group of operational wells are directly involved in the recovery of uranium from underground. Their function is to distribute and recirculate the leaching solutions and to control the hydrodynamic framework in the wellfield. Within the group, the recovery wells (sometimes called production wells) are designed for lifting the production solutions containing dissolved uranium from the production layer (orebody) to the surface. Injection wells are used to return the leaching solutions (solvent) into the orebody after the uranium has been removed.
Injection and recovery wells may be operated at various flow rates depending upon the hydrological and geological conditions in the ore deposit and the geometry of wellfield patterns. For injection wells, the flow rates range from a minimum of 0.0007 m3/second to a maximum of 0.007 m3/second with a typical average rate of 0.0014 m3/second. The equivalent flow rates for recovery wells are 0.0014, 0.014 and 0.0028 m3/second, respectively.
The auxiliary wells and holed are not involved in recovery of uranium, but are used for several purposes such as preparation of the ore zone for leaching, control of solutions, monitoring, sampling and environmental protection. Included in this group are uncased holes drilled for detailed delineation of the ore, confirmation of ore reserves or studying rock properties along solution flow paths.
Auxiliary cased wells are commonly installed for the purpose of modifying the properties of the host rock to enhance rock permeability and improve leaching performance. Examples of these activities include pre-treatment of the existing groundwater, disaggregation, ultrasonic treatment, hydraulic fracturing etc. Other cased wells might be installed to create hydraulic barriers by injecting native groundwater to restrict solution movement through barren or low ore grade zones inside the wellfield.
A peripheral ring of control wells may be installed around the margin of an ISL site, or an entire deposit, to prevent the escape of leaching solutions from the wellfield and protect the natural groundwater in adjacent parts of the aquifer. If a water barrier is to be used, the external control wells operate as injection wells and are supplied with a non-leaching fluid, which is usually formation water. At a later stage, when injection of reagents has stopped, these wells can be converted into pumping wells to recover fluids from the dispersion halo.
Other wells could be installed for the purpose of mechanically restricting solution flow by injecting an impermeable material, such as cement, clay slurry or resins, into fissures created by hydraulic fracturing.
Observation wells are used for monitoring and sampling the leaching solutions within the wellfield and in the dispersion halo. They are also used to detect excursions of leaching solutions beyond the dispersion halo and in overlying and underlying aquifers. Observation wells may also be installed in depleted wellfields to confirm the complete recovery of uranium from the ore, to study changes in the host rock and to monitor any post-leach environmental contamination.
The design and method of installation of a well varies according to intended use. The standard of reliability of a well and its expected service life can also be different. The highest standards of construction quality are used for the injection and recovery wells, which a consequent effect on the engineering and economic factors of mineral recovery.

189
9.2. CONSTRUCTION AND OPERATION OF INJECTION AND RECOVERY WELLS
The design of injection and recovery wells to be installed at an ISL facility may be complicated by the need to accommodate the broad range of operating conditions which may be encountered with this extraction process, namely:
(1) Separate ore zones may occur in different geological and hydrological situations. Sandstone deposits are often found in unconsolidated sandy-clay formations with several aquifers present in the stratigraphic section. The water in the production layer is generally under a pressure head and artesian conditions may even be present at some deposits. The formation water temperature can vary from 0 to 50oC.
(2) For ISL extraction of sandstone deposits, the wells are always installed from the ground surface.
(3) ISL deposits are located in various geographical and climatic zones, often in remote regions far from industrial and residential development, which increases the capital cost for construction of a facility. Local climatic conditions, particularly extremes of temperature, may require that the construction equipment and the ISL facility itself be provided with specialised fabrication materials or operating supplies.
(4) The different uses of wells (recovery, injection, observation, control, etc.) require specific construction designs for each type.
(5) The service life of drill holes or cased wells will vary, depending on their purpose, from a few hours or days (exploration, blasting, control, hydrofracturing of rock, etc.) to several years (recovery, injection, observation).
(6) Well construction costs should be carefully considered, depending on the expected service life of each type of well.
(7) A large number of wells may be installed in a relatively small area, often as many as 800 to 1800 per square kilometre. The separation distance between wells varies from 15 to 70 metres.
(8) At this density, up to 500 wells may be installed annually during the commercial development of an entire ore deposit. Maintaining the installation costs within acceptable limits for such a large number of wells would require the use of highly efficient drilling equipment and advanced technology for well construction.
(9) The depth and diameter of the drill holes and wells depends upon the depth of the ore bodies and usually ranges from 15 to 800 metres.
(10) Various reagents are used in the leaching solutions (acid, bicarbonate, oxygen, etc.), some of which may require specific materials for well casing and other equipment. Some of these reagents also require special operating procedures for environmental protection operator safety.
(11) A variety of types and sizes of pumps is usually required for satisfactory operation of wells at different flow rates and pressure heads in the aquifer. Sometimes, a new pump design altogether is needed.
(12) Injection wells can be operated under a variety of conditions. The leaching solution can be introduced into the production zone either by natural recharge under gravity or by applied pressure. The injection flow can be either continuous or intermittent.
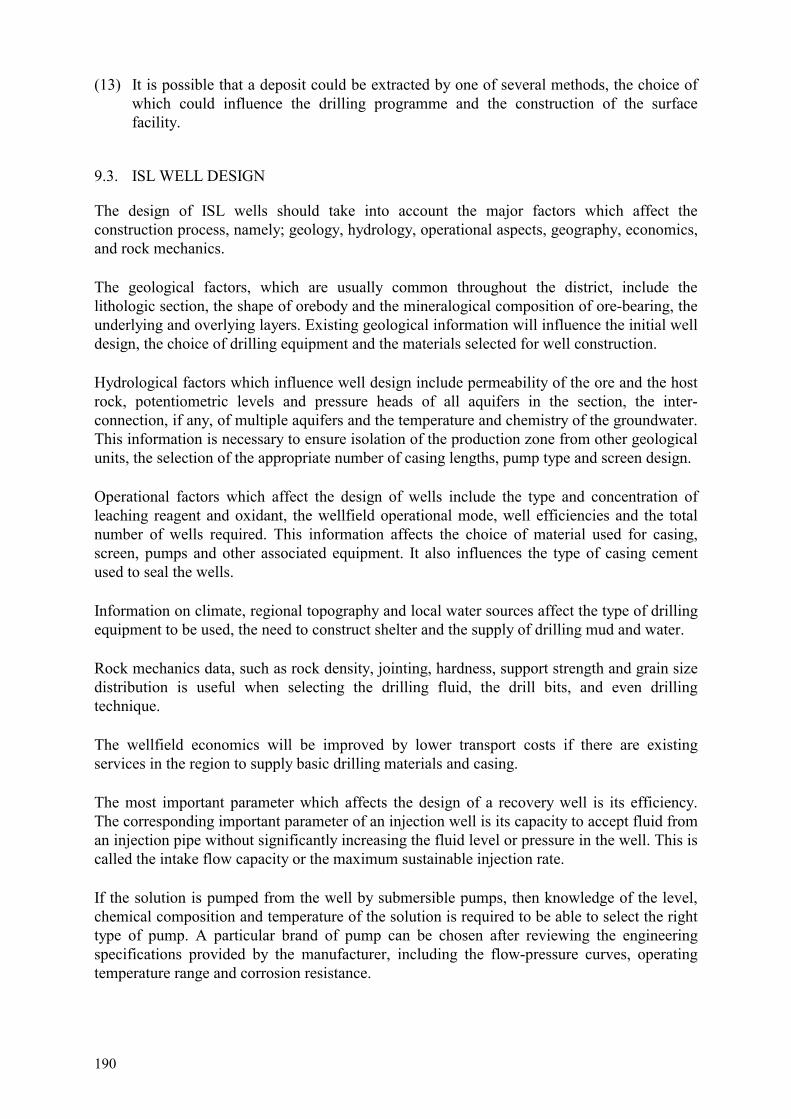
190
(13) It is possible that a deposit could be extracted by one of several methods, the choice of which could influence the drilling programme and the construction of the surface facility.
9.3. ISL WELL DESIGN
The design of ISL wells should take into account the major factors which affect the construction process, namely; geology, hydrology, operational aspects, geography, economics, and rock mechanics.
The geological factors, which are usually common throughout the district, include the lithologic section, the shape of orebody and the mineralogical composition of ore-bearing, the underlying and overlying layers. Existing geological information will influence the initial well design, the choice of drilling equipment and the materials selected for well construction.
Hydrological factors which influence well design include permeability of the ore and the host rock, potentiometric levels and pressure heads of all aquifers in the section, the inter-connection, if any, of multiple aquifers and the temperature and chemistry of the groundwater. This information is necessary to ensure isolation of the production zone from other geological units, the selection of the appropriate number of casing lengths, pump type and screen design.
Operational factors which affect the design of wells include the type and concentration of leaching reagent and oxidant, the wellfield operational mode, well efficiencies and the total number of wells required. This information affects the choice of material used for casing, screen, pumps and other associated equipment. It also influences the type of casing cement used to seal the wells.
Information on climate, regional topography and local water sources affect the type of drilling equipment to be used, the need to construct shelter and the supply of drilling mud and water.
Rock mechanics data, such as rock density, jointing, hardness, support strength and grain size distribution is useful when selecting the drilling fluid, the drill bits, and even drilling technique.
The wellfield economics will be improved by lower transport costs if there are existing services in the region to supply basic drilling materials and casing.
The most important parameter which affects the design of a recovery well is its efficiency. The corresponding important parameter of an injection well is its capacity to accept fluid from an injection pipe without significantly increasing the fluid level or pressure in the well. This is called the intake flow capacity or the maximum sustainable injection rate.
If the solution is pumped from the well by submersible pumps, then knowledge of the level, chemical composition and temperature of the solution is required to be able to select the right type of pump. A particular brand of pump can be chosen after reviewing the engineering specifications provided by the manufacturer, including the flow-pressure curves, operating temperature range and corrosion resistance.
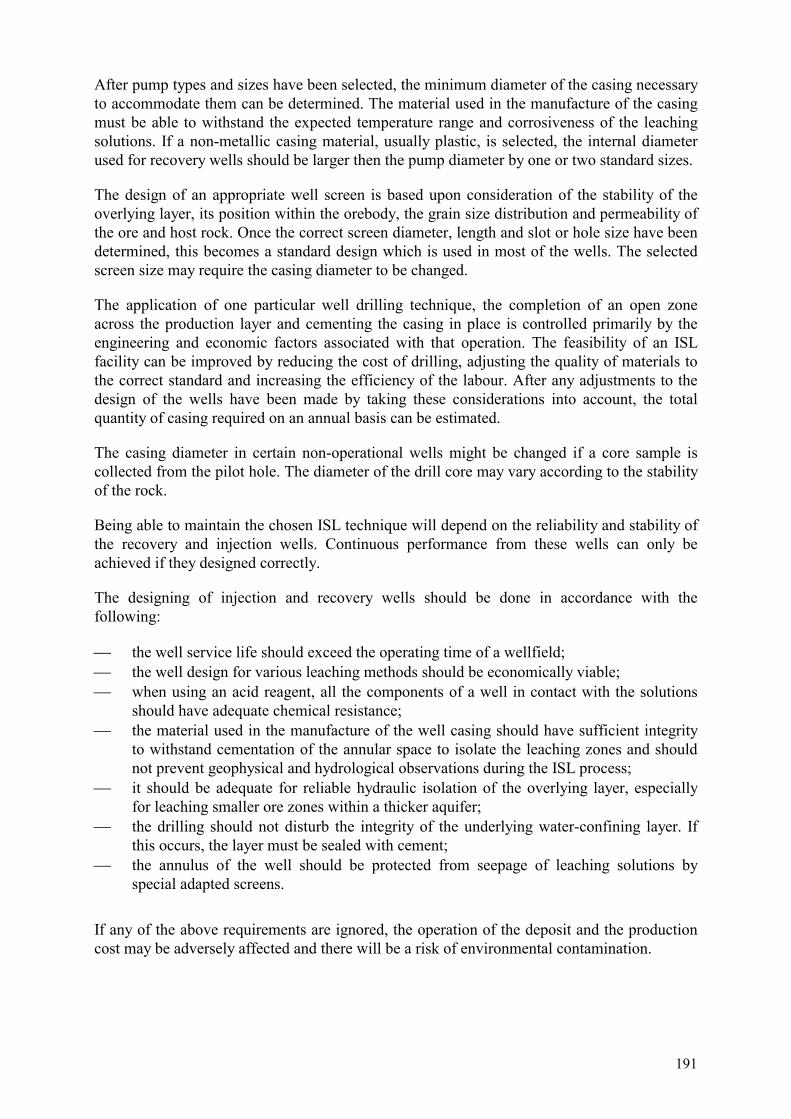
191
After pump types and sizes have been selected, the minimum diameter of the casing necessary to accommodate them can be determined. The material used in the manufacture of the casing must be able to withstand the expected temperature range and corrosiveness of the leaching solutions. If a non-metallic casing material, usually plastic, is selected, the internal diameter used for recovery wells should be larger then the pump diameter by one or two standard sizes.
The design of an appropriate well screen is based upon consideration of the stability of the overlying layer, its position within the orebody, the grain size distribution and permeability of the ore and host rock. Once the correct screen diameter, length and slot or hole size have been determined, this becomes a standard design which is used in most of the wells. The selected screen size may require the casing diameter to be changed.
The application of one particular well drilling technique, the completion of an open zone across the production layer and cementing the casing in place is controlled primarily by the engineering and economic factors associated with that operation. The feasibility of an ISL facility can be improved by reducing the cost of drilling, adjusting the quality of materials to the correct standard and increasing the efficiency of the labour. After any adjustments to the design of the wells have been made by taking these considerations into account, the total quantity of casing required on an annual basis can be estimated.
The casing diameter in certain non-operational wells might be changed if a core sample is collected from the pilot hole. The diameter of the drill core may vary according to the stability of the rock.
Being able to maintain the chosen ISL technique will depend on the reliability and stability of the recovery and injection wells. Continuous performance from these wells can only be achieved if they designed correctly.
The designing of injection and recovery wells should be done in accordance with the following:
�� the well service life should exceed the operating time of a wellfield; �� the well design for various leaching methods should be economically viable; �� when using an acid reagent, all the components of a well in contact with the solutions
should have adequate chemical resistance; �� the material used in the manufacture of the well casing should have sufficient integrity
to withstand cementation of the annular space to isolate the leaching zones and should not prevent geophysical and hydrological observations during the ISL process;
�� it should be adequate for reliable hydraulic isolation of the overlying layer, especially for leaching smaller ore zones within a thicker aquifer;
�� the drilling should not disturb the integrity of the underlying water-confining layer. If this occurs, the layer must be sealed with cement;
�� the annulus of the well should be protected from seepage of leaching solutions by special adapted screens.
If any of the above requirements are ignored, the operation of the deposit and the production cost may be adversely affected and there will be a risk of environmental contamination.

192
9.3.1. Design of recovery wells
The design of recovery wells can vary depending upon the installation method and operating conditions, but most importantly, the method of lifting leaching solutions to the surface, namely, airlifting, suction, or electric-powered submersible pumps.
A casing column can be made of pipe of the same material and diameter, or it can contain a combination of different materials or sizes. For instance, the casing diameter from the surface to the depth of the submersible pump should be sufficient to house the pump, but it can be a smaller diameter below the pump, possibly to accept screen of a different size.
The length of the individual sections of casing pipes and the depth at which the base of the casing column is set are related to both the compressional strength of the casing material and the expected operating fluid level during pumping. In particular, the length of larger diameter casing in the upper part of the well should be sufficient to ensure that the entire length of the pump is submersed 3–5 metres below the lowest fluid level.
In many recovery wells, where the potentiometric level of the fluid is very deep, the larger diameter casing in the upper part of the well must extend below the maximum recommended depth calculated from the compressional strength of the pipe material. In such cases, an outer metal casing is first set to this depth to withstand the compressional load, then the plastic casing is mounted inside.
The casing diameter in recovery wells is determined by the pump sizes, the static level of solution in the well, and the casing material. When using submersible pumps in wells with plastic or combined metal and plastic casing, the diameter of the casing should be twice or three times bigger because the wall thickness of the polyethylene tube may change during installation. Also, the cross sectional area of the pipe is reduced at thermally welded joints because the thickness of the weld may reach 8 mm. Loss of head from the vertical solution movement from the screen to the suction inlet of the pump should be minimal.
The diameter of drill holes which will contain only a single column of casing is based upon the diameter and type of material used for the casing (e.g. polyethylene, glass-reinforced plastic, stainless steel, etc.), the type, diameter, and the mounting location of the weights used to lower the polyethylene casing and on the cementing and sealing methods.
Recovery wells constructed using only a single column of sealed casing are simple and inexpensive to install, but this design precludes the use of gravel-packed screens in smaller diameter wells, which reduces their efficiency and operating life. In some recovery wells which have larger diameter casing, gravel-packed screens can be installed after the diameter of the open interval has been enlarged by under-reaming. Sometimes, in recovery wells fitted with sand/gravel-packed screens, a lining made of acid-resistant material is extended to top of the productive layer. The lowest section of the outer casing column, which is called a “shoe”, is of a smaller diameter to ensure a closer fitting and better seal using packers between the screen and the casing.
Figure 9.1 shows the design of operational wells intended for use at greater depths (over 300 metres) where unstable rock is present in shallower intervals. An outer metal casing (guard casing) is inserted to support the unstable portion of the bore hole, with the annulus being sealed by cement. An inner casing made of acid-resistant material is then installed and the annular space between the two casing columns sealed with packers, cement, or clay slurry.
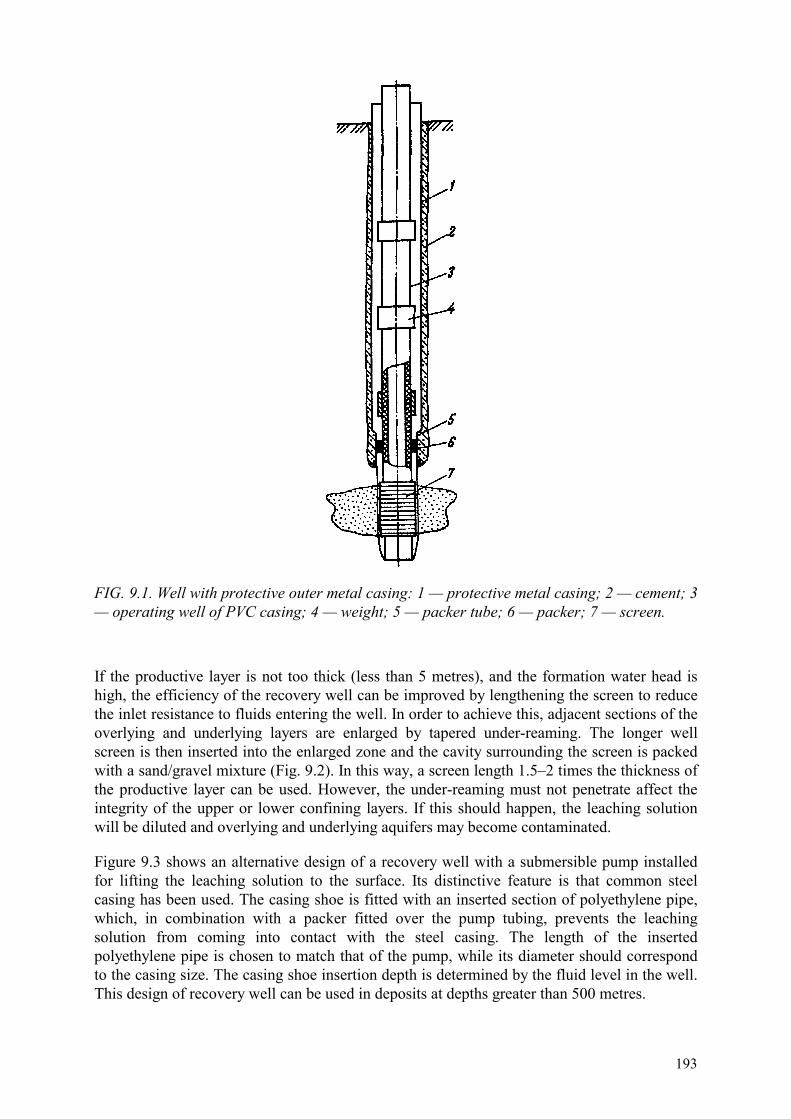
193
FIG. 9.1. Well with protective outer metal casing: 1 — protective metal casing; 2 — cement; 3 — operating well of PVC casing; 4 — weight; 5 — packer tube; 6 — packer; 7 — screen.
If the productive layer is not too thick (less than 5 metres), and the formation water head is high, the efficiency of the recovery well can be improved by lengthening the screen to reduce the inlet resistance to fluids entering the well. In order to achieve this, adjacent sections of the overlying and underlying layers are enlarged by tapered under-reaming. The longer well screen is then inserted into the enlarged zone and the cavity surrounding the screen is packed with a sand/gravel mixture (Fig. 9.2). In this way, a screen length 1.5–2 times the thickness of the productive layer can be used. However, the under-reaming must not penetrate affect the integrity of the upper or lower confining layers. If this should happen, the leaching solution will be diluted and overlying and underlying aquifers may become contaminated.
Figure 9.3 shows an alternative design of a recovery well with a submersible pump installed for lifting the leaching solution to the surface. Its distinctive feature is that common steel casing has been used. The casing shoe is fitted with an inserted section of polyethylene pipe, which, in combination with a packer fitted over the pump tubing, prevents the leaching solution from coming into contact with the steel casing. The length of the inserted polyethylene pipe is chosen to match that of the pump, while its diameter should correspond to the casing size. The casing shoe insertion depth is determined by the fluid level in the well. This design of recovery well can be used in deposits at depths greater than 500 metres.
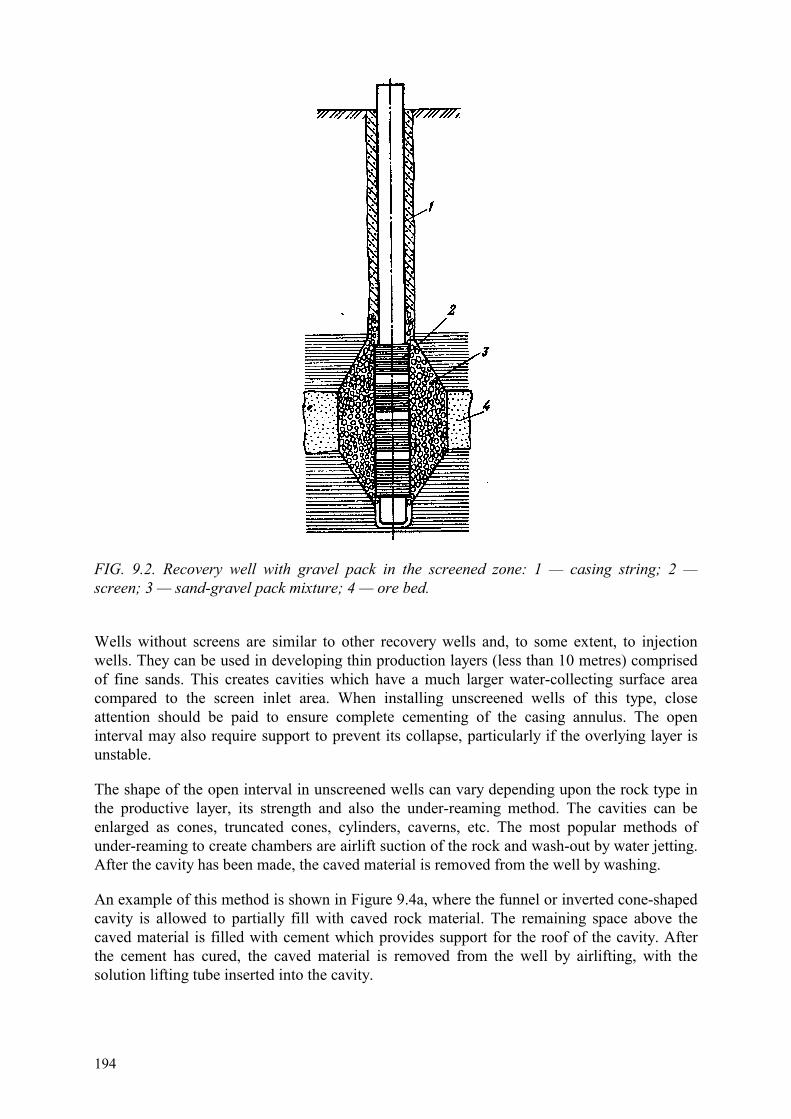
194
FIG. 9.2. Recovery well with gravel pack in the screened zone: 1 — casing string; 2 — screen; 3 — sand-gravel pack mixture; 4 — ore bed.
Wells without screens are similar to other recovery wells and, to some extent, to injection wells. They can be used in developing thin production layers (less than 10 metres) comprised of fine sands. This creates cavities which have a much larger water-collecting surface area compared to the screen inlet area. When installing unscreened wells of this type, close attention should be paid to ensure complete cementing of the casing annulus. The open interval may also require support to prevent its collapse, particularly if the overlying layer is unstable.
The shape of the open interval in unscreened wells can vary depending upon the rock type in the productive layer, its strength and also the under-reaming method. The cavities can be enlarged as cones, truncated cones, cylinders, caverns, etc. The most popular methods of under-reaming to create chambers are airlift suction of the rock and wash-out by water jetting. After the cavity has been made, the caved material is removed from the well by washing.
An example of this method is shown in Figure 9.4a, where the funnel or inverted cone-shaped cavity is allowed to partially fill with caved rock material. The remaining space above the caved material is filled with cement which provides support for the roof of the cavity. After the cement has cured, the caved material is removed from the well by airlifting, with the solution lifting tube inserted into the cavity.
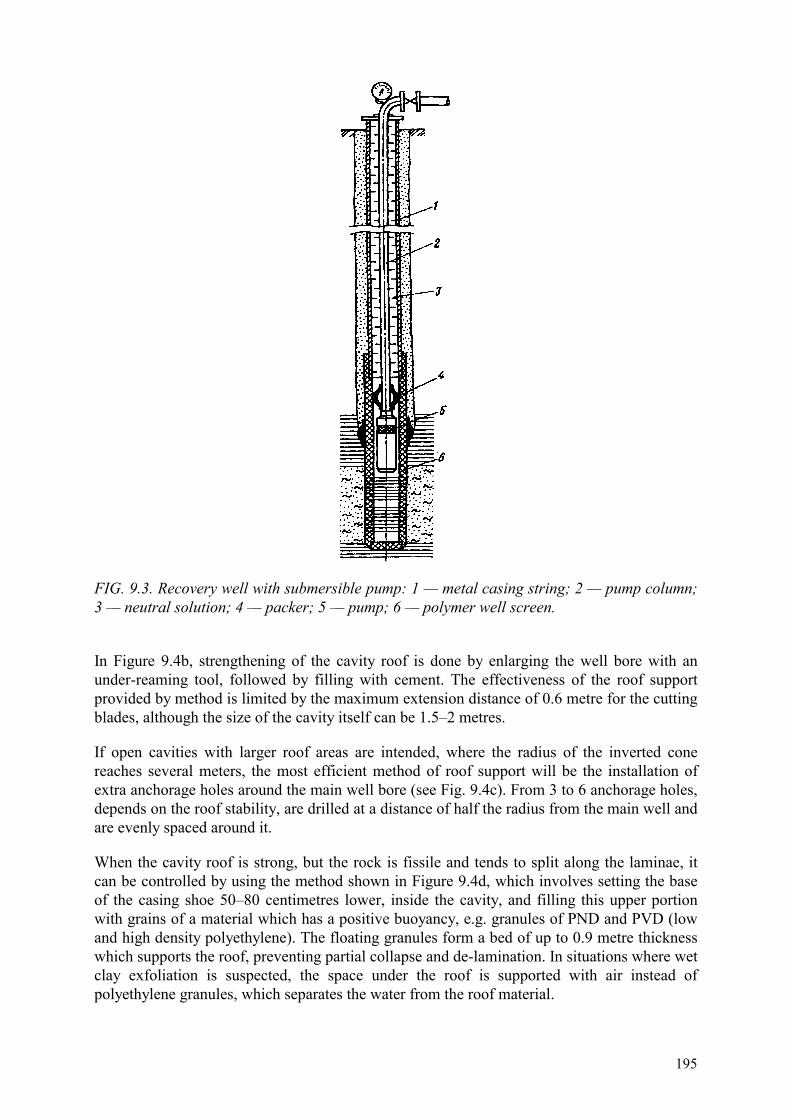
195
FIG. 9.3. Recovery well with submersible pump: 1 — metal casing string; 2 — pump column; 3 — neutral solution; 4 — packer; 5 — pump; 6 — polymer well screen.
In Figure 9.4b, strengthening of the cavity roof is done by enlarging the well bore with an under-reaming tool, followed by filling with cement. The effectiveness of the roof support provided by method is limited by the maximum extension distance of 0.6 metre for the cutting blades, although the size of the cavity itself can be 1.5–2 metres.
If open cavities with larger roof areas are intended, where the radius of the inverted cone reaches several meters, the most efficient method of roof support will be the installation of extra anchorage holes around the main well bore (see Fig. 9.4c). From 3 to 6 anchorage holes, depends on the roof stability, are drilled at a distance of half the radius from the main well and are evenly spaced around it.
When the cavity roof is strong, but the rock is fissile and tends to split along the laminae, it can be controlled by using the method shown in Figure 9.4d, which involves setting the base of the casing shoe 50–80 centimetres lower, inside the cavity, and filling this upper portion with grains of a material which has a positive buoyancy, e.g. granules of PND and PVD (low and high density polyethylene). The floating granules form a bed of up to 0.9 metre thickness which supports the roof, preventing partial collapse and de-lamination. In situations where wet clay exfoliation is suspected, the space under the roof is supported with air instead of polyethylene granules, which separates the water from the roof material.

196
FIG. 9.4. Methods for strengthening the roof of open hole wells: 1 — casing string; 2 — cement; 3 — water-receiving chamber; 4 — anchor well; 5 — gravel; 6 — anchor; 7 — hydrofractured fissures. Where quick sand is present, filling the cavity with large sized gravel or crushed rock should prevent running sand and the need to continually remove it by pumping (see Fig. 9.4 e), although this may cause the water intake capacity of the well to be reduced.
If the roof is stable and the cavity is cylindrical or shaped like a truncated cone, caving of the wall can be prevented by mechanically adjusted metallic plates or rods (see Fig. 9.4f).
There are often situations where significant thickness of unstable geological formations overlie the production layer containing the orebody. It may be possible to stabilize such material by injecting chemical compounds if the rocks are sufficiently permeable, or they could be supported by an artificial stable roof. An example of this method is shown in Figure 9.4g. After drilling a hole to the production layer and cementing the annular space behind the casing, the bottom sections of casing is perforated and a horizontal hydrofracture is created in the formation. The fissure is filled with cement and after it has cured the procedure is repeated at successively higher levels. The number of cemented fissures required will depend on the expected operational life of the well and the characteristics of the roof rock. The cement plug in the casing string is drilled out, the production layer is developed and a new water-receiving cavity created.
Unscreened wells, with their limited casing requirements, simplicity of design, high operational efficiency and long service life are advantageous for underground leaching where appropriate conditions exist in the orebody.
9.3.2. Injection well design
Recovery wells of the above design can be also used for injecting leaching solutions into the production layer, but using a single design for all operational wells may result in higher

197
installation costs. Because the number of injection wells is usually 2–4 times greater than the number of recovery wells, it would be beneficial to consider then as a separate group and modify their design to be suitable for injection of leaching solutions only. The greatest cost savings would be achieved by reducing the well diameter, but this is accompanied by loss of flexibility because it will no longer be possible to reverse solution flows by installing pumps in injection wells.
Operating ISL facilities use two designs of injection wells, those having only a single casing column and others which having an additional column of outer protection casing. The well casing and screen diameters should be adequate for injection of leaching solutions at the planned flow rates and to allow research and maintenance equipment to be inserted into the screened zone. The minimum diameter necessary to achieve this is usually 0.05 metre.
The construction material for injection wells should be able to withstand both the external compressive load and the internal injection. It is important that the joints between all casing sections are completely sealed.
Leaching solutions can be injected through the types of wells shown in Figures 9.1, 9.2 and 9.4. The injection efficiency can be increased by directly feeding the leaching solutions into the screened zone with internal injection tubing. This technique tends to reduce plugging of the screen because any free gas and air will escape from the production layer through the space between the tube walls. 9.3.3. Design of observation wells
The design parameters (column diameter, screen type, etc.) of observation wells are determined by the nature of the investigations to be carried out, their frequency and the expected operational life.
The depth of the observation wells are related to the depth of aquifer or productive layer being investigated. The well screen can be installed in the following ways, but can only be completed in one zone at a time:
(1) in aquifers overlying or underlying the production layer, to detect any unwanted vertical migration of leaching solutions;
(2) in the same aquifer as, but above and below the production layer to monitor the dispersion of leaching solutions;
(3) inside the production layer, to provide information on uranium recovery during leaching.
The choice of the well design depends on the type of equipment available for these investigations. The simplest observation well is similar to an injection well with a single casing column and is constructed with the screen attached to the casing. A more complicated design of well for studying several layers simultaneously is shown in Figure 9.5. In the first of these illustrations (Fig. 9.5a), the well is equipped with three separate, but parallel casing columns. Each casing column has a screen positioned at various levels within a single production layer or in completely different aquifers. For easier mounting of the screen on the casing, the latter can be made of polymer hose with an internal diameter at least 0.05 metre.

198
FIG. 9.5. Observation well: a — with parallel casing strings; b — with concentric casing strings; c — one-column unit: 1 — casing strings; 2 — screen; 3 — surface casing seal; 4 — well column; 5 — packer; 6 — opening in screen; 7 — sampling column; 8 — spring valve. In the design shown in Figure 9.5b, the casing columns are arranged telescopically inside each other. Sampling is done separately from each screen by airlifting, with the compressed air passing through holes in the casing. The disadvantages of this design are complicated sealing of the annular casing spaces beneath the screens, the rapid increase in well diameter caused by multiple concentric casing columns and the impossibility of inserting instruments into the annular spaces.
The well design shown in Figure 9.5c includes a casing string with screen holes covered from the inside with a spring-loaded conical plug which allows simultaneous sampling of each zone of interest. An inner tubing column, which is inserted after the casing column has been installed, is used for later hydrological investigations. The bottom of the tubing is wider, so that it activates the plug springs and opens the holes in the casing, allowing fluids to enter the well. The fluid sample is collected from the well either by a baler or by airlifting, using an additional air hose inside the casing. By raising or lowering the inner tubing, the wider section can be used to open each spring plug in turn, while the others remain closed. The design is simple and inexpensive. It allows reliable sampling of multiple underground fluids and the ability to correctly measure water levels and heads.
The only difference between the observation well shown in Figure 9.5b and an injection designed to operate in multiple layered ore bodies, only by a mixer placed in the central casing column. When air is passed down the central column, the sampling is done from the upper zone of the production layer. When air is injected between the tubes through the central column, the sample is taken from the lower zone. The formation water head is taken as an average and is measured through the central column.
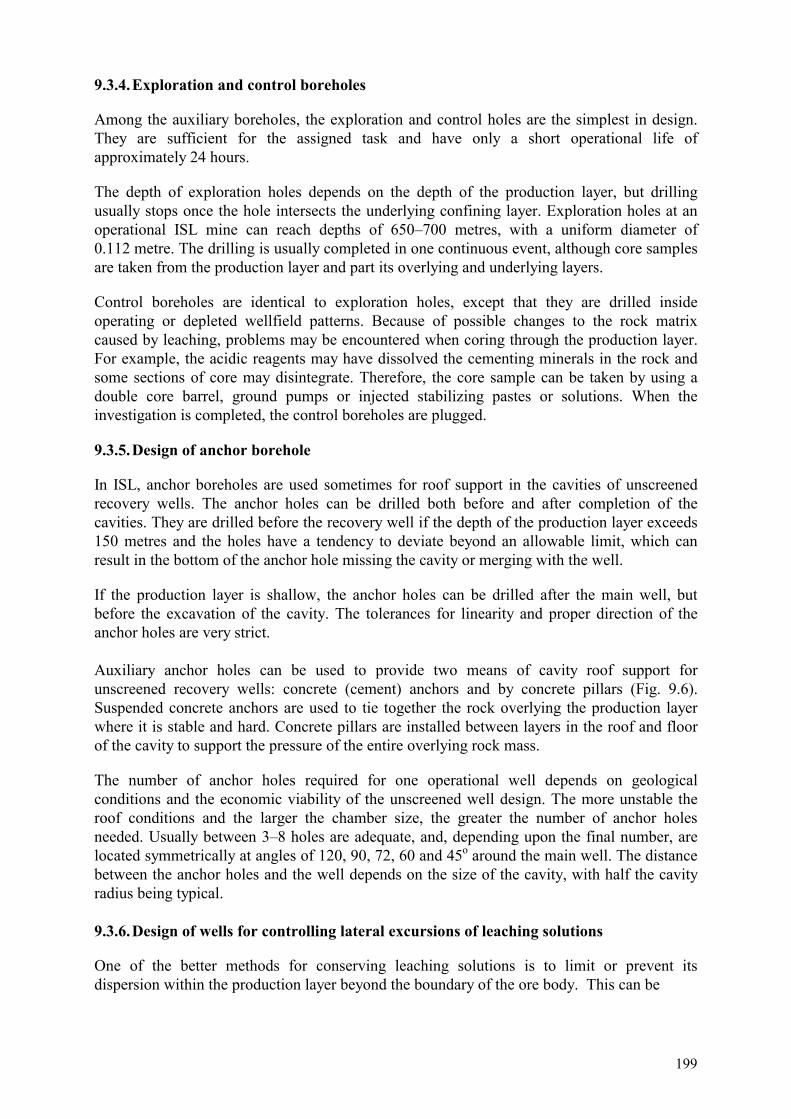
199
9.3.4. Exploration and control boreholes
Among the auxiliary boreholes, the exploration and control holes are the simplest in design. They are sufficient for the assigned task and have only a short operational life of approximately 24 hours.
The depth of exploration holes depends on the depth of the production layer, but drilling usually stops once the hole intersects the underlying confining layer. Exploration holes at an operational ISL mine can reach depths of 650–700 metres, with a uniform diameter of 0.112 metre. The drilling is usually completed in one continuous event, although core samples are taken from the production layer and part its overlying and underlying layers.
Control boreholes are identical to exploration holes, except that they are drilled inside operating or depleted wellfield patterns. Because of possible changes to the rock matrix caused by leaching, problems may be encountered when coring through the production layer. For example, the acidic reagents may have dissolved the cementing minerals in the rock and some sections of core may disintegrate. Therefore, the core sample can be taken by using a double core barrel, ground pumps or injected stabilizing pastes or solutions. When the investigation is completed, the control boreholes are plugged.
9.3.5. Design of anchor borehole
In ISL, anchor boreholes are used sometimes for roof support in the cavities of unscreened recovery wells. The anchor holes can be drilled both before and after completion of the cavities. They are drilled before the recovery well if the depth of the production layer exceeds 150 metres and the holes have a tendency to deviate beyond an allowable limit, which can result in the bottom of the anchor hole missing the cavity or merging with the well.
If the production layer is shallow, the anchor holes can be drilled after the main well, but before the excavation of the cavity. The tolerances for linearity and proper direction of the anchor holes are very strict. Auxiliary anchor holes can be used to provide two means of cavity roof support for unscreened recovery wells: concrete (cement) anchors and by concrete pillars (Fig. 9.6). Suspended concrete anchors are used to tie together the rock overlying the production layer where it is stable and hard. Concrete pillars are installed between layers in the roof and floor of the cavity to support the pressure of the entire overlying rock mass.
The number of anchor holes required for one operational well depends on geological conditions and the economic viability of the unscreened well design. The more unstable the roof conditions and the larger the chamber size, the greater the number of anchor holes needed. Usually between 3–8 holes are adequate, and, depending upon the final number, are located symmetrically at angles of 120, 90, 72, 60 and 45o around the main well. The distance between the anchor holes and the well depends on the size of the cavity, with half the cavity radius being typical. 9.3.6. Design of wells for controlling lateral excursions of leaching solutions
One of the better methods for conserving leaching solutions is to limit or prevent its dispersion within the production layer beyond the boundary of the ore body. This can be
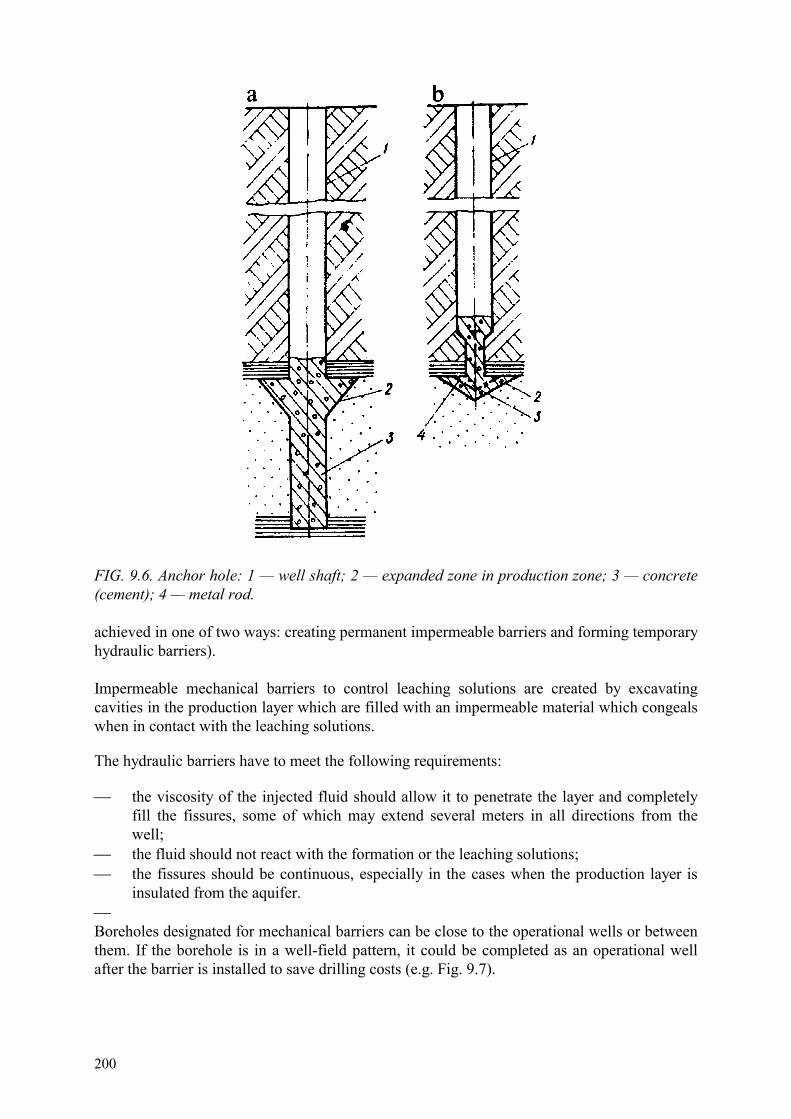
200
FIG. 9.6. Anchor hole: 1 — well shaft; 2 — expanded zone in production zone; 3 — concrete (cement); 4 — metal rod. achieved in one of two ways: creating permanent impermeable barriers and forming temporary hydraulic barriers). Impermeable mechanical barriers to control leaching solutions are created by excavating cavities in the production layer which are filled with an impermeable material which congeals when in contact with the leaching solutions.
The hydraulic barriers have to meet the following requirements:
�� the viscosity of the injected fluid should allow it to penetrate the layer and completely fill the fissures, some of which may extend several meters in all directions from the well;
�� the fluid should not react with the formation or the leaching solutions; �� the fissures should be continuous, especially in the cases when the production layer is
insulated from the aquifer. �� Boreholes designated for mechanical barriers can be close to the operational wells or between them. If the borehole is in a well-field pattern, it could be completed as an operational well after the barrier is installed to save drilling costs (e.g. Fig. 9.7).
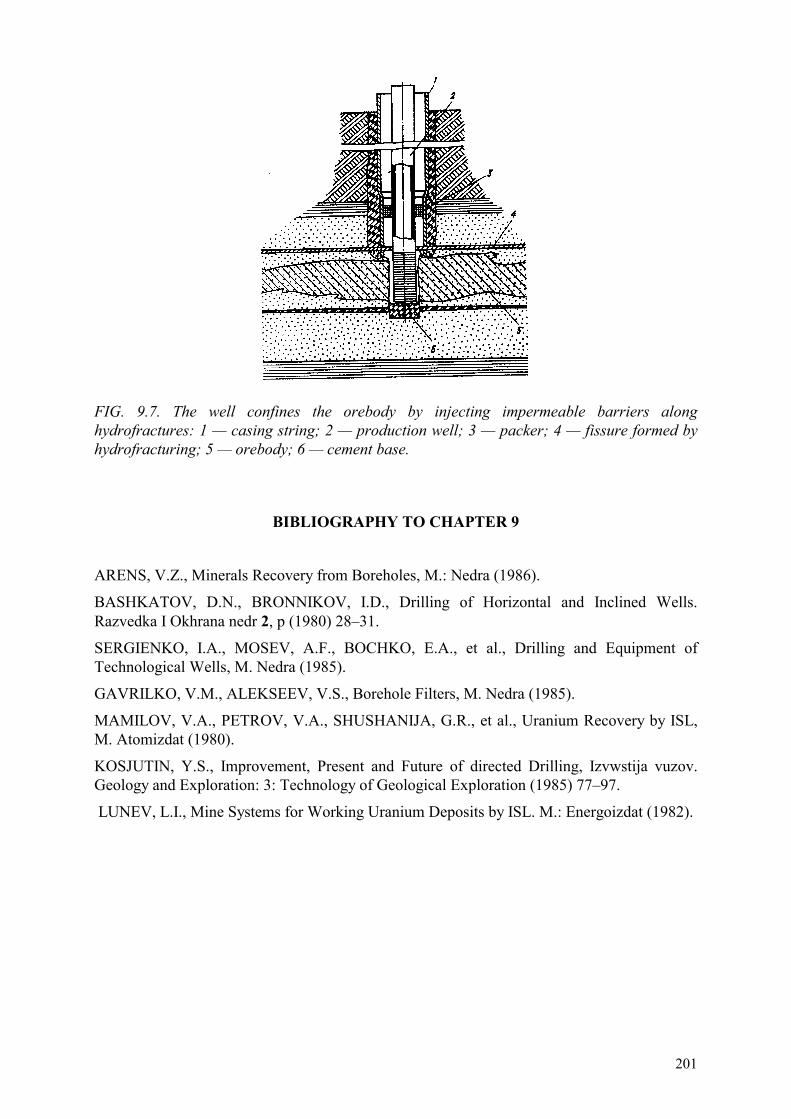
201
FIG. 9.7. The well confines the orebody by injecting impermeable barriers along hydrofractures: 1 — casing string; 2 — production well; 3 — packer; 4 — fissure formed by hydrofracturing; 5 — orebody; 6 — cement base.
BIBLIOGRAPHY TO CHAPTER 9
ARENS, V.Z., Minerals Recovery from Boreholes, M.: Nedra (1986).
BASHKATOV, D.N., BRONNIKOV, I.D., Drilling of Horizontal and Inclined Wells. Razvedka I Okhrana nedr 2, p (1980) 28–31.
SERGIENKO, I.A., MOSEV, A.F., BOCHKO, E.A., et al., Drilling and Equipment of Technological Wells, M. Nedra (1985).
GAVRILKO, V.M., ALEKSEEV, V.S., Borehole Filters, M. Nedra (1985).
MAMILOV, V.A., PETROV, V.A., SHUSHANIJA, G.R., et al., Uranium Recovery by ISL, M. Atomizdat (1980).
KOSJUTIN, Y.S., Improvement, Present and Future of directed Drilling, Izvwstija vuzov. Geology and Exploration: 3: Technology of Geological Exploration (1985) 77–97.
LUNEV, L.I., Mine Systems for Working Uranium Deposits by ISL. M.: Energoizdat (1982).

203
10. ISL WELL OPERATIONS 10.1. METHODS FOR PUMPING ISL PRODUCTION SOLUTIONS TO THE SURFACE
Production solutions in ISL practice are hoisted by either airlift or submersible electric pumps. The choice of the method is determined by hydrogeological conditions of the deposit (static and dynamic water level, flow properties, ore host rock character), by the type of reagents used for leaching (acid, alkaline), as well as by the engineering and economic parameters of production costs per cubic meter of recovered solution.
In contrast to standard practice in the USA, where submersible electric pumps are used, airlifts find broad application in the ISL facilities in Europe and Central Asia due to several advantages. Some of these are the capability of pumping solutions with large quantities of suspended solids, handling acid, the ability to operate at elevated temperatures and the relative simplicity of maintenance. An airlift consists of sets of pipes: one feeding in air and the other for lifting solutions, as well as an educter and a compressor.
There are two pipe installation systems for airlift: with concentric and parallel mounting for air and recovered solution tubes. In the concentric system, the operational column (casing string) of the well serves for lifting solutions while an airlift with parallel tubes is used in large diameter wells. The immersion depth, air and solution pipe diameter, the feed rate, and operational pressure are given in Table 10.1. When pumping solutions, the airlift efficiency is controlled by increasing or decreasing the quantity of air fed into the well, or by the depth of immersion of the eductor.
The electric submersible pumps used for ISL have certain advantages in comparison with airlifts: the absence of compressors and air conduits in the leaching field, and more uniform operating conditions in the vicinity of the wellscreen. The stable performance of the ISL recovery wells equipped with submersible pumps largely depends on the well construction. Pumped recovery wells have to meet the following requirements:
�� the well casing and pipe fittings must be corrosion resistant to 0.1-10% sulphuric acid solutions;
�� the temperature of the pumped solution should not exceed +25 to 35oC; �� total dissolved solids (TDS) in the solution should not exceed 70-80g/L; �� the well axis should remain straight; deviation from a straight line is not permitted; �� the well yield should correspond to the operational capacity of the pump; the content of
suspended solids in the solution should not exceed 0.1g/L (or in only limited cases up to 1g/L).
The major disadvantages of submersible pumps are the rapid wear of some parts due to attrition by mechanical impurities and the inability of electric motors to operate at high temperatures.
Installation of the pump into a well is accomplished by a crane (for steel tubing) or special hoisting devices (for plastic tubing).

TAB
LE 1
0.1.
PA
RA
MET
ERS
FOR
SO
LUTI
ON
REC
OV
ERY
BY
AIR
LIF
T
Dep
th ra
tio o
f dyn
amic
leve
l and
imm
ersi
on o
f mix
er
R
ecom
men
ded
tube
C
ondi
tions
for
1
: 2.5
1 : 2
1 : 1
.66
diam
eter
vrs
. air
flow
rate
airli
ft
Dyn
amic
leve
l, m
(dep
th b
elow
wel
l hea
d)
conc
entri
c pa
ralle
l
oper
atio
n 10
20
30
40
50
20
30
40
50
60
45
55
70
so
lutio
n ai
r so
lutio n
air
Imm
ersi
on d
epth
fr
om fl
ow-o
ut le
vel,
m: f
or so
lutio
n tu
be
mix
er
25
28
50
53
75
278
10
0 10
3
12
5 12
8
40
43
60
63
80
83
10
0 10
3
12
0 12
3
74
.7
77.7
91
.3
94.3
11
6.2
119.
2
Ope
ratin
g pr
essu
re in
ai
r tub
e at
mix
er,
Mpa
0.15
0.
3 0.
45
0.6
0.75
0.2
0.3
0.4
0.5
0.5
0.3
0.36
0.
46
Spec
ific
air f
low
rate
, m
3 /min
3 3.
81
4.66
5.
41
6.15
5.
43
6.46
7.
5 8.
35
9.15
11
.76
13.2
14
.61
Air
flow
rate
, m
3 /min
, for
lifti
ng
wat
er, m
3 /hr:
- 5
- 10
- 20
- 30
0.
25
0.5 1 1.5
0.
32
0.63
1.
26
1.9
0.
38
0.75
1.
5 2.
3
0.
42
0.84
1.
7 2.
25
0.5 1 2 3
0.
43
0.86
1.
72
2.6
0.
53
1.1
2.12
3.
2
0.
63
1.26
2.
52
3.8
0.
68
1.36
2.
7 4
0.7
1.6
3.35
4.
2
0.
97
1.95
3.
9 5.
84
1.1
2.16
4.
32
6.48
1.
25
2.5 5 7.5
40
50
80
100
15
20
23
25
32
40
70
70
15
20
20
20
204
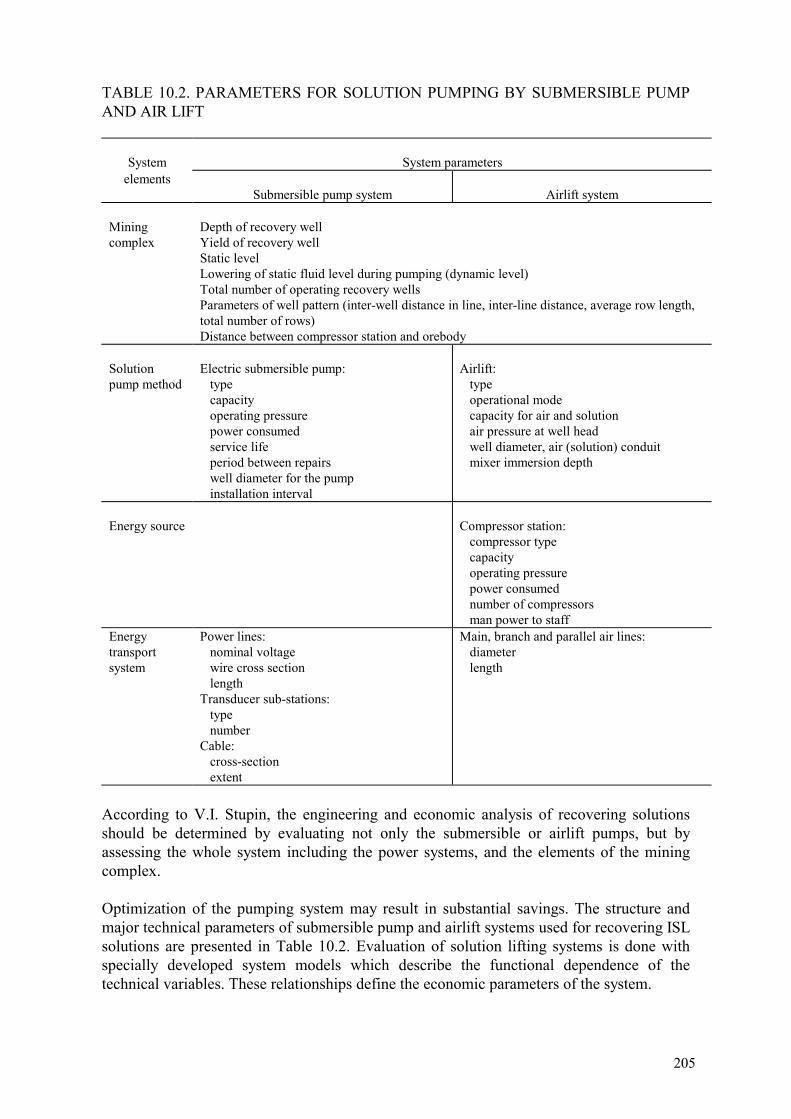
205
TABLE 10.2. PARAMETERS FOR SOLUTION PUMPING BY SUBMERSIBLE PUMP AND AIR LIFT
System
System parameters
elements Submersible pump system
Airlift system
Mining complex
Depth of recovery well Yield of recovery well Static level Lowering of static fluid level during pumping (dynamic level) Total number of operating recovery wells Parameters of well pattern (inter-well distance in line, inter-line distance, average row length, total number of rows) Distance between compressor station and orebody
Solution pump method
Electric submersible pump: type capacity operating pressure power consumed service life period between repairs well diameter for the pump installation interval
Airlift: type operational mode capacity for air and solution air pressure at well head well diameter, air (solution) conduit mixer immersion depth
Energy source
Compressor station: compressor type capacity operating pressure power consumed number of compressors man power to staff
Energy transport system
Power lines: nominal voltage wire cross section length Transducer sub-stations: type number Cable: cross-section extent
Main, branch and parallel air lines: diameter length
According to V.I. Stupin, the engineering and economic analysis of recovering solutions should be determined by evaluating not only the submersible or airlift pumps, but by assessing the whole system including the power systems, and the elements of the mining complex. Optimization of the pumping system may result in substantial savings. The structure and major technical parameters of submersible pump and airlift systems used for recovering ISL solutions are presented in Table 10.2. Evaluation of solution lifting systems is done with specially developed system models which describe the functional dependence of the technical variables. These relationships define the economic parameters of the system.

206
In the pumping system model there are electric pumps, and two types of airlift systems:
�� with air fed through the central hose and solution rising through the annulus between the hose and well casing;
�� with air fed through the annulus between the central hose and casing, and the solution moving up through the central hose.
There are also two operational modes with compressors:
�� when the start-up and normal performance of the airlift are provided by one compressor;
�� when the start-up is provided using a high-pressure compressor and the normal operations are carried out by a second, lower pressure operational compressor.
Calculations performed within the model are:
(a) determining the following technical parameters:
�� Type of solution pump based on the given mining complex parameters; �� Preferred energy source based on the type of pumping and the mining complex
parameters; �� The energy transmission system necessary to connect the preferred energy source with
the desired pumping system.
(b) determining economic parameters of the system (final result — annual costs for solution-pumping system) according to the calculated parameters.
The model allows the user to determine the parameters of submersible and airlift pump systems using the design parameters of the mining complex. The most effective economic system is then selected based on the comparison of results. The airlift requirements are calculated on the basis of estimated parameters: type, standard size of the casing and air (solution) conduit, solution head over the eductor, and air pressure at the well head.
Utilization of data obtained by models requires optimizing calculations, especially for the airlift system. This is related to the fact that the airlift calculation requires fixing as constant some parameters that in principle are variable. Solving the problem is made possible by testing several combinations of selected airlift parameters and choosing the most profitable of them. Since the method requires a lot of work, the calculation can be accelerated by computer analysis. The analysis of technical-economical parameters has shown that small deposits can be successfully leached using one method for solution pumping. Deposits with a large area may be mined using two pumping methods, e.g. using both submersible and airlift pumps.
10.2. LEACH-FIELD WELL PERFORMANCE
Injection and recovery well performance is characterized by two coefficients — utilization factor (Cu) and reliability coefficient (Cr).
The utilization factor, Cu, measures the use of the well during the life of the operation. It denotes the viability of the well arrangement and affects the operational cost in exploitation
207
of a deposit or an orebody. The utilization factor is defined as the ratio of the block leaching time Tb divided by the total time of that well being operated Tw, so Cu = Tb/Tw. Under various conditions, with block leaching time from 1 to 5 years and the wells equipped with metal and plastic tubes, the utilization factor varies across a broad range of values. Thus, with a block leaching time of 1, 2 and 3 years and the service life of the injection and recovery wells being 8 years, the Cu values are 0.125; 0.25; 0.375. The restoration of the leached-out productive layer will correspondingly increase the Cu value.
For the observation wells the utilization factor will reach 0.6-0.8. They have a longer operational life in comparison with the injection and recovery wells due to continuing observation in the leached block.
The most reasonable arrangement of the ISL operation is when the well service life and operational time are equal. Under these conditions Cu equals 1.
In ISL facilities using acidic leaching solution, the injection and recovery wells are generally equipped with polyethylene tubes and the service life of the wells is from 1 to 3 years. The ratio of the well life and the leaching time of a block is characterized by the well reliability coefficient Cr = Tw/Tb, which should be greater than 1. In common practice, the wells begin to fail in the first or second year of the block operation, therefore their reliability coefficient is 0.5-0.8. During the life of the ISL operation, the facilities tested various designs for injection and recovery wells with various degrees of success. The structural support of the wells was done with stainless steel, polyethylene, polypropylene, plywood, fiberglass, and metalloplastic tubes. The wells were also equipped with screens of various designs (slotted, perforated, netted, wire, disk with gravel ring and without).
The injection and recovery well performance in the ISL facilities was analyzed by studying the condition of disconnected, failed wells. The analysis took into account their design, operation period, designation, hydraulic sealing type, and subsurface problems. The major causes of well damage were: casing integrity failure, screen breakage, loss of well capacity beyond repair, absence of adequate hydraulic sealing resulting in contamination of the rock mass and dilution of leaching solutions.
The examination of a number of 220-250 metres deep wells at various facilities has shown that injection wells were failing in a great number. The main reason for their failure was casing integrity damage or a complete loss of productivity. On the whole, 50% of the injection wells failed during the third year of their operation. The failure rate of the recovery wells averaged about 20%.
Well failures are related to leaching conditions (the recovery or injection mode and productivity), the well design and completion. Wells used to recycle recovery and injection solutions, as well as injection wells operating under excessive pressure, fail during the first or second year of operation.
Wells grouted with a gel/cement paste or clay solution doped with polyacrylamide, may fail during start-up as the result of losing casing integrity at the bottom of the airlift pipe. When using clay grout to fill the annulus around the connection between a screen and a casing and in the absence of hydraulic sealing, the casing may be damaged and lose tightness at the connection, especially in the lower part of the sand and sandy-clayey rocks.
208
The most reliable performance is achieved in wells where the casing string has been cemented to the surface. Good quality grouting considerably increases the well service life. Thus, geophysical investigations conducted in the wells after seven years of their operation have revealed no breaks in the casing connections. The residual thermal deformations of the tubes had no effect on the casing string and performance of the wells.
10.3. CAUSES OF REDUCED INJECTION WELL EFFICIENCY
Effectiveness of ISL operations, in many cases, depends on the condition of the well screens in injection wells which controls ability to accept fluid. To maintain the design flow rate of leaching solutions under stable conditions, one has to either apply additional pressure or interrupt the operation while cleaning the well. After cleaning, the well efficiency initially reaches the design value and then begins to again decrease rapidly.
The reason for reduced injection well intake (injectivity) is the decrease of permeability in the screen zone. This permeability decrease is caused by various physical and chemical phenomena taking place during the injection of leaching solution into the formation. When the leaching solution interacts with the solid and liquid phases of the productive horizon, chemical residues are formed in the pores, thus changing the physical properties (density, viscosity, etc.) of the solution in the formation.
Formation water can have quite different compositions and concentrations. Nearly all chemical elements are present in the formation water in the form of non-dissociated molecules. There are also dissolved gases (O2, CO2, H2, CH4, etc.) in the groundwater which can easily be released from solution when physical and chemical conditions change.
Many compounds in the formation water are unstable and, depending on pH and Eh, may either remain in a dissolved state or precipitate. For instance, aluminum hydroxide becomes insoluble and precipitates at pH = 4-9; bivalent iron is insoluble at pH > 7 and trivalent iron precipitates at pH > 3-4. The solubility of oxygen noticeably increases in acid and alkaline water. The minerals of the silica earth group, aluminum and iron hydroxides, precipitate from solutions as colloid particles forming gels, which may reduce the rock porosity and permeability.
Some carbonate bearing rock present in the productive layer may react to alter rock permeability. Calcium carbonate, interacting with diluted sulphuric acid, forms calcium sulphate.
CaCO3 + H2SO4 � CaSO4 + H2O + CO2
Ca3 (PO4)2 + 3 H2SO4 � 2 H3PO4 + 3 CaSO4.
When gypsum forms, it may precipitate and plug the pores and microfissures in the rock.
Accumulation of residue solids depends on mineralogical composition of rocks, the character and concentration of the leaching solution, as well as the intensity of interaction between the injected solution and the natural water and rock. Investigations by S.B. Markelov, M.A. Kashe and I.S. Osmolovski were conducted on a quantitative evaluation of the permeability changes in the productive rock layer occurring in the injection well screen zone during its operation. They verified that the decrease of the permeability takes place at the onset of leaching — during the acidification of the formation. The solid phase yields to the solution large quantities of aluminum and iron ions capable of forming insoluble
209
compounds when the pH increases (pH > 3). These compounds may then plug the pore space of the producing formation.
The processes of chemical interaction between the solution and enclosing rock, taking place at the acidification front border, are accompanied by release of gas (primarily CO2). This may raise the piezometric level in the aquifer by up to 10 metres. This type of gas blockage is temporary, and is practically absent during later stages of the leaching process.
Observation of the piezometric level in the formation during operational testing has shown that the dynamic levels rose by 10-26 metres, even with low flow rates of the injection wells (below 1m3/hr). However, at a distance of 3-4 metres from the wells the level increased by only one metre. This pressure difference may be explained by the plugging of the formation in the near vicinity of the well screen zone. The calculation change in the hydraulic resistance of the injection wells before and during leaching has shown a increase from 89m to 410-706m. The permeability of the layer also decreases due to the injection of various suspended solid impurities which plug the pores. These solids are usually delivered in recirculating leaching solutions. They sometimes form as the result of dust falling in the settling ponds, and then enter the production solutions of the processing facility.
The plugging caused by these particles can penetrate for long distances from the well into the formation. This makes it difficult to restore the initial permeability of the layer. The plugging of pores by particulate material makes the dynamic level rise in the well, in some cases causing the level of the leaching solution to rise to the surface.
When examining the conditions in the vicinity of the well screen zone, one should consider that the degree of plugging by suspended particles is controlled by the interpore canal diameter. This varies within the range of 0.0001-0.25mm for sedimentary deposits. It is possible to relate plugging of the suspended particles deposited in the productive layer pores of average diameter Di, to the average diameter of the suspended particles di:
�i = Di / di
The pore plugging takes place at �i < 5 to 6; at �i > 5 to 6. The particles usually are passed through the porous medium. The suspension velocity should be approximately equal to the flow rate of the solution.
Long term experience in ISL exploitation has shown that the concentration of physically suspended particles in the leaching solutions vary from 30-80mg/L. The monthly volume of the suspensions introduced into the screened layer can reach 90kg, at the injection flow rate 0.0007m3/hr. This is equal to the volume of a 10 meter high leaching column with the internal diameter of 74mm.
The filling of the injection well with suspended solids contained in the leaching solution is presented in Table 10.3. The plug length is calculated for a well equipped with a disc screen which operated for one month. The table makes it evident that at the plugging of such intensity the well intake decreases after the first 15 days of operation. This was confirmed by field investigation. A large number of wells under simultaneous operation and proper stability of the injection/recovery process do not allow the operator to carry out the maintenance (restoration of the design flow rate) of the injection wells during such a short period of operation. It would require arranging a substantial maintenance service at the facility, in addition to shutting down a number of wells, and excluding them from the leaching process.

210
TABLE 10.3. ACCUMULATION OF SUSPENDED SOLIDS IN WELL BORES AT VARIOUS FLOW RATES
Residue quantity, mg/L
Plug length in filtration zone, cm, at injection Q, m3/hr
2 3 4 5
10 20 30 40 50 60 70 80
163 326 489 652 815 978 1141 1304
245 490 735 980
1225 1470 1715 1960
327 654 981
1208 1535 1962 2289 2616
409 918
1227 1636 2045 2454 2863 3272
The most practical presentation measure here would be a preliminary cleaning (filtering) of the leaching solutions after the acidification circuit or before reinjecting the fluid. This will stabilize the ISL process and, in the final result, will reduce the production cost.
The layer around the screen may also become less permeable due to increased hydrostatic pressure on the rock surrounding the screen. This additional pressure is caused by the injected leaching solution. The ensuing pressure can exceed the natural piezometric level by several tens of meters, depending on the collecting properties of the layer, injection flow rate, and density of the leaching solution. Under the influence of this higher head, the rock skeleton becomes deformed and consequently compacted, decreasing the porosity. In addition, the permeability can decrease rapidly as clayey particles within the rock begin to swell (montmorillonite). This clay swelling prevents the solution movement and builds a water-impermeable barrier. Further, certain components of the rock are dissolved by the diluted sulphuric acid, often creating colloids. Colloid solutions and gel structures additionally resist the flow of injected solutions, leading to an intense decrease of permeability of rocks (sometimes reducing the original values by a factor of 10 to 20).
Another reason for reduced injectivity is the presence of gases and air in the pore space of the rock, especially in the zone near the screens. In this case the resistance to the solution flow increases and the level in the operational column rises to the well mouth. Such conditions are also characteristic for the case of injecting water in the aquifer when the well productivity decreases by 4-6 times within a month. Plugging by gas, resulting from carbon dioxide and hydrogen sulphide liberated in the interaction of an acid leaching solution and carbonate constituents of the rock, is confined to the initial stage of the deposit exploitation, the acidification of the production layer.
The main reason for gas plugging is that the leaching solution contains dissolved air. The most saturation comes from oxygen, which is released not only from the air, but also can be introduced as a strong oxidant. The oxygen getting into the productive layer together with the solution affects acidification, causes intensive corrosion, and leads to precipitation in the screened zone, which leads to plugging and to a lower recovery rate.
211
Besides air and gases in complete saturation, there are small bubbles, which cannot dissolve in the short pipelines and at the high solution flow rate, and therefore get into the productive layer. The bubbles can dissolve at high formation water heads, but new bubbles arrive and develop resistance to the solution current. An especially intensive invasion of air bubbles takes place at an unrestricted pouring of the solution into the well at the surface.
The well injectivity can also be affected by sand trapped in the screen, which tends to increase at the period of formation acidification. Some sand can stay in the screen after the pumping at the starting period prior to the operation.
The formation sand can get into the injection well screen zone if the injection flow rate of the solution is low (0.5-1.2 litre per second) and the screen length and its flow capacity is more than twice the actual flow, or because of the wrong screen type and its parameters (size and shape of the holes or slots too large). The plugging of the screen with sand can be explained by the fact that while the leaching solution is being injected into the layer, some minerals and cementing in the sand adjacent to the screen are dissolved. The washed, clean, fine-grain sand near the screen, meeting no resistance from the screen flow pressure, caves into the screen voids and fills it in the course of time. While filling the lower part of the screen, the leaching solution can get only through the upper screen part, which results in non-uniform flow in the orebody and leaves unleached horizons in the injection wells area.
In practice, it is difficult to prevent plugging by gas in injection wells, since it would be difficult to remove gas from the formation and especially from the solution. Still, it is possible to reduce the plugging and raise the well productivity by applying the following measures:
�� decrease the air (gases) present in the solutions by degassing the solutions in a vacuum;
�� when pumping the solutions by centrifugal pumps, one should choose the smallest suction height and pumps with the least cavitation;
�� if the injection well is operated with pressure at the wellhead, use of an automatic gas release valve on the well is recommended;
�� when feeding the solutions by pouring, one could prevent the solution from being saturated with air and release gases ensuing from the interaction of the solutions with rocks by way of an extra column (hose or small pipe) inserted into the casing. The lower end of this extra column is inserted into the screen zone in the upper part. It releases the entrained gases through the upper part of the screen and the intertube space. The spills of gas/fluid mixture can be checked by dissectors dividing air and solution, installed in an extra solution-feeding column placed higher than the dynamic level. The extra column diameter is chosen such that it could provide continuous feeding of the solution. At a well flow rate of 1.4 l/sec. the most reasonable measure would be the application of polyethylene hoses, diameter 32mm, as additional columns;
�� removing sand from the screen and mechanical suspensions from the screened zone of the well with water or leaching solutions by inserting an additional hose into the sand plug and washing it out under the pressure of water or solution exceeding the operational heads of the leaching solution. The solid residues are lifted from the space between the tubes and collected;
212
�� the most efficient method for cleaning the plugging products from the wells will be alternating injection with a short recovery mode. In order to save time for the re-installation, the additional hose is equipped with a eductor composed of tab valves. When pumping solutions from the well, the hose is disconnected from the main line, and the well head is equipped with a sealed upper structure and outlet duct delivering compressed air to the eductor through the annular space. The solution and plug material are lifted through the solution-feeding hose, the solids collected, and disposed.
10.4. FACTORS REDUCING THE RECOVERY WELLS PRODUCTIVITY
The main reason the recovery wells reduce their capacity is the mechanical and chemical plugging of their screens and screen zone. The common plugging material is sand and products of corrosion. The screen is being plugged by suspended solids during the entire period of well operation. Still, a portion of the suspension is lifted with the solution and the rest, consisting of larger particles, precipitates and accumulates in the settler and then in the screened zone. This is explained by the fact that at certain flow rates of pumping, the velocity of the liquid inside the screen is not uniform throughout the screen length, decreasing towards the lower part. At the values below the free fall velocity, the particles will settle forming a sand plug that covers a part of the screen zone.
Sand accumulation in the recovery wells is not uniform and depends on the well productivity, pump type, screen design and its parameters, particle-size distribution of the sand in the productive layer, mineralogical composition of the rock, type of leaching solution and concentration, and the planned leaching stages.
The amount of sand pumped from the formation will be the least at a constant discharge yield. There will be almost no sand evacuation, and it will be present in the pumped solution in quantities suitable for various solution pump types. Beyond the screened contour, the sand forms rigid frames due to adhesion force and its geometrical shape. Microscopic voids are formed at each screen slot, fringed by the sand frame. The screen void collects only the smallest particles transferred from the farthest rock layers as the result of particle migration and flushing.
The wells equipped with electrical submersible pumps have the most reliable and stable performance. The recovery wells are operated with pumps of various brands. The airlift pumping of solutions does not produce a constant yield due to the changing water level in the well and flow rates in the screen. The production of sand usually has no effect on the airlift performance and it can operate with solutions containing as much as 30% solids.
Fluctuations in the solution pumping rate affects the sand frame around the screen. Even a small change of the discharge rate causes caving of the microvoids and destruction of the sand frame. This is accompanied by a redistribution of sand and sand transfer into the screen void. After some time, a cavern is formed in the upper part of the screen zone, growing as the sand flows into the well. If the pumping rate is not high, most of the solution comes from the screen portion within the cavern zone, while the lower part of the screen fills with sand.

213
The operating experience with electrical submersible pumps shows that the largest movement of the formation sand takes place very soon after the pump starts. The sand flow into the well results from the initial pressure depression in the screen zone immediately after a rapid (30-55 seconds) water level drop in the casing string at the pump start. At this moment, i.e. the filling of the solution pumping pipe, the pump capacity is the greatest. The sudden drop of the liquid level in the casing raises the flow rate of the liquid coming into the screen, resulting in the flow of fine sand into the well. The experiments show that the solution begins to enter the well about 1 to 3 minutes after the pump start-up and liquid appears at the surface. It means that sand can accumulate in the well for 1 to 3 minutes after the pump starts.
The analysis of the recovery wells performance with pumps has shown that submersible pump failure mainly result from well construction quality, pump type, and their improper handling. In most cases the pumps had failed in the wells with unacceptably high sand concentrations in solutions due to an improper choice of screen design and in the wells where the well curved or drifted more than 1o in the vertical per 100 metres of depth.
The major submersible pumps failures are the electric motor starter sleeve, spot corrosion of the starter sleeve, electric arc break-down of the starter sleeve, pseudo-release of the protection system, jammed rotor in the starter sleeve, and the electrical motor phase break.
10.5. CAUSES OF LEACH-FIELD WELL FAILURE
Leach-field wells may fail both in the process of construction and during operation for the following reasons:
(1) Poor drilling practices and improper flushing of the productive layer: The wells fail as the result of accidents, shrinkage of the drillhole diameter, or excessive horizontal drift of the well shaft causing the screen or casing to break. Flushing of the productive layer without taking core samples and without using geophysical investigations on the location of ore bodies leads to a wrong position of the screen in the productive layer section and a wrong position of the connecting sleeve.
(2) Wrong choice of hydrologic isolation material (casing annulus cement) and inappropriate methods for installing the material: The isolation material fails which results in leaks of leaching solution. This problem can lead to contamination of the overlying and underlying aquifers.
(3) Breakage in the casing or screen in the process of assembling and cementing of the well, or a mismatch between the screen opening size and the formation particle size.
(4) Long idle period between the well construction and its start-up. It may be impossible to remove the clay crust that becomes harder in the course of time. For instance, when the injection wells were equipped with casing made of low density polyethylene with wall thickness 11.5mm and outer diameter 110mm, 20% of drilled and installed wells had failed mainly due to the tube compression during their start-up period. If the wells are operated by airlift, unplugging of the productive layer requires lowering the level in the column, so that the formation pressure of the solution would destroy the clay crust. The level difference inside the column and beyond it can reach 60-100 metres causing compression of the casing by the outside hydraulic force.

214
The most common reason of the well failure is the break of the casing integrity. The construction and operation experience indicates that 60% of the total failures had been the breakage of non-metallic casing.
In the long-term operation of wells, the non-metallic casing strings or wells can fail from age and normal use. The wear and tear on casing strings happens in the process of cleaning and work over due to attrition of the pipe by hoisting and lowering tools and instruments. The casing strings undergo the most bending stress in the well by compression and stretching. The suspended solids contained in the solutions abrades the casing strings regardless of the material selected.
The low pH value of the solution in the well also shortens the pipe life, especially in pipes with no resistance to corrosion. Oxygen, carbon dioxide and other gases soluble in water strongly increase the rate of metal corrosion. The most active and dangerous is oxygen, causing corrosion even at low concentrations. Higher temperatures accelerate the corrosion of materials.
Wear by corrosion also depends on the solution flow rate in the well. The higher the liquid flow rate, the greater is the corrosion activity with the tendency to reach very high rates if the liquid contains suspended particles of sand or gas.
The following rules should be observed. They were developed specifically to reduce the wear and tear of the casing strings:
�� there should be no bending of the casing string in the well; the curvature of the well should not exceed pre-set values; the casing strings should be provided with centralizers; there should be proper clearance allowed between the casing string and the hole wall. Too much clearance allows the pipe to bend and too little makes it too hard to force the pipe down the well;
�� the lifting and descending operations in the casing strings should be done at lower speed; the tools and instruments should be provided with centralizers (protecting rings) made of a softer material than that of the casing;
�� flushing of the productive layer by wells reinforced with non-metal tubes requires the use of protective metallic columns inserted into a non-metal casing string;
�� fine suspended solids in the solutions should be avoided; slimes (clays) should be removed from the drilling solution using modern equipment such as settlers, cyclones, etc.;
�� the entering solution flow rates should be reduced by screens with lower permeability. The testing conducted on biplastic tubing used for well casing has revealed the following reasons of the failure:
�� break of polyethylene and fiberglass shells as well as distortion of tubes in manufacturing and casing installation;
�� disconnection of the sleeve and nipple from the tube during the casing string installation;
�� plugging of the screen holes with fiberglass shavings when cutting holes in fiberglass tubes.
The failure of wells equipped with polyethylene casing happens mostly due to a break of the casing, fracture of the casing, break of the connection seal, collapse of casing etc. during

215
assembly, cementation of casing strings or operational columns, or start-up operations. The casing is generally damaged by drilling tools inserted between the wall and casing string during grouting operations. When inserting a polyethylene column into a metallic one, the latter should have no sharp edges, which can damage the polyethylene casing during the descent. When the polyethylene column is to be lowered as an assembly fixed on the surface, one should bear in mind than the bend radius must not exceed the value recommended by the manufacturer for the given casing type.
The polyethylene casing and screens collapse most often during the casing string cementing, and as it was already mentioned, in the start-up period. The cementing of polyethylene columns depends on the density of the cementing solution and liquid inside the tubes. The greater the solutions density difference, the stronger the compression force on the tubes at the lowered level border. Experience has shown that the polyethylene column is most often squashed at the site where the tube has a defect (deviation from round cross section, smaller wall thickness, microfissures, etc.). The welded polyethylene tubes do not get squashed due to the hard welding ridge around the connection.
The wells equipped with polyethylene casing are strongly sensitive to the working temperature. The casing and its insulation should withstand seasonal temperature variations, and the thermal effect of the leaching reactions. The casing will deform lengthwise if the temperature of air, injected leaching solutions, or formation liquid changes rapidly. The deformations caused by the temperature change can result in cracking, leaks, and even breaks. The largest number of failures in polyethylene casings occur during the winter.
The number and kind of failures in casing caused by thermal deformations depend on how the casing is set into well. If the casing is protected by a metallic outer case and is not firmly fixed, i.e. the space between the tubes is filled with water or clayey (lime) solution (so called “floating column”), then only the casing length will vary, without any break of its integrity.
In the single casing design, the material can become completely restrained if the annulus is cemented to the surface. In such a situation the casing is under a stress. The most common damage in such a position will be the collapse of the polyethylene in the lengths between the connections and the cracking of the polyethylene, thus forming microfissures.
With an inferior or incomplete cementing of the annulus, the casing can break at the point of highest stress. If only a part of the annulus in an operational well has been cemented, then the fixed portion of the casing is held and the rest is free. As the result of thermal deformation, there can be casing breaks, collapses, intensive cracking etc. at the restraining points.
Wells equipped with metalloplastic casing can also fail due to thermal deformation. The primary failures will be cracking and bulging of the casing, and at the connections of the metal reinforcement. These result from the differences in linear expansion of the tube materials (steel and polyethylene).
10.6. WELL WORK-OVER
The main work-over operations are changing of screens, preparing the casing, and insulation of the annulus of the well.
216
The change of screens and repair of casings or single parts in the wells are done in the following cases:
(a) when the surface of the screen or its frame is damaged;
(b) when the screen is completely plugged and all efforts to bring it into an operational state have failed;
(c) when the material of the screen and casing cannot resist corrosion by leaching solutions;
(d) when the well receives sand in quantity exceeding the specified value;
(e) when the hydraulic sealing is damaged due to various defects in casing strings and lift pipes (cracked casing, broken seal, squashed and broken casing, etc.).
Screen replacement means the destruction of the old screen or removal of it from the productive layer and installing a new one. The well design with no rigidly fixed screen allows its removal. It can be done with derricks, winches, drill bores, or their combination. But firm closure of the screen by rock, presence of plugging, and weakness of the plastic materials reduce the probability of its complete removal by hoisting. More often the upper part of the screen is broken and the rest then crushed into pieces and washed out.
Sometimes screens freely installed in the wells can be worked on by columnar drilling rigs. The screen can be hoisted by the drilling rig winch.
If the screen cannot be removed totally, it can be destroyed by an explosion. The pieces can be removed by tube catcher, sludge pumps and other means. The screen can be replaced without hoisting the casing to the surface. The major disadvantage of this method for screen replacement is that the lumps of the blasted old screen fill the screen zone and plug it, thus reducing the efficiency of the new screen and creating conditions for plugging in the screened zone.
In wells with a single, integral casing design, the replacement of screens is difficult, especially with non-metallic casing and screens. The removal of casing and screen by reaming takes much time and money and it is impossible to use hoisting for the rigid connection of the screen and casing. In this case, one can apply the following method of screen replacement. The well is drilled further below the casing and screen to a greater depth, equals to the length of the old screen. It creates a space for removal of old screen (see Fig. 10.1). Then the screen has to be cut off from the operational column by tube cutters, sand jet perforators or some other method. The cut-off screen is pushed down into the interval created under the screen. After that the new screen of smaller diameter is lowered into the empty well interval through the casing. If the old screen is long, the cutting and lowering is done piece by piece.
The work over or replacement of casing becomes necessary when they leak, causing seepage of leaching solution and contamination of aquifers. Sometimes it can lead to dilution of leaching solution. The replacement of a casing can be done via various methods. The determining factors are the well design and material of the casing string. If the casing is metallic and there is no annulus, the tubes can be hoisted by cargo lifting devices (winches, jacks, vibrators, etc.). If the wells are equipped with casing made of non-metallic materials
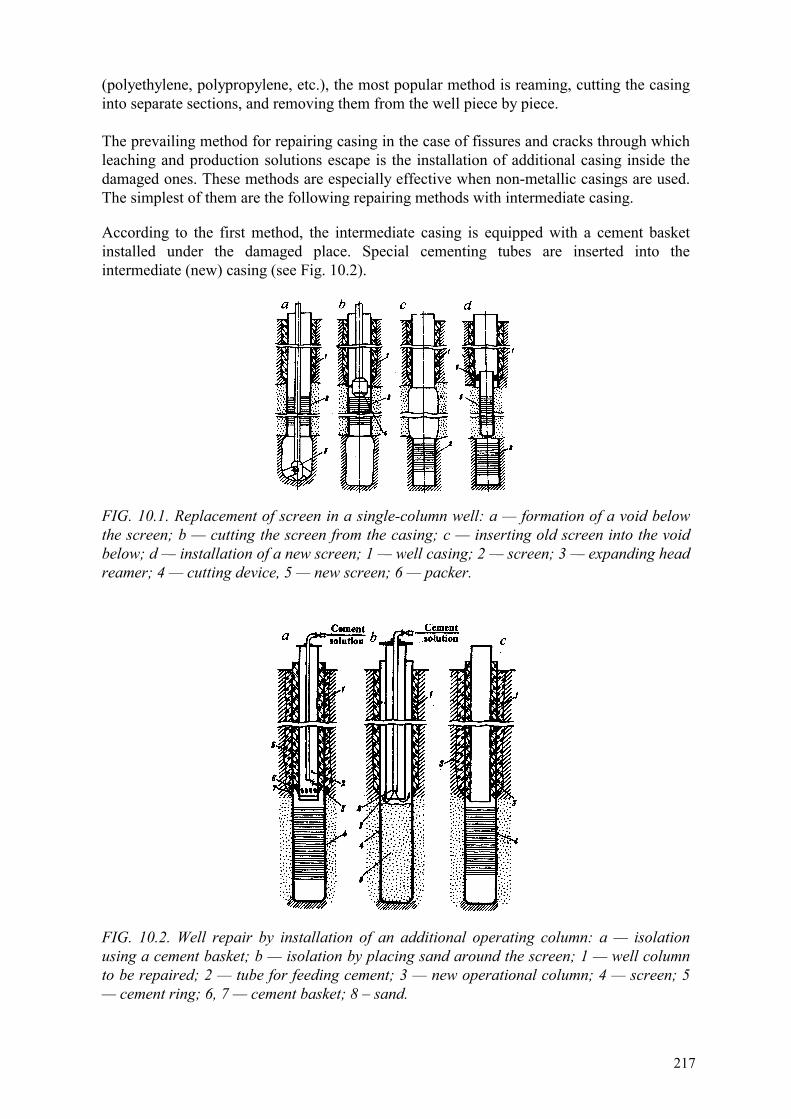
217
(polyethylene, polypropylene, etc.), the most popular method is reaming, cutting the casing into separate sections, and removing them from the well piece by piece. The prevailing method for repairing casing in the case of fissures and cracks through which leaching and production solutions escape is the installation of additional casing inside the damaged ones. These methods are especially effective when non-metallic casings are used. The simplest of them are the following repairing methods with intermediate casing.
According to the first method, the intermediate casing is equipped with a cement basket installed under the damaged place. Special cementing tubes are inserted into the intermediate (new) casing (see Fig. 10.2).
FIG. 10.1. Replacement of screen in a single-column well: a — formation of a void below the screen; b — cutting the screen from the casing; c — inserting old screen into the void below; d — installation of a new screen; 1 — well casing; 2 — screen; 3 — expanding head reamer; 4 — cutting device, 5 — new screen; 6 — packer.
FIG. 10.2. Well repair by installation of an additional operating column: a — isolation using a cement basket; b — isolation by placing sand around the screen; 1 — well column to be repaired; 2 — tube for feeding cement; 3 — new operational column; 4 — screen; 5 — cement ring; 6, 7 — cement basket; 8 – sand.
218
In the second method, a part of the well is filled with some inert material (preferably sand) under the damaged place. Then a new casing is put inside. The new casing equipped with an upper joint is filled with liquid. The cementing tubes are put inside for the pumping of hydraulic sealing material. After grouting between the casings, the cementing tubes are removed. The inert filling is then removed from the well.
The internal diameter of the polyethylene tubing may be smaller than the standard due to inferior quality and cannot hold the solution-pumping equipment. In this case the casing has to be cut inside, which damages it. Therefore the operation is applicable only in cases of extreme necessity. After the repair work is completed, the casing integrity is checked by geophysical methods followed with recovery or injection testing. 10.7. CONTROL OF LEACHING-FIELD PARAMETERS IN ISL PROCESS
Reducing the cost of production depends on using the most favourable regime of the solution pumping and injection, the possibility of controlled well operation, the alternative switching and off-on of the wells, regulation of the heads, etc. The above conditions can be attained by constant control over the initial parameters of leaching by automation in the ISL processing.
The control of the leaching parameters is done through injection and recovery, observation, and observation core holes. The injection and recovery control in the wells includes the following procedures:
�� periodic check of the dynamic level in the recovery wells; �� maintaining the design flow rate and its control in the injection wells; �� recording time of the recovery and injection wells operations; �� periodic control of the flow rate in the cased wells; �� automation and remote control of electrical submersible pump operations and
recording of their operating time; �� periodic measuring of the water level in the monitoring wells and taking water
samples from them.
The ISL facilities have to perform the following operations:
�� continuous measurement and recording of the flow rates of leaching solutions in the rows of injection and recovery wells;
�� automatic control and recording of the leaching solution acidity; �� continuous control and recording of the solution quantity coming in and going out
from the field(s); �� continuous control of the basic component and acid contents in the production
solution; �� maintenance of the design pressure in injection branch tubes; �� automation and remote control of pumping stations; �� control of the main component, accompanying elements and acid content in the
leaching solutions while taking samples in accordance with the Control and Mode Schedule of the facility;
�� continuous quality control in all collectors and pressurized vessels; �� continuous control and recording of energy consumption by surface and underground
facilities.

219
BIBLIOGRAPHY TO CHAPTER 10
GRABOVNIKOV, V.A., Geotechnological Investigation in Exploration for Metals. M.: Nedra, (1983).
LISOVSKI, G.D., LOBANOV, D.P., NAZARKIN V.P., et al., Heap and In-Situ Leaching of Metals, M.: Nedra (1982).
PETROV, R.P., DOLGIKH, P.F., SHUMILIN, I.P., et al., Heap Leaching in Uranium Deposits Working, M.: Energoatomizdat, (1988).
LUTSENKO, I.K., BELETSKI, V.I., DAVYDOVA, L.G., No-mine Working of Minerals. M.: Nedra (1986).
MOSINETS, V.N., LOBANOV, D.P., TEDEEV, M.N., et al., Construction and Operation of In-Situ Leaching Mines, M.: Nedra (1987).


221
Chapter 11
INVESTIGATION AND ACTIONS FOR ENVIRONMENTAL PROTECTION
11.1. GENERAL (CONCEPT)
ISL involves extracting the ore mineral from the deposit with minimal disturbance of the existing natural conditions of the earth’s subsurface and surface. In contrast to underground and open pit mining, there are no rock dumps and tailings storage, no dewatering of aquifers, and much smaller volumes of mining and hydrometallurgical effluents that could contaminate the surface, air and water supply sources. Therefore the impact of ISL on the environment is much less than for other mining methods as long as projects are properly planned, and operated and closed using best practice.
In ISL the primary source of potential contamination is the acidic leaching solution. The low pH of the fluid results in the dissolution of various metals contained within the host rock. The combination of low pH and elevated concentrations of metals as well as radionuclides creates a risk to surface waters and soils (from spills) and a separate risk to adjacent groundwaters.
Though the risk of such contamination is usually local, it has the potential to impact the regional economy, animals, and vegetation. Therefore, acidic ISL operations should remain under strict surveillance both during the ISL process and during the subsequent decommissioning and reclamation of the site. In some cases (especially in populated areas) it will be necessary to restore the contaminated groundwater. If residual soil or groundwater contamination will remain at the site, long term monitoring programmes must be established to ensure that the contamination does not spread into uncontrolled aquifers or areas.
11.2. CONTAMINATION OF SURFACE AND RECULTIVATION OF LAND
The most serious environmental risk in the ISL is surface contamination and damage to soils. This can impact local vegetation, wildlife, and agricultural practice. The surface contamination may result from the leaching solution leaking from defective pipelines, spills from open injection wells, pumping of wells for cleaning or sampling, or when production solutions are just dumped to the ground instead of into special reservoirs. Contamination will be minimized with good environmental control services. Nevertheless, the surface (especially in the proximity of injection wells) will likely become contaminated and one should plan for the cleanup.
The solutions bring to the surface sulphuric acid and its salts, nitrates and radionuclides (uranium, thorium, radium, polonium, etc.). As the result, the soil may temporarily become unable to nourish plants or they may acquire properties harmful for animals and man. Among the radionuclides the most toxic is Po210 with its half-life period of 22 years; U238 is less dangerous in this regard (half-life of 4.49•109 years); for Po210 it is equal to only 140 days, but for Th230 reaches 8.3•104 years [7].
The maximum penetration of ions and radionuclides into the soil is typically limited to 40–60 cm, rarely reaching one meter. The contamination depth in the soil is determined by its filtration as well as by physical and chemical properties. An example for ground contamination in production sites is given in Figure 11.1. The maximum contamination levels are confined to the rows of leaching wells and solutions pipelines.

222
FIG. 11.1. Surface map of ISL site showing contamination indicated by radiometric survey data: 1 — sites to be cleaned up and recultivated (i.e. with contamination in excess of allowable limit); 2 — wellfield blocks; 3 — injection well; 4 — recovery well.
In humid climates, frequent rainfalls can expedite the self-cleaning of the soil as the fresh water aids the migration of contaminating components into deeper sub-soil layers. However, even in the most favourable situation (permeable soils, high rainfall) this natural cleanzing may require several tens of years [5]. In arid climates, this soil restoration will take much longer. In addition, the contamination can be spread over wide areas by strong winds. Again the extent of this airborne dispersion is magnified in arid climates such as deserts or semi-desert areas.
Accounting for the above, the following activities may be undertaken at the ISL sites. Before the operations begin, a top soil layer ~0.5 m thick may be stripped from selected areas and removed from the site boundaries. This top soil is stored in designated areas and revegetated. During decommissioning, any contaminated soils or sub-soils must be neutralized with lime.
223
Severely contaminated soils may be removed for neutralization and burial in designated trenches. The stock piled topsoil will be returned to the original sites and revegetated. The tentative cost of recultivation is about $5,000 (1992 costs) for one hectare.
The second method of recultivation of land is based on electric adsorption technology and can be used under conditions of water-resisting clayey rock present under the earth layer to be cleaned. The method requires drilling of special holes equipped with electrodes and water hoisting devices. Inside of the site to be cleaned, the rock is washed with 1–3 pore volumes under direct current (voltage ~50V, current from 5 to 45A, depending on the situation). The anodes are inserted into the surface layer, cathodes — into the underlying water-confining layer. The optional cost of cleaning one hectare is about $2,000.
The ISL field operations should proceed with strict controls against spills and leaks of production and leaching solutions onto the site ground. The solutions recovered from the recovery wells should be collected into portable receptacles and returned to the recycling system.
Prior to leaching, a baseline survey of the site should be conducted. During the leaching process as well as following completion of leaching, additional radiation environmental control and sanitary surveys should be carried out. The results of these surveys should be integrated to develop the final plan for reclamation of the surface and elimination of residual contamination. The plan would normally be reviewed and approved by the local and state health agencies prior to implementation. In some countries, ownership of the reclaimed site may be transferred to a governmental agency for long term care and maintenance.
11.3. GENERAL INFORMATION ON CONTAMINATION OF UNDERGROUNDWATER IN ISL
The ISL introduces low pH fluids often containing oxidants into a productive aquifer. It, therefore, is bound to contaminate groundwater in the vicinity of the operating wells. It is especially noticeable when sulphuric acid sharply decreases the pH value of the fluids (from 7–8 to 1–2) and, beside uranium ores, other minerals are then dissolved. First of all carbonaceous minerals (especially calcium-bearing) are affected, in a lesser degree — clayey minerals, sulphides, micas, feldspars, etc. While the carbonates and sulphides react quickly, leaching of feldspars can go on for years and even decades. Quartz is the most resistant to leaching. The sulphuric acid leaching adds to the groundwater the following dissolved components: SO4
2-, NO-, HCO3-, Ca2+, Mg2+, Al3+, Fe2+, Fe3+, Na+, K+, SiO2, radionuclides
and other trace metals: Zn, Cu, Ni, Se, Be, V, Co, Cr, Ti, etc. Sulphuric acid dissolves into solution more or less all elements present in the rock in concentrations exceeding the maximum admissible concentrations for public drinking water supply systems.
By comparison, a bicarbonate reagent selectively dissolves uranium ores and the level of by product contamination in the groundwaters is markedly lower. In addition to uranium compounds, the alkaline solution contains elevated concentration of carbonate and bicarbonate ions as well as cations such as Na+, Mg2+, NH4
+, and K+. In spite of limited dissolution of harmful impurities, the alkaline leaching solution does contain toxic elements such as radium and selenium which can migrate for long distances in the alkaline medium.
When the ISL test sites operate in a balanced mode, the movement of the contamination halo boundary is confined by the external solution flow lines, which exit the injection wells, turn around the flanks and approach the recovery wells (see chapter 6). Therefore the large testing
224
fields produce little special (area) contamination. Under steady, balanced flow conditions, the aerial extent or sweep of the leaching fluid remains constant over the life of the operation.
The sulphuric acid leaching process is observed to create different sized zones or areas of contamination for various species. This is especially true for species which have pH dependant solubilities. The pH nature varies from neutral or weakly alkaline values at the halo boundary up to 1–2 in its centre. The internal or smallest halo where the pH is less than 2.5 is distinguished by elevated concentrations of Fe, Al, and U. Then the widening halos of Fe3+ (pH ~ 3), Al3+ (pH = 4–5), Fe2+ (pH ~ 6) follow, these will mainly precipitate as hydroxides as the acid is neutralized in the solutions moving through that portion of the total halo.
Calcium ion migrates a little further and its dissemination is mainly controlled by the solubility of gypsum (CaSO4•2H2O). The ion is chiefly generated by carbonates and clayey minerals, due to the ion-exchanging processes. The sulphate ion is delivered in excess by sulphuric acid solutions.
Sulphate ion (rarely NO3-) travels for the longest distances in the aqueous halo. Although the
migration properties of NO3- are higher than that of SO4
2- and there are no insoluble nitrates formed in ISL, the minimum measurable concentrations of sulphates are observed further along the flow, because the SO4
2+ concentration in the leaching solutions is much higher than NO3
-2.
In summary, zonation of the macrocomponents of contamination in sulphuric acid leaching is as follows:
U � Fe3+ � Al3+ � Fe2+ � Ca2+ � NO3- � SO4
2-.
The remainder of the macro- and microcomponents including radionuclides becomes disseminated within the sulphate halo limits.
The total dissolved solids (TDS) or ionic strength of solutions in the central part of the aqueous halo is generally determined by the initial concentration of injected reagent which usually is 15–25 g/dm3 in sulphuric acid leaching. Towards the halo limits, the TDS decreases and soon reaches the background values. A comparison of the chemical compositions of production solutions and natural groundwater are illustrated in Tables 11.1 and 11.2.
The contaminants concentration underground decreases under the influence of chemical interaction with rock minerals, neutralization of the medium, ion-exchange processes, adsorption, diffusion and filtration dispersion. All the contaminants decrease their concentration in the flow direction due to dilution with natural groundwater (filtration macro- and microdispersion). Only small increases of certain species (for instance calcium) concentrations are possible there as the result of partial re-leaching by the residual acid solutions flowing through fresh rock (carbonates).
The maximum distance between the contamination halo boundary and the geometric well pattern boundary in a standard test site with the well network 25 × 50 m extends 50–80 m (rarely to 100 m). In large-scale sites the overall size of the aqueous contamination halo depends on the portion of orebody being leached (Fig. 11.2). However, the width of the contamination around such a site also extends about 50–100 m, beyond the well pattern boundary.
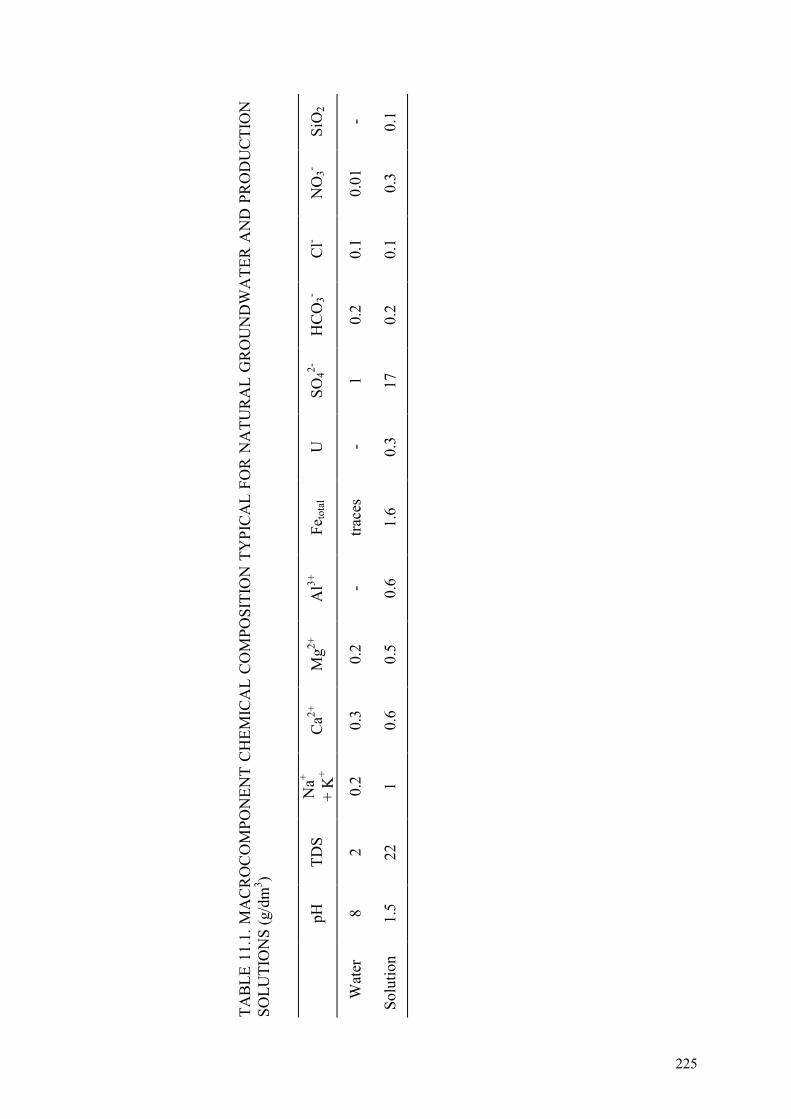
TAB
LE 1
1.1.
MA
CR
OC
OM
PON
ENT
CH
EMIC
AL
CO
MPO
SITI
ON
TY
PIC
AL
FOR
NA
TUR
AL
GR
OU
ND
WA
TER
AN
D P
RO
DU
CTI
ON
SO
LUTI
ON
S (g
/dm
3 )
pH
TD
S N
a+ +
K+
Ca2+
M
g2+
Al3+
Fe
tota
l U
SO
42-
HC
O3-
Cl-
NO
3- Si
O2
Wat
er
8 2
0.2
0.3
0.2
- tra
ces
- 1
0.2
0.1
0.01
-
Solu
tion
1.5
22
1 0.
6 0.
5 0.
6 1.
6 0.
3 17
0.
2 0.
1 0.
3 0.
1
225

226
TABLE 11.2. TRACE METALS COMPOSITION OF PRODUCTION SOLUTIONS IN CERTAIN URANIUM DEPOSIT EXPLOITED BY SULPHURIC ACID ISL (mg/dm3)
Element Content Element Content
Be
As
Zr
Mn
Pb
Sn
Ni
Ti
Mo
Cu
0.36
n/f
1.21
6.05
0.726
n/f
1.21
1.20
n/f
1.20
Ag
Zn
Co
Cr
V
Ba
Se
Y
La
Nb
n/f
n/f
3.6
1.21
202
1.20
n/f
1.21
n/f
n/f
n/f — not found.
FIG. 11.2. Position of sulphuric acid solution dispersion limits in a commercial ISL field: 1 — injection well; 2 — recovery well; 3 — monitoring well. Numbers — pH values.

227
The shift of the solution balance towards recovery or injection correspondingly decreases or increases the width of the contamination halo. The alteration of halo width due to the imbalance can reach +50 m. It has to be noted that it would be not wise to specially decrease the contamination halo by an artificial imbalance (in any case for a large value), since the missing volume of solutions would be compensated by the inflow of natural groundwater thus diluting the production solutions. In addition, the surplus leaching fluid must be treated for disposal as a result of this overproduction.
There are two clearly discernible periods for the migration of contaminating components in the aquifer under ISL conditions (Fig. 11.3):
FIG. 11.3. Position of contaminated groundwater halo at ISL site during (1976) and after (1982) operation: a — in presence of noticeable flow, b — without flow and with high residual content of acid-consuming minerals (carbonates) non-uniformly distributed in the rock mass: 1 — ISL site, 2 — pH iso-contours, 3 — outside contour of sulphate ion dispersion and its concentration (g/L), 4 — observation hole. Numbers at the wells — concentration of sulphate ion (g/L). Zones of pH: 5 — below 3; 6 — 3 to 5; 7 — 5 to 7; 8 — more than 7.
228
(1) The period of proper leaching, when the halo propagation is limited by hydrodynamic balance of the wellfield. In this case groundwater contamination takes place within a relatively small zone of hydraulic influence near leaching wells and does not move along the stratum (away from the wellfield).
(2) When the uranium recovery is finished and the artificial hydrologic cone of depression well is abandoned, the hydrologic control returns to the natural flow of groundwater. This could cause contamination to move away from the ISL site for fairly long distances.
Due to interactions of the dissolved contaminates with the host rock (chemical interaction, adsorption, dilution, etc.), the concentration of these components in the solution decreases and a self-cleaning of the groundwater to the background value eventually takes place. In this way, the redistribution of hazardous components in the productive aquifer rock happens as the result of geochemical processes. A portion of material (uranium, etc.) is recovered to the surface. In addition to the natural compounds, some reagent solution (usually H2SO4 mixed with HNO3) is introduced underground, which increases (on account of sulphates and nitrates) the TDS. Depending on the halo size in the flow direction, the velocity of the latter and interaction conditions for the contaminating components and rock minerals, the contaminated pathway and self-cleaning time of groundwater can vary in a broad range — from a few hundreds meters and a couple of years in small testing fields up to kilometres and decades in large-scale ISL sites (mines). According to the latest research [4, 8], a contamination halo progressing through unmineralized, unleached rock does not decrease in size (as was previously hoped) but actually spreads out, chiefly due to hydraulic dispersion and gravitation differentiation of the fluid. However, maximum contamination within the halo continuously decreases (including for those components which do not chemically react with the rock minerals).
11.4. EVALUATION OF GROUNDWATER CONTAMINATION
11.4.1. General (conception)
In the process of ISL there are only limited concerns regarding wide spread contamination of the aquifer as a rule, since the border line of the halo has been practically stabilized by the hydraulic effect of leaching wells at the distance of 50–100 m from the ISL site boundaries. The only exception are wellfields within the radius of influence of water supply or discharge sources, exercising drainage influence on the productive aquifer (mines, open pits, etc.).
Still, in all cases there should be continuous observation (monitoring) of the chemical composition of the groundwater through specially drilled observation (monitoring) wells.
Evaluation of the productive aquifer groundwater must be done in the cases when the latter is utilized for the communal water supply. This continuous evaluation is carried out in accordance with approved governmental regulations for both water quality and radiation safety [7].
The water meeting the requirements indicated in Table 11.3 is considered to belong to the first (highest quality) category. The pH value there should be within the range 6–8 and TDS must not exceed 1 g/dm3.
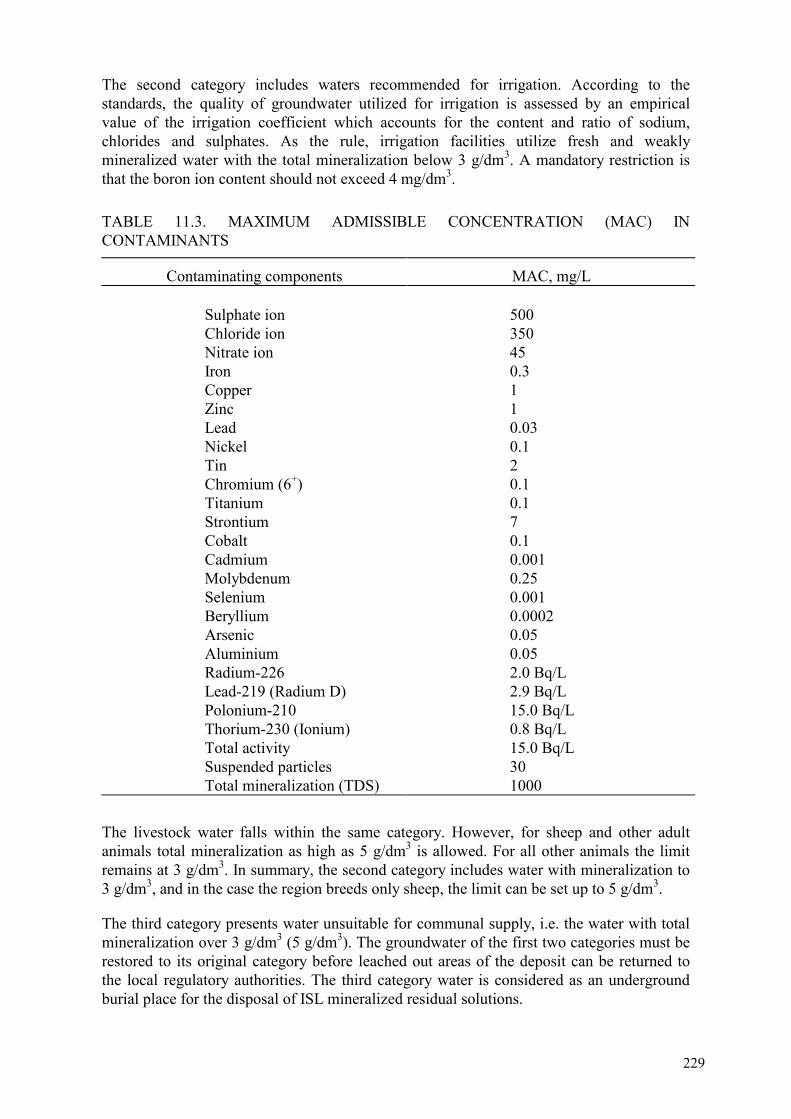
229
The second category includes waters recommended for irrigation. According to the standards, the quality of groundwater utilized for irrigation is assessed by an empirical value of the irrigation coefficient which accounts for the content and ratio of sodium, chlorides and sulphates. As the rule, irrigation facilities utilize fresh and weakly mineralized water with the total mineralization below 3 g/dm3. A mandatory restriction is that the boron ion content should not exceed 4 mg/dm3.
TABLE 11.3. MAXIMUM ADMISSIBLE CONCENTRATION (MAC) IN CONTAMINANTS
Contaminating components MAC, mg/L Sulphate ion Chloride ion Nitrate ion Iron Copper Zinc Lead Nickel Tin Chromium (6+) Titanium Strontium Cobalt Cadmium Molybdenum Selenium Beryllium Arsenic Aluminium Radium-226 Lead-219 (Radium D) Polonium-210 Thorium-230 (Ionium) Total activity Suspended particles Total mineralization (TDS)
500 350 45 0.3 1 1 0.03 0.1 2 0.1 0.1 7 0.1 0.001 0.25 0.001 0.0002 0.05 0.05 2.0 Bq/L
2.9 Bq/L 15.0 Bq/L 0.8 Bq/L 15.0 Bq/L 30 1000
The livestock water falls within the same category. However, for sheep and other adult animals total mineralization as high as 5 g/dm3 is allowed. For all other animals the limit remains at 3 g/dm3. In summary, the second category includes water with mineralization to 3 g/dm3, and in the case the region breeds only sheep, the limit can be set up to 5 g/dm3.
The third category presents water unsuitable for communal supply, i.e. the water with total mineralization over 3 g/dm3 (5 g/dm3). The groundwater of the first two categories must be restored to its original category before leached out areas of the deposit can be returned to the local regulatory authorities. The third category water is considered as an underground burial place for the disposal of ISL mineralized residual solutions.
230
11.4.2. Calculation of contaminated groundwater halo after ISL termination
The maximum spreading of the contaminated water halo beyond the boundary of an orebody (or a part of it) can be estimated from the formula given below. The formula has been devised for homogeneous media and is not accurate in a laminated mass of an aquifer due to absence of data on macrodispersion, reduced density of the solutions and difficulty in obtaining a total diffusion coefficient (dispersion) [2].
L = Xsp + 0.5 (Xd + Xb) + Xf,
where: L = maximum spreading length of residual solutions beyond the orebody boundary in time t, m; Xsp = maximum spreading of solutions beyond orebody boundary during the leaching period, m; Xd = extent of the dispersion zone, m; Xb = extent of the deformation interface boundary due to the densities difference between contaminated and pure groundwater, m; Xf = travel distance of the contaminated water front induced by the native flow of groundwater or by operation of a water intake installation, m.
The extent of the dispersion zone (Xd) is to be determined according to the following formula with the account of the physical and chemical interactions:
XA
D tpd
a�
�6 6.
where: D = total coefficient of molecular diffusion, hydrodispersion, chemical interaction and adsorption; t = time from the working termination, days; pa = active porosity, fractions of unit; A = deceleration content, fractions of unit.
in its own case [5]. A �
�15 9
�
�[ , ] �
��
�
�
C PC
a
c10
where: � = the material distribution coefficient in the solution/water system, fractions of unit; C = concentration of the contaminant in the solution, g/dm3; Cc = capacity of the rock for the component under study, %; � = volumetric mass of the rock, g/cm3.
The Xf value is determined by the formula [1, 2]:
XA
KT tnf �� �2 2. cos
,�� �
where: K = the rock hydraulic conductivity, m/day; T = thickness of the aquifer, m;
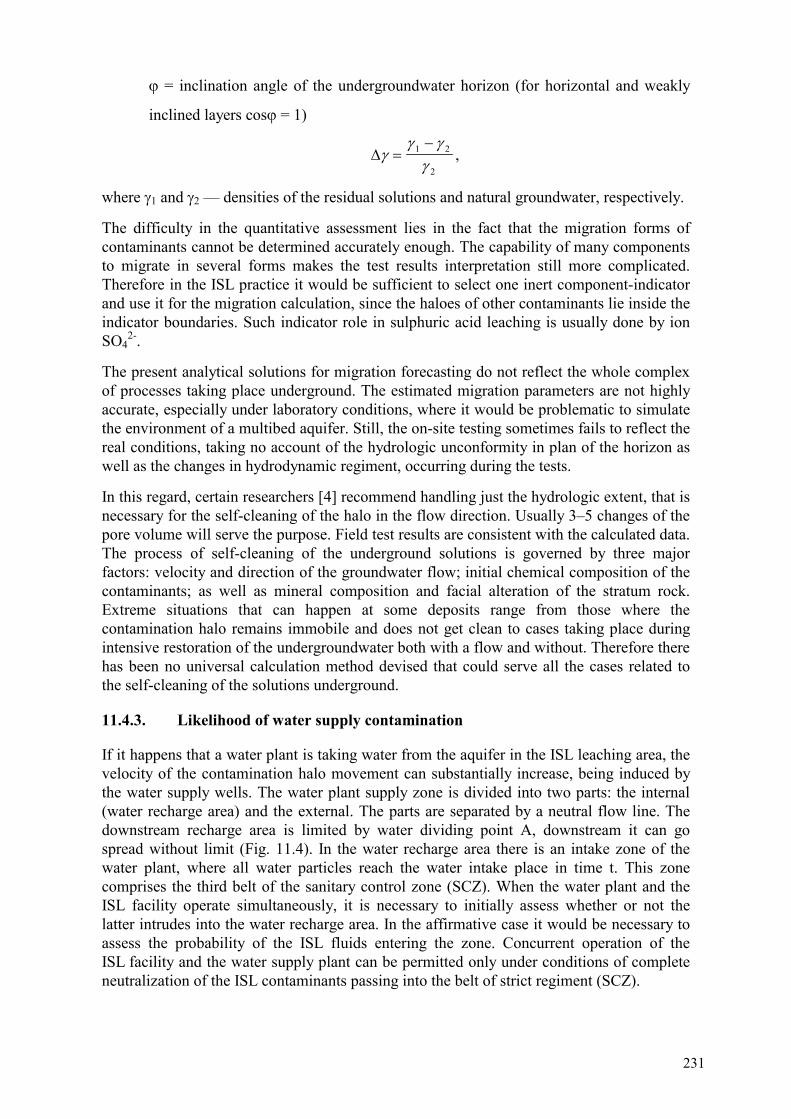
231
� = inclination angle of the undergroundwater horizon (for horizontal and weakly
inclined layers cos� = 1)
��� �
��
�1 2
2,
where �1 and �2 — densities of the residual solutions and natural groundwater, respectively.
The difficulty in the quantitative assessment lies in the fact that the migration forms of contaminants cannot be determined accurately enough. The capability of many components to migrate in several forms makes the test results interpretation still more complicated. Therefore in the ISL practice it would be sufficient to select one inert component-indicator and use it for the migration calculation, since the haloes of other contaminants lie inside the indicator boundaries. Such indicator role in sulphuric acid leaching is usually done by ion SO4
2-.
The present analytical solutions for migration forecasting do not reflect the whole complex of processes taking place underground. The estimated migration parameters are not highly accurate, especially under laboratory conditions, where it would be problematic to simulate the environment of a multibed aquifer. Still, the on-site testing sometimes fails to reflect the real conditions, taking no account of the hydrologic unconformity in plan of the horizon as well as the changes in hydrodynamic regiment, occurring during the tests.
In this regard, certain researchers [4] recommend handling just the hydrologic extent, that is necessary for the self-cleaning of the halo in the flow direction. Usually 3–5 changes of the pore volume will serve the purpose. Field test results are consistent with the calculated data. The process of self-cleaning of the underground solutions is governed by three major factors: velocity and direction of the groundwater flow; initial chemical composition of the contaminants; as well as mineral composition and facial alteration of the stratum rock. Extreme situations that can happen at some deposits range from those where the contamination halo remains immobile and does not get clean to cases taking place during intensive restoration of the undergroundwater both with a flow and without. Therefore there has been no universal calculation method devised that could serve all the cases related to the self-cleaning of the solutions underground.
11.4.3. Likelihood of water supply contamination
If it happens that a water plant is taking water from the aquifer in the ISL leaching area, the velocity of the contamination halo movement can substantially increase, being induced by the water supply wells. The water plant supply zone is divided into two parts: the internal (water recharge area) and the external. The parts are separated by a neutral flow line. The downstream recharge area is limited by water dividing point A, downstream it can go spread without limit (Fig. 11.4). In the water recharge area there is an intake zone of the water plant, where all water particles reach the water intake place in time t. This zone comprises the third belt of the sanitary control zone (SCZ). When the water plant and the ISL facility operate simultaneously, it is necessary to initially assess whether or not the latter intrudes into the water recharge area. In the affirmative case it would be necessary to assess the probability of the ISL fluids entering the zone. Concurrent operation of the ISL facility and the water supply plant can be permitted only under conditions of complete neutralization of the ISL contaminants passing into the belt of strict regiment (SCZ).

232
FIG. 11.4. Diagram of flow towards recovery well in an infinite layer: 1 — water intake; 2 — catchment area, 3 — direction of natural flow, 4 — zone border. For the case of an unlimited water-bearing stratum and a single water intake well (or compact group of wells) the major elements in the water recharge zone are determined by formula [3]:
XQ
qY
QMV
YQMVA o
e e� � �
�2 4 2�
; ;
where: XA = the distance from the water plant to the water dividing point, m; Q = water plant yield, m3/day; q = specific yield of the natural aquifer, m2/day; Yo and Y� = one half of the water recharge area width downstream the water intake line and upstream at a long distance, m; Ve = natural velocity of the groundwater stream, m/day.
For the recharge area, taken as a rectangle for easier calculation, the main parameters are determined according to the formulae [6, 7]:
Total length: L = R + r, the groundwater extent upstream: T = R — ln(1 + R), (11.1)
the groundwater extent downstream: T = — [ln(1 — r) + r] (11.2)
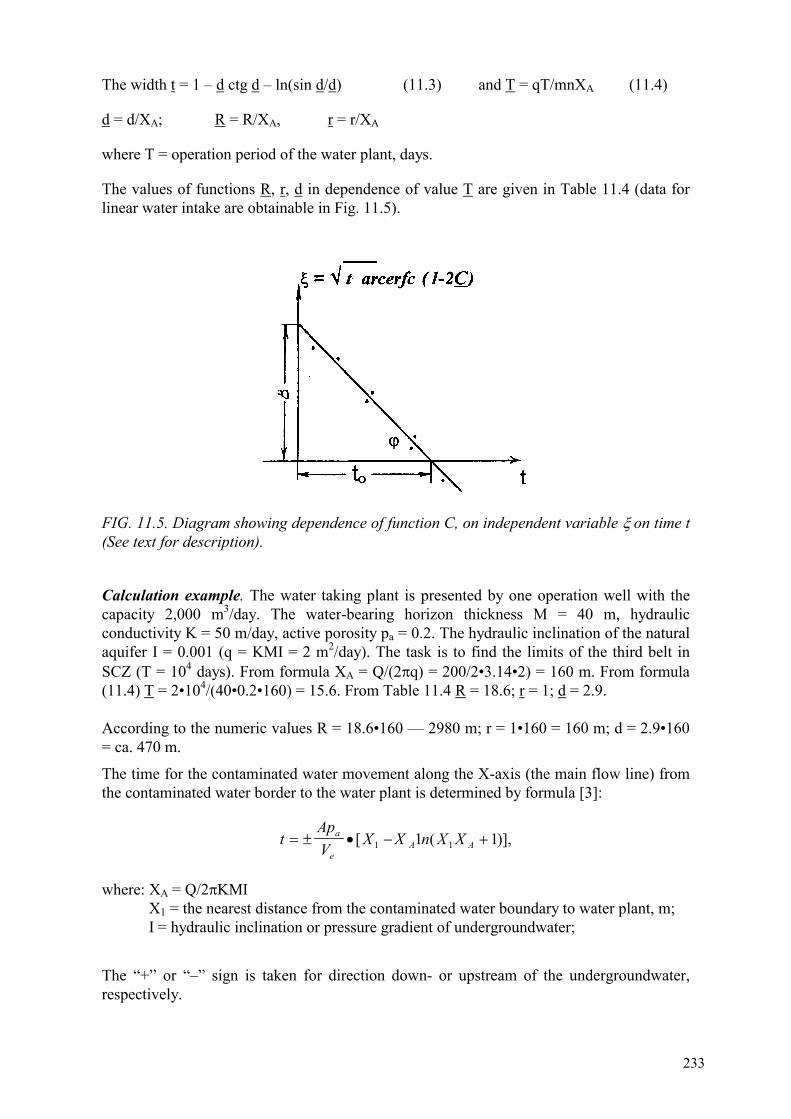
233
The width t = 1 – d ctg d – ln(sin d/d) (11.3) and T = qT/mnXA (11.4)
d = d/XA; R = R/XA, r = r/XA
where T = operation period of the water plant, days.
The values of functions R, r, d in dependence of value T are given in Table 11.4 (data for linear water intake are obtainable in Fig. 11.5).
FIG. 11.5. Diagram showing dependence of function C, on independent variable � on time t (See text for description).
Calculation example. The water taking plant is presented by one operation well with the capacity 2,000 m3/day. The water-bearing horizon thickness M = 40 m, hydraulic conductivity K = 50 m/day, active porosity pa = 0.2. The hydraulic inclination of the natural aquifer I = 0.001 (q = KMI = 2 m2/day). The task is to find the limits of the third belt in SCZ (T = 104 days). From formula XA = Q/(2�q) = 200/2•3.14•2) = 160 m. From formula (11.4) T = 2•104/(40•0.2•160) = 15.6. From Table 11.4 R = 18.6; r = 1; d = 2.9. According to the numeric values R = 18.6•160 — 2980 m; r = 1•160 = 160 m; d = 2.9•160 = ca. 470 m.
The time for the contaminated water movement along the X-axis (the main flow line) from the contaminated water border to the water plant is determined by formula [3]:
tApV
X X n X Xa
eA A� � � � �[ ( )],1 11 1
where: XA = Q/2���� X1 = the nearest distance from the contaminated water boundary to water plant, m; I = hydraulic inclination or pressure gradient of undergroundwater;
The “+” or “–” sign is taken for direction down- or upstream of the undergroundwater, respectively.
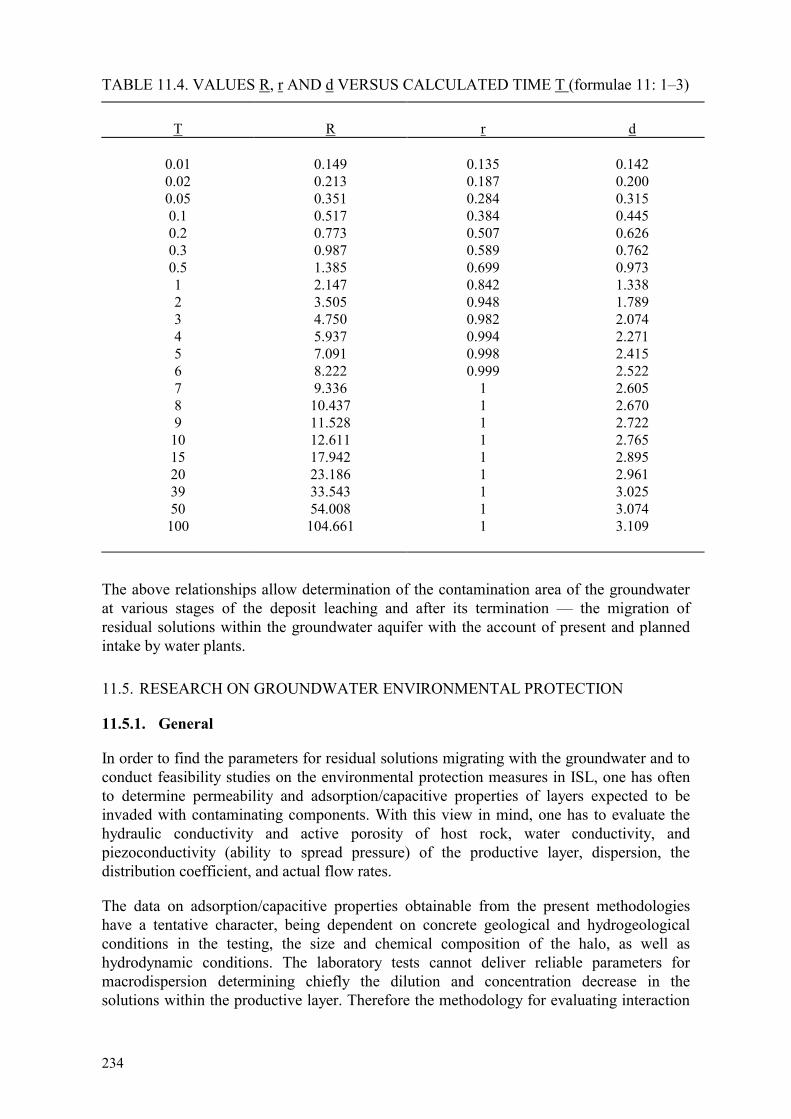
234
TABLE 11.4. VALUES R, r AND d VERSUS CALCULATED TIME T (formulae 11: 1–3)
T
R
r
d
0.01 0.02 0.05 0.1 0.2 0.3 0.5 1 2 3 4 5 6 7 8 9 10 15 20 39 50
100
0.149 0.213 0.351 0.517 0.773 0.987 1.385 2.147 3.505 4.750 5.937 7.091 8.222 9.336 10.437 11.528 12.611 17.942 23.186 33.543 54.008 104.661
0.135 0.187 0.284 0.384 0.507 0.589 0.699 0.842 0.948 0.982 0.994 0.998 0.999
1 1 1 1 1 1 1 1 1
0.142 0.200 0.315 0.445 0.626 0.762 0.973 1.338 1.789 2.074 2.271 2.415 2.522 2.605 2.670 2.722 2.765 2.895 2.961 3.025 3.074 3.109
The above relationships allow determination of the contamination area of the groundwater at various stages of the deposit leaching and after its termination — the migration of residual solutions within the groundwater aquifer with the account of present and planned intake by water plants.
11.5. RESEARCH ON GROUNDWATER ENVIRONMENTAL PROTECTION
11.5.1. General
In order to find the parameters for residual solutions migrating with the groundwater and to conduct feasibility studies on the environmental protection measures in ISL, one has often to determine permeability and adsorption/capacitive properties of layers expected to be invaded with contaminating components. With this view in mind, one has to evaluate the hydraulic conductivity and active porosity of host rock, water conductivity, and piezoconductivity (ability to spread pressure) of the productive layer, dispersion, the distribution coefficient, and actual flow rates.
The data on adsorption/capacitive properties obtainable from the present methodologies have a tentative character, being dependent on concrete geological and hydrogeological conditions in the testing, the size and chemical composition of the halo, as well as hydrodynamic conditions. The laboratory tests cannot deliver reliable parameters for macrodispersion determining chiefly the dilution and concentration decrease in the solutions within the productive layer. Therefore the methodology for evaluating interaction

235
parameters for sandy-clayey rocks in laboratory conditions (both static and dynamic) has not been considered in this manual.
11.5.2. Methodology for evaluating interacting parameters in field conditions
The field testing is conducted in accord with two plans:
(a) injection of residual ISL solutions into a single well: (b) “duplication” test with creation of a flow induced by simultaneous operation of
recovery and injection wells. In the first test plan, the start-up well is injected with formation water up to the moment of quasi-stationary permeable medium flow. Then the well is fed with the residual solution from ISL at the previous flow rate and with a non-adsorbable indicator. Thirdly, without stopping the injection and at the same rate the well is fed with formation water to wash the productive layer. An observation well system is used to check the progress of the solution indicator.
The test is stopped when the concentrations of the components under study drop to the background values. The samples from the observation holes are taken for chemical analysis once daily. From the moment the indicator appears, the sampling is recommended to be done 1–3 times daily until the concentrations of the components became stable.
The “duplication” method is on the whole the same as in the above scheme.
The results of the testing are used for plotting curves of relative change in the indicator and contaminating component’s concentrations versus time C = f(t). The further processing of each curve is done according to the method by F.M. Bochever and A.E. Oradovskaja [2].
The expression: C ca erfcP FFx t
e o
o( , ) . .�
��
���
�
���0 5
12
becomes: � � � �� ��
���
�
�t arcerfc C
r v t pD p
a
a
( )/
/,1 2
2
showing the linear dependence on t.
In the above formulae: Pe = Peclet’s criterion, Pe = Vx/D; D = depression coefficient; v = filtration (flow) rate; Fo = a dimensionless function, Fo = Dt/x2; Pa = active porosity; r = distance to the observation hole, m.
The value is calculated for all experimental data C and t and a dependence on t is being plotted (Fig. 11.5).
The dispersion coefficient is determined from equation: D = v2/4patg2�

236
where tg� = angular content of the straight line t = f(), or D = n•x2/4B2,
where B = a segment on the ordinate cut by this line.
The distribution coefficient is determined by the tangent angle of the � inclined to the time axis t and segment to cut on this axis: � = l/(tov-nl).
The adsorption rate parameter: � = tg2�/�.
Using the exit curves C = f(t) obtained in the indicator filtration inert to the rock, the active porosity is calculated: Pa = v/L • C = 0.5
where: v = filtration rate (the apparent flow velocity);
l = distance between the injection and observation wells;
C = 0.5 = time when the indicator concentration in the filter becomes c = 0.5.
The value of the real velocity is calculated by the time one half of the concentration C = 0.5 is fixed in relation to the non-adsorbable indicator (chlorine ion).
A correction is used in the calculations for the time by which the clear water is displaced from the well: t’ = �r�c� c/Qh,
where �Hc = the height of water level in the well with radius rc and flow rate Qh.
The distribution coefficient � is to be determined from the comparison of the exit curves for adsorption and non-adsorption components.
The actual flow rate of the undergroundwater aquifer for Cl- ion: Vcl- = l/�tCl
c=0.5.
The flow rate for point C=0.5 of the component A to be adsorbed is V*A = l/�t*c=0.5
The shift �t of the exit curves determined the distribution coefficient � for component A:
�t = l (1/V*A — 1/V*Cl); V*A = V*C(�/1+�); � = (na•l)/(V•�t).
The curves shift is determined from the diagrams of exit curves for values C = 0.5.
For � calculation the above graphic analysis using all the curve is preferable, since � calculated by the shift using only one or two points of the exit curve might have a large error.
11.6. PROCESSES FOR GROUNDWATER RESTORATION
The methods for restoration of groundwater can be divided into two groups (Table 11.5). The first one comprises methods of direct cleaning. The second method attains restoration by self-cleaning.
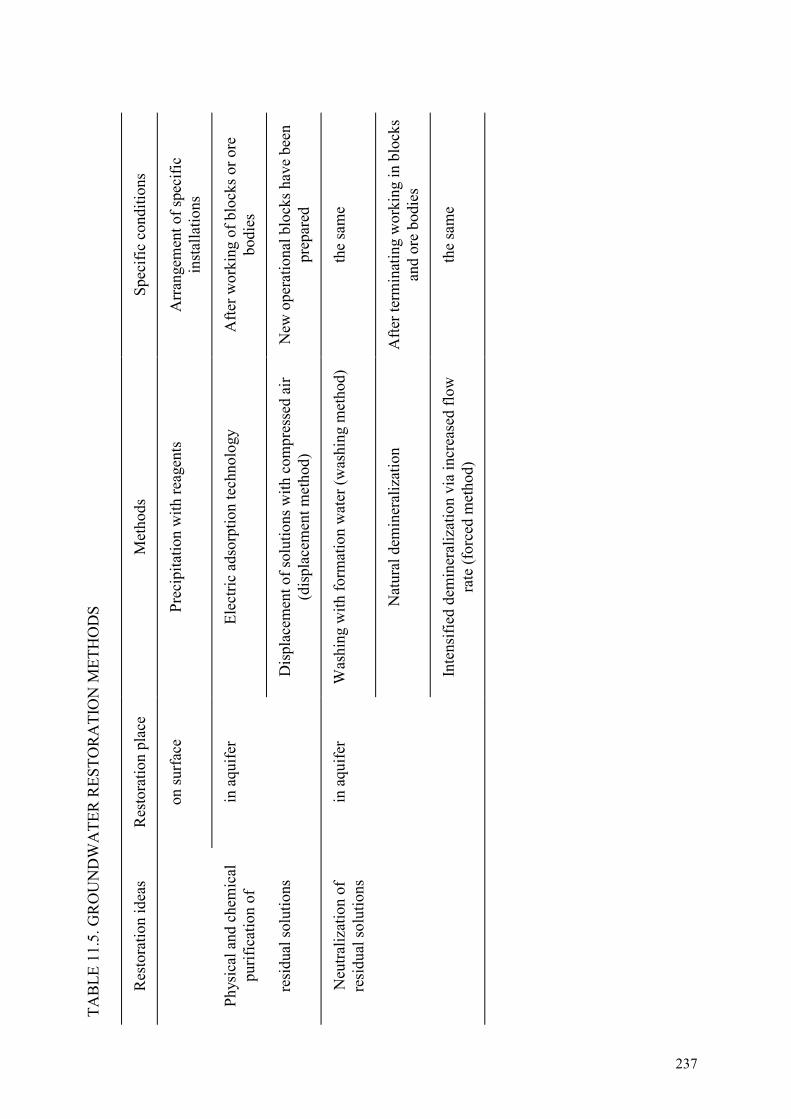
TAB
LE 1
1.5.
GR
OU
ND
WA
TER
RES
TOR
ATI
ON
MET
HO
DS
Res
tora
tion
idea
s R
esto
ratio
n pl
ace
Met
hods
Sp
ecifi
c co
nditi
ons
on
surf
ace
Pr
ecip
itatio
n w
ith re
agen
ts
Arr
ange
men
t of s
peci
fic
inst
alla
tions
Phys
ical
and
che
mic
al
purif
icat
ion
of
in a
quife
r El
ectri
c ad
sorp
tion
tech
nolo
gy
Afte
r wor
king
of b
lock
s or o
re
bodi
es
resi
dual
solu
tions
Dis
plac
emen
t of s
olut
ions
with
com
pres
sed
air
(dis
plac
emen
t met
hod)
N
ew o
pera
tiona
l blo
cks h
ave
been
pr
epar
ed
Neu
traliz
atio
n of
re
sidu
al so
lutio
ns
in a
quife
r W
ashi
ng w
ith fo
rmat
ion
wat
er (w
ashi
ng m
etho
d)
the
sam
e
Nat
ural
dem
iner
aliz
atio
n
Afte
r ter
min
atin
g w
orki
ng in
blo
cks
and
ore
bodi
es
Inte
nsifi
ed d
emin
eral
izat
ion
via
incr
ease
d flo
w
rate
(for
ced
met
hod)
th
e sa
me
237
238
11.6.1. Cleaning by precipitation with reagents
Direct cleaning of pumped out solutions is done by precipitating undesired materials with reagents in specially arranged installations. The natural concentration of groundwater requires recovery of 5–10 pore volumes of fluid from the leached-out blocks. The solution cleaning is carried out in multistage chemical circuits that incorporate operations of adsorption and desorption of uranium, precipitation of lime pulp, and analysis. The saline residual must be buried. The quality of clean water conforms to the water used in production. The cost of the reagent cleaning is (up to $2/m3). The implementation of the method is complicated by the necessity to bury large quantities of waste solids and slurries. Therefore the method can be recommended only in exceptional cases when other methods are unsuitable.
11.6.2. Cleaning via electrical adsorption technology
Cleaning of the underground residual solutions via electrical adsorption technology is based on creating an electrical field in the ore mass of the productive aquifer. Through a borehole or a system of wells, a cathode (or cathodes) is inserted into clayey sediments. As the clayey formations, one can use the upper or/and lower water-resisting layers, clayey interbeds and lenses. The positive anodes are inserted through the boreholes into the orebody. The electrodes are inserted so that the solution to be cleaned is between them.
When the electrodes are under voltage, the direct current passes through the residual solutions. The cations in the solutions move towards the cathode. Passing through the clay, the cations of iron, aluminium, heavy and other metals are adsorbed by the clay in exchange for ions of calcium, which bind the sulphate and arsenate ions into insoluble compounds. In that way the groundwater is also cleaned of anions. The application fields of the method for cleaning lenses of residual solutions in the leached-out block contours depend on engineering potential for setting-up efficient electrodes. The testing data for residual solutions of 10 metres depth have shown that the cleaning cost was $0.1/m3, essentially reaching initial concentrations for radionuclides and sulphates. With increasing depth of the well, the cleaning cost will evidently increase.
11.6.3. Cleaning solutions by compressed air
The essence of the method is as follows. When a block or a group of blocks has been leached out, the injection wells are blown with compressed air under pressure exceeding the hydrostatic pressure in the productive layer. The excessive air pressure expels the residual solutions through the recovery wells. Through special pipelines, the expelled solutions are directed to adsorption for extraction of remaining uranium and after conditioning are fed into new ISL blocks for acidification.
The restoration of groundwater via expulsion with compressed air facilitates the recovery of 70–80% of pore volume from the leached out contour per cycle. Once the compressed air pressure subsides, the rock of the block under restoration is filled with formation water thus reducing the initial contamination to 20–30% of the starting level. Another displacement cycle permits the user to attain practically the initial composition of the undergroundwater. The production cost of re-extracted uranium is 5–7 times lower than during the working period. The measure thus improves the profitability of the undergroundwater restoration. Under the conditions of 80% recovery of residual solutions per cycle, the cost of restoration of groundwater will not exceed $0.2/m3. One of the disadvantages of this method is that the air blasting predominantly affects the upper parts of aquifer and may partially plug the aquifer with gas.
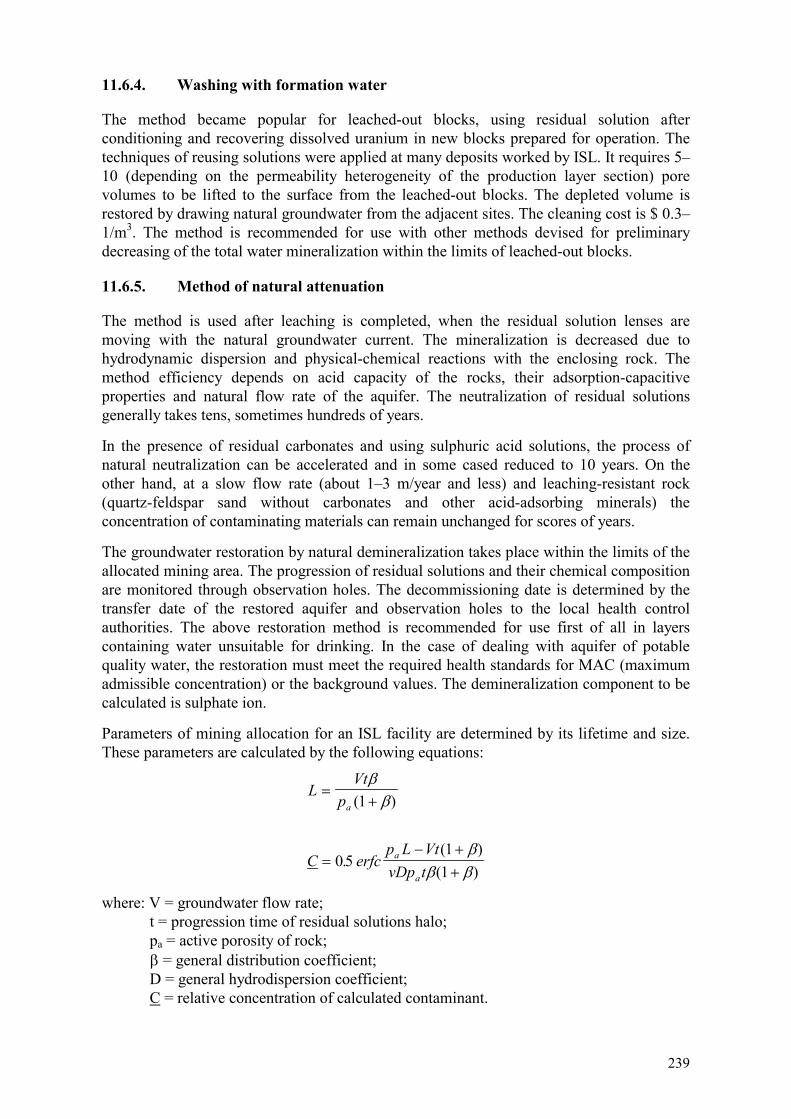
239
11.6.4. Washing with formation water
The method became popular for leached-out blocks, using residual solution after conditioning and recovering dissolved uranium in new blocks prepared for operation. The techniques of reusing solutions were applied at many deposits worked by ISL. It requires 5–10 (depending on the permeability heterogeneity of the production layer section) pore volumes to be lifted to the surface from the leached-out blocks. The depleted volume is restored by drawing natural groundwater from the adjacent sites. The cleaning cost is $ 0.3–1/m3. The method is recommended for use with other methods devised for preliminary decreasing of the total water mineralization within the limits of leached-out blocks.
11.6.5. Method of natural attenuation
The method is used after leaching is completed, when the residual solution lenses are moving with the natural groundwater current. The mineralization is decreased due to hydrodynamic dispersion and physical-chemical reactions with the enclosing rock. The method efficiency depends on acid capacity of the rocks, their adsorption-capacitive properties and natural flow rate of the aquifer. The neutralization of residual solutions generally takes tens, sometimes hundreds of years.
In the presence of residual carbonates and using sulphuric acid solutions, the process of natural neutralization can be accelerated and in some cased reduced to 10 years. On the other hand, at a slow flow rate (about 1–3 m/year and less) and leaching-resistant rock (quartz-feldspar sand without carbonates and other acid-adsorbing minerals) the concentration of contaminating materials can remain unchanged for scores of years.
The groundwater restoration by natural demineralization takes place within the limits of the allocated mining area. The progression of residual solutions and their chemical composition are monitored through observation holes. The decommissioning date is determined by the transfer date of the restored aquifer and observation holes to the local health control authorities. The above restoration method is recommended for use first of all in layers containing water unsuitable for drinking. In the case of dealing with aquifer of potable quality water, the restoration must meet the required health standards for MAC (maximum admissible concentration) or the background values. The demineralization component to be calculated is sulphate ion.
Parameters of mining allocation for an ISL facility are determined by its lifetime and size. These parameters are calculated by the following equations:
LVt
p
C erfcp L VtvDp t
a
a
a
�
�
�
� �
�
�
�
�
� �
( )
.( )
( )
1
0 51
1
where: V = groundwater flow rate; t = progression time of residual solutions halo; pa = active porosity of rock; � = general distribution coefficient; D = general hydrodispersion coefficient; C = relative concentration of calculated contaminant.

240
In order to predict the lifetime of the site it would be necessary to pre-determine the required relative concentration of the background value of the contaminant (e.g. sulphate ion) or MAC value for the initial concentration of that component in the residual solution. After that the above equations can be solved.
11.6.6. Method for accelerating groundwater natural attenuation
In recent years a method intensifying the demineralization of an aquifer has been successfully tested using higher flow rates. The groundwater is pumped from wells specially drilled beyond the orebody limits. Simultaneously some water is pumped in from the opposite side of the halo (the progressing halo can also be cleaned portion by portion). The method permits the user to run the solutions through rocks untouched by leaching and to clean the water from harmful impurities during a comparatively short time (from a few months to 2–3 years) depending on the area to be cleaned. The expenditures are mostly related to the drilling of extra holes and employing pumps. The cost of cleaning is about $1.0 per cubic metre/m3 (costs are tied to 1990).
The character of changing content of contaminating components in the process of solution flow is shown in Figure 11.6 with three possible cases:
(1) there is no adsorption of material by the rock and the total quantity of contaminating component remains unchanged; the concentration decreases due to the halo spreading under the influence of dispersion, gravity differentiation, and diffusion. This case is characteristic for the ions NO3
- and Cl-.
FIG. 11.6. Changing concentration of contaminants (C), with flow path length (X), and time (t), with “package” injection of solutions: a — without absorption of material by rock; b — with absorption; c — with additional leaching of rock by residual acid.
241
(2) the material is adsorbed by the rock, decreasing both the concentration and total quantity of the contaminant in the solution. This case is characteristic for the majority of dissolved salts generated by leaching.
(3) extra leaching of rock by residual acid with a short raise of the concentration and total quantity of material in the solution, followed by a rapid decrease of them. This case is characteristic mainly for carbonates actively reacting with the residual acid and uranium beyond the orebody, as well as for forming ionic Ca2+.
Physical processes accompanying flow of liquid in porous medium (hydraulic dispersion, gravity differentiation, diffusion) lead to blending and dilution of the groundwater contaminated by residual solutions in all three cases above. This process becomes still more active in the nonuniform permeability of a productive aquifer.
In summary, the solution flow through unleached rock in all the cases results in the decrease of contaminants concentration to the background values. An increase of flow rate reduces the time of aquifer restoration by a factor of ten to a hundred [5, 8].
The latest research on restoration employs biological methods for water purification. Thus, there are some investigations, still at the laboratory stage, utilizing sulphate-reducing bacteria. The seemingly successful results became the basis for pilot plant testing at leached-out ISL sites.
REFERENCES TO CHAPTER 11
[1] BELITSKY, A.S., Preservation of Natural Reserves while Burying Liquid Wastes Underground, M. Nedra (1976).
[2] BOCHEVER, F.M., ORADOVSKAJA, A.E., Hydrogeological Grounds for Preservation of Underground Water and Water Intake from Contamination, M. Nedra (1972).
[3] GOLDBERG, V.M., Hydrogeological Prognostication of Underground Water Quality in Water Intake, M. Nedra (1979).
[4] KOCHETKOV, V.I., BELETSKY, V.I., SPESHILOV, S.L., Migration of Contaminating Components in Underground Water of Worked-Out ISL Facilities, Engineering Progress in Atomic Industry. Series Industrial Technology and Radioecology 1 (1992) 19–24.
[5] LUTSENKO, I.K., BELETSKY, V.I., DAVYDOVA, L.G., Mineless Working of Ore Deposits, M. Nedra (1986).
[6] MIRONENKO, V.A., RUMYNIN, V.G., UCHAEV, V.K., Preservation of Underground Water In Mining Areas. L. Nedra (1980).
[7] Standards of Radiation Safety and Main Sanitary Regulations in Handling Radioactive Materials and Ionizing Sources OSP-72. Third publication, M. Energoatomizdat (1988).
[8] SKOROVAROV, J.I., BELETSKY, V.I., Safeguarding Underground Water in ISL of Minerals and Restoration after Decommissioning ISL Fields, Coll. Chemical Methods of Mining and Processing. Pshibram (1990) 365–373.

242
BIBLIOGRAPHY TO CHAPTER 11 BOCHEVER, F.M., ORADOVSKAJA, A.E., LAPSHIN, N.N., Preservation of Underground Water from Contamination, M. Nedra (1979).
GOST (State Standards) 2874 82. Potable Water, M. Standards Publication (1984).
Addendum to Maximum Admissible Concentration List of Harmful Impurities In Reservoirs of Domestic Utilization, M, Minzdrav of USSR (1981).
ORADOVSKAJA, A.E., LAPSHIN, N.N., Sanitary Preservation of Underground Water Intakes, M. Nedra (1987).

243
Chapter 12
DESIGNING IN SITU LEACHING FACILITIES
Facilities for ISL consist of the following: the mining (wellfield) complex, the piping system for transport of injection and recovery solutions, the solution processing plant, and auxiliary services.
The wellfield complex is designated for pre-conditioning and leaching the uranium deposit, leaching solutions injection into the ore bodies, and for the production solution recovery to the surface. This includes injection, monitoring and recovery wells, submersible pumps or airlift systems for the recovery wells, associated control, piping, and power systems, as well as access and service roads.
The solution processing plant is designated to recover uranium and by-products from the recovery solutions and for reagents addition. It consists of the resin adsorption, resin regeneration and chemicals addition circuits.
The system of solution transportation links the mining and processing plant by delivering injection solutions to the injection wells and returning recovery solutions to the processing plant. It may include central and field pumping stations and pipelines for injection and recovery solutions. If airlifts are used for solution recovery, the system also includes compressed air pipelines and compressor stations. ISL projects also have auxiliary facilities, for on-site equipment repair and maintenance, warehousing of goods, garages, administration offices, personnel quarters (in remote locations) and other services.
The feasibility and engineering plan for design and construction of an ISL facility consists of the following sections.
12.1. SUMMARY FEASIBILITY REPORT
The study or report provides an overview of the project and should address all significant issues pertaining to construction, operation, and final closure of the project. Included within the report should be discussions of:
�� Mineable uranium reserves and resources. �� Potential for the development of additional resources. �� Confidence level of the resource estimates. �� Possible by-products. �� Testing and other measures supporting the recovery factors and other parameters used
for design. Overview of the economic factors should also be included and is as follows:
�� Capital investment requirements. �� Forecasts for Life of Mine (LOM) operating costs. �� Forecasts for LOM product sales price. �� Financial evaluations of the project profile. �� Financial sensitivity studies testing the impact of changes to key variables.

244
Key variables may include but are not limited to: �� Currency values. �� Utility (electricity, fuel) costs. �� Labour costs. �� Market selling prices (supply-demand). �� Production of by-products (by-product credits). �� Environmental regulations and compliance costs. �� Variations in production rates.
These sensitivity studies and financial evaluations should be supported by detailed schedules for the following items:
�� Initial capital equipment and costs. �� Annual drilling programmes and costs. �� Annual energy requirements (fuel, power) and costs. �� Wellfield installation — materials and labor. �� Annual manpower requirements and costs. �� Reagents consumption and costs. �� Sustaining capital requirements and costs. �� Decommissioning plans and costs. �� Surface reclamation plans and costs. �� Ground water remediation plans and costs.
This list is not intended to be all inclusive but rather to illustrate the width of investigation and planning which is necessary at the onset of commercial development.
The Summary Feasibility Report gives a clear view of the scale of production, used technology, required power/heat/water resources, technical-economic parameters and economic effectiveness of the planned facility.
12.2. MAJOR TECHNOLOGICAL DECISIONS
12.2.1. Geotechnology of mining
This section presents the main parameters (Table 12.1) characterizing geotechnology of mining, geological structure of the deposit (size, borders, genetic and morphologic type, stratigraphy and lithology of the rock with a detailed description of productive horizons, elements of the rock deposition), the confinement of the deposit to certain stratigraphic horizons, location of ore bodies within the product horizon (soil, roof, etc.), the characteristics of ore bodies in plan (length, width, direction) and in section (dip direction and average dip angle, vertical span).
For each deposit, the following parameters should be reported: depth from the surface, varying thickness of ore bodies, distribution of mineralization, presence and size of the barren rock interbedding, aerial extent and shape of ore-bearing sands, presence and distribution of the below-grade ore.

245
TABLE 12.1. PARAMETERS FOR ISL MINE DESIGN
Parameter value
Parameters Unit For ultimate development
For first stage
Notes
1 2 3 4 5 1. Geological ore reserves in categories, including geotechnological types
th•t
2. Recoverable reserves in categories, including geotechnological types
th•t
3. Leach field area th•m2 4. Average operational thickness m 5. Workable reserves of ore mass including geotechnological types
th•t
6. Liquid:solid ratio m3/t 7. Volume of leaching solutions: - injection; - barren; - recovery
mil•m3
8. Total reagent consumption: - leaching agent; - oxidant
th•t
9. Reagent consumption per 1 ton of ore mass: - leaching agent; - oxidant
kg/t
10. Leaching agent concentration in operational solutions (average) including: - at the oxidation stage; - at the active leaching stage; - at the final leaching stage
g/dm3
11. Design time for block acidification days 12. Design time for block leaching days 13. Operational well network: - recovery (distance between wells) - injection (distance between wells) - area of production cell
m•m m•m m2
14. Average design flow rate of operational wells m3/h 15. Quantity of operational wells simultaneously working: - recovery wells; - injection wells
number of wells
16. Working period: - working days per year; - shifts per day - hours/shift
days shift hour
17. Total period of facility operation, including: - development; - design capacity; - completed
year
18. Annual facility capacity for solutions (average for calculated year): - injection - barren - recovery
m3/h
million m3 per year
19. Annual reagent consumption (average for calculated year): - leaching agent; - oxidant
thousand t
20. Annual total drilling (average for calculated year) including operational wells
unit/r.m -“”-
21. Total drilling for the development period (start-up) including operational wells
unit/r.m
22. Total reagent consumption for the development period (start-up): - leaching agent - oxidant
thousand tons

246
In addition, information should be reported regarding the characteristics of the material and qualitative composition, geotechnological properties of the ores and host formations, the major and accompanying valuable (by-product) components, classification of ore types according to lithological and sedimentary properties, the concentration of harmful impurities and the major component (uranium), chemical composition of ores and host formations, particle size distribution of the main lithological variety of rocks, geochemical parameters of the ISL process according to laboratory data, and field testing, etc.
The information on hydrogeological conditions of the deposit is quite important. Since the solution movement is governed by the laws of underground hydrodynamics, it is necessary to determine the general hydrogeological position of the deposit in the region, description of aquifers developed in the deposit area, the areas of aquifer recharge and drainage, the aquifer character (confined or unconfined), and the character of water-confining layers. Much of this information can only be obtained from site specific pump tests.
The hydrodynamic calculations and simulation of the leaching process require information on piezometric level, the thickness of the aquifer (limits and average), yield and specific yield of the well, permeability (in enclosing rock and orebody), effective porosity, water conductivity, mineralization and chemical composition of the water, as well as the effective thickness of productive water-bearing horizons.
If domestic or agricultural wells are present in the deposit vicinity, there should be the information available on each of them: distance from the deposit, the aquifer serving the water wells, annual average water consumption, influence of the production aquifers (factual and expected water level drop, intensity of the level drop, etc.).
The initial data and design assignment must address the following: geotechnological parameters for the target ore deposit (including the first stage of the construction): the total volume of leaching solutions (injection and recovery), the facility capacity for solutions (injection and recovery), total reagent consumption, annual reagent consumption, average concentration of the leaching agent in leaching solutions, the block acidification time, the block leaching time, and the number of simultaneously operating recovery wells.
The development and operating sequence for the deposits depends on the chosen development system, design schedule for installing wells and preparing the deposit for leaching, total number of injection, recovery, and monitor wells, the order in which the blocks are placed into operation, the injection and recovery regiment, preliminary completion intervals for wells, and planned decommissioning of the areas.
The potential for leaching the full vertical section of the aquifer or selective development of the ore bearing horizon is to be chosen depending on the morphological and lithological properties of the aquifer structure, as well as on the hydrogeological parameters.
The main parameters of the development system are established. This includes the pattern of the injection and recovery wells, their efficiency, etc. The start-up period to reach full design capacity is established as well as the order in which well blocks are placed into operation and the number of simultaneously operating recovery wells.
The facilities for in-situ leaching can be the source of possible contamination of the environment. The present chapter provides a list of procedures directed to environmental

247
protection: storing of top soils, recultivation of contaminated land and restoration of aquifers, etc.
12.3. PROCESSING OF SOLUTIONS
Field and laboratory investigations are the basis for specifying the leaching chemistry and the process flowsheet. Several variables must be considered and the most novel and progressive are recommended for the design.
The chapter presents criteria for choosing and evaluating process equipment, setting its arrangement or layout, scheduling the complete development of the facility, and setting the construction phases and funding schedules in order to minimize the preparation time for the start-up.
(a) The ISL facilities differ from the traditional mines by their rapid increase of productivity, therefore the design should foresee a potential expansion of any process circuit without halting the plant operation.
(b) Some facilities of smaller capacity and pilot plants should be erected using easily installed and dismantled structures.
(c) For the normal functioning of the facilities in winter periods and in order to reduce the heating cost, the equipment should be installed with maximum compactness considering the process units and auxiliary services.
(d) The design should foresee necessary mechanization and automation of operations and maintenance at the sites.
(e) Delivery, storage, and preparation of the bulky, labor-intensive, or hazardous reagents should occur at a central site of each processing plant, depending on the circumstance. The reagent preparation processes are done according to their characteristic.
(f) The major process parameter of each processing plant is the volume of solutions to be treated, measured in million cubic meters per year and cubic meters per hour.
(g) The solutions delivered for processing from the ISL wellfield sites are monitored for the following parameters: (i) chemical composition including major anions and cations; (ii) density, temperature; (iii) solid impurities and their size distribution; (iv) acidity, alkalinity; (v) presence of specific impurities (organic and radioactive materials, etc .); (vi) uranium concentration.
Injection and recovery solutions are tested for the concentration of leaching reagents, solid suspensions, common ions, dissolved uranium, as well as the pH and Eh values.
The annual demand in reagent solutions and materials is to be estimated based on the net concentration of leaching reactants, in thousand tons. The initial load of expensive agents and materials (adsorbents, extractants, etc.) is to be estimated, as well as process water consumption (specifying the quality: fresh, recirculating, etc.) in thousands m3 per year and m3 per hour, consumption of steam (specifying pressure, Mpa, and temperature, oC) in thousand tons per year, power, MW h per year, and of air (specifying pressure, Mpa) in millions m3 per year and m3 per minute.

248
The processing of recovery solutions must be accompanied by monitoring using available means for automated control and measurement combined into automation systems. Measurement standards and specifications are to be specified.
The processing of leaching solutions makes certain contributions to environment pollution, contaminating the atmosphere and water resources. The design should consider engineering options for reducing the emission of contaminating agents into the atmosphere, including process flowsheet revisions as well as additional equipment and methods for retention and decontamination of harmful materials released by gases from process units.
Rational conservation of water resources should be directed to the reduction of liquid effluents volume by a solution-balanced block system, applying processes with “soft” reagent systems and utilization of the decontaminated wastes.
12.4. WELLS AND PUMPING EQUIPMENT
The necessary number of wells (recovery, injection, reserved, observation, exploration, monitor) should be calculated on the basis of selected leaching system. The work schedule for the design period can then be compiled.
The well efficiency is determined according to the hydrogeological conditions of the deposit. While specifying the well design and construction methods, one has to take into account the circumstances peculiar for the ISL method such as:
�� sandstone deposits characterized by unconsolidated, sandy-clayey rocks with aquifers present in the section;
�� each type of well (recovery, injection, observation, control, etc.) may require a distinct, separate approach to its design;
�� the angles and direction of the wells may be different; the sedimentary deposits can be leached by vertical, vertically inclined, inclined-horizontal bore holes; in addition, the wells may have one purpose or be multi-purpose;
�� the leaching agents may contain various solvents (acid, bicarbonate, oxygen, etc.) which have varying corrosion capabilities. This may, in turn, require specific, corrosion resistant materials for well construction;
�� the differing heads of the undergroundwater may require solutions that are both of low density (aerated, surfactant-treated) and higher density.
The list can be continued by enumerating peculiarities noteworthy for design considerations. The main parameters to be taken into account for the design are presented in Chapter 9 and Table 12.2.
The solutions can be pumped by airlifts or submersible pumps. The choice of the lifting means is determined by geological and hydrogeological conditions of the deposit (static level, flow properties, character of the productive horizon rocks), reagents used for leaching (acids, alkalis) as well as by feasibility factors concerning the capital and operating costs to move one cubic meter solution from the well (see Chapter 10).
The preparation and leaching of the ore bodies is preceded by a complex series of investigations including geophysical, hydrogeological studies and hydrochemical testing.
249
The geophysical studies include various kinds of logging. The orebody thickness and uranium content in the ore are determined by gamma-logging. The lithologic section throughout the wells is analyzed using electrical logging methods: resistance, and self potential surveys, which define the layers of low permeability and productive horizons.
Where non-conductive polyethylene casing is used, monitoring of the sulphuric acid solution movement is done by induction logging. This technique measures the change of the concentration of dissolved solids in the formation of water. The constant inspection of the monitor, recovery and injection wells and analysis of the data obtained will indicate the predominant pathways for solution movement, and also detect factors influencing the solutions distribution throughout the blocks. This provides an indirect indication of the extent of leaching in the orebody.
Systematic testing of the metal casing string integrity is conducted by resistivity, thermal, and flow measurements. The same methods are applied for solution loss evaluation in the case of a casing tubing string break. Thermal analysis checks the annular space cement quality, i.e. the hydroisolation of the ore-bearing horizon from the overlaying aquifers.
The hydrogeological and hydrogeochemical studies are to be carried out at all stages of the ISL process. The list of investigations includes:
�� observation of water formation level; �� measuring of well depth (to sand); �� testing of the recovery solution for U and pH; �� for mechanical impurities; �� testing of the recovered solution for accompanying elements. The monitoring and testing frequency at various stages of ISL should be established based on their minimum duration and on a scheduled basis (work week, ten days, monthly, quarterly, etc.).
The entire suite of well related measurements is incorporated into the design. The manpower requirement is determined based on qualification categories necessary for conducting the major tasks of the uranium ISL at a designed facility.
12.5. TRANSPORTATION OF INJECTION AND RECOVERY SOLUTIONS
The characteristic feature of ISL is handling large solution volumes for processing, employing long distance pipeline and branch piping networks because the ore bodies are scattered over large areas. Hence the fluid transportation system requires a significant share of the total of capital and operating costs of the designed facility. The principle scheme for the recirculating leaching solutions in the ISL site is presented in Figure 12.1.
Depending on the size and relative locations of planned wellfields, the processing plant can be situated and designed according to two schemes. The first lay-out foresees a plant constructed at the main production site with sufficient capacity to process the entire solution volume delivered from all wellfield blocks. In this case the plant will be a capital investment for long term service. The delivery of recovery solutions to the plant and the return of the leaching solutions from the plant to the wellfield blocks is done through main and lateral pipelines. As new wellfields are added, their distance from the plant will likely increase, thus increasing length of the main pipeline and the power consumption for moving the solutions. A single

250
FIG. 12.1. Principle scheme for recirculating technological ISL solutions in the ISL site. 1 — flushing wellfield; 2 — buffer block; 3 — leaching without acidification; 4 — acidification; 5 — preparation for leaching.
processing plant is best suited for a dense, closely spaced location of ore bodies (wellfields) with the production facilities centrally located. The second approach is to install several smaller, processing units, instead of one plant, with the total capacity sufficient to treat all recovery solutions delivered from the scattered wellfield blocks. The local units, similarly to the central plant, have a set of adsorption columns, circuits for desorption and acidification (preparation) for recovery solutions. The local units are usually erected at the wellfields, and each can serve several ore bodies. The local unit may be less durable and more simple since its service life does not exceed 5 years. The process building can be temporary, and erected on the assembled foundation. The unit design permits easy dismounting and erection at a new site within a short time period. These local units are useful for operating both remote test sites and wellfields. Pipeline lengths are shortened and the number of pumping stations is minimized. Still, one has to account for their construction and installation cost which is a trade-off against capital savings for extended pipelines and higher operating costs for pumping.
In addition to these two schemes for processing units, there is a third novel scheme for processing leaching solutions. According to the scheme, only desorption columns are set at the processing plant site for recovering uranium ions from the resin. An intermediate product (uranium bearing ion exchange resin) is obtained from the recovery solutions directly at the operational wellfields. Therefore, only adsorption columns are installed at the wellfield. Once

251
TABLE 12.2. PARAMETERS FOR WELLS AND PUMP INSTALLATION
Parameter value
Parameter Unit to the end first phase
Notes
1 2 3 4 5 1. Annual total of drilling; including: - recovery wells - injection wells - observation wells - control wells - exploration holes - reserved wells
number of wells + m
2. Drilling extent at the start-up including operational wells
number of wells + m
3. Average well depth m 4. Average rock drilling category category 5. Drill hole diameter over casual interval mm 6. Average casing depth, including casing type m 7. Number of drill rigs # 8. Efficiency of drill rigs, consisting rig type m/schift 9. Consumption of cone drill bits per hole # 10. Consumption of drill bits per hole # 11. Consumption of clay per hole t 12. Consumption of water per hole m3 13. Annual consumption of cement for well grouting
t
14. Consumption of cement for one well completion
t
15. Well capacity for solutions: a) recovery (range from/to, average) b) injection (range from/to, average)
m3/h
16. Number of submersible pumps in simultaneous operation, including types
#
17. Required number of submersible pumps (annually replaced) including types
#
18. Manpower for drilling, construction, maintenance and decommissioning of wells
person
19. Productivity of drilling and well completion m/per.mth 20. Construction cost of 1 running meter of well
currency
the resin becomes loaded, it is delivered by trucks to the desorption columns installed at a central site. This concept is known as the Satellite Method and has been employed in commercial alkaline ISL operations in the United States.
The adsorption module is installed on a platform or temporary foundation. The acidification circuit (preparation of leaching solutions) and the pumping station is also mounted on separate platforms. Such arrangement of adsorption columns allows them to be moved and relocated according to the progression of wellfield operation without much expenditures for buildings. This scheme for processing recovery solutions eliminates the need for the main pipelines,
252
pumping stations, and settling ponds which are integral to the first approach using centralized facilities.
The production capacity of a single adsorption column does not exceed 250 m3/h of solutions and the application of the scheme requires at the most 250/q of recovery wells in simultaneous operation, where q is the flow rate of one recovery well in m3/h.
Depending on the conditions of installation and operation, the ISL operating pipelines are classified according to the nature of the fluid transported, the method of connection to the processing units, and the operational mode.
On the basis of the type of transported fluid, pipelines are subdivided into the following categories:
�� pipe lines carrying recovery solutions containing valuable components in commercial concentrations from recovery wells to the adsorption unit at the stage of the operational blocks leaching;
�� pipe lines for transporting barren solutions, i.e. solutions from which the valuable component has been recovered; they carry the barren solutions from the adsorption unit to the acidification circuit for refortifying the necessary solvent concentration; in some cases the barren solutions are immediately directed from the adsorption unit to the operational wellfield blocks and the leaching proceeds without any additional acidification of the solutions (these pipe lines by-pass the acidification unit);
�� pipe line for transporting return solutions (recovery solutions containing uranium in concentrations lower than the commercial value); they transport these solutions from the recovery wells to the acidification circuit, by-passing the adsorption unit. This operation is used at the stage of active acidification of the blocks and for washing the rock mass of decommissioned sites; the lines are operable during the entire leaching stage;
�� pipe lines for acidification solutions (leaching); they are laid from the acidification circuit to the injection wells of the operational wellfield blocks. They are used throughout the entire leaching stage;
�� pipe lines for acidifying solutions laid from the acidification circuit to the injection wells within the operational wellfield blocks; they differ from the line for leaching solutions only in the quality of solutions transporting with different solvent concentration; they are operable during the active block acidification stage;
�� pipe lines for transporting native formation water, located only within the limits of the deposits sites to be worked; they deliver the native water obtained at the initial stage of active acidification for use in washing the mined-out (depleted) wellfield blocks.
The pipe lines are subdivided into Mains, Branch or series and Distribution classes depending on the method of connection to the operating wells.
The Mains carry the total solution volume from the processing facilities to operational wellfield blocks, or vice versa. The Mains are not used for transporting the formation water from the acidifying blocks, for washing the mined-out wellfield blocks or for delivering the recycling solutions to the acidification circuit at the ISL site. According to experience the Mains length can extend up to 15 km depending on the distance between the processing facilities and the wellfield blocks.
253
The Branch Pipe lines collect production and other solutions from the rows of recovery wells and also deliver the leaching solutions to the rows of injection wells. The Branch lines are connected to the Mains. Their length is determined by the size of operational ISL site (wellfield blocks).
The Distribution Pipe lines connect individual wells to the Branch line. They deliver to or take away, a solution volume determined by the designated well flow rate. Distribution lines are neither large in length or diameter.
On the basis of the above classification, capacity and corrosion properties of the transported fluids, pipe lines are designed and installed at the ISL sites. The routing of pipe lines determines the amount of tubing, i.e. material consumption for the surface part of the ISL mining complex and, in the end, the capital investment (main percentage) of the selected mining system.
The length of the pipe lines, their diameters and material type depend on the following parameters:
�� lay-out of operation wells; the length of the branch lines is determined by the geometrical shape of ore bodies and the sequence for mining;
�� distance between operational wellfield blocks and processing facilities or Local Adsorption Units (LAU); the rational distribution of processing units and LAU can be determined only by comparison of several feasibility factors, therefore the lay-out schemes are the most important engineering decisions to be made at the pre-design stage;
�� technological parameters of leaching (solution volumes, ensuing heads, composition and physical/chemical properties of solutions, etc.) which influence the pipe line type, its performance, and material of construction;
�� geographical and climatic conditions of the deposit; the processing units and LAU should be positioned so that gravity flow can be utilized wherever possible;
�� sequential order for new ore bodies or deposits introduced into operation; sensible organization and scheduling of wellfield blocks utilize previously installed pipe lines.
At present, solution flow and pipeline designs are based on a generally accepted scheme of two closed circuits for recycling leaching solutions:
�� injection and recovery solutions by scheme “technological complex — operational blocks”,
�� acidified and returned solutions by scheme “acidification circuit — blocks to be acidified”.
The injection and acidifying solutions are mainly transported by pressurized pipe lines to deliver fluid to injection wells at a surface (wellhead) at a pressure of up to 1 Mpa. In test sites with small deposits, injection solutions are moved under the force of gravity. The recovery solutions are also moving from the recovery wells to the settling pond by a system of gravity fed trays.
Economically sound arrangements of solution pipe lines in ISL fields basically depends on the position of the adsorption unit with respect to the wellfield blocks.
254
If the processing plant services several ore bodies, situated at long distances (several kilometres) from each other, the Mains should be designed for maximum ease of operation and minimum distances.
The Branching of injection and recovery solutions to the wellfield blocks can be done via a parallel line scheme by laying single pairs of lines from the ion exchange plant to each orebody. In contrast, the circle arrangement of the lines has only one set of Main lines from the ion exchange plant routed to all ore bodies. Separate end Branches are arranged from the Mains to individual wellfield blocks in the ore bodies, or for a group of wells.
The pipe material should withstand the designated media attacks. The tube durability is characterized also by corrosion resistance to the leaching solutions, mechanical strength against both internal and external pressures, as well as attrition strength or abrasion resistance when transporting solutions containing solid suspensions. The pipe lines must transport the designed volume of solutions under pre-determined operating conditions.
Main pipe lines made of polyethylene are widely used for both delivering the injection solutions to the wellfield sites and for collecting and pumping recovery solutions to the ion exchange (adsorption) plant. Still, the use of polyethylene pipe is limited by its strength and operating conditions. Leaching solution Mains are specified to accommodate the maximum solution pressure, active resistance and material type. Such pipelines are made of heavy and superheavy polyethylene. The calculated Mains diameter sometimes reaches high values (400–1000 mm). Polyethylene tubes cannot be used for transporting leaching solutions under pressure exceeding 0.5 Mpa. The application of stainless steel is compulsory in this case. But the maximum diameter of stainless steel tubing manufactured in Russia does not exceed 325 mm. Therefore ISL facilities have two design possibilities: pipelines of required diameter are manufactured from rolled stainless steel sheets or the pipe line is composed of several parallel lines of smaller diameter.
Mains made of polyethylene can be laid over the surface, elevated on trestles and frames, or underground. However, polyethylene has a large coefficient of thermal expansion. It is particularly important to design for this factor when installing the pipe above ground. The underground arrangement of the Mains is designed on the basis of engineering and economic factors, geological mining and geographical conditions of the deposit.
Surface pipe lines will be more economical in uncultivated areas with short distances between the ion exchange plant and wellfield blocks even in the case of a complicated, irregular terrain and long operational periods. Under such conditions the replacement of tubing after 1.5–2 years will be economically viable. In the case of extended mains (over 3 km) and serial connection of wellfield blocks, the operating life of the pipe line will be equal to the working time of the whole deposit, perhaps 10 and more years. In such conditions buried or underground piping will be more sensible. When the main pipe line is laid in cultivated land, then a soil layer 0.2–0.3 metres thick and 12 metres wide should be stripped. A trench is dug to a depth lower then the frost penetration. In some cases the line can be buried above the freezing depth limits, if provided with proper thermal insulation. As a preventive measure, the pipeline trench should be covered with material capable of neutralizing the leaching solutions in case of small leaks. Such material neutralizing sulphuric acid can be finely crushed dolomite, carbonate-containing sand or rock. The protective layer thickness usually does not exceed 0.3–0.5 m.

255
Buried polyethylene lines should be designed to withstand both internal pressures and the external load of soils and temporary (surface traffic) loads, as well as atmospheric pressure when under vacuum and external hydrostatic pressure. The external load should be determined based on the pipe diameter, the trench and the embankment, installation conditions, soil type of the trench floor and walls, ground compaction, burial depth, nature and magnitude of temporary loads on the ground surface. Installation of the Mains is done with pipe-layers or track cranes.
Concrete water-conduits of irrigation systems with flumes of square or parabolic cross section can be used successfully as mains for transporting leaching solutions. Application of flumes in some facilities as old as 6–8 years showed their usefulness, even without additional coating of the internal surface. The outlet pipe lines (collectors) of the recovery lines usually operate under the force of gravity, rarely pressurized. The free-flowing pipe lines are made of polyethylene. The pipe line diameter is determined by the total capacity of the recovery wells in the row. In some cases the volume of recovery solution cannot be served by one pipe line. This necessitates the use of more lines laid side by side (in parallel). Such an approach results from a shortage or lack of strong, large-diameter pipes.
The laying of cumulative collectors is done on supports arranged to permit gravity flow in the lines inclined towards connection with the Mains.
The Branch lines for injection wells operate under pressure and are generally made of polyethylene.
Plastic hoses are usually used for distribution lines to both recovery and injection wells.
Pumping stations of the surface complex in ISL mines are an important link in the solution distribution system and include a complex combination of equipment and apparatus. There are pumps and motors of various type, meters and recorders, pipe line systems for internal use and for recovering solutions from reservoirs, valves for the solution control, electrical equipment and elements of monitoring. Pumping stations are designated for pumping all kind of leaching and injection solutions, delivering the injection solutions to the wellfield sites and into injection wells, hoisting the production solutions to the surface and to the ion exchange plant, pumping acids and feeding water for preparing solution.
The number of pumping stations depends on the process system and leaching schemes, capacity of the facility, the number of processing units, and the pipe line distances. The simplest scheme of a mining field has two pumping stations: one for feeding the recovery solutions to the ion exchange unit and one for distribution of injection solutions throughout the injection well rows. The greatest number of pumping stations in service are necessary when local processing units (modules with adsorption columns) are used with each wellfields of the deposit in operation.
The main parameters of pumping stations are flow capacity and the complete lifting height (head), differential pressure.
Since the ISL scheme provides a closed circuit of leaching and recovery solutions which maintains a steady balance of these solutions, the choice of the pumping station parameters becomes relatively easy.
256
As the rule, the pumping stations are sized to deliver solutions at average flow rate, therefore their capacity is calculated as follows: Q = � • S/T
where � — coefficient of solution volume increase due to higher yield of recovery wells or intake of injection wells (usually below 1.2);
S = maximum daily productivity of the mine for solutions;
T = daily (24 hours) operational hours of the pumping station (ISL field)
The pumping stations head for leaching solutions: Hl.s. = Hg.s.+Hg.i.+Ht+hss+his,
where:
Hg.s. = geodetic height of suction, i.e. the difference of the pump axis indication and the dynamic level of solution in the solution hoist;
Hg.i. = geodetic height of injection; i.e. the distance from the pump axis to the entrance valve of adsorption columns;
Ht = necessary head (pressure) at the tubing inlet;
hss and his = head loss (friction) in the suction and injection lines of the pumping station and wellfield sites.
The pumping stations can be equipped with centrifugal or piston pumps. Generally the pumping module should have at least two pumps including the reserve in parallel. If the capacity of one module is not sufficient, than additional pump modules are installed.
The building of a stationary pumping station is designed to accommodate future capacity expansion.
12.6. GENERAL PURPOSE SERVICES, POWER SUPPLY, OPERATIONAL ORGANIZATION
12.6.1. Central research laboratory
An ISL facility has to carry out research on operational performance, complex hydrogeological, geophysical, hydrogeochemical investigations, environmental monitoring, technological studies, etc. These activities require application of chemical, physical, hydrological and fluid dynamic methods of analysis. The extent of work requires that the facility should have a special division within its structure to handle all methods of analysis and directions of scientific research (chemical analysis, hydrogeology, hydrogeochemistry, geophysics, engineering geology, X ray spectroscopy, mineralogy, technology, ecology, etc.), as well as a pilot plant.
The extent of a Laboratory’s activities includes laboratory leaching and process studies, chemical, spectroscopic, X ray spectroscopic, hydrochemical, mineralogical and other investigations, larger scale research for development of various elements of the ISL technology, as well as analytical support for the ISL commercial operations. The laboratory has to be equipped with modern, efficient equipment and devices which can automate the research processes. All equipment and devices should be supplied with electrical power, compressed air, water, and steam from the facility systems. The laboratory should be incorporated within the general layout of the facility such that expenditures for the service and
257
support infrastructure are minimized. This local laboratory along with a pilot plant should be designed on the basis of Initial Data and materials delivered by the Supplier and based on the requirements of proper authorities.
In the laboratory design, special attention should be paid to the pilot plant. Its equipment should be sufficient to encompass the broad extent of multivariant technological studies. Therefore prior to compiling the Technical Basis for Design, the Supplier should deliver, as part of Initial Data, a list of research and experimental work within the scope of the ISL process.
12.6.2. Maintenance, garage and storage services
The list of major equipment applied in ISL facilities includes drilling rigs, compressors, various (piston, centrifugal and immersion) pumps, adsorption and desorption columns, filters of various type, etc. In addition, tractors, bulldozers, truck and tractor cranes, pipe-layers, winches of various design and purpose, trucks (drop-side, dumpers, tanks for solutions and acids) and other equipment may be required.
The stores are to be equipped with hoisters, crane-blocks, travelling cranes. The ISL facilities consume large quantities of bulk solid materials (clay, weighting material, cement), acids (sulphuric, hydrochloric, nitric), and other reagents, with usage reaching tens and even hundreds of thousand tons per year. All these equipment, engineering means and materials are to be handled by proper service bodies of the facility.
Repair and Maintenance Services. Beside repair of the main and auxiliary equipment, the repair and maintenance (R&M) services have to prepare screens for operating wells, well head equipment, as well as cut the drilling and casing tubing and pipe. The R&M group must have numerous capabilities including engineering, locksmith/assemblage, welding, electrical assemblage, blacksmith, engine, painting and other divisions.
The design takes into account the labour requirement and workload for each shop, calculates the manpower, annual requirements for materials and supplies, and plans for annual repair and maintenance service in monetary and labour units of all activities (overhaul, manufacture of spare parts, non-standard equipment, moulding, etc.). The schedule also takes into account the co-operative efforts with other repair and maintenance groups.
Garage Service. The design should be based on the scope of mobile equipment services to be provided, the types and number of vehicles and mechanisms, the conditions of their operation, and the place for overhaul. The technology for service and repair of the various vehicles is established based on the latest technological, equipment and devices that will improve garage efficiency, repair quality and reduce repair manpower. A larger scale planning of the garage service schedule must factor in the various vehicle efficiency coefficients, coefficient of operational standby, annual mileage, periodicity of operating impact, and the required hours and manpower for service.
Warehouse Service. In the case the facility has no connection to railway or ship line, then some storage buildings for acids and loose materials should be erected at the railway station or the port, in addition to the facility’s storage at the production site. The warehouse capacity depends on the distance between the facility and the railway station (port), reliability of the transportation, seasonal fluctuation of delivery, etc. When the facility is far from the station (port) and seasonal fluctuation is unavoidable, cargo delivery would require strict organization
258
and will increase the production cost of the end product. Therefore a sensible arrangement of warehouse facilities becomes quite important. A noticeable role belongs to mechanized cargo handling, packing in containers, and highly efficient pumps for handling acids. All these issues are to be taken into consideration when designing the storage service.
Heating System. At the initial design stage of the heating system, the main heat consumers and their characteristics are determined, the capability of present heat supply systems determined, and the possibility to use local heat resources transformed into heat energy is evaluated. The expansion of the heating capability should be done based on standard design of boilers. The heating transmission lines are sized for their distance, the method of installation, the methods compensating for thermal extension, thermal insulation and anticorrosion protection of the lines, as well as the location of facilities (thermal stations, pumping stations, systems of heat control)within the piping network.
The major basic technico-economic parameters are the following:
�� for heating sources — established efficiency, Gcal/h; specific consumption of fuel equivalent, Tfe/Gcal/h; specific costs per unit of established efficiency, cost/Gcal/h;
�� for heating transmission lines — the calculated efficiency of thermal load, Gcal/h; specific capital investment per Gcal/h of the calculated transferred heat load, cost/Gcal/h; per km of the heat transmission line distance (one line), cost/km.
Air Supply. The design should include specifications for the required compressed air, its pressure, and purity standards. The compressor type and quantity are chosen based on these specifications. The specifications for compressed air pipe lines are set as well as the mechanization and level of automation in the compressed air station and pipe line service.
Electrical Power Supply. The main decisions determining the electrical power supply requirements for the facility should be co-ordinated with regional development of the power supply grid. In the case where some power is generated internally, one should calculate an energy balance (incoming/consumed) and power production as well as compile a master balance sheet which includes the energy consumption from the external power system.
The design gives the choice of external voltage (35 kV and higher) and inter-site (6 to 1 kV) energy supply after comparison of several alternatives and gives the facility’s energy supply scheme. The substations and power lines are shown in the general layout plan. Characteristics of substation construction are given: the type of complex switch-gear 6 — 10 — 35 kV, transformation substation 220–110/35–6–10 kV, transformation substation 6–10 kV and transformation substation 6–10/0.4 kV, switch-board type, relay protection, local switch-boards. In areas of high specific resistance of rock or permafrost, special grounding devices should be specified (in wells or remote grounding electrodes).
Personnel for operation/repair/maintenance of the facility’s electrical power lines are determined, as well as the structure of the service for power lines, dimension and equipment of production network (shops, single rooms, etc.).
12.6.3. Industrial engineering and management
The design for this subsection considers Initial Data delivered by the Customer (reconstruction, expansion or construction of a new facility), production and management structure of the present facility, standard decision, as well as comparison charts on analogous enterprises (for new construction).

259
Considering the structure, there are basic, auxiliary and service divisions. Every division is assigned with special operation regime: shifts, work days, annual schedule. The management structure concerns levels of sites, departments, shops, mining administration, and facility.
12.7. GENERAL CONSTRUCTION DECISIONS, CONSTRUCTION ENGINEERING
12.7.1. General construction decisions
This section determines the calculated time for using buildings and industrial structures, general rules adopted for basic construction decisions (standards and regulations, industrial construction base, etc.), feasibility study of recommended variants of space/plan decisions on large and complex buildings and structures, construction decisions on the facility as a whole, as well as single buildings and constructions. In the case of site specific environmental conditions (seismic danger, permafrost, unstable ground, etc.), a list of necessary preventive measures is given.
A recommended scheme is also presented for arranging canteens, medical stations, and personnel accommodation, with indication of the type of service, capacity and number of people to be served. A description for the system of heating, air conditioning, water supply and sewerage is provided, as well as a list of standard documentation for the engineering decisions to be taken.
12.7.2. Construction engineering
On the basis of the design capacity of the facility and the number of personnel of the chief, auxiliary, and service departments, the population of the town (settlement) is calculated according to the standards approved by the Russian Federation State Construction Engineering Organization. The scope of construction is determined by the approved standard for living space per person. The number of stories and standard design series for housing are chosen depending on this standard.
The water, heat, and energy requirements are determined by the Sanitary State Standards according to the population.
12.8. PROTECTION OF THE ENVIRONMENT
12.8.1. Protection of the atmosphere
This section gives characteristics of physical/geographical and climatic conditions of the construction site, as well as the present background baseline concentrations of harmful impurities in the near surface layer of the atmosphere prior to the facility construction. Pollution sources (vent discharge from production buildings, dust from the internal roads, gases and acid aerosols from the operations, fumes from the power station and boilers) are to be determined including estimates of harmful materials which may pose health hazards. Specific measures to protect the atmosphere are to be designed and engineering solutions are recommended for abatement of dust/gas pollutants using gas scrubbers.
12.8.2. Protection and utilization of water resources
The natural pre-mine conditions of water resources are presented in documents delivered by authorities on water management and health/epidemiological service prior to the construction start-up. The total water use is to be calculated considering both surface and
260
undergroundwater sources. Specific measures are designed to prevent leaching solutions leakage into aquifers supplying potable water, as well as to restore stratal water in the productive horizons after ISL is completed.
12.8.3. Protection and utilization of land
A series of measures should be provided for protecting and utilizing the Earth’s surface (removing and storing the fertile top layer of soil, followed with later utilization; prevention of acid spills, recultivation of disturbed land, and planting vegetation in the areas of production sites, etc.).
12.9. GENERAL LAYOUT AND TRANSPORT
12.9.1. General layout
This section determines the extent of surveying to be carried out, concise engineering/geological characteristics of the construction site, near surface material types, their physical and chemical properties, the presence of local construction materials, information on hydrogeological conditions of the site, and specific construction conditions (permafrost, seismic potential, flooding of the sites, etc.).
A list of the main design considerations is compiled, and the feasibility of the adopted design plan is given regarding the arrangement of wellfield sites and auxiliary structures based on minimum transportation and communication costs taking into consideration the adopted wellfield development methods. The layouts of similar enterprises (if any) are described. Each wellfield site should be provided with an architectural plan based on the project flowsheet.
12.9.2. Transportation
The freight turnover of the facility is calculated as well as the alternatives for transportation (trucks, railway, other kinds of transport) to the site. In the case of the truck transport, a list of roads and their construction specifications should be provided, along with the total extent of cargo handled by trucks, lists of necessary structures to be erected, calculated daily freight turnover, truck types, transportation distances, necessary stock of vehicles, and number of drivers. The annual operational cost is to be calculated.
In the case of the rail alternative, the necessary number of railway division personnel should be calculated, as well as the freight train standard at the approach line number of freight cars, daily car turnover at the facility, and approach line distances, etc. While comparing the alternatives for external transport, one should take into consideration the capital and operational costs, and the most feasible and economic alternative is to be adopted.
12.10. CALCULATED COST OF CONSTRUCTION
The construction cost of the facility is to be determined with the reliability necessary for proper planning and evaluation of economic effectiveness of the capital investment. The construction cost of an ISL facility is estimated based on large-scale parameters for construction cost developed throughout the world based on contemporary standard methods.

261
Chapter 13
BY-PRODUCT RECOVERY FROM IN SITU LEACHING OF SANDSTONE URANIUM DEPOSITS IN UZBEKISTAN
In the process of exploration and exploitation of uranium deposits using ISL methods, it has been recognized these ores and the resulting leaching solutions contain a considerable amount of several rare elements. Any by-product, and its selective economic recovery will lead to a more profitable use of the deposit and increase the project value.
The most interesting of these elements are those which undergo valence changes in natural geochemical environment. They were accumulated, together with uranium, in the reduction barrier of the formation oxidation zone. These elements include selenium, molybdenum, rhenium, and vanadium and more uncommonly and at lower concentration — germanium, silver, and others.
The above metals differ in their geochemical properties depending on the conditions and mineral form in the ore forming zone. Rhenium and molybdenum are concentrated in conditions where uranium concentrates, and also under stronger reducing conditions. These metals can be successfully recovered by the solvents used for uranium ISL, especially when oxygen is added. Selenium and vanadium accumulate in a more oxidized portion of the ore zone, in a more acidic environment and require either stronger oxidants (e.g. chlorine, etc.) for their recovery, or special processes for their selective recovery from the solution. (for selenium — sodium sulphide solutions, Na2S).
Available information shows that the types and concentrations of elements accumulated both in the ores at the reducing barrier and in the leaching solution, differ throughout provinces and, to a lesser degree, within a province. Therefore the potentially economic components will vary from site to site.
Other rare and disseminated elements, though not forming considerable accumulations in the ore zone, still become partially leached from the host rock by sulphuric acid solutions. They can accumulate in the solutions to the levels that may potentially allow their economic recovery. They are primarily: scandium, yttrium, and lanthanides, and possibly gallium, aluminium, etc.
Table 13.1 shows the concentrations of associated components commonly found in uranium ISL solutions.
The process of the investigation and by-product recovery of rare and disseminated elements during uranium ISL includes certain interrelated aspects:
(1) Identifying the most complete spectrum of associated potentially valuable components in ores, host rock, and ISL leaching solutions at specific sites.
(2) Evaluating the economic value of each element, the present and future market requirements, and the availability of resources and technology for manufacturing the pure products.
(3) Studying the relationships of the distribution and concentration of these rare elements in ores and enclosing rock, the chemical processes of dissolution, migration and re-

262
precipitation in natural water and leaching solutions, development of methods for testing ore and solutions, and the estimation of current potential and recoverable resources.
(4) Developing economic procedures for leaching, recovery from solution and producing potentially valuable by-product components.
TABLE 13.1. CONCENTRATIONS OF ASSOCIATED COMPONENTS IN URANIUM ISL SOLUTIONS
Elements Concentration in uranium ISL solution, mg/L
Scandium Hafnium Rhenium Lanthanum Cerium Samarium Europium Gadolinium Terbium Thulium Dysprosium Erbium Ytterbium Yttrium Lutecium
0.05–1.01 1.63–2.86 0.01–3.30 1.16–5.8 0.91–11.50 0.35–4.50 0.02–0.28 0.30–2.00 0.25–1.18 0.13–0.17 0.23–1.00 0.17–0.40 <0.01–0.23 0.56–4.10 0.12–0.49
The complexity of the above tasks is compounded by the lack of methods for effective and inexpensive testing of ores and solutions for the large number of elements which may be present at very low concentrations in the deposits. In other words, a key issue for economic recovery of by-products from these deposits is, at present, the analytical laboratory methods available to identify these trace metals.
13.1. IDENTIFYING BY-PRODUCT COMPONENTS
The introduction of precise and efficient analytical methods has made it possible to obtain information on many potentially valuable components present in the ores and leaching solutions of uranium ISL deposits. Generally, the distribution of potentially valuable components is mainly determined by the sedimentary process and does not change in the process of epigenesis.
The data on the concentration of associated components in leaching solutions are of fundamental importance to access their prospects for recovery. Experience shows the concentration levels of associated components at sulphuric acid ISL sites are typically within the range, (mg/L): Re – 0.2–0.5; Sc- 0.15–0.6; V – 10–40; Li – 0.3–1; Rb – up to 1, Sr – up to 10; total yttrium and other rare earths elements (REE) – 10–40. In carbonate leaching solutions, Sc is generally not observed, Re is at the same level as in sulphuric acid solutions. Molybdenum concentration at some sites can reach 40 mg/L.
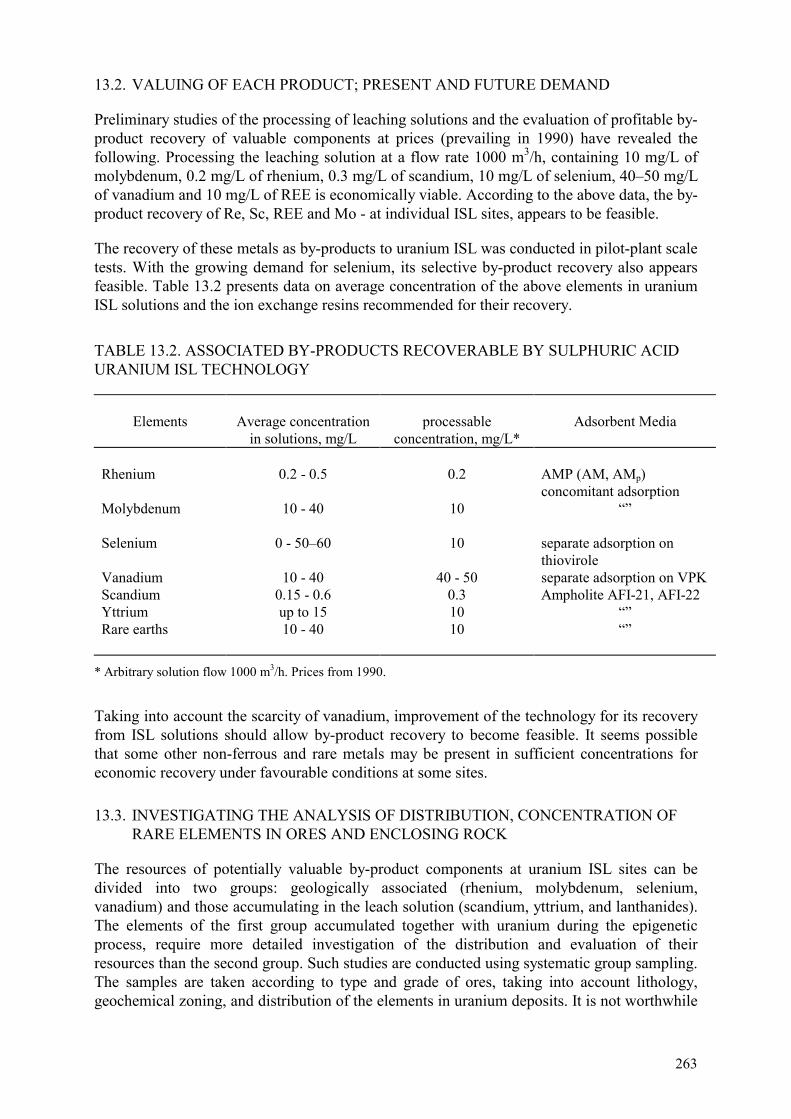
263
13.2. VALUING OF EACH PRODUCT; PRESENT AND FUTURE DEMAND
Preliminary studies of the processing of leaching solutions and the evaluation of profitable by-product recovery of valuable components at prices (prevailing in 1990) have revealed the following. Processing the leaching solution at a flow rate 1000 m3/h, containing 10 mg/L of molybdenum, 0.2 mg/L of rhenium, 0.3 mg/L of scandium, 10 mg/L of selenium, 40–50 mg/L of vanadium and 10 mg/L of REE is economically viable. According to the above data, the by-product recovery of Re, Sc, REE and Mo - at individual ISL sites, appears to be feasible.
The recovery of these metals as by-products to uranium ISL was conducted in pilot-plant scale tests. With the growing demand for selenium, its selective by-product recovery also appears feasible. Table 13.2 presents data on average concentration of the above elements in uranium ISL solutions and the ion exchange resins recommended for their recovery.
TABLE 13.2. ASSOCIATED BY-PRODUCTS RECOVERABLE BY SULPHURIC ACID URANIUM ISL TECHNOLOGY
Elements
Average concentration
in solutions, mg/L
processable
concentration, mg/L*
Adsorbent Media
Rhenium Molybdenum Selenium Vanadium Scandium Yttrium Rare earths
0.2 - 0.5
10 - 40
0 - 50–60
10 - 40
0.15 - 0.6 up to 15 10 - 40
0.2
10
10
40 - 50 0.3 10 10
AMP (AM, AMp) concomitant adsorption
“” separate adsorption on thiovirole separate adsorption on VPK Ampholite AFI-21, AFI-22
“” “”
* Arbitrary solution flow 1000 m3/h. Prices from 1990.
Taking into account the scarcity of vanadium, improvement of the technology for its recovery from ISL solutions should allow by-product recovery to become feasible. It seems possible that some other non-ferrous and rare metals may be present in sufficient concentrations for economic recovery under favourable conditions at some sites.
13.3. INVESTIGATING THE ANALYSIS OF DISTRIBUTION, CONCENTRATION OF RARE ELEMENTS IN ORES AND ENCLOSING ROCK
The resources of potentially valuable by-product components at uranium ISL sites can be divided into two groups: geologically associated (rhenium, molybdenum, selenium, vanadium) and those accumulating in the leach solution (scandium, yttrium, and lanthanides). The elements of the first group accumulated together with uranium during the epigenetic process, require more detailed investigation of the distribution and evaluation of their resources than the second group. Such studies are conducted using systematic group sampling. The samples are taken according to type and grade of ores, taking into account lithology, geochemical zoning, and distribution of the elements in uranium deposits. It is not worthwhile

264
to test all ore intersections, even by the group method. The spacing for group sampling of associated components during exploration can be quite large.
The entire effective thickness of the ore-bearing layer contacted by leaching solutions has to be tested. Since the associated elements are recovered only with uranium, their estimated resource is determined within the contours of the uranium deposits. Only at a site with considerable accumulations of the associated elements is it worthwhile to perform detailed testing of the ore bodies to determine if the selective recovery of potentially valuable components can be done without dilution of the leaching solutions. In cases where the by-product elements under study become the major product, the approach to their testing and resource evaluation should radically change.
The second group of elements is present in the ores and rocks in a disseminated form. Because of low concentration recovered in the ISL solutions, other evaluation methods are developed for the group. It would not be worthwhile to conduct mass testing and specially select “ore bodies”. The concentration and distribution of these metals in the ores and surrounding rock can be assessed by a loose network of mineralogical/geochemical profiles. Any reserve estimates of these elements would not be useful. It is more important to determine the reserves of the rare elements, which could be actually recovered in ISL solutions, as calculated per ton of acidified rock/ore mass.
The best method to evaluate the resources to be recovered will be the systematic geochemical testing of ores combined with a complex of laboratory and on-site research verifying the transfer of rare elements into solutions. The testing should be done throughout the mineralogical/geochemical sections including characteristic elements of epigenetic zoning and lithological/permeable types of ores. Because testing should determine only resources to be recovered, there would be no need to analyze the solid samples for rare elements before and after leaching. The analysis becomes easier, the number of analyses required decreases, and more attention can be paid to the quality and extent of analyses.
When conducting tests on disseminated elements, it must be recognized that they are mainly confined to leach resistant minerals that only partially decompose during uranium ISL. Leaching is slow and continues throughout the entire period of contact with acid solutions. The test time can be decreased by increasing the rate of the minerals break-down by using more aggressive leaching (more concentrated acid solutions, heating, and ground samples).
In some deposits many tests have been conducted to measure rare earth elements in dry residues of solutions using spectral semi-quantitative analyses and the method of three-phase arc plasma. This testing was done in two stages: the first — with the solution of acetic acid ammonium to indicate mobile forms, and then for one hour — with a hot 10% hydrochloric acid.
The generalized results of the micro-testing, with samples divided into classes and geochemical zones, are presented in Table 13.3. Generally they correspond to laboratory leaching test data. Still, more precise methods of analysis would be required to distinguish the distribution of the resources to be recovered throughout ore bodies, blocks, and geochemical zones.
The proposed methodology of microtesting, though requiring certain improvements for specific deposits, seems applicable to ISL projects. It provides the quick results necessary for

TAB
LE 1
3.3.
AC
ID R
ECO
VER
AB
LE Q
UA
NTI
TIES
OF
RA
RE
ELEM
ENTS
IN
CO
RE
SAM
PLES
FR
OM
TW
O I
SL B
LOC
KS
OF
SAN
DST
ON
E D
EPO
SIT,
g/t
Gre
y sa
nds
Oxi
dize
d sa
nds
Ave
rage
Gro
und
Elem
ent
fg
mg
cg
unso
rted
aver
age
fg
mg
cg
aver
age
for s
and
silts
tone
Sam
ples
nu
mbe
r 55
26
13
4
98
9 13
7
29
127
27
Sc
Y
Yb La
Ce V
Be
0.16
2.11
0.16
9.37
12.5
9
3.30
0.33
0.11
2.07
0.12
9.56
12.9
0
4.36
0.28
0.12
2.14
0.15
7.53
8.59
2.78
0.30
0.16
2.24
0.14
15.1
5
17.7
5
9.45
0.45
0.14
2.11
0.15
9.41
11.3
3
3.76
0.32
0.13
2.80
0.13
20.8
8
18.4
4
3.87
0.48
0.11
1.67
0.12
6.19
8.24
0.85
0.46
0.17
4.94
0.18
13.1
4
11.3
1
0.90
0.29
0.13
2.61
0.14
12.4
3
12.1
5
1.80
0.42
0.14
2.27
0.15
10.1
0
11.5
2
3.32
0.34
1.17
4.63
0.25
13.2
4
18.8
3
9.54
1.78
fg
= fi
ne-g
rain
ed;
mg
= m
ediu
m-g
rain
ed;
cg =
coa
rse-
grai
ned.
265
266
preliminary estimation of most potentially valuable components with little effort spent on extensive testing. The evaluation of the such potential by-products in operating ISL sites should be differentiated depending on the degree of concentration in ores and solutions, and the recovered value of each element. The measure will allow the user to obtain data to help in determining the most expedient way of extracting metals from a complex deposit.
13.4. DEVELOPMENT OF ECONOMIC BY-PRODUCT RECOVERY
Laboratory tests have shown that molybdenum and rhenium are well recovered by the ISL reagents, both by sulphuric acid and carbonate procedures. Oxidants introduced into the solution increase the recovery of rhenium and molybdenum to as high as 70–90%. In many cases rhenium is transferred into the solution even before uranium. The calculation of the rhenium balance carried out at one ISL site (by testing the observation wells) has shown 50% recovery. The lower rhenium yield as compared with the laboratory tests results is probably related to insufficient oxidant in the solutions, since no oxidant was added to the productive layer. Molybdenum and rhenium are adsorbed on resins, together with uranium.
While, scandium, thorium and REE cannot practically be recovered using the carbonate procedure, they are partially leached using sulphuric acid solution. Laboratory tests have shown that the recovery of uranium-associated scandium and yttrium is determined by the acidity of the solutions. Scandium concentrations were observed to rise only at a pH value below 2.0. The maximum concentration of scandium at a pH > 2.0 is 3.2 mg/L. This occurs close to the maximum concentration of aluminium (920 mg/L). The maximum scandium recovery is in the range of 7.5–30%. At higher concentrations of acid, higher temperature, longer contact time, and addition of HF, the scandium recovery increased by 25–30%. The concentration of scandium in the laboratory test solution varied from 0.2 to 7 mg/L. The flow of a scandium- and yttrium-bearing sulphuric acid solution mixed with fresh ore causes precipitation of these elements. Then, upon reduction of the pH - the leaching produces the highest concentration of scandium and yttrium in the solution. Leaching of the re-precipitated scandium is done in two stages related to its two hydrolyzed forms. The second one is associated with re-precipitation by iron hydroxide and is even more resistant to leaching. There are studies underway to recover scandium, yttrium and REE from the ISL solutions by various resins and extractants, e.g. resins KU and AFI-21,22.
In summary, the scientific investigations have created a basis for potential profitable recovery of rhenium, scandium, yttrium, REE, molybdenum, vanadium and selenium from uranium ISL solutions. However, caution should be exercised in basic economic planning on by-product recovery, because experience has shown that unexpected difficulties can severely reduce the profitability of a planned by-product recovery.
BIBLIOGRAPHY TO CHAPTER 13
SECHEVITSA, A.M., KOROLEV, Y.I., BOBROVA, L.V., et al., Methodological Recommendations on Foundation of Indices for Complex Utilization of Minerals in Exploration and Evaluation of Non-Ferrous Metal Deposits, M.,VIEMS (1984).
SECHEVITSA, A.M., Geological Production Evaluation of Associated Minerals in Complex Ore Deposits, M., Nedra (1987).
SKOROVAROV, J.I., FAZLULLIN, M.I., In-Situ Leaching Method for Complex Recovery of Associated Components when Working Hydrogenous Deposits: Symposium of Mining Industries Scientists, Pshibram (1990).

267
Annex I
GLOSSARY
Acid capacity the ability of rock to react with a certain amount of acid (usually sulphuric), employed for leaching. It is expressed in relative units (acid mass per ore mass) or in per cent. The neutralizing power of a base expressed as the number of hydroxyl ions available per molecule.
Acid content of solution
free acid concentration in the solution in g/cub.dm.
Acid flooding of wellfield (ore blocks)
preparation of the ore for in situ leaching by displacing the undergroundwater contained in the pores within the rock with an acid leaching solution.
Acid leaching the use of acidic solutions (usually sulphuric acid) in leaching projects. Normally restricted to ore with a low carbonate (<2%) content.
Active flow rate (Va)
the actual fluid velocity through porous media. It is related to the superficial velocity (V), which does not account for the active porosity (Pa), according to the ratio Va = V/Pa; thus with Pa = 0.33 Va = 3V.
Active porosity (Pa)
the ratio of volume of the water involved in flow (Vd) to the total rock volume (V) : Pa = Vd : V; Pa is equal or less than Po (Po - see OPEN POROSITY). In highly permeable sands (large and middle grain size) Pa = Po;in clays Pa = 0.
Adsorption (loading, ion-exchange)
a physical-chemical process of adsorbing useful components from solutions or pulps while leaching ores and concentrates. A process in which a substance or entity concentrates or holds another substance upon its surface. The absorbate is concentrated on the surface of the adsorbent by adhesive forces.
Air lift an apparatus used for pumping water from wells. In operation, compressed air enters the eduction pipe and mixes with the water. As the water and air rise, the air expands and is practically at atmospheric pressure at the top of the discharge pipe. (From: A dictionary of mining, mineral, and related terms, US Bureau of Mines, 1968.)
Alkaline leaching
the leaching of useful components from ores, using carbonate and/or bicarbonate solutions.
Annulus the space between the drill string or casing and the wall of the borehole or outer casing.
Aquiclude geological formation that, although porous and capable of absorbing water, does not transmit it at rates sufficient to furnish an appreciable supply for a well or spring.
268
Aquifer (1) porous water-bearing formation(bed or stratum) of permeable rock, sand, or gravel capable of yielding usable quantities of water. (2) a permeable (water-bearing) geological formation (rock, bed or a part of it) containing, compared with its surroundings, relatively significant quantities of water (see also Artesian, Confined, Leaky, Unconfined aquifers, comp. Aquiclude, Aquitard).
Aquifer protection
a set of measures ensuring hydrochemical monitoring of the groundwater quality, limiting the migration of toxic components and providing for aquifer restoration.
Aquitard geological formation with a low permeability which transfers water at a very slow rate compared with an aquifer.
Barrier an engineered physical obstruction, confining flows (solutions or undergroundwater) within the system boundaries. May have various forms including water curtains, grouting, hydraulic pressure ridges, and other inhibitors to fluid movement.
Channelling of solutions
formation of pore canals of higher permeability due to migration of fine grained fraction of solid particles within a subsurface zone. Often caused by a pressure gradient exceeding the formation fracture pressure or by gas migrating as an independent phase (bubbles).
Clogging or plugging
blockage of the effective porosity by chemical precipitates (chemical plugging) or fine particles (suspension) introduced into a aquifer (mechanical plugging), or by has produced from chemical reactions or by reduced hydrostatic pressure (gas blockage), which partially or totally fill the pore space within an aquifer.
Darcy a unit denoting permeability(s) of the rocks. It is related to the hydraulic conductivity (C) in the equation C = �/�•s, where � - the density, and � - the fluid viscosity. In fresh water one darcy relates to about 1m/day (0.85 m/day, to be exact).
Desorption a process opposite to adsorption, comprising the recovery of adsorbed components from ion-exchange resins. The reverse of absorption or adsorption, as in the release of one substance which has been “taken into” another by a physical process, or the release of a substance which has been held in concentrated form upon a surface.
Diffusion coefficient
The rate of diffusion of particles across a given area is proportional in amount, and opposite in sign, to the concentration gradient. This
relationship is defined by the equation: dw Ddedx
st� � , where the
DIFFUSION COEFFICIENT D is the mass of material diffusing across a plane 1 square centimetre in area, and dw is the quantity diffusing
across the plane in time dt when the concentration gradient is dcdx
.
269
Diffusion leaching
the leaching of components, mainly involving diffusion processes for mass transfer.
Drilling fluid (mud)
a water- or air-based fluid used in the water-well drilling operation to remove cuttings from the hole, to clean and cool the bit, to reduce friction between the drill string and the sides of the hole, and to seal the borehole.
Dynamic level the subterranean water level, either lowered by pumping or raised as the result of injecting fluid into an aquifer; expressed in meters.
Effective thickness
the useful thickness of a productive aquifer (including the permeable ore bodies and enclosing rocks), where the major (80 – 90%) mass movement is taking place as solution flow. The effective thickness is equal to, or less than, the total aquifer thickness.
Effective porosity (pe)
a porosity index characterizing the specific total capacity of rock, taking into account the physical-chemical interactions of the solution component under study (Pe is equal or less than Pa); with no interaction (Pe = Pa) the term denotes the active porosity.
Electrical (geophysical) logging
a type of logging used for studying geological sections of wells by measuring the electric resistance of rocks, the electric conductivity of rocks under the natural conditions in situ, natural electric fields, as well as the electric fields generated by electric current passed through the rocks.
Eluent (desorbate)
the liquid obtained by the desorption of components from ion-exchange resins, used for obtaining concentrates of end products.
Excursion spreading of the solutions beyond the perimeter of an ISL site or operation block under the forces of subterranean hydrodynamics. It may be controlled and mitigated by creating a local cone of depression by pumping which causes an influx of the groundwater from the surrounding area.
Flow rate the volume of liquid flow per time unit. It is sometimes used as a synonym to well yield, expressed in cub., m/day or cub., m/hour.
Fracture pressure gradient
the highest value of pressure gradient at which the smallest fractions (fines) start their migration through the pore canals in loose sandy rocks under the force of fluid flow. According to Terzagy, Imax = (�-1) (I-P), where � = the density and P = the rock porosity. The Imax value for quartz-feldspar sands comprises 1.2.
Geotechnoloy (Russian usage) science of physical-chemical processes for recovering minerals at their site of deposition and pertaining to mining methods. The geotechnological mining methods are: underground leaching (ISL), underground dissolution, underground melting, underground gasification, hydraulic mining by holes.

270
Grade thickness the product of ore bed thickness and the average mineral content contained therein, expressed in Thickness x % (metre % U).
Gravel packing a method of placing gravel or coarse sand in the annulus outside the well screen.
Ground water all types of waters, confined within the rocks of the earth’s crust.
Grout (cement) (1) to fill, or the material filling, the space around the pipe in a well, usually between the pipe and the drilled hole. The material is ordinarily a mixture of portland cement and water. syn. cement.
(2) a fluid mixture of cement and water (neat cement) of a consistency that can be forced through a pipe and placed as required. Various additives, such as sand, bentonite, and hydrated lime, may be included in the mixture to meet certain requirements. Bentonite and water are sometimes used for grout.
Head over roof the height of water in wells in relation to the upper limit, or roof, of an aquifer, expressed in meters. Hydrostatic pressure of an artesian aquifer.
Hydrogeological (test) well
a well equipped and used for a pump test or other specific hydrogeological studies.
Hydroinsulation (Russian usage) - the isolation or seating between the well casing and the drill (bore) hole surface.
Hydrostatic pressure
the sum of piezometric height and the position of a point over the horizontal plane of comparison, generally expressed in meters (or cm) of the water column.
Infiltration fluid movement in a porous medium under forces of gravity. There is a horizontal velocity with the preferential transport of fluid horizontally along the mineralized aquifer limits (with the recovery and injection wells fairly removed) and vertical velocity with the predominant motion of the solutions downwards, the filters or well screens located on top and at the bottom of the orebody.
In situ leaching (1) a chemical method of recovering useful components directly underground, using reagent solutions and pumping the productive solutions to the surface for further treatment and recovery of the useful components.
(2) the extraction of uranium from the host sandstone by chemical solutions and the recovery of uranium at the surface. ISL extraction is conducted by injecting a suitable leach solution into the ore zone below the water table; oxidizing, complexing, and mobilizing the uranium; recovering the pregnant solutions through production wells; and, finally, pumping the uranium bearing solution to the surface for further processing.

271
Injection feeding a leaching solution or water into underground strata through cased wells.
Injection well a well used to deliver liquids (leaching solution or water) into a productive aquifer.
Ion-exchange resin capacity
the content of the useful component in the resin phase, expressed in mg/g or kg/t.
Leaching well a well used in the ISL process.
1) Injection wells feed the leach solution into the formation, and recovery wells deliver the pregnant solution to the surface.
2) A cased and cemented hole with equipment installed to inject or recover fluids.
Liquid/solid ratio
the quantity volumetric of recovered solution per unit of rock mass leached required for economic recovery of useful components.
Logging a geophysical method of measuring the physical/radiological characteristics of rocks through which drill holes are bored. Used to conduct geological studies.
Mass transfer displacement of material by fluid or gas flow under the force of pressure difference (conduction), concentration gradient (diffusion), and temperature difference (heat convection), etc.
Maximal permissible concentration (mpc)
(Russian usage) the maximum allowable concentration of a metal, element, or other substance in water authorized for domestic use. The norms are determined by the State Standards.
Mine waters the underground (sometimes surface) waters, penetrating the orebody to be leached and affecting the development and leaching of deposits. In regulatory affairs, the subsurface fluids authorized for use in ISL operations.
Monitor (observation) well
(1) a well used to measure the hydrostatic level and/or chemical and radiological composition of undergroundwaters.
(2) a surveillance (observation) well located usually along the periphery of a wellfield, either around the periphery of the mine zone or in overlying or underlying aquifers. It is used to indicated containment and/or lixiviant migration beyond the wellfield boundary. When the upper control limit, as indicated by a designated component reaching a specified concentration in a monitor well is exceeded, corrective action is initiated.
Ore A mineral or combination of minerals found in nature, usually mixed with other substances. By convention, ORE denotes economic recoverable quantities of one or more minerals.
272
Permeability the ability of rocks to pass liquids and gases; expressed in DARCY units. The rock permeability for water or solutions is generally expressed by a PERMEABILITY COEFFICIENT, accounting for the intrinsic permeability of rock and the physical properties of the formation liquid (density and viscosity).
Permeability (1) and ability of rock or soil to transmit fluid (such as water) under a hydraulic gradient (comp. Intrinsic permeability, Hydraulic conductivity). (2) the ability of rocks to pass liquids and gases, expressed in DARCY units. The rocks permeability for water (solutions) is generally expressed by FILTRATION COEFFICIENT, accounting for the permeability of rock per se and the physical properties of filtration liquid (density and viscosity).
Permeable rock rock having a texture that permits water to move through it under a hydraulic gradient (syn. Pervious rock, see Permeability).
Piping the movement of soil particles by percolating water leaching to the development of channel.
Pressure gradient
loss of head (�h) per flow path length (l): I = �h/L, which is the driving force of flow through the rock pore space (according to Darcy, the water flow rate through the rock is V = CI, where C = hydraulic conductivity). The natural undergroundwater flow under plane conditions is I = ca.n • 10-4, an abstract value. In ISL it is 3 to 4 orders of magnitude higher with the use of injection and recovery wells.
Producing aquifer
an aquifer containing ores, that can be worked by ISL.
Productivity of an orebody
the content of useful minerals expressed per unit of orebody area, kg/m2.
Pumping hoisting or lifting of liquids (solution, groundwater) to the surface using special devices (pumps, airlifts).
Recovery pumping groundwaters or production solutions to the surface to obtain valuable mineral components in commercial quantities.
Recovery factor (recovery coefficient)
the ratio of the recovered mineral to its initial quantity, expressed in %.
Recovery solution
the solution pumped to the surface through recover or production wells. It is formed underground as the result of physical-chemical inter-actions between the leaching solution and the rock mass being leached, and contains useful (minable) components in commercial concentrations.
Recovery well a well used to lift subsurface fluids to the surface.
273
Recycling solution
a low-grade production solution containing the useful component in a concentration lower than commercially acceptable but that could be recycled (after adding the leaching reagents) as leaching solution.
Restoration (groundwater)
(1) the returning of all affected groundwater to its pre-mining quality for its pre-mining use. (2) (Russian usage) restoring natural waters following decommissioning.
Reversal of flow changing the direction of leach solution flow between wells by making injection wells recovery wells, and vice versa, to improve recovery.
Screen porosity open space in a well screen defined as the relative area of the open space, or intake, versus the total surface area of the screen, in %.
Spent (barren) solution
the recovery solution devoid of useful components; may be used to prepare fresh leach solution by adding reagents.
Static level the natural (hydrostatic) subterranean water level undisturbed by injecting or pumping; it is expressed in meters from the earth surface or absolute elevation versus sea level.
Superficial velocity (v)
an apparent velocity of fluid progressing though permeable rocks. It is determined as flow rate of fluid (yield-Q) passing through an area unit (F) of an aquifer cross section (disregarding the medium porosity): V = Q/F.
Technological well
(Russian usage) used in geotechnology for ISL mining. Includes injection wells to feed the leach solution into the formation, and recovery wells to deliver the pregnant solution to the surface (see Leaching Wells).
Test well a well installed to observe or measure the effect of the leaching solution on the rock, or to determine the residual concentration of the component being leached.
Transmissivity rate at which water is transmitted through a unit width of the aquifer under a unit hydraulic gradient It is expressed as the product of the hydraulic conductivity and the thickness of the saturated portion of the aquifer.
Unconfined aquifer
upper limit of the aquifer is defined by the water table (level) itself. At the water table (the top of the saturated portion of the geologic formation), the water in the pores of the aquifer is at atmospheric pressure (as if it were in an open tank). Synonyms include: water-table aquifer, unconfined groundwater, and free groundwater.
Unplugging restoration of rock permeability by removal of plugging (clogging) material present in the pores using chemical treatment (dissolution) and mechanical evacuation (hole washing) of plugging material present in the pore canals.

274
Waste solution the barren or off-grade recovery solution that cannot be used for preparing new leaching solution, usually it may only be returned to the mining zone after all hazardous components are removed.
Well completion (well development)
the concluding stage of well installation, bringing the well up to the designed capacity, prior to the long-term performance under the chosen technological operational mode.
Well completion the process of casing a well, and perhaps cementing the casing in place. Also includes the drilling out to depth and placing the wells screen or other device for filtering any silt out of the fluid flowing into the well.
Wellfield unit (block)
a portion of an orebody, functioning as an independent production site with its own system of operational wells, communications, preparation and operational plans, under conditions of regular control over the geotechnological performance (on a monthly, quarterly, or annual basis).
Well screen a filtering device that serves as the intake or injection portion of wells constructed unconsolidated or semiconsolidated aquifer. A screen permits water or solution to enter or leave the well from the saturated aquifer, prevents sediment from entering the well, and serves structurally to support the unconsolidated aquifer material.
Well head a device which seals the well at the surface, but allows the release of gas into the atmosphere.
Well workover various measures taken to restore the integrity of the well (casing strings, screen), hydroinsulation and the flow capacity of the well by flushing the formation in the vicinity of the screen and cleaning and removing any material which blocks the producing interval or well bore. May include pump repair and/or casing replacement.
Wellfield (pattern) layout
the systematic arrangement of the injection and recovery wells. There are two basic types - those arranged in a linear series (generally alternating rows of injection and recovery wells), and the cell type, where injection wells surround each recovery well in a geometric pattern of a triangle, square or hexagon.

275
Annex II
THE IMPORTANCE OF ENVIRONMENTAL IMPACT ASSESSMENT FOR PLANNING ISL URANIUM MINING PROJECTS
Introduction
Today there is agreement among many members of the world community that an environmental assessment should be carried out before starting development of major industrial projects. While it is generally recognized that in situ leach (ISL) uranium mining technology has environmental and safety advantage as compared to conventional mining and milling, it is also accepted that ISL projects should not be started without giving appropriate consideration for environmental consequences.
The environment, in the broadest sense, encompasses man and his world, comprising both animate and inanimate components [1]. The physical environment includes surface geography, geology, soils, climate, surface water and groundwater. The biological environment comprises all living organisms, including plants and animals (both vertebrates and invertebrates). In examining the environment through various trophic (i.e. concerned with nutrition) levels, impacts on human health are ultimately considered.
Increasingly in many countries, the social and economic (frequently called socio-economic) environment is included in environmental assessment. Social and cultural issues may be more important where mines are proposed in undeveloped areas which may be populated by indigenous people who have a very different culture from that of the society interested in developing the mine.
ISL uranium mining – environmental and safety considerations
In situ leach uranium mining has several advantages as compared with conventional mining. ISL is a technology with environmental and safety, as well as economic, advantages when projects are well planned and correctly operated in suitable sandstone deposits.
Replacement of conventional mining by ISL reduces the exposure of workers to conventional industrial and radiological risks. Other environmental advantages include:
�� minimal surface disturbance; �� greatly reduced waste (tailings and rock); �� no mining nor metallurgical effluent; �� limited water use, with no aquifer dewatering; and �� site may be restored to pre-mining conditions.
The control and monitoring programmes for ISL uranium mining processes are associated with four broad categories [2]. They include: Hydrologic/groundwater controls and monitoring of underground solution flow patterns; Environmental impact monitoring of natural uranium decay series; Waste management and control programmes, including excess leaching solutions, process wastes, and potentially contaminated equipment, and; Conventional uranium mill in-plant health physics associated with uranium oxide slurries and powders, with additional concern for radon gas.

276
While ISL technology normally has reduced impacts as compared to conventional uranium mining, the associated environmental and safety impacts may be further reduced through proper planning, operations, monitoring, control and groundwater restoration (where necessary) following mining.
However, the importance of proper environmental planning cannot be over emphasized. While ISL is a technology with environmental and safety advantages when projects are well planned and correctly operated [3] there are examples of projects that fall far short of this standard. Two acid leach ISL projects that were developed and started operations with little or no consideration for the environment at Konigstein, Germany [4] and Straz, Czech Republic [5] have resulted in major problems of groundwater pollution. In each case use of the technology was implemented in populated areas in which drinking water aquifers are present in the immediate vicinity of the ISL site. At Konigstein lack of control of the residual leach solution could result in pollution of the nearby Elbe River. These projects resulted in groundwater cleanup projects each with an estimated costs of about US$ 1billion. Proper environmental planning could have prevented these problems.
The potential for pollution of a drinking water aquifer by residual leach solutions from a closed acid ISL project is also reported from Ukraine [6]. However, the details of the environmental situation at this site are not well known. These examples illustrate the importance of proper environmental planning for acid ISL projects. It should not be underestimated.
However, the licensing of acid ISL projects in Australia (Beverley [7], South Australia) and USA (Florence [8], Arizona), which respectively mine uranium and copper, indicate that properly planned acid leach projects can be developed in jurisdictions where the environmental aspects of mine development are strictly regulated. To obtain the necessary licensing and permits each project was required to complete a lengthy environmental impact assessment process.
Completing an environmental impact assessment is an important part of planning. The impact of each project is evaluated in the context of the pre-existing environment, regulatory and licensing requirements. Environmental impact assessment (EIA) [9] is a process in which environmental factors are integrated into project planning and decision making. An environmental impact assessment is comprised of an examination of the local environment around a proposed project, an examination of the proposed project, and a prediction of the potential impacts of the project on the physical, biological and socio-economic environment, with the objective to judge the acceptability of the project and control those impacts to acceptable levels, while maintaining the viability of the project.
Impact on aquifer water
Some of the most important questions associated with ISL mining are related to the groundwater effected during operations. These include the location of the project with respect to the local population (if any), pre-mining baseline water quality and water use. Where the water quality is low because it is saline, or other components exceed standards, water quality is less critical. Where water quality is good, or the project is located in the vicinity with aquifers used for drinking water or agricultural purposes, additional care is necessary to prevent excessive impacts and to complete restoration following leaching according to regulatory requirements.

277
The impact of ISL mining on groundwater differs based on the leaching technology used, either alkaline (i.e. using oxygen and CO2) or acid. It has been found in the US, where only alkaline leaching is used, that aquifers can be routinely restored to pre-mine quality following leaching. This led the U.S. Nuclear Regulatory Commission to conclude that “Based upon the accumulation of operational data and information, it has become apparent that ISL operations pose no significant environmental impacts” [10].
The amount of groundwater consumed in conjunction with ISL operations is normally much less than the amount displaced during dewatering activities required for conventional mining. Furthermore, it is reported that an ISL uranium project using alkaline leaching may consume 0.165 million cubic metres per year, or less water than is consumed through the cultivation of most agricultural crops grown under the same conditions [11].
Information describing aquifer conditions following acid leaching in the Former Soviet Union indicates that under, at least some natural conditions, long term environmental effects of the technology may not be as great as previously thought. Some evidence is available indicating that following mining the groundwater undergoes a series of naturally occurring chemical and physical changes that greatly reduce or eliminate the impacts of acid leaching. This “self restoration” or “natural attenuation” [12] results in chemical conditions in the mine area returning to near pre-mine conditions within 15 to 20 years. The evidence, which is incomplete at this time, is based on the results of post-leach monitoring which suggests that the movement of elevated amounts of dissolved substances does not exceed maximum allowable water quality limits more than a few hundred metres from the area leached [13].
An indication of the growing acceptance of acid leach technology is given by the recent licensing of BHP Copper's Florence ISL mining project using acid leaching in the state of Arizona. The permitting by the Arizona Department of Environmental Quality [14] and the United States Environmental Protection Agency [15] indicates that acid technology may be acceptable in highly regulated lands when projects are well planned and environmental considerations are adequately addressed. The project is designed to recover copper using 2000 wells over 15 years. It is equivalent to a large uranium ISL operation such as the Highland Uranium Project, Wyoming, USA.
The project is designed to protect drinking water aquifers in adjacent areas, with restoration following operation. The potential impacts of the ISL mining process on the aquifer were evaluated using groundwater flow and solute transport models, which models were based on an extensive hydrogeological assessment and groundwater monitoring programme.
Environmental planning for ISL
Over the last 3 decades environmental planning has become increasingly important in many countries. Today it is an fundamental and essential part of planning of any new uranium production facility. Environmental planning is frequently taken into consideration through some type of environmental assessment. This must be completed before a project is authorized to proceed with development. The evaluation is usually done by conducting an environmental impact assessment and producing an environment impact statement.
An environmental impact statement (EIS) [16] is a document which describes the local environment, the proposed project, its potential impacts on the environment, and possible mitigating measures. This document is a tool used in the assessment of the impact of the proposed project.
278
Generally, the environmental impact statement is produced by the proponent of the mining project, often with the assistance of specialist consultants. Members of the public in the area of the proposed development may have legitimate concerns about the nature and impacts of the project; their concerns should be identified and addressed. The third participant in environmental assessment is the authority which will judge the acceptability of the project and, if deemed acceptable, will issue the appropriate approvals.
The purpose of environmental assessment is, by examining the environment and the project, to assess potential impacts of a project on the physical, biological and socio-economic environment with a view towards determining mitigating measures for significant impacts and ultimately judging the acceptability of the project, balancing the potential impacts against the benefits.
Guidelines on preparation of an environmental impact assessment for uranium production projects are given in IAEA-TECDOC-979: [17]. Examples of two recently published EISs for ISL projects are: Final Environmental Impact Statement To Construct And Operate The Crownpoint Uranium Solution Mining Project, Crownpoint, New Mexico, published by the US Nuclear Regulatory Commission [18] and the Environmental Impact Statement(Main Report) for the Beverley Uranium Mine published by the project owner Heathgate Resources, Pty. Ltd [19].
Guidelines on good operational practice for ISL projects are given in IAEA-TECDOC-1059 [20].
As with all industrial activities proper environmental planning is an important part of development of ISL uranium mining projects. However, based on the demonstrated performance it has been established that ISL mining has clear environmental and safety advantages when compared to conventional mining. Furthermore with proper environmental assessment and good operational practice ISL uranium projects may be developed, operated and closed with little or no safety and environmental impacts.
REFERENCES TO ANNEX II
[1] INTERNATIONAL ATOMIC ENERGY AGENCY, Environmental Impact Assessment for Uranium Mine, Mill and In Situ Leach Projects, IAEA-TECDOC-979, Vienna (1997).
[2] BROWN, S.H., Radiological aspects of uranium-solution mining, in Uranium, vol. 1 (1982).
[3] UNDERHILL, D.H., In Situ Leach Uranium Mining – Current Practice, Potential and Environmental Aspects, ABARE OUTLOOK '98 Commodities Conference, Canberra, 3-5 Feb. (1998).
[4] OECD NUCLEAR ENERGY AGENCY, INTERNATIONAL ATOMIC ENERGY AGENCY, Uranium 1997 – Resources, Production and Demand, OECD, Paris (1998).
[5] ARIZONA DEPARTMENT OF ENVIRONMENTAL QUALITY, Final Florence Project Aquifer Protection Programme (APP) Permit, (Permit–101704), Arizona Department of Environmental Quality, Phoenix, Arizona, USA, 9 June 1997.
[6] MOLCHANOV, A., SOROKA, Y., ISAYEVA, N., MORDBERG, E., The state of environment on former site of in-situ leaching of uranium, Radioactive Waste Management and Environmental Remediation, Proc. fifth International Conference on
279
Radioactive Waste Management and Environmental Remediation, Berlin, Germany, Sept. 3-8, ASME (1995).
[7] HEATHGATE RESOURCES, Pty. Lt., Beverley Uranium Mine, Environmental Impact Statement (Main Report), Heathgate Resources, Pty. Ltd, Adelaide (1998).
[8] ARIZONA DEPARTMENT OF ENVIRONMENTAL QUALITY, Final Florence Project Aquifer Protection Programme (APP) Permit (Permit–101704), Arizona Department of Environmental Quality, Phoenix, Arizona, USA, 9 June 1997.
[9] INTERNATIONAL ATOMIC ENERGY AGENCY, Environmental Impact Assessment for Uranium Mine, Mill and In Situ Leach Projects, IAEA-TECDOC-979, Vienna (1997).
[10] GRACE, S.R., US NRC, Licensing update, issues and items of interest affecting in situ uranium solution mining, In Situ All Minerals Symposium, Casper, Wyoming (1989).
[11] McCARN, D., The Crownpoint and Churchrock uranium deposits, San Juan Basin, New Mexico: An ISL mining perspective, paper presented at Technical Committee Meeting on In Situ Leach Uranium Mining, Almaty, Kazakhstan, 9–12 September 1996, IAEA, Vienna.
[12] BRADY, P.V., BRADY, M.V., BORNS, D.J., Natural Attenuation, CERCLA, RBCA’s, and the Future of Environmental Remediation, Lewis Publishers, CRC Press LLC, New York, (1998).
[13] FAZLULLIN, M.I., NOVOSELTSEV, V.V., FARBER, V.J., SOLODOY, I.N., NESTEROV, JU.V., Restoration experience on uranium ore-bearing aquifers after in-situ leach via hydrogeochemical methods, paper presented at the IAEA Technical Committee Meeting on In Situ Leach Uranium Mining, Almaty, Kazakhstan, 9-12 September 1996.
[14] ARIZONA DEPARTMENT OF ENVIRONMENTAL QUALITY, Final Florence Project Aquifer Protection Programme (APP) Permit (Permit–101704), Arizona Department of Environmental Quality, Phoenix, Arizona, USA, 19 June 1997.
[15] US ENVIRONMENTAL PROTECTION AGENCY, Underground Injection Control Programme, Area Permit, Final Class 3 UIC Permit #AZ396000001 and Aquifer Exemption, 1 May 1997, USEPA, San Francisco, CA.
[16] INTERNATIONAL ATOMIC ENERGY AGENCY, Environmental Impact Assessment for Uranium Mine, Mill and In Situ Leach Projects, IAEA-TECDOC-979, Vienna (1997).
[17] INTERNATIONAL ATOMIC ENERGY AGENCY, Environmental Impact Assessment for Uranium Mine, Mill and In Situ Leach Projects, IAEA-TECDOC-979, Vienna (1997).
[18] US NUCLEAR REGULATORY COMMISSION, Office of Nuclear Materials and Safeguards, Final Environmental Impact Statement to construct and Operate the Crownpoint Uranium Solution Mining Project, Crownpoint, New Mexico, Docket No. 40-8968, Hydro Resources, Inc., NUREG–1508, Washington, DC, USNRC (1997).
[19] HEATHGATE RESOURCES, Pty. Ltd., Beverley Uranium Mine, Environmental Impact Statement (Main Report), Heathgate Resources, Pty. Ltd., Adelaide (1998).
[20] INTERNATIONAL ATOMIC ENERGY AGENCY, Guidebook on Good Practice in the Management of Uranium Mining and Mill Operations and the Preparation for their Closure, IAEA-TECDOC-1059, Vienna (1998).
280
Annex III
BIBLIOGRAPHY
(Nearly all of the references cited in this report are available only in the Russian language. Therefore an English language bibliography is included here).
BROWN, S.H., Radiological aspects of uranium-solution mining, Uranium 1 (1982) 37–52,.
CRAIG, F.F., Jr., The Reservoir Engineering Aspects of Waterflooding, Monograph Volume 3, Henry L. Doherty Series, Society of Petroleum Engineers of AIME — Second Printing (1971).
DRISCOLL, F.G., Groundwater and Wells, Second Edn., US Filter/Johnson Screens, St. Paul, MN, Sixth Printing (1995).
HOLEN, H.K., HATCHELL, W.O., Bibliography of Uranium In Situ Leach Technology, New Mexico Energy, Minerals and Natural Resources, Bureau of Economic Geology Report of Investigation Number 4, Santa Fe, NM (1988).
INTERNATIONAL ATOMIC ENERGY AGENCY, Uranium Extraction Technology, Technical Reports Series No. 359, Vienna (1993).
LERMAN, A., Geochemical Processes Water and Sediment Environments, John Wiley & Sons (1979).
MERRITT, R.C., The Extractive Metallurgy of Uranium, Colorado School of Mines Research Institute, Johnson Publishing Co., Boulder, CO (1971).
MUSKAT, M., Flow of Homogeneous Fluids, IHRDC, Boston, MA (1982).
NIGBOR, M.T., ENGELMANN, W.H., TWEETON, D.R., Case history of a pilot-scale acidic in situ uranium leaching experiment, US Bureau of Mines, Washington, DC (1982).
POURBAIX, M., Atlas of Electrochemical Equilibria in Aqueous Solutions, National Association of Corrosion Engineers, Houston, TX (1974).
SPINK, L.K., Principles and Practice of Flow Meter Engineering, The Foxboro Company, Foxboro, MA, 9th Edn (1978).
STEWART, C.L., REIMANN, L.J., SWAPP, S.M., Mineralogic considerations for uranium in situ leach mining: A preliminary study of uranium and associated mineralogy of roll-front uranium deposits in Wyoming and Nebraska, Technical Paper, CIM Bulletin 93 1045, November-December (2000).
TWEETON, D.R., PETERSON, K.A., Selection of Lixiviants for In Situ Uranium Leaching, Information Circular, US Bureau of Mines (1981).
U.S. BUREAU OF MINES, In Situ Mining Division, Bibliography of In Situ Leach Mining, US Department of Interior Bureau of Mines, Twin Cities Research Center, Minnesota.
The reader should also refer to references in ANNEX II of this report.
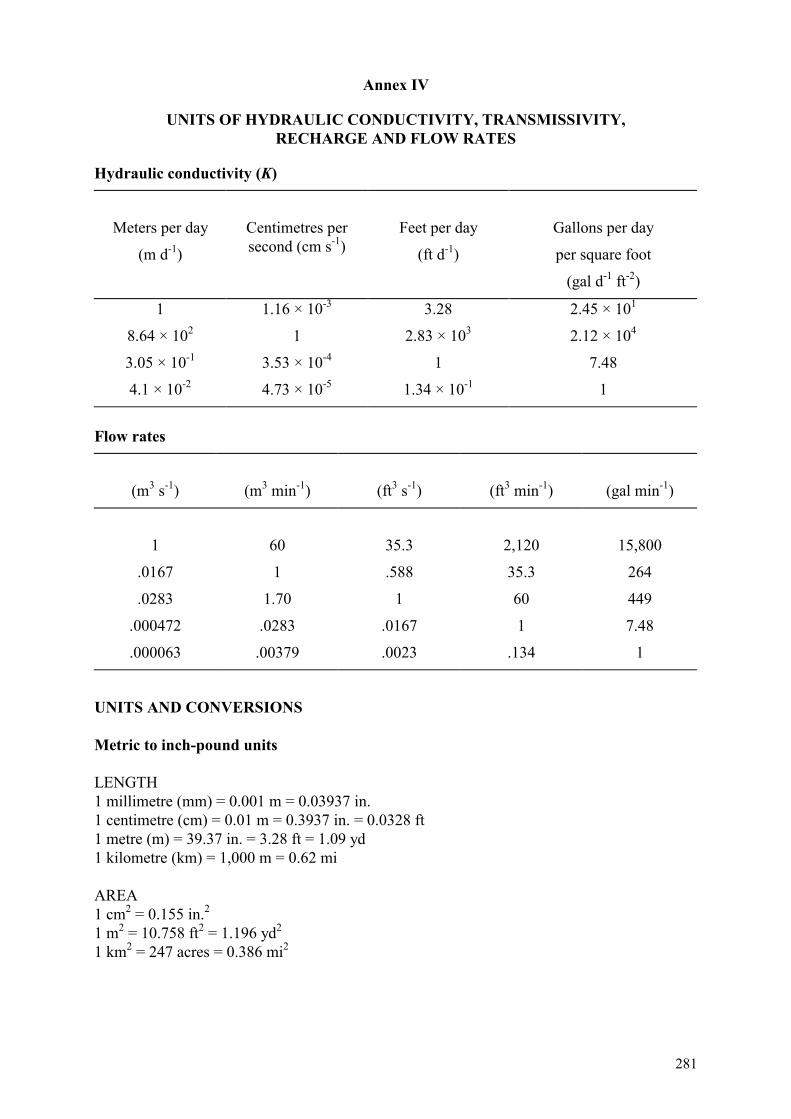
281
Annex IV
UNITS OF HYDRAULIC CONDUCTIVITY, TRANSMISSIVITY, RECHARGE AND FLOW RATES
Hydraulic conductivity (K)
Meters per day
(m d-1)
Centimetres per second (cm s-1)
Feet per day
(ft d-1)
Gallons per day
per square foot
(gal d-1 ft-2)
1
8.64 × 10²
3.05 × 10⁻¹
4.1 × 10⁻²
1.16 × 10⁻³
1
3.53 × 10⁻⁴
4.73 × 10⁻⁵
3.28
2.83 × 10³
1
1.34 × 10⁻¹
2.45 × 101
2.12 × 10⁴
7.48
1
Flow rates
(m3 s-1)
(m3 min-1)
(ft3 s-1)
(ft3 min-1)
(gal min-1)
1
.0167
.0283
.000472
.000063
60
1
1.70
.0283
.00379
35.3
.588
1
.0167
.0023
2,120
35.3
60
1
.134
15,800
264
449
7.48
1
UNITS AND CONVERSIONS Metric to inch-pound units LENGTH 1 millimetre (mm) = 0.001 m = 0.03937 in. 1 centimetre (cm) = 0.01 m = 0.3937 in. = 0.0328 ft 1 metre (m) = 39.37 in. = 3.28 ft = 1.09 yd 1 kilometre (km) = 1,000 m = 0.62 mi AREA 1 cm2 = 0.155 in.2 1 m2 = 10.758 ft2 = 1.196 yd2
1 km2 = 247 acres = 0.386 mi2
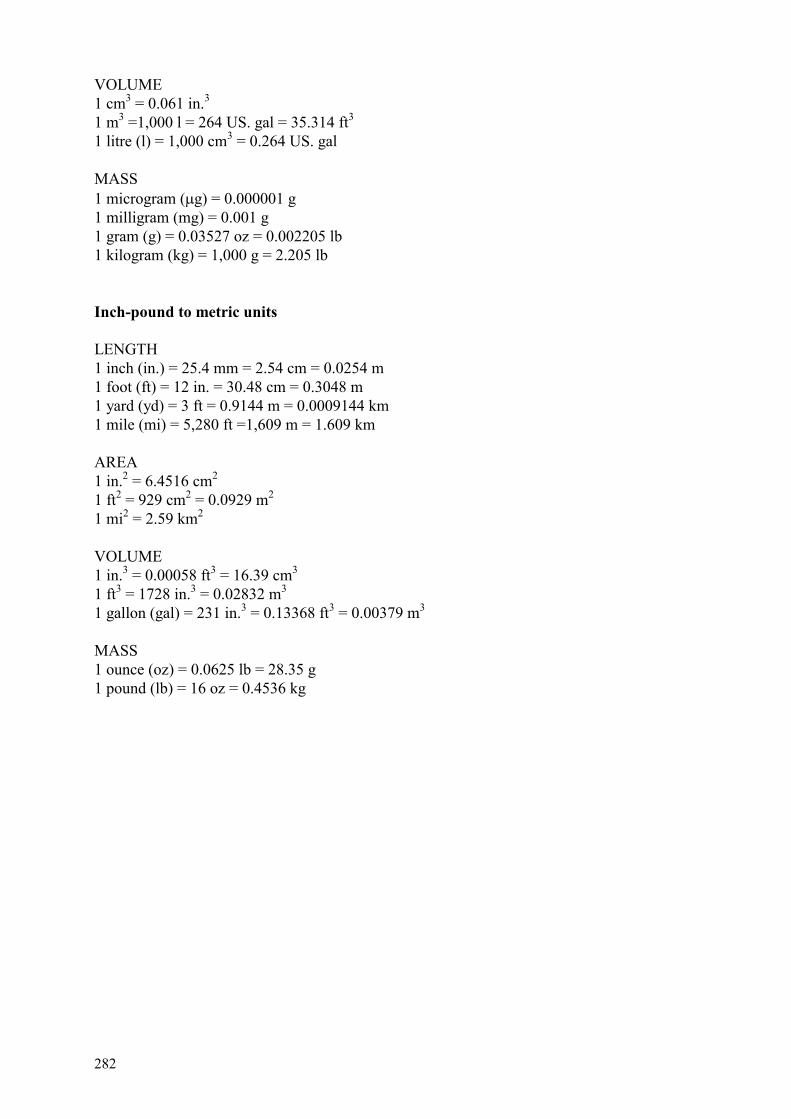
282
VOLUME 1 cm3 = 0.061 in.3 1 m3 =1,000 l = 264 US. gal = 35.314 ft3
1 litre (l) = 1,000 cm3 = 0.264 US. gal MASS 1 microgram (�g) = 0.000001 g 1 milligram (mg) = 0.001 g 1 gram (g) = 0.03527 oz = 0.002205 lb 1 kilogram (kg) = 1,000 g = 2.205 lb Inch-pound to metric units LENGTH 1 inch (in.) = 25.4 mm = 2.54 cm = 0.0254 m 1 foot (ft) = 12 in. = 30.48 cm = 0.3048 m 1 yard (yd) = 3 ft = 0.9144 m = 0.0009144 km 1 mile (mi) = 5,280 ft =1,609 m = 1.609 km AREA 1 in.2 = 6.4516 cm2 1 ft2 = 929 cm2 = 0.0929 m2 1 mi2 = 2.59 km2 VOLUME 1 in.3 = 0.00058 ft3 = 16.39 cm3 1 ft3 = 1728 in.3 = 0.02832 m3 1 gallon (gal) = 231 in.3 = 0.13368 ft3 = 0.00379 m3 MASS 1 ounce (oz) = 0.0625 lb = 28.35 g 1 pound (lb) = 16 oz = 0.4536 kg
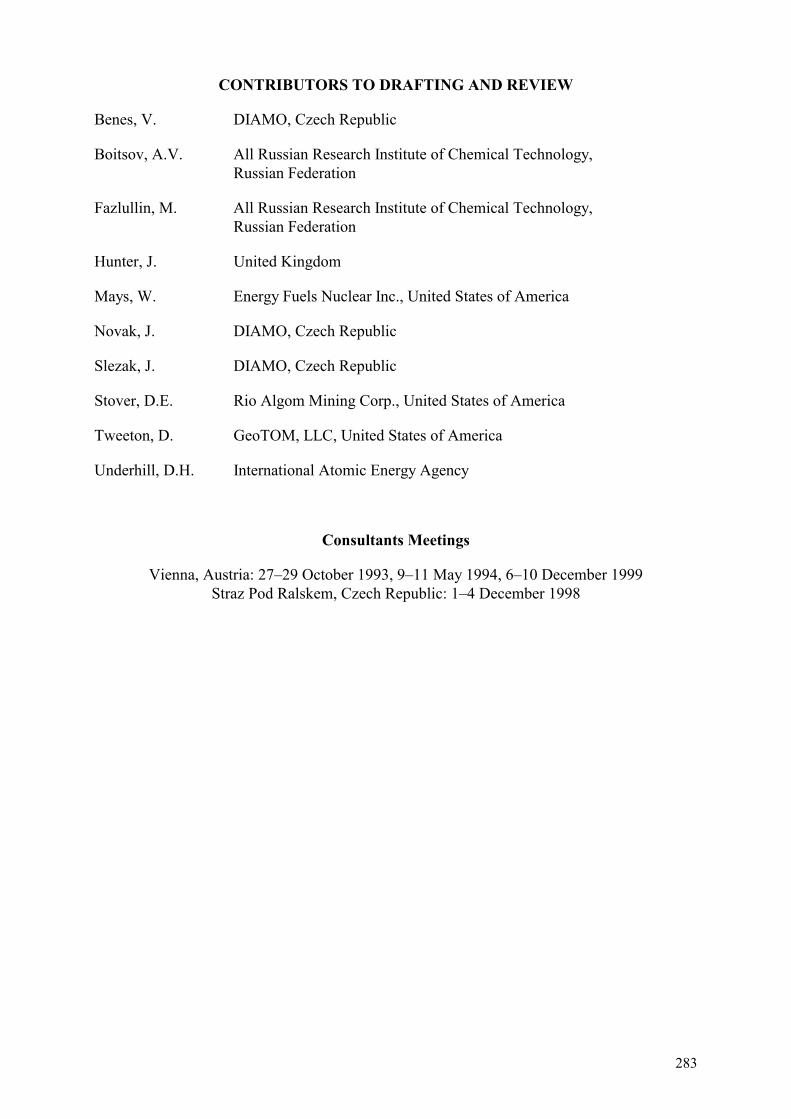
283
CONTRIBUTORS TO DRAFTING AND REVIEW
Benes, V. DIAMO, Czech Republic
Boitsov, A.V. All Russian Research Institute of Chemical Technology, Russian Federation
Fazlullin, M. All Russian Research Institute of Chemical Technology, Russian Federation
Hunter, J. United Kingdom
Mays, W. Energy Fuels Nuclear Inc., United States of America
Novak, J. DIAMO, Czech Republic
Slezak, J. DIAMO, Czech Republic
Stover, D.E. Rio Algom Mining Corp., United States of America
Tweeton, D. GeoTOM, LLC, United States of America
Underhill, D.H. International Atomic Energy Agency
Consultants Meetings
Vienna, Austria: 27–29 October 1993, 9–11 May 1994, 6–10 December 1999 Straz Pod Ralskem, Czech Republic: 1–4 December 1998

01-0
1194