Embed Size (px)
Citation preview


2
Manitoba Health, Seniors & Active Living
Annual Statistics 2014-2015
This page intentionally left blank.

3
Manitoba Health, Seniors & Active Living
Annual Statistics 2014-2015
Table of Contents
Preface..........................................................................................................................................7
How to Use This Report............................................................................................................8
Important Notes and Data Cautions.........................................................................................9
Additional Publications to Consider........................................................................................10
Demographics............................................................................................................................11
Map of Manitoba Regional Health Authorities�������...............................................12
Population Pyramids...............................................................................................................13
Pregnancy ..............................................................................................................................14
Births.......................................................................................................................................15
Deaths....................................................................................................................................16
Population Health Status and Mortality...................................................................................17
Premature Mortality................................................................................................................18
Infant Mortality........................................................................................................................19
Child Mortality.........................................................................................................................20
Disease and Injury.....................................................................................................................21
Hypertension (High Blood Pressure)......................................................................................22
Diabetes..................................................................................................................................23
Acute Myocardial Infarction (Heart Attack).............................................................................24
Stroke.....................................................................................................................................25
Chronic Conditions.................................................................................................................26
Injury Hospitalization...............................................................................................................27
Injury Mortality........................................................................................................................28
Prevalence of Mental Illness and Use of Services..................................................................29
Cumulative Mental Illness�...................................................................................................30
Mood and Anxiety Disorders...................................................................................................31
Personality Disorders..............................................................................................................32

4
Manitoba Health, Seniors & Active Living
Annual Statistics 2014-2015
Schizophrenia........................................................................................................................33
Substance Abuse...................................................................................................................34
Hospitalization for Self-Inflicted Injury....................................................................................35
Suicide...................................................................................................................................36
Health Services Insurance Plan ...............................................................................................37
Insured Services per Capita..................................................................................................38
Use of Medical Services............................................................................................................39
Number of General Practitioners and Specialists��.��..����������.............40
Number of Nurses and Nurse Practitioners�����..�����������...............41
Physician Use........................................................................................................................42
Majority of Care (formerly Continuity of Care).......................................................................43
Ambulatory Care Visits..........................................................................................................44
Use of Hospital Services...........................................................................................................45
Map of Hospitals by Facility Size...........................................................................................46
Use of Hospitals....................................................................................................................47
Inpatient Hospital Separations..............................................................................................48
Day Surgery����...��..�����������........................................................49
Hospitalization for Ambulatory Care Sensitive Conditions....................................................50
Alternate Level of Care.........................................................................................................51
High Profile Surgeries...............................................................................................................53
Coronary Artery Bypass Graft Surgery and Percutaneous Coronary Surgery��................54
Hip Replacement....................................................................................................................55
Knee Replacement.................................................................................................................56
Paediatric Dental Extraction...................................................................................................57
Cataract Surgery.....................................................................................................................58
Women's Reproductive Health.................................................................................................59
Hysterectomy.........................................................................................................................60
Caesarean Section................................................................................................................61
Vaginal Birth after Caesarean Section..................................................................................62

5
Manitoba Health, Seniors & Active Living
Annual Statistics 2014-2015
Use of Home Care Services......................................................................................................63
Total Number of Clients in Home Care at March 31, 2014����..���������.....64 Number of Assessments for Admission, Admissions and Discharges....................................65
Use of Personal Care Homes....................................................................................................67
Map of Personal Care Homes by Facility Size........................................................................68
Personal Care Home Admissions...........................................................................................69
Median Wait Times for Personal Care Home Admission........................................................70
Median Length of Stay (Years) at Personal Care Homes.......................................................71
Preventative Services................................................................................................................73
Breast Cancer Screening........................................................................................................74 Cervical Cancer Screening......................................................................................................75
Influenza Immunizations..........................................................................................................76
Pneumococcal Immunizations................................................................................................77
Prescription Drug Use...............................................................................................................79
Pharmaceutical Use.................................................................................................................80
Drugs Dispensed per User......................................................................................................81
Total Drug Expenditures by Plan and RHA.............................................................................82 Glossary.....................................................................................................................................83

6
Manitoba Health, Seniors & Active Living
Annual Statistics 2014-2015
This page intentionally left blank.

7
Manitoba Health, Seniors & Active Living
Annual Statistics 2014-2015
Preface Manitoba Health, Seniors and Active Living�s Annual Statistics report is designed for a broad audi-ence that includes health professionals, researchers, policymakers and the general public. This re-port describes Manitoba�s population, health utilization and health status using key health indica-tors measured both over time and for the most recently available fiscal or calendar year.
Manitoba�s health care system is a broad network of services and programs. Overseeing this sys-
tem is Manitoba Health, Seniors and Active Living, a department of the provincial government.
Primarily, services are delivered through regional health authorities�five regional agencies set up
by the province to meet the local needs of Manitobans�Winnipeg RHA, Southern Health-Santé
Sud, Interlake-Eastern RHA, Prairie Mountain Health and Northern Health Region.
In Manitoba, the regional health authorities are responsible, within the context of broad provincial
policy direction, for assessing and prioritizing needs and health goals, and developing and manag-
ing health services in their region.
Any inquiries pertaining to this publication generally or in reference to specific indicators should be addressed to: Information Management and Analytics Branch Manitoba Health, Seniors and Active Living Room 4044 300 Carlton Street Winnipeg, Manitoba R3B 3M9 Phone: (204) 786-7229
Karen Herd Deputy Minister Manitoba Health, Seniors and Active Living

8
Manitoba Health, Seniors & Active Living
Annual Statistics 2014-2015
How to Use This Report
The Manitoba Health, Seniors and Active Living Annual Statistics report is a descriptive report
comprised of thirteen sections. The report looks at the distribution of the population, mortality,
disease and injury, prevalence of mental illness, physician and hospital services, use of home
care and personal care homes, preventative services and prescription drug use. Unless other-
wise stated, indicators in this report are population-based rather than service-based. In other
words, the indicators reflect where people live, not where they received services.
For most indicators the report provides a rate by RHA and then a more in-depth look or
�Highlight� at the Manitoba level. For some indicators, the data is only presented at the Mani-
toba level. The majority of the indicators report data for the 2014/2015 fiscal year. Where
most recent data was not available, the prior year was used. However, in some instances due to
small numbers, multiple years had to be combined to ensure confidentiality and to achieve sta-
ble rates. For more information on how the indicators were calculated and defined please refer
to the glossary.
Indicators found in this report show similar trends to indicators found in other public docu-
ments. However, exact rates in this report cannot be directly compared due to different inclu-
sion and exclusion criteria.
The report provides descriptive analyses of indicators, not explanatory. Indicators are produced
using administrative data, which does not include information on context, history or local cir-
cumstances. The information in this report should be used in conjunction with information
from other sources so that regional and provincial planners and decision-makers can make well-
informed decisions.

9
Manitoba Health, Seniors & Active Living
Annual Statistics 2014-2015
Important Notes and Data Cautions Throughout the report, the RHAs are shown in a particular order based on their overall health status as measured by the premature mortality rate (PMR). PMR was calculated for the RHAs by the Manitoba Centre for Health Policy for the RHA Indicators Atlas 20131. A death before the age of 75 is considered to be premature; therefore the PMR is the average annual rate of deaths before the age of 75, per 1,000 residents under 75. The RHA with the lowest PMR (best overall health status) appears at the top of the graph. The RHA with the highest PMR (poorest overall health status) appears at the bottom of the graph.
Two types of rates are presented in this report: crude rates and adjusted rates.
Crude rates:
A crude rate is the expression of the frequency of an event in a defined population in a defined period of time. It is calculated by dividing the number of observations by the suitable population and multiplying by an appropriate multiplier (such as 100 to create a percentage). Although crude rates do not take differ-ences in population structure into account they are vital for policy and programming as they represent the actual rate in a given population.
Adjusted Rates:
The adjustment of rates is a statistical process that makes groups such as those in particular geographic areas comparable by removing the effects of demographic differences such as age and gender distribution. Essentially, adjusted rates tell us what the rates would be if each geographic area had the same age and sex distribution. Therefore, adjusted rates are fictional rates which use statistical models to remove the effects of age and sex differences to allow for comparisons across populations. Accordingly, while adjusted rates have been statistically modelled to be comparable to each other, they should be considered fictional in the sense that they do not measure anything directly. Please note that these adjusted rates cannot be compared to other rates which have not received the same adjustment.
Statistical Testing:
Statistical testing was performed to determine whether regional rates were statistically significantly different from the Manitoba rate for each time period. If a difference was statistically different, then we are 99% confident that this difference is not just due to chance.
Please note the following data cautions when reading the graphs:
(*) Indicates that the region is statistically different from Manitoba. (!) Indicates that the regional rate should be used with caution due to small numbers. (-) Indicates that the regional rate is suppressed because the numerator contains a small number of individuals which could potentially be identified. (..) Indicates that there was no data for this time period. ____________________________
1. Fransoo R, Martens P, Burland E, The Need to Know Team, Prior H, Burchill C. Manitoba RHA Indicators Atlas 2013. Winnipeg, MB:
Manitoba Centre for Health Policy, October 2013.

10
Manitoba Health, Seniors & Active Living
Annual Statistics 2014-2015
Additional Publications to Consider
While this report has attempted to provide an overview of statistics from across the health care system,
it is by no means exhaustive.
For more detailed information on cancer incidence and mortality, please refer to the following link from
CancerCare Manitoba � http://www.cancercare.mb.ca/resource/File/Epi-Cancer_Registry/
CCMB_CHA_Report-2014.pdf
The regional health authorities also provide statistics in the comprehensive Community Health Assess-
ments which are conducted every five years. The reports for each of the RHAs can be found at:
Interlake-Eastern RHA
http://www.ierha.ca/data/2/rec_docs/20654_2014CommunityHealthAssessment-Interlake-
EasternRHA.pdf
Northern RHA
http://www.northernhealthregion.ca/data/1/rec_docs/1083_NHR_2014_CHA_Report.pdf
Southern Health-Santé Sud
http://www.southernhealth.ca/cha.php?lang=en&
Prairie Mountain Health
http://www.prairiemountainhealth.ca/images/Community_Health_Assessment.pdf
Winnipeg RHA
http://www.wrha.mb.ca/research/cha2014/files/CHAReport2014.pdf
11
Manitoba Health, Seniors & Active Living
Annual Statistics 2014-2015
Demographics
The following section provides an overview of the demographics of the population
of Manitoba. This includes population distribution and size, pregnancies, births
and deaths.
In 2014/2015, Manitoba had a population of 1,306,309 residents. There were a
total of 19,641 pregnancies in the same year.
There were 16,292 babies born in 2013/2014. In the same time period, 10,129
Manitobans died, with the majority of these deaths being due to circulatory dis-
ease and cancer.

DEMOGRAPHICS
12
Manitoba Health, Seniors & Active Living
Annual Statistics 2014-2015

DEMOGRAPHICS
13
Manitoba Health, Seniors & Active Living
Annual Statistics 2014-2015
Population Pyramids
Figure 1 shows the age and sex composition of
the Manitoba population, based on records of
residents registered with Manitoba Health,
Seniors and Active Living on June 1, 2014. The
percentage of the population within each par-
ticular age group is shown for males and fe-
males. In 2014/2015, the total population of
Manitoba was 1,306,309 residents, of which
50% were male and 50% were female. In the
population pyramid above two distinct bulges
can be seen. One represents those in their fif-
ties, and the second represents those in their
twenties.
Figure 2 shows the age and sex composition of
Manitoba First Nations people based on re-
cords of self-reported First Nations residents
registered with Manitoba Health, Seniors and
Active Living on June 1, 2014. First Nations
people in Manitoba are a much younger popu-
lation. Of the 99,536 people who declared
their First Nations status to Manitoba Health,
Seniors and Active Living 54% were under the
age of 25, compared to only 33% for the Mani-
toba population overall.
For more information on Manitoba�s popula-tion, please refer to the Manitoba Health, Seniors and Active Living�s Population Report at http://www.gov.mb.ca/health/population/index.html.
Figure 1: Population pyramid for Manitoba, 2014/2015
Figure 2: Population pyramid for Manitoba First Nations
people, 2014/2015

DEMOGRAPHICS
14
Manitoba Health, Seniors & Active Living
Annual Statistics 2014-2015
Pregnancy
Figure 3 shows the age-adjusted rate of preg-nancies for Manitoba women ages 15 to 49 by RHA of residence. Pregnancies include all live births, stillbirths, abortions and ectopic preg-nancies.
In 2014/2015, there were a total of 19,641 preg-nancies among Manitoba women ages 15 to 49, representing a rate of 64.4 pregnancies per 1,000 women in the same age group.
Northern Health Region had a significantly higher age-adjusted pregnancy rate which is 67% higher than for Manitoba overall.
The majority of pregnancies in Manitoba were
among women ages 20 to 34, with 77.1% of
pregnancies represented by women in this age
group (Figure 4).
Figure 4: Percentage of total pregnancies by age group, 2014/2015
Figure 3: Age-adjusted rate of pregnancies per 1,000 female residents ages 15 to 49 by RHA, 2014/2015

DEMOGRAPHICS
15
Manitoba Health, Seniors & Active Living
Annual Statistics 2014-2015
Births
Figure 5: Crude rate of total births per 1,000 residents by RHA of residence, 2013/2014
Figure 6: Percentage of total live births by size for gestational age, 2013/2014
Figure 5 shows the crude number of live births
by RHA of residence, per 1,000 population.
In 2013/2014, there were 16,292 babies born to
Manitoba residents, representing a rate of 12.6
newborns per 1,000 population. Rates varied
significantly across the province, ranging from a
high of 23.2 births per 1,000 population in
Northern Health Region to a low of 11.1 births
per 1,000 population in Winnipeg.
The majority of babies born in Manitoba had a
weight that was appropriate-for-gestational-age
with 78% of newborns within this group (Figure
6). Of the remaining newborns, 12% were large-
for-gestational-age and 9% were small-for-
gestational-age.

DEMOGRAPHICS
16
Manitoba Health, Seniors & Active Living
Annual Statistics 2014-2015
Deaths
Figure 7: Age- and sex-adjusted rate of death per 1,000 residents by RHA, 2013/2014
Figure 8: Percentage of deaths by cause, 2013/2014
Figure 7 shows the age- and sex-adjusted death
rate per 1,000 population by region of residence.
In 2013/2014, 10,129 Manitoba residents died,
representing a rate of 7.9 deaths per 1,000 popu-
lation. The age-and sex-adjusted death rate in
Northern Health Region was significantly higher
than Manitoba overall.
In Manitoba overall, the five most common
causes of death were:
1) circulatory disease (29%)
2) cancer (27%)
3) respiratory disease (6%)
4) injuries (8%)
5) mental/behavioural (7%)
These five causes represented 79% of all deaths
(Figure 8).

17
Manitoba Health, Seniors & Active Living
Annual Statistics 2014-2015
Population Health Status and Mortality
The following section provides an overview of population health status and mortality
within Manitoba. This includes premature mortality rates, infant mortality rates and
child mortality rates.
From 2009/2010 to 2013/2014 an average of 3,696 Manitoba residents died each
year before the age of 75. For the same time period there was an annual average of
91 infant deaths and 100 deaths of children between the ages of 1 and 19. The rate of
death for male children remained consistently higher than female children.

POPULATION HEALTH STATUS AND MORTALITY
18
Manitoba Health, Seniors & Active Living
Annual Statistics 2014-2015
Premature Mortality
Figure 9: Age- and sex-adjusted rate of premature death per 1,000 residents under the age of 75 by RHA,
2009/2010 to 2013/2014
Figure 9 shows the age‐ and sex‐adjusted prema-
ture mortality rate (PMR). Premature mortality
is defined as death before the age of 75. PMR is
used as an indicator of general health of a popu-
lation; a higher PMR indicates poorer health
status.
On average, there were 3,696 Manitoba resi-
dents that died before the age of 75, represent-
ing a rate of 3.2 deaths per 1,000 residents un-
der the age of 75. The premature mortality rate
in Northern Health Region was significantly
higher than in Manitoba overall.

POPULATION HEALTH STATUS AND MORTALITY
19
Manitoba Health, Seniors & Active Living
Annual Statistics 2014-2015
Infant Mortality
Figure 10: Crude rate of infant deaths per 1,000 infants by RHA, 2009/2010 to 2013/2014
Figure 11: Crude rate of infant deaths per 1,000 infants by fiscal year
Figure 10 shows the crude rate of infant death by
RHA of residence. Infants are defined as individu-
als less than one year of age. Infant mortality is
seen as an indicator of health status, level of
health care in area and effectiveness of prenatal
care.
From 2009/2010 to 2013/2014, there were 457
deaths among Manitoba infants, representing a
rate of 5.8 deaths per 1,000 infants. The infant
mortality rate in Northern Health Region was sig-
nificantly higher than Manitoba overall.
Figure 11 shows the infant mortality rate in
Manitoba over time. The overall infant mortality
rate in Manitoba appeared to be relatively stable
over time, with the mortality rate in males being
generally higher than that of females.
*As new information becomes available slight
deviations from previous reports may be present.

POPULATION HEALTH STATUS AND MORTALITY
20
Manitoba Health, Seniors & Active Living
Annual Statistics 2014-2015
Child Mortality
Figure 12: Age- and sex-adjusted rate of death per 100,000 children ages 1 to19 by RHA,
2009/2010 to 2013/2014
Figure 13: Rate of death per 100,000 children age 1 to 19 by fiscal year
Figure 12 shows the age‐ and sex‐adjusted rate
of child death by RHA of residence. Children are
defined as individuals between ages 1 and 19.
From 2009/2010 to 2013/2014, there were 502
deaths among Manitoba children. This repre-
sented a rate of 32.4 deaths per 100,000 chil-
dren ages 1 to 19. The child mortality rate in
Northern Health Region was significantly higher
than Manitoba overall, while the rate in Winni-
peg Health Region was significantly lower.
Figure 13 shows the child mortality rate in Mani-
toba over time. The child mortality rate in Mani-
toba appeared to be stable over time, with the
mortality rate in males remaining consistently
higher than that of females.

21
Manitoba Health, Seniors & Active Living
Annual Statistics 2014-2015
Disease and Injury
The following section provides an overview of the burden of illness for selected
diseases and chronic conditions, along with injury hospitalizations and deaths
due to injury.
In 2013/2014, 28.5% of Manitobans age 20 and older had hypertension, and
8.6% of Manitobans age one and older had diabetes.
In the same time period, there were approximately 3 heart attacks and 3 strokes
for every 1,000 Manitoba residents age 40 and older.
In 2014/2015, 46.3% of Manitobans age 20 and older had one or more of the fol-
lowing chronic conditions: arthritis, asthma/COPD, coronary heart disease, dia-
betes or stroke.
For the same time period, there were 8,958 injury-related hospitalizations. In
2013/2014 there were 680 deaths where injury was the cause of death.

DISEASE AND INJURY
22
Manitoba Health, Seniors & Active Living
Annual Statistics 2014-2015
Hypertension (High Blood Pressure)
Figure 14: Age- and sex-adjusted percent of residents with hypertension age 20 and older by RHA,
2013/2014
Figure 15: Percent of residents with hypertension age 20 and older by fiscal year
Figure 14 shows the age- and sex-adjusted preva-
lence of hypertension among Manitoba residents
age 20 and older by RHA of residence.
In 2013/2014, there were 273,347 Manitobans
with hypertension (high blood pressure). This
represented 28.5% of the total population age 20
and older. Hypertension prevalence varied
across the province, as the percentage of people
living with hypertension was significantly higher
in Northern Health Region when compared to
Manitoba overall.
Figure 15 shows hypertension prevalence in Manitoba over time. The proportion of people living with hypertension appeared to have in-creased steadily from 24.7% in 2004/2005 to 28.5% in 2013/2014.
*Please note that due to a change in methodol-ogy, the proportions in Figure 15 are not directly comparable to those in last year�s report.

DISEASE AND INJURY
23
Manitoba Health, Seniors & Active Living
Annual Statistics 2014-2015
Diabetes
Figure 16: Age- and sex-adjusted percent of residents with diabetes age one and older by RHA,
2013/2014
Figure 17: Percent of residents with diabetes age one and older by fiscal year
Figure 16 shows the age- and sex-adjusted
prevalence of diabetes among Manitoba resi-
dents age one and older by RHA of residence.
In 2013/2014, there were 109,289 Manitobans
with diabetes, representing 8.6% of the total
population age one and older. Diabetes preva-
lence varied across the province ranging from a
high of 17.8% in Northern Health Region to a
low of 6.9% in Southern Health-Santé Sud.
Figure 17 shows diabetes prevalence in Mani-toba over time. The proportion of people living with diabetes increased steadily from 6.3% in 2004/2005 to 8.6% in 2013/2014. *Please note that due to a change in methodol-ogy, the proportions in Figure 17 are not di-rectly comparable to those in last years report.

DISEASE AND INJURY
24
Manitoba Health, Seniors & Active Living
Annual Statistics 2014-2015
Acute Myocardial Infarction (Heart Attack)
Figure 18: Age- and sex-adjusted rate of heart attack per 1,000 residents age 40 and older by
RHA, 2013/2014
Figure 19: Rate of heart attack per 1,000 residents age 40 and older by fiscal year
Figure 18 shows the age- and sex-adjusted rate
of heart attack (AMI) in Manitoba residents age
40 and older by RHA of residence.
In 2013/2014, there were 1,993 heart attacks
among Manitoba residents, representing a rate
of 3.3 heart attacks per 1,000 population age 40
and older. When compared to Manitoba over-
all, a higher rate of heart attacks recorded
among residents of Northern RHA.
Figure 19 shows the rate of heart attacks in
Manitoba over time. The rate of heart attacks
has decreased in the last five fiscal years since
2008/2009.

DISEASE AND INJURY
25
Manitoba Health, Seniors & Active Living
Annual Statistics 2014-2015
Stroke
Figure 20: Age- and sex-adjusted rate of stroke per 1,000 residents age 40 and older by RHA,
2013/2014
Figure 21: Rate of stroke per 1,000 residents age 40 and older by fiscal year
Figure 20 shows the age- and sex-adjusted stroke rate in Manitoba residents age 40 and older by RHA of residence.
In 2013/2014, there were 1,606 strokes among
Manitoba residents, representing a rate of 2.6
strokes per 1,000 population age 40 and older.
Rates varied across the province. When com-
pared to Manitoba overall, a significantly higher
rate of strokes occurred among Northern Health
Region residents.
Figure 21 shows the stroke rate in Manitoba
residents over time. The rate of strokes is rela-
tively stable with the lowest rate (2.5 per 1,000
population) in 2011/2012 and the highest rate
(2.8 per 1,000 population) in 2007/2008 and
2012/2013.

DISEASE AND INJURY
26
Manitoba Health, Seniors & Active Living
Annual Statistics 2014-2015
Chronic Conditions
Figure 22: Age- and sex-adjusted percent of residents with chronic conditions age 20 and older
by RHA, 2014/2015
Figure 23: Percentage of residents with chronic conditions age 20 and older, by the number of
chronic conditions, 2014/2015
Figure 22 shows the age- and sex-adjusted per-
cent of people living with chronic conditions. The
chronic condition rate is defined as the percent
of the population age 20 and older having one or
more of the following conditions: arthritis,
asthma/COPD, coronary heart disease, diabetes
or stroke.
In 2014/2015, 458,995 Manitobans age 20 and
older received medical care for one or more
chronic conditions, representing 47.0% of the
Manitoba population of the same age group. The
percent of the population with at least one
chronic condition ranged from 43.1% in Southern
Health-Santé Sud to 51.6% in Interlake-Eastern
RHA.
Of those residents living with a chronic condition,
Figure 23 shows the proportion with one or mul-
tiple chronic conditions. Almost two-thirds
(65.4%) of those with a chronic condition had just
one condition, 25.2% had two conditions and the
remaining 9.4% had three or more chronic condi-
tions.

DISEASE AND INJURY
27
Manitoba Health, Seniors & Active Living
Annual Statistics 2014-2015
Injury Hospitalization
Figure 24: Age- and sex-adjusted rate of hospitalization for injury per 1,000 residents by RHA, 2014/2015
Figure 25: Age- and sex-specific rate of hospitalization for injury per 1,000 residents,
2014/2015
Figure 24 shows the age- and sex-adjusted rate of injury hospitalizations per 1,000 residents.
In 2014/2015, there were 8,958 hospitalizations
related to injury among Manitoba residents, rep-
resenting a rate of 6.9 injury hospitalizations per
1,000 population. Rates varied significantly
across the province. Residents of Northern
Health Region had more than two times the rate
of injury hospitalizations compared to Manitoba
overall. Residents of Winnipeg Health Region
had significantly lower injury hospitalization
rates.
Figure 25 shows the rate of injury hospitalization in 2014/2015 among Manitobans by age and sex. An elevated rate of injury hospitalization rates was evident for those aged 20, particularly for males. The rate remained higher than fe-males until the age of 59. At the age of 60 the female rate exceeded that of males. Injury hos-pitalization rates for both sexes began to in-crease at the age of 65 and continued to in-crease exponentially up to age 90+.

DISEASE AND INJURY
28
Manitoba Health, Seniors & Active Living
Annual Statistics 2014-2015
Injury Mortality
Figure 26: Age- and sex-adjusted rate of death due to injury per 1,000 residents by RHA, 2013/2014
Figure 27: Percentage of injury deaths, by cause, 2013/2014
Figure 26 shows the age- and sex-adjusted rate of death for which an injury was the cause, per 1,000 residents. In 2013/2014, there were 690 deaths due to in-jury for Manitoba residents, representing a rate of 0.53 deaths per 1,000 population. The age-and sex-adjusted death rate in Northern Health Re-gion was significantly higher than Manitoba over-all, having an injury mortality rate two times that of the rate in Manitoba.
In Manitoba overall the five most common cause of injury-related deaths were:
1) falls (26.8%) 2) poisoning (19.4%) 3) violence to self (19.4%) 4) motor vehicle (12.9%) 5) other (9.3%) These causes combined represented 87.8% of all injury-related deaths (Figure 27).
29
Manitoba Health, Seniors & Active Living
Annual Statistics 2014-2015
Prevalence of Mental Illness and Use of Services
The following section provides an overview of the prevalence of mental illness. Between 2010/2011 and 2014/2015, approximately 25% of Manitobans age 10 and older received medical care for at least one of the following mental illnesses: depression, anxiety, substance abuse, personality disorder, or schizophrenia.
In 2014/2015 there were approximately 570 hospitalizations related to self-inflicted injury for Manitoba residents. This represented a rate of 50.0 self-inflicted injury hospitalizations per 100,000 residents age 10 and older.
On average, there were 192 suicides per year for the period of 2009/2010 to 2013/2014. This represented a suicide rate of less than one for every thousand Manitoba residents.

PREVALENCE OF MENTAL ILLNESS AND USE OF SERVICES
30
Manitoba Health, Seniors & Active Living
Annual Statistics 2014-2015
Cumulative Mental Illness
Figure 28: Age- and sex-adjusted prevalence of cumulative mental illness among residents age 10 and
older by RHA, 2010/2011 to 2014/2015
Figure 29: Crude percent of residents age 10 and older with cumulative mental illness, by age
and sex, 2010/2011 to 2014/2015
Figure 28 shows the age- and sex-adjusted preva-
lence of cumulative mental illness among Mani-
toba residents age 10 and older by RHA of resi-
dence. Cumulative mental illness is defined as
receiving medical care for at least one of: depres-
sion, anxiety disorders, substance abuse, schizo-
phrenia or a personality disorder.
From 2010/2011 to 2014/2015, there were
278,060 Manitoba residents treated for at least
one of these mental illnesses, representing 25.4%
of Manitoba residents age 10 and older. The age-
and sex-adjusted rates in Southern Health-Santé
Sud were significantly lower than the Manitoba
rate.
Figure 29 shows the prevalence of cumulative
mental illness by age and sex. From 2010/2011 to
2014/2015 the rate for females was higher than
males for all age groups.

PREVALENCE OF MENTAL ILLNESS AND USE OF SERVICES
31
Manitoba Health, Seniors & Active Living
Annual Statistics 2014-2015
Mood and Anxiety Disorders
Figure 30: Age- and sex-adjusted prevalence of mood and anxiety disorders among residents
age 10 and older by RHA, 2010/2011 to 2014/2015
Figure 31: Crude percent of residents age 10 and older with mood and anxiety disorders, by age
and sex, 2010/2011 to 2014/2015
Figure 30 shows the age- and sex-adjusted preva-
lence of mood and anxiety disorders among
Manitoba residents age 10 and older by RHA of
residence.
From 2010/2011 to 2014/2015, there were
247,630 Manitoba residents treated for mood
and anxiety disorders, representing 22.6% of
Manitoba residents age 10 and older. The age-
and sex-adjusted rates in Northern Health Region
and Southern Health-Santé Sud were signifi-
cantly lower than the Manitoba rate.
Figure 31 shows the prevalence of mood and
anxiety disorders by age and sex. From
2010/2011 to 2014/2015 the rate for females
was higher than males for all age groups.

PREVALENCE OF MENTAL ILLNESS AND USE OF SERVICES
32
Manitoba Health, Seniors & Active Living
Annual Statistics 2014-2015
Personality Disorders
Figure 32: Age- and sex-adjusted prevalence of personality disorders among residents age 10
and older by RHA, 2010/2011 to 2014/2015
Figure 33: Crude percent of residents age 10 and older with personality disorders, by age and
sex, 2010/2011 to 2014/2015
Figure 32 shows the age- and sex-adjusted
prevalence of personality disorders among
Manitoba residents age 10 and older by RHA of
residence.
From 2010/2011 to 2014/2015, there were
8,866 Manitoba residents treated for a personal-
ity disorder, representing 0.81% of Manitoba
residents age 10 and older. The age- and sex-
adjusted rates were significantly lower in South-
ern Health-Santé Sud, Interlake-Eastern RHA,
and Northern Health Region when compared to
the Manitoba rate.
Figure 33 shows the prevalence of personality
disorders by age and sex. From 2010/2011 to
2014/2015 the rate for females was higher than
males for all age groups. The rate for both sexes
began to increase at the age of 70 and continued
to increase up to the age of 90+.

PREVALENCE OF MENTAL ILLNESS AND USE OF SERVICES
33
Manitoba Health, Seniors & Active Living
Annual Statistics 2014-2015
Schizophrenia
Figure 34: Age- and sex-adjusted prevalence of schizophrenia among residents age 10 and older by RHA,
2010/2011 to 2014/2015
Figure 35: Crude percent of residents age 10 and older with schizophrenia, by age and sex,
2009/2010 to 2014/2015
Figure 34 shows the age- and sex-adjusted preva-
lence of schizophrenia among Manitoba resi-
dents age 10 and older by RHA of residence.
From 2010/2011 to 2014/2015, there were 8,368
Manitoba residents treated for schizophrenia,
representing 0.77% of Manitoba residents age 10
and older. The age- and sex-adjusted rates in
Southern Health-Santé Sud and Interlake-Eastern
RHA were significantly lower than Manitoba
overall.
Figure 35 shows the prevalence of schizophrenia
by age and sex. From 2010/2011 to 2014/2015
the rate for males under the age of 55 was higher
than females. The rate of females over the age
of 60 was higher than males.

PREVALENCE OF MENTAL ILLNESS AND USE OF SERVICES
34
Manitoba Health, Seniors & Active Living
Annual Statistics 2014-2015
Substance Abuse
Figure 36: Age- and sex-adjusted prevalence of substance abuse among residents age 10 and
older by RHA, 2010/2011 to 2014/2015
Figure 37: Crude percent of residents age 10 and older with substance abuse, by age and sex,
2009/2010 to 2013/2014
Figure 36 shows the age- and sex-adjusted
prevalence of substance abuse among Manitoba
residents age 10 and older by RHA of residence.
From 2010/2011 to 2014/2015, there were
56,146 Manitoba residents treated for sub-
stance abuse, representing 5.1% of Manitoba
residents age 10 and older. The age- and sex-
adjusted rate for Northern Health Region was
almost 2 times higher than the Manitoba rate.
Figure 37 shows the prevalence of substance
abuse by age and sex. From 2010/2011 to
2014/2015 the rate for males between the ages
of 15 and 89 was higher than females.

PREVALENCE OF MENTAL ILLNESS AND USE OF SERVICES
35
Manitoba Health, Seniors & Active Living
Annual Statistics 2014-2015
Hospitalization for Self-Inflicted Injury
Figure 38: Age- and sex-adjusted rate of hospitalization due to self-inflicted injury per 100,000
residents age 10 and older by RHA, 2014/2015
Figure 39: Crude rate per 100,000 residents age 10 and older hospitalized for self-inflicted injury,
by age and sex, 2013/2014
Figure 38 shows the age- and sex-adjusted rate of
hospitalization for which a self-inflicted injury
was the cause, per 100,000 residents age 10 and
older.
In 2014/2015, there were 570 hospitalizations
due to self-inflicted injury among Manitoba resi-
dents, representing a rate of 50.0 hospitaliza-
tions per 100,000 population.
Figure 39 shows the age- and sex-specific rate of
hospitalization due to self-inflicted injury per
100,000 residents. Manitoba females between
the ages of 15 and 19 had a rate over 5 times
that of males within the same age grouping.

PREVALENCE OF MENTAL ILLNESS AND USE OF SERVICES
36
Manitoba Health, Seniors & Active Living
Annual Statistics 2014-2015
Suicide
Figure 40: Age- and sex-adjusted rate of death due to suicide per 1,000 residents age 10 and older by
RHA, 2009/2010 to 2013/2014
Figure 41: Crude rate of suicide deaths per 1,000 residents by age and sex, 2009/2010 to 2013/2014
Figure 40 shows the age- and sex-adjusted rate
of death for which suicide was the cause, per
1,000 Manitoba residents age 10 and older.
From 2009/2010 to 2013/2014, there were 960
deaths due to suicide among Manitoba resi-
dents, representing a rate of 0.18 deaths per
1,000 population. The age- and sex-adjusted
death rate in Northern Health Region
was significantly higher than Manitoba overall,
while Southern Health-Santé Sud�s rate was sig-
nificantly lower.
Figure 41 shows the death rate for suicide by
age and sex. From 2009/2010 to 2013/2014, the
rate for males was higher than females for all
age groups with the exception of ages 10 to 19.

37
Manitoba Health, Seniors & Active Living
Annual Statistics 2014-2015
Health Services Insurance Plan
Manitoba residents who are Canadian citizens or have immigrant status (including work/study permit holders), and who are either a permanent resi-dent of Manitoba or reside in Manitoba for at least six months of the year, are eligible for Manitoba Health, Seniors and Active Living.
The Health Services Insurance Plan operates outside the Provincial Consoli-dated Fund and provides for payment of insured services for hospitals, per-sonal care homes, and health care providers on behalf of Manitoba residents. Other plans include the prescription drugs program (Pharmacare), Ambulance, Air Ambulance, and Northern Patient Transportation programs.

HEALTH SERVICES INSURANCE PLAN
38
Manitoba Health, Seniors & Active Living
Annual Statistics 2014-2015
Insured Services per Capita
Figure 42: Crude cost of insured services per capita by fiscal year
Figure 43: Percentage of total cost, 2014/2015
Figure 42 represents the cost per capita of in-
sured services in Manitoba.
In 2014/2015, approximately five billion dollars
was spent on insured services in Manitoba, rep-
resenting $4,018 per capita.
Figure 43 shows the distribution of total costs.
In 2014/2015, 68.9% of the total cost was attrib-
uted to facilities and health authorities (HAs) fol-
lowed by medical services for fee for service phy-
sicians (23.0%), Pharmacare programs (4.7%) and
provincial programs (3.4%).

39
Manitoba Health, Seniors & Active Living
Annual Statistics 2014-2015
Use of Medical Services
The following section provides an overview of the use of medical services in Manitoba. This includes number of physicians and nurses, physician use, majority of care and ambulatory care visit rates.
In 2014 there were 17,657 nurses and 2,682 physicians registered in Mani-toba. Over eighty percent (82.7%) of Manitoba residents saw a physician at least once in 2014/2015. On average, these Manitobans saw a physi-cian about four times. Nearly three-quarters (69.9%) of residents saw the same physician for more than 50% of their ambulatory visits.

USE OF MEDICAL SERVICES
40
Manitoba Health, Seniors & Active Living
Annual Statistics 2014-2015
Number of General Practitioners and Specialists
Figure 44: Number of General Practitioners and Specialists in Manitoba, 2010 - 2014
Figure 44 shows the number of general practitio-ners and specialists in Manitoba as reported by the College of Physicians and Surgeons of Mani-toba by calendar year.
For 2014, there were a total of 2,682 physicians in Manitoba. This consisted of nearly even num-bers of family physicians and specialists.

USE OF MEDICAL SERVICES
41
Manitoba Health, Seniors & Active Living
Annual Statistics 2014-2015
Number of Nurses and Nurse Practitioners
Figure 45: Number of RNs, LPNs and RPNs in Manitoba, 2010-2014
Figure 46: Number of Nurse Practitioners in Manitoba, 2010-2014
Figure 45 shows the number of registered nurses
(RNs), licensed practical nurses (LPN)s and regis-
tered psychiatric nurses (RPNs) as reported by
the College of Registered Nurses of Manitoba.
For 2014, there were 17,657 RNs, LPNs and RPNs
registered with the College of Registered Nurses
of Manitoba, of which 76.5% were registered
nurses. The remaining 23.5% consisted of regis-
tered psychiatric nurses and licensed practical
nurses.
Figure 46 shows the number of nurse practitio-
ners in Manitoba. The number of registered
nurse practitioners increased from 101 in 2010
to 149 in 2014.

USE OF MEDICAL SERVICES
42
Manitoba Health, Seniors & Active Living
Annual Statistics 2014-2015
Physician Use
Figure 47: Age- and sex-adjusted percent of residents who used physician services by RHA, 2014/2015
Figure 48: Crude percent of residents who used physician services by age and sex, 2014/2015
Figure 47 shows the age- and sex-adjusted per-
cent of Manitobans who used physician ser-
vices by RHA of residence.
In 2014/2015, 82.7 % of Manitoba residents
saw a physician at least once during the year.
Residents of Northern Health Region appeared
to have lower rates. However, these values
are affected by missing data for services pro-
vided by salaried physicians and should be in-
terpreted with caution.
Figure 48 shows the physician use rate in
2014/2015 by age and sex. Females had a
higher use of physicians than males for all age
groups over the age of 10.

USE OF MEDICAL SERVICES
43
Manitoba Health, Seniors & Active Living
Annual Statistics 2014-2015
Majority of Care (formerly Continuity of Care)
Figure 49: Age- and sex-adjusted percent of residents with more than 50% of ambulatory
visits to the same physician by RHA, 2013/2014 to 2014/2015
Figure 50: Crude percent of residents with more than 50% of ambulatory visits to the same physician,
by age and sex, 2013/2014 to 2014/2015
Figure 49 shows the age- and sex-adjusted per-
cent of Manitoba residents with more than 50%
of ambulatory visits made to the same physician,
by RHA of residence.
From 2013/2014 to 2014/2015, 69.9% of resi-dents had more than 50% of their visits to the same physician. Northern Health Region and Southern Health-Santé Sud had a significantly
lower majority of care when compared to the Manitoba rate, while Interlake-Eastern RHA had a higher majority of care. Figure 50 shows the age- and sex-specific percent of residents with at least 50% of visits made to the same physician. Generally, majority of care was the same for both males and females. Mani-toba females age 5 to 9 and Manitoba males age 20 to 24 had the lowest majority of care.

USE OF MEDICAL SERVICES
44
Manitoba Health, Seniors & Active Living
Annual Statistics 2014-2015
Ambulatory Care Visits
Figure 51: Age- and sex-adjusted average number of ambulatory care visits by RHA, 2014/2015
Table 1: Percentage of visits by reason, 2014/2015
Figure 51 shows the age- and sex-adjusted aver-age number of visits to a physician per Manitoba resident. Services provided to a patient while admitted to hospital have been excluded.
In 2014/2015, there was an average of about four visits to physicians per Manitoba resident. Northern Health region and Southern Health-
Santé Sud�s visit rate were significantly lower than the Manitoba visit rate.
In Manitoba overall, the most common reason for a physician visit, excluding factors influencing health status and contact with health services, was respiratory disease, representing 10.6% of all visits (Table 1).
Reason for Visit Percentage of Visits
Res pi ra tory 10.6%Fa ctors Infl uenci ng Hea lth Sta tus a nd Contact wi th Hea lth 10.2%Menta l Di sorders 9.5%Mus culos kel eta l System & Connective Ti ss ue 9.3%Symptoms, Si gns , I l l -Defined Condi tions 8.6%Circul a tory 8.5%Nervous Sys tem & Sense Orga ns 7.6%Endocri ne, Meta bol i c Dis ea se, Immunol ogi c Di s orders 6.9%Geni touri na ry 5.9%Ski n & Subcutaneous Ti ss ue 5.8%Injury & Poi soni ng 4.7%Digestive 4.0%Infecti ous a nd Pa ra s i ti c Di s ea s es 3.2%Neopl a sms 2.8%Dis ea se of Bl ood, Blood-Formi ng Orga ns 1.3%Congeni ta l Anoma l i es 0.5%Pregna ncy, Chi l dbirth, Puerperium 0.4%Condi tions Orgi na ting i n Perina ta l Period 0.1%

45
Manitoba Health, Seniors & Active Living
Annual Statistics 2014-2015
Use of Hospital Services
The following section provides an overview of the use of hospital ser-vices, appropriateness of care and proportion of alternate level of care days in Manitoba. This includes use of hospitals, hospital separation rates, day surgery rates, hospitalizations for ambulatory care sensitive conditions and alternate level of care days.
In 2014/2015, there were 75 acute and chronic care facilities along with 2 long term psychiatric facilities.
About 6.3% of Manitoba residents were admitted as an inpatient to a
hospital in 2014/2015. In total, there were 81,947 inpatient hospitali-
zations.
There were a total of 100,462 hospital day surgery visits among Mani-
toba residents in 2014/2015. The majority of these visits were for pro-
cedures involving the digestive system.
Ambulatory care sensitive conditions (ACSC) is a measure of access to
appropriate medical care. While not all admissions for these condi-
tions are avoidable, significantly elevated rates often reflect problems
obtaining access to primary care. In 2014/2015, the rate of hospitali-
zation for ACSC was 6.8 per 1,000 residents.
Alternate level of care (ALC) days are inpatient days in which a patient
no longer requires the level of care their care setting provides, and
where the patient is awaiting discharge to a more appropriate non-
acute care setting. In 2014/2015, 4.1% of all hospitalized cases had
one or more ALC days associated with it.

USE OF HOSPITAL SERVICES
46
Manitoba Health, Seniors & Active Living
Annual Statistics 2014-2015
Map of Hospitals by Facility Size

USE OF HOSPITAL SERVICES
47
Manitoba Health, Seniors & Active Living
Annual Statistics 2014-2015
Use of Hospitals
Figure 52: Age- and sex-adjusted percent of residents admitted to hospital by RHA, 2014/2015
Figure 53: Crude percent of residents admitted to hospital by age and sex, 2014/2015
Figure 52 shows the age- and sex-adjusted
percent of Manitobans who were admitted to
hospital by RHA of residence.
In 2014/2015, 6.3% of Manitoba residents
were admitted at least once to a hospital.
Northern and Prairie Mountain Health Regions
had significantly higher percentages of resi-
dents with one or more admissions than Mani-
toba overall.
Figure 53 shows the hospital use rate in
2014/2015 by age and sex. Females age 10 to
54 have higher hospital use than males in the
same age group. This is mainly attributed to
women admitted to hospital for obstetrical
services. Rates for both genders increase with
age, with senior males having a higher rate.

USE OF HOSPITAL SERVICES
48
Manitoba Health, Seniors & Active Living
Annual Statistics 2014-2015
Inpatient Hospital Separations
Figure 54: Age- and sex-adjusted rate of separation for inpatient hospitalizations per 1,000
residents by RHA, 2014/2015
Table 2: Percentage of inpatient hospital separations by reason, 2014/2015
Figure 54 shows the age- and sex-adjusted rate of separation for inpatient hospitalizations, per 1,000 residents. A separation is defined as any-time a patient leaves a facility because of a dis-charge, transfer or death.
In 2014/2015, there were 112,768 inpatient sepa-rations among Manitoba residents, representing a rate of 86.3 per 1,000 Manitoba residents. Rates in Northern Health Region and Prairie Mountain Health were significantly higher than Manitoba overall, while the rate in Winnipeg was signifi-cantly lower.
In Manitoba overall, the most common reason for inpatient hospitalization was pregnancy, represent-ing 15.8% of inpatient hos-pitalizations. This was fol-lowed by hospitalizations for circulatory issues at 10.7% (Table 2).
Reason for Hospitalization Percentage of Hospitalizations
Pregancy, Childbirth & Puerperium 15.8%Circulatory System 10.7%Digestive System 10.3%Factors Influencing Health Status & Contact with Health Services 9.4%Respiratory 8.5%Injuring & Poisoning 8.4%Neoplasms 5.8%Musculoskeletal System & Connective Tissue 5.6%Mental & Behavioural Disorders 5.3%Genitourinary System 5.1%Symptoms, Signs and Abnormal Clinical/Lab Findings 4.8%Endocrine, Nutritional and Metabolic Diseases 2.8%Infectious & Parasitice Diseases 2.3%Nervous System 1.5%Skin & Subcutaneous Tissue 1.5%Diseases of Blood & Blood Forming Organs 0.7%Eye & Adnexa 0.5%Congenital Anomalies 0.5%Conditions Originating in Perinatal Period 0.4%Ear & mastoid process 0.2%

USE OF HOSPITAL SERVICES
49
Manitoba Health, Seniors & Active Living
Annual Statistics 2014-2015
Day Surgery
Figure 55: Age� and sex-adjusted rate of day surgery hospitalization per 1,000 residents by RHA,
2014/2015
Table 3: Percentage of day surgery hospitalization by reason, 2014/2015
Figure 55 shows the age- and sex-adjusted rate
of day surgery hospitalization per 1,000 resi-
dents. Day surgery is defined as surgical ser-
vices received on an outpatient basis.
In 2014/2015, there were 100,462 day surgery
hospitalizations among Manitoba residents,
representing a rate of 76.9 per 1,000 Manitoba
residents.
The most common reason for day surgery hos-
pitalization in Manitoba was for an intervention
on the digestive tract, representing 42.9% of all
day surgery hospitalizations (Table 3).
Type of Day Surgery Intervention% of Day Surgery
Hopitalizations
Interventions on the Di gesti ve and Hepatobi l ia ry Tracts and Other Si tes wi thi n the Abdominal Cavi ty NEC42.9%
Interventions on the Eye and Ocular Adnexa 12.4%
Interventions on the Mus cul os keletal System 12.2%
Interventions on the Urinary System 6.2%
Interventions on the Cardiovas cular System 5.9%
Interventions on the Orocraniofacia l Region 5.4%
Interventions Femal e Genital Organs 3.9%
Obs tetri cal and Feta l Interventions 3.0%
Interventions on the Skin, Subcutaneous Ti ss ue and Breast 3.0%
Interventions on the Nervous Sys tem 1.5%
Interventions Mal e Genital Organs 1.4%
Interventions on the Respiratory System 1.0%
Interventions on the Ear and Mas toid (proces s) 0.9%
Interventions on the Lymphati c System 0.3%

USE OF HOSPITAL SERVICES
50
Manitoba Health, Seniors & Active Living
Annual Statistics 2014-2015
Hospitalization for Ambulatory Care Sensitive Conditions
Figure 56: Age� and sex-adjusted rate of ambulatory care sensitive conditions per 1,000 residents by RHA, 2014/2015
Table 4: Percentage of ambulatory care sensitive conditions by
reason, 2014/2015
Figure 56 shows the age- and sex-adjusted rate
of hospitalization for ambulatory care sensitive
conditions (ACSC) by RHA of residence. ACSC are
a set of conditions comprised of 25 diseases/
diagnoses which have been identified as ob-
servably responsive to primary care. ACSC hos-
pitalizations accordingly can function as an indi-
rect measure of primary care access. Although
significantly higher rates are presumed to reflect
problems obtaining access to primary
care, not all admissions for these conditions are
avoidable.
In 2014/2015, the rate of hospi-
talization for ACSC was 6.8 per
1,000 Manitoba residents. Hospi-
talization rates in Northern and
Prairie Mountain Health regions
were significantly higher than
Manitoba overall, while the rate
in Winnipeg was significantly
lower.
Bacterial Pneumonia was the
most common ambulatory care
sensitive condition which Mani-
toba residents were hospitalized
for, representing 17.3% of all
ACSC hospitalizations (Table 4).
Ambulatory Care Sensitive Condition % of Total ACSC Hospitalizations
Bacterial Pneumonia 17.3% Chronic Obstructive Pulmonary Disease 15.8% Diabetes 11.7% Kidney/Urinary Infections 11.4% Congestive Heart Failure 10.0% Cellulitis 7.9% Asthma 5.0% Epilepsy 4.1% Angina 3.5% Convulsions 3.1% Severe ENT Infections 2.1% Dental Conditions 1.6% Hypertension 1.4% Pulmonary Tuberculosis 1.2% Pelvic Inflammatory Disease 1.1% Dehydration/Volume Depletion 1.1% Gastroenteritis 0.8% All Other ACS Conditions 1.0%

USE OF HOSPITAL SERVICES
51
Manitoba Health, Seniors & Active Living
Annual Statistics 2014-2015
Alternate Level of Care
Figure 57: Average length of stay for alternate level of care and acute care-only patient stays by
RHA of hospital 2014/2015
Figure 58: Crude percent of total hospitalized cases associated with and without
alternate level of care days, 2014/2015
Figure 57 shows the average lengths of stay for acute care-only hospitalizations, and for hospitalizations where a portion of the stay included alternate level of care (ALC). Inpa-tient days are identified as ALC when a pa-tient no longer requires the level of care their care setting provides, and where the patient is awaiting discharge to a more ap-propriate non-acute care setting, such as a personal care home. The average length of stay for an ALC case was approximately 43
days, compared to 8 days for a non-ALC acute case.
Figure 58 shows the crude proportion of to-
tal hospitalizations with and without associ-
ated ALC days. In 2014/2015, there were
5,095 hospitalizations in which a portion of
the stay included ALC days, representing
4.1% of all hospitalized cases.

52
Manitoba Health, Seniors & Active Living
Annual Statistics 2014-2015
This page intentionally left blank.

53
Manitoba Health, Seniors & Active Living
Annual Statistics 2014-2015
High Profile Surgeries
The following section provides an overview of high profile surgery rates for
the Manitoba population, including rates for coronary artery bypass grafts
(CABG), hip replacement surgeries, knee replacement surgeries, cataract
surgeries and paediatric dental extractions.
For the period of 2010/2011 to 2014/2015, there were 1.1 coronary artery
bypass graft surgeries and 3.8 Percutaneous Coronary surgeries per 1,000
Manitoba residents age 40 and older.
In 2014/2015, there were 2.4 hip replacement surgeries and 3.4 knee re-
placement surgeries per 1,000 Manitoba residents age 40 and older.
In 2013/2014, there were 29.8 cataract surgeries per 1,000 Manitoba resi-
dents age 50 and older.
There were 12.2 dental surgeries per 1,000 children under the age of six in
2014/2015.

HIGH PROFILE SURGERIES
54
Manitoba Health, Seniors & Active Living
Annual Statistics 2013-2014
Coronary Artery Bypass Graft Surgery and Percutaneous Coronary Intervention Surgery
Figure 59: Age- and sex-adjusted coronary artery bypass graft surgery rate per 1,000 residents
age 40 and older by RHA, 2010/2011 to 2014/2015
Figure 60: Age� and sex-adjusted Percutaneous Coronary (PCI) surgery rate per 1,000 residents
age 40 and older by RHA, 2010/2011 to 2014/2015
Figure 59 shows the age- and sex-adjusted coro-
nary artery bypass graft (CABG) surgery rate
among Manitoba residents age 40 and older, by
RHA of residence.
For the period of 2010/2011 to 2014/2015, an
average of 678 coronary artery bypass surgeries
were performed on Manitoba residents per year,
representing a rate of 1.1 surgeries per 1,000 for
those age 40 and older.
Figure 60 shows the age- and sex-adjusted Percu-
taneous Coronary Intervention (PCI) surgery rate
among Manitoba residents age 40 and older, by
RHA of residence. In cases amenable to treat-
ment with less-invasive procedures, percutane-
ous coronary intervention (PCI) is an alternative
intervention to improve blood flow to the heart
muscle.
For the period of 2010/2011 to 2014/2015, an
average of 2,246 percutaneous coronary inter-
vention surgeries were performed on Manitoba
residents per year, representing a rate of 3.8 sur-
geries per 1,000 for those age 40 and older.

HIGH PROFILE SURGERIES
55
Manitoba Health, Seniors & Active Living
Annual Statistics 2013-2014
Hip Replacement
Figure 61: Age- and sex-adjusted hip replacement surgery rate per 1,000 residents age 40 and
older by RHA, 2014/2015
Figure 62: Hip replacement surgery rate per 1,000 residents age 40 and older by fiscal year
Figure 61 shows the age- and sex-adjusted hip
replacement surgery rate among Manitoba
residents age 40 and older, by RHA of resi-
dence.
In 2014/2015, there were 1,484 hip replace-
ment surgeries performed on Manitoba resi-
dents, representing a rate of 2.4 per 1,000 for
those age 40 and older.
Figure 62 shows the hip replacement surgery rate in Manitoba over time. The hip replace-ment surgery rate in Manitoba has been rela-tively stable since 2005/2006.

HIGH PROFILE SURGERIES
56
Manitoba Health, Seniors & Active Living
Annual Statistics 2013-2014
Knee Replacement
Figure 63: Age- and sex-adjusted knee replacement surgery rate per 1,000 residents age 40 and
older by RHA, 2014/2015
Figure 64: Knee replacement surgery rate per 1,000 residents age 40 and older
by fiscal year
Figure 63 shows the age- and sex-adjusted total
knee replacement surgery rate among Manitoba
residents age 40 and older, by RHA of residence.
In 2014/2015, there were 2,070 total knee re-
placement surgeries performed on Manitoba resi-
dents, representing a rate of 3.4 per 1,000 for
those age 40 and older. None of the age- and sex-
adjusted rates by new RHA were significantly dif-
ferent than Manitoba overall.
Figure 64 shows knee
replacement surgery
rate in Manitoba over
time. The knee replace-
ment surgery rate in
Manitoba has been rela-
tively stable since
2005/2006.

HIGH PROFILE SURGERIES
57
Manitoba Health, Seniors & Active Living
Annual Statistics 2013-2014
Paediatric Dental Extraction
Figure 65: Age- and sex-adjusted rate of dental extraction for children under the age of six per 1,000
children under the age of six by RHA, 2014/2015
Figure 66: Crude rate of paediatric dental extractions and total paediatric dental surgeries by fiscal year
Figure 65 shows the age- and sex-adjusted rate of
dental extractions among Manitoba children un-
der the age of six by RHA of residence.
In 2014/2015, there were 1,223 hospitalizations
for dental extractions among Manitoba children
under the age of six, representing a rate of 12.2
hospitalizations per 1,000 children. The age- and
sex-adjusted hospitalization rate in Northern
Health Region was significantly higher than Mani-
toba overall, with Northern Health Region having
a hospitalization over 5 times that of the rate in
Manitoba.
Figure 66 shows the rate of paediatric dental ex-
tractions as well as all total paediatric dental pro-
cedures over time. The rates for both have been
steadily decreasing since 2005/2006.

HIGH PROFILE SURGERIES
58
Manitoba Health, Seniors & Active Living
Annual Statistics 2013-2014
Cataract Surgery
Figure 67: Age- and sex-adjusted rate of cataract surgery per 1,000 residents age 50 and older by
RHA, 2013/2014
Figure 68: Age- and sex-adjusted rate of cataract surgery per 1,000 residents age 50 and older by RHA,
2013/2014
Figure 67 shows the age- and sex-adjusted rate
for cataract surgery among Manitoba residents
age 50 and older by RHA of residence.
In 2013/2014, there were 12,413 cataract surger-
ies performed on Manitoba residents, represent-
ing a rate of 29.8 residents per 1,000 for those
age 50 and older. None of the age- and sex- ad-
justed rates by RHA were significantly different
than Manitoba overall.
Figure 68 shows cataract surgery rate by age and
sex. For 2013/2014 the rate for females were
consistently higher than males until the ages of
80 to 84. The rate of surgery for males is higher
for those age 85+.
59
Manitoba Health, Seniors & Active Living
Annual Statistics 2014-2015
Women�s Reproductive Health
The following section provides an overview of selected women�s reproduc-
tive health indicators, including hysterectomy rates, proportion of deliveries
by caesarean section and proportion of vaginal births after caesarean sec-
tions.
In 2014/2015, of every 1,000 Manitoba women between the ages of 20 to
84 approximately 4 had a hysterectomy. Provincially, 22.7% of total deliver-
ies were caesarean deliveries among women between the ages of 15 to 54,
and 30.7% of women having a previous caesarean section delivered vagi-
nally.

WOMEN�S REPRODUCTIVE HEALTH
60
Manitoba Health, Seniors & Active Living
Annual Statistics 2014-2015
Hysterectomy
Figure 69: Age-adjusted hysterectomy rate per 1,000 female residents ages 20 to 84 by RHA,
2014/2015
Figure 70: Hysterectomies performed by age group, 2014/2015
Figure 69 shows the age-adjusted hysterectomy
rate among Manitoba female residents ages 20
to 84 by RHA of residence.
In 2014/2015, there were 1,672 females that
had a hysterectomy, representing a rate of 3.4
hysterectomies per 1,000 female population
ages 20 to 84. None of the age-adjusted rates
by RHA were significantly different than Mani-
toba overall.
In Manitoba overall, the largest proportion (39.5%) of hysterectomies were performed on females between the ages of 40 to 49 (Figure 70).
WOMEN�S REPRODUCTIVE HEALTH
61
Manitoba Health, Seniors & Active Living
Annual Statistics 2014-2015
Caesarean Section
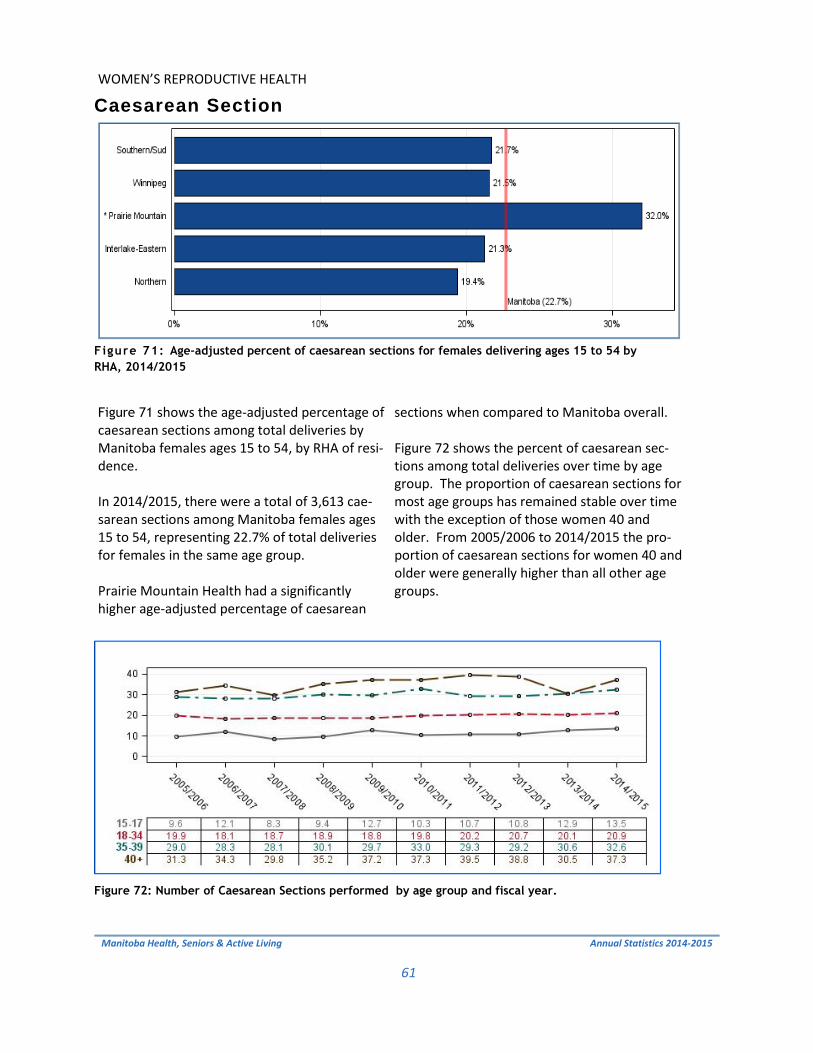
Figure 71: Age-adjusted percent of caesarean sections for females delivering ages 15 to 54 by
RHA, 2014/2015
Figure 72: Number of Caesarean Sections performed by age group and fiscal year.
Figure 71 shows the age-adjusted percentage of caesarean sections among total deliveries by Manitoba females ages 15 to 54, by RHA of resi-dence. In 2014/2015, there were a total of 3,613 cae-sarean sections among Manitoba females ages 15 to 54, representing 22.7% of total deliveries for females in the same age group. Prairie Mountain Health had a significantly higher age-adjusted percentage of caesarean
sections when compared to Manitoba overall. Figure 72 shows the percent of caesarean sec-tions among total deliveries over time by age group. The proportion of caesarean sections for most age groups has remained stable over time with the exception of those women 40 and older. From 2005/2006 to 2014/2015 the pro-portion of caesarean sections for women 40 and older were generally higher than all other age groups.
WOMEN�S REPRODUCTIVE HEALTH
62
Manitoba Health, Seniors & Active Living
Annual Statistics 2014-2015
Vaginal Birth after Caesarean Section
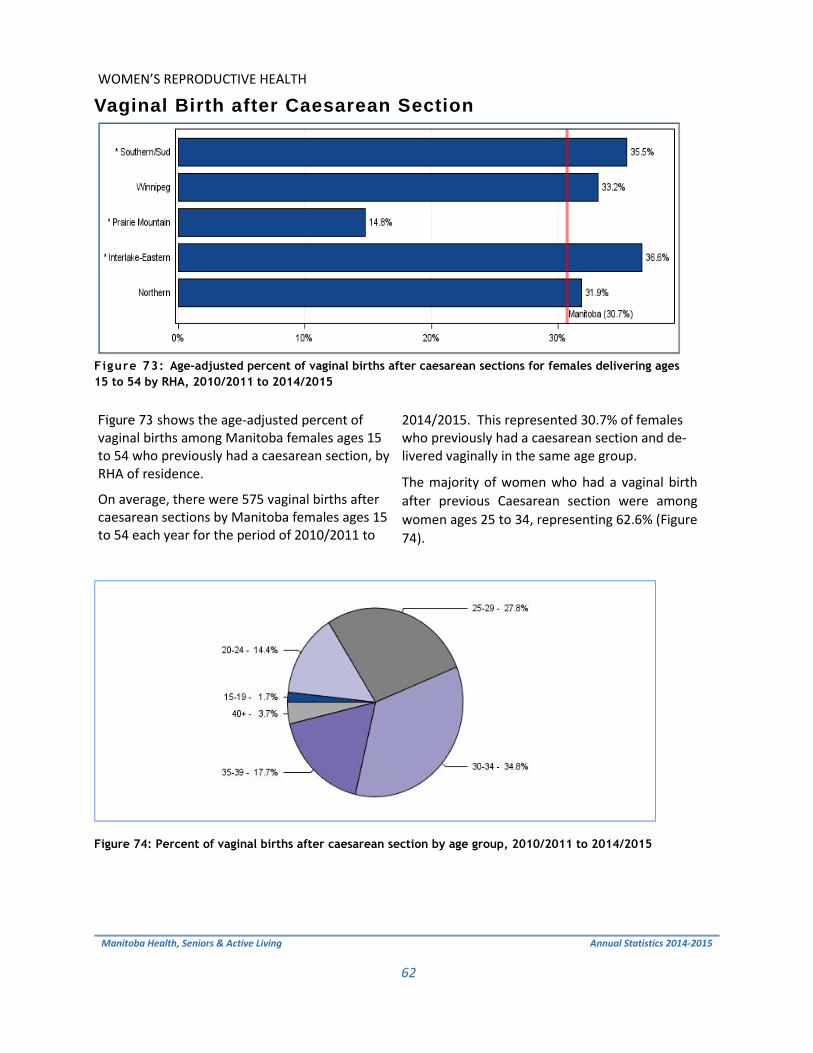
Figure 73: Age-adjusted percent of vaginal births after caesarean sections for females delivering ages
15 to 54 by RHA, 2010/2011 to 2014/2015
Figure 74: Percent of vaginal births after caesarean section by age group, 2010/2011 to 2014/2015
Figure 73 shows the age-adjusted percent of vaginal births among Manitoba females ages 15 to 54 who previously had a caesarean section, by RHA of residence.
On average, there were 575 vaginal births after caesarean sections by Manitoba females ages 15 to 54 each year for the period of 2010/2011 to
2014/2015. This represented 30.7% of females who previously had a caesarean section and de-livered vaginally in the same age group.
The majority of women who had a vaginal birth after previous Caesarean section were among women ages 25 to 34, representing 62.6% (Figure 74).

63
Manitoba Health, Seniors & Active Living
Annual Statistics 2014-2015
Use of Home Care Services
The following section provides an overview of the home care program in Manitoba. The home care program has the responsibility for the develop-ment and implementation of a comprehensive range of in-home services. The program also maintains and manages the assessment and waiting list for personal care home placement in each regional health authority.
This section includes statistics on the average number of clients receiving co-ordinated care and the average number of clients receiving services and as-sessments for admission to the home care program.
In 2014/2015, there were 14,265 Manitoba residents were admitted to home care, while 14,263 were discharged.

USE OF HOME CARE SERVICES
64
Manitoba Health, Seniors and Active Living
Annual Statistics 2014-2015
Total Number of Clients in Home Care at March 31, 2015
Figure 75: Total number of clients in Home Care at March 31, 2015
Figure 75 shows the total number of clients re-ceiving coordinated home care services at March 31, 2015.
On March 31, 2015, there was a total of 24,123 clients in home care. Of these, about 59% of clients resided in Winnipeg Health Region.

USE OF HOME CARE SERVICES
65
Manitoba Health, Seniors and Active Living
Annual Statistics 2014-2015
Number of Assessments for Admission, Admissions and Discharges
Figure 76: Number of assessments for admission, admissions and discharges, 2008/2009
to 2014/2015
Figure 76 shows the number of assessments for admission to the home care program, as well as admissions to and discharges from the home care program.
In 2014/2015 14,265 clients were admitted and 14,263 clients were discharged.
*Please note that the number of assessments is not available for 2013/2014 or 2014/2015.

66
Manitoba Health, Seniors & Active Living
Annual Statistics 2014-2015
This page intentionally left blank.

67
Manitoba Health, Seniors & Active Living
Annual Statistics 2014-2015
Use of Personal Care Homes
The following section provides an overview of personal care home (PCH) and respite care in Manitoba. This includes PCH admissions, median wait time for admission, and median length of stay.
PCHs are residential facilities which are predominately intended for adults age 75 and older that may have a chronic condition, and for residents with a disability. In 2014/2015, there were 125 PCHs in Manitoba.
In Manitoba, 3.1% of the population age 75 and older were admitted to a PCH from 2013/2014 to 2014/2015. The median wait time for placement into a PCH was approximately 9 weeks, and the median length of time a resident spent in PCH was approximately two years. Length of stay is as-sociated with level of care on admission, as sicker patients stay less time in a PCH than healthier patients do.

USE OF PERSONAL CARE HOMES
68
Manitoba Health, Seniors & Active Living
Annual Statistics 2014-2015
Map of Personal Care Homes by Facility Size

USE OF PERSONAL CARE HOMES
69
Manitoba Health, Seniors & Active Living
Annual Statistics 2014-2015
Personal Care Home Admissions
Figure 77: Age- and sex-adjusted percent of residents age 75 and older admitted to a personal
care home by RHA, 2013/2014 to 2014/2015
Figure 78: Percent distributions of level of care assigned to PCH residents age 75 and older at time of
admission, 2013/2014 to 2014/2015
Figure 77 shows the age- and sex-adjusted pro-
portion of Manitoba residents age 75 and older
admitted for the first time to a personal care
home.
On average, there were 2,637, or 3.1% of Mani-
toba residents age 75 and older admitted to a
personal care home each year for the period of
2013/2014 to 2014/2015. The age-and sex-
adjusted rate in Prairie Mountain RHA was signifi-
cantly higher than Manitoba overall.
Figure 78 shows the distributions of level of care
assigned to PCH residents age 75 and older at the
time of their admission. Level 1 represents the
lowest level of need and Level 4 represents the
highest. There were no Level 1 residents admit-
ted during this time period. Levels 2Y and 3Y rep-
resent individuals who required close supervision
due to possible behavioural issues, while 2N and
3N were for individuals who did not require su-
pervision. Almost two-thirds (60%) of admissions
were for individuals assessed at a Level 2 or 3 and
not requiring supervision.

USE OF PERSONAL CARE HOMES
70
Manitoba Health, Seniors & Active Living
Annual Statistics 2014-2015
Median Wait Times for Personal Care Home Admission
Figure 79: Median wait time (weeks) from assessment to admission of residents age 75 and
older by RHA, 2013/2014 to 2014/2015
Figure 80: Percentage of location prior to admission of residents age 75 and older,
2013/2014 to 2014/2015
Figure 79 shows the amount of time it took for
half of all Manitoba residents age 75 and older
to be admitted after being assessed as requiring
placement into a personal care home.
There were a total of 5,273 Manitoba residents
age 75 and older admitted to a personal care
home in the 2013/2014 to 2014/2015 time pe-
riod. The median wait time was about 9.3
weeks. Regionally, the wait time varied. South-
ern-Santé Sud and Interlake-Eastern RHA had
significantly higher wait times, while Winnipeg
Health Region had a significantly lower wait
time when compared to Manitoba overall.
Of all Manitoba residents age 75 and older ad-
mitted to a personal care home in 2013/2014 to
2014/2015, 70.1% were waiting in a hospital
prior to admission, while 29.9% were waiting in
the community, i.e. a home setting, as shown in
Figure 80.
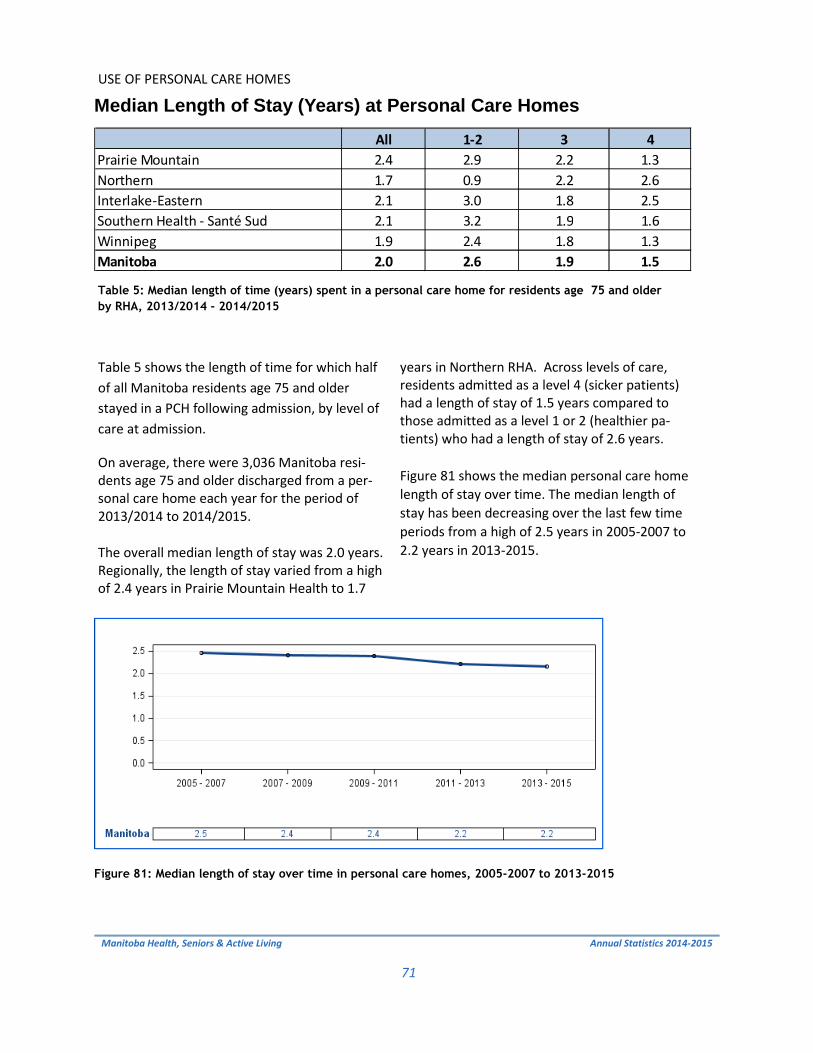
USE OF PERSONAL CARE HOMES
71
Manitoba Health, Seniors & Active Living
Annual Statistics 2014-2015
Median Length of Stay (Years) at Personal Care Homes
Figure 81: Median length of stay over time in personal care homes, 2005-2007 to 2013-2015
Table 5: Median length of time (years) spent in a personal care home for residents age 75 and older
by RHA, 2013/2014 - 2014/2015
Table 5 shows the length of time for which half
of all Manitoba residents age 75 and older
stayed in a PCH following admission, by level of
care at admission.
On average, there were 3,036 Manitoba resi-dents age 75 and older discharged from a per-sonal care home each year for the period of 2013/2014 to 2014/2015.
The overall median length of stay was 2.0 years. Regionally, the length of stay varied from a high of 2.4 years in Prairie Mountain Health to 1.7
years in Northern RHA. Across levels of care, residents admitted as a level 4 (sicker patients) had a length of stay of 1.5 years compared to those admitted as a level 1 or 2 (healthier pa-tients) who had a length of stay of 2.6 years.
Figure 81 shows the median personal care home length of stay over time. The median length of stay has been decreasing over the last few time periods from a high of 2.5 years in 2005-2007 to 2.2 years in 2013-2015.
All 1-2 3 4Prairie Mountain 2.4 2.9 2.2 1.3Northern 1.7 0.9 2.2 2.6Interlake-Eastern 2.1 3.0 1.8 2.5Southern Health - Santé Sud 2.1 3.2 1.9 1.6Winnipeg 1.9 2.4 1.8 1.3Manitoba 2.0 2.6 1.9 1.5

72
Manitoba Health, Seniors & Active Living
Annual Statistics 2014-2015
This page intentionally left blank.

73
Manitoba Health, Seniors & Active Living
Annual Statistics 2014-2015
Preventative Services
The following section provides an overview of preventative and screening ser-vices for selected programs available in Manitoba. Detailed information on immunizations have not been included in this report, as they are shown in Manitoba Health, Seniors and Active Living�s annual Manitoba Immunization Monitoring System (MIMS) report at: http://www.gov.mb.ca/health/publichealth/surveillance/reports.html#influenza
In Manitoba, breast screening mammograms are provided through the Mani-toba Breast Screening Program to check women age 50 and older for early signs of breast cancer. For the period of 2013/2014 to 2014/2015, there were 94,308 Manitoba fe-male residents ages 50 to 69 who had a mammogram, representing 59.4% of the female population in the same age group.
Papanicolaou (Pap) tests are provided to Manitoba females ages 18 to 69 for the early detection of cervical cancer. For the period of 2012/2013 to 2014/2015, there were 231,079 Manitoba females ages 18 to 69 who had a Pap test, representing 53.3% of the female population for the same age group.

PREVENTATIVE SERVICES
74
Manitoba Health, Healthy Living & Seniors
Annual Statistics 2013-2014
Breast Cancer Screening
Figure 82 shows the age-adjusted percent of
Manitoba females ages 50 to 69 who received
at least one mammogram in a two-year period,
by RHA of residence. �BreastCheck� is a
provincially monitored screening program man-
aged by CancerCare Manitoba. The program
recommends that all women between 50 and
69 years of age get screened every 2 years for
breast cancer.
For the period of 2013/2014 to 2014/2015,
there were 94,308 Manitoba females ages 50
to 69 who had a mammogram, representing
59.4% of the female population for the same
age group. The age-adjusted percentage in
Northern Health Region was significantly lower
than Manitoba overall.
Figure 82: Age-adjusted percent of female residents ages 50 to 69 who received a mammogram by
RHA, 2013/2014 to 2014/2015

PREVENTATIVE SERVICES
75
Manitoba Health, Healthy Living & Seniors
Annual Statistics 2013-2014
Cervical Cancer Screening
Figure 83: Age-adjusted percent of female residents ages 18 to 69 who received a Pap test by
RHA, 2012/2013 to 2014/2015
Figure 83 shows the age-adjusted percent of
Manitoba females ages 18 to 69 who received
at least one Papanicolaou (Pap) test in a three-
year period, by RHA of residence.
�CervixCheck� is a provincially monitored
screening program managed by CancerCare
Manitoba. The goal of this program is to re-
duce the number of women diagnosed with
cervical cancer.
For the period of 2012/2013 to 2014/2015,
there were 231,079 Manitoba females ages 18
to 69 who had a Pap test, representing 53.3%
of the female population for the same age
group. The age-adjusted percentage in North-
ern Health Region was significantly lower than
Manitoba overall.

PREVENTATIVE SERVICES
76
Manitoba Health, Healthy Living & Seniors
Annual Statistics 2013-2014
Influenza Immunizations
Figure 84: Percent of Manitoba residents age 65 and older immunized for influenza, 2013/2014
Figure 84 shows the crude percentage of Manito-
bans age 65 and older who were immunized for
influenza (flu), by RHA of residence.
In the 2013/2014 �flu season� (September 2013
to April 2014), the percentage of Manitobans age
65 and older who received an immunization for
influenza was 56%.
For more information on immunizations in Mani-toba please follow the link below.
http://www.gov.mb.ca/health/publichealth/surveillance/reports.html#influenza

PREVENTATIVE SERVICES
77
Manitoba Health, Healthy Living & Seniors
Annual Statistics 2013-2014
Pneumococcal Immunizations
Figure 85 shows the crude percentage of Manito-
bans age 65 and older who, by RHA of residence,
had a current pneumococcal vaccine.
In 2013, the percentage of Manitobans age 65
and older who had a current pneumococcal vac-
cine was 69.5%.
Figure 85: Percent of Manitoba residents age 65 and older immunized for pneumonia, 2013

78
Manitoba Health, Seniors & Active Living
Annual Statistics 2014-2015
This page intentionally left blank.

79
Manitoba Health, Seniors & Active Living
Annual Statistics 2014-2015
Prescription Drug Use
The following section provides an overview of prescription drug use and paid
expenditures by drug benefit plan in Manitoba.
In 2014/2015, 68.7% of Manitoba residents had at least one prescription dis-
pensed. On average, these residents were prescribed 3 different types of drugs
in the fiscal year.
Manitoba paid $234.5 million in drug expenditures for eligible Manitobans
through the Pharmacare program, $57.3 million through Family Services, $11.1
million through nursing home care and $3.6 million through palliative care.
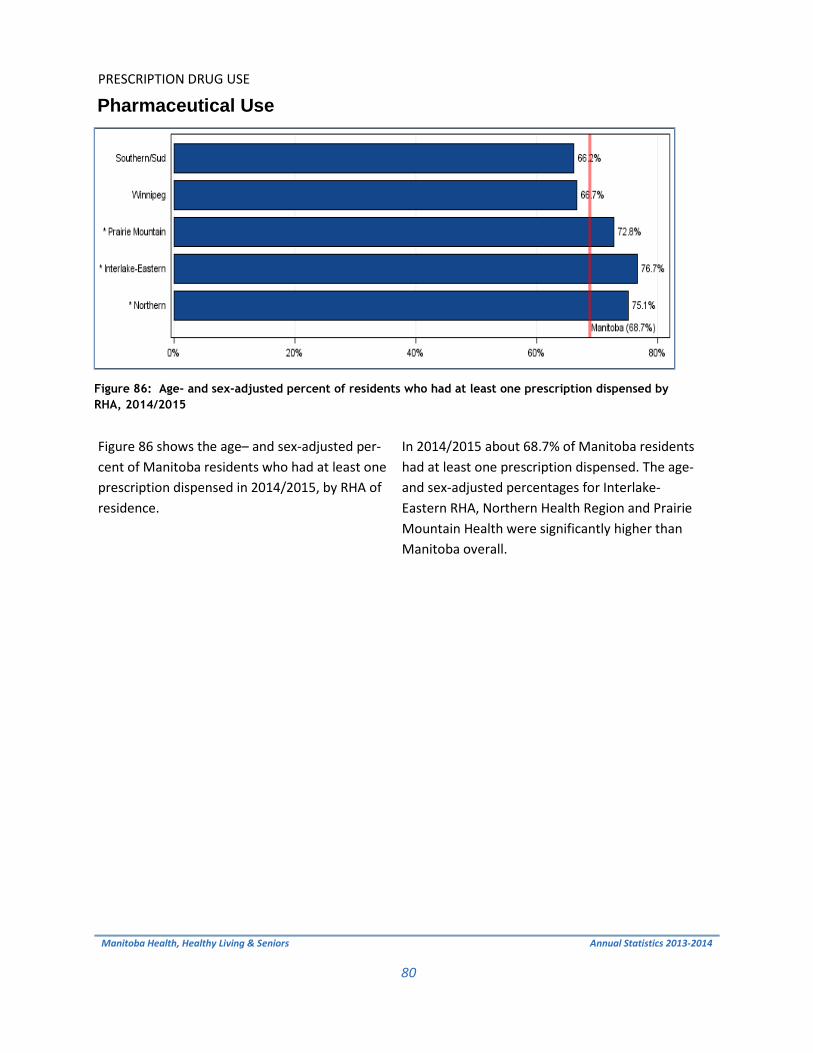
PRESCRIPTION DRUG USE
80
Manitoba Health, Healthy Living & Seniors
Annual Statistics 2013-2014
Pharmaceutical Use
Figure 86: Age- and sex-adjusted percent of residents who had at least one prescription dispensed by
RHA, 2014/2015
Figure 86 shows the age� and sex-adjusted per-
cent of Manitoba residents who had at least one
prescription dispensed in 2014/2015, by RHA of
residence.
In 2014/2015 about 68.7% of Manitoba residents
had at least one prescription dispensed. The age-
and sex-adjusted percentages for Interlake-
Eastern RHA, Northern Health Region and Prairie
Mountain Health were significantly higher than
Manitoba overall.

PRESCRIPTION DRUG USE
81
Manitoba Health, Healthy Living & Seniors
Annual Statistics 2013-2014
Drugs Dispensed per User
Figure 87: Age- and sex-adjusted average number of drug types dispensed per resident by RHA,
2014/2015
Figure 87 shows the age- and sex-adjusted aver-
age number of drug types dispensed per Mani-
toba resident, by RHA of residence.
In 2014/2015, an average of 3.3 drug types were
dispensed per Manitoba resident. The age- and
sex-adjusted number varied significantly across
the province, ranging from 2.9 drug types per
Southern Health-Santé Sud resident to 4.4 drug
types per Northern Health Region resident.

PRESCRIPTION DRUG USE
82
Manitoba Health, Healthy Living & Seniors
Annual Statistics 2013-2014
Total Drug Expenditures by Plan and RHA
Table 6 shows the total paid expenditures by drug benefit plan and by RHA of residence.
In 2014/2015, Manitoba paid $234.5 million in drug expenditures for eligible Manitoba resi-dents through the Pharmacare program, $57.3 million through Family Services, $11.1 million for those in Nursing Homes and $3.6 million for those in palliative care.
Figure 88 shows the total paid expenditures by drug benefit plan for Manitoba over time. The total expenditures by plan decreased from 2011/2012 to 2014/2015, with Pharmacare rep-resenting the largest proportion (76.5%) of ex-penditures.
RHA Pharmacare Nursing Home Family Services Palliative Care
Southern/Sud $31,137,791 $592,182 $4,308,170 $452,170Winnipeg $139,912,683 $6,507,325 $42,601,036 $1,856,039Prairie Mountain $35,744,546 $2,744,075 $6,591,166 $851,304Interlake-Eastern $23,916,180 $1,071,491 $3,095,144 $432,664Northern $3,805,394 $153,690 $746,902 $30,473
Manitoba $234,516,594 $11,068,763 $57,342,418 $3,622,650
Table 6: Total paid drug expenditures by plan and RHA, 2014/2015
Figure 88: Total paid expenditures by fiscal year

83
Manitoba Health, Seniors & Active Living
Annual Statistics 2014-2015
Glossary
The Glossary provides explanations and definitions for the indicators and key terms used in this report. The method used to calculate each indicator is described in this section.

GLOSSARY
84
Manitoba Health, Healthy Living & Seniors
Annual Statistics 2013-2014
Acute Myocardial Infarction (Heart Attack) Rate
Calculated as the number of hospitalizations or deaths due to acute myocardial infarction (AMI) in resi-dents age 40 or older per 1,000 residents age 40 or older. The denominator was residents age 40 or older as of June 1st. Rates were age- and sex-adjusted to the Manitoba population age 40 or older. AMI is defined by ICD-9-CM code 410 or ICD-10-CA code I21 in the most responsible diagnosis field for hospitalization or as the cause of death in Vital Statistics death files. Persons discharged alive from hos-pital after less than three days were excluded as likely �rule-out� AMI cases.
Adjusted Rate
A statistical process that makes groups such as those in particular geographic areas comparable by re-moving the effects of demographic differences such as age and sex distribution. Essentially, adjusted rates tell us what the rates would be if each geographic area had the same age and sex distribution. Therefore, adjusted rates are fictional rates which use statistical models to remove the effects of age and sex differences and to allow for comparisons across populations.
Accordingly, while adjusted rates have been statistically modelled to be comparable to each other, they should be considered fictional in the sense that they do not measure anything directly. Please note that these adjusted rates cannot be compared to other rates which have not received the same adjustment.
Alternate Level of Care (ALC)
Inpatient hospital days are identified as ALC when a patient no longer requires the level of care their acute care setting provides, and where the patient is awaiting discharge to a more appropriate non-acute care setting, such as personal care home placement.
The average lengths of stay for acute care hospitalizations, and for hospitalizations where a portion of the stay included ALC were calculated.
Ambulatory Care Visit Rate
This is the average number of visits to physicians per resident . The denominator is all residents as of June 1st. The number was age- and sex-adjusted to the Manitoba population.
The term �ambulatory visits� captures virtually all contacts with physicians, except during inpatient hos-pitalization and visits for prenatal care. Ambulatory visits include regular office visits, walk-in clinics, home visits, nursing home visits, visits to outpatient departments of hospitals, emergency room visits (where data are recorded) and visits for prenatal care.
Birth Rate Calculated as the number of live births per 1,000 residents. The denominator was all residents as of June 1st. The Vital Statistics birth records were used to count live births.
GLOSSARY
85
Manitoba Health, Healthy Living & Seniors
Annual Statistics 2013-2014
Breast Cancer Screening Rate
The proportion of female residents ages 50 to 69 that had at least one mammogram in a two-year pe-riod. The denominator was all female residents ages 50 to 69 as of June 1st of the second year. The proportion was age- adjusted to the Manitoba female population ages 50 to 69. The indicator includes both screening and diagnostic mammograms, identified by the following tariffs in the physician claims:
7098 (Radiology, Intraluminal Dilatation, Mammography, Bilateral)
7099 (Radiology, Intraluminal Dilatation, Mammography, Unilateral)
7104 (Screening Mammography Bilateral)
Cataract Surgery Rate
The number of cataract replacement surgeries performed on residents age 50 or older, per 1,000 resi-dents age 50 or older. The denominator was residents age 50 or older as of June 1st. The rate was age- and sex-adjusted to the Manitoba population age 50 or older. Cataract surgery was defined by a physi-cian claim with tariff codes 5611, 5612 and tariff prefix 2 (surgery), or a hospital separation with ICD-9-CM procedure codes 13.11, 13.19, 13.2, 13.3, 13.41, 13.42, 13.43, 13.51, 13.59, or CCI code 1.CL.89. Additional cataract surgeries for Manitoba residents were added from medical reciprocal claims for out of province procedures, including Alberta (tariff code 27.72) and Saskatchewan (tariff codes 135S, 136S, 226S and 325S). The most recent medical reciprocal claims data available for cataract surgery rates were provided. Caesarean Section Rate
The proportion of caesarean section procedures among female residents ages 15 to 54. The denomina-tor was total deliveries among female residents ages 15 to 54 at hospital admission. The rate was age-adjusted to the Manitoba female population ages 15 to 54 who delivered in the same year. Caesarean section procedures were defined by ICD-9-CM procedure codes 74.0, 74.1, 74.2, 74.9 or CCI code 5.MD.60 in any procedure field in hospital abstracts.
Cervical Cancer Screening Rate
The proportion of female residents ages 18 to 69 that received at least one Papanicolaou (Pap) test in a three-year period. The denominator was all female residents ages 18 to 69 on June 1st of the middle year. The proportion was age-adjusted to the Manitoba female population ages 18 to 69. The indicator is defined by a physician visit with a tariff code for a Pap test, including a visit for a physical or regional exam with a Pap test, or a visit for Pap testing only. The tariffs used were as follows:
8470 � Regional gynaecological exam, including cytological smear of the cervix, provided by
a GP/FP
8495 � complete physical and gynaecological exam, including cytological smear of the cer-
vix, provided by an OB/GYN specialist

GLOSSARY
86
Manitoba Health, Healthy Living & Seniors
Annual Statistics 2013-2014
8496 � regional gynaecological exam, including cytological smear of the cervix, provided by
an OB/GYN specialist
8498 � complete physical and gynaecological exam, including cytological smear of the cer-
vix, provided by a GP/FP
9795 � cytological smear of the cervix for cancer screening
Child Mortality Rate
Calculated as the number of deaths among children ages 1 to 19 years in a five-year period, per 100,000 children ages 1 to 19 years in the same time period. The rates were age- and sex-adjusted to the over-all Manitoba population ages 1 to 19 years old. The Vital Statistics death records were used to count deaths. Rates fluctuate in areas with small populations; therefore five years of data was used instead of a single year.
Chronic Conditions Prevalence Rate
The proportion of residents age 20 or older having one or more of the following conditions: arthritis, asthma/COPD, coronary heart disease, diabetes or stroke (see definitions below). The denominator was residents age 20 or older with active Manitoba registration on March 31st. The proportion was age- and sex-adjusted to the Manitoba population age 20 or older.
The chronic conditions were defined as follows:
Arthritis:
at least one hospitalization or two physician visits over a five-year period with a diag-
nosis defined by ICD-9-CM codes 274, 446, 710-721, 725-729, 739 or ICD-10-CM
codes M00-M03, M05-M07, M10-M25, M30-M36, M65-M79
Asthma/COPD:
at least one hospitalization or one physician visit over a five-year period with a diag-
nosis defined by ICD-9-CM code 493 or ICD-10-CM codes J43-J46, or
at least one prescription for asthma receiving medication over a five-year period as
defined by drug groups R03A (Adrenergics, inhalants), R03B (Other drugs for obstruc-
tive airway diseases, inhalants), R03C (Adrenergics for systemic use), R03D (other
systemic drugs for obstructive airway diseases)
Coronary Heart Disease:
at least one hospitalization or one physician visit over a five-year period with a diag-
nosis defined by ICD-9-CM codes 410-414 or ICD-10-CM codes I20-I22, I24-I25

GLOSSARY
87
Manitoba Health, Healthy Living & Seniors
Annual Statistics 2013-2014
Diabetes:
at least one hospitalization or two physician visits over a three-year period with a
diagnosis defined by ICD-9-CM code 250 or ICD-10-CM codes E10-E14, or
at least one prescription for diabetes receiving medication over a three-year period
as defined by all DINs associated with the following second level ATC code: A10
(drugs used in diabetes)
Stroke:
at least one hospitalization or one physician visit over a five-year period with a diag-
nosis defined by ICD-9-CM codes 430-438 or ICD-10-CM codes G41, I60-I69
Coronary Artery Bypass Graft Surgery Rate
The number of bypass surgeries performed on residents age 40 or older, in a five-year period, per 1,000 residents age 40 or older. The denominator was residents age 40 or older during the same time period. The rate was age- and sex-adjusted to the Manitoba population age 40 or older. Bypass surgery was defined by ICD-9-CM procedure codes 36.10-36.17, 36.19 or CCI code 1.IJ.76 in any procedure field in hospital abstracts.
Cumulative Mental Illness Prevalence Rate
The proportion of residents age 10 or older who received treatment for any of the following in a five-year period: depression, anxiety, substance abuse, personality disorders, or schizophrenia. The propor-tion was age- and sex-adjusted to the Manitoba population age 10 or older. See corresponding glossary entries for definitions on specific mental illnesses.
Day Surgery
The total number of day surgery separations per 1,000 residents. The denominator was all residents as of June 1st. The rate was age- and sex-adjusted to the Manitoba population.
Day Surgery hospitalizations involve surgical services on an outpatient basis and are typically less than one day. All Manitoba hospitals were included; personal care homes, nursing stations and long-term care facilities were excluded (Deer Lodge Centre, Manitoba Adolescent Treatment Centre, Rehabilita-tion Centre for Children and Riverview Health Centre).
Death Causes
The distribution of causes of death based on Vital Statistics files, using the 21 chapters of the Interna-tional Classification of Diseases (ICD-10-CA) system. Results are provided at the Manitoba level, but not by RHA due to the relatively small number of deaths by cause in smaller areas.

GLOSSARY
88
Manitoba Health, Healthy Living & Seniors
Annual Statistics 2013-2014
Death Rate
Calculated as the number of deaths per 1,000 residents. The denominator was all residents as of June 1st. The rates were age- and sex- adjusted to the overall Manitoba population. The Vital Statistics death records were used to count deaths.
Diabetes Prevalence Rate
The proportion of residents age 1 or older with at least one hospitalization or at least two physician vis-its with a diagnosis of diabetes within a two-year period. A diabetes diagnosis was defined as ICD-9-CM codes 250 or ICD-10-CA codes E10-E14. The denominator was residents age 1 or older as of June 1st of the second year. The proportion was age- and sex- adjusted to the Manitoba population age 1 or older.
Although the case definition uses a two-year period to define cases, an annual number was derived by using the earliest date of hospitalization or the later of the two physician claims as the case date. The definition for diabetes was derived from the Canadian Chronic Disease Surveillance System (CCDSS). This definition has been validated and is the definition utilized by Manitoba Health, Seniors and Active Living.
Drug Program Expenditures by Plan and RHA The total paid expenditures by drug benefit plan and RHA of residence is shown. Drug program expen-ditures are grouped in to the following categories: Pharmacare, Nursing Home, Family Services and Pal-liative Care. Expenditure data is taken from DPIN. Pharmacare is a drug benefit program for eligible Manitoba residents, regardless of disease or age, whose income is seriously affected by high prescription drug costs. Pharmacare coverage is based on both an individual�s total family income and the amount they pay for eligible prescription drugs. Each year the individual is required to pay a portion of the cost of the eligible prescription drugs. This amount is the annual Pharmacare deductible. The deductible is set based on the adjusted family in-come.
Drugs Dispensed per User
The average number of different types of drugs dispensed to each resident who had at least one pre-scription. The number was age- and sex-adjusted to the Manitoba population. A �different� drug type was determined by fourth-level class of the Anatomic, Therapeutic, Chemical (ATC) classification sys-tem. This level essentially separates drugs used for different health problems. A person could have several prescriptions for drugs in the same 4th level ATC class, but this would only count as one drug type in the year.

GLOSSARY
89
Manitoba Health, Healthy Living & Seniors
Annual Statistics 2013-2014
Drugs Programs Information Network (DPIN)
An electronic, on-line, point-of-sale prescription drug database. It links all community pharmacies (but not pharmacies in hospitals or personal care homes) and captures information about all Manitoba resi-dents, including most prescriptions dispensed to registered First Nations. DPIN contains information
such as unique patient identification, age, date of birth, sex, medication history, over-the-counter medication history, patient postal code, new drug prescribed, date dispensed, and unique pharmacy identification number. DPIN is maintained by Manitoba Health, Seniors and Active Living.
First Nations Residents
Residents who have registered with Manitoba Health, Seniors and Active Living as a �Status or Treaty Indian.� Entitlements of land, voting rights, and Band membership are received by registered First Na-tions. A registered First Nation resident may be living in a First Nation community (on-reserve) or in a non-First Nation community (off-reserve).
Hip Replacement Rate
The number of total hip replacements performed on residents age 40 or older, per 1,000 residents age 40 or older. The denominator was all residents age 40 or older as of June 1st. The rate was age- and sex-adjusted to the Manitoba population age 40 or older. Hip replacements were defined by ICD-9-CM codes 81.50, 81.51, or 81.53 or CCI code 1.VA.53.LA-PN or 1.VA.53.PN-PN in any procedure field in hos-pital abstracts. This definition includes revisions on previously performed hip replacements and ex-cludes partial hip replacements.
Home Care The Manitoba Home Care Program, established in its present form in 1974, is the oldest comprehen-sive, province-wide, universal home care program in Canada. Home Care is provided to Manitoba resi-dents of all ages based on assessed need and taking into account other resources available to the indi-vidual including family, community resources and other programs. Home Care services are provided free of charge. Reassessments at pre-determined intervals are the basis for decisions by case managers to discharge individuals from the Program or to change the type or amount of services delivered by the Home Care Program.
Home Care: Number of Assessments for Admission, Admissions and Discharges
The annual number of assessments, admission and discharges to Manitoba residents is shown. Assess-ments are made by case managers and may or may not lead to an admission in to the Home Care Pro-gram.
Home Care: Total Number of Clients on Home Care Program at Fiscal Year End
The average monthly number of Manitoba residents receiving coordinated Home Care services by RHA of residence is shown.

GLOSSARY
90
Manitoba Health, Healthy Living & Seniors
Annual Statistics 2013-2014
Hospital Discharge Abstract Database
Hospital abstracts are completed at the point of discharge for all separations from acute care facilities. Abstracts are completed for all inpatient stays as well as some day surgery stays. Since April 1, 2004, they include up to 25 diagnosis codes based on the International Classification of Diseases, 10th Revi-sion, Canada (ICD-10-CA) and 20 procedure (intervention) codes based on the Canadian Classification of
Health Interventions (CCI). Information on Manitoba residents who are admitted to out of province acute care facilities is captured through reciprocal Hospital Claims data, housed at Manitoba Health, Seniors and Active Living.
Hospital Separation Rate
The total number of inpatient hospital separations of residents, per 1,000 residents. The denominator was all residents as of June 1st. The rate was age- and sex-adjusted to the Manitoba population.
A separation from a health care facility occurs anytime when a patient leaves because of discharge, transfer or death. In a fiscal year, a resident could be hospitalized more than once, so this indicator shows the total number of separations from acute care facilities. All Manitoba hospitals were included; personal care homes, nursing stations and long-term care facilities were excluded (Deer Lodge Centre, Manitoba Adolescent Treatment Centre, Rehabilitation Centre for Children and Riverview Health Cen-tre). Out-of-province hospitalizations for Manitoba residents were also included. In cases of birth, new-born hospitalizations were excluded.
Hospital Use Rate
The proportion of residents who were admitted to an acute care hospital at least once. The denomina-tor was all residents as of June 1st. The proportion was age- and sex-adjusted to the Manitoba popula-tion.
All Manitoba hospitals were included; personal care homes, nursing stations and long-term care facili-ties were excluded (Deer Lodge Centre, Manitoba Adolescent Treatment Centre, Rehabilitation Centre for Children and Riverview Health Centre). Out-of-province hospitalizations for Manitoba residents were also included. In cases of birth, newborn hospitalizations were excluded. Outpatient and day sur-gery services were excluded.
Hospitalization Rate for Ambulatory Care Sensitive Conditions (ACSC)
The rate at which residents ages 0 to 74 were hospitalized for ambulatory care sensitive conditions, per 1,000 residents ages 0 to 74. The denominator was all residents ages 0 to 74 as of June 1st. The rate was age- and sex-adjusted to the Manitoba population ages 0 to 74. All Manitoba hospitals were in-cluded; PCHs, nursing stations and Long-Term Care facilities were excluded (Deer Lodge and Riverview). Individuals who died in hospital were excluded from the numerator.
ACSC are a set of conditions comprised of 25 diseases/diagnoses, which have been identified as ob-servably responsive to primary care. ACSC hospitalizations accordingly can function as an indirect measure of primary care access. Although significantly higher rates are presumed to reflect problems obtaining access to primary care, not all admissions for these conditions are avoidable.

GLOSSARY
91
Manitoba Health, Healthy Living & Seniors
Annual Statistics 2013-2014
ACSC include (with ICD-10-CA and CCI codes):
Congenital syphilis: Z38 & A50
Immunization-related & preventable conditions (primary diagnoses): A35, A37, A80, I00, I01
Hemophilus meningitis for age 1-5 only: G00.0
Epilepsy: G40, G41
Convulsions: R56
Severe ENT infections: procedure code 1.DF.53.JATS and diagnosis code H66, J02, J03, J06, J312
Pulmonary tuberculosis: A15.0, A15.1, A15.2, A15.3, A15.7, A15.9, A16.0, A16.1, A62, A16.7, A16.9
Other tuberculosis: A15.4, A15.5, A15.6, A15.8, A16.3, A16.4, A16.5, A16.8, A17, A18, A19
COPD: J41, J42, J43, J44, J47. There is a new combination code of acute lower respira-tory infection for patients with COPD (J44) and J10.0, J11.0, J12, J13, J14, J15, J16, J18, J21, J22
Acute bronchitis: secondary diagnosis of J41, J42, J43, J44, J47 where J20 is the primary diagnosis
Bacterial pneumonia: primary diagnosis of J13, J14, J15.3, J15.4, J15.7, J15.9, J16, J18. Exclude cases with secondary diagnosis of sickle cell anemia: D57.0, D57.1, D57.2, and D57.8. Exclude patients < 2 months old
Asthma: primary diagnosis of J45
Congestive heart failure:
i. exclude cases with certain cardiac interventions (all categories):1.HB.53, 1.HB.54, 1.HB.55, 1.HD.53, 1.HD.54, 1.HD.55, 1.HZ.53, 1.HZ.55, 1.HZ.85, 1.IJ.50, 1.IJ.57.GQ, 1.IJ.76
ii. where the primary diagnosis is: I50, J81
Hypertension: primary diagnosis of I10.0, I10.1, I11 and exclude cardiac surgery as stated above.

GLOSSARY
92
Manitoba Health, Healthy Living & Seniors
Annual Statistics 2013-2014
Angina: exclude cases with any surgical intervention in CCI section 1, 2 or 5. And in-clude primary diagnosis of I20, I23.82, I24.0, I24.8, I24.9
Cellulitis: incision of skin and subcutaneous tissue intervention. Exclude cases with any surgical intervention except incision of skin and subcutaneous tissue where it is the
only listed intervention. Include primary diagnosis of :L03, L04, L08, L44.4, L88, L92.2, L98.0, L98.3
Diabetes: primary diagnosis of: E10.1, E10.6, E10.7, E10.9, E11.0, E11.1, E11.6, E11.7, E11.9, E13.0, E13.1, E13.6, E13.7, E13.9, E14.0, E14.1, E14.6, E14.7, E14.9
Hypoglycemia: primary diagnosis of E16.0, E16.1, E16.2
Gastroenteritis: K52.2, K52.8, K52.9
Kidney/urinary infection: N10, N11, N12, N13.6, N15.8, N15.9, N16.0-N16.5, N28.83-N28.85, N36.9, N39.0, N39.9
Dehydration/volume depletion: primary diagnosis of E86
Iron deficiency anemia: age <= 5 and primary diagnosis of: D50.1, D50.8, D50.9
Nutritional deficiencies: primary diagnosis of E40, E41, E42, E43, E55.0, E64.3
Failure to thrive: age < 1 and primary diagnosis of R62
Pelvic inflammatory disease:
i. exclude cases with surgical procedure of hysterectomy: 1.RM.87, 1.RM.89, 1.RM.91, 5.CA.89.CK, 5.CA.89.DA, 5.CA.89.GB, 5.CA.89.WJ, 5.CA.89.WK
ii. primary diagnosis of: N70, N73, N99.4 for females only
Dental conditions: K02-K06, K08, K09.8, K09.9, K12, K13
Hypertension (High Blood Pressure) Prevalence Rate
The proportion of residents age 20 or older with at least one hospitalization or at least two physician visits with a diagnosis of hypertension within a two-year period. A hypertension diagnosis was defined as ICD-9-CM codes 401-405 or ICD-10-CA codes I10-I13, I15. The denominator was residents age 20 or older as of June 1st of the second year. The proportion was age- and sex-adjusted to the Manitoba population age 20 or older.

GLOSSARY
93
Manitoba Health, Healthy Living & Seniors
Annual Statistics 2013-2014
Although the case definition uses a two-year period to define cases, an annual number is derived by using the earliest date of hospitalization or the later of the two physician claims as the case date. The definition for hypertension was derived from the Canadian Chronic Disease Surveillance System (CCDSS). This definition has been validated and is the definition utilized by Manitoba Health, Seniors and Active Living.
Hysterectomy Rate
The number of hysterectomy surgeries performed on female residents ages 20 to 84, per 1,000 female residents ages 20 to 84. The denominator was female residents ages 20 to 84 as of June 1st. The rate was age-adjusted to the Manitoba female population ages 20 to 84. Hysterectomy surgery was defined by ICD-9-CM procedure codes 68.3 � 68.9 or CCI codes 1.RM.87BAGX, 1.RM.87.CAGX, 1.RM.87.DAGX, 1.RM.87.LAGX, 1.RM.89, 1.RM.91 in any procedure field in hospital abstracts.
Immunization for Influenza (Flu) Rate
The proportion of residents age 65 or older who received a vaccine for the influenza season (September through April). The denominator was all residents age 65 or older as of September 1st. Flu shots were defined by physician tariff codes 8791, 8792, 8793, or 8799 in Manitoba Immunization Monitoring Sys-tem (MIMS) data.
Immunization for Pneumonia Rate
The proportion of residents age 65 or older who ever received a vaccine for pneumonia. The denomi-nator was all residents age 65 or older as of June 1st. For most seniors, a pneumococcal vaccination is considered a �once in a lifetime� event, so these rates show the cumulative percent of residents who ever had a pneumococcal vaccination, as defined by physician tariff codes 8681-8694 and 8961 in MIMS data.
Infant Mortality Rate
Calculated as the number of deaths among infants under one year of age, in a five-year period, per 1,000 live births in the same time period. The Vital Statistics death records were used to count deaths. Rates fluctuate in areas with small populations; therefore five years of data was used instead of a single year.
Injury Hospitalization Rate
The number of hospital separations of residents for which any injury code was included as one of the diagnoses in hospital abstracts per 1,000 residents. The denominator was all residents as of June 1st. Rates were age- and sex-adjusted to the Manitoba population.
Hospitalizations were defined as any inpatient stay with an external cause of injury diagnosis code, ICD-9-CM codes E800-E999; ICD-10-CA codes V01-Y89. Excluded from the hospitalizations due to injury are those related to medical error or complications, as follows:

GLOSSARY
94
Manitoba Health, Healthy Living & Seniors
Annual Statistics 2013-2014
misadventures during surgical or medical care, ICD-9-CM codes E870-E876; ICD-10-CA
codes Y60-Y69, Y88.1
reactions or complications due to medical care, ICD-9-CM codes E878-E879; ICD-10-CA
codes Y70-Y84, Y88.2, Y88.3
adverse effects due to drugs, ICD-9-CM codes E930-E949; ICD-10-CA codes Y40-Y59,
Y88.0
All Manitoba hospitals were included; PCHs, nursing stations and Long-Term Care facilities were ex-cluded (Riverview, Deer Lodge, Rehabilitation Centre for Children and Adolescent Treatment Centre). Newborn birth injuries or deaths, stillbirths and brain deaths were excluded.
Injury Mortality Causes
The distribution of causes of injury death based on Vital Statistics files, using the International Classifi-cation of Diseases (ICD-10-CA) system. Excluded are codes for misadventures, reactions, complications, or adverse effects of medical, surgical or pharmaceutical treatments (see list in Injury Mortality Rate). Results are provided at the Manitoba level, but not by RHA due to the relatively small number of deaths by cause in smaller areas.
Injury Mortality Rate
Calculated as the number of deaths due to injury per 1,000 residents, based on Vital Statistics death codes. The denominator was all residents as of June 1st. Rates were age- and sex-adjusted to the Manitoba population. Injury deaths were defined as records with ICD-10-CA cause of death codes of V01-Y89.
Excluded from the hospitalizations due to injury are those related to medical error or complications, as follows:
misadventures during surgical or medical care, ICD-9-CM codes E870-E876; ICD-10-CA
codes Y60-Y69, Y88.1
reactions or complications due to medical care, ICD-9-CM codes E878-E879; ICD-10-CA
codes Y70-Y84, Y88.2, Y88.3
adverse effects due to drugs, ICD-9-CM codes E930-E949; ICD-10-CA codes Y40-Y59,
Y88.0
Insured Services per Capita
The total dollars spent on insured services in Manitoba per capita. The denominator was the number of residents as of June 1st.
The Health Services Insurance Plan operates outside the Provincial Consolidated Fund and provides for payment of insured services for hospitals, personal care homes, and health care providers on behalf of

GLOSSARY
95
Manitoba Health, Healthy Living & Seniors
Annual Statistics 2013-2014
Manitoba residents. Other plans include the prescription drugs program (Pharmacare), Ambulance, Air Ambulance, and Northern Patients Transportation programs.
Knee Replacement Rate
The number of total knee replacements performed on residents age 40 or older, per 1,000 residents age 40 or older. The denominator was all residents age 40 or older as of June 1st. The rate was age- and sex-adjusted to the Manitoba population age 40 or older. Knee replacements were defined by ICD-9-CM codes 81.54, 81.55, or CCI codes 1.VG.53.LA.PN and 1.VG.53.LA.PP in any procedure field in hos-pital abstracts. This definition includes revisions on previously performed knee replacements.
Majority of Care
The proportion of residents receiving more than 50% of their ambulatory visits over a two-year period from the same physician. The denominator includes all residents with at least three ambulatory visits in the same two-year time period. The proportion was age- and sex-adjusted to the Manitoba popula-tion.
For children ages 0 to 14, visits included those to a GP/FP or Pediatrician; for those ages 15 to 59, only GP/FPs were used; for those age 60+, it could be a GP/FP or an Internal Medicine specialist.
Mood and Anxiety Disorders
The proportion of residents age 10 or older diagnosed with depression and/or anxiety disorder in a five-year period by any of the following:
one or more hospitalizations with a diagnosis for depressive disorder, affective psychoses, neurotic depression or adjustment reaction: ICD�9�CM codes 296.2�296.8, 300.4, 309 or 311; ICD�10�CA codes F31, F32, F33, F341, F38.0, F38.1, F41.2, F43.1, F43.2, F43.8, F53.0, F93.0 or with a diagnosis for a manic disorder, anxiety state, phobic disorders, obsessive� compulsive disorders or hypochondriasis: ICD�9�CM codes 296.1, 300.0, 300.2, 300.3, 300.7; ICD�10�CA codes F40, F41.0, F41.1, F41.3, F41.8, F41.9, F42, F45.2
one or more hospitalizations with a diagnosis for anxiety disorders: ICD�9�CM code 300; ICD
�10�CA codes F32, F341, F40, F41, F42, F44, F45.0, F45.1, F45.2, F48, F68.0, or F99 AND one or more prescriptions for an antidepressant, anxiolytic or mood stabilizer: ATC codes N05AN01, N05BA, N06A
one or more physician visits with a diagnosis for depressive disorder or affective psychoses:
ICD�9�CM codes 296, 311 one or more physician visits with a diagnosis for anxiety disorders: ICD�9�CM code 300 AND
one or more prescriptions for an antidepressant, anxiolytic or mood stabilizer: ATC codes N05AN01, N05BA, N06A
three or more physician visits with a diagnosis for anxiety disorders or adjustment reaction:
ICD�9�CM code 300, 309 The proportion was age and sex-adjusted to the Manitoba population age 10 or older.

GLOSSARY
96
Manitoba Health, Healthy Living & Seniors
Annual Statistics 2013-2014
Paediatric Dental Extraction Rate The number of dental extractions among resident children under the age of six, per 1,000 children un-der the age of six. The denominator was resident children under the age of six as of June 1st. The rate was sex-adjusted to the Manitoba population under the age of six. Dental extractions were defined by ICD-9-CM codes 23.01, 23.09, 23.11, 23.19 or CCI codes 1.FE.57, 1.FE.89. Paediatric dental extractions performed outside of hospitals (e.g., in dentists� offices) were not included, so the rates reported may underestimate the extent of severe early childhood tooth decay.
Paediatric Dental Surgery Rate
The number of dental surgeries among children under the age of six, per 1,000 children under the age of six. The denominator was resident children under the age of six as of June 1st. The rate was sex-adjusted to the Manitoba population under the age of six. Dental surgeries were defined by ICD9-CM procedure code 23 or CCI code 1.FE. Paediatric dental surgeries performed outside of hospital (e.g. In dentists� office) were not included, so the rates reported may underestimate the extent of early child-hood dental issues.
Percutaneous Coronary Intervention Surgery Rate
The number of percutaneous coronary intervention (PCI) surgeries performed on residents age 40 or older, per 1,000 residents age 40 or older in a five-year period. The denominator was residents age 40 or older during the same time period. The rate was age� and sex-adjusted to the Manitoba population age 40 or older. PCI was defined by ICD-9-CM procedure codes 36.01-36.03, 36.05, 36.06-36.07 or CCI code 1.IJ.50 and 1.IJ.57 in an procedure field in hospital abstracts. Personal Care Homes (PCH)
Personal care homes (PCHs), or nursing homes, are residential facilities for persons with chronic illness or disability who can no longer remain safely at home even with home care services. Residents of PCHs are predominantly older adults. In Manitoba, PCHs can be proprietary (for profit) or non-proprietary. PCH data is populated by assessment, admission and discharge forms. An assessment form for place-ment in to a PCH is filled out by the resident while in an acute care facility or at home. The assessment application is reviewed to decide if the person is eligible for admission. There may be a waiting period between admission approval and actual admission. Personal Care Home, Admissions The percentage of residents age 75 and older admitted to a PCH in a year (values shown are the annual average). Residence was assigned based on the location of the PCH. The denominator was all residents age 75 and older in the same period. The proportion was age- and-sex adjusted to the Manitoba popu-lation age 75 and older.
Personal Care Home, Level of Care on Admission
The distribution of level of care assigned to PCH residents 75 years of age and older at the time of their admission to a provincial PCH in a two-year period. Level 1 represents the lowest level of need, and Level 4 represents the highest.

GLOSSARY
97
Manitoba Health, Healthy Living & Seniors
Annual Statistics 2013-2014
For the report years there were zero residents admitted at level of care 1. Levels 2 and 3 were stratified by the close supervision indicator (coded as yes/no on assessment to indicate the need for close super-vision due to possible behavioural issues), but due to small numbers level 4 was not stratified.
Personal Care Home, Median Length of Stay at Personal Care Homes
The median length of stay (in years) of PCH residents age 75 and older, over a two-year period, accord-ing to their level of care on admission. The median length of stay is the amount of time which half of all residents stayed.
Personal Care Home, Median Wait Time for Admission
The amount of time it took for half of all residents, age 75 and older, to be admitted, after being as-sessed as requiring PCH placement. The median wait time is provided in weeks and is shown for a two-year time period. Personality Disorders Prevalence Rate
The proportion of residents age 10 or older diagnosed with personality disorders in a five-year period, by any of the following:
one or more hospitalizations with a diagnosis for personality disorders, ICD-9-CM code 301; ICD-
10-CA codes F34.0, F60, F61, F62, F68.1, F68.8, F69
one or more physician visits with a diagnosis for personality disorders, ICD-9-CM code 301.
The proportion was age- and sex-adjusted to the Manitoba population age 10 or older.
Pharmaceutical Use Rate
The proportion of residents who had at least one prescription dispensed. The denominator was all resi-dents as of June 1st. The proportion was age- and-sex adjusted to the Manitoba population. This in-cludes all prescriptions dispensed from community-based pharmacies across Manitoba. Prescription data is captured in Manitoba�s Drug Programs Information Network (DPIN) (see glossary entry above).
Physician Claims
These are claims for payment submitted to the provincial government by physicians for services they provide. Fee-for-service physicians receive payment based on these claims, while those submitted by salaried physicians are only for administrative purposes (referred to as �shadow billing�).
Physician Use Rate
The proportion of residents who received at least one ambulatory visit. The denominator was all resi-dents as of June 1st. The proportion was age- and sex-adjusted to the Manitoba population.
The term �ambulatory visits� captures virtually all contacts with physicians, except during inpatient hos-pitalization. Ambulatory visits include regular office visits, walk-in clinics, home visits, nursing home

GLOSSARY
98
Manitoba Health, Healthy Living & Seniors
Annual Statistics 2013‐2014
visits, visits to outpatient departments of hospitals, emergency room visits (where data are recorded)
and prenatal visits.
Population
Population data shown in this report was based on records of residents registered with Manitoba
Health, Seniors and Active Living on June 1st. Registered individuals include persons who reside in the
province of Manitoba, as well as new Manitobans arriving from another province (eligible for coverage
after a waiting period of up to 3 months), new Manitobans from another country (eligible for coverage
immediately if they have landed immigrant status), and foreign citizens holding a one‐year or more
work permit. Manitoba residents not covered include armed forces and federal penitentiary inmates.
Population Pyramid
A graph showing the age and sex distribution of a population. The percentage of residents within each
five‐year age group is shown for both males and females. Most developing countries have a population
pyramid triangular in shape, indicating a very young population with few people in the oldest age
groups. Most developed countries have a population pyramid that looks more rectangular with the
young and middle‐aged people representing similar and smaller percentages of the population, and
more elderly people in the top part of the pyramid.
Premature Mortality Rate
Calculated as the number of deaths among residents under the age of 75 years, in a five‐year period,
per 1,000 residents under the age of 75 years in the same time period. The rates were age‐ and sex‐
adjusted to the overall Manitoba population. The Vital Statistics death records were used to count
deaths
Pregnancy Rate
Calculated using data from hospital records by taking the ratio of all live and still births, abortions and
ectopic pregnancies for females ages 15 to 49 to the female population ages 15 to 49.
The denominator was female residents ages 15 to 49 as of June 1st. Rates were age‐ and sex‐ adjusted
to the Manitoba female population ages 15 to 49.
Pregnancy was defined as follows:
A hospitalization for one of the following diagnoses:
o Live birth:
ICD10 ‐ Z37, ICD9 – V27 o Missed Abortion:
ICD10 – O02.1, ICD9 ‐ 632 o Ectopic Pregnancy:
ICD10 – O00, ICD9 – 633

GLOSSARY
99
Manitoba Health, Healthy Living & Seniors
Annual Statistics 2013-2014
o Abortion (spontaneous or medical):
ICD10 � O03, O04, O05, O06, O07 ICD9 � 634, 635, 636, 637
o Intrauterine death: ICD10 � O36.4, ICD9- 656.4
OR �
A Hospitalization with one of the following procedures:
o Surgical Termination of Pregnancy: CCI � 5.CA.89, 5.CA.90, ICD9 - 69.01, 69.51, 74.91 o Surgical Removal of extra-uterine (ectopic) pregnancy:
CCI � 5.CA.93, ICD9 � 66.62, 74
o Pharmacological Termination of Pregnancy:
CCI � 5.CA.88, ICD9 - 75.0
o Interventions during labour and delivery:
CCI � 5.MD.5, 5.MD.60, ICD9�74
Regional Health Authority (RHA)
Manitoba's health care system is a broad network of services and programs. Overseeing this system is Manitoba Health, Seniors and Active Living, a department of the provincial government. For the most part, the actual services are delivered through local regional health authorities - five regional agencies set up by the province to meet the local needs of Manitobans. As of April of 2013, the RHAs were Win-nipeg Health Region, Southern Health/Santé Sud, Interlake-Eastern RHA, Prairie Mountain Health and Northern Health Region. In Manitoba, the regional health authorities are responsible, within the context of broad provincial pol-icy direction, for assessing and prioritizing needs and health goals, and developing and managing an integrated approach to their own health care system.
The Regional Health Authorities Act legislation came into force in 1997. It sets out the conditions under which the RHAs are incorporated, as well as defining duties and responsibilities of the RHAs and the Minister of Health. Both parties are responsible for policy, assessment of health status and ensuring effective health planning and delivery.
Indicators in this report, unless otherwise indicated, are presented by RHA of residence. In other words, indicators reflect where people live, not where they received services.

GLOSSARY
100
Manitoba Health, Healthy Living & Seniors
Annual Statistics 2013-2014
Schizophrenia Prevalence Rate
The proportion of residents age 10 or older diagnosed with schizophrenia, in a five-year period, by any of the following:
one or more hospitalizations with a diagnosis for schizophrenia, ICD-9-CM code 295; ICD-10-CA
codes F20, F21, F23.2, F25
one or more physician visits with a diagnosis for schizophrenia, ICD-9-CM code 295.
The proportion was age- and sex-adjusted to the Manitoba population age 10 or older.
Self-Inflicted Injury Hospitalization Rate
The number of hospital separations of residents age 10 or older for which any self-inflicted injury code was included as one of the diagnoses per 1,000 residents age 10 or older. The denominator was resi-dents age 10 or older as of June 1st. Rates were age- and sex-adjusted to the Manitoba population age 10 or older. Hospitalizations were defined as any inpatient stay with a self-inflicted external cause of injury diagno-sis code, ICD-9-CM codes E950-E959; ICD-10-CA codes X60-X84.
Size for Gestational Age
Size for gestational age is a measure of fetal growth. Birth weight and gestational age were taken from the Vital Statistics birth records . Size for gestational age is classified as follows:
Small-for-Gestational-Age: Infants that are at or below the 10th percentile in birth weight, from an infant population of the same sex and gestational age.
Large-for-Gestational-Age: Infants that are at or above the 90th percentile in birth weight, from an infant population of the same sex and gestational age.
Appropriate-for-Gestational-Age: A birth is considered to be appropriate for gestational age if the birth weight is between the 10th and 90th percentiles for the infant's gestational age and sex.
Stroke Rate
Calculated as the number of hospitalizations or deaths due to stroke in residents age 40 or older per 1,000 residents age 40 or older. The denominator was residents age 40 or older as of June 1st. Rates were age- and sex-adjusted to the Manitoba population age 40 or older. Stroke is defined by ICD-9-CM codes 431, 434, 436 or ICD-10-CA codes I61, I63, I64 in the most responsible diagnosis field for hospi-talization or as the cause of death in Vital Statistics death files. This definition will not capture minor strokes which did not result in hospitalization or death.

GLOSSARY
101
Manitoba Health, Healthy Living & Seniors
Annual Statistics 2013-2014
Substance Abuse Prevalence Rate
The proportion of residents age 10 or older diagnosed with substance abuse in a five-year period, by any of the following:
one or more hospitalizations with a diagnosis for alcoholic or drug psychoses, alcohol or drug de-
pendence or nondependent abuse of drugs, ICD-9-CM code 291, 292, 303, 304, 305; ICD-10-CA
codes F10-F19, F55
one or more physician visits with a diagnosis for alcoholic or drug psychoses, alcohol or drug de-
pendence or nondependent abuse of drugs, ICD-9-CM code 291, 292, 303, 304, 305.
The proportion was age- and sex-adjusted to the Manitoba population age 10 or older.
Suicide Rate
The number of deaths due to suicide among residents age 10 or older, in a five-year period, per 1,000 residents. The denominator was residents age 10 or older per year. Rates were age- and sex-adjusted to the Manitoba population age 10 or older. Suicides were defined as any death record in Vital Statis-tics data with any of the following causes:
accidental poisoning, ICD-9-CM codes E850-E854, E858, E862, E868; ICD-10-CA codes X40-X42,
X46, X47
poisoning with undetermined intent, ICD-10-CA codes Y10-Y12, Y16, Y17
self-inflicted poisoning, ICD-9-CM codes E950-E952; ICD-10-CA codes X60-X69
self-inflicted injury by hanging, strangulation and suffocation, ICD-9-CM code E953; ICD-10-CA
code X70
self-inflicted injury by drowning, ICD-9-CM code E954; ICD-10-CA code X71
self-inflicted injury by firearms and explosives, ICD-9-CM code E955; ICD-10-CA codes X72-X75
self-inflicted injury by smoke, fire, flames, steam, hot vapours and hot objects, ICD-9-CM codes
E958.1, E958.2; ICD-10-CA codes X76, X77
self-inflicted injury by cutting or piercing instruments, ICD-9-CM code E956; ICD-10-CA codes X78,
X79
self-inflicted injury by jumping from high places, ICD-9-CM code E957; ICD-10-CA code X80
self-inflicted injury by jumping or lying before a moving object, ICD-9-CM code E958.0; ICD-10-CA
code X81
self-inflicted injury by crashing a motor vehicle, ICD-9-CM code E958.5; ICD-10-CA code X82

GLOSSARY
102
Manitoba Health, Healthy Living & Seniors
Annual Statistics 2013-2014
self-inflicted injury by other and unspecified means, ICD-9-CM codes E958.3, E958.4, E958.6-
E958.9; ICD-10-CA codes X83, X84
late effects of self-inflicted injury, ICD-9-CM code E959
Vaginal Birth After Caesarean Section Rate
The proportion of female residents ages 15 to 54 giving birth vaginally, in a five-year period, who had previously had at least one delivery by caesarean section. The denominator was female residents ages 15 to 54 delivering in the same time period who had at least one previous caesarean section delivery. A woman is determined to have experienced a delivery after C-section if each of the following criteria is met using hospital abstract data:
1. Presence of a uterine scar from previous surgery (ICD-9-CM diagnosis code of 654.2 or ICD-10 code of O34.201, O34.203, O34.209, O34.291, O34.293, O34,299 or O75.701, O75.703, O75.709)
2. Any single ICD-9-CM or ICD-10 diagnoses code indicating a delivery.
ICD-9-CM V27.0, V27.2, V27.3, V27.5, or V27.6, in any position
ICD-10 -CA O1, O2, O4, O6, O7, O8, O9, O30-O35, O37, O36.0, O36.1, O36.2, O36.3, O36.5, O36.6, O36.7, O36.8, O36.9 and with a sixth digit of �1' or �2'; Z37.0, Z37.2, Z37.3, Z37.5, or Z37.6, in any position
To obtain the numerator, all women who had caesarean section deliveries in the current fiscal year are removed from the denominator pool. Caesarean section deliveries are identified by ICD-9-CM proce-dure codes 74.0, 74.1, 74.2, 74.4, or 74.99 or CCI procedure code 5.MD.60 in any position. The percent is age-adjusted to the Manitoba female population ages 15 to 54. Vital Statistics Database
Birth Database:
The central Vital Statistics Registry in each province and territory provides data from birth registrations to Statistics Canada. The following data items are reported for each birth by all provinces and territo-ries for inclusion in the Canadian Vital Statistics system:
Date and place of birth
Child�s sex, birth weight and gestational age
Parent�s age, marital status and birthplace
Mother�s place of residence
Type of birth (single or multiple)

GLOSSARY
103
Manitoba Health, Healthy Living & Seniors
Annual Statistics 2013-2014
Death Database:
The central Vital Statistics Registry in each province and territory provides data from death certificates to Statistics Canada. The following data items are reported for each death by all provinces and territo-ries for inclusion in the Canadian Vital Statistics system:
Age, sex, marital status, place of residence and birth place of the deceased
Date of death
Underlying cause of death classified to the �World Health Organization International Classifica- tion of Disease and Related Health Problems� (ICD)
Province or territory of occurrence of death
Place of accident
Autopsy information