Embed Size (px)
Citation preview
1 M N S 1 1 5 E A S T 2 3 R D S T R E E T , N E W Y O R K , N Y 1 0 0 1 0 2 1 2 . 4 7 5 . 9 0 0 0 I N F O @ M N S . C O M M N S . C O M
TM
M A N H AT TA N N E W D E V E L O P M E N T R E P O R T
2 0 1 2 S E C O N D Q U A R T E R
m a n h a t t a n n e w d e v e l o p m e n t R e p o R t 2 q 1 2
2 M N S 1 1 5 E A S T 2 3 R D S T R E E T , N E W Y O R K , N Y 1 0 0 1 0 2 1 2 . 4 7 5 . 9 0 0 0 I N F O @ M N S . C O M M N S . C O M
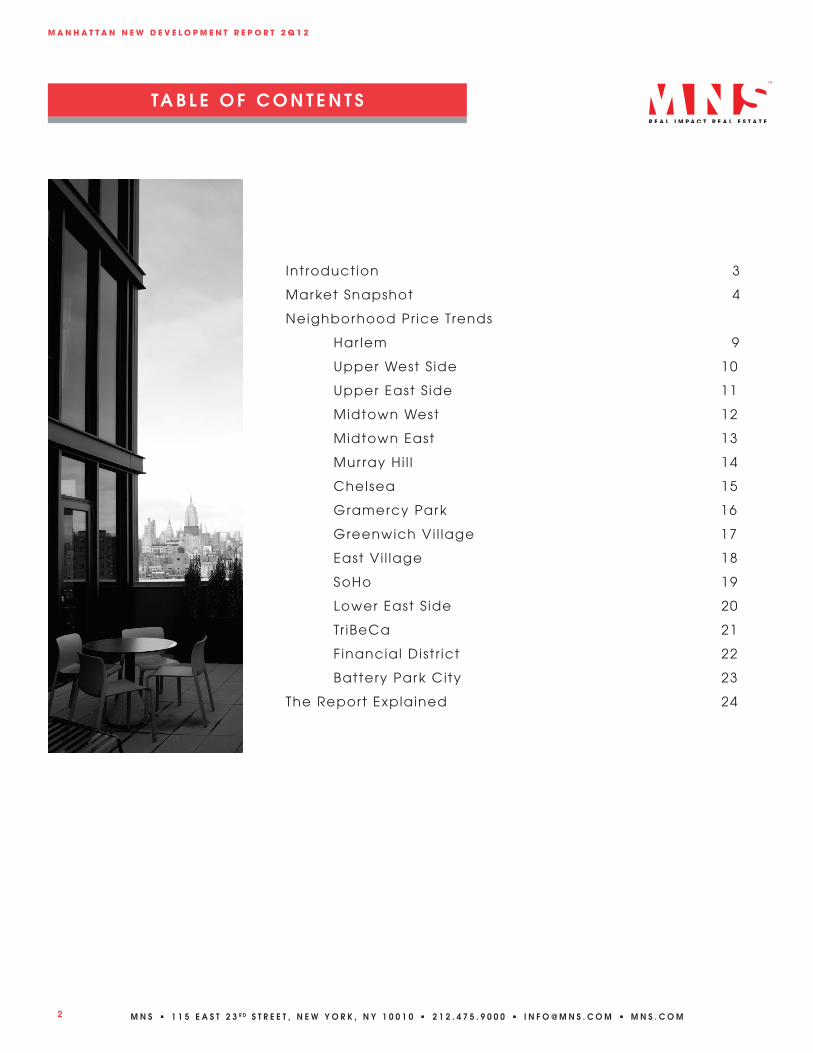
TA B L E O F C O N T E N T S
Introduction 3
Market Snapshot 4
Neighborhood Pr ice Trends
Har lem 9
Upper West S ide 10
Upper East S ide 11
Midtown West 12
Midtown East 13
Mur ray Hi l l 14
Chelsea 15
Gramercy Park 16
Greenwich Vi l lage 17
East Vi l lage 18
SoHo 19
Lower East S ide 20
Tr iBeCa 21
Financial Dist r ict 22
Battery Park City 23
The Report Explained 24
m a n h a t t a n n e w d e v e l o p m e n t R e p o R t 2 q 1 2
3 M N S 1 1 5 E A S T 2 3 R D S T R E E T , N E W Y O R K , N Y 1 0 0 1 0 2 1 2 . 4 7 5 . 9 0 0 0 I N F O @ M N S . C O M M N S . C O M
I N T R O D U C T I O N
MNS is proud to present the Second Quarter 2012 edition of our New Development Market Report. New Development
Sales data, defined as such “Arms-Length” first offering transactions where the seller is considered a “Sponsor”, was
compiled from the Automated City Register Information System (ACRIS) for sponsor sales that traded during the
Second Quarter of 2012 (04/01/12 – 06/30/11). All data summarized is on a median basis.
m a n h a t t a n n e w d e v e l o p m e n t R e p o R t 2 q 1 2
4 M N S 1 1 5 E A S T 2 3 R D S T R E E T , N E W Y O R K , N Y 1 0 0 1 0 2 1 2 . 4 7 5 . 9 0 0 0 I N F O @ M N S . C O M M N S . C O M
M A R K E T S N A P S H O T
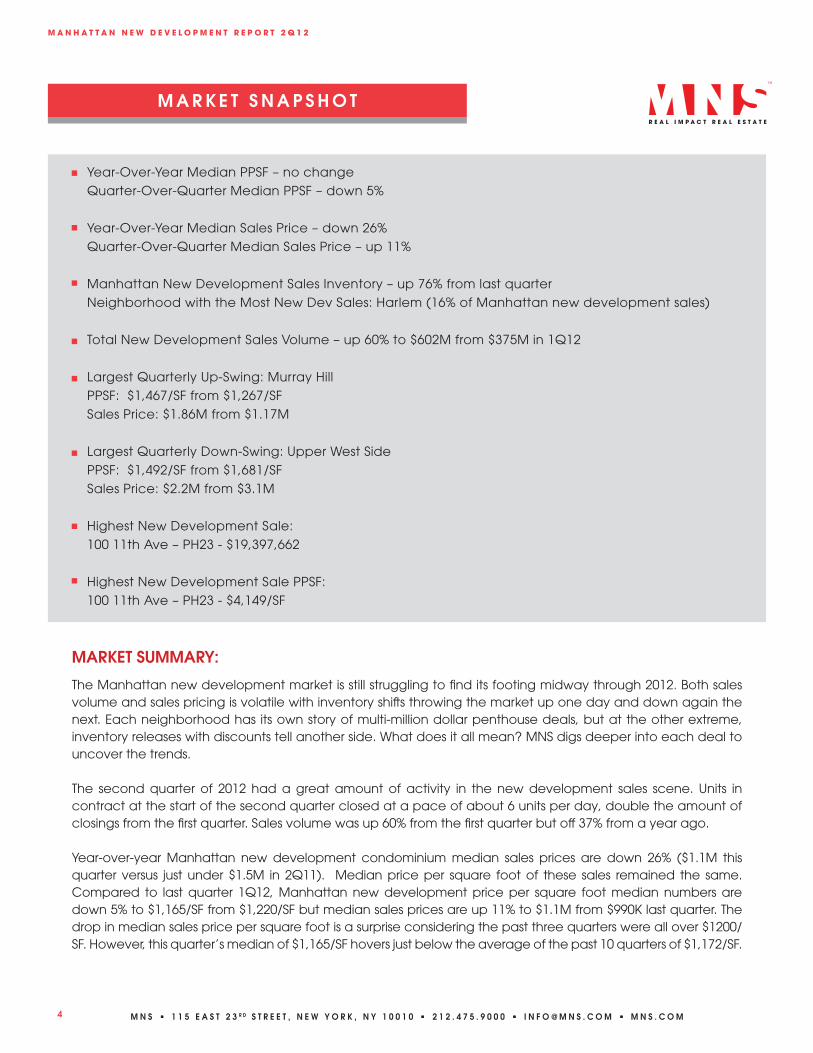
Year-Over-Year Median PPSF – no change Quarter-Over-Quarter Median PPSF – down 5%
Year-Over-Year Median Sales Price – down 26% Quarter-Over-Quarter Median Sales Price – up 11%
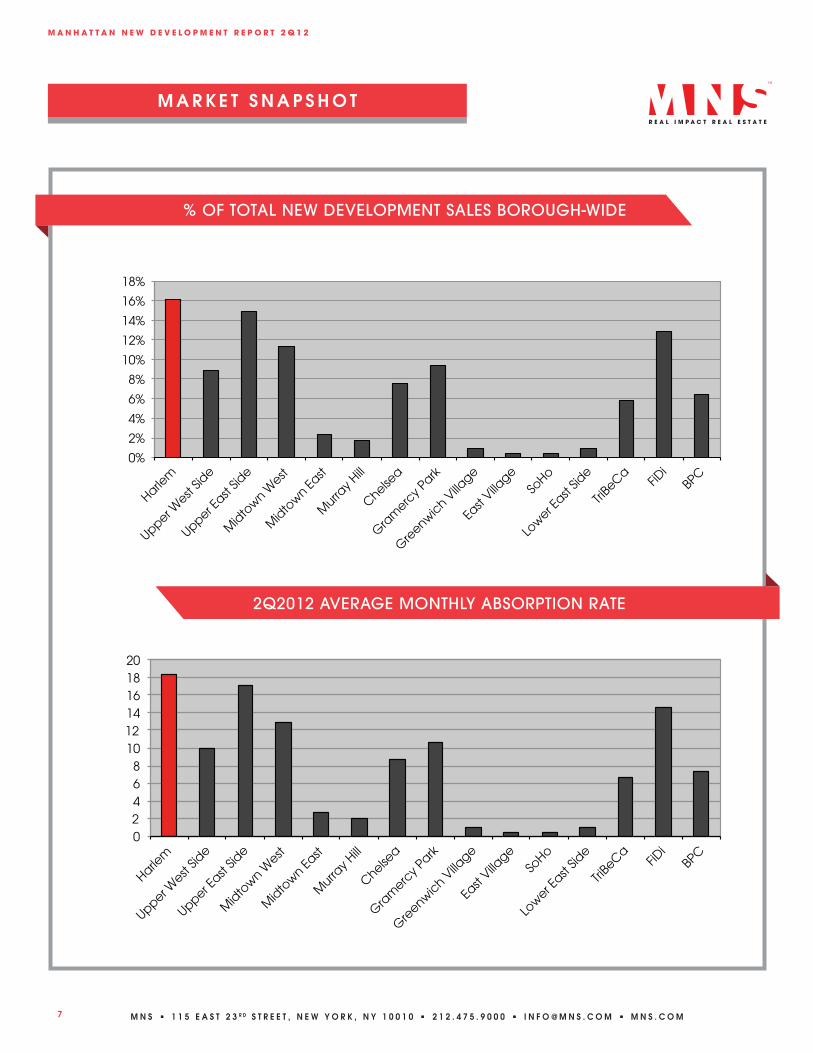
Manhattan New Development Sales Inventory – up 76% from last quarter Neighborhood with the Most New Dev Sales: Harlem (16% of Manhattan new development sales)
Total New Development Sales Volume – up 60% to $602M from $375M in 1Q12
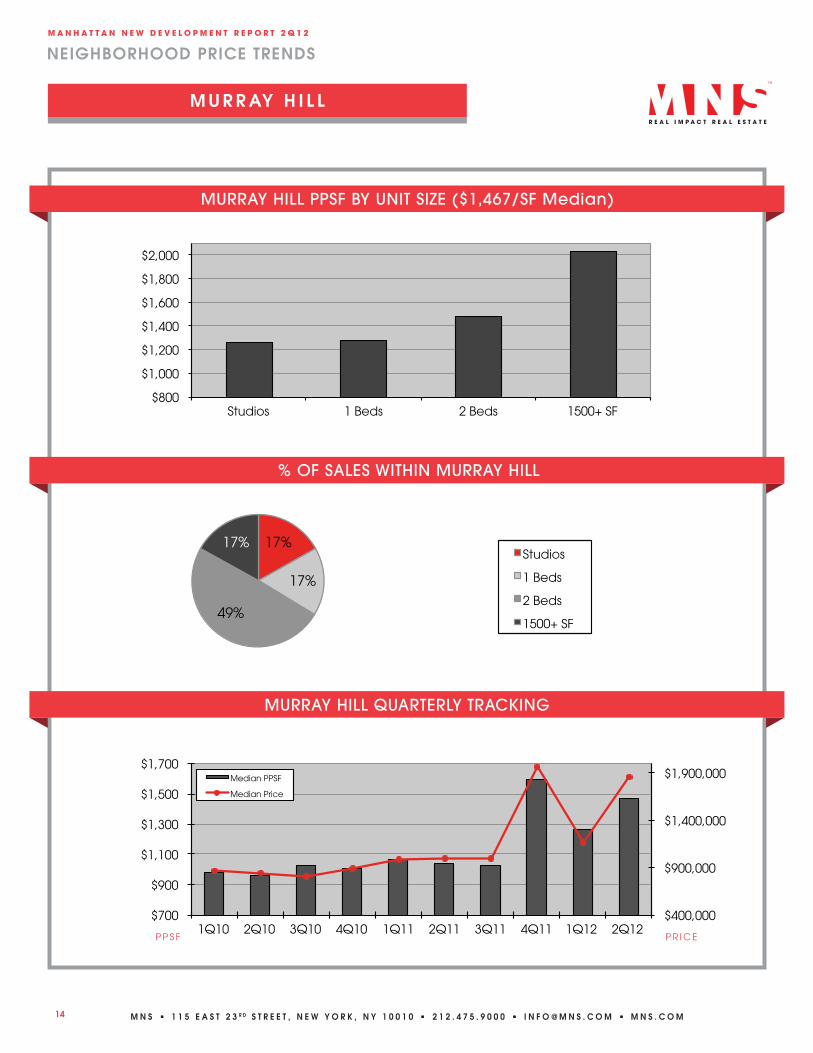
Largest Quarterly Up-Swing: Murray Hill PPSF: $1,467/SF from $1,267/SF Sales Price: $1.86M from $1.17M
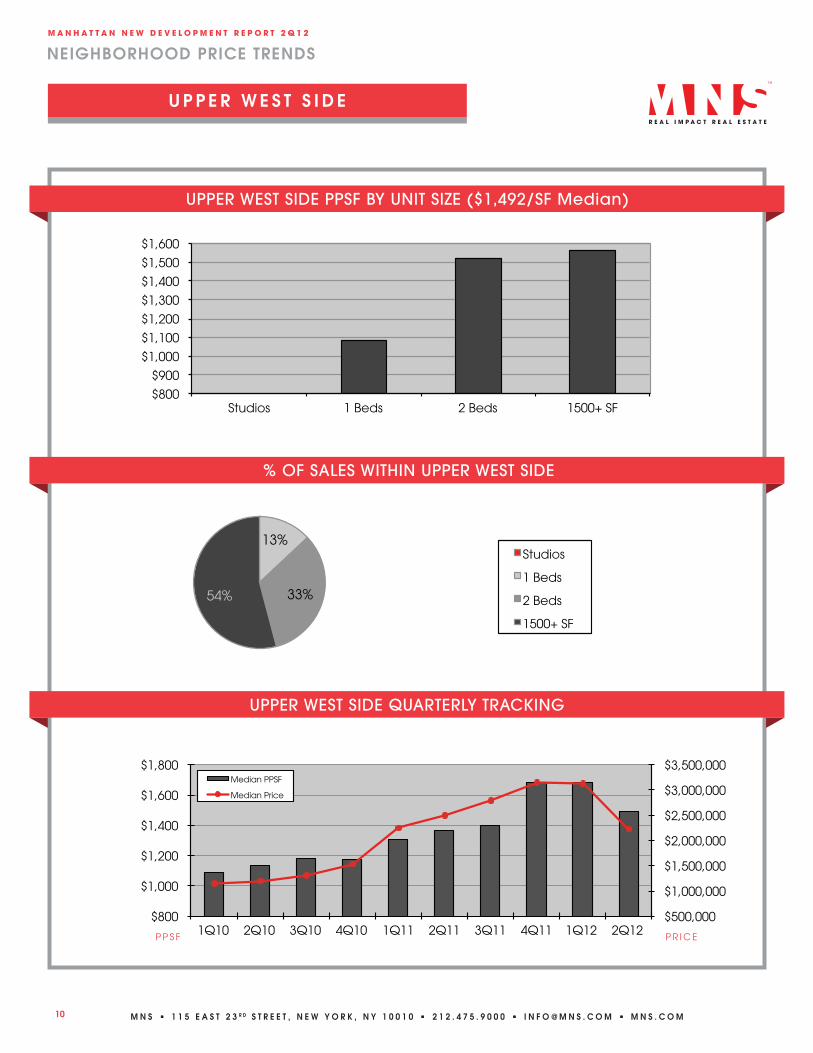
Largest Quarterly Down-Swing: Upper West Side PPSF: $1,492/SF from $1,681/SF Sales Price: $2.2M from $3.1M
Highest New Development Sale: 100 11th Ave – PH23 - $19,397,662
Highest New Development Sale PPSF: 100 11th Ave – PH23 - $4,149/SF
MARKET SUMMARY:
The Manhattan new development market is still struggling to find its footing midway through 2012. Both sales volume and sales pricing is volatile with inventory shifts throwing the market up one day and down again the next. Each neighborhood has its own story of multi-million dollar penthouse deals, but at the other extreme, inventory releases with discounts tell another side. What does it all mean? MNS digs deeper into each deal to uncover the trends.
The second quarter of 2012 had a great amount of activity in the new development sales scene. Units in contract at the start of the second quarter closed at a pace of about 6 units per day, double the amount of closings from the first quarter. Sales volume was up 60% from the first quarter but off 37% from a year ago.
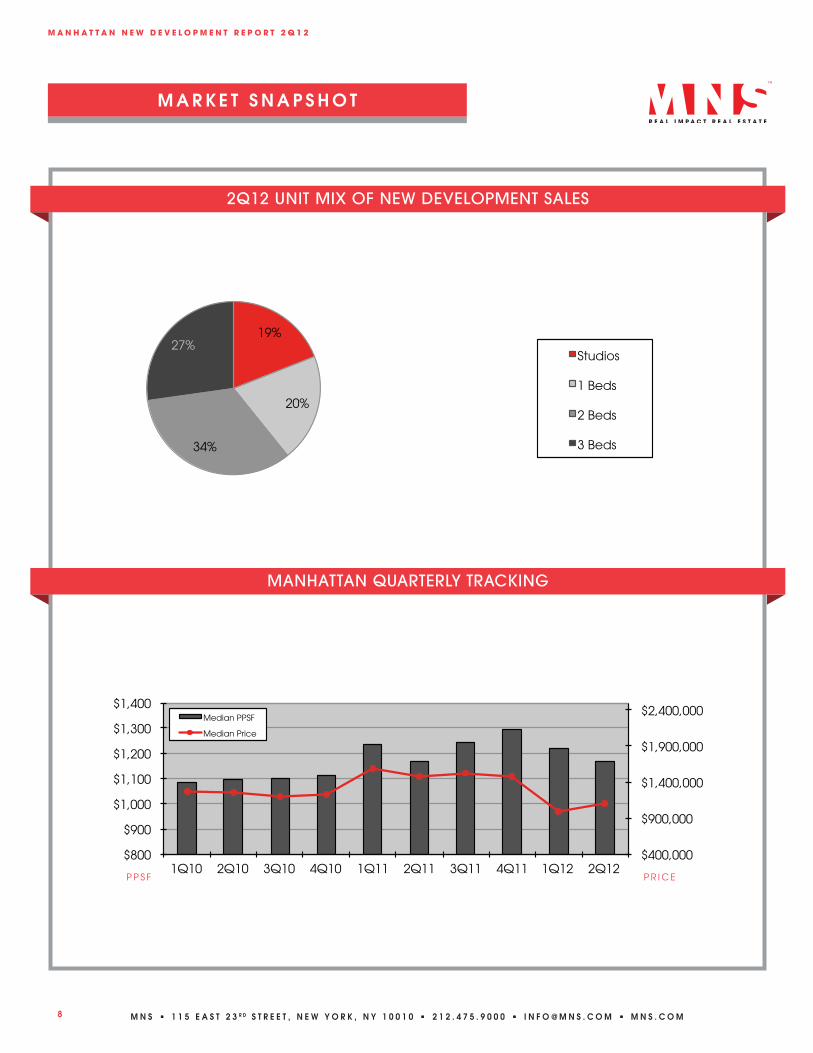
Year-over-year Manhattan new development condominium median sales prices are down 26% ($1.1M this quarter versus just under $1.5M in 2Q11). Median price per square foot of these sales remained the same. Compared to last quarter 1Q12, Manhattan new development price per square foot median numbers are down 5% to $1,165/SF from $1,220/SF but median sales prices are up 11% to $1.1M from $990K last quarter. The drop in median sales price per square foot is a surprise considering the past three quarters were all over $1200/SF. However, this quarter’s median of $1,165/SF hovers just below the average of the past 10 quarters of $1,172/SF.
m a n h a t t a n n e w d e v e l o p m e n t R e p o R t 2 q 1 2
5 M N S 1 1 5 E A S T 2 3 R D S T R E E T , N E W Y O R K , N Y 1 0 0 1 0 2 1 2 . 4 7 5 . 9 0 0 0 I N F O @ M N S . C O M M N S . C O M
M A R K E T S N A P S H O T
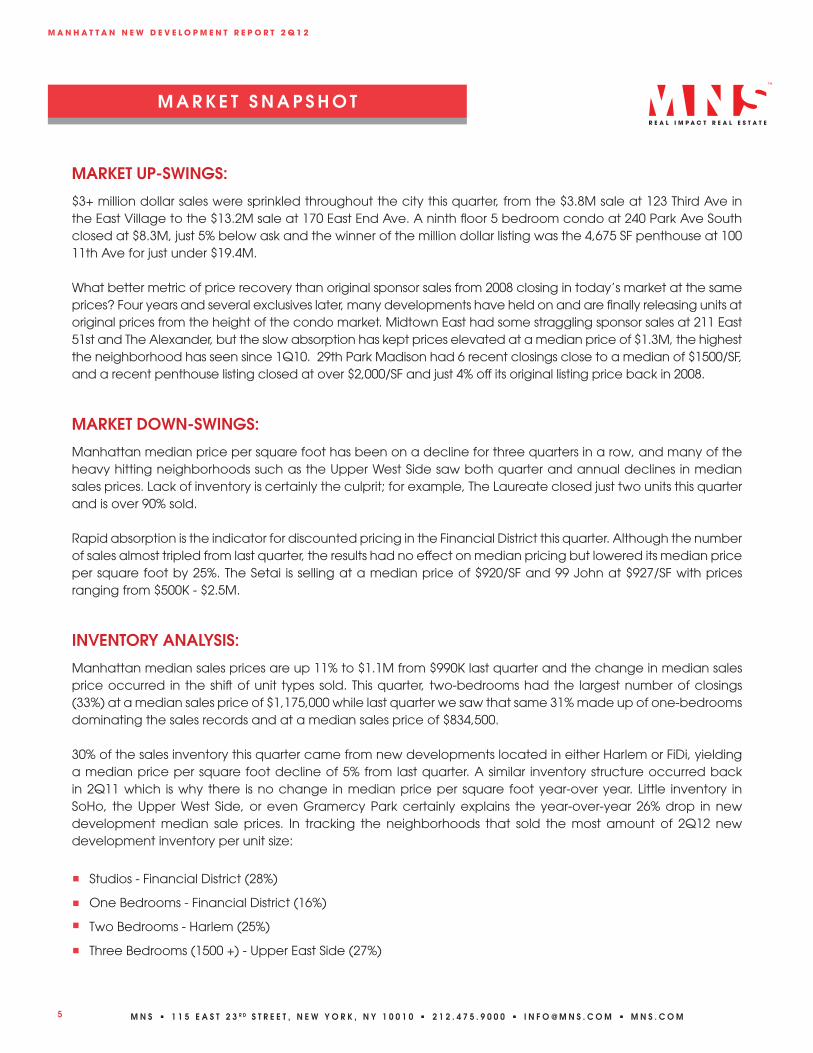
MARKET UP-SWINGS:
$3+ million dollar sales were sprinkled throughout the city this quarter, from the $3.8M sale at 123 Third Ave in the East Village to the $13.2M sale at 170 East End Ave. A ninth floor 5 bedroom condo at 240 Park Ave South closed at $8.3M, just 5% below ask and the winner of the million dollar listing was the 4,675 SF penthouse at 100 11th Ave for just under $19.4M.
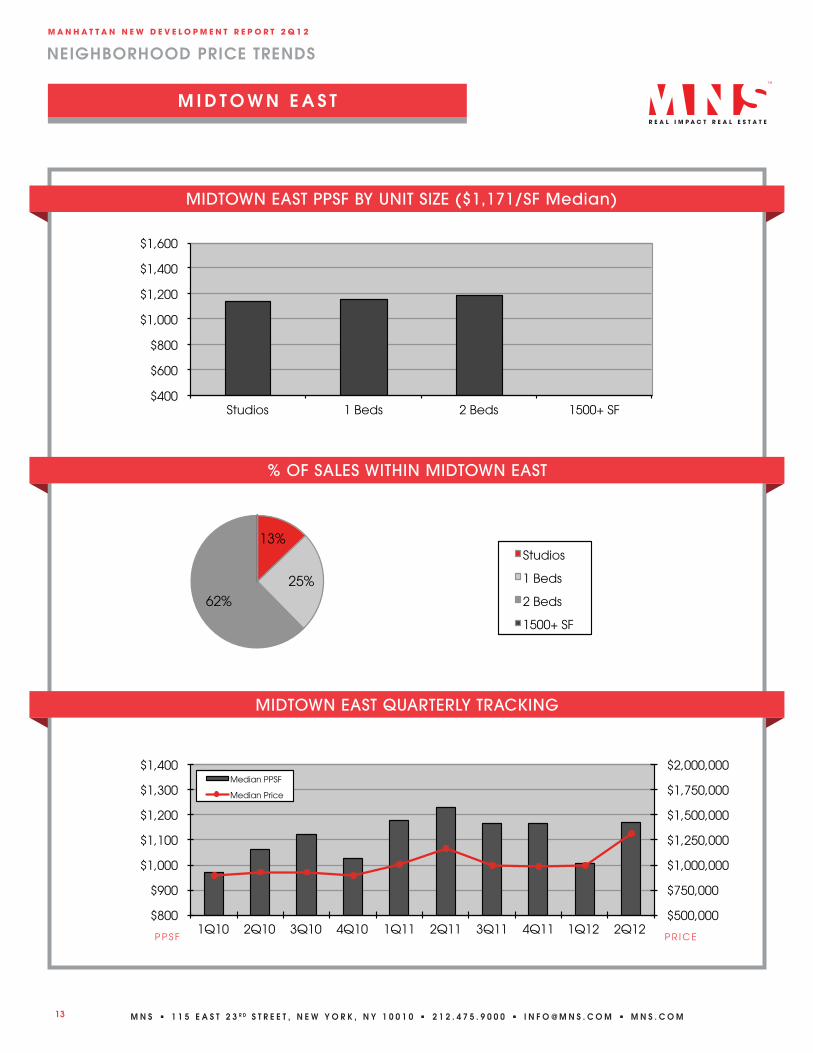
What better metric of price recovery than original sponsor sales from 2008 closing in today’s market at the same prices? Four years and several exclusives later, many developments have held on and are finally releasing units at original prices from the height of the condo market. Midtown East had some straggling sponsor sales at 211 East 51st and The Alexander, but the slow absorption has kept prices elevated at a median price of $1.3M, the highest the neighborhood has seen since 1Q10. 29th Park Madison had 6 recent closings close to a median of $1500/SF, and a recent penthouse listing closed at over $2,000/SF and just 4% off its original listing price back in 2008.
MARKET DOWN-SWINGS:
Manhattan median price per square foot has been on a decline for three quarters in a row, and many of the heavy hitting neighborhoods such as the Upper West Side saw both quarter and annual declines in median sales prices. Lack of inventory is certainly the culprit; for example, The Laureate closed just two units this quarter and is over 90% sold.
Rapid absorption is the indicator for discounted pricing in the Financial District this quarter. Although the number of sales almost tripled from last quarter, the results had no effect on median pricing but lowered its median price per square foot by 25%. The Setai is selling at a median price of $920/SF and 99 John at $927/SF with prices ranging from $500K - $2.5M.
INVENTORY ANALYSIS:
Manhattan median sales prices are up 11% to $1.1M from $990K last quarter and the change in median sales price occurred in the shift of unit types sold. This quarter, two-bedrooms had the largest number of closings (33%) at a median sales price of $1,175,000 while last quarter we saw that same 31% made up of one-bedrooms dominating the sales records and at a median sales price of $834,500.
30% of the sales inventory this quarter came from new developments located in either Harlem or FiDi, yielding a median price per square foot decline of 5% from last quarter. A similar inventory structure occurred back in 2Q11 which is why there is no change in median price per square foot year-over year. Little inventory in SoHo, the Upper West Side, or even Gramercy Park certainly explains the year-over-year 26% drop in new development median sale prices. In tracking the neighborhoods that sold the most amount of 2Q12 new development inventory per unit size:
Studios - Financial District (28%)
One Bedrooms - Financial District (16%)
Two Bedrooms - Harlem (25%)
Three Bedrooms (1500 +) - Upper East Side (27%)
m a n h a t t a n n e w d e v e l o p m e n t R e p o R t 2 q 1 2
6 M N S 1 1 5 E A S T 2 3 R D S T R E E T , N E W Y O R K , N Y 1 0 0 1 0 2 1 2 . 4 7 5 . 9 0 0 0 I N F O @ M N S . C O M M N S . C O M
M A R K E T S N A P S H O T
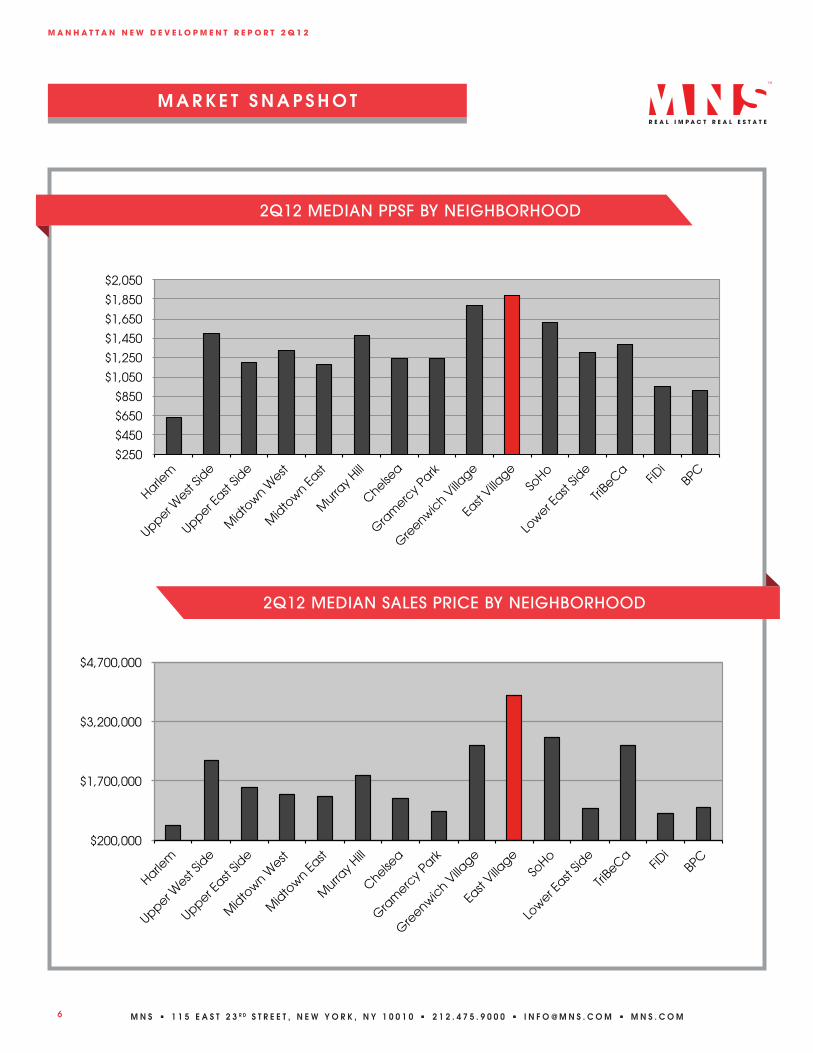
2Q12 MEDIAN SALES PRICE BY NEIGHBORHOOD
2Q12 MEDIAN PPSF BY NEIGHBORHOOD
$250
$450
$650
$850
$1,050
$1,250
$1,450
$1,650
$1,850
$2,050
Harlem
Upper West
Side
Upper East
Side
Mid
town W
est
Mid
town Ea
st
Murra
y Hill
Chelsea
Gra
merc
y Park
Gre
enwich Villa
ge
East
Village
SoHo
Lower E
ast Sid
e
TriBe
Ca FiD
i BP
C
2Q12 Median PPSF by Neighborhood
$200,000
$1,700,000
$3,200,000
$4,700,000
Harlem
Upper West
Side
Upper East
Side
Mid
town W
est
Mid
town Ea
st
Murra
y Hill
Chelsea
Gra
merc
y Park
Gre
enwich Villa
ge
East
Village
SoHo
Lower E
ast Sid
e
TriBe
Ca FiD
i BP
C
2Q12 Median Sales Price by Neighborhood
m a n h a t t a n n e w d e v e l o p m e n t R e p o R t 2 q 1 2
7 M N S 1 1 5 E A S T 2 3 R D S T R E E T , N E W Y O R K , N Y 1 0 0 1 0 2 1 2 . 4 7 5 . 9 0 0 0 I N F O @ M N S . C O M M N S . C O M
M A R K E T S N A P S H O T
% OF TOTAL NEW DEVELOPMENT SALES BOROUGH-WIDE
2Q2012 AVERAGE MONTHLY ABSORPTION RATE
0%
2%
4%
6%
8%
10%
12%
14%
16%
18%
Harlem
Upper West
Side
Upper East
Side
Mid
town W
est
Mid
town Ea
st
Murra
y Hill
Chelsea
Gra
merc
y Park
Gre
enwich Villa
ge
East
Village
SoHo
Lower E
ast Sid
e
TriBe
Ca FiD
i BP
C
% of total sponsor sales - borough-wide
0 2 4 6 8
10 12 14 16 18 20
Harlem
Upper West
Side
Upper East
Side
Mid
town W
est
Mid
town Ea
st
Murra
y Hill
Chelsea
Gra
merc
y Park
Gre
enwich Villa
ge
East
Village
SoHo
Lower E
ast Sid
e
TriBe
Ca FiD
i BP
C
Avg Monthly Absorption Rate
m a n h a t t a n n e w d e v e l o p m e n t R e p o R t 2 q 1 2
8 M N S 1 1 5 E A S T 2 3 R D S T R E E T , N E W Y O R K , N Y 1 0 0 1 0 2 1 2 . 4 7 5 . 9 0 0 0 I N F O @ M N S . C O M M N S . C O M
$400,000
$900,000
$1,400,000
$1,900,000
$2,400,000
$800
$900
$1,000
$1,100
$1,200
$1,300
$1,400
1Q10 2Q10 3Q10 4Q10 1Q11 2Q11 3Q11 4Q11 1Q12 2Q12
All Manhattan
Median PPSF
Median Price
M A R K E T S N A P S H O T
3Q11 UNIT MIX OF NEW DEVELOPMENT SALES
MANHATTAN QUARTERLY TRACKING
P R I C EP P S F
2Q12 UNIT MIX OF NEW DEVELOPMENT SALES
MANHATTAN QUARTERLY TRACKING
17%
20%
32%
31%
4Q11 Unit Mix of New Development Sales
Studios
1 Beds
2 Beds
3 Beds
19%
20%
34%
27%
2Q12 Unit Mix of New Development Sales
studios
one bedrooms
two bedrooms
three bedrooms
NEIGHBORHOOD PRICE TRENDS
9
m a n h a t t a n n e w d e v e l o p m e n t R e p o R t 2 q 1 2
13%
13%
37%
37%
% of Sales within BPC
Studios
1 Beds
2 Beds
1500+ SF
M N S 1 1 5 E A S T 2 3 R D S T R E E T , N E W Y O R K , N Y 1 0 0 1 0 2 1 2 . 4 7 5 . 9 0 0 0 I N F O @ M N S . C O M M N S . C O M
$400,000
$450,000
$500,000
$550,000
$600,000
$650,000
$700,000
$300
$400
$500
$600
$700
$800
1Q10 2Q10 3Q10 4Q10 1Q11 2Q11 3Q11 4Q11 1Q12 2Q12
Harlem
Median PPSF
Median Price
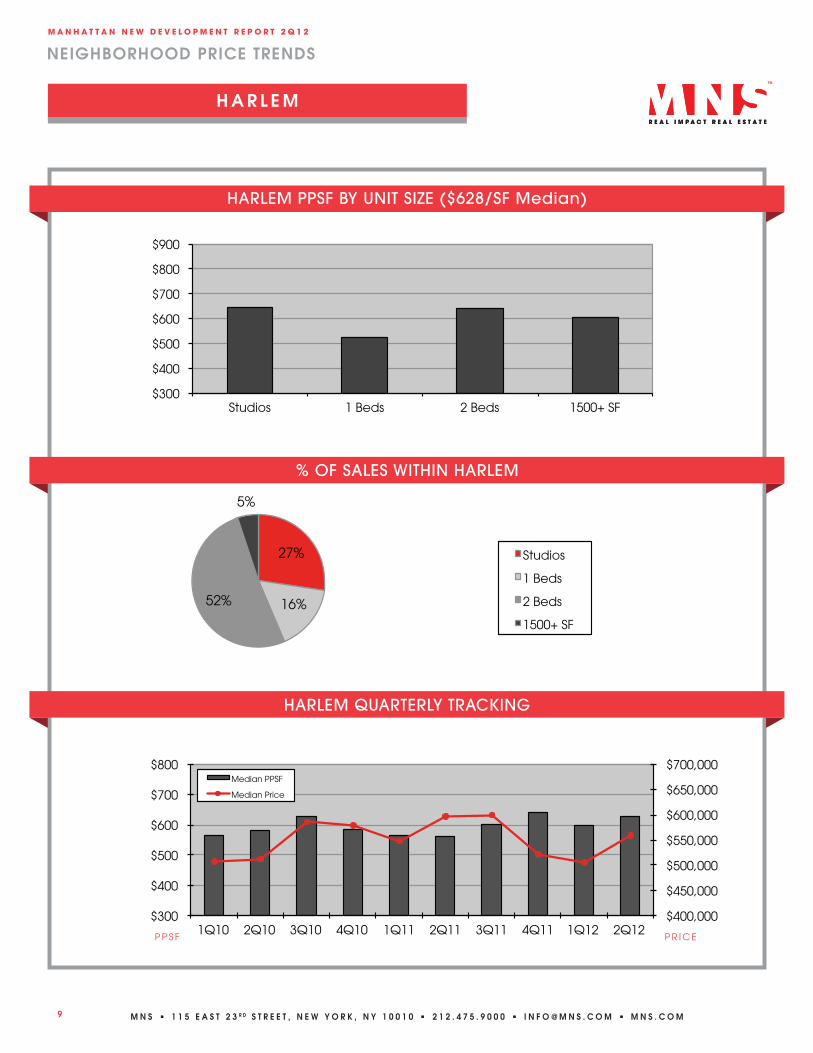
HARLEM QUARTERLY TRACKING
H A R L E M
% OF SALES WITHIN HARLEM
HARLEM PPSF BY UNIT SIZE ($628/SF Median)
P P S F P R I C E
$300
$400
$500
$600
$700
$800
$900
Studios 1 Beds 2 Beds 1500+ SF
Harlem PPSF By Unit Size ($628/SF Median)
27%
16% 52%
5%
% of Sales within Harlem
Studios
1 Beds
2 Beds
1500+ SF
NEIGHBORHOOD PRICE TRENDS
10
m a n h a t t a n n e w d e v e l o p m e n t R e p o R t 2 q 1 2
13%
13%
37%
37%
% of Sales within BPC
Studios
1 Beds
2 Beds
1500+ SF
M N S 1 1 5 E A S T 2 3 R D S T R E E T , N E W Y O R K , N Y 1 0 0 1 0 2 1 2 . 4 7 5 . 9 0 0 0 I N F O @ M N S . C O M M N S . C O M
$500,000
$1,000,000
$1,500,000
$2,000,000
$2,500,000
$3,000,000
$3,500,000
$800
$1,000
$1,200
$1,400
$1,600
$1,800
1Q10 2Q10 3Q10 4Q10 1Q11 2Q11 3Q11 4Q11 1Q12 2Q12
Upper West Side
Median PPSF
Median Price
UPPER WEST SIDE QUARTERLY TRACKING
U P P E R W E S T S I D E
% OF SALES WITHIN UPPER WEST SIDE
UPPER WEST SIDE PPSF BY UNIT SIZE ($1,492/SF Median)
P P S F P R I C E
$800 $900
$1,000 $1,100 $1,200 $1,300 $1,400 $1,500 $1,600
Studios 1 Beds 2 Beds 1500+ SF
UWS PPSF by Unit Size ($1,492/SF Median)
0%
13%
33% 54%
% of Sales within UWS
Studios
1 Beds
2 Beds
1500+ SF
NEIGHBORHOOD PRICE TRENDS
11
m a n h a t t a n n e w d e v e l o p m e n t R e p o R t 2 q 1 2
13%
13%
37%
37%
% of Sales within BPC
Studios
1 Beds
2 Beds
1500+ SF
M N S 1 1 5 E A S T 2 3 R D S T R E E T , N E W Y O R K , N Y 1 0 0 1 0 2 1 2 . 4 7 5 . 9 0 0 0 I N F O @ M N S . C O M M N S . C O M
$500,000
$1,000,000
$1,500,000
$2,000,000
$2,500,000
$3,000,000
$900
$1,000
$1,100
$1,200
$1,300
$1,400
$1,500
1Q10 2Q10 3Q10 4Q10 1Q11 2Q11 3Q11 4Q11 1Q12 2Q12
Upper East Side
Median PPSF
Median Price
UPPER EAST SIDE QUARTERLY TRACKING
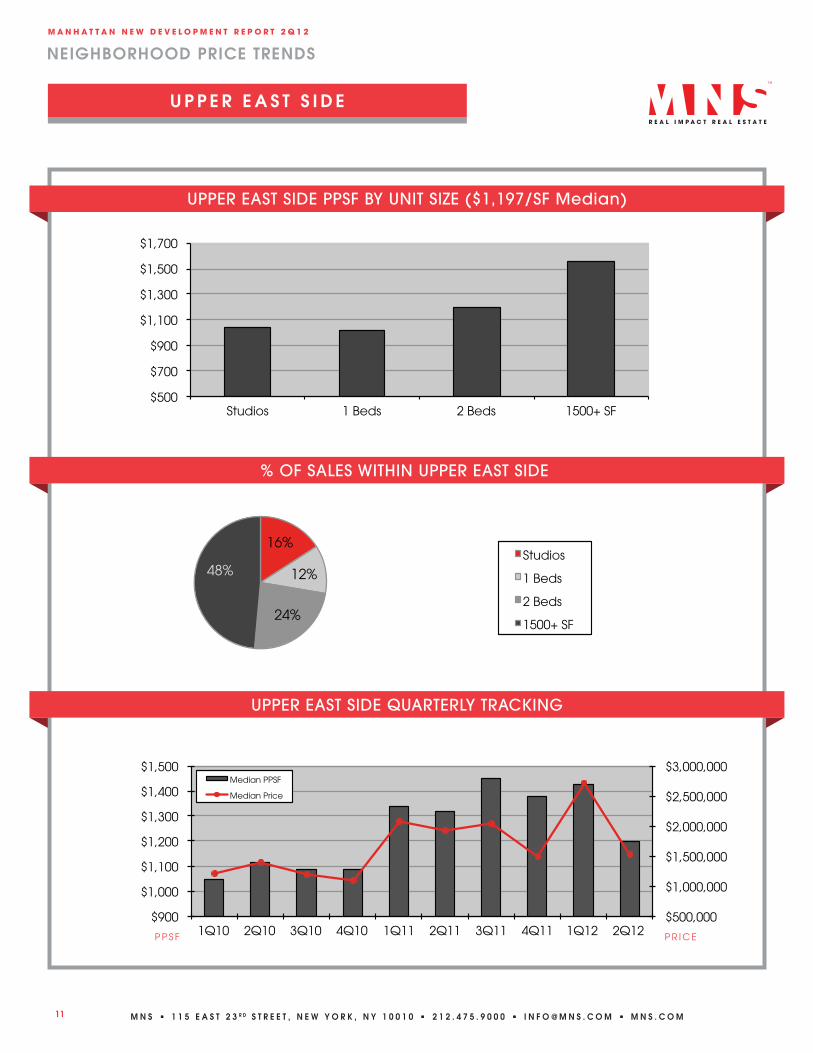
% OF SALES WITHIN UPPER EAST SIDE
U P P E R E A S T S I D E
UPPER EAST SIDE PPSF BY UNIT SIZE ($1,197/SF Median)
P P S F P R I C E
$500
$700
$900
$1,100
$1,300
$1,500
$1,700
Studios 1 Beds 2 Beds 1500+ SF
UES PPSF by Unit Size ($1,197/SF Median)
16%
12%
24%
48%
% of Sales within UES
Studios
1 Beds
2 Beds
1500+ SF
NEIGHBORHOOD PRICE TRENDS
12
m a n h a t t a n n e w d e v e l o p m e n t R e p o R t 2 q 1 2
13%
13%
37%
37%
% of Sales within BPC
Studios
1 Beds
2 Beds
1500+ SF
M N S 1 1 5 E A S T 2 3 R D S T R E E T , N E W Y O R K , N Y 1 0 0 1 0 2 1 2 . 4 7 5 . 9 0 0 0 I N F O @ M N S . C O M M N S . C O M
$800,000
$1,050,000
$1,300,000
$1,550,000
$1,800,000
$2,050,000
$2,300,000
$700
$900
$1,100
$1,300
$1,500
$1,700
1Q10 2Q10 3Q10 4Q10 1Q11 2Q11 3Q11 4Q11 1Q12 2Q12
Midtown West
Median PPSF
Median Price
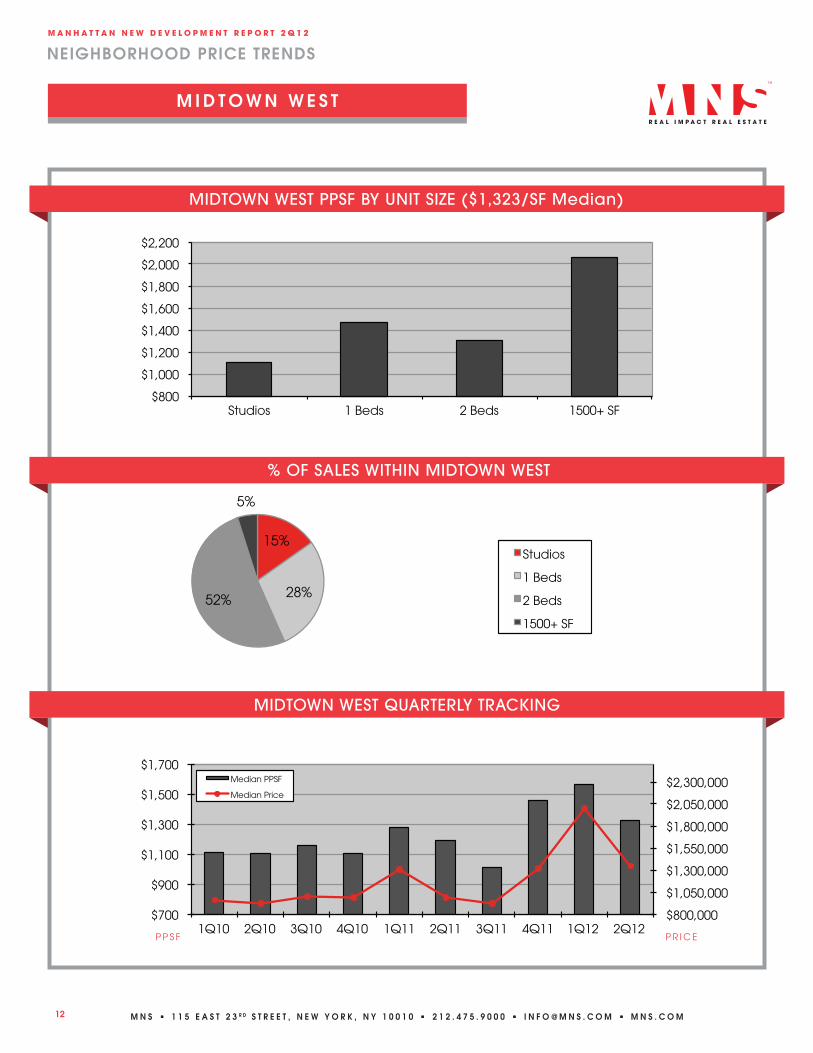
% OF SALES WITHIN MIDTOWN WEST
M I D T O W N W E S T
P P S F P R I C E
MIDTOWN WEST PPSF BY UNIT SIZE ($1,323/SF Median)
MIDTOWN WEST QUARTERLY TRACKING
$800
$1,000
$1,200
$1,400
$1,600
$1,800
$2,000
$2,200
Studios 1 Beds 2 Beds 1500+ SF
Midtown West PPSF by Unit Size ($1,323/SF Median)
15%
28% 52%
5%
% of Sales within Midtown West
Studios
1 Beds
2 Beds
1500+ SF
NEIGHBORHOOD PRICE TRENDS
13
m a n h a t t a n n e w d e v e l o p m e n t R e p o R t 2 q 1 2
13%
13%
37%
37%
% of Sales within BPC
Studios
1 Beds
2 Beds
1500+ SF
M N S 1 1 5 E A S T 2 3 R D S T R E E T , N E W Y O R K , N Y 1 0 0 1 0 2 1 2 . 4 7 5 . 9 0 0 0 I N F O @ M N S . C O M M N S . C O M
$500,000
$750,000
$1,000,000
$1,250,000
$1,500,000
$1,750,000
$2,000,000
$800
$900
$1,000
$1,100
$1,200
$1,300
$1,400
1Q10 2Q10 3Q10 4Q10 1Q11 2Q11 3Q11 4Q11 1Q12 2Q12
Midtown East
Median PPSF
Median Price
MIDTOWN EAST QUARTERLY TRACKING
M I D T O W N E A S T
% OF SALES WITHIN MIDTOWN EAST
MIDTOWN EAST PPSF BY UNIT SIZE ($1,171/SF Median)
P P S F P R I C E
$400
$600
$800
$1,000
$1,200
$1,400
$1,600
Studios 1 Beds 2 Beds 1500+ SF
Midtown East PPSF by Unit Size ($1,171/SF Median)
13%
25% 62%
0%
% of Sales within Midtown East
Studios
1 Beds
2 Beds
1500+ SF
NEIGHBORHOOD PRICE TRENDS
14
m a n h a t t a n n e w d e v e l o p m e n t R e p o R t 2 q 1 2
13%
13%
37%
37%
% of Sales within BPC
Studios
1 Beds
2 Beds
1500+ SF
M N S 1 1 5 E A S T 2 3 R D S T R E E T , N E W Y O R K , N Y 1 0 0 1 0 2 1 2 . 4 7 5 . 9 0 0 0 I N F O @ M N S . C O M M N S . C O M
$400,000
$900,000
$1,400,000
$1,900,000
$700
$900
$1,100
$1,300
$1,500
$1,700
1Q10 2Q10 3Q10 4Q10 1Q11 2Q11 3Q11 4Q11 1Q12 2Q12
Murray Hill
Median PPSF
Median Price
MURRAY HILL QUARTERLY TRACKING
% OF SALES WITHIN MURRAY HILL
MURRAY HILL PPSF BY UNIT SIZE ($1,467/SF Median)
M U R R AY H I L L
P P S F P R I C E
$800
$1,000
$1,200
$1,400
$1,600
$1,800
$2,000
Studios 1 Beds 2 Beds 1500+ SF
Murray Hill PPSF by Unit Size ($1,467/SF Median)
17%
17%
49%
17%
% of Sales within Murray Hill
Studios
1 Beds
2 Beds
1500+ SF
NEIGHBORHOOD PRICE TRENDS
15
m a n h a t t a n n e w d e v e l o p m e n t R e p o R t 2 q 1 2
13%
13%
37%
37%
% of Sales within BPC
Studios
1 Beds
2 Beds
1500+ SF
M N S 1 1 5 E A S T 2 3 R D S T R E E T , N E W Y O R K , N Y 1 0 0 1 0 2 1 2 . 4 7 5 . 9 0 0 0 I N F O @ M N S . C O M M N S . C O M
$700,000
$1,200,000
$1,700,000
$2,200,000
$2,700,000
$900
$1,000
$1,100
$1,200
$1,300
$1,400
$1,500
1Q10 2Q10 3Q10 4Q10 1Q11 2Q11 3Q11 4Q11 1Q12 2Q12
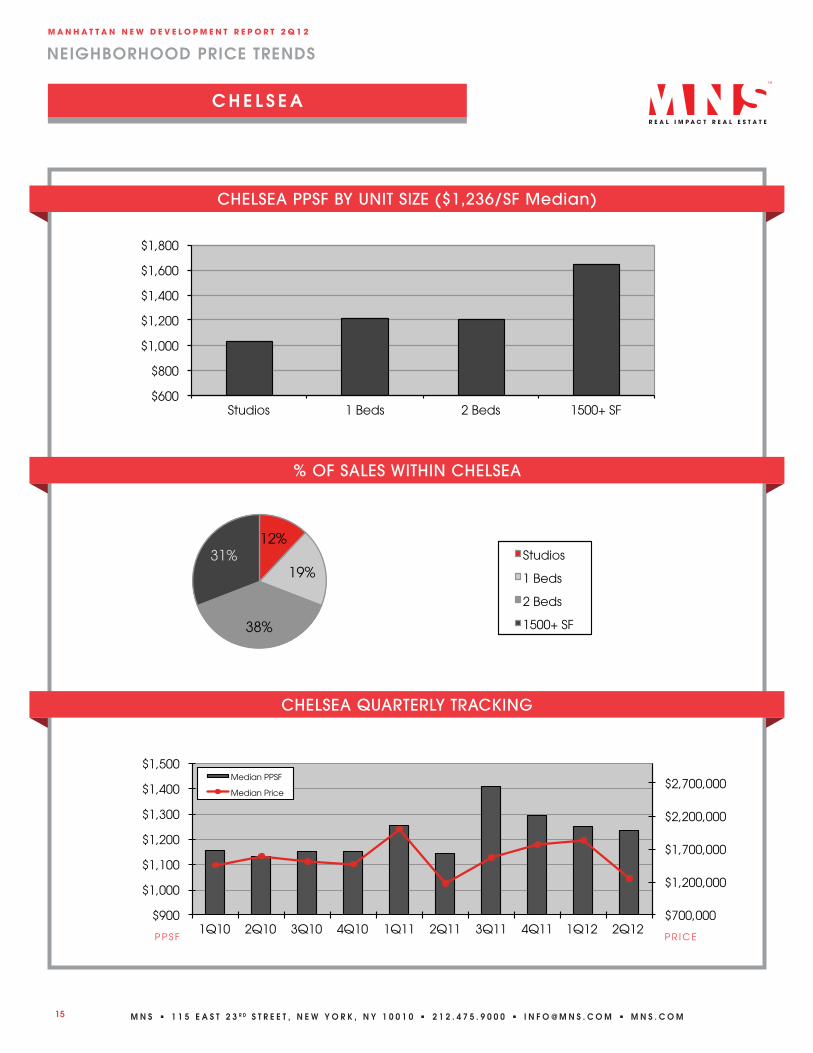
Chelsea
Median PPSF
Median Price
CHELSEA QUARTERLY TRACKING
% OF SALES WITHIN CHELSEA
CHELSEA PPSF BY UNIT SIZE ($1,236/SF Median)
C H E L S E A
P P S F P R I C E
$600
$800
$1,000
$1,200
$1,400
$1,600
$1,800
Studios 1 Beds 2 Beds 1500+ SF
Chelsea PPSF by Unit Size ($1,236/SF Median)
12%
19%
38%
31%
% of Sales within Chelsea
Studios
1 Beds
2 Beds
1500+ SF
NEIGHBORHOOD PRICE TRENDS
16
m a n h a t t a n n e w d e v e l o p m e n t R e p o R t 2 q 1 2
13%
13%
37%
37%
% of Sales within BPC
Studios
1 Beds
2 Beds
1500+ SF
M N S 1 1 5 E A S T 2 3 R D S T R E E T , N E W Y O R K , N Y 1 0 0 1 0 2 1 2 . 4 7 5 . 9 0 0 0 I N F O @ M N S . C O M M N S . C O M
$500,000
$750,000
$1,000,000
$1,250,000
$1,500,000
$1,750,000
$2,000,000
$2,250,000
$1,100
$1,200
$1,300
$1,400
$1,500
$1,600
$1,700
1Q10 2Q10 3Q10 4Q10 1Q11 2Q11 3Q11 4Q11 1Q12 2Q12
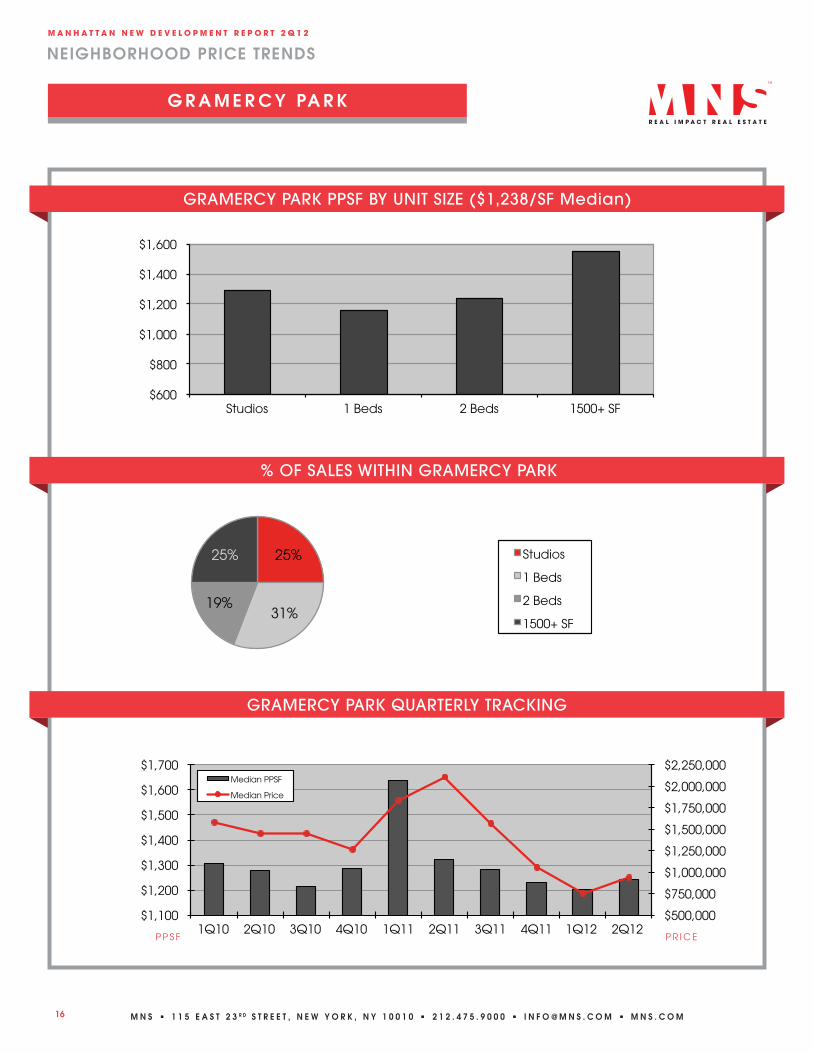
Gramercy Park
Median PPSF
Median Price
GRAMERCY PARK QUARTERLY TRACKING
% OF SALES WITHIN GRAMERCY PARK
GRAMERCY PARK PPSF BY UNIT SIZE ($1,238/SF Median)
G R A M E R C Y PA R K
P P S F P R I C E
$600
$800
$1,000
$1,200
$1,400
$1,600
Studios 1 Beds 2 Beds 1500+ SF
Gramercy PPSF by Unit Size ($1,238/SF Median)
25%
31% 19%
25%
% of Sales within Gramercy
Studios
1 Beds
2 Beds
1500+ SF
NEIGHBORHOOD PRICE TRENDS
17
m a n h a t t a n n e w d e v e l o p m e n t R e p o R t 2 q 1 2
13%
13%
37%
37%
% of Sales within BPC
Studios
1 Beds
2 Beds
1500+ SF
M N S 1 1 5 E A S T 2 3 R D S T R E E T , N E W Y O R K , N Y 1 0 0 1 0 2 1 2 . 4 7 5 . 9 0 0 0 I N F O @ M N S . C O M M N S . C O M
$1,250,000
$2,250,000
$3,250,000
$4,250,000
$5,250,000
$6,250,000
$7,250,000
$1,000
$1,500
$2,000
$2,500
$3,000
$3,500
1Q10 2Q10 3Q10 4Q10 1Q11 2Q11 3Q11 4Q11 1Q12 2Q12
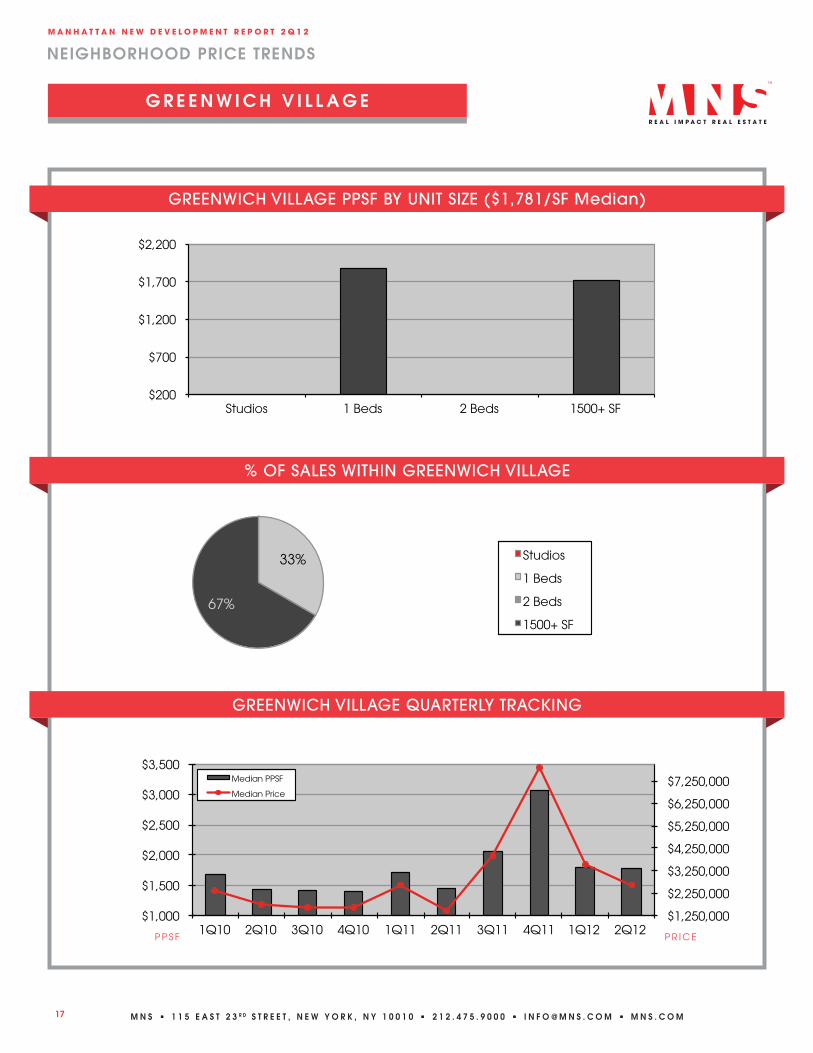
Greenwich Village
Median PPSF
Median Price
GREENWICH VILLAGE QUARTERLY TRACKING
% OF SALES WITHIN GREENWICH VILLAGE
GREENWICH VILLAGE PPSF BY UNIT SIZE ($1,781/SF Median)
G R E E N W I C H V I L L A G E
P P S F
0%
33%
0% 67%
% of Sales within Greenwich Village
Studios
1 Beds
2 Beds
1500+ SF
P R I C E
$200
$700
$1,200
$1,700
$2,200
Studios 1 Beds 2 Beds 1500+ SF
Greenwich Village PPSF by Unit Size ($1,822/SF Median)

NEIGHBORHOOD PRICE TRENDS
18
m a n h a t t a n n e w d e v e l o p m e n t R e p o R t 2 q 1 2
13%
13%
37%
37%
% of Sales within BPC
Studios
1 Beds
2 Beds
1500+ SF
M N S 1 1 5 E A S T 2 3 R D S T R E E T , N E W Y O R K , N Y 1 0 0 1 0 2 1 2 . 4 7 5 . 9 0 0 0 I N F O @ M N S . C O M M N S . C O M
$400,000
$1,400,000
$2,400,000
$3,400,000
$600
$1,100
$1,600
1Q10 2Q10 3Q10 4Q10 1Q11 2Q11 3Q11 4Q11 1Q12 2Q12
East Village
Median PPSF
Median Price
EAST VILLAGE QUARTERLY TRACKING
% OF SALES WITHIN EAST VILLAGE
EAST VILLAGE PPSF BY UNIT SIZE ($1,886/SF Median)
E A S T V I L L A G E
P P S F P R I C E
$600
$800
$1,000
$1,200
$1,400
$1,600
$1,800
$2,000
Studios 1 Beds 2 Beds 1500+ SF
East Village PPSF by Unit Size ($1886/SF Median)
0% 0% 0%
100%
% of Sales within East Village
Studios
1 Beds
2 Beds
1500+ SF
NEIGHBORHOOD PRICE TRENDS
19
m a n h a t t a n n e w d e v e l o p m e n t R e p o R t 2 q 1 2
13%
13%
37%
37%
% of Sales within BPC
Studios
1 Beds
2 Beds
1500+ SF
M N S 1 1 5 E A S T 2 3 R D S T R E E T , N E W Y O R K , N Y 1 0 0 1 0 2 1 2 . 4 7 5 . 9 0 0 0 I N F O @ M N S . C O M M N S . C O M
$1,000,000
$3,000,000
$5,000,000
$7,000,000
$9,000,000
$11,000,000
$1,000
$1,500
$2,000
$2,500
$3,000
$3,500
1Q10 2Q10 3Q10 4Q10 1Q11 2Q11 3Q11 4Q11 1Q12 2Q12
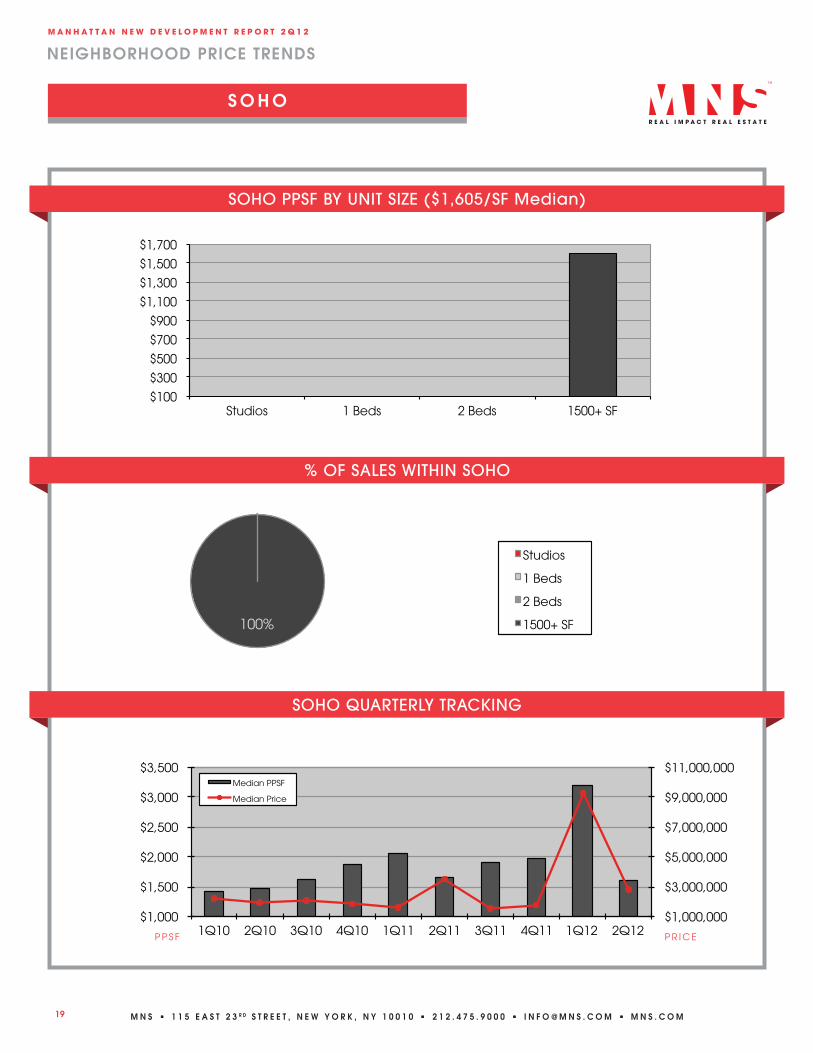
SoHo
Median PPSF
Median Price
0% 0% 0%
100%
% of Sales within SoHo
Studios
1 Beds
2 Beds
1500+ SF
SOHO QUARTERLY TRACKING
% OF SALES WITHIN SOHO
SOHO PPSF BY UNIT SIZE ($1,605/SF Median)
S O H O
P P S F P R I C E
$100 $300 $500 $700 $900
$1,100 $1,300 $1,500 $1,700
Studios 1 Beds 2 Beds 1500+ SF
SoHo PPSF by Unit Size ($1,605/SF Median)
NEIGHBORHOOD PRICE TRENDS
20
m a n h a t t a n n e w d e v e l o p m e n t R e p o R t 2 q 1 2
13%
13%
37%
37%
% of Sales within BPC
Studios
1 Beds
2 Beds
1500+ SF
M N S 1 1 5 E A S T 2 3 R D S T R E E T , N E W Y O R K , N Y 1 0 0 1 0 2 1 2 . 4 7 5 . 9 0 0 0 I N F O @ M N S . C O M M N S . C O M
$500,000
$750,000
$1,000,000
$1,250,000
$1,500,000
$1,750,000
$800
$1,000
$1,200
$1,400
1Q10 2Q10 3Q10 4Q10 1Q11 2Q11 3Q11 4Q11 1Q12 2Q12
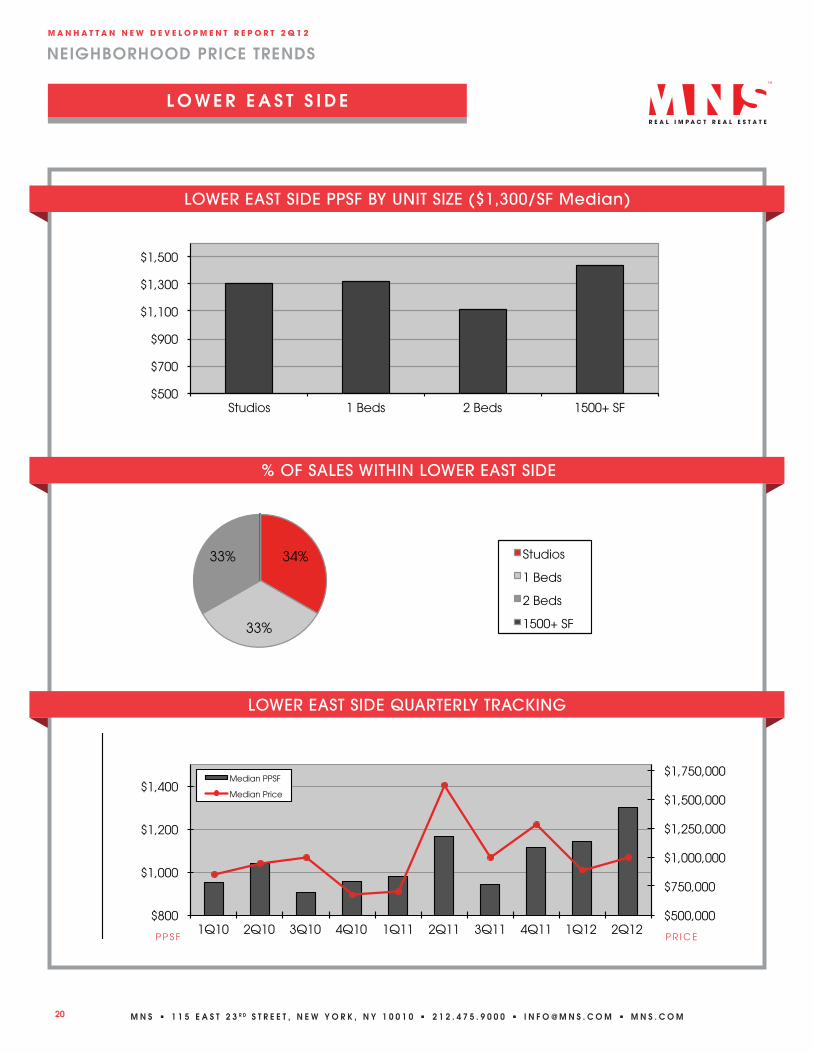
Lower East Side
Median PPSF
Median Price
LOWER EAST SIDE QUARTERLY TRACKING
% OF SALES WITHIN LOWER EAST SIDE
LOWER EAST SIDE PPSF BY UNIT SIZE ($1,300/SF Median)
L O W E R E A S T S I D E
P P S F P R I C E
$500
$700
$900
$1,100
$1,300
$1,500
Studios 1 Beds 2 Beds 1500+ SF
LES PPSF by Unit Size ($1,300/SF Median)
34%
33%
33%
0%
% of Sales within LES
Studios
1 Beds
2 Beds
1500+ SF
NEIGHBORHOOD PRICE TRENDS
21
m a n h a t t a n n e w d e v e l o p m e n t R e p o R t 2 q 1 2
13%
13%
37%
37%
% of Sales within BPC
Studios
1 Beds
2 Beds
1500+ SF
M N S 1 1 5 E A S T 2 3 R D S T R E E T , N E W Y O R K , N Y 1 0 0 1 0 2 1 2 . 4 7 5 . 9 0 0 0 I N F O @ M N S . C O M M N S . C O M
$500,000
$1,500,000
$2,500,000
$3,500,000
$4,500,000
$5,500,000
$6,500,000
$1,000
$1,200
$1,400
$1,600
$1,800
$2,000
1Q10 2Q10 3Q10 4Q10 1Q11 2Q11 3Q11 4Q11 1Q12 2Q12
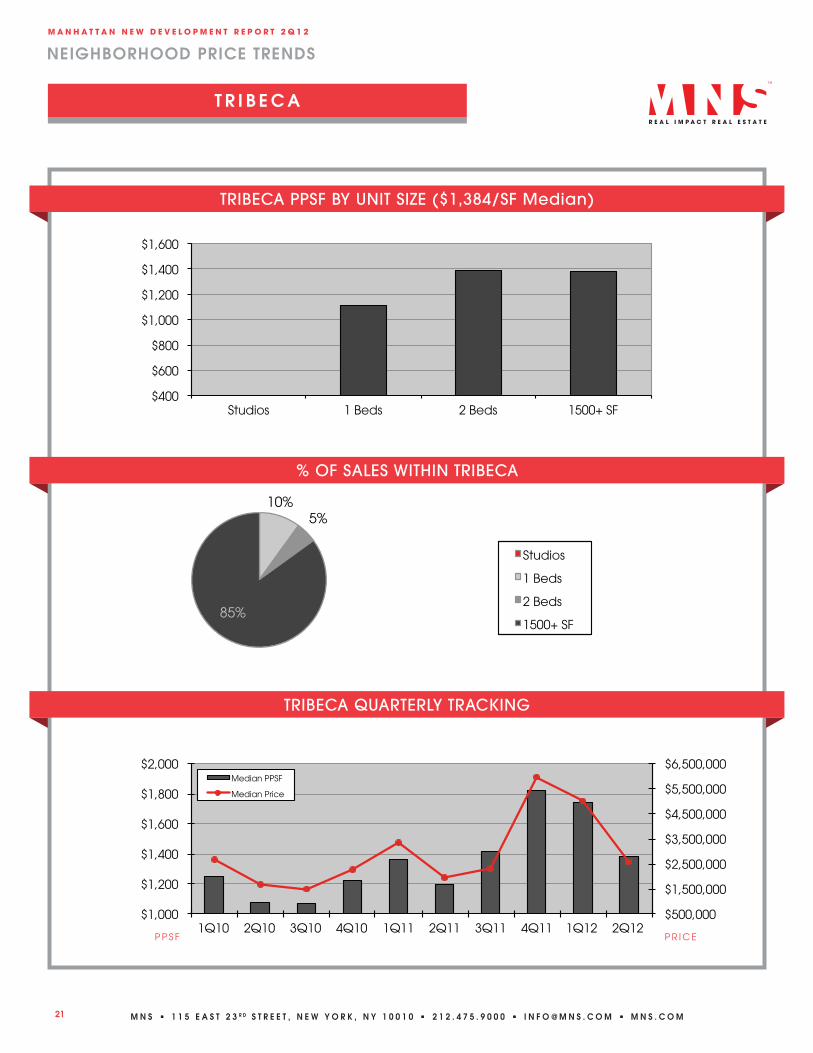
TriBeCa
Median PPSF
Median Price
TRIBECA QUARTERLY TRACKING
% OF SALES WITHIN TRIBECA
TRIBECA PPSF BY UNIT SIZE ($1,384/SF Median)
T R I B E C A
P P S F P R I C E
$400
$600
$800
$1,000
$1,200
$1,400
$1,600
Studios 1 Beds 2 Beds 1500+ SF
TriBeCa PPSF by Unit Size ($1,300/SF Median)
0% 10% 5%
85%
% of Sales within TriBeCa
Studios
1 Beds
2 Beds
1500+ SF
NEIGHBORHOOD PRICE TRENDS
22
m a n h a t t a n n e w d e v e l o p m e n t R e p o R t 2 q 1 2
13%
13%
37%
37%
% of Sales within BPC
Studios
1 Beds
2 Beds
1500+ SF
M N S 1 1 5 E A S T 2 3 R D S T R E E T , N E W Y O R K , N Y 1 0 0 1 0 2 1 2 . 4 7 5 . 9 0 0 0 I N F O @ M N S . C O M M N S . C O M
$500,000
$700,000
$900,000
$1,100,000
$1,300,000
$1,500,000
$600
$800
$1,000
$1,200
$1,400
1Q10 2Q10 3Q10 4Q10 1Q11 2Q11 3Q11 4Q11 1Q12 2Q12
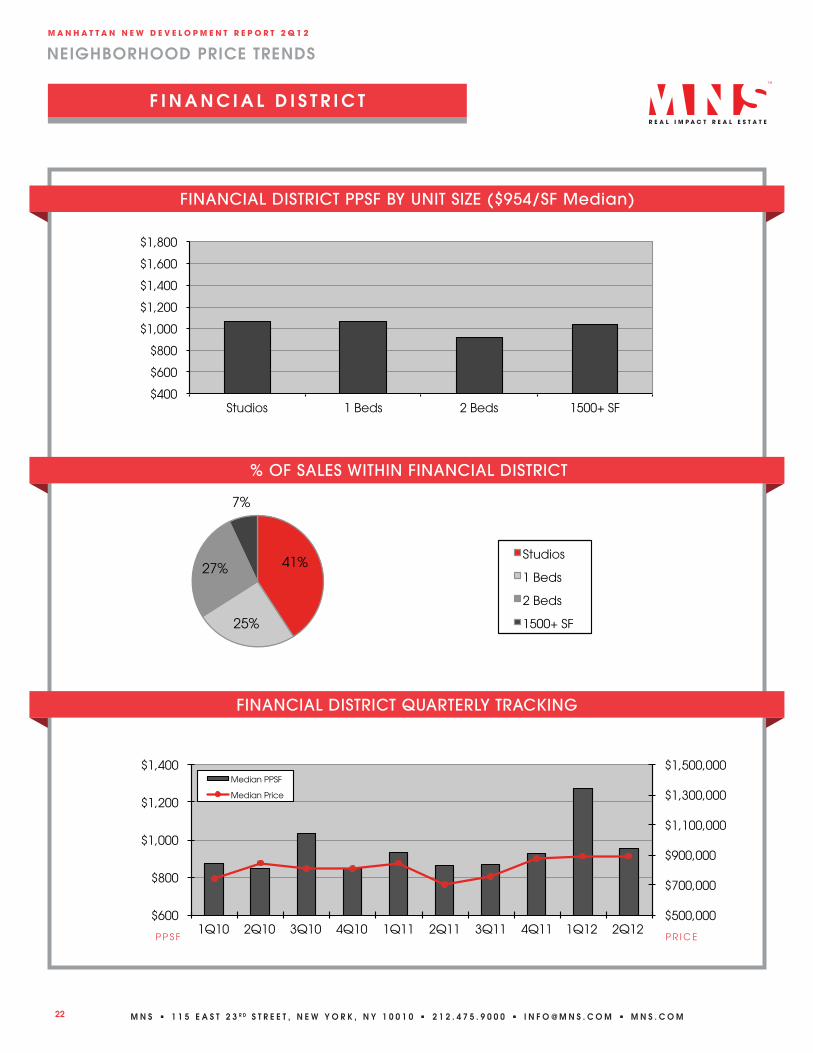
FiDi
Median PPSF
Median Price
FINANCIAL DISTRICT QUARTERLY TRACKING
% OF SALES WITHIN FINANCIAL DISTRICT
FINANCIAL DISTRICT PPSF BY UNIT SIZE ($954/SF Median)
F I N A N C I A L D I S T R I C T
P P S F P R I C E
$400
$600
$800
$1,000
$1,200
$1,400
$1,600
$1,800
Studios 1 Beds 2 Beds 1500+ SF
FiDi PPSF by Unit Size ($954/SF Median)
41%
25%
27%
7%
% of Sales within FiDi
Studios
1 Beds
2 Beds
1500+ SF
NEIGHBORHOOD PRICE TRENDS
23
m a n h a t t a n n e w d e v e l o p m e n t R e p o R t 2 q 1 2
13%
13%
37%
37%
% of Sales within BPC
Studios
1 Beds
2 Beds
1500+ SF
M N S 1 1 5 E A S T 2 3 R D S T R E E T , N E W Y O R K , N Y 1 0 0 1 0 2 1 2 . 4 7 5 . 9 0 0 0 I N F O @ M N S . C O M M N S . C O M
$400,000
$900,000
$1,400,000
$1,900,000
$2,400,000
$700
$800
$900
$1,000
$1,100
$1,200
$1,300
1Q10 2Q10 3Q10 4Q10 1Q11 2Q11 3Q11 4Q11 1Q12 2Q12
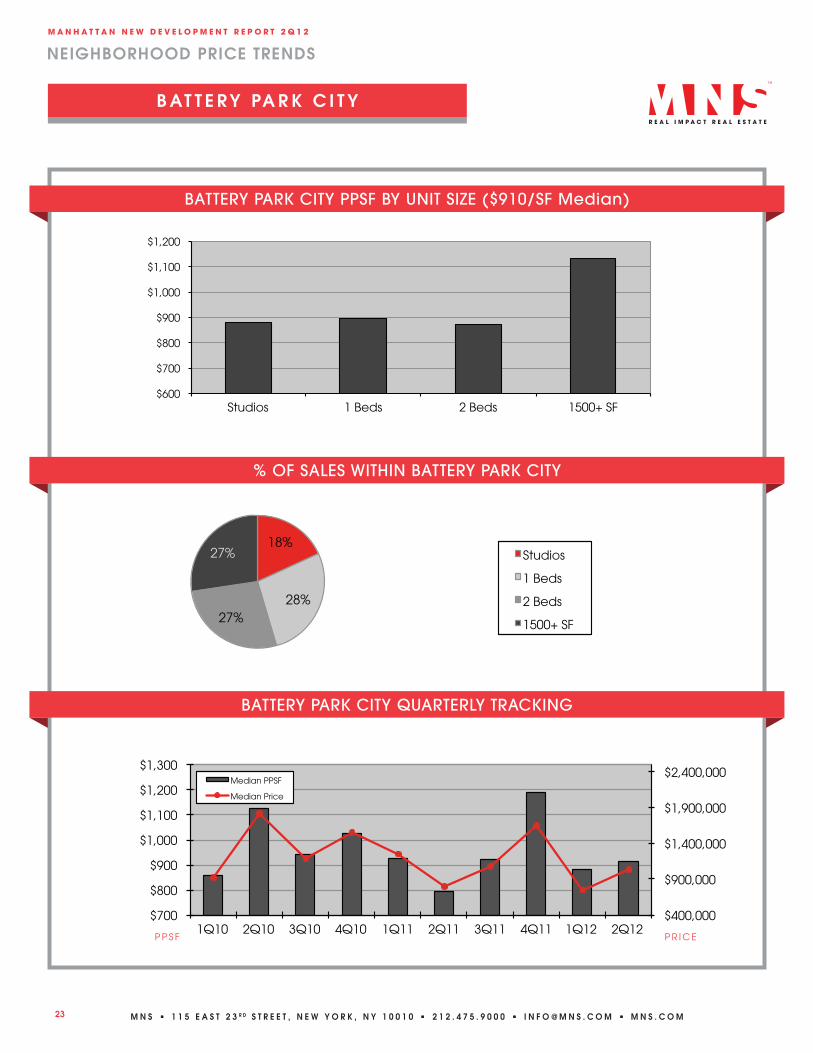
Battery Park City
Median PPSF
Median Price
BATTERY PARK CITY QUARTERLY TRACKING
% OF SALES WITHIN BATTERY PARK CITY
BATTERY PARK CITY PPSF BY UNIT SIZE ($910/SF Median)
B AT T E R Y PA R K C I T Y
P P S F P R I C E
$600
$700
$800
$900
$1,000
$1,100
$1,200
Studios 1 Beds 2 Beds 1500+ SF
BPC PPSF by Unit Size ($910/SF Median)
18%
28% 27%
27%
% of Sales within BPC
Studios
1 Beds
2 Beds
1500+ SF
m a n h a t t a n n e w d e v e l o p m e n t R e p o R t 2 q 1 2
24 M N S 1 1 5 E A S T 2 3 R D S T R E E T , N E W Y O R K , N Y 1 0 0 1 0 2 1 2 . 4 7 5 . 9 0 0 0 I N F O @ M N S . C O M M N S . C O M
T H E R E P O R T E X P L A I N E D
Included in this research are walk-up and elevator new development condominium buildings, as well as
new conversion condominiums if the sales were applicable sponsor transactions. Excluded from the report
are all cooperative sales. Unit types such as studios, one-bedrooms, and two-bedroom units are grouped by
square footage ranges. Studios are under 700 square feet, one-bedrooms are under 900 square feet, and two-
bedrooms are under 1,450 square feet. Added to the report is the over-sized unit type that ranges from 1,500
square feet to 7,000 square feet.
Presented with a quarter-over-quarter and year-over-year comparison, both city-wide and by neighborhood,
MNS New Development ReportTM tracks the market trends throughout Manhattan and Brooklyn. MNS offers a
unique insight into the new development market by tracking stalled construction sites on a quarterly basis, a
great indicator of where development in general is moving. MNS is your source to find neighborhood price
per square foot analysis, average sale prices, unit type sales trends, overall price movement, neighborhood
inventory comparisons, and absorption rates.
Can’t find what you’re looking for? Ask MNS for more information at www.mns.com.
CONTACT US NOW: 212.475.9000
Note: All market data is collected and compiled by MNS marketing department. The information presented here is intended for instructive purposes
only and has been gathered from sources deemed reliable, though it may be subject to errors, omissions, changes or withdrawal without notice. If you would like to republish this report on the web, please be sure to source it as the “Manhattan New Development Report” with a link back to its
original location (http://www.mns.com/manhattan_new_dev_report).


![[Very Important Elaporation on FiDI Clauses] Seppala_dec03_1mar04](https://img.pdfslide.us/doc/110x75/577cdad81a28ab9e78a6b162/very-important-elaporation-on-fidi-clauses-seppaladec031mar04.jpg)