Embed Size (px)
Citation preview

A comprehensive analysis of the residential real estate market in Manhattan.
Battery Park City Beekman Carnegie Hill Central Park South Chelsea Flatiron Clinton East Harlem East Village Financial District Gramercy Greenwich Village Hamilton Heights Morningside Heights Harlem Inwood Chinatown Lower East Side Midtown East Midtown West Murray Hill Roosevelt Island SoHo/Nolita Sutton Area TriBeCa Upper East Side Upper West Side Washington Heights West Village The Corcoran Report Battery Park City Beekman Carnegie Hill Central Park South Chelsea Flatiron Clinton East Harlem East Village Financial District Gramercy Greenwich Village Hamilton Heights Manhattan Morningside Heights Harlem Inwood Chinatown Lower East Side Midtown East Midtown West Murray Hill Nolita Roosevelt Island SoHo Sutton TriBeCa Upper East Side Upper West Side Washington Heights West Village The Corcoran ReportBattery Park City Beekman Carnegie Hill Central Park South Chelsea Flatiron Clinton East Harlem East Village Financial District Gramercy Greenwich Village Hamilton Heights Manhattan Morningside Heights Harlem Inwood Chinatown Lower
3rd Quarter 2013

Page 2The Corcoran Report3rd Quarter 2013
Welcome to the Corcoran Report, our quarterly examination of Manhattan’s residential real estate
market. This report uses market-wide data based on transactions that closed in the Third Quarter
2013 (July 1 through September 30) and compares them to closings that took place last quarter and
during the same quarter last year. Closings typically occur eight-to-twelve weeks after a contract is
signed. For that reason, the sales activity discussed trails actual market conditions.
Third Quarter 2013 recorded sales reached 4,164 closings, their highest level since the market
downturn five years ago. Strong local and international consumer confidence in the New York
market and extreme pent-up demand drove this quarter’s performance. Sales increased 5% from
Third Quarter 2012 and were stable from Second Quarter 2013. Historically low interest rates and a
continued influx of all-cash buyers contributed to the highly competitive market this quarter.
The high number of sales is even more impressive considering Manhattan’s chronically low supply of
homes for sale. Manhattan has experienced year-over-year inventory declines for ten consecutive
quarters. Despite depressed inventory levels, buyer activity has been intense; the last time there
were more closings in a single quarter (Second Quarter 2008) listed inventory was 73% higher.
Market wide average price per square foot reached its highest point since 2008, increasing 11%
from Third Quarter 2012 and 5% from Second Quarter 2013. Resale co-op, resale condo and new
development average price per square foot all increased by double-digits compared to Third Quarter
2012. Market wide median price increased by 7% from Third Quarter 2012 and 3% from Second
Quarter 2013. The new development market only represented 10% of closings which makes this
quarter’s price gains all the more impressive. Resale condo and co-op median price both reached
their highest point ever this quarter.
If you have any questions regarding your specific needs, Corcoran agents are here to help you
navigate the current market with expert knowledge and exceptional service.
For a digital copy of this report and more information on the New York real estate market please
visit our website at www.corcoran.com/nyc/Advice.
Sincerely,
Pamela Liebman Chief Executive Officer
The following members of the The Corcoran Group made significant contributions to this report:Helen Howe I Douglas LaMere I Kathleen Mejia I Ryan Schleis I Joshua Sachs
The following members of the PropertyShark team made significant contributions to this report:Matthew Haines I Lavinia Husar I Bodor Kalman I Robert Raiz I Mihai Palermo

Page 3The Corcoran Report3rd Quarter 2013
Financial District and Battery Park CityFinancial District and Battery Park City resale condo median price was 7% higher than Third Quarter 2012 and 10% higher than Second Quarter 2013 largely due to sales in Battery Park City towers. Increased market share for one bedrooms caused new development median price to decline. Page 15
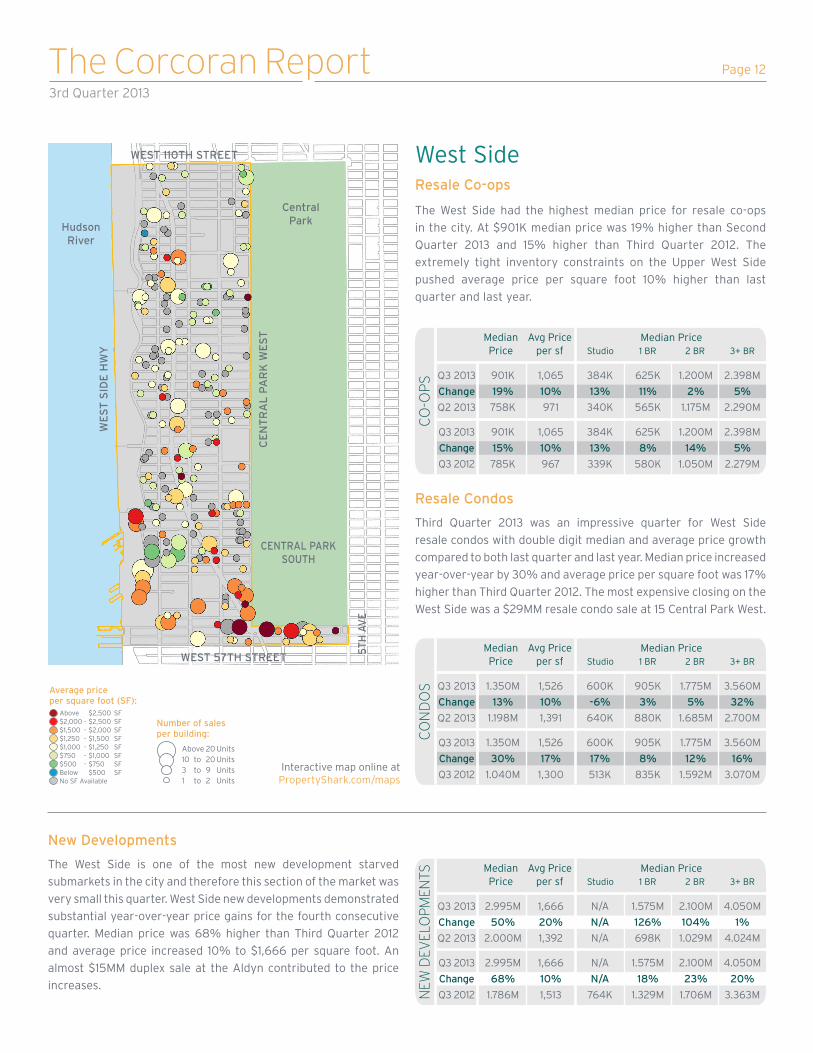
West SideThe West Side had the highest median price for resale co-ops in the city. Resale condos experienced double-digit median and average price growth compared to both last quarter and last year. New developments demonstrated substantial year-over-year price gains for the fourth consecutive quarter. Page 12
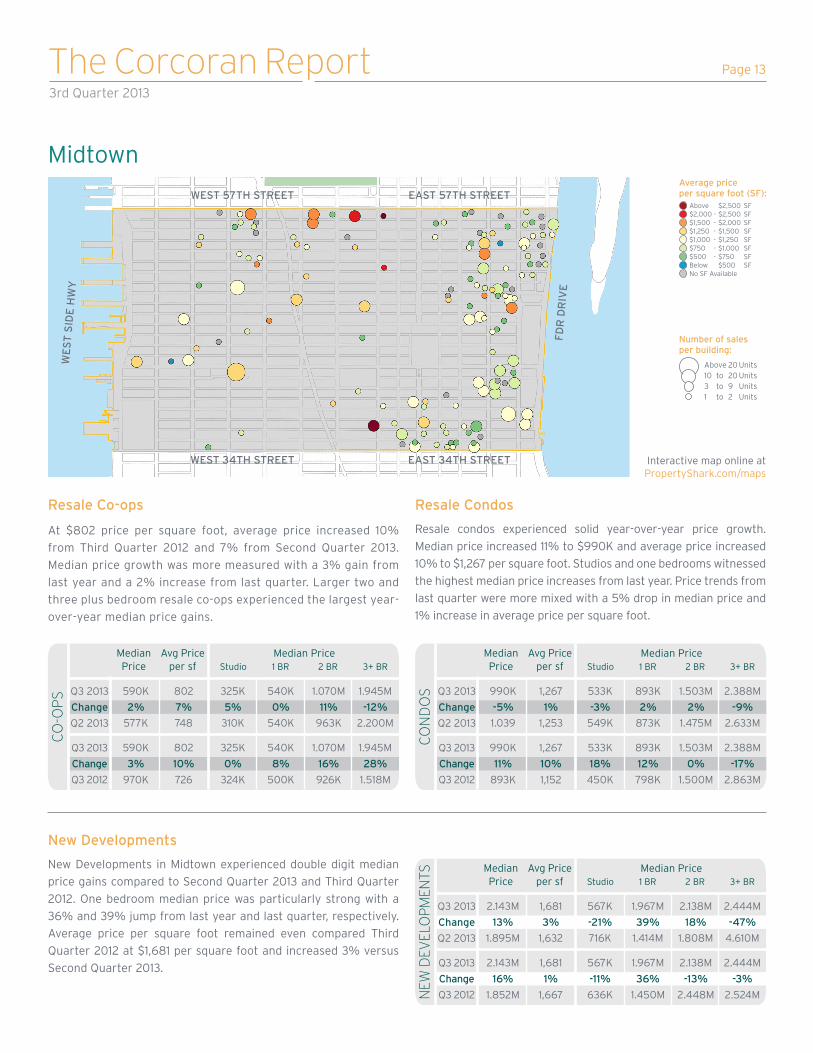
MidtownMidtown experienced the biggest uptick in market share this quarter and reached 16% of closings in Third Quarter 2013 compared to 13% in Third Quarter 2012. Average price per square foot for both resale co-ops and resale condos increased year-over-year by 10%. New development median price was up 16% from last year and 13% from Second Quarter 2013. Page 13
Market TrendsMarket wide prices responded to strong demand for limited inventory with year-over-year average price per square foot increases in every submarket. Page 4
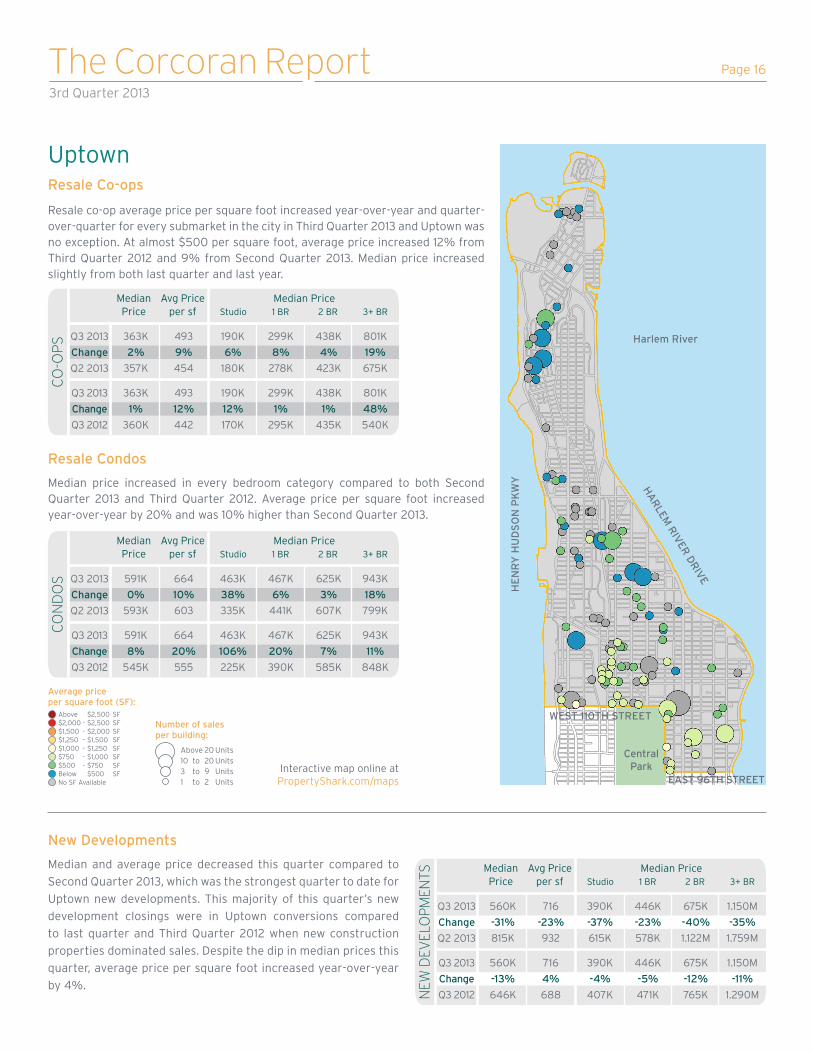
UptownThe resale condo and co-op
market experienced significant average price per square foot
gains compared to both last quarter and last year. Median price for both resale condos and co-ops was higher than
Second Quarter 2013 and Third Quarter 2012. New development
prices dipped compared to the Second Quarter 2013, which was
the strongest quarter to date for Uptown new developments.
Page 16
East SideIncreased activity for $20MM+
co-ops influenced resale co-op pricing. Resale condo
average price per square foot increased 6% compared to
both last quarter and last year. New Development average
price per square foot and median price both increased
year-over-year by 10%. Page 11
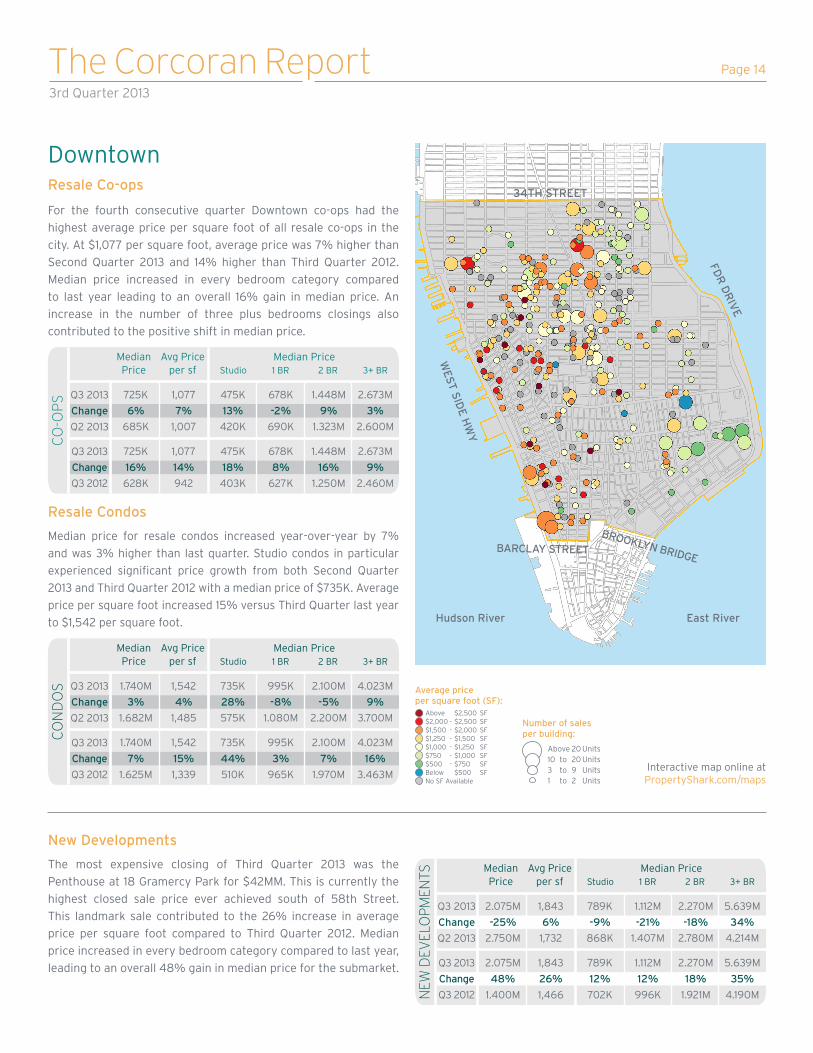
DowntownDowntown had the highest price
per square foot in the city this quarter. Intense demand for Downtown residences drove
resale co-op average price per square foot up 14% higher than
last year. Median price for resale condos increased year-over-
year by 7%. Average price per square foot for Downtown new development was 26% higher
than Third Quarter last year. Page 14
Interactive map online at
propertyshark.com/maps
PropertyShark.com’s map of Manhattan plots sales in the Second Quarter according to the number of sales and their respective prices per square foot.
Number of sales per building:
Above 20 Units 10 to 20 Units 3 to 9 Units 1 to 2 Units
Average price per square foot (SF):
Above $2,500 SF $2,000 - $2,500 SF $1,500 - $2,000 SF $1,250 - $1,500 SF $1,000 - $1,250 SF $750 - $1,000 SF $500 - $750 SF Below $500 SF No SF Available
View all our current market reports atwww.corcoran.com/nyc/Advice
Equal Housing Opportunity. The Corcoran Group is a licensed real estate broker located at 660 Madison Ave, NY, NY 10065. All information furnished regarding property for sale or rent or regarding financing is from sources deemed reliable, but Corcoran makes no warranty or representation as to the accuracy thereof. All property information is presented subject to errors, omissions, price changes, changed property conditions, and withdrawal of the property from the market, without notice.
Page 4The Corcoran Report3rd Quarter 2013
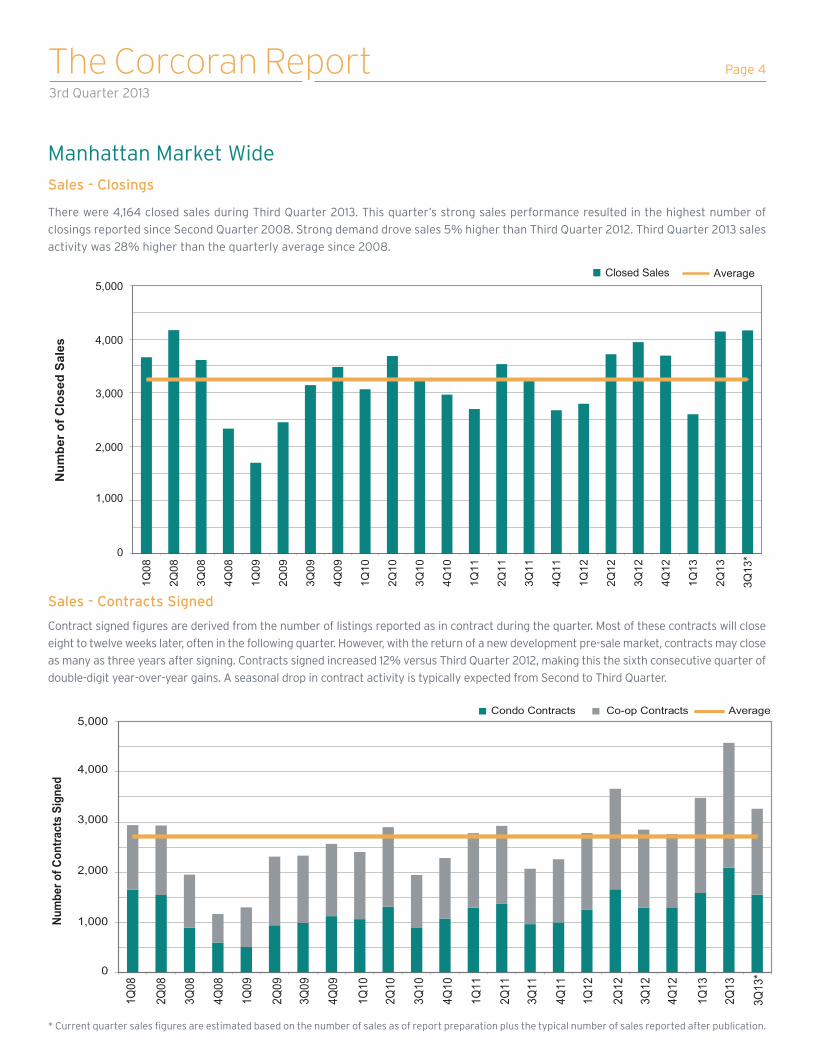
Sales - Closings
Sales - Contracts Signed
Contract signed figures are derived from the number of listings reported as in contract during the quarter. Most of these contracts will close
eight to twelve weeks later, often in the following quarter. However, with the return of a new development pre-sale market, contracts may close
as many as three years after signing. Contracts signed increased 12% versus Third Quarter 2012, making this the sixth consecutive quarter of
double-digit year-over-year gains. A seasonal drop in contract activity is typically expected from Second to Third Quarter.
There were 4,164 closed sales during Third Quarter 2013. This quarter’s strong sales performance resulted in the highest number of
closings reported since Second Quarter 2008. Strong demand drove sales 5% higher than Third Quarter 2012. Third Quarter 2013 sales
activity was 28% higher than the quarterly average since 2008.
Manhattan Market Wide
* Current quarter sales figures are estimated based on the number of sales as of report preparation plus the typical number of sales reported after publication.
0
1,000
2,000
3,000
4,000
5,000
1Q08
2Q08
3Q08
4Q08
1Q09
2Q09
3Q09
4Q09
1Q10
2Q10
3Q10
4Q10
1Q11
2Q11
3Q11
4Q11
1Q12
2Q12
3Q12
4Q12
1Q13
2Q13
3Q13
*
Num
ber o
f Con
tract
s Si
gned
Condo Contracts Co-op Contracts Average
0
1,000
2,000
3,000
4,000
5,000
1Q08
2Q08
3Q08
4Q08
1Q09
2Q09
3Q09
4Q09
1Q10
2Q10
3Q10
4Q10
1Q11
2Q11
3Q11
4Q11
1Q12
2Q12
3Q12
4Q12
1Q13
2Q13
3Q13
*
Num
ber o
f Clo
sed
Sale
s
1
Average Closed Sales

Page 5The Corcoran Report3rd Quarter 2013
Midtown experienced the biggest uptick in market share and
reached 16% of closings in Third Quarter 2013 compared to 13%
in Third Quarter 2012. Uptown market share slightly constricted
to 8% of closings, down from 10% last year. Market share in other
neighborhoods was largely unchanged from Third Quarter 2012.
While there are many currently selling new developments
absorbing at an extremely rapid pace, a limited number of sites
have started closings. New developments only represented
10% of closings this quarter down from 16% in Third Quarter
2012. The resale market expanded to meet growing demand.
Neighborhood Sales Comparison
Q3 2012 Q3 2013 Q3 2012 Q3 2013
Property Type Sales Comparison
28%
20%
23%
16%
5% 8%
20%
22%
13%
5%10%
29%
28%
20%
23%
16%
5% 8%
20%
22%
13%
5%10%
29%
32%
58%
10%
28%
56%
16%
Neighborhood Sales Comparison
36%
20%
21%
12%
6% 5%
Downtown West Side East Side Midtown FD/BPC Uptown
Bedroom Type Sales Comparison
12%
39%31%
18%
Studio One Bedroom Two Bedroom Three+ Bedroom
Resale Condo Resale Co-op New Development
Neighborhood Sales Comparison
36%
20%
21%
12%
6% 5%
Downtown West Side East Side Midtown FD/BPC Uptown
Bedroom Type Sales Comparison
12%
39%31%
18%
Studio One Bedroom Two Bedroom Three+ Bedroom
Resale Condo Resale Co-op New Development
32%
58%
10%
28%
56%
16%
* Percentages may not total 100 due to rounding.
The under $500K market constricted this quarter to less than 20% of sales. The $500K to $1MM market continues to represent the
largest market share at 37% of sales. The top segment of the market (over $5MM) expanded to 4% of sales this quarter compared to
3% in both Third Quarter 2012 and Second Quarter 2013. This quarter 45% of sales closed for over $1MM compared to 40% during
Third Quarter 2012.
Manhattan Market WideSales by Price Category
24% 37% 23% 9% 5% 3%
21% 37% 23% 10% 6% 3%
19% 37% 25% 9% 7% 4%
0% 20% 40% 60% 80% 100%
3Q12
2Q13
3Q13
Percent of Sales
Qua
rter
$0-$500K $500K-$1MM $1MM-$2MM $2MM-$3MM $3MM-$5MM $5MM+
Page 6The Corcoran Report3rd Quarter 2013
0 500 1,000 1,500 2,000 2,500 3,000 3,500 4,000 4,500
3Q13
2Q13
3Q12
Condo Listings
0 500 1,000 1,500 2,000 2,500 3,000 3,500 4,000 4,500
3Q13
2Q13
3Q12
Co-op Listings
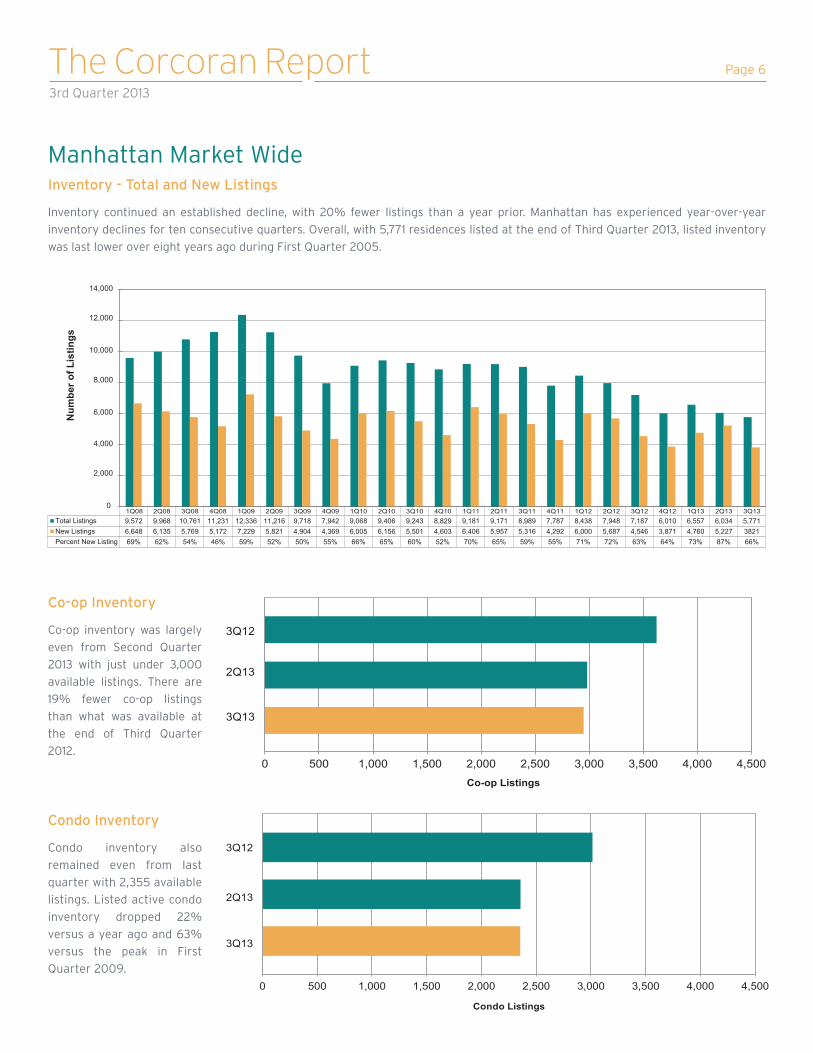
Co-op Inventory
Condo Inventory
Co-op inventory was largely
even from Second Quarter
2013 with just under 3,000
available listings. There are
19% fewer co-op listings
than what was available at
the end of Third Quarter
2012.
Condo inventory also
remained even from last
quarter with 2,355 available
listings. Listed active condo
inventory dropped 22%
versus a year ago and 63%
versus the peak in First
Quarter 2009.
Manhattan Market Wide
2Q08 3Q08 4Q08 1Q09 2Q09 3Q09 4Q09 1Q10 2Q10 3Q10 4Q10 1Q11 2Q11 3Q11 4Q11 1Q12 2Q12 3Q12 4Q12 1Q13 2Q13 3Q13Total Listings 9,572 9,968 10,761 11,231 12,336 11,216 9,718 7,942 9,068 9,406 9,243 8,829 9,181 9,171 8,989 7,787 8,438 7,948 7,187 6,010 6,557 6,034 5,771New Listings 6,648 6,135 5,769 5,172 7,229 5,821 4,904 4,369 6,005 6,156 5,501 4,603 6,406 5,957 5,316 4,292 6,000 5,687 4,546 3,871 4,760 5,227 3821Percent New Listing 69% 62% 54% 46% 59% 52% 50% 55% 66% 65% 60% 52% 70% 65% 59% 55% 71% 72% 63% 64% 73% 87% 66%
0
2,000
4,000
6,000
8,000
10,000
12,000
14,000
Num
ber o
f Lis
tings
1Q08
Inventory - Total and New Listings
Inventory continued an established decline, with 20% fewer listings than a year prior. Manhattan has experienced year-over-year
inventory declines for ten consecutive quarters. Overall, with 5,771 residences listed at the end of Third Quarter 2013, listed inventory
was last lower over eight years ago during First Quarter 2005.
Page 7The Corcoran Report3rd Quarter 2013
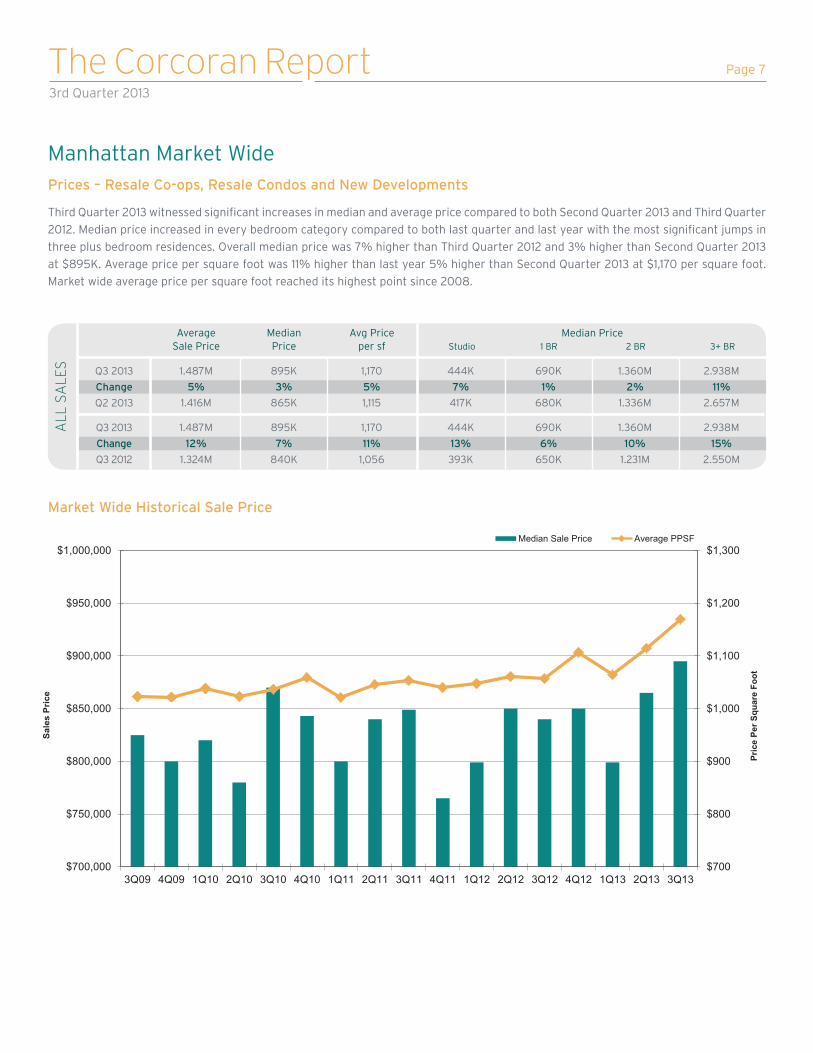
Third Quarter 2013 witnessed significant increases in median and average price compared to both Second Quarter 2013 and Third Quarter
2012. Median price increased in every bedroom category compared to both last quarter and last year with the most significant jumps in
three plus bedroom residences. Overall median price was 7% higher than Third Quarter 2012 and 3% higher than Second Quarter 2013
at $895K. Average price per square foot was 11% higher than last year 5% higher than Second Quarter 2013 at $1,170 per square foot.
Market wide average price per square foot reached its highest point since 2008.
Manhattan Market WidePrices – Resale Co-ops, Resale Condos and New Developments
Market Wide Historical Sale Price
$700
$800
$900
$1,000
$1,100
$1,200
$1,300
$700,000
$750,000
$800,000
$850,000
$900,000
$950,000
$1,000,000
3Q09 4Q09 1Q10 2Q10 3Q10 4Q10 1Q11 2Q11 3Q11 4Q11 1Q12 2Q12 3Q12 4Q12 1Q13 2Q13 3Q13
Median Sale Price Average PPSF
Pric
e Pe
r Squ
are
Foot
Sal
es P
rice
AverageSale Price
Median Price
Avg Priceper sf Studio 1 BR 2 BR 3+ BR
Median Price
Q3 2013
Change
Q3 2012
Q3 2013
Change
Q2 2013
1.487M 895K 1,170 444K 690K 1.360M 2.938M
1.487M 895K 1,170 444K 690K 1.360M 2.938M
12% 7% 11% 13% 6% 10% 15%
1.416M 865K 1,115 417K 680K 1.336M 2.657M
1.324M 840K 1,056 393K 650K 1.231M 2.550M
ALL
SA
LES
5% 3% 5% 7% 1% 2% 11%

Page 8The Corcoran Report3rd Quarter 2013
Resale co-ops in every submarket experienced double-digit year-
over-year price growth in average price per square foot which
lead to the overall 13% gain compared to Third Quarter 2012. At
$720K, median price increased 13% from last year and was 7%
higher than Second Quarter 2013.
Extremely strong supply-demand dynamics drove resale condo
median and average prices to their highest points ever. Both median
and average price per square foot increased 7% versus Second
Quarter 2013. Median price increased year-over-year by 11% and
average price was 12% higher than Third Quarter 2012 at $1,369 per
square foot.
Resale Co-ops
Resale Condos
Resale Condo Historical Sale Price
Resale Co-op Historical Sale Price
Q3 2013
Change
Q3 2012
Q3 2013
Change
Q2 2013
CO
-OP
S
Average
Sale Price
Median
Price
Avg Price
per sf Studio 1 BR 2 BR 3+ BR
1.214M 720K 951 390K 585K 1.134M 2.430M
1.214M 720K 951 390K 585K 1.134M 2.430M
16% 13% 13% 11% 6% 12% 19%
1.108M 670K 879 355K 565K 1.053M 2.252M
1.050M 640K 842 350K 550K 1.014M 2.050M
10% 7% 8% 10% 4% 8% 8%
Q3 2013
Change
Q3 2012
Q3 2013
Change
Q2 2013
CO
ND
OS
Average
Sale Price
Median
Price
Avg Price
per sf Studio 1 BR 2 BR 3+ BR
1.809M 1.220M 1,369 579K 870K 1.675M 3.550M
1.809M 1.220M 1,369 579K 870K 1.675M 3.550M
11% 11% 12% 21% 7% 4% 15%
1.644M 1.140M 1,278 549K 854K 1.599M 2.800M
1.637M 1.100M 1,220 477K 810K 1.610M 3.088M
10% 7% 7% 5% 2% 5% 27%
$600
$700
$800
$900
$1,000
$550,000
$600,000
$650,000
$700,000
$750,000
3Q09 4Q09 1Q10 2Q10 3Q10 4Q10 1Q11 2Q11 3Q11 4Q11 1Q12 2Q12 3Q12 4Q12 1Q13 2Q13 3Q13
Median Sale Price Average PPSF
Sal
e Pr
ice
Pric
e pe
r Squ
are
Foot
$1,000
$1,100
$1,200
$1,300
$1,400
$700,000
$850,000
$1,000,000
$1,150,000
$1,300,000
3Q09 4Q09 1Q10 2Q10 3Q10 4Q10 1Q11 2Q11 3Q11 4Q11 1Q12 2Q12 3Q12 4Q12 1Q13 2Q13 3Q13
Median Sale Price Average PPSF
Pric
e Pe
r Squ
are
Foot
Sal
e Pr
ice
Page 9The Corcoran Report3rd Quarter 2013
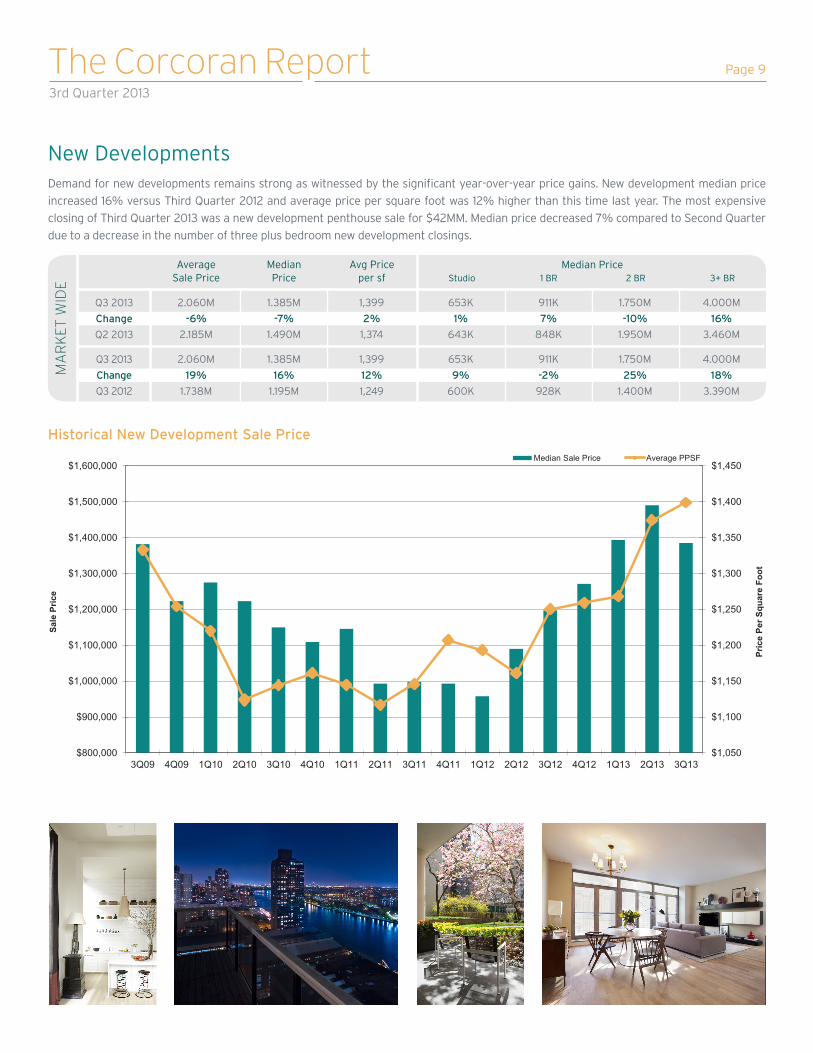
Demand for new developments remains strong as witnessed by the significant year-over-year price gains. New development median price
increased 16% versus Third Quarter 2012 and average price per square foot was 12% higher than this time last year. The most expensive
closing of Third Quarter 2013 was a new development penthouse sale for $42MM. Median price decreased 7% compared to Second Quarter
due to a decrease in the number of three plus bedroom new development closings.
New Developments
AverageSale Price
Median Price
Avg Priceper sf Studio 1 BR 2 BR 3+ BR
Median Price
Q3 2013
Change
Q3 2012
Q3 2013
Change
Q2 2013
2.060M 1.385M 1,399 653K 911K 1.750M 4.000M
2.060M 1.385M 1,399 653K 911K 1.750M 4.000M
19% 16% 12% 9% -2% 25% 18%
2.185M 1.490M 1,374 643K 848K 1.950M 3.460M
1.738M 1.195M 1,249 600K 928K 1.400M 3.390M
MA
RK
ET
WID
E
-6% -7% 2% 1% 7% -10% 16%
Historical New Development Sale Price
$1,050
$1,100
$1,150
$1,200
$1,250
$1,300
$1,350
$1,400
$1,450
$800,000
$900,000
$1,000,000
$1,100,000
$1,200,000
$1,300,000
$1,400,000
$1,500,000
$1,600,000
3Q09 4Q09 1Q10 2Q10 3Q10 4Q10 1Q11 2Q11 3Q11 4Q11 1Q12 2Q12 3Q12 4Q12 1Q13 2Q13 3Q13
Median Sale Price Average PPSF
Sale
Pric
e
Pric
e Pe
r Squ
are
Foot

Page 10The Corcoran Report3rd Quarter 2013
Luxury Market
AverageSale Price
Median Price
Avg Priceper sf
Q3 2013
Change
Q3 2012
Q3 2013
Change
Q2 2013
5.627M 4.300M 2,129
5.627M 4.300M 2,129
17% 13% 11%
5.193M 3.950M 1,957
4.825M 3.800M 1,914
ALL
SA
LES
8% 9% 9%
AverageSale Price
Median Price
Avg Priceper sf
Q3 2013
Change
Q3 2012
Q3 2013
Change
Q2 2013
7.659M 5.400M 2,470
7.659M 5.400M 2,470
39% 17% 22%
7.764M 5.898M 2,283
5.509M 4.598M 2,031NEW
DEV
ELO
PM
ENTS
-1% -8% 8%
AverageSale Price
Median Price
Avg Priceper sf
Q3 2013
Change
Q3 2012
Q3 2013
Change
Q2 2013
5.416M 4.100M 1,912
5.416M 4.100M 1,912
12% 8% 6%
4.769M 3.737M 1,668
4.833M 3.800M 1,799R
ESA
LE C
O-O
PS
14% 10% 15%
AverageSale Price
Median Price
Avg Priceper sf
Q3 2013
Change
Q3 2012
Q3 2013
Change
Q2 2013
5.288M 4.250M 2,152
5.288M 4.250M 2,152
19% 21% 14%
4.635M 3.633M 1,971
4.460M 3.500M 1,891
RES
ALE
CO
ND
OS
14% 17% 9%
Average townhouse pricing can be highly variable each quarter due to the low number of transactions. East Side townhouses had a strong
Third Quarter with year-over-year and quarter-over-quarter median price growth. At $7.725MM, East Side median price was 36% higher
than last year and 19% higher than Second Quarter 2013. Uptown townhouses also experienced positive median price trends with a 5% jump
versus last year and an 8% increase from last quarter.
Townhouses
Average Price Median Average Price Median Average Price Median Average Price Median
East Side West Side Downtown Uptown
Q3 2013
Change
Q3 2012
Q3 2013
Change
Q2 2013
9.010M 7.725M 4.991M 4.200M 5.887M 5.400M 1.391M 1.259M
-3% 19% -4% -21% -16% -9% 15% 8%
9.311M 6.517M 5.190M 5.300M 7.037M 5.924M 1.205M 1.169M
ALL
SA
LES
9.010M 7.725M 4.991M 4.200M 5.887M 5.400M 1.391M 1.260M
8.057M 5.663M 4.445M 4.150M 6.305M 5.800M 1.492M 1.195M
12% 36% 12% 1% -7% -7% -7% 5%
Manhattan’s luxury market is defined as the top 10% of all co-op and condo transactions. Prices in this upper echelon of the market
increased this quarter. Market wide average price per square foot increased 11% compared to last year and 9% compared to Second
Quarter 2013. At $4.3MM, market wide median price was 13% higher than Third Quarter 2012 and 9% higher than Second Quarter 2013.
The new development luxury market experienced the largest year-over-year average price gains. Average sale price was 39% higher
than last year and average price per square foot increased 22% to $2,470.

Page 11The Corcoran Report3rd Quarter 2013
East Side EAST 96TH STREET
5T
H A
VE
NU
E
FD
R D
RIV
E
Ro
ose
velt
Isl
and
East River
Ce
ntr
al P
ark
EAST 57TH STREET
Interactive map online at PropertyShark.com/maps
Number of sales per building:
Above 20 Units 10 to 20 Units 3 to 9 Units 1 to 2 Units
Average price per square foot (SF): Above $2,500 SF $2,000 - $2,500 SF $1,500 - $2,000 SF $1,250 - $1,500 SF $1,000 - $1,250 SF $750 - $1,000 SF $500 - $750 SF Below $500 SF No SF Available
Average price per square foot for East Side co-ops increased
year-over-year by 19% and quarter-over-quarter by 10%. Median
price increased in every bedroom category compared to both
last quarter and last year with the most significant increases in
three plus bedroom residences. Strong sales activity over $20MM
supported these submarket wide gains.
Median Price
Avg Priceper sf Studio 1 BR 2 BR 3+ BR
Median Price
Q3 2013
Change
Q3 2012
Q3 2013
Change
Q2 2013
1.723M 1,461 692K 849K 1.999M 2.995M
1.723M 1,461 692K 849K 1.999M 2.995M
14% 6% 0% 4% 8% -3%
10% 10% N/A 7% 38% -14%
1.510M 1,376 695K 816K 1.845M 3.100M
1.570M 1,334 N/A 794K 1.456M 3.466MNEW
DEV
ELO
PM
ENTS
Resale Co-ops
Resale Condos
New Developments
At $1,362 average price per square foot was 6% higher than both
last quarter and Third Quarter last year. Median price had more
mixed results with an 8% gain from last year but a 7% drop from
Second Quarter 2013. In Third Quarter 2013, over 50% of East
Side resale condos closed for under $1MM compared to less than
40% during Second Quarter 2013.
New Development average price per square foot and median price
both experienced a 10% increase compared to last year. Strong
demand for new developments on the East Side also caused a 14%
jump in median price from last quarter and 6% increase in average
price per square foot. Closings at properties like The Touraine and
Manhattan House helped bolster these numbers.
Median Price
Avg Priceper sf Studio 1 BR 2 BR 3+ BR
Median Price
Q3 2013
Change
Q3 2012
Q3 2013
Change
Q2 2013
843K 962 325K 540K 1.200M 2.973M
843K 962 325K 540K 1.200M 2.973M
12% 10% 7% 1% 10% 20%
3% 19% 2% 4% 4% 29%
753K 878 305K 533K 1.095M 2.475M
820K 809 320K 520K 1.150M 2.300M
CO
-OP
S
Median Price
Avg Priceper sf Studio 1 BR 2 BR 3+ BR
Median Price
Q3 2013
Change
Q3 2012
Q3 2013
Change
Q2 2013
1.175M 1,362 570K 775K 1.598M 3.613M
1.175M 1,362 570K 775K 1.598M 3.613M
-7% 6% 23% 3% 3% 33%
8% 6% 27% 15% 15% -4%
1.257M 1,290 464K 750K 1.546M 2.725M
1.084M 1,288 450K 675K 1.390M 3.775M
CO
ND
OS
Page 12The Corcoran Report3rd Quarter 2013
West Side
WE
ST
SID
E H
WY
CE
NT
RA
L P
AR
K W
ES
T
5TH
AV
E
CENTRAL PARK SOUTH
Hudson River
CentralPark
WEST 57TH STREET
WEST 110TH STREET
Interactive map online at PropertyShark.com/maps
Number of sales per building:
Above 20 Units 10 to 20 Units 3 to 9 Units 1 to 2 Units
Average price per square foot (SF): Above $2,500 SF $2,000 - $2,500 SF $1,500 - $2,000 SF $1,250 - $1,500 SF $1,000 - $1,250 SF $750 - $1,000 SF $500 - $750 SF Below $500 SF No SF Available
Resale Co-ops
Resale Condos
New Developments
The West Side is one of the most new development starved
submarkets in the city and therefore this section of the market was
very small this quarter. West Side new developments demonstrated
substantial year-over-year price gains for the fourth consecutive
quarter. Median price was 68% higher than Third Quarter 2012
and average price increased 10% to $1,666 per square foot. An
almost $15MM duplex sale at the Aldyn contributed to the price
increases.
Median Price
Avg Priceper sf Studio 1 BR 2 BR 3+ BR
Median Price
Q3 2013
Change
Q3 2012
Q3 2013
Change
Q2 2013
2.995M 1,666 N/A 1.575M 2.100M 4.050M
2.995M 1,666 N/A 1.575M 2.100M 4.050M
50% 20% N/A 126% 104% 1%
68% 10% N/A 18% 23% 20%
2.000M 1,392 N/A 698K 1.029M 4.024M
1.786M 1,513 764K 1.329M 1.706M 3.363MNEW
DEV
ELO
PM
ENTS
Median Price
Avg Priceper sf Studio 1 BR 2 BR 3+ BR
Median Price
Q3 2013
Change
Q3 2012
Q3 2013
Change
Q2 2013
901K 1,065 384K 625K 1.200M 2.398M
901K 1,065 384K 625K 1.200M 2.398M
19% 10% 13% 11% 2% 5%
15% 10% 13% 8% 14% 5%
758K 971 340K 565K 1.175M 2.290M
785K 967 339K 580K 1.050M 2.279M
CO
-OP
S
Median Price
Avg Priceper sf Studio 1 BR 2 BR 3+ BR
Median Price
Q3 2013
Change
Q3 2012
Q3 2013
Change
Q2 2013
1.350M 1,526 600K 905K 1.775M 3.560M
1.350M 1,526 600K 905K 1.775M 3.560M
13% 10% -6% 3% 5% 32%
30% 17% 17% 8% 12% 16%
1.198M 1,391 640K 880K 1.685M 2.700M
1.040M 1,300 513K 835K 1.592M 3.070M
CO
ND
OS
Third Quarter 2013 was an impressive quarter for West Side
resale condos with double digit median and average price growth
compared to both last quarter and last year. Median price increased
year-over-year by 30% and average price per square foot was 17%
higher than Third Quarter 2012. The most expensive closing on the
West Side was a $29MM resale condo sale at 15 Central Park West.
The West Side had the highest median price for resale co-ops
in the city. At $901K median price was 19% higher than Second
Quarter 2013 and 15% higher than Third Quarter 2012. The
extremely tight inventory constraints on the Upper West Side
pushed average price per square foot 10% higher than last
quarter and last year.
Page 13The Corcoran Report3rd Quarter 2013
Midtown
Interactive map online at PropertyShark.com/maps
Number of sales per building:
Above 20 Units 10 to 20 Units 3 to 9 Units 1 to 2 Units
Average price per square foot (SF): Above $2,500 SF $2,000 - $2,500 SF $1,500 - $2,000 SF $1,250 - $1,500 SF $1,000 - $1,250 SF $750 - $1,000 SF $500 - $750 SF Below $500 SF No SF Available
Resale Co-ops Resale Condos
New Developments
New Developments in Midtown experienced double digit median
price gains compared to Second Quarter 2013 and Third Quarter
2012. One bedroom median price was particularly strong with a
36% and 39% jump from last year and last quarter, respectively.
Average price per square foot remained even compared Third
Quarter 2012 at $1,681 per square foot and increased 3% versus
Second Quarter 2013.
Median Price
Avg Priceper sf Studio 1 BR 2 BR 3+ BR
Median Price
Q3 2013
Change
Q3 2012
Q3 2013
Change
Q2 2013
2.143M 1,681 567K 1.967M 2.138M 2.444M
2.143M 1,681 567K 1.967M 2.138M 2.444M
13% 3% -21% 39% 18% -47%
16% 1% -11% 36% -13% -3%
1.895M 1,632 716K 1.414M 1.808M 4.610M
1.852M 1,667 636K 1.450M 2.448M 2.524MNEW
DEV
ELO
PM
ENTS
Median Price
Avg Priceper sf Studio 1 BR 2 BR 3+ BR
Median Price
Q3 2013
Change
Q3 2012
Q3 2013
Change
Q2 2013
990K 1,267 533K 893K 1.503M 2.388M
990K 1,267 533K 893K 1.503M 2.388M
-5% 1% -3% 2% 2% -9%
11% 10% 18% 12% 0% -17%
1.039 1,253 549K 873K 1.475M 2.633M
893K 1,152 450K 798K 1.500M 2.863M
CO
ND
OS
Median Price
Avg Priceper sf Studio 1 BR 2 BR 3+ BR
Median Price
Q3 2013
Change
Q3 2012
Q3 2013
Change
Q2 2013
590K 802 325K 540K 1.070M 1.945M
590K 802 325K 540K 1.070M 1.945M
2% 7% 5% 0% 11% -12%
3% 10% 0% 8% 16% 28%
577K 748 310K 540K 963K 2.200M
970K 726 324K 500K 926K 1.518M
CO
-OP
S
Resale condos experienced solid year-over-year price growth.
Median price increased 11% to $990K and average price increased
10% to $1,267 per square foot. Studios and one bedrooms witnessed
the highest median price increases from last year. Price trends from
last quarter were more mixed with a 5% drop in median price and
1% increase in average price per square foot.
At $802 price per square foot, average price increased 10%
from Third Quarter 2012 and 7% from Second Quarter 2013.
Median price growth was more measured with a 3% gain from
last year and a 2% increase from last quarter. Larger two and
three plus bedroom resale co-ops experienced the largest year-
over-year median price gains.
EAST 57TH STREET
EAST 34TH STREET
WEST 57TH STREET
WEST 34TH STREET
FD
R D
RIV
E
WE
ST
SID
E H
WY
Page 14The Corcoran Report3rd Quarter 2013
Downtown
Interactive map online at PropertyShark.com/maps
Number of sales per building:
Above 20 Units 10 to 20 Units 3 to 9 Units 1 to 2 Units
Average price per square foot (SF): Above $2,500 SF $2,000 - $2,500 SF $1,500 - $2,000 SF $1,250 - $1,500 SF $1,000 - $1,250 SF $750 - $1,000 SF $500 - $750 SF Below $500 SF No SF Available
Resale Co-ops
Resale Condos
New Developments
Median price for resale condos increased year-over-year by 7%
and was 3% higher than last quarter. Studio condos in particular
experienced significant price growth from both Second Quarter
2013 and Third Quarter 2012 with a median price of $735K. Average
price per square foot increased 15% versus Third Quarter last year
to $1,542 per square foot.
The most expensive closing of Third Quarter 2013 was the
Penthouse at 18 Gramercy Park for $42MM. This is currently the
highest closed sale price ever achieved south of 58th Street.
This landmark sale contributed to the 26% increase in average
price per square foot compared to Third Quarter 2012. Median
price increased in every bedroom category compared to last year,
leading to an overall 48% gain in median price for the submarket.
Median Price
Avg Priceper sf Studio 1 BR 2 BR 3+ BR
Median Price
Q3 2013
Change
Q3 2012
Q3 2013
Change
Q2 2013
2.075M 1,843 789K 1.112M 2.270M 5.639M
2.075M 1,843 789K 1.112M 2.270M 5.639M
-25% 6% -9% -21% -18% 34%
48% 26% 12% 12% 18% 35%
2.750M 1,732 868K 1.407M 2.780M 4.214M
1.400M 1,466 702K 996K 1.921M 4.190MNEW
DEV
ELO
PM
ENTS
Median Price
Avg Priceper sf Studio 1 BR 2 BR 3+ BR
Median Price
Q3 2013
Change
Q3 2012
Q3 2013
Change
Q2 2013
725K 1,077 475K 678K 1.448M 2.673M
725K 1,077 475K 678K 1.448M 2.673M
6% 7% 13% -2% 9% 3%
16% 14% 18% 8% 16% 9%
685K 1,007 420K 690K 1.323M 2.600M
628K 942 403K 627K 1.250M 2.460M
CO
-OP
S
Median Price
Avg Priceper sf Studio 1 BR 2 BR 3+ BR
Median Price
Q3 2013
Change
Q3 2012
Q3 2013
Change
Q2 2013
1.740M 1,542 735K 995K 2.100M 4.023M
1.740M 1,542 735K 995K 2.100M 4.023M
3% 4% 28% -8% -5% 9%
7% 15% 44% 3% 7% 16%
1.682M 1,485 575K 1.080M 2.200M 3.700M
1.625M 1,339 510K 965K 1.970M 3.463M
CO
ND
OS
FDR
DR
IVE
WE
ST
SID
E H
WY
Hudson River East River
34TH STREET
BARCLAY STREET
BROOKLYN BRIDGE
For the fourth consecutive quarter Downtown co-ops had the
highest average price per square foot of all resale co-ops in the
city. At $1,077 per square foot, average price was 7% higher than
Second Quarter 2013 and 14% higher than Third Quarter 2012.
Median price increased in every bedroom category compared
to last year leading to an overall 16% gain in median price. An
increase in the number of three plus bedrooms closings also
contributed to the positive shift in median price.

Page 15The Corcoran Report3rd Quarter 2013
Financial District and Battery Park City
FDR
DR
IVE
WE
ST
ST
RE
ET
EastRiver
HudsonRiver
BARCLAY STREET
CHAMBERS STREETBROOKLYN BRIDGE
BR
OA
DW
AY
Interactive map online at PropertyShark.com/maps
Number of sales per building:
Above 20 Units 10 to 20 Units 3 to 9 Units 1 to 2 Units
Average price per square foot (SF): Above $2,500 SF $2,000 - $2,500 SF $1,500 - $2,000 SF $1,250 - $1,500 SF $1,000 - $1,250 SF $750 - $1,000 SF $500 - $750 SF Below $500 SF No SF Available
Resale Condos
Resale Co-ops
New Developments
The composition of new development inventory in the Financial
District and Battery Park City is largely unchanged from last
quarter and therefore prices were stable compared to Second
Quarter 2013. 60% of the new development closings were one
bedroom residences this quarter which heavily influenced overall
median pricing compared to last year. Median price declined 5%
due to this shift in market share while average price per square
foot increased 9% year-over-year.
Median Price
Avg Priceper sf Studio 1 BR 2 BR 3+ BR
Median Price
Q3 2013
Change
Q3 2012
Q3 2013
Change
Q2 2013
852K 1,160 590K 815K 1.508M 2.450M
852K 1,160 590K 815K 1.508M 2.450M
0% 1% 1% -4% -1% 8%
-5% 9% 8% -2% 13% 8%
855K 1,149 585K 846K 1.516M 2.260M
900K 1,063 547K 830K 1.328M 2.275MNEW
DEV
ELO
PM
ENTS
Median Price
Avg Priceper sf Studio 1 BR 2 BR 3+ BR
Median Price
Q3 2013
Change
Q3 2012
Q3 2013
Change
Q2 2013
850K 997 505K 750K 1.463M 2.400M
850K 997 504K 750K 1.463M 2.400M
10% 7% -2% 13% 17% 13%
7% 10% -6% 10% 18% 50%
775K 932 516K 663K 1.248M 2.128M
798K 909 535K 680K 1.240M 1.604MC
ON
DO
S
Strong sales at Battery Park City towers with water views lead resale condos this quarter to solid year-over-year and quarter-over-
quarter price gains. At $850K, median price was 7% higher than Third Quarter 2012 and 10% higher than Second Quarter 2013. Three
plus bedroom condos had a particularly strong median price performance, increasing 50% from last year.
There is very limited cooperative inventory in the Financial
District and none in Battery Park City. As a result there was not
a statistically significant number of sales to draw any meaningful
conclusions.
Page 16The Corcoran Report3rd Quarter 2013
UptownH
AR
LEM R
IVER
DR
IVE
Harlem River
WEST 110TH STREET
EAST 96TH STREET
HE
NR
Y H
UD
SO
N P
KW
Y
CentralParkInteractive map online at
PropertyShark.com/maps
Number of sales per building:
Above 20 Units 10 to 20 Units 3 to 9 Units 1 to 2 Units
Average price per square foot (SF): Above $2,500 SF $2,000 - $2,500 SF $1,500 - $2,000 SF $1,250 - $1,500 SF $1,000 - $1,250 SF $750 - $1,000 SF $500 - $750 SF Below $500 SF No SF Available
Resale co-op average price per square foot increased year-over-year and quarter-over-quarter for every submarket in the city in Third Quarter 2013 and Uptown was no exception. At almost $500 per square foot, average price increased 12% from Third Quarter 2012 and 9% from Second Quarter 2013. Median price increased slightly from both last quarter and last year.
Median Price
Avg Priceper sf Studio 1 BR 2 BR 3+ BR
Median Price
Q3 2013
Change
Q3 2012
Q3 2013
Change
Q2 2013
363K 493 190K 299K 438K 801K
363K 493 190K 299K 438K 801K
2% 9% 6% 8% 4% 19%
1% 12% 12% 1% 1% 48%
357K 454 180K 278K 423K 675K
360K 442 170K 295K 435K 540K
CO
-OP
S
Resale Co-ops
Resale Condos
New Developments
Median and average price decreased this quarter compared to
Second Quarter 2013, which was the strongest quarter to date for
Uptown new developments. This majority of this quarter’s new
development closings were in Uptown conversions compared
to last quarter and Third Quarter 2012 when new construction
properties dominated sales. Despite the dip in median prices this
quarter, average price per square foot increased year-over-year
by 4%.
Median Price
Avg Priceper sf Studio 1 BR 2 BR 3+ BR
Median Price
Q3 2013
Change
Q3 2012
Q3 2013
Change
Q2 2013
560K 716 390K 446K 675K 1.150M
560K 716 390K 446K 675K 1.150M
-31% -23% -37% -23% -40% -35%
-13% 4% -4% -5% -12% -11%
815K 932 615K 578K 1.122M 1.759M
646K 688 407K 471K 765K 1.290MNEW
DEV
ELO
PM
ENTS
Median Price
Avg Priceper sf Studio 1 BR 2 BR 3+ BR
Median Price
Q3 2013
Change
Q3 2012
Q3 2013
Change
Q2 2013
591K 664 463K 467K 625K 943K
591K 664 463K 467K 625K 943K
0% 10% 38% 6% 3% 18%
8% 20% 106% 20% 7% 11%
593K 603 335K 441K 607K 799K
545K 555 225K 390K 585K 848K
CO
ND
OS
Median price increased in every bedroom category compared to both Second Quarter 2013 and Third Quarter 2012. Average price per square foot increased year-over-year by 20% and was 10% higher than Second Quarter 2013.