Embed Size (px)
Citation preview
Forestry Department Food and Agriculture Organization of the United Nations
Mangroves of Asia 1980-2005:
COUNTRY REPORTS
Forest Resources Assessment Programme
Working Paper 137 Rome, 2007
Disclaimer Forest Resources Assessment Working Papers report on issues and activities in the forest resources assessment field. These working papers do not reflect any official position of FAO. Please refer to the FAO website (www.fao.org/forestry) for official information. The purpose of these papers is to provide early release of information on ongoing activities and programmes and to stimulate discussion. Comments and feedback are welcome. For further information, please contact [email protected] or Mette Løyche Wilkie Senior Forestry Officer FAO Forestry Department Viale delle Terme di Caracolla 00153 Rome, Italy e-mail: [email protected]
© FAO 2007
CONTENTS Acknowledgements............................................................................................................. ii Introduction......................................................................................................................... 1 Bahrain................................................................................................................................ 3 Bangladesh.......................................................................................................................... 7 Brunei Darussalam............................................................................................................ 15 Cambodia .......................................................................................................................... 20 China ................................................................................................................................. 25 India .................................................................................................................................. 31 Indonesia ........................................................................................................................... 40 Iran .................................................................................................................................... 49 Japan ................................................................................................................................. 53 Kuwait............................................................................................................................... 57 Malaysia............................................................................................................................ 60 Maldives............................................................................................................................ 69 Myanmar ........................................................................................................................... 71 Oman................................................................................................................................. 77 Pakistan ............................................................................................................................. 81 Philippines......................................................................................................................... 86 Qatar.................................................................................................................................. 99 Saudi Arabia.................................................................................................................... 103 Singapore ........................................................................................................................ 107 Sri Lanka......................................................................................................................... 112 Thailand .......................................................................................................................... 118 Timor-Leste..................................................................................................................... 128 United Arab Emirates ..................................................................................................... 132 Viet Nam......................................................................................................................... 136 Yemen............................................................................................................................. 143 Bibliography ................................................................................................................... 147 Annex 1. The world's mangroves 1980-2005: Regional working papers....................... 148
1
Acknowledgements
The Global Forest Resources Assessment 2005 (FRA 2005) represents a major effort of FAO’s Forestry Department, FAO member countries, donors, partners and individual experts. More than 800 people have been directly involved in the process. National correspondents and their teams provided detailed country reports for the assessment. In addition to a detailed report from each country and the main report (FAO, 2006a), several thematic studies were prepared. One of these is The world’s mangroves 1980–2005. In addition to the main report (FAO, 2007) five regional working papers have been produced providing more detailed information on the mangroves in the 124 countries and areas in which they are found. This document is one of these working papers. FAO is grateful for the support of all countries, organizations and experts inside and outside the organization that have made this study possible. More than 150 people have been involved, including 107 national correspondents to FRA 2005 and their colleagues, national and international experts. Institutional and individual contributors are listed in Annex 1. FAO also recognizes the important collaboration, support and financial resources provided by ITTO in the framework of the interagency initiative for a revised World Atlas of Mangroves. FAO also thanks colleagues in the International Society for Mangrove Ecosystems (ISME), the United Nations Environment Programme World Conservation Monitoring Centre, the Man and Biosphere Programme of the United Nations Educational, Scientific and Cultural Organization and the International Network on Water, Environment and Health of the United Nations University for their collaboration in the data gathering process and remote sensing interpretation; and Spacedat s.r.l. for assistance with the distribution map. Serena Fortuna was responsible for compiling and analysing the data and preparing this working paper; Mette Wilkie initiated the study and provided technical guidance when needed.
ii
1
Introduction Mangroves are commonly found along sheltered coastlines in the tropics and subtropics where they fulfil important socio-economic and environmental functions. These include the provision of a large variety of wood and non-wood forest products; coastal protection against the effects of wind, waves and water currents; conservation of biological diversity, including a number of endangered mammals, reptiles, amphibians and birds; protection of coral reefs, sea-grass beds and shipping lanes against siltation; and provision of habitat, spawning grounds and nutrients for a variety of fish and shellfish, including many commercial species. High population pressure in coastal areas has, however, led to the conversion of many mangrove areas to other uses, including infrastructure, aquaculture, rice and salt production. Numerous case studies describe mangrove losses over time, but information on the status and trends of the extent of mangroves at the global level has, so far, been scarce. The first attempt at estimating the total mangrove area in the world was undertaken as part of the FAO/United Nations Environment Programme (UNEP) Tropical Forest Resources Assessment in 1980, where the world total was estimated as 15.6 million hectares. More recent estimates have ranged from 12 to 20 million hectares. Countries with small areas of mangroves have been excluded from many studies because of lack of information and because their combined area of mangroves would not significantly affect the world total. The world’s mangroves 1980–2005 is a thematic study undertaken within the framework of the Global Forest Resources Assessment 2005. It was led by FAO in collaboration with mangrove specialists throughout the world, and was co-funded by the International Tropical Timber Organization (ITTO). It builds on the 1980 assessment, on the FAO Global Forest Resources Assessment 2000 (FRA 2000) and 2005 (FRA 2005), and on an extensive literature search and correspondence with mangrove and forest resources assessment specialists. The main aim of this study is to facilitate access to comprehensive and comparable information on the current and past extent of mangroves in the 124 countries and areas where they are known to exist, highlighting information gaps and providing updated information that may serve as a tool for mangrove managers and policy- and decision-makers worldwide. Some 2 900 national and subnational data sets on the extent of mangrove ecosystems were collected during this process, permitting the compilation of an updated list of the most recent reliable estimate for each country. Regression analyses based on historical data provided revised estimates for 1980, 1990, 2000 and a forecast for 2005. The extrapolation to 2005 was constrained by the lack of recent information for a number of countries. This estimate is thus indicative and is likely to change when results from ongoing and future assessments become available. The main report entitled The world’s mangroves 1980–2005 (FAO, 2007) presents a global overview of mangrove vegetation, species composition and distribution, together with an indication of the main uses and threats in each region. The results indicate that global mangrove area is currently about 15.2 million hectares, with the largest areas found in Asia and Africa, followed by North and Central America. An alarming 20 percent of the global mangrove area, or 3.6 million hectares, has been lost since 1980. More recently, the rate of net loss appears to have slowed down, reflecting an increased awareness of the value of mangrove ecosystems. However, the annual rate of loss is still disturbingly high.
The report also highlights that regular updating of information on the extent and condition of mangroves is needed as an aid to policy- and decision-making for the conservation, management and sustainable use of the world’s remaining mangrove ecosystems. Detailed qualitative and quantitative information for each country is reported in five regional working papers as a complement to the information in the main report. This document is one of those regional working papers. It is an unedited compilation of country profiles providing more detailed information on the extent of mangroves and changes over time, a vegetation description and an indication on major threats and uses of these coastal forests. The country profiles are the result of an intense cooperation between FAO staff at Headquarters and in our Regional Offices and national experts. Each country profile is presented in the official UN language of communication and is structured - with some exceptions for those countries where insufficient information is available - according to six sections:
• Vegetation description, uses and threats; • Mangrove species checklist; • National level mangrove estimates; • Trends in mangrove area extent over time; • Summary status of mangrove area extent over time; • Formulas used for the trend analysis.
Following the classification used by Tomlinson 1987, mangroves may be divided into three groups according to their features: major elements (strict or true mangroves), minor elements and mangrove associates. During this assessment Tomlinson’s list of true mangrove species was modified by adding some species commonly found as exclusive mangrove species (Saenger et al. 1983). Information on minor elements and mangrove associates is not included in this report. All the national level mangrove area estimates collected during the preparation of this assessment are presented in each country profile. However, differences in methodologies, classifications, mapping scales etc. make a direct comparison of the estimates difficult. Consequently only the estimates considered as the most accurate and reliable were used for the analysis of the area changes over time. These are clearly marked in the tables. Detailed information on the formula used for the trend analysis is available for each country, with the exception of those countries/territories where related information was not available. The findings of this study will also contribute to the revised edition of the World Atlas of Mangroves, first published in 1997 by the International Society for Mangrove Ecosystems (ISME) in collaboration with the International Tropical Timber Organization (ITTO) and the UNEP World Conservation Monitoring Centre (UNEP-WCMC). The second edition is being developed as a joint initiative of ISME, ITTO, the Man and the Biosphere Programme of the United Nations Educational, Scientific and Cultural Organization (UNESCO), UNEP-WCMC, the International Network on Water, Environment and Health of United Nations University, and FAO. The atlas will promote conservation, restoration, management and sustainable use of mangrove ecosystems. Further information on and contacts for this initiative are available at www.fao.org/forestry/site/mangrove-atlas.
Bahrain Vegetation description, uses and threats The state of Bahrain is made up of more than 33 islands, among which the main is known as Bahrain of Awal. The last remaining stand of mangrove forest is found at Tubli Bay (Ras Tubli), a sheltered and shallow bay with extensive intertidal mudflats on the northeast coast of the main island. Mangroves are found in the southern part of this bay, at Ras Sanad and they were designated nature reserve in 1988. Avicennia marina is the sole species found, the highest tree being approximately 3.5 m tall. Uses and threats Tubli Bay, location of the only remaining stand of mangroves in the country, is located in an urban and industrial area with high human pressure, such as land-fill and land reclamation for infrastructure development, uncontrolled fishing, sewage disposal and discharge. Oil spills, oil shipping and loading operations represent major threat to the wetlands. Ras Sanad mangroves were declared Wildlife Reserve in 1988 and reforestation activities were undertaken in order to restore former areas, but with limited success. This zone is an important resting and feeding area for several water bird species during their migration periods in winter; the zone is also a very important nursery for commercial shrimp species such as Penaeus semisulcatus and Metapenaeus stebbingi. The entire Bay (around 1 600 ha) was designated Wetlands of International Importance (Ramsar site) in 1997, limiting land use within and around the site to small-scale commercial fishing, recreation and cultivation. Despite its protected status, the area is still under threat of damage. Reference: Abdulrahman, H. nd. Conservation in Bahrain. http://www.eef.org.bh/cnsrvnbhr.htm.
General Commission for the Protection of Marine Resources, Environment & Wildlife. 2003. The Kingdom of Bahrain. National Assessment of Barbados Programme of Action. http://www.sidsnet.org/docshare/other/20031230154234_Bahrain_NAR_2003.pdf
Ramsar. nd. A Directory of Wetlands of International Importance. http://www.wetlands.org/RDB/Ramsar_Dir/Bahrain/BH002D02.htm
Ramsar. nd. The Annotated Ramsar List: Bahrain. http://www.ramsar.org/profile/profiles_bahrain.htm
Spalding, M.D., Blasco, F. & Field, C.D., eds. 1997 World Mangrove Atlas. The International Society for Mangrove Ecosystems, Okinawa, Japan. 178 pp.
Scott, D.A. ed. 1995. A Directory of Wetlands in the Middle East. IUCN, Gland, Switzerland and IWRB, Slimbridge, U.K. xvii + 560pp, 13 maps.
True mangrove species checklist Avicennia marina
National level mangrove estimates
Year Area (ha) Source Trend Methodology/Comments
1991 40 Vreeland. 1991. Personal communication
Cited in: Fisher, P and Spalding, M.D. 1993. Protected areas with mangrove habitat. Draft Report World Conservation Centre, Cambridge, UK. 60pp. There is no reference on the date or methods used.
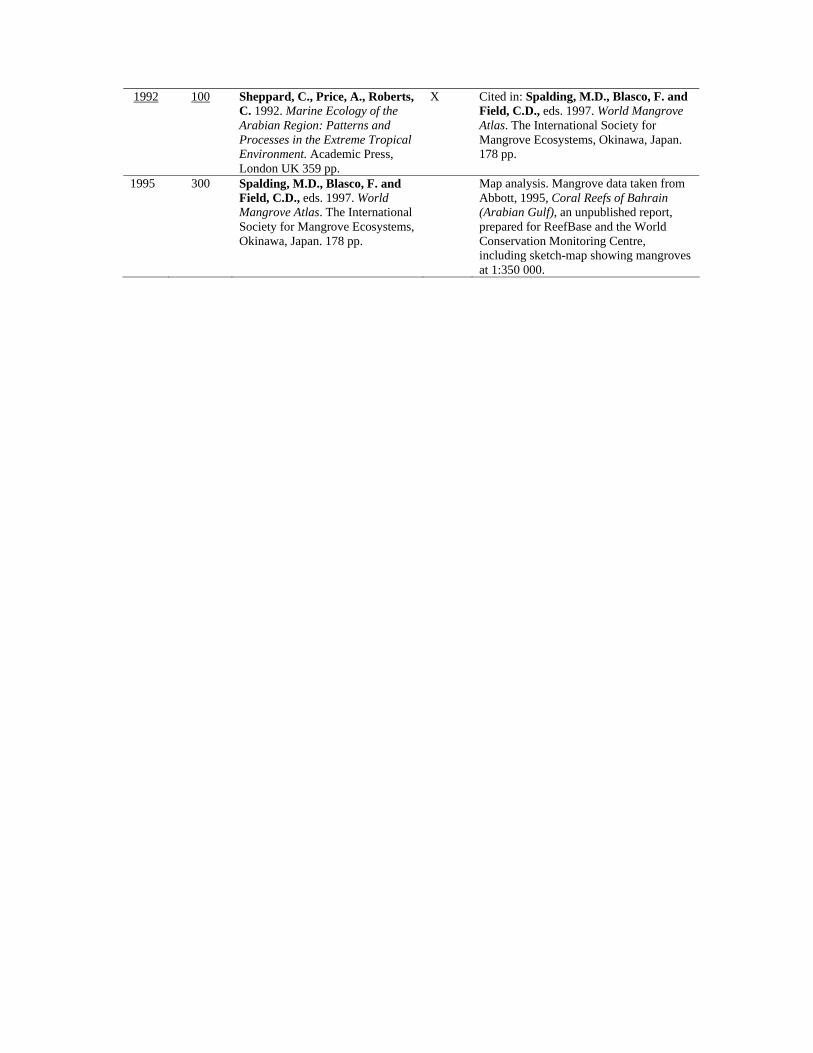
1992 100 Sheppard, C., Price, A., Roberts, C. 1992. Marine Ecology of the Arabian Region: Patterns and Processes in the Extreme Tropical Environment. Academic Press, London UK 359 pp.
X Cited in: Spalding, M.D., Blasco, F. and Field, C.D., eds. 1997. World Mangrove Atlas. The International Society for Mangrove Ecosystems, Okinawa, Japan. 178 pp.
1995 300 Spalding, M.D., Blasco, F. and Field, C.D., eds. 1997. World Mangrove Atlas. The International Society for Mangrove Ecosystems, Okinawa, Japan. 178 pp.
Map analysis. Mangrove data taken from Abbott, 1995, Coral Reefs of Bahrain (Arabian Gulf), an unpublished report, prepared for ReefBase and the World Conservation Monitoring Centre, including sketch-map showing mangroves at 1:350 000.
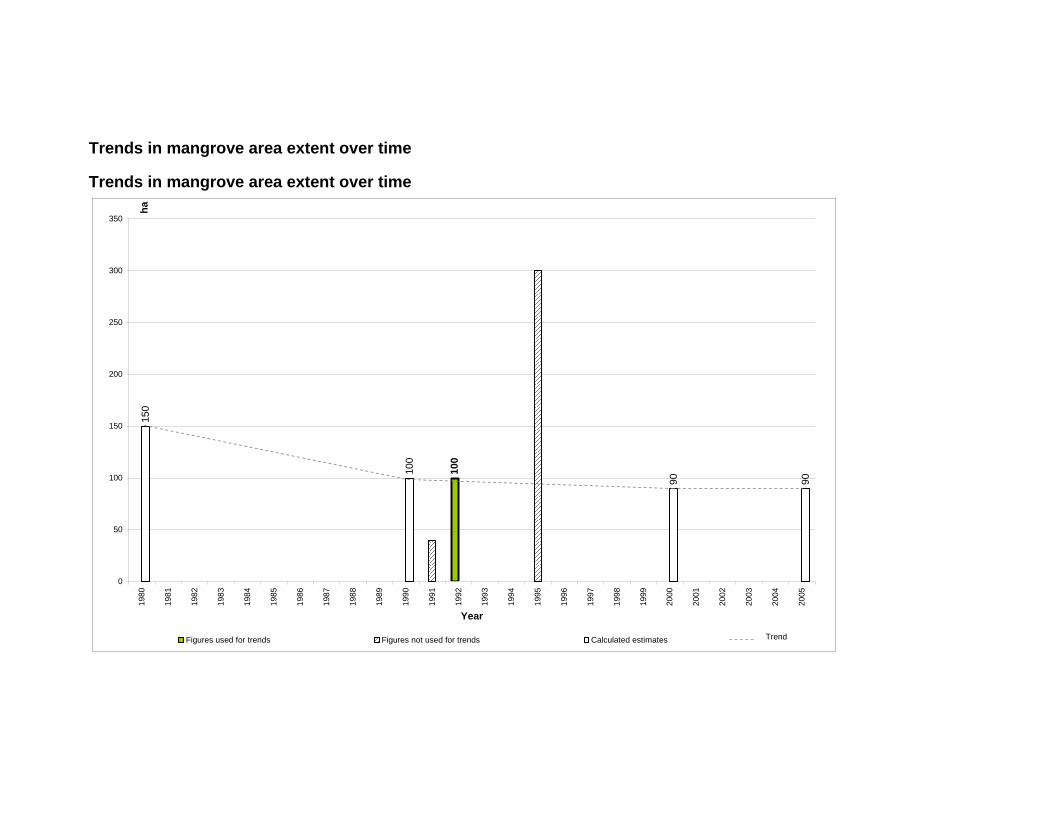
Trends in mangrove area extent over time
Trends in mangrove area extent over time
150
100
90 90
100
0
50
100
150
200
250
300
350
1980
1981
1982
1983
1984
1985
1986
1987
1988
1989
1990
1991
1992
1993
1994
1995
1996
1997
1998
1999
2000
2001
2002
2003
2004
2005
Year
ha
Figures used for trends Figures not used for trends Calculated estimates Trend
6
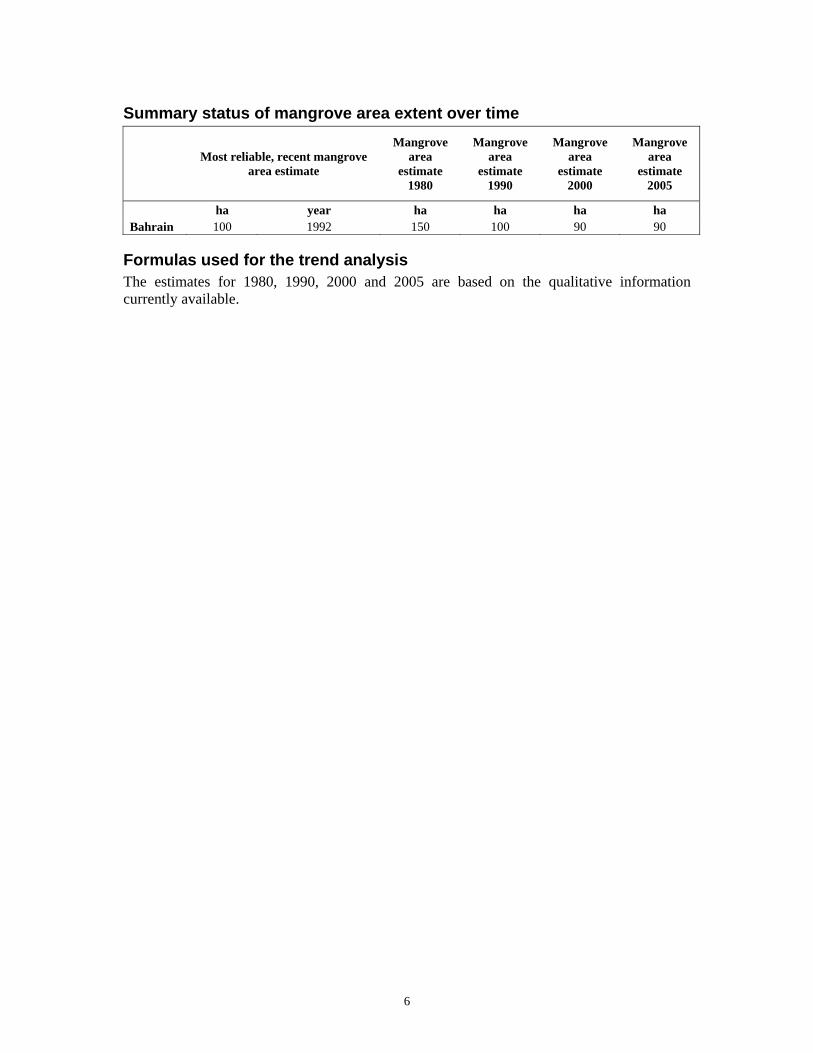
Summary status of mangrove area extent over time
Most reliable, recent mangrove area estimate
Mangrove area
estimate 1980
Mangrove area
estimate 1990
Mangrove area
estimate 2000
Mangrove area
estimate 2005
ha year ha ha ha ha Bahrain 100 1992 150 100 90 90
Formulas used for the trend analysis The estimates for 1980, 1990, 2000 and 2005 are based on the qualitative information currently available.
7
Bangladesh Vegetation description, uses and threats Bangladesh has a coastline of approximately 700 kilometres and highly dynamic, being influenced by a high degree of riverine sediments and the impact of the frequent cyclones. The result is a combination of erosion and accretion of land which involve also the mangrove ecosystem. Mangrove biodiversity in Bangladesh is very high, and the country can count with more than 20 different true mangrove species. The Ganges, Brahmaputra and Meghna Rivers form one of the largest areas of river delta in the world and the largest continuous area of mangroves in the world, the Sundarbans approximately 1 000 000 ha spread between India and Bangladesh. The Sundarbans Forest Reserve, is found in the south-eastern part of the delta, around Khulna. The process for the institution of the Reserve began in 1875 when the area then assigned to be protected by legislation was 541 800 ha. The physical boundary of the reserve has changed several times over the years, and the creation of the protected area ended in 1932/1933; the limit of the Reserve has not changed since then. The Sundarbans Reserved Forest appears to have been relatively well protected and the area has been kept relatively intact. Revilla (et. al, 1998) estimates the area of mangroves in this area at around 411 000 ha. Here the predominant tree species are sundri (Heritiera littoralis syn H. minor), representing the 63 percent of the total composition, and gewa (Excoecaria agallocha), around the 20 percent. Less frequent species are passur (Xylocarpus mekongensis syn Carapa moluccensis), goran (Ceriops decandra syn Ceriops roxburghiana), kankra (Bruguiera gymnorrhiza), keora (Sonneratia apetala) and baen (Avicennia officinalis). This closed forest has a dense canopy usually 8 to 15 m high, however taller trees of 25 to 30 m in height may also be found. Tree diameters range from 10 to 20 cm although it may reach up to 45 cm under favourable conditions. The Sundarbans currently represents the only natural mangrove forest left in Bangladesh, while in the past natural mangroves were also found in two other areas, the Chokoria Sundarbans and Teknaf. The first one was an important natural mangrove area, located in the Matamuhuri River, despite the preparation of two working plans, the first one in 1911 and the second one in 1978, mangroves have been heavily exploited and gradually converted to shrimp farms. By the late 1980s the mangroves were totally destroyed and the 30 percent of the area is now completely converted to shrimp farms. The main causes of mangrove removal in Teknaf have been identified in the over exploitation of wood, development of human settlements and shrimp farming. Even though nowadays the Sundarbans represent the only natural mangrove forests in the country, significant additional mangrove areas have been planted and/or replanted in the Bay of Bengal. Bangladesh has a densely populated coastline and around ten million people living in coastal zones of Bangladesh rely directly or indirectly on these natural resources. Mangrove wood is widely used for timber and fuel; sundry sawlogs are useful for piling in saline zones, keora wood is especially used for decking and Nypa palms are often used as thatching materials. Shrimps, crabs, molluscs and finfish are taken from the surrounding waters. Apiculture is also an important industry for the country, which yields thousand of tons of honey and wax each year. The 2004 Indian Ocean Tsunami did not significantly affect the coast of Bangladesh, however the coastal zone is particularly impacted by tropical storms and tidal surges and Bangladesh has witnessed many natural calamities. Between 1797 and 1998, 67 major cyclones occurred,
8
causing a high number of fatalities and severe damages to resources and infrastructures; the 1991 cyclone, for example, killed approximately 139 000 people and generated economic losses of US$2.07 billion. Institutional arrangements which deals with disasters (the most dedicated agency being the Cyclone Preparedness Programme) have been set up in the country and several structural and non structural mitigation measures (e.g. cyclone shelters, coastal embankments, elevated housing, coastal afforestation, community preparedness, etc) have been implemented, even though still in a limited extent. Here the role of mangrove as shelterbelts to protect the coastline from natural hazards has long been recognised, for their services in protecting the soil erosion, the flood mitigation and the dissipation of the wave energy. The recognition of these benefits led to the development of a large mangrove plantation programme in 1966, which was undertaken mainly for conservation and production purposes but also for the creation of bioshields to help protect life and property from cyclones and tidal surges. About 170 000 ha are estimated to have been planted over the last four decades. Unfortunately in some areas, as in the Noakhali district, a relevant part of the plantation raised in the seventies has been converted for urban development. A green belt establishment programme was completed in 2002 and several other programmes are currently underway to rehabilitate coastal forests. The success of past programmes however has been highly variable. The main responsibility for forest-related policy implementation in Bangladesh lies with the Forest Department and protection of the country against natural disasters is the main objective of the 1992 National Environment Policy which emphasizes maintenance of ecological balance and sustainable development. To support coastal forest rehabilitation, priorities include developing ecological knowledge and information, building capacity, accessing technical advice and financial assistance and improving cooperation and collaboration. Reference: EC/JRC. 2005. Mapping severe damage to S.E. Asia’s land cover following the Tsunami. http://tsunami.jrc.it/Reports/Tsunami_land_cover_change.pdf
FAO, UNEP. 1981. Tropical Forest Resources Assessment Project, Forest Resources of Tropical Asia. FAO, UNEP, 475 pp.
FAO. 2007f. Proceedings of the workshop on coastal area planning and management in Asian tsunami-affected countries, 27–29 September 2006, Bangkok, Thailand. RAP PUBLICATION 2007/06 (www.fao.org/forestry/site/35734/en)
Haque, Md. E. 2004. Management and conservation of mangroves at Bangladesh. In: Bhandari, B.B., Kashio, M. and Nakamura, R. Mangroves in Southeast Asia. Status, Issues and Challenges. pp: 135-150. Ramsar Center Japan. Institute for Global Environmental Strategies (IGES). Tokyo.
Islam, M.A. 2004. personal communication.
Revilla, Ahmand, Hussain. 1998. Final Report: Forest inventory of the Sunderbans Reserved Forest.
Spalding, M.D., Blasco, F. and Field, C.D., eds. 1997. World Mangrove Atlas. The International Society for Mangrove Ecosystems, Okinawa, Japan. 178 pp.
True mangrove species checklist Acanthus ilicifolius Acrostichum aureum Aegialitis rotundifolia Aegiceras corniculatum Avicennia alba Avicennia marina Avicennia officinalis Bruguiera gymnorrhiza
9
Bruguiera sexangula Ceriops decandra Ceriops tagal Excoecaria agallocha Excoecaria indica Heritiera fomes Heritiera littoralis Kandelia candel Nypa fruticans Rhizophora apiculata Rhizophora mucronata Sonneratia apetala Sonneratia caseolaris Xylocarpus granatum Xylocarpus mekongensis
National level mangrove estimates Year Area
(ha) Source Tre
nd Methodology/Comments
1959 407 000 Chowdhry. nd. Working Plan for the Sundarbans Forest Division from the period of 1960-1961 to 1979-1980. Vol. 3 East Pakistan Government Press. Tejgaon, Dacca.
FAO, UNEP. 1981. Tropical Forest Resources Assessment Project, Forest Resources of Tropical Asia. FAO, UNEP, 475 pp. Interpretation of aerial photos.
1978 400 000 Department of Forests. 1978. Country report for the Eight World Forestry Congress 1978. Jakarta, Indonesia Oct. 16-28, 1978 – Dacca.
Cited in: FAO, UNEP. 1981. Tropical Forest Resources Assessment Project, Forest Resources of Tropical Asia. FAO, UNEP, 475 pp. This figure refers to the extent of mangroves in the Sundarbans.
1978 600 000 FAO. 1978. Country report on Forestry Communities Practising Shifting Cultivation in Bangladesh UNFPA/FAO project - Bangkok
Cited in: FAO, UNEP. 1981. Tropical Forest Resources Assessment Project, Forest Resources of Tropical Asia. FAO, UNEP, 475 pp.
1979 405 000 FAO, UNEP. 1981. Tropical Forest Resources Assessment Project, Forest Resources of Tropical Asia. FAO, UNEP, 475 pp.
This figure should be considered as the extent of mangroves in the Sundarbans.
10
Year Area (ha)
Source Trend
Methodology/Comments
1981 430 587 Ibid X Combined National Level Mangrove Estimate based on remote sensing studies. The Sundarbans (405 608 ha, ref year 1981): Hammermaster, E. T. 1981. Village Forest Inventory of Bangladesh: Inventory Results. Field Document No. 5. UNDP/FAO Project BGD/78/020 Cox's Bazar (8 000ha ref year 1980): Mangrove action project. The Late Friday News, 84th Edition. http://www.earthisland.org/map/ltfrn_84.htm Bhola CA (3565 ha ref year 1984), Chittagong CA (3 342 ha ref year 1984), Patuakhali CA (4 007 ha ref year 1984), Noakhali CA (6 065 ha ref year 1984): Drigo, R. Latif, M.A. Chowdhury, J.A. and Shaheduzzaman, M. 1987. The maturing mangrove plantations of the coastal afforestation project. Field document. FAO/UNDP/BGD/85/085, 200 pp.
1981 576 700 Spalding, M.D., Blasco, F. and Field, C.D., eds. 1997. World Mangrove Atlas. The International Society for Mangrove Ecosystems, Okinawa, Japan. 178 pp.
Map analysis. 1:500,000. Information for the Sundarbans was derived from World Bank, 1981, derived from updated and ground-truth in 1977 Landsat satellite imagery. Additional areas are largely plantation forest, taken from a detailed sketch map prepared for this work by N.A. Siddiqi, Bangladesh Forest Research Institute, drawn onto a 1:1,000,000 base map. World Bank. 1981. Bangladesh-General Vegetation. Sheet No. G8. 1:500 000. Prepared by the Resource Planning Unit, Agriculture and Rural Development Department, World Bank, Washington.
1982 625 374 Habib, M.G. 1982. Improvements of Sundarbans by enrichment plantation. In: Proceedings of the Second Bangladesh National Conference on forestry, Dhaka. p 150-155.
Cited in: Rahman, L.M. 1986. Monograph on Mangrove Forest. Asia Pakistan Forest Inst., Forest Education Div., Thesis (M.Sc.), University of Peshawar (Pakistan) 176 pp. The "Year" is the publication year.
1983 410 000 Wacharakitty, S. 1983. Mangrove Ecosystem in General. In: ESCAP/UNESCO/NRCT Regional Remote Sensing Training Course of Mangrove Ecosystem. p. 22-33. Bangkok, Nov. 28-Dec. 16 1983
Cited in: FAO. 1994. Mangrove forest management guidelines. FAO Forestry Paper 117. Rome, 319 pp. The figure probably refers to the mangroves of the Sundarbans.
1984 417 013 Hamilton, L.S. and Snedaker, S.C., eds. Handbook for Mangrove Area Management. IUCN, Gland, Switzerland. UNESCO Paris & East-West Center, Hawaii; 123 pp
This figure could refer to the Sundarbans
1985 395 600 Anonymous. 2000. Mangrove Conservation and Development Bangladesh Country Profile
Secondary reference, no primary source provided.
11
Year Area (ha)
Source Trend
Methodology/Comments
1986 587 380 Mahmood. N. 1986. Effects of shrimp farming and other impacts on mangroves of Bangladesh. Paper presented at the Third Session of IPFC Workshop on Inland Fish/Mangrove, 22–25 June, Bangkok, Thailand.
Secondary reference, no primary source provided. "Year" is the publication year.
1991 671 779 Forest Department. 1991. Development of Forest Resources in Bangladesh.
No definition of methodology provided. The “Year” is the publication year.
1993 710 000 Khatun, Fahmida, Akter. 1998. Depreciation of forest Resources in Bangladesh. Research Rep. No. 157 - Bangladesh Institute Bangladesh Institute of Development Studies. Dhaka, Bangladesh.
Secondary reference, no primary source provided. .
1995 634 300 Siddiqi. 1995. Personal communication
Cited in: Spalding, M.D., Blasco, F. and Field, C.D., eds. 1997. World Mangrove Atlas. The International Society for Mangrove Ecosystems, Okinawa, Japan. 178 pp.
1995 476 215 Ibid. X Combined National Level Mangrove Estimate based on remote sensing studies. The Sundarbans (399 682 ha, ref year 1995): Revilla Jr. J. A. V et. al. 1998. Final Report: Forest Inventory of the natural forests and Forest plantation (Sundarbans Forest Division) Mandela Agricultural Development Corporation and Forest Department, Ministry of Environment and Forests. Bangladesh. Cox's Bazar (0 ha; mangroves have been converted to shrimp farm since late 1980s) Bhola CA (12 420 ha ref year 1996), Chittagong CA (20 042 ha ref year 1996) Patuakhali CA (9 848 ha ref year 1996), Noakhali CA (34 223 ha ref year 1996): Revilla Jr. J. A. V et. al. 1998. Final Report: Forest Inventory of the natural forests and Forest plantation (Coastal Afforestation) Mandela Agricultural Development Corporation and Forest Department, MOEF. Bangladesh.
2000 630 000 Aizpuru, M., Achard, F., and Blasco, F. 2000. Global Assessment of Cover Change of the Mangrove Forests using satellite imagery at medium to high resolution. In EEC Research project n 15017-1999-05 FIED ISP FR – Joint Research center, Ispra.
National level estimate based on extrapolation from a remote sensing case study in Ganges and literature review.
2000 735 000 Jalil, M.A. 2000. Country report submitted to the 18th Asia Pacific Forestry Commission, held in Australia. 2000
Cited in: Quazi Liaquat Ali, 2005. Draft Country report on forest resources of Bangladesh for FRA 2005. Unpublished.

12
Trends in mangrove area extent over time
428
000
460
000
476
000
476
215
476
000
150 000
300 000
450 000
600 000
750 000
1959
1970
1971
1972
1973
1974
1975
1976
1977
1978
1979
1980
1981
1982
1983
1984
1985
1986
1987
1988
1989
1990
1991
1992
1993
1994
1995
1996
1997
1998
1999
2000
2001
2002
2003
2004
2005
Year
ha
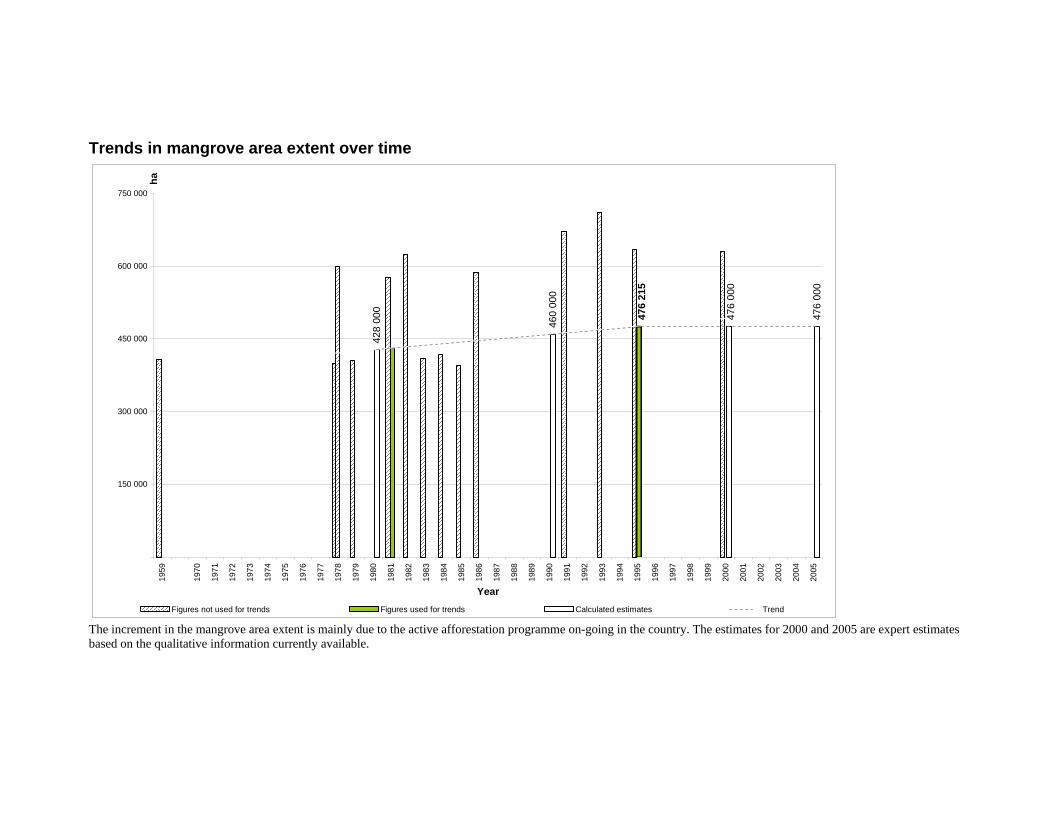
Figures not used for trends Figures used for trends Calculated estimates Trend The increment in the mangrove area extent is mainly due to the active afforestation programme on-going in the country. The estimates for 2000 and 2005 are expert estimates based on the qualitative information currently available.
14
Summary status of mangrove area extent over time
Most reliable, recent mangrove area estimate
Mangrove area
estimate 1980
Mangrove area
estimate 1990
Mangrove area
estimate 2000
Mangrove area
estimate 2005
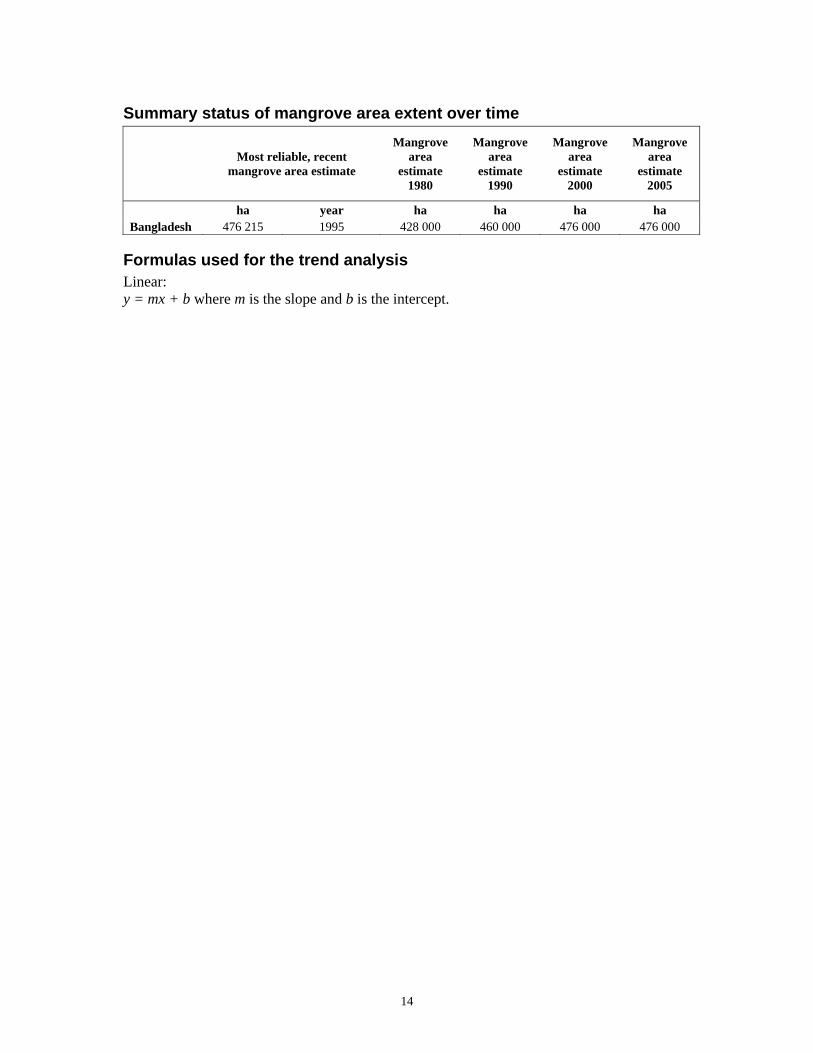
ha year ha ha ha ha Bangladesh 476 215 1995 428 000 460 000 476 000 476 000
Formulas used for the trend analysis Linear: y = mx + b where m is the slope and b is the intercept.
15
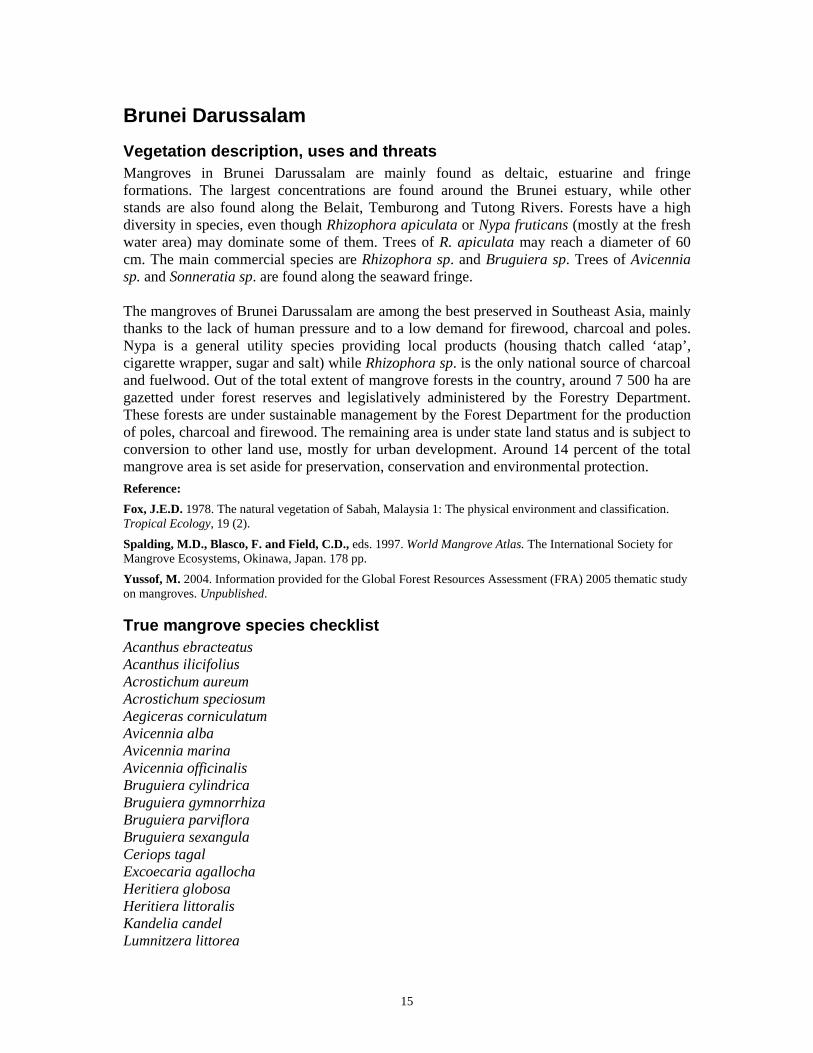
Brunei Darussalam Vegetation description, uses and threats Mangroves in Brunei Darussalam are mainly found as deltaic, estuarine and fringe formations. The largest concentrations are found around the Brunei estuary, while other stands are also found along the Belait, Temburong and Tutong Rivers. Forests have a high diversity in species, even though Rhizophora apiculata or Nypa fruticans (mostly at the fresh water area) may dominate some of them. Trees of R. apiculata may reach a diameter of 60 cm. The main commercial species are Rhizophora sp. and Bruguiera sp. Trees of Avicennia sp. and Sonneratia sp. are found along the seaward fringe. The mangroves of Brunei Darussalam are among the best preserved in Southeast Asia, mainly thanks to the lack of human pressure and to a low demand for firewood, charcoal and poles. Nypa is a general utility species providing local products (housing thatch called ‘atap’, cigarette wrapper, sugar and salt) while Rhizophora sp. is the only national source of charcoal and fuelwood. Out of the total extent of mangrove forests in the country, around 7 500 ha are gazetted under forest reserves and legislatively administered by the Forestry Department. These forests are under sustainable management by the Forest Department for the production of poles, charcoal and firewood. The remaining area is under state land status and is subject to conversion to other land use, mostly for urban development. Around 14 percent of the total mangrove area is set aside for preservation, conservation and environmental protection. Reference: Fox, J.E.D. 1978. The natural vegetation of Sabah, Malaysia 1: The physical environment and classification. Tropical Ecology, 19 (2).
Spalding, M.D., Blasco, F. and Field, C.D., eds. 1997. World Mangrove Atlas. The International Society for Mangrove Ecosystems, Okinawa, Japan. 178 pp.
Yussof, M. 2004. Information provided for the Global Forest Resources Assessment (FRA) 2005 thematic study on mangroves. Unpublished.
True mangrove species checklist Acanthus ebracteatus Acanthus ilicifolius Acrostichum aureum Acrostichum speciosum Aegiceras corniculatum Avicennia alba Avicennia marina Avicennia officinalis Bruguiera cylindrica Bruguiera gymnorrhiza Bruguiera parviflora Bruguiera sexangula Ceriops tagal Excoecaria agallocha Heritiera globosa Heritiera littoralis Kandelia candel Lumnitzera littorea
16
Lumnitzera racemosa Nypa fruticans Rhizophora apiculata Rhizophora mucronata Scyphiphora hydrophyllacea Sonneratia alba Sonneratia caseolaris Sonneratia ovata Sonneratia x gulngai Xylocarpus granatum
National level mangrove estimates
Year Area (ha) Source Trend Methodology/Comments
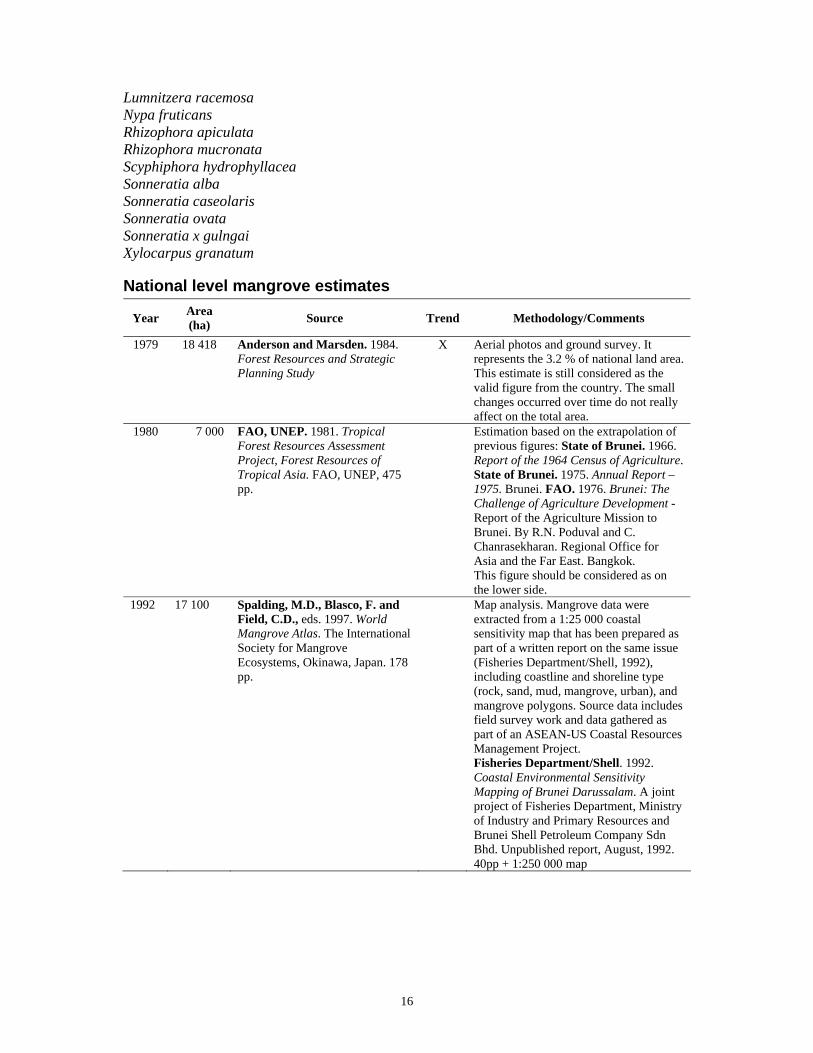
1979 18 418 Anderson and Marsden. 1984. Forest Resources and Strategic Planning Study
X Aerial photos and ground survey. It represents the 3.2 % of national land area. This estimate is still considered as the valid figure from the country. The small changes occurred over time do not really affect on the total area.
1980 7 000 FAO, UNEP. 1981. Tropical Forest Resources Assessment Project, Forest Resources of Tropical Asia. FAO, UNEP, 475 pp.
Estimation based on the extrapolation of previous figures: State of Brunei. 1966. Report of the 1964 Census of Agriculture. State of Brunei. 1975. Annual Report – 1975. Brunei. FAO. 1976. Brunei: The Challenge of Agriculture Development - Report of the Agriculture Mission to Brunei. By R.N. Poduval and C. Chanrasekharan. Regional Office for Asia and the Far East. Bangkok. This figure should be considered as on the lower side.
1992 17 100 Spalding, M.D., Blasco, F. and Field, C.D., eds. 1997. World Mangrove Atlas. The International Society for Mangrove Ecosystems, Okinawa, Japan. 178 pp.
Map analysis. Mangrove data were extracted from a 1:25 000 coastal sensitivity map that has been prepared as part of a written report on the same issue (Fisheries Department/Shell, 1992), including coastline and shoreline type (rock, sand, mud, mangrove, urban), and mangrove polygons. Source data includes field survey work and data gathered as part of an ASEAN-US Coastal Resources Management Project. Fisheries Department/Shell. 1992. Coastal Environmental Sensitivity Mapping of Brunei Darussalam. A joint project of Fisheries Department, Ministry of Industry and Primary Resources and Brunei Shell Petroleum Company Sdn Bhd. Unpublished report, August, 1992. 40pp + 1:250 000 map
17
Year Area (ha) Source Trend Methodology/Comments
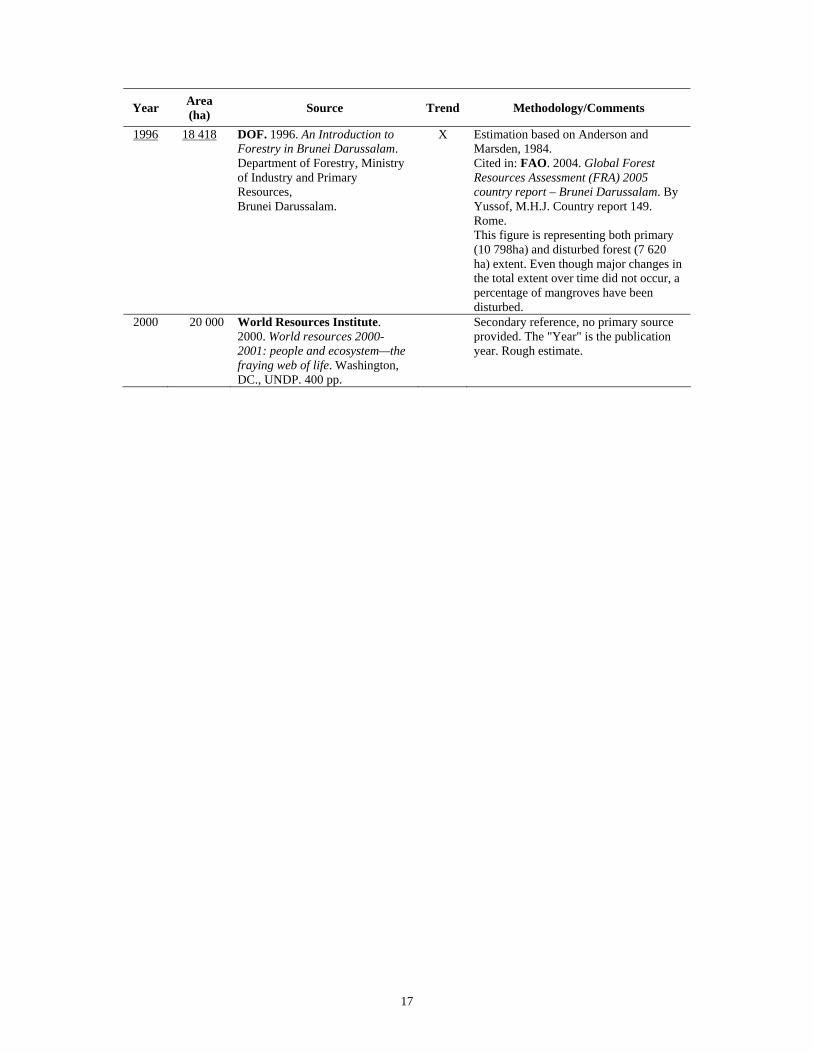
1996 18 418 DOF. 1996. An Introduction to Forestry in Brunei Darussalam. Department of Forestry, Ministry of Industry and Primary Resources, Brunei Darussalam.
X Estimation based on Anderson and Marsden, 1984. Cited in: FAO. 2004. Global Forest Resources Assessment (FRA) 2005 country report – Brunei Darussalam. By Yussof, M.H.J. Country report 149. Rome. This figure is representing both primary (10 798ha) and disturbed forest (7 620 ha) extent. Even though major changes in the total extent over time did not occur, a percentage of mangroves have been disturbed.
2000 20 000 World Resources Institute. 2000. World resources 2000-2001: people and ecosystem—the fraying web of life. Washington, DC., UNDP. 400 pp.
Secondary reference, no primary source provided. The "Year" is the publication year. Rough estimate.
Trends in mangrove area extent over time
18
418
18
400
18
400
18
400
18
400
5 000
10 000
15 000
20 000
1980
1981
1982
1983
1984
1985
1986
1987
1988
1989
1990
1991
1992
1993
1994
1995
1996
1997
1998
1999
2000
2001
2002
2003
2004
2005
Year
ha
Figures used for trends Figures not used for trends Calculated estimates Trend
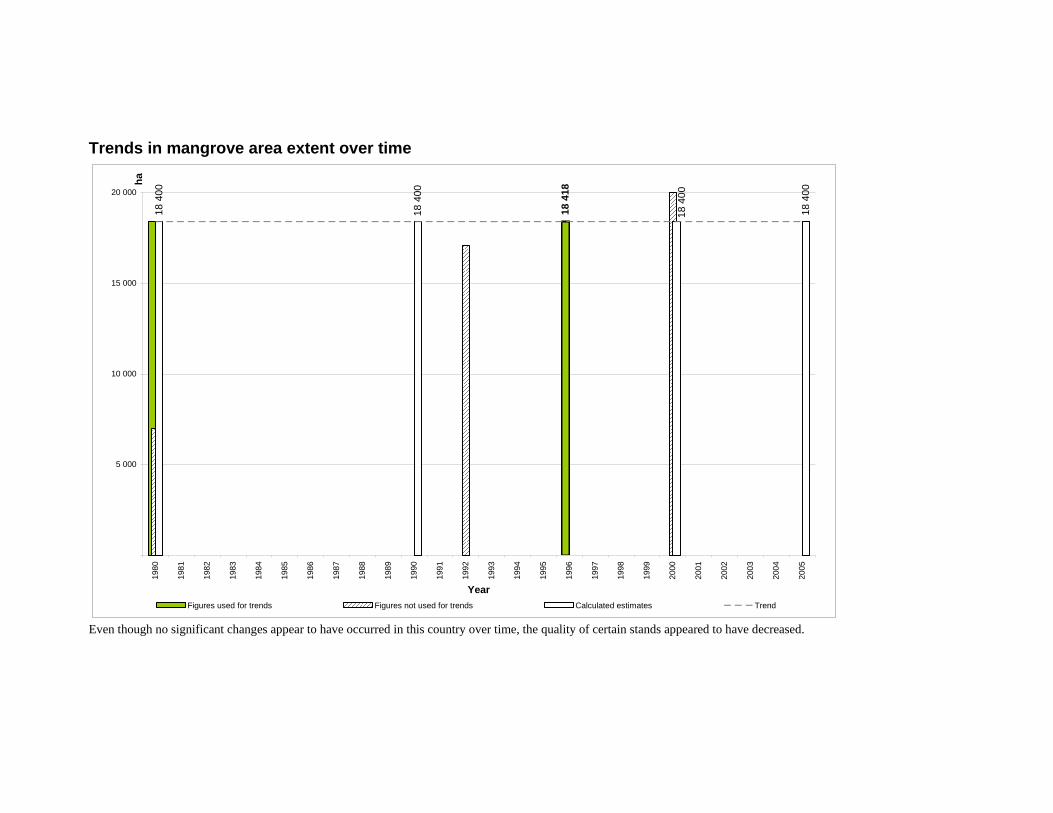
Even though no significant changes appear to have occurred in this country over time, the quality of certain stands appeared to have decreased.
19
Summary status of mangrove area extent over time
Most reliable, recent mangrove area estimate
Mangrove area
estimate 1980
Mangrove area
estimate 1990
Mangrove area
estimate 2000
Mangrove area
estimate 2005
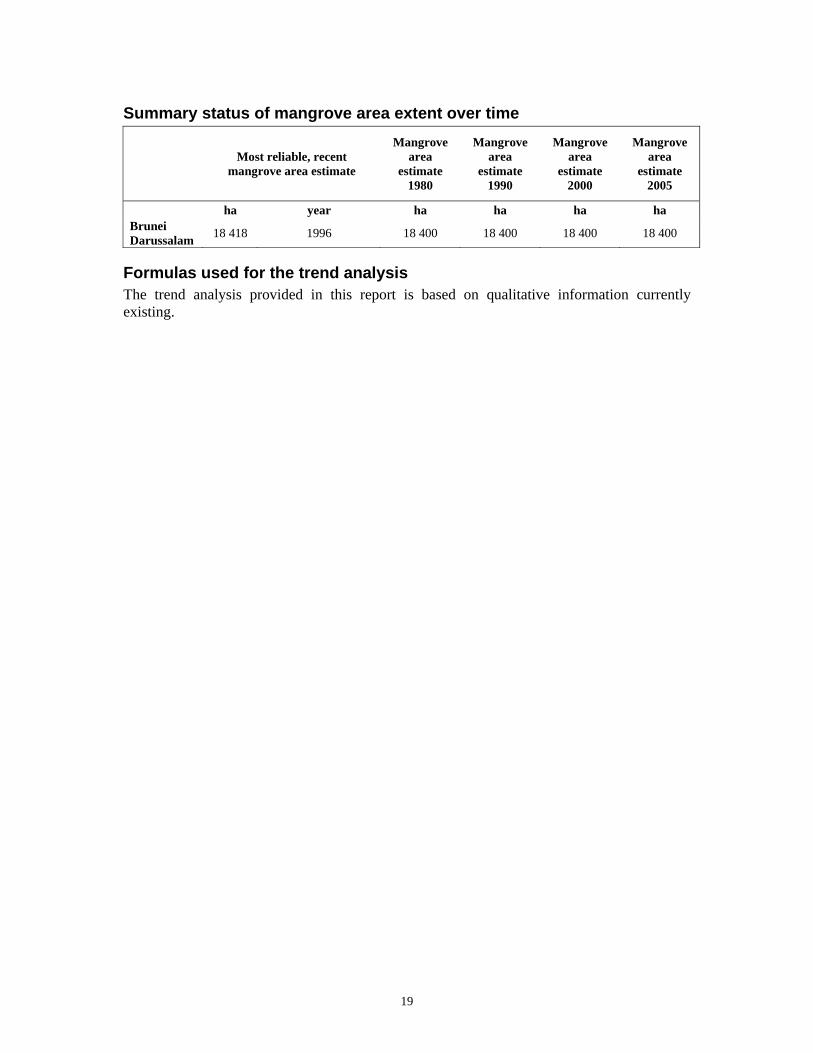
ha year ha ha ha ha Brunei Darussalam 18 418 1996 18 400 18 400 18 400 18 400
Formulas used for the trend analysis The trend analysis provided in this report is based on qualitative information currently existing.

20
Cambodia Vegetation description, uses and threats Mangroves are found along almost all the coasts of Cambodia with the largest areas being found at the main estuaries (e.g. Peam Krasop, Andong Tuk, Sre Ambel, Chak Sre Cham, and Prek Kampot), where mangroves cover an average area from 200 m to 300 m from the estuaries Narrow belts, which can eventually continue fairly far up the water courses, can also occur around Veal Renh and Kompong Som Bays and north of Kas Kong up to the border with Thailand. Three different types of mangroves are found in Cambodia: riverine, basin and fringing mangroves. The first are mainly found in Prek Piphot, Prek Koh Poa, Stung Kep, Stung Meteoeuk, Peam Krasoap, Kampot and Sihanouville. Bays with dense forests are found in Kampong Soam, Koh Kong and Kep bays; while relevant fringing mangroves communities can be found in complex ecosystems of Koh Kapic and Koh Kong Province. Sixteen of true mangrove species are found growing in this country; the most common are Rhizophora apiculata (syn R. conjugata), R. mucronata, Bruguiera gymnorrhiza, B. sexangula, Ceriops tagal, C. decandra, Sonneratia alba, Lumnitzera littorea, L. racemosa and Xylocarpus granatum (syn. Carapa obovata). Phoenix paludosa, an elegant, short-stemmed (3 to 8 m) palm is often found in clumps. The general mangrove tree height varies between 10 and 15 m, while the much more abundant shrubs vary between 5 and 10 m. In more elevated areas mangroves are often found above the line of flood and the ecosystem is dominated by Rhizophora apiculata trees of height between 2 and 3 m, with a thick tangle of aerial roots; they can be replaces in certain localities by Bruguiera gymnorrhiza. The soil is blackish, very moist and criss-crossed by a mesh of fine roots. In the hinterland of the mangrove swamps, where the water is almost always fresh, with salt water penetrating only at spring tides, trees of Bruguiera gymnorrhiza and Excoecaria agallocha can grow together with Melaleuca leucadendron (the major component of these associations) and species that can tolerate low quantity of salt in water, such as Melastoma villesum, Barringtonia spp., Hibiscus tiliaceus and Nypa fruticans Rural communities often still rely on mangroves for their livelihood and for the contribution to the local economy. Timber is harvested for the production of firewood and charcoal, especially for domestic consumption. In Kampot province and Kep Municipality some mangroves have been cleared for salt production. The cut off for fuelwood, charcoal and the change of land use to shrimp farming (mainly in Koh Kong Province) represent the most important causes of mangrove losses during the past two decades, while some more mangrove lands have been reclaimed for agriculture purposes. A first attempt of mangrove mapping for management purposes was undertook by the Department of Fisheries after the Regime; mangroves gained some sort of protection, especially from overharvesting of wood, under the Fisheries Law in which these ecosystems, as nursery area for several fish species, were also included. No conservation or management activities were undertaken in the country during the Khmer Rouge regime (1975 to 1979) and although conservation has become important since then, there are still no proposals for the full protection or active management of mangrove areas. Since the end of the 1970s mangroves are under the jurisdiction of the Department of Fisheries of the Ministry of Agriculture, Forestry and Fisheries. However some mangrove
21
forests growing in protected areas (e.g. Ream National Park, Batum Sakor National Park and Peam Krasoap Wildlife Sanctuary – which protect the most important mangrove forest in Cambodia) are under the jurisdiction of the Ministry of Environment. Information on mangrove plantations are not numerous but by local communities have been involved in some reforestation activities in a degraded area in Sihanoukville (mostly with Rhizophora apiculata and R. mucronata). Reference: FAO, UNEP. 1981. Tropical Forest Resources Assessment Project, Forest Resources of Tropical Asia. FAO, UNEP, 475 pp.
Sour, Kim. 2004. Current status of mangroves in Cambodia. In: Bhandari, B.B., Kashio, M. and Nakamura, R. Mangroves in Southeast Asia. Status, Issues and Challenges. pp: 135-150. Ramsar Center Japan. Institute for Global Environmental Strategies (IGES)., Tokyo.
Spalding, M.D., Blasco, F. and Field, C.D., eds. 1997. World Mangrove Atlas. The International Society for Mangrove Ecosystems, Okinawa, Japan. 178 pp.
True mangrove species checklist Avicennia alba Avicennia marina Avicennia officinalis Bruguiera gymnorrhiza Bruguiera sexangula Ceriops decandra Ceriops tagal Excoecaria agallocha Lumnitzera littorea Lumnitzera racemosa Nypa fruticans Rhizophora apiculata Rhizophora mucronata Sonneratia alba Sonneratia caseolaris Xylocarpus granatum
National level mangrove estimates
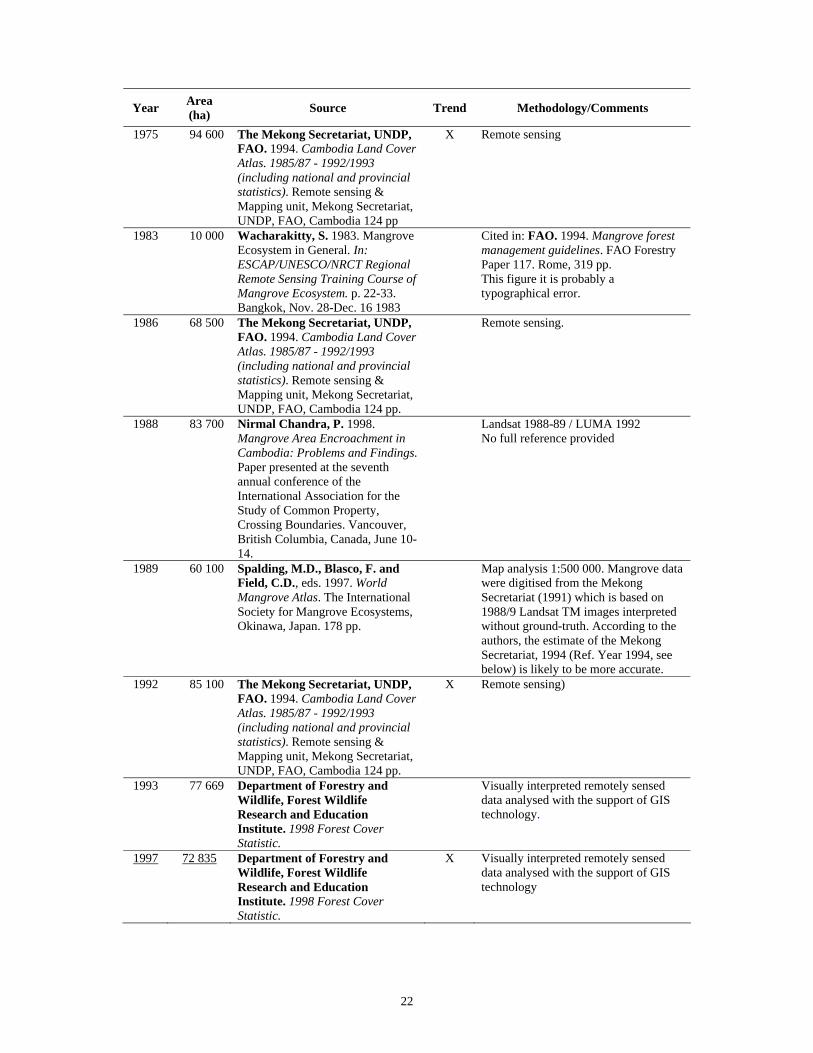
Year Area (ha) Source Trend Methodology/Comments
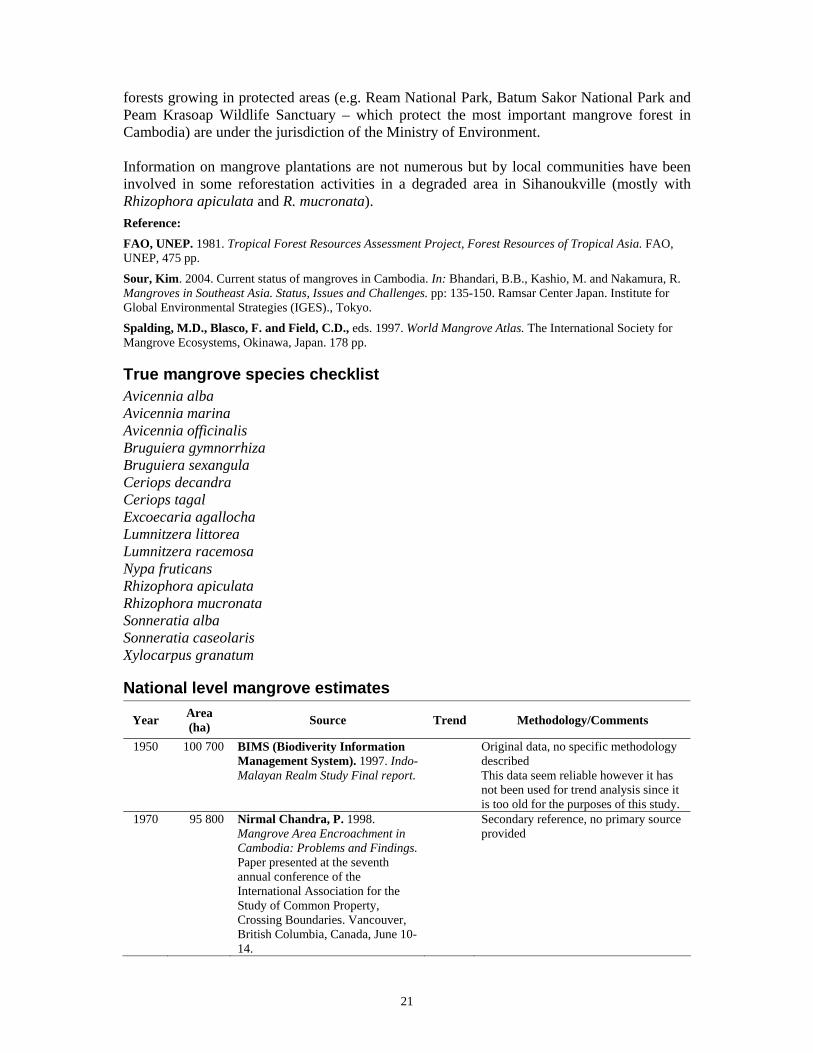
1950 100 700 BIMS (Biodiverity Information Management System). 1997. Indo-Malayan Realm Study Final report.
Original data, no specific methodology described This data seem reliable however it has not been used for trend analysis since it is too old for the purposes of this study.
1970 95 800 Nirmal Chandra, P. 1998. Mangrove Area Encroachment in Cambodia: Problems and Findings. Paper presented at the seventh annual conference of the International Association for the Study of Common Property, Crossing Boundaries. Vancouver, British Columbia, Canada, June 10-14.
Secondary reference, no primary source provided
22
Year Area (ha) Source Trend Methodology/Comments
1975 94 600 The Mekong Secretariat, UNDP, FAO. 1994. Cambodia Land Cover Atlas. 1985/87 - 1992/1993 (including national and provincial statistics). Remote sensing & Mapping unit, Mekong Secretariat, UNDP, FAO, Cambodia 124 pp
X Remote sensing
1983 10 000 Wacharakitty, S. 1983. Mangrove Ecosystem in General. In: ESCAP/UNESCO/NRCT Regional Remote Sensing Training Course of Mangrove Ecosystem. p. 22-33. Bangkok, Nov. 28-Dec. 16 1983
Cited in: FAO. 1994. Mangrove forest management guidelines. FAO Forestry Paper 117. Rome, 319 pp. This figure it is probably a typographical error.
1986 68 500 The Mekong Secretariat, UNDP, FAO. 1994. Cambodia Land Cover Atlas. 1985/87 - 1992/1993 (including national and provincial statistics). Remote sensing & Mapping unit, Mekong Secretariat, UNDP, FAO, Cambodia 124 pp.
Remote sensing.
1988 83 700 Nirmal Chandra, P. 1998. Mangrove Area Encroachment in Cambodia: Problems and Findings. Paper presented at the seventh annual conference of the International Association for the Study of Common Property, Crossing Boundaries. Vancouver, British Columbia, Canada, June 10-14.
Landsat 1988-89 / LUMA 1992 No full reference provided
1989 60 100 Spalding, M.D., Blasco, F. and Field, C.D., eds. 1997. World Mangrove Atlas. The International Society for Mangrove Ecosystems, Okinawa, Japan. 178 pp.
Map analysis 1:500 000. Mangrove data were digitised from the Mekong Secretariat (1991) which is based on 1988/9 Landsat TM images interpreted without ground-truth. According to the authors, the estimate of the Mekong Secretariat, 1994 (Ref. Year 1994, see below) is likely to be more accurate.
1992 85 100 The Mekong Secretariat, UNDP, FAO. 1994. Cambodia Land Cover Atlas. 1985/87 - 1992/1993 (including national and provincial statistics). Remote sensing & Mapping unit, Mekong Secretariat, UNDP, FAO, Cambodia 124 pp.
X Remote sensing)
1993 77 669 Department of Forestry and Wildlife, Forest Wildlife Research and Education Institute. 1998 Forest Cover Statistic.
Visually interpreted remotely sensed data analysed with the support of GIS technology.
1997 72 835 Department of Forestry and Wildlife, Forest Wildlife Research and Education Institute. 1998 Forest Cover Statistic.
X Visually interpreted remotely sensed data analysed with the support of GIS technology
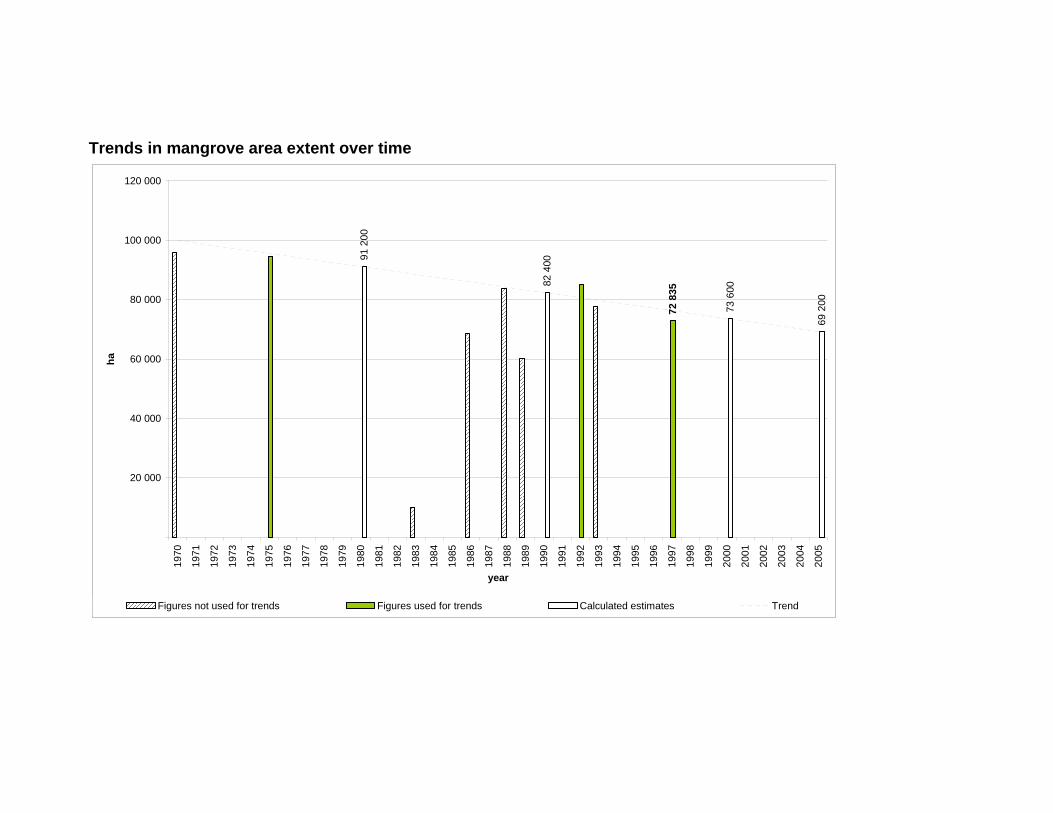
Trends in mangrove area extent over time
91
200
82
400
73
600
69
200
72
835
20 000
40 000
60 000
80 000
100 000
120 00019
70
1971
1972
1973
1974
1975
1976
1977
1978
1979
1980
1981
1982
1983
1984
1985
1986
1987
1988
1989
1990
1991
1992
1993
1994
1995
1996
1997
1998
1999
2000
2001
2002
2003
2004
2005
year
ha
Figures not used for trends Figures used for trends Calculated estimates Trend

24
Summary status of mangrove area extent over time
Most reliable, recent mangrove area estimate
Mangrove area
estimate 1980
Mangrove area
estimate 1990
Mangrove area
estimate 2000
Mangrove area
estimate 2005
ha year ha ha ha ha Cambodia 72 835 1997 91 200 82 400 73 600 69 200
Formulas used for the trend analysis Linear: y = mx + b where m is the slope and b is the intercept.

25
China Vegetation description, uses and threats Mangroves are widespread along the coasts of mainland China, Taiwan and Hong Kong. In mainland China and Taiwan they are often found growing in small stands of relatively stunted and degraded trees and are mainly concentrated on the southernmost coasts, in Hainan Island and Taiwan. Most of the coast of Hainan was once fringed with mangroves, but these have largely been destroyed over time and now mangroves can be found only in some locations which however include some well-developed forests. In Taiwan the largest stand is located along the West Coast, especially in Tanshui estuary and further south, in the area of the Chan-Yun-Chia reserve. In Hong Kong mangroves are concentrated in tiny areas with dwarf trees, with the largest mangrove forest being found in the Mai Po Marsh, in the North West, on the shores of Deep Bay. Mai Po is highly managed and most of its area now consists of shrimp ponds, or Gei wais, and fish ponds. Some patches of mangroves are still visible between shrimp ponds, while the areas of fish ponds are completely deforested. Even though reduced in areas an appreciable tree diversity can still be found in mainland China and Taiwan, while only eight mangrove species are found in Hong Kong, i.e. Acanthus ilicifolius, Aegiceras corniculatum, Avicennia marina, Bruguiera cylindrica, B. gymnorrhiza, Acrostichum aureum, Excoecaria agallocha and Kandelia candel. Mangroves in this country have been used extensively for firewood and charcoal production, however the use of these coastal resources for timber and tannins has decreased together with their extent. Uses in traditional medicine though still remain important. A large area of mangroves have been reclaimed for agriculture and for shrimp ponds. In Hong Kong population density with a consequent high human pressure on coastal ecosystems; here almost all of the coastal areas have been drained and reclaimed for agriculture, fishponds, salt pans and urban development. To contrast this negative trend plantation and reforestation efforts have been increasing during the last twenty years (especially since 1990s) and around 2 700 ha have been planted or reforested so far, mainly for conservation of biodiversity and coastal protection purposes. Also, mangroves are increasingly being promoted as strip forests for coastal protection, consisting typically of Kandelia candel planted in front of reclaimed land. These plantations resulted to be very effective in reducing the breaching and erosion of dykes during cyclones. It is also important to remark that mangrove destruction is now decreasing and mangroves are currently being protected in thirty-nine nature reserves (twenty-eight in Hanan, 5 in Taiwan and 6 in Hong Kong). Reference: FAO. 2007b. Thematic Study on Mangroves – Asia - Working Paper (in press) www.fao.org/forestry/site/mangrove
Spalding, M.D., Blasco, F. & Field, C.D., eds. 1997 World Mangrove Atlas. The International Society for Mangrove Ecosystems, Okinawa, Japan. 178 pp.
Su Chunyu & Chen Xuefeng. 2005. Information provided for the Global Forest Resources Assessment (FRA) 2005 thematic study on mangroves. Unpublished.
26
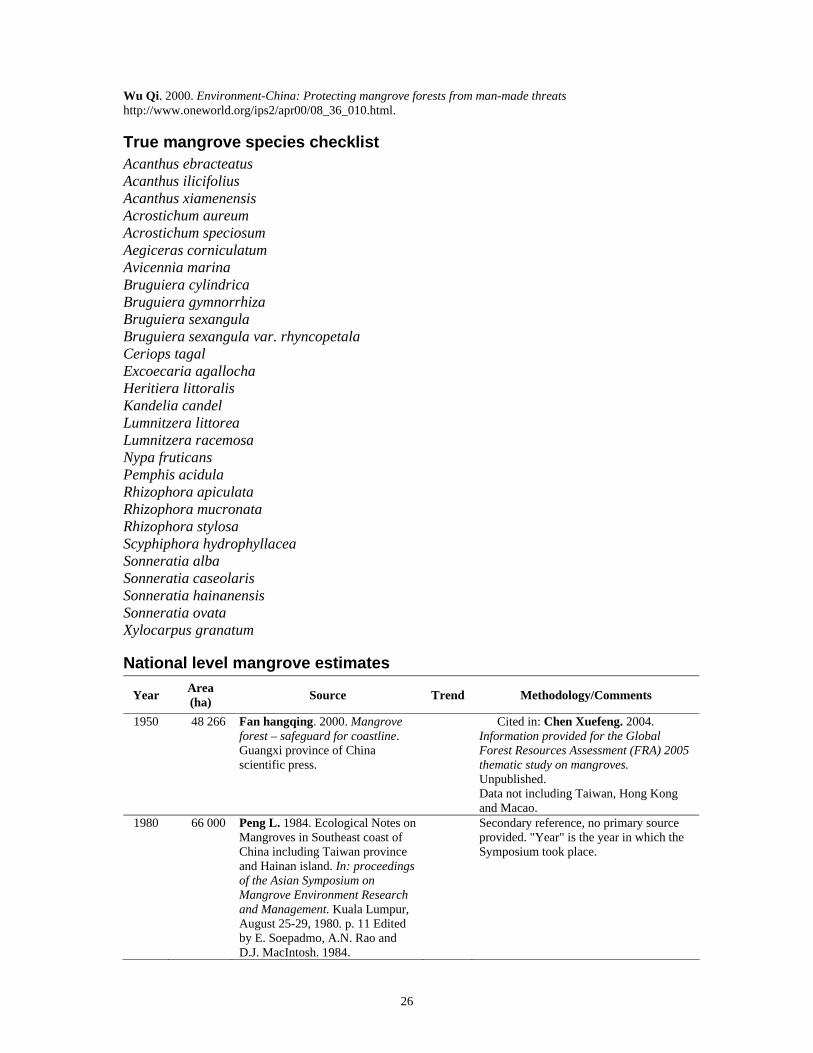
Wu Qi. 2000. Environment-China: Protecting mangrove forests from man-made threats http://www.oneworld.org/ips2/apr00/08_36_010.html.
True mangrove species checklist Acanthus ebracteatus Acanthus ilicifolius Acanthus xiamenensis Acrostichum aureum Acrostichum speciosum Aegiceras corniculatum Avicennia marina Bruguiera cylindrica Bruguiera gymnorrhiza Bruguiera sexangula Bruguiera sexangula var. rhyncopetala Ceriops tagal Excoecaria agallocha Heritiera littoralis Kandelia candel Lumnitzera littorea Lumnitzera racemosa Nypa fruticans Pemphis acidula Rhizophora apiculata Rhizophora mucronata Rhizophora stylosa Scyphiphora hydrophyllacea Sonneratia alba Sonneratia caseolaris Sonneratia hainanensis Sonneratia ovata Xylocarpus granatum
National level mangrove estimates
Year Area (ha) Source Trend Methodology/Comments
1950 48 266 Fan hangqing. 2000. Mangrove forest – safeguard for coastline. Guangxi province of China scientific press.
Cited in: Chen Xuefeng. 2004. Information provided for the Global Forest Resources Assessment (FRA) 2005 thematic study on mangroves. Unpublished. Data not including Taiwan, Hong Kong and Macao.
1980 66 000 Peng L. 1984. Ecological Notes on Mangroves in Southeast coast of China including Taiwan province and Hainan island. In: proceedings of the Asian Symposium on Mangrove Environment Research and Management. Kuala Lumpur, August 25-29, 1980. p. 11 Edited by E. Soepadmo, A.N. Rao and D.J. MacIntosh. 1984.
Secondary reference, no primary source provided. "Year" is the year in which the Symposium took place.
27
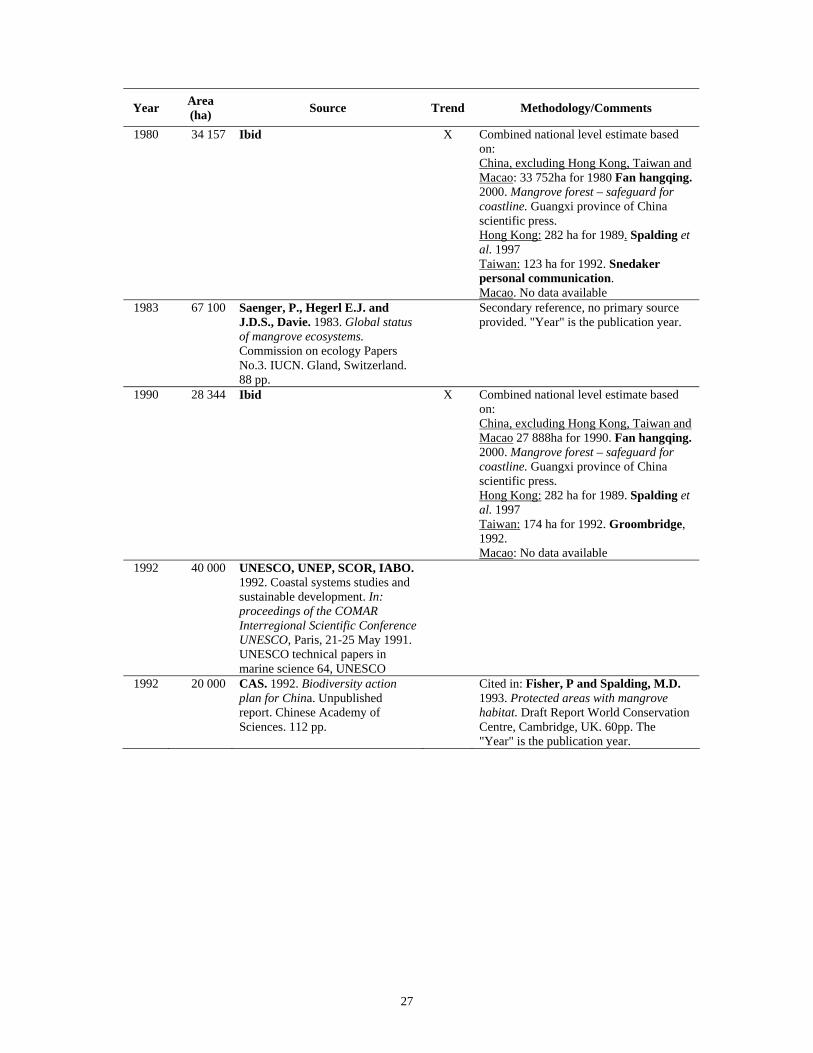
Year Area (ha) Source Trend Methodology/Comments
1980 34 157 Ibid X Combined national level estimate based on: China, excluding Hong Kong, Taiwan and Macao: 33 752ha for 1980 Fan hangqing. 2000. Mangrove forest – safeguard for coastline. Guangxi province of China scientific press. Hong Kong: 282 ha for 1989. Spalding et al. 1997 Taiwan: 123 ha for 1992. Snedaker personal communication. Macao. No data available
1983 67 100 Saenger, P., Hegerl E.J. and J.D.S., Davie. 1983. Global status of mangrove ecosystems. Commission on ecology Papers No.3. IUCN. Gland, Switzerland. 88 pp.
Secondary reference, no primary source provided. "Year" is the publication year.
1990 28 344 Ibid X Combined national level estimate based on: China, excluding Hong Kong, Taiwan and Macao 27 888ha for 1990. Fan hangqing. 2000. Mangrove forest – safeguard for coastline. Guangxi province of China scientific press. Hong Kong: 282 ha for 1989. Spalding et al. 1997 Taiwan: 174 ha for 1992. Groombridge, 1992. Macao: No data available
1992 40 000 UNESCO, UNEP, SCOR, IABO. 1992. Coastal systems studies and sustainable development. In: proceedings of the COMAR Interregional Scientific Conference UNESCO, Paris, 21-25 May 1991. UNESCO technical papers in marine science 64, UNESCO
1992 20 000 CAS. 1992. Biodiversity action plan for China. Unpublished report. Chinese Academy of Sciences. 112 pp.
Cited in: Fisher, P and Spalding, M.D. 1993. Protected areas with mangrove habitat. Draft Report World Conservation Centre, Cambridge, UK. 60pp. The "Year" is the publication year.
28
Year Area (ha) Source Trend Methodology/Comments
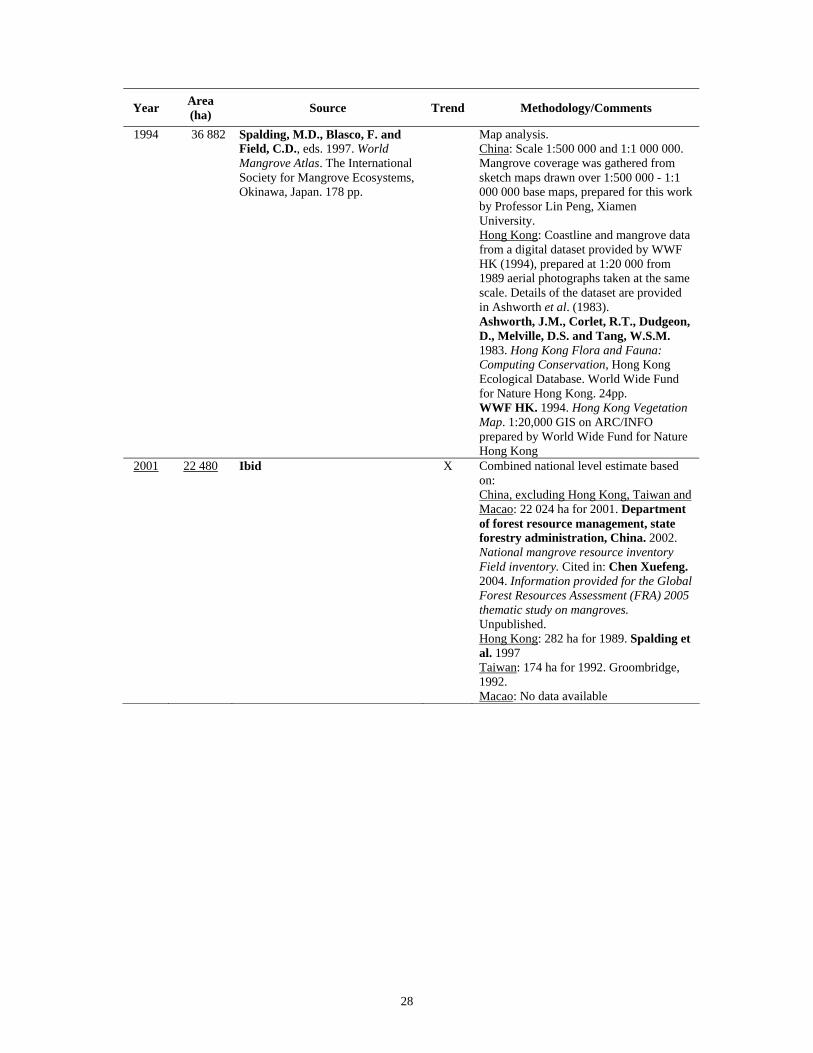
1994 36 882 Spalding, M.D., Blasco, F. and Field, C.D., eds. 1997. World Mangrove Atlas. The International Society for Mangrove Ecosystems, Okinawa, Japan. 178 pp.
Map analysis. China: Scale 1:500 000 and 1:1 000 000. Mangrove coverage was gathered from sketch maps drawn over 1:500 000 - 1:1 000 000 base maps, prepared for this work by Professor Lin Peng, Xiamen University. Hong Kong: Coastline and mangrove data from a digital dataset provided by WWF HK (1994), prepared at 1:20 000 from 1989 aerial photographs taken at the same scale. Details of the dataset are provided in Ashworth et al. (1983). Ashworth, J.M., Corlet, R.T., Dudgeon, D., Melville, D.S. and Tang, W.S.M. 1983. Hong Kong Flora and Fauna: Computing Conservation, Hong Kong Ecological Database. World Wide Fund for Nature Hong Kong. 24pp. WWF HK. 1994. Hong Kong Vegetation Map. 1:20,000 GIS on ARC/INFO prepared by World Wide Fund for Nature Hong Kong
2001 22 480 Ibid X Combined national level estimate based on: China, excluding Hong Kong, Taiwan and Macao: 22 024 ha for 2001. Department of forest resource management, state forestry administration, China. 2002. National mangrove resource inventory Field inventory. Cited in: Chen Xuefeng. 2004. Information provided for the Global Forest Resources Assessment (FRA) 2005 thematic study on mangroves. Unpublished. Hong Kong: 282 ha for 1989. Spalding et al. 1997 Taiwan: 174 ha for 1992. Groombridge, 1992. Macao: No data available
Trends in mangrove area extent over time
22
480
34
157
22
480 2
8 34
4
22
955
10 000
20 000
30 000
40 000
50 000
60 000
70 000
80 000
1950
1970
1971
1972
1973
1974
1975
1976
1977
1978
1979
1980
1981
1982
1983
1984
1985
1986
1987
1988
1989
1990
1991
1992
1993
1994
1995
1996
1997
1998
1999
2000
2001
2002
2003
2004
2005
Year
ha
Figures used for trends Figures not used for trends Calculated estimates Trend
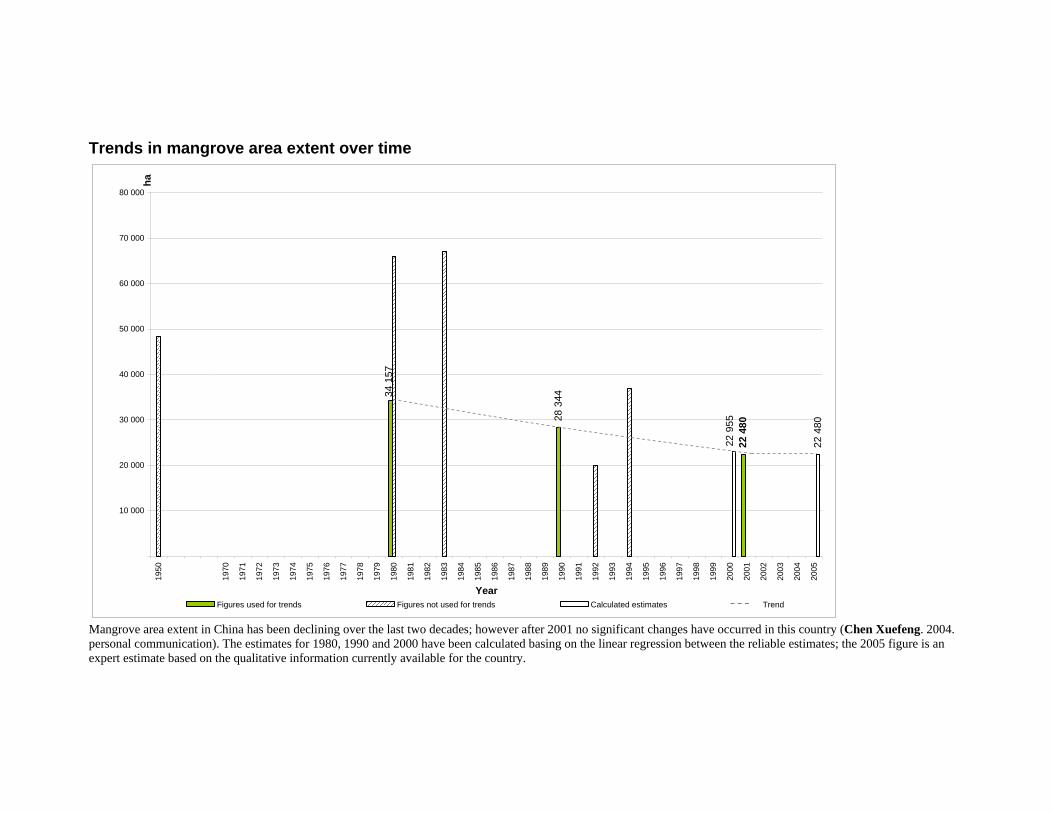
Mangrove area extent in China has been declining over the last two decades; however after 2001 no significant changes have occurred in this country (Chen Xuefeng. 2004. personal communication). The estimates for 1980, 1990 and 2000 have been calculated basing on the linear regression between the reliable estimates; the 2005 figure is an expert estimate based on the qualitative information currently available for the country.
30
Summary status of mangrove area extent over time
Most reliable, recent mangrove area estimate
Mangrove area
estimate 1980
Mangrove area
estimate 1990
Mangrove area
estimate 2000
Mangrove area
estimate 2005
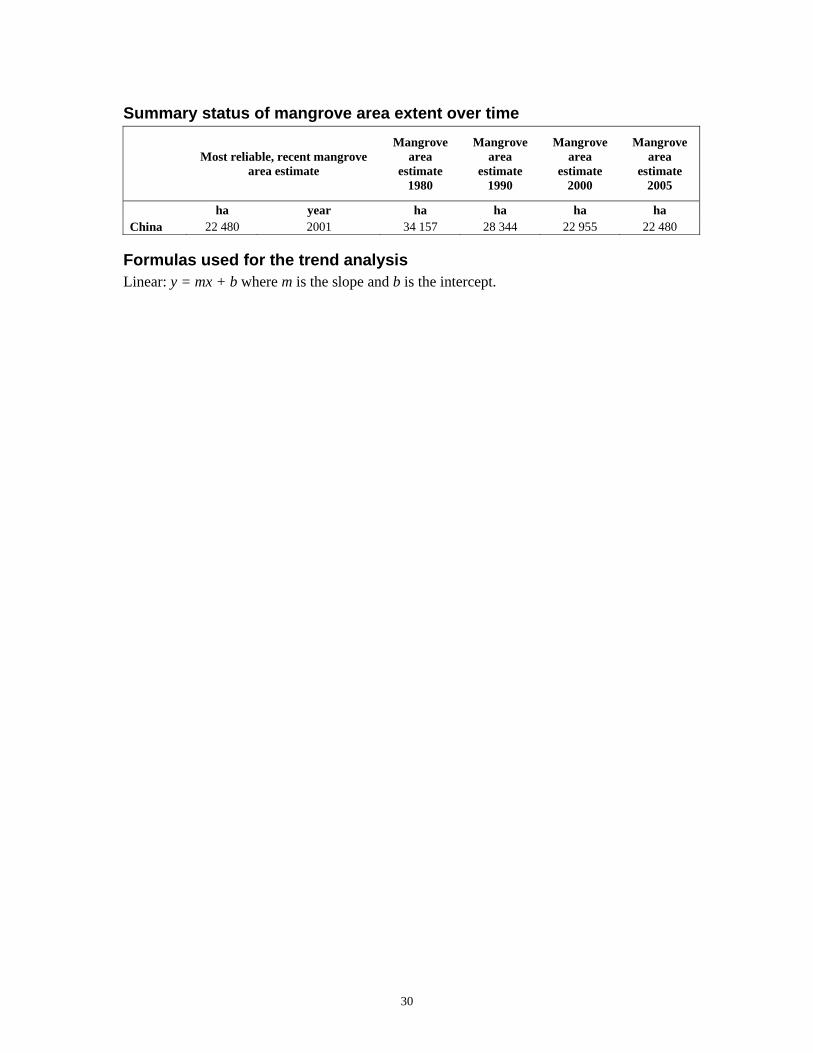
ha year ha ha ha ha China 22 480 2001 34 157 28 344 22 955 22 480
Formulas used for the trend analysis Linear: y = mx + b where m is the slope and b is the intercept.
31
India Vegetation description, uses and threats Mangrove forests are scattered along the 12 700 km Indian coastlines with about the 80 percent of India's mangroves are located along the East coast favoured by its more gentle slopes and the rich estuaries. Thirty-two true mangrove species are growing in India, with Heritiera sp. or, less commonly, Bruguiera sp. being the most widespread. In zones of the forest closer to the sea Heritiera sp. is replaced by Rhizophora sp. Mangrove forests in India grow as evergreen closed high forest that in some areas can reach up to 30 m or more in height, they are often two-storied, with a prevalence of trees growing maximum to 5-10 m in height in the underwood (e.g. Ceriops sp.). Other tree genera commonly found in India are Sonneratia spp., Avicennia spp and Excoecaria spp, shrubs and palms among which Acanthus sp. and Nypa fruticans. The largest mangrove area found in this country is growing in the Sundarbans National Park, West Bengal (UNESCO World Heritage site since 1987), which protects the 40 percent of the transboundary and well extended Sundarbans forest. Other forests of relevant interest are found in Gujarat and on the Andaman & Nicobar Islands, which have close affinities to the nearby Southeast Asian mangroves as well as the mangroves associated with the estuaries of the Mahanadi, Godavari, Krishna, and Cauvery Rivers. On the West coast, mangroves are fringing the estuaries of many small rivers, with interesting communities being found also in the arid coast around the Gulf of Kutch. The majority of estuarine mangrove areas in the country have human communities living close by (the Sundarbans forest for example have a resident population of some two million people). Local uses include extraction of fuelwood and of Nypa leaves for roofing materials, the production of honey and fisheries and traditional aquaculture. The production of firewood is another relevant use of mangroves, especially in the Gulf of Kutch, where it represents the only important source of firewood. In a number of areas of the East coast timber extraction is regulated by Forest Working Plans with detailed felling cycles varying from 20 to 100 years. Indian mangroves offer a very good habitat for many different animal species and are used as resting and feeding sites by a large variety of birds, both migratory and resident. Mangroves are also an important source of fodder for camels and cattle, and most accessible stands are often degraded because of their grazing. In certain areas of the country though the overexploitation of the resource has, led to serious mangrove losses; on the Andaman and Nicobar Islands only, for example, around 22 000 ha have been lost between 1987 and 1997. Mangrove losses have been caused also by the conversion of the land to other uses, such as for the salt production (especially in the Kutch region), or the construction of shrimp ponds, recently boosted also by the development of hatchery technology. In some areas polyculture techniques are applied and paddy cultivations are rotated with prawn farming. Large areas of land have also been reclaimed for agricultural purposes and urban development to respond to the increasing human pressure in all Indian areas; just to give an example Mumbay (Bombay) was built on an area that originally was a group of seven islands surrounded by mangroves. Another side effect of the heavily populated areas is the production of high quantities of runoff produced by urban areas, which, together with those of the agricultural land represent a current threat to mangroves’ health in the country.
32
Besides human threats, mangroves in India have to face many different natural hazards, such as cyclones, wind and tsunamis; even though thick and well structured forests may help reducing the impact of natural hazards on coastal areas (see page Error! Bookmark not defined. for further details), trees in the front lines often get damaged and uprooted by strong events. The 2004 Indian Ocean Tsunami had serious impacts also in India, where the destruction was amplified by the narrow continental shelf and higher poverty levels amplified tsunami destruction along the east coast of India in 2004. Rapid assessments showed that damages were less severe towards the north along the east coast. Mangroves were severely damaged in the Andaman and Nicobar Islands. The role played by mangroves during the 2004 Indian Ocean Tsunami differed from locality to locality. Even though mitigation effect for different sites should not be compared unless it can be determined that waves were of similar size, speed, and form (pertinent parameters in isolating the role of coastal forests), it appeared that where mangroves were still forming dense and thick forest (e.g. in The Nicobar Islands or in Pichavaram region of Cuddalore) they played a positive role, absorbing the energy of the waves, even though causing high damages to the forest itself. The values of mangroves as bio shields against wind and storm surges, in terms of reducing human death, residential house damages and loss of livestock have been recently assessed using the 1999 Orissa super cyclone as case study. The services provided by different type of coastal forests (mangroves and casuarinas trees) have also been analysed. Through her preliminary results Das (2007) highlighted that mangroves played a significant role and that mixed indigenous forests seems to have better mitigating capacity than casuarinas only. It has been generally agreed though that thin forest belts do not have the same beneficial effects, since the uprooted trees would be washed away inland, causing damages to infrastructures or, even worse, to human beings. The role of coastal shelterbelts in mitigating the impacts of natural disasters is well recognized in India, and policy-makers include them in their developmental programmes. The country learned from the lessons learned during the coastal plantation and mangrove rehabilitation implemented following the super cyclone of 1999 in the framework of the National Cyclone Risk Mitigation Project and bioshields were included as one of the components of the post-2004 Tsunami Reconstruction Programme (coordinated by the National Planning Commission). A National Mangrove Committee was established in India in 1976, superseded by a National Committee on Wetlands, Mangroves and Coral Reefs in 1986, as an advisory body to the Government of India on policy issues related to conservation and management of these ecosystems. Fifteen key mangrove areas, including all of the large sites already mentioned, were identified by this advisory body and Management Action Plans were prepared for all of them so to be administered by the state governments - with financial assistance from the Ministry of Environment and Forests. A number of sites have also been legally protected, including part of the Gulf of Kutch where some afforestation schemes have been undertaken, and the Great Andaman Biosphere Reserve. India has a long history of coastal plantations, and even though the needs of natural shelterbelts were emphasized after the December 2004 Indian Ocean Tsunami, plantations along the east coast were already carried out prior to the tsunami, generally with the main aim of increasing the economic benefits to local populations. Some rehabilitation activities to restore mangrove degraded areas have been undertaken in the country even prior to the Tsunami, by the state forest department, environmental foundations and NGOs; the M. S. Swaminathan Research Foundation, the major NGO involved in developing coastal shelterbelts, has recently restored 1 500 ha of degraded forest through a community based project. Other relevant players are the Covenant Centre for Development (CCD) (Grameen Foundation) and the Coastal Community Development Programme (CCDP). Coastal forest plantations have also been developed by the The Tamil Nadu Forest Department, which covered around 2 000 hectares of coastal land in
33
2005. Anawim, the International Ocean Institute, in collaboration with the Tamil Nadu Forest Department as part of an agroforestry programme, has also raised additional plantations. In addition to provide protection services, the established plantations (both mangroves and other coastal tree species) also help improving the local livelihood of local communities, by providing fruits and other non wood forest products. Dialogue and cooperation between implementing agencies (NGOs, state department, etc) and local communities are being taken into account in the country, as well as the use of a solid and sound science on the forest characteristics (length, thick, species composition, etc) needed to offer a proper protection to the coast. Reference: Bioinformatics Centre (National Institute of Oceanography). 1998. Mangroves of India. http://www.indian-ocean.org/bioinformatics/mangrove/mangcd/main.htm
Das, Saudamini. 2007. Evaluation of storm protection functions — a case study of mangrove forest in Orissa, India and the 1999 super cyclone. In FAO. 2007. Coastal protection in the aftermath of the Indian Ocean tsunami: What role for forests and trees?. Proceedings of the Regional Technical Workshop, Khao Lak, Thailand, 28–31 August 2006. Compiled and edited by Braatz, S., Fortuna, S, Broadhead, J. and Leslie, R. In press. (www.fao.org/forestry/tsunami/coastalprotection)
Duvuru, N. 2007. Use of coastal shelterbelts along the east coast of India. In FAO. 2007. Coastal protection in the aftermath of the Indian Ocean tsunami: What role for forests and trees?. Proceedings of the Regional Technical Workshop, Khao Lak, Thailand, 28–31 August 2006. Compiled and edited by Braatz, S., Fortuna, S, Broadhead, J. and Leslie, R. In press. (www.fao.org/forestry/tsunami/coastalprotection)
FAO. 2007a. Coastal protection in the aftermath of the Indian Ocean tsunami: What role for forests and trees? Proceedings of the Regional Technical Workshop, Khao Lak, Thailand, 28–31 August 2006. Compiled and edited by Braatz, S., Fortuna, S, Broadhead, J. and Leslie, R. In press. (www.fao.org/forestry/tsunami/coastalprotection)
FAO. 2007b. The role of coastal forests in the mitigation of tsunami impacts. Prepared by Forbes, K. FAO Regional Office for Asia and the Pacific. In press
Forest Survey of India 2001. State of Forest Report, 2001. Forest Survey of India, MOEF, GOI, India.
Ravishankar, T., M. Navamuniyammal, L. Gnanappazham, Satya Shree Nayak, Gopal Chandra Mahapatra and V. Selvam. 2004. Atlas of Mangrove Wetlands of India, Part III : Orissa Chennai, M.S. Swaminathan Research Foundation, xv, 102 p., figs., maps.
Spalding, M.D., Blasco, F. & Field, C.D., eds. 1997. World Mangrove Atlas. The International Society for Mangrove Ecosystems, Okinawa, Japan. 178 pp.
True mangrove species checklist Acanthus ilicifolius Acrostichum aureum Aegialitis rotundifolia Aegiceras corniculatum Avicennia alba Avicennia marina Avicennia officinalis Bruguiera cylindrica Bruguiera gymnorrhiza Bruguiera parviflora Bruguiera sexangula Ceriops decandra Ceriops tagal Cynometra ramiflora Excoecaria agallocha Heritiera fomes
34
Heritiera kanikensis Heritiera littoralis Kandelia candel Lumnitzera racemosa Nypa fruticans Rhizophora apiculata Rhizophora mucronata Rhizophora stylosa Rhizophora lamarckii Scyphiphora hydrophyllacea (rare) Sonneratia alba Sonneratia apetala Sonneratia caseolaris Sonneratia griffithii Xylocarpus granatum Xylocarpus mekongensis
National level mangrove estimates
Year Area (ha) Source Trend Methodology/Comments
1957 638 818 Waheed Khan. 1957. Cited in: Chaudhuri, A.B. and Choudhury, A. 1994. Mangroves of the Sundarbans. Vol. 1. India. The IUCN Wetlands Programme. Bangkok, Thailand, IUCN. This figure could include also water.
1957 571 808 Mathauda, G.S. 1957. The mangrove of India. In Proceedings of the Mangrove Symposium. p. 66-97. Calcutta.
Cited in: Chaudhuri, A.B. and Choudhury, A. 1994. Mangroves of the Sundarbans. Vol. 1. India. The IUCN Wetlands Programme. The breakdown is provided.
1963 681 976 Sidhu. 1963. Studies on Mangrove. National Academy of Sciences. Vol 33b Part 1. p. 129-136.
Cited in: FAO. 1982. Management and utilization of mangroves in Asia and the Pacific. FAO Environment Paper 3. 160 pp. This extent includes also water.
1963 689 876 Andaman and Nicobar Islands; Andra Pradesh, Gujarat, Maharashtra, Orissa, Tamil Nadu, West Bengal: Sidhu. 1963. Studies on Mangrove. National Academy of Sciences. Vol 33b Part 1. p. 129-136. Goa, Karnataka: Untawale, A.G. 1984. Present Status of Mangrove Along the Coast of India. In: proceedings of the Asian Symposium on Mangrove Environment Research and Management, Kuala Lumpur, August 25-29, 1980. Edited by E. Soepadmo, A.N. Rao and D.J. MacIntosh. 1984. p.57-64. Kerala: Sparse mangroves.
Combined National Level Mangrove Estimate. This figure should be considered as on the higher side.
1975 356 500 Blasco, F. 1975. The Mangroves of India. Institut Francais de Pondichery. Pondichery.
Cited in: FAO. 1982. Management and utilization of mangroves in Asia and the Pacific. FAO Environment Paper 3. 160 pp.
35
Year Area (ha) Source Trend Methodology/Comments
1980 91 000 FAO, UNEP. 1981. Tropical Forest Resources Assessment Project, Forest Resources of Tropical Asia. FAO, UNEP, 475 pp.
Based on the information provided by Champion, H.G. and Seth, S.K. 1968. A Revised Survey of the Forest Types of India. Publication Division, Government of India - Delhi. Anon. 1976. Atlas of Forest Resources of India. National Atlas Organization. Calcutta. The area has been updated to year 1980 on the basis of annual deforestation rates.
1980 506 702 Ibid X All the most reliable information available per province has been analysed and processed through the regression analysis. The 1980 figures obtained for each region 1980 have been used.
1982 404 600 Forest Survey of India. 1987. The state of Forest Report 1987. Forest Survey of India, MOEF, GOI, India
Interpretation of 1981-1983 LANDSAT – MSS imageries; resolution 80 m; scale of interpretation: 1:1 million. Breakdown provided per State/Union Territory. The “year” is the mid-year of the imagery data period.
1983 96 000 Wacharakitty, S. 1983. Mangrove Ecosystem in General. In: ESCAP/UNESCO/NRCT Regional Remote Sensing Training Course of Mangrove Ecosystem. p. 22-33. Bangkok, Nov. 28-Dec. 16 1983
Cited in: FAO. 1994. Mangrove forest management guidelines. FAO Forestry Paper 117. Rome, 319 pp.
1986 425 500 Forest Survey of India. 1989. State of Forest Report 1989. Forest Survey of India, MOEF, GOI, India.
Interpretation of 1985-1987 LANDSAT – MSS imageries; resolution 30 m; scale of interpretation: 1:250 000. Breakdown provided per State/Union Territory. The “year” is the mid-year of the imagery data period. Cited in: FSI 2001. State of Forest Report, 2001. Forest Survey of India, MOEF, GOI, India. And FAO 2005. Global Forest Resources Assessment (GFRA) 2005 country report - India. Unpublished.
1987 674 000 Government of India. 1987. Mangroves in India. Government of India, Ministry of Environment & Forests, New Delhi. 150 pp.
Secondary reference, no primary source provided. The "Year" is the publication year.
1987 420 000 Jagtap, T.G., Chavan, V.S. and Untawale, A.G. 1993. Mangrove Ecosystem of India: A need for Protection. Ambio 22 (4).
Remote sensing, the figure it is not very accurate.
1988 424 400 Forest Survey of India. 1991. The State of Forest Report 1991. Forest Survey of India, MOEF, GOI, India
Interpretation of 1987-1989 LANDSAT – MSS imageries; resolution 30 m; scale of interpretation: 1:250 000. Breakdown provided per State/Union Territory. The “year” is the mid-year of the imagery data period.
36
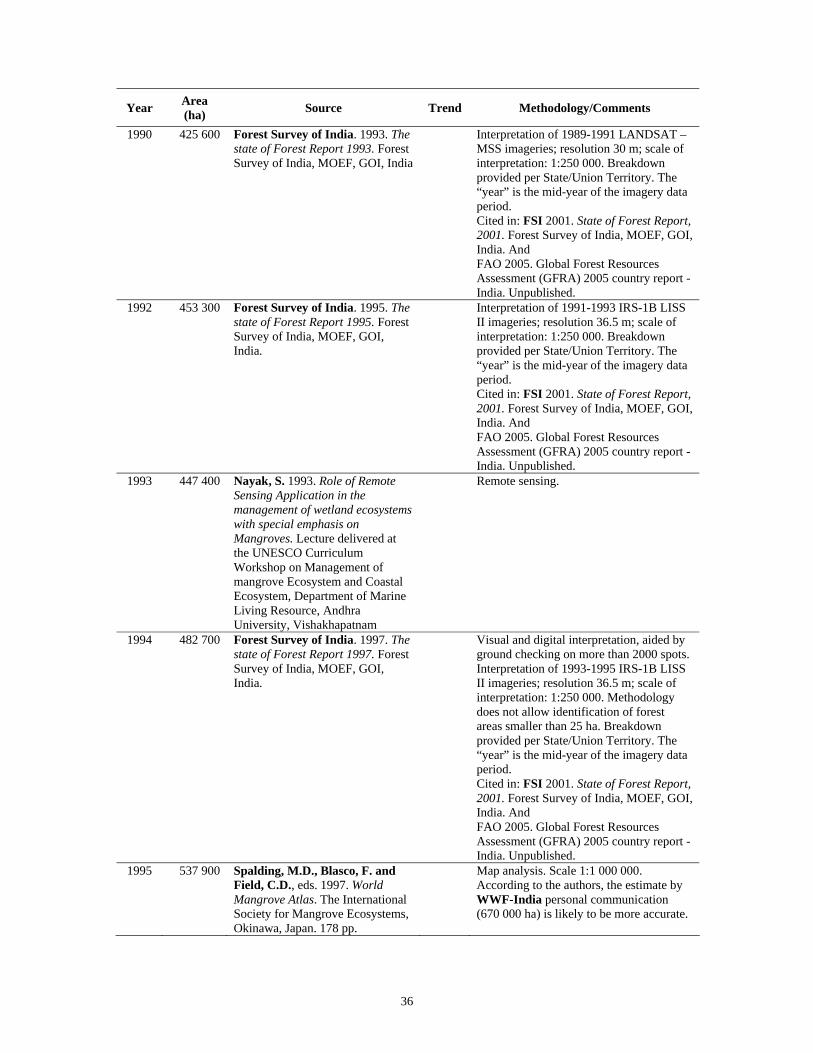
Year Area (ha) Source Trend Methodology/Comments
1990 425 600 Forest Survey of India. 1993. The state of Forest Report 1993. Forest Survey of India, MOEF, GOI, India
Interpretation of 1989-1991 LANDSAT – MSS imageries; resolution 30 m; scale of interpretation: 1:250 000. Breakdown provided per State/Union Territory. The “year” is the mid-year of the imagery data period. Cited in: FSI 2001. State of Forest Report, 2001. Forest Survey of India, MOEF, GOI, India. And FAO 2005. Global Forest Resources Assessment (GFRA) 2005 country report - India. Unpublished.
1992 453 300 Forest Survey of India. 1995. The state of Forest Report 1995. Forest Survey of India, MOEF, GOI, India.
Interpretation of 1991-1993 IRS-1B LISS II imageries; resolution 36.5 m; scale of interpretation: 1:250 000. Breakdown provided per State/Union Territory. The “year” is the mid-year of the imagery data period. Cited in: FSI 2001. State of Forest Report, 2001. Forest Survey of India, MOEF, GOI, India. And FAO 2005. Global Forest Resources Assessment (GFRA) 2005 country report - India. Unpublished.
1993 447 400 Nayak, S. 1993. Role of Remote Sensing Application in the management of wetland ecosystems with special emphasis on Mangroves. Lecture delivered at the UNESCO Curriculum Workshop on Management of mangrove Ecosystem and Coastal Ecosystem, Department of Marine Living Resource, Andhra University, Vishakhapatnam
Remote sensing.
1994 482 700 Forest Survey of India. 1997. The state of Forest Report 1997. Forest Survey of India, MOEF, GOI, India.
Visual and digital interpretation, aided by ground checking on more than 2000 spots. Interpretation of 1993-1995 IRS-1B LISS II imageries; resolution 36.5 m; scale of interpretation: 1:250 000. Methodology does not allow identification of forest areas smaller than 25 ha. Breakdown provided per State/Union Territory. The “year” is the mid-year of the imagery data period. Cited in: FSI 2001. State of Forest Report, 2001. Forest Survey of India, MOEF, GOI, India. And FAO 2005. Global Forest Resources Assessment (GFRA) 2005 country report - India. Unpublished.
1995 537 900 Spalding, M.D., Blasco, F. and Field, C.D., eds. 1997. World Mangrove Atlas. The International Society for Mangrove Ecosystems, Okinawa, Japan. 178 pp.
Map analysis. Scale 1:1 000 000. According to the authors, the estimate by WWF-India personal communication (670 000 ha) is likely to be more accurate.
37
Year Area (ha) Source Trend Methodology/Comments
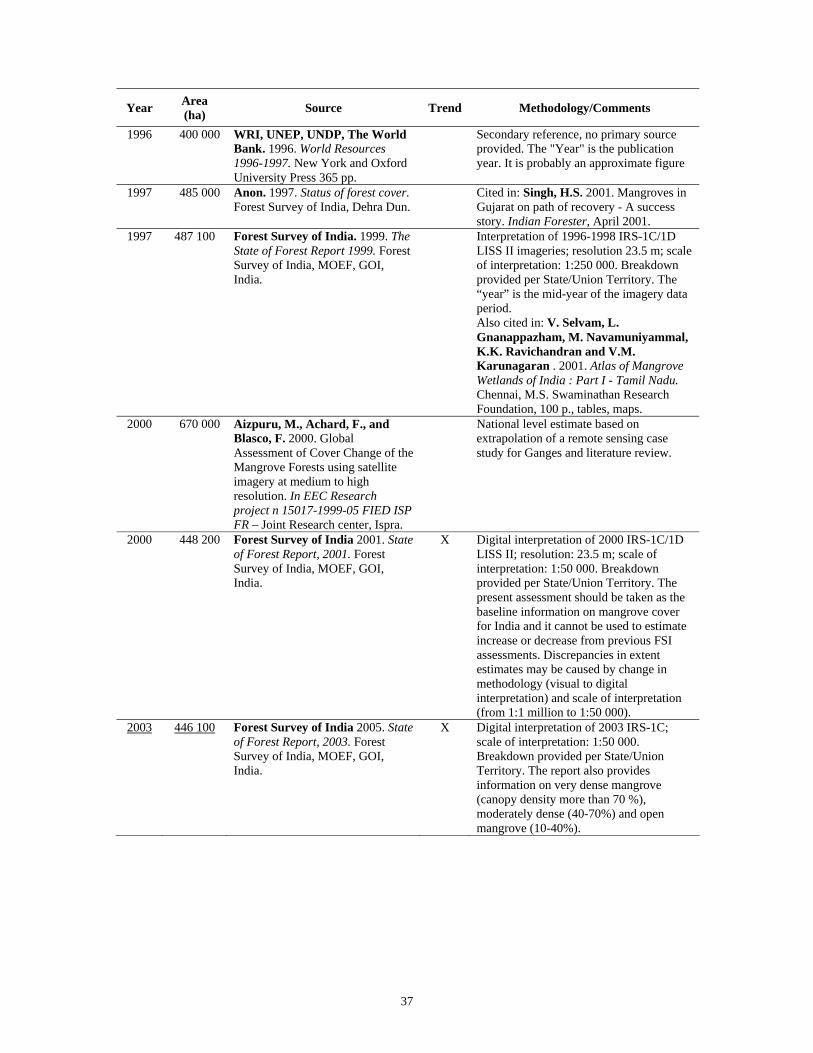
1996 400 000 WRI, UNEP, UNDP, The World Bank. 1996. World Resources 1996-1997. New York and Oxford University Press 365 pp.
Secondary reference, no primary source provided. The "Year" is the publication year. It is probably an approximate figure
1997 485 000 Anon. 1997. Status of forest cover. Forest Survey of India, Dehra Dun.
Cited in: Singh, H.S. 2001. Mangroves in Gujarat on path of recovery - A success story. Indian Forester, April 2001.
1997 487 100 Forest Survey of India. 1999. The State of Forest Report 1999. Forest Survey of India, MOEF, GOI, India.
Interpretation of 1996-1998 IRS-1C/1D LISS II imageries; resolution 23.5 m; scale of interpretation: 1:250 000. Breakdown provided per State/Union Territory. The “year” is the mid-year of the imagery data period. Also cited in: V. Selvam, L. Gnanappazham, M. Navamuniyammal, K.K. Ravichandran and V.M. Karunagaran . 2001. Atlas of Mangrove Wetlands of India : Part I - Tamil Nadu. Chennai, M.S. Swaminathan Research Foundation, 100 p., tables, maps.
2000 670 000 Aizpuru, M., Achard, F., and Blasco, F. 2000. Global Assessment of Cover Change of the Mangrove Forests using satellite imagery at medium to high resolution. In EEC Research project n 15017-1999-05 FIED ISP FR – Joint Research center, Ispra.
National level estimate based on extrapolation of a remote sensing case study for Ganges and literature review.
2000 448 200 Forest Survey of India 2001. State of Forest Report, 2001. Forest Survey of India, MOEF, GOI, India.
X Digital interpretation of 2000 IRS-1C/1D LISS II; resolution: 23.5 m; scale of interpretation: 1:50 000. Breakdown provided per State/Union Territory. The present assessment should be taken as the baseline information on mangrove cover for India and it cannot be used to estimate increase or decrease from previous FSI assessments. Discrepancies in extent estimates may be caused by change in methodology (visual to digital interpretation) and scale of interpretation (from 1:1 million to 1:50 000).
2003 446 100 Forest Survey of India 2005. State of Forest Report, 2003. Forest Survey of India, MOEF, GOI, India.
X Digital interpretation of 2003 IRS-1C; scale of interpretation: 1:50 000. Breakdown provided per State/Union Territory. The report also provides information on very dense mangrove (canopy density more than 70 %), moderately dense (40-70%) and open mangrove (10-40%).
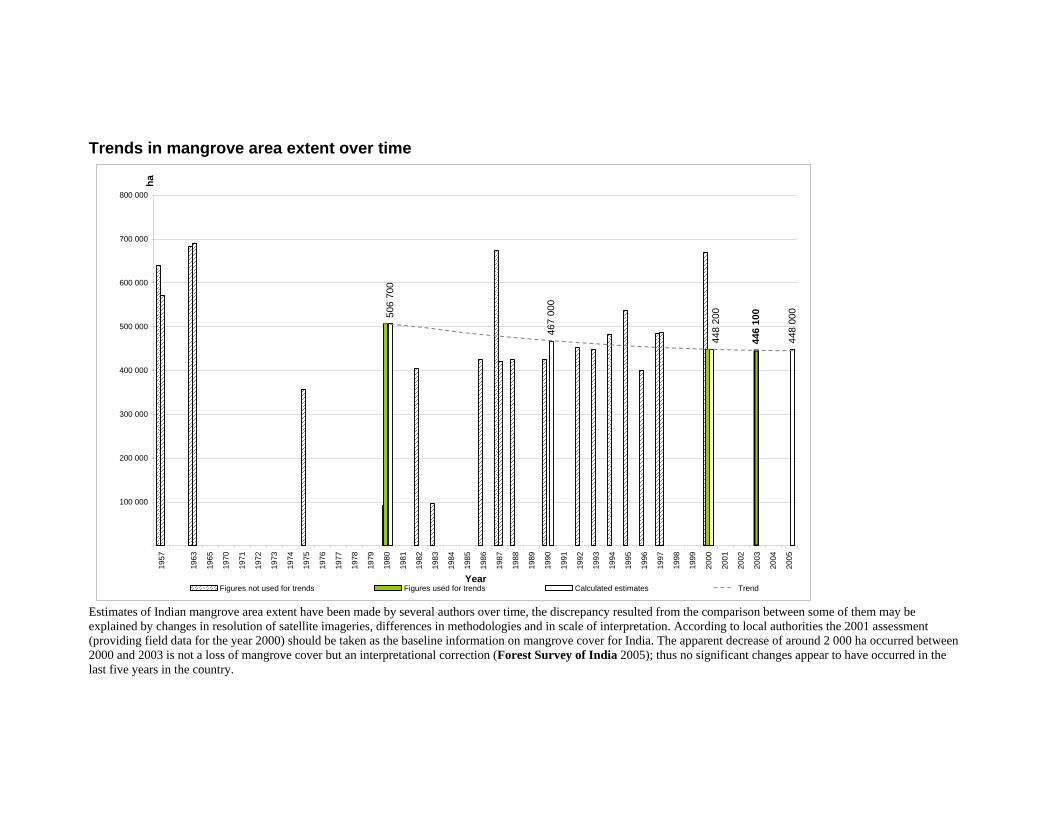
Trends in mangrove area extent over time
506
700
467
000
448
000
446
100
448
200
100 000
200 000
300 000
400 000
500 000
600 000
700 000
800 000
1957
1963
1965
1970
1971
1972
1973
1974
1975
1976
1977
1978
1979
1980
1981
1982
1983
1984
1985
1986
1987
1988
1989
1990
1991
1992
1993
1994
1995
1996
1997
1998
1999
2000
2001
2002
2003
2004
2005
Year
ha
Figures not used for trends Figures used for trends Calculated estimates Trend
Estimates of Indian mangrove area extent have been made by several authors over time, the discrepancy resulted from the comparison between some of them may be explained by changes in resolution of satellite imageries, differences in methodologies and in scale of interpretation. According to local authorities the 2001 assessment (providing field data for the year 2000) should be taken as the baseline information on mangrove cover for India. The apparent decrease of around 2 000 ha occurred between 2000 and 2003 is not a loss of mangrove cover but an interpretational correction (Forest Survey of India 2005); thus no significant changes appear to have occurred in the last five years in the country.

39
Summary status of mangrove area extent over time
Most reliable, recent mangrove area estimate
Mangrove area
estimate 1980
Mangrove area
estimate 1990
Mangrove area
estimate 2000
Mangrove area
estimate 2005
ha year ha ha ha ha India 446 100 2003 506 700 467 000 448 200 448 000
Formulas used for the trend analysis Linear: y = mx + b where m is the slope and b is the intercept.
40
Indonesia Vegetation description, uses and threats The vast Indonesian archipelago represents the world hot spot for mangrove extent and biodiversity. Mangroves are found throughout the country even though scarce in west Sumatra. A large part of the national mangroves are hosted in Irian Jaya, and other very large areas are found along the East coast of Kalimantan and the East coast of Sumatra. Five major mangrove types or 'consociations' may be identified in this country, based on dominant species of Avicennia, Rhizophora, Sonneratia, Bruguiera and Nypa. The relative occurrence of each of these can be related to ecological factors such as tidal regime, soils and salinity. Mangroves in this country show a high degree of structural development, with trees reaching 50 m in height in many areas such as on the South and East coasts of Sumatra and Kalimantan. It is very difficult to make generalisations about the climate or physical conditions in a country of this size; however most coastal regions have humid tropical or equatorial climates, with high humidity, seasonal wind and precipitation, a high annual rainfall and high temperatures. Where conditions of rainfall or coastal topography are less favourable, mangroves may only form shrubby communities or are virtually absent, such as in the East Nusa Tenggara (Lesser Sunda Islands) and western Sumatra. Tidal fluctuations vary enormously over relatively short distances due, in part, to the complexity of the coastal configuration. With its 43 true mangrove species Indonesia not only represents the country with the highest mangrove biodiversity in the region, but also in the world. Local populations often rely on mangroves for timber, fuelwood and charcoal, sugar and thatching material (produced from Nypa). Commercial uses include charcoal production and large areas of logging concessions as well as the production of woodchips and pulp. Chip mills were built in Sumatra and Kalimantan, while a major mill was built to process mangroves from a 137 000 ha lease in Bintuni Bay, Irian Jaya, formerly one of the largest and most pristine mangrove areas in the world. Poles extracted from Rhizophoraceae trees are still used for building foundations. Mangrove associated fisheries are also important, ranging from finfish to shellfish (bivalves and crabs). Brackish water fishponds have been used in Indonesia since the fifteenth century and in the 1970s they began to be used for shrimp farming. Extensive methods, relying on natural stocking, as well as intensive methods are used. The fry are obtained from hatcheries and feeding and predator controls are applied. The uncontrolled development of aquaculture however brought together several environmental concerns and eventually led to the lost of several mangrove areas especially in East Java, Sulawesi and Sumatra. If unsustainable aquaculture development has been identified as the main cause for mangrove losses in the country, the overexploitation of the resources through intensive logging might be cited as a secondary cause. Continuing cutting has given rise to thickets of the fern Acrostichum aureum and Acanthus spp., by which natural regeneration is greatly impaired. Smaller areas of mangroves have been lost due to the conversion of mangrove land for agricultural purpose and for the construction of salt pans (Java and Sulawesi), while other are threatened by oil spills (East Kalimantan) and pollution. As a consequence of the misuse of the resources occurred in the past decades more than half of the current mangrove extent is degraded.
41
As occurring in the other Indian Ocean countries, besides human threats mangroves in Indonesia have to face many different natural hazards, such as cyclones, wind and tsunamis; even though thick and well structured forests may help reducing the impact of natural hazards on coastal areas, trees in the front lines often get damaged and uprooted by strong events (see page Error! Bookmark not defined. for further details). According to various studies during the 2004 Indian Ocean tsunami where mangrove still covered a large and not degraded area they appear to have provided some degree of protection even in some Indonesian localities, so near to the earthquake epicentre. On the other hand, in areas where mangroves were highly degraded and growing only as relict forests, the presence of these trees did not play any difference in saving lives and structures behind them, since they were uprooted and carried inland by the strength of the waves. The Government of Indonesia is also attempting to restore areas impacted by the 2004 Indian Ocean Tsunami through a mangrove and coastal forest rehabilitation programme. To support the initiative the government has also prepared policies, legislation and other administrative tools. During recent years the awareness of mangrove importance and of the benefit of thick and health forests is increasing and some areas have been reforested or planted. Recognising the contribution provided by mangroves to the fisheries and forestry sectors as well as their services for coastal protection and for the conservation of the wildlife, the government designated a number of protected areas with mangroves sorting the land use in different classes, such as nature conservation and national park, protection forest, production forest, agriculture fishery and other purposes. Reference: FAO. 2007a. Coastal protection in the aftermath of the Indian Ocean tsunami: What role for forests and trees? Proceedings of the Regional Technical Workshop, Khao Lak, Thailand, 28–31 August 2006. Compiled and edited by Braatz, S., Fortuna, S, Broadhead, J. and Leslie, R. In press. (www.fao.org/forestry/tsunami/coastalprotection)
FAO. 2007b. Proceedings of the workshop on coastal area planning and management in Asian tsunami-affected countries, 27–29 September 2006, Bangkok, Thailand. RAP PUBLICATION 2007/06 (www.fao.org/forestry/site/35734/en)
Kusumawardhani, L. 2004. Information provided for the Global Forest Resources Assessment (GFRA) 2005 thematic study on mangroves. Unpublished. National Forest – Inventory. 1993. INTAGM Dep. Kehutanan using Landsat data from early and mid -1980's
Rekalkulasi Penutupan Lahan Indonesia, 2003. Indonesia Forest Coverage Reassessment, 2003. Unpublished. www.dephut.go.id
Soemodihardjo, S., Wiroatmodjo, P., Abdullah, A. Tantra, I.G.M. and Soegiarto, A. 1993. Condition, socio-economic values and environmental significance of mangrove areas. In: Clough, B.F. 1993. The Economic and environmental values of mangrove forests and their present state of conservation in the South-East Asia/Pacific Region. p. 17-38 Mangrove Ecosystems Technical Reports vol.3 ITTO/ISME/JIAM Project PD71/89. Rev. 1(F) Okinawa, Japan, ISME. 202 pp.
Spalding, M.D., Blasco, F. & Field, C.D., eds. 1997. World Mangrove Atlas. The International Society for Mangrove Ecosystems, Okinawa, Japan. 178 pp. Wiroatmodjo, P. 2004. Status and challenges on the management of mangroves in Indonesia. In: Bhandari, B.B., Kashio, M. and Nakamura, R. Mangroves in Southeast Asia. Status, Issues and Challenges. pp: 135-150. Ramsar Center Japan. Institute for Global Environmental Strategies (IGES)., Tokyo.
True mangrove species checklist Acanthus ebracteatus Acanthus ilicifolius Acrostichum aureum
42
Acrostichum speciosum Aegialitis annulata Aegiceras corniculatum Aegiceras floridum Avicennia alba Avicennia marina Avicennia officinalis Avicennia rumphiana Bruguiera cylindrical Bruguiera exaristata Bruguiera gymnorrhiza Bruguiera hainesii Bruguiera parviflora Bruguiera sexangula Camptostemon philippinensis Camptostemon schultzii Ceriops decandra Ceriops tagal Excoecaria agallocha Excoecaria indica Heritiera globosa Heritiera littoralis Kandelia candel Lumnitzera littorea Lumnitzera racemosa Nypa fruticans Osbornia octodonta Pemphis acidula Rhizophora apiculata Rhizophora mucronata Rhizophora stylosa Scyphiphora hydrophyllacea Sonneratia alba Sonneratia caseolaris Sonneratia ovata Sonneratia x gulngai Sonneratia x urama Xylocarpus granatum Xylocarpus mekongensis Xylocarpus rumphii
National level mangrove estimates
Year Area (ha) Source Trend Methodology/Comments
1950 2 501 825 Martosubroto, P., Naamin, N. 1977. Relationship between tidal forests (mangroves) and commercial shrimp production in Indonesia. Marine Resources Indonesia 18: 81-86.
Map analysis. This figure excludes Bali and Nusa Tenggara and provides a low estimate for Irian Jaya. This figure has not been represented in the chart since it is too old for the purposes of this study.
43
Year Area (ha) Source Trend Methodology/Comments
1973 3 807 100 Directorate of forestry Planning. 1981. Report on the Forest of Indonesia. Publication No. 18, 1981
Cited in: Sutter, H., Ministry of Forestry, Government of Indonesia, FAO. 1989. Forest Resources and Land Use in Indonesia. This figure excludes Nusa Tenggara.
1978 1 000 000 Directorate of Forest Planning. 1979. Forestry in Indonesia 1978. Bogor
Cited in: FAO, UNEP. 1981. Tropical Forest Resources Assessment Project, Forest Resources of Tropical Asia. FAO, UNEP, 475 pp. According to the authors this figure has to be considered as on the higher side.
1978 3 600 000 Soemodihardjo, S. 1978. Utilization and management of mangrove resources in Indonesia.
Cited in: Snedaker, S.C. 1984. The Mangroves of Asia and Oceania: Status and Research Planning. In: proceedings of the Asian Symposium on Mangrove Environment Research and Management, p 5-15 Kuala Lumpur, August 25-29, 1980. Edited by E. Soepadmo, A.N. Rao and D.J. MacIntosh. 1984
1978 3 627 119 Wiroatmodjo, P. and Judi, D.M. 1978. Pengelolaan hutan payau di Indonesia / Management of brakish-water forests in Indonesia. Presented at Seminar on Mangrove Ecosystem, 27 February - 1 March 1978, Jakarta.
Cited in: FAO. 1982. Management and utilization of mangroves in Asia and the Pacific. FAO environment paper 3. 160 pp. This figure does not include Bali.
1978 3 707 119 Knox, G., Miyabara, T. 1984. Coastal Zone Resource Development and Conservation in Southeast Asia with special reference to Indonesia. UNESCO East-West Centre, Jakarta Pusat, Indonesia, 182 pp.
Based on: Burbridge, P. R., Koesoebiono. 1980. Management of Mangrove exploitation in Indonesia; Wiroatmodjo, P. and Judi, D.M. 1978. Pengelolaan hutan payau di Indonesia / Management of brakish-water forests in Indonesia. Presented at Seminar on Mangrove Ecosystem, 27 February - 1 March 1978, Jakarta
1980 2 171 300 Sutter, H., Ministry of Forestry, Government of Indonesia, FAO. 1989. Forest Resources and Land Use in Indonesia. Forestry studies: I-1. MOF - FAO.
Vegetation map of Outer Islands at the scale of 2 750 000, source date 1972; Jawa and Bali at scale 1: 1 000 000.
1982 3 177 200 Sutter, H., Ministry of Forestry, Government of Indonesia, FAO. 1989. Forest Resources and Land Use in Indonesia. Forestry studies: I-1. MOF - FAO.
Bina Programme 1982 & FAO 1981 and 1982 edited from Asian Wetland Bureau, quoted in article in The Jakarta Post of 27 March 1989 by Information Officer at AKEPHI, the Network for forest Conservation in Indonesia.
1982 4 251 011 FAO. 1985. Mangrove management in Thailand, Malaysia, and Indonesia. FAO Environment Paper (FAO), no. 4. FAO, Rome, 62 pp.
BINA program - Directorate of Forest Planning
44
Year Area (ha) Source Trend Methodology/Comments
1982 4 254 312 Forestry Department. 1982 X Cited in: Soemodihardjo, S., Wiroatmodjo, P., Abdullah, A. Tantra, I.G.M. and Soegiarto, A. 1993. Condition, socio-economic values and environmental significance of mangrove areas. In: Clough, B.F. 1993. The Economic and environmental values of mangrove forests and their present state of conservation in the South-East Asia/Pacific Region. p. 17-38 Mangrove Ecosystems Technical Reports vol.3 ITTO/ISME/JIAM Project PD71/89. Rev. 1(F) Okinawa, Japan, ISME. 202 pp.
1983 2 176 300 Saenger, P., Hegerl E.J. and J.D.S., Davie. 1983. Global status of mangrove ecosystems. Commission on ecology Papers No.3. IUCN. Gland, Switzerland. 88 pp.
Secondary reference, no primary source provided. The "Year" is the publication year. The figure is very similar to the one cited in Sutter, et al. 1989 (see above) It could refer to the same source, the difference in the figure could be due to a different conversion factor used.
1984 4 250 000 Darsidi, A. 1984. Mangrove forest management in Indonesia. In: Soemodihardjo, S. et al (eds) Proceedings of the Seminar on the mangrove ecosystem II, Baturaden, 1982. LIPI : 19-26
Cited in: Soegiarto, A. 2000. Research and conservation of Mangrove ecosystem in Indonesia. In: Proceedings of the International Workshop 26-30 March, 2000, Okinawa, Japan - Asia-Pacific cooperation on Research for conservation of Mangroves. This figure could refer to Soemodihardjo, S. et al., 1993. (see above)
1984 4 345 116 Soegiarto and Sukardjo. 1984. Cited in: Cholik, F. and A. Poernomo. 1986. Development of aquaculture in mangrove areas and its relationship to the mangrove ecosystem. In: Mepham, R.H. 1986. Papers contributed to the workshop on strategies for the management of fisheries and aquaculture in mangrove ecosystems. p. 93-104. Bangkok, Thailand, 23 June 1986. The "Year" is the publication year.
1985 3 790 500 Regional Physical Planning Programme for Transmigration (RePPProT mid 1980's, 1985-89)
Cited in: The World Bank. 2001. Indonesia: environment and natural resource management in a time of transition. Washington DC. World Bank. 147 pp.
1985 3 737 340 National Forest – Inventory. 1993. INTAGM Dep. Kehutanan using Landsat data from early and mid -1980's
X Remote sensing.
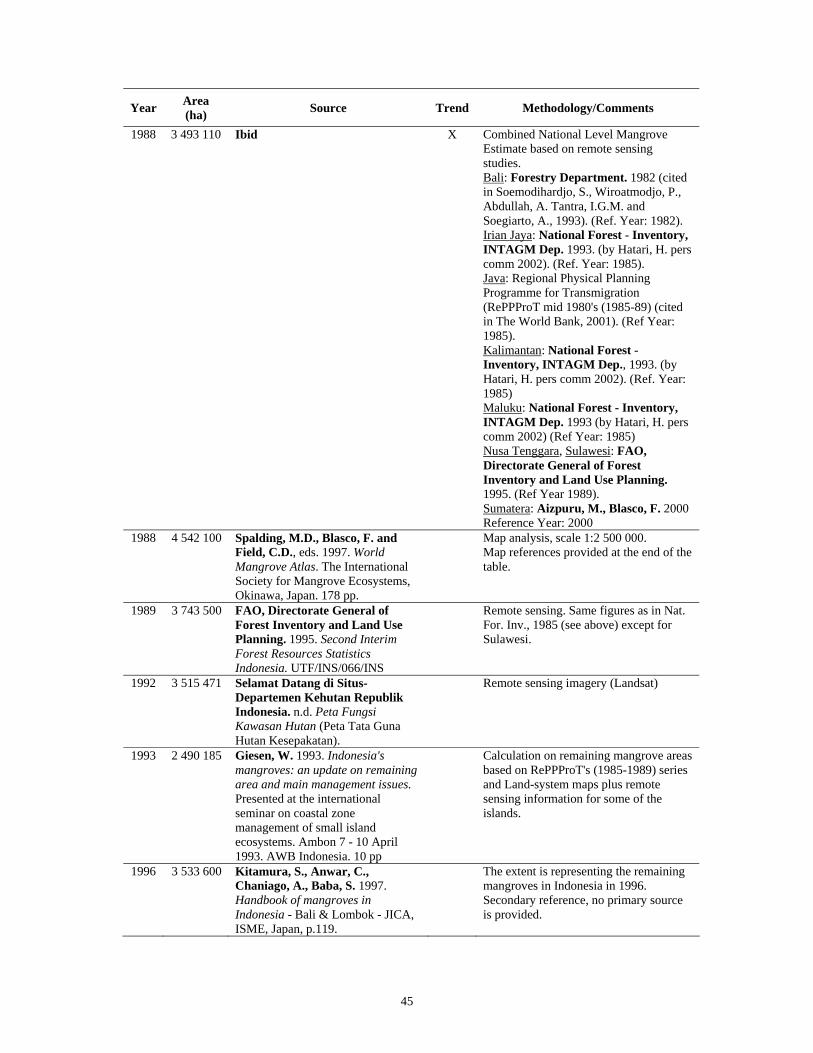
45
Year Area (ha) Source Trend Methodology/Comments
1988 3 493 110 Ibid X Combined National Level Mangrove Estimate based on remote sensing studies. Bali: Forestry Department. 1982 (cited in Soemodihardjo, S., Wiroatmodjo, P., Abdullah, A. Tantra, I.G.M. and Soegiarto, A., 1993). (Ref. Year: 1982). Irian Jaya: National Forest - Inventory, INTAGM Dep. 1993. (by Hatari, H. pers comm 2002). (Ref. Year: 1985). Java: Regional Physical Planning Programme for Transmigration (RePPProT mid 1980's (1985-89) (cited in The World Bank, 2001). (Ref Year: 1985). Kalimantan: National Forest - Inventory, INTAGM Dep., 1993. (by Hatari, H. pers comm 2002). (Ref. Year: 1985) Maluku: National Forest - Inventory, INTAGM Dep. 1993 (by Hatari, H. pers comm 2002) (Ref Year: 1985) Nusa Tenggara, Sulawesi: FAO, Directorate General of Forest Inventory and Land Use Planning. 1995. (Ref Year 1989). Sumatera: Aizpuru, M., Blasco, F. 2000 Reference Year: 2000
1988 4 542 100 Spalding, M.D., Blasco, F. and Field, C.D., eds. 1997. World Mangrove Atlas. The International Society for Mangrove Ecosystems, Okinawa, Japan. 178 pp.
Map analysis, scale 1:2 500 000. Map references provided at the end of the table.
1989 3 743 500 FAO, Directorate General of Forest Inventory and Land Use Planning. 1995. Second Interim Forest Resources Statistics Indonesia. UTF/INS/066/INS
Remote sensing. Same figures as in Nat. For. Inv., 1985 (see above) except for Sulawesi.
1992 3 515 471 Selamat Datang di Situs- Departemen Kehutan Republik Indonesia. n.d. Peta Fungsi Kawasan Hutan (Peta Tata Guna Hutan Kesepakatan).
Remote sensing imagery (Landsat)
1993 2 490 185 Giesen, W. 1993. Indonesia's mangroves: an update on remaining area and main management issues. Presented at the international seminar on coastal zone management of small island ecosystems. Ambon 7 - 10 April 1993. AWB Indonesia. 10 pp
Calculation on remaining mangrove areas based on RePPProT's (1985-1989) series and Land-system maps plus remote sensing information for some of the islands.
1996 3 533 600 Kitamura, S., Anwar, C., Chaniago, A., Baba, S. 1997. Handbook of mangroves in Indonesia - Bali & Lombok - JICA, ISME, Japan, p.119.
The extent is representing the remaining mangroves in Indonesia in 1996. Secondary reference, no primary source is provided.
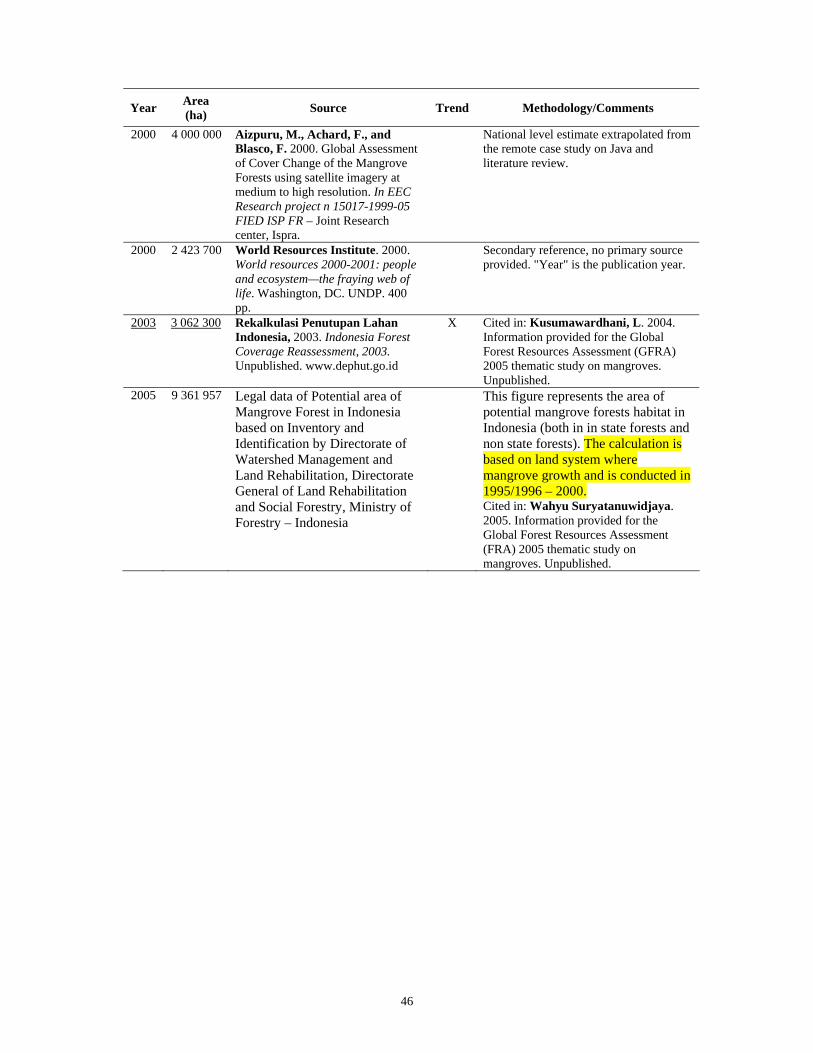
46
Year Area (ha) Source Trend Methodology/Comments
2000 4 000 000 Aizpuru, M., Achard, F., and Blasco, F. 2000. Global Assessment of Cover Change of the Mangrove Forests using satellite imagery at medium to high resolution. In EEC Research project n 15017-1999-05 FIED ISP FR – Joint Research center, Ispra.
National level estimate extrapolated from the remote case study on Java and literature review.
2000 2 423 700 World Resources Institute. 2000. World resources 2000-2001: people and ecosystem—the fraying web of life. Washington, DC. UNDP. 400 pp.
Secondary reference, no primary source provided. "Year" is the publication year.
2003 3 062 300 Rekalkulasi Penutupan Lahan Indonesia, 2003. Indonesia Forest Coverage Reassessment, 2003. Unpublished. www.dephut.go.id
X Cited in: Kusumawardhani, L. 2004. Information provided for the Global Forest Resources Assessment (GFRA) 2005 thematic study on mangroves. Unpublished.
2005 9 361 957 Legal data of Potential area of Mangrove Forest in Indonesia based on Inventory and Identification by Directorate of Watershed Management and Land Rehabilitation, Directorate General of Land Rehabilitation and Social Forestry, Ministry of Forestry – Indonesia
This figure represents the area of potential mangrove forests habitat in Indonesia (both in in state forests and non state forests). The calculation is based on land system where mangrove growth and is conducted in 1995/1996 – 2000. Cited in: Wahyu Suryatanuwidjaya. 2005. Information provided for the Global Forest Resources Assessment (FRA) 2005 thematic study on mangroves. Unpublished.
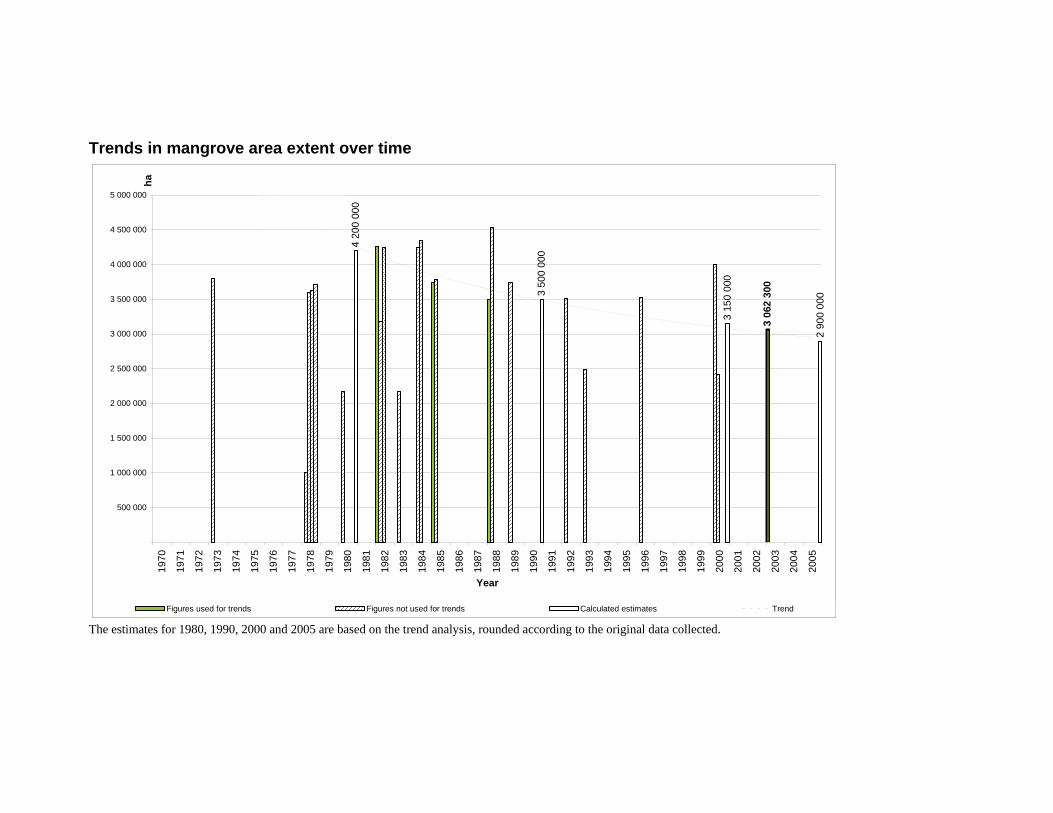
Trends in mangrove area extent over time
4 20
0 00
0
3 50
0 00
0
3 15
0 00
0
2 90
0 00
0
3 06
2 30
0
500 000
1 000 000
1 500 000
2 000 000
2 500 000
3 000 000
3 500 000
4 000 000
4 500 000
5 000 000
1970
1971
1972
1973
1974
1975
1976
1977
1978
1979
1980
1981
1982
1983
1984
1985
1986
1987
1988
1989
1990
1991
1992
1993
1994
1995
1996
1997
1998
1999
2000
2001
2002
2003
2004
2005
Year
ha
Figures used for trends Figures not used for trends Calculated estimates Trend
The estimates for 1980, 1990, 2000 and 2005 are based on the trend analysis, rounded according to the original data collected.
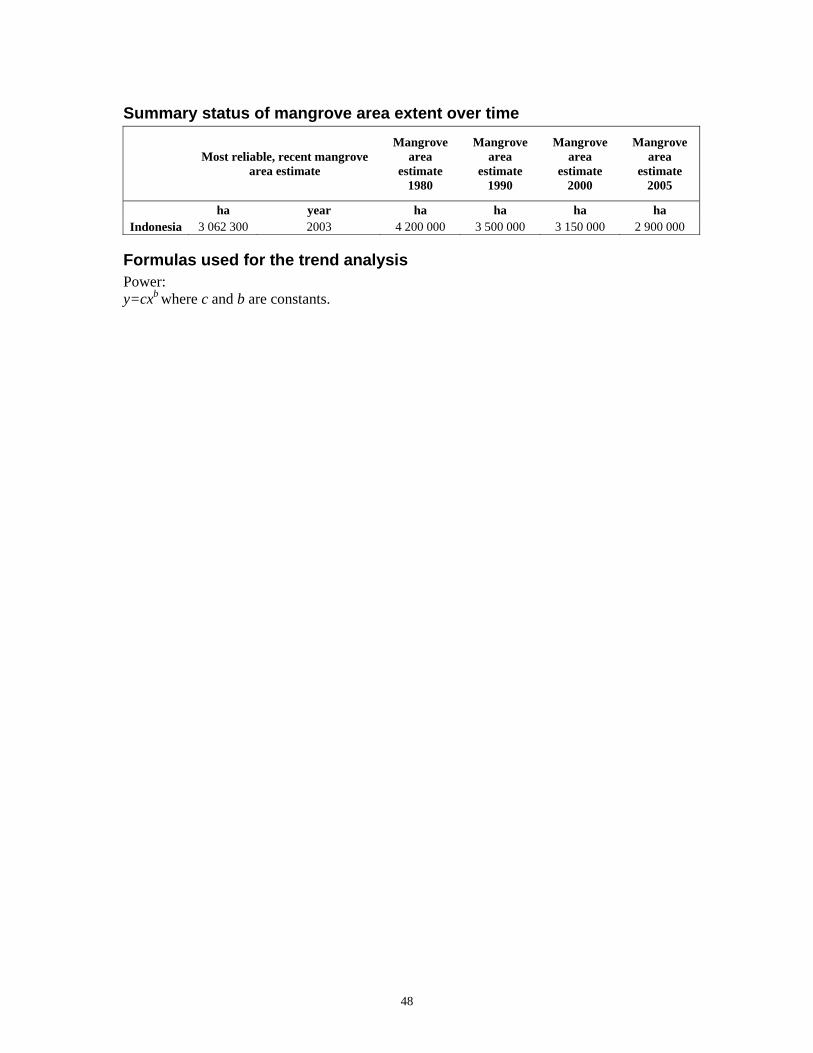
48
Summary status of mangrove area extent over time
Most reliable, recent mangrove area estimate
Mangrove area
estimate 1980
Mangrove area
estimate 1990
Mangrove area
estimate 2000
Mangrove area
estimate 2005
ha year ha ha ha ha Indonesia 3 062 300 2003 4 200 000 3 500 000 3 150 000 2 900 000
Formulas used for the trend analysis Power: y=cxb where c and b are constants.
49
Iran Vegetation description, uses and threats Mangroves in Iran can be found in the tidal zones of the sea of Oman and of the Persian Gulf. These forests are composed mainly of Avicennia marina, which forms dense forest in the intertidal zones whit bushes and trees, from 3 to 6 metres height, and occasional stands of Rhizophora mucronata, which grows especially near Sirik, in a mixed forest with A. marina. An important A. marina stand grows at the Khouran Straits (previously called Clarence Straits), the most well conserved and westerly mangroves in Iran, if not considering the tiny and degraded stands at Bandar Asalu. Other relevant forest in terms of tree size and density are found at Deltas of Rud-i-Gaz and Rud-i-Hara together with the one at the Sarbaz River mouth which contains some of the largest Avicennia sp. trees found in Iran, sometimes reaching a diameter of 40 cm. Originally there were about 200 000 hectares of Avicennia marina forests, which have suffered a strong decline over the years. Mangrove loss over time is mainly due to land conversion for shrimp cultivation and for infrastructure development, such as roads and harbours, to the excessive utilization for fuelwood and fodder, and over-grazing by camels. On the other hand some mangrove reforestation has been undertaken in the early 1990’s (1991 and 1993) on around 400 ha in the coastal area of the Persian Gulf and of the Oman Sea for rehabilitation purposes. The entire area of the Khouran Straits is protected under several international convention and reserves, Ramsar Site in 1975, UNESCO (MAB) Biosphere Reserve in 1976 and "Important Bird Area" (identification by BirdLife International in 1994). Reference: Mahdavi, A. 2001. Investigation on quantitative and qualitative alterations of Mangrove forests in Gheshm area by using of 1967 and 1994 aerial photos. University of Tehran.
Scott, D.A. ed. 1995. A Directory of Wetlands in the Middle East. IUCN, Gland, Switzerland and IWRB, Slimbridge, U.K. xvii + 560pp, 13 maps.
Shariatnegad, S. 2005. Information provided for the Forest Resources Assessment (FRA) 2005 thematic study on mangroves. Unpublished.
True mangrove species checklist Avicennia marina Rhizophora mucronata
National level mangrove estimates
Year Area (ha) Source Trend Methodology/Comments
1970 74 900 Spalding, M.D., Blasco, F. and Field, C.D., eds. 1997. World Mangrove Atlas. The International Society for Mangrove Ecosystems, Okinawa, Japan. 178 pp.
Map analysis. Generalised data of the entire coastline were taken from Mobayen and Tregubov, 1970. Further details for the mangroves of Qeshm Island were added from an unreferenced high resolution map provided to WCMC by M. Khosarvi, Department of the Environment. Mobayen, S. and Tregubov, V. 1970. Carte de la Végétation naturelle de l'Iran, 1:2 500 000. Centre National Cartographique de L'Iran.
50
1976 8 900 Harrington, F.A. Jr. 1976. Iran, Surveys of the Southern Iranian Coastline with Recommendations for Additional Marine Reserves. In: Promotion of the Establishment of Marine Parks and Reserves in the Northern Indian Ocean including the Red Sea and Persian Gulf. Proc. Regional Meeting, Tehran, Iran, March 1975. IUCN Publications new series No.35: 50-75.
Cited in: Scott, D.A. ed. 1995. A Directory of Wetlands in the Middle East. IUCN, Gland, Switzerland and IWRB, Slimbridge, U.K. xvii + 560pp, 13 maps.
1991 23 717 Behrouzi-Rad, B. 1991. Personal communication
Cited in: Fisher, P and Spalding, M.D. 1993. Protected areas with mangrove habitat. Draft Report World Conservation Centre, Cambridge, UK. 60pp.
1994 20 700 Khosravi and Motalebi. 1994. Mangrove studies project in the Khuran Strait. In: Indus Delta Biosphere Reserve; Workshop report. pp 57-60 IUCN World Conservation Union, Gland Switzerland.
X Cited in: Spalding, M.D., Blasco, F. and Field, C.D. eds. 1997. World Mangrove Atlas. The International Society for Mangrove Ecosystems, Okinawa, Japan. 178 pp.
1997 19 234 Engineering Technical Bureau of FRWO
X Cited in: Shariatnegad, S. 2005. Information provided for the Forest Resources Assessment (FRA) 2005 thematic study on mangroves. Unpublished. Remote Sensing- Land cover map scale 1:250 000
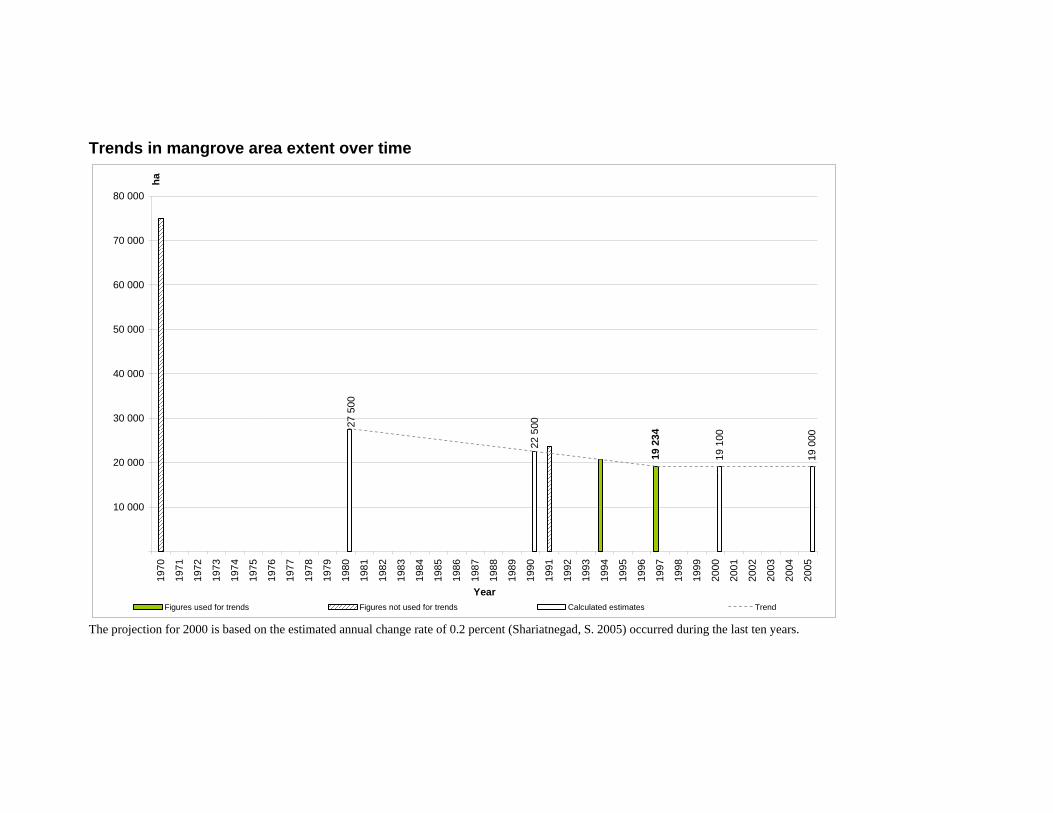
Trends in mangrove area extent over time
19
234
19
100
19
000
22
500
27
500
10 000
20 000
30 000
40 000
50 000
60 000
70 000
80 000
1970
1971
1972
1973
1974
1975
1976
1977
1978
1979
1980
1981
1982
1983
1984
1985
1986
1987
1988
1989
1990
1991
1992
1993
1994
1995
1996
1997
1998
1999
2000
2001
2002
2003
2004
2005
Year
ha
Figures used for trends Figures not used for trends Calculated estimates Trend
The projection for 2000 is based on the estimated annual change rate of 0.2 percent (Shariatnegad, S. 2005) occurred during the last ten years.
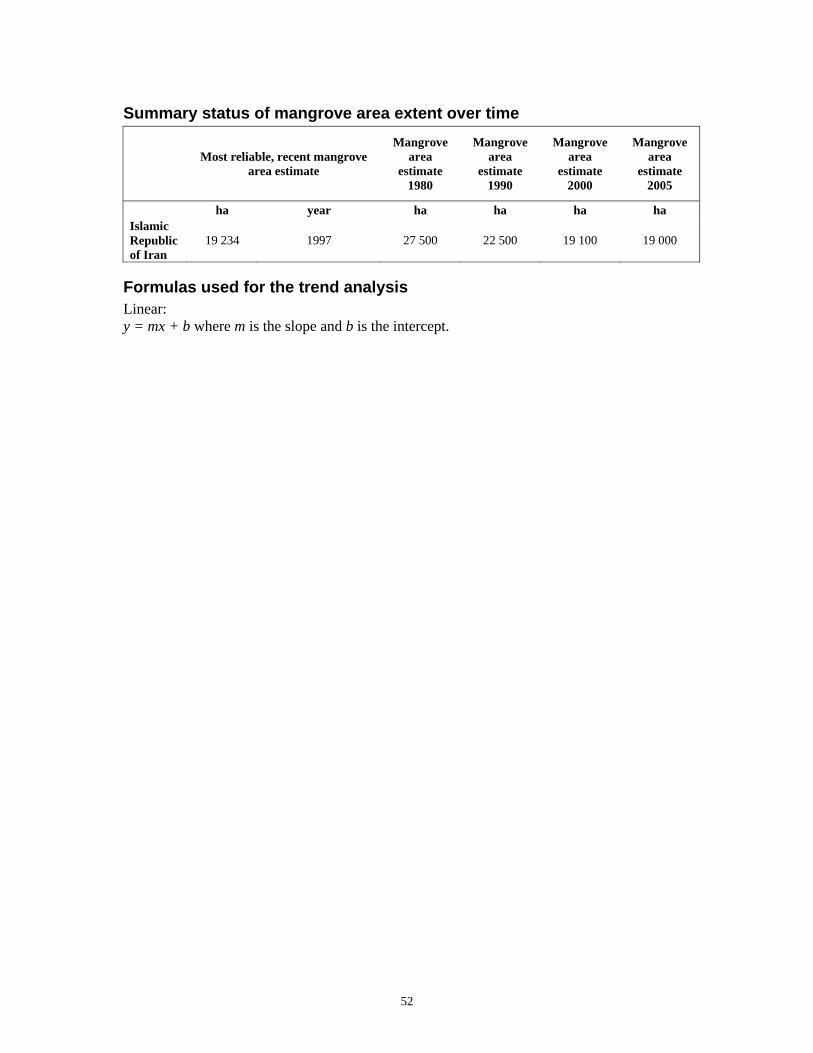
52
Summary status of mangrove area extent over time
Most reliable, recent mangrove area estimate
Mangrove area
estimate 1980
Mangrove area
estimate 1990
Mangrove area
estimate 2000
Mangrove area
estimate 2005
ha year ha ha ha ha Islamic Republic of Iran
19 234 1997 27 500 22 500 19 100 19 000
Formulas used for the trend analysis Linear: y = mx + b where m is the slope and b is the intercept.
53
Japan Vegetation description, uses and threats Mangroves are distributed in Okinawa prefecture such as Iriomote, Ishigaki, Miyako, Okinawa and other islands, and Kagoshima prefecture. Japanese mangroves are the northernmost in Asia, at latitude 31'22'N (Kiire area, Kagoshima city). The total area is small and it is largely concentrated on the islands of Ishigaki and Iriomote, where the largest and most diverse communities (eleven true mangroves species) have been recorded. A few strong typhoons pass over the Ryukyu Islands every year, limiting tree height to around 10-15 m and in some areas to shrub formations. Some traditional use of mangroves for tannins was recorded from Iriomote until just after 1945. Over the last decades some areas have been damaged for urban development and road construction, however mangroves in this country do not face serious threats and they are quite well conserved. Okinawa prefecture and local governments, together with non-governmental organizations have started activities to conserve and restore mangrove ecosystems which are now colonizing new areas through natural regeneration. In addition to that some small areas have been planted for education purposes in Okinawa, Ishigaki and Iriomote islands. A traditional proverb is often cited "no forest on the land, no fish in the sea” showing an ancient awareness of the importance of mangroves for this country. Reference: Baba, S. 2004. Information provided for the Global Forest Resources Assessment (FRA) 2005 thematic study on mangroves. Unpublished.
Spalding, M.D., Blasco, F. & Field, C.D., eds. 1997 World Mangrove Atlas. The International Society for Mangrove Ecosystems, Okinawa, Japan. 178 pp.
True mangrove species checklist Acrostichum aureum Avicennia marina Bruguiera gymnorrhiza Excoecaria agallocha Heritiera littoralis Kandelia candel Lumnitzera racemosa Nypa fruticans Pemphis acidula Rhizophora stylosa Sonneratia alba
National level mangrove estimates
Year Area (ha) Source Trend Methodology/Comments
54
Year Area (ha) Source Trend Methodology/Comments
1980 400 Nakasuga, 1980. Personal communication
Expert estimate. Cited in: Snedaker, S.C. 1984. The mangroves of Asia and Oceania: status and research planning. In: Proceedings of the Asian Mangrove Symposium, eds: Soepadmo, E Rao, AN; McIntosh, DJ. p. 5-15. Percetakan Ardyas Sdn Bhd. Kuala Lumpur, 25-29 August 1980, Kuala Lumpur, Malaysia.
1986 750 Spalding, M.D., Blasco, F. and Field, C.D., eds. 1997. World Mangrove Atlas. The International Society for Mangrove Ecosystems, Okinawa, Japan. 178 pp.
Map analysis. Mangroves of Iriomote Island digitised from 1:50 000 map appended to Aramoto. 1986 Map of Land Utilisation of Iriomote Island. Mangroves for the remainder of the islands around Okinawa were digitised from the Environment Agency (1981-87), whilst location of mangrove areas not covered on these maps were gathered from approximate distribution maps provided by Dr Shigeyuki Baba (June, 1995). Aramoto, M. 1986. Iriomote-jima wo chusin to shita shigen shokubutsu huzon genkyo (Bio-resources distribution in Iriomote Island, Okinawa). Published by Chiiki-sanjyo-gijutsu-shinko-kai, Okinawa Japan. 97pp. Environment Agency. 1981-87. Actual Vegetation Map, Okinawa 1-29. 1:50 000. The Third National Survey on the Natural Environment (Vegetation). Environment Agency, Japan. (29-map series on 26 sheets).
2005 800 Baba, S. 2004. Information provided for the Global Forest Resources Assessment (FRA) 2005 thematic study on mangroves. Unpublished.
X Preliminary results of national level mangrove inventory. Aerial photography and field check
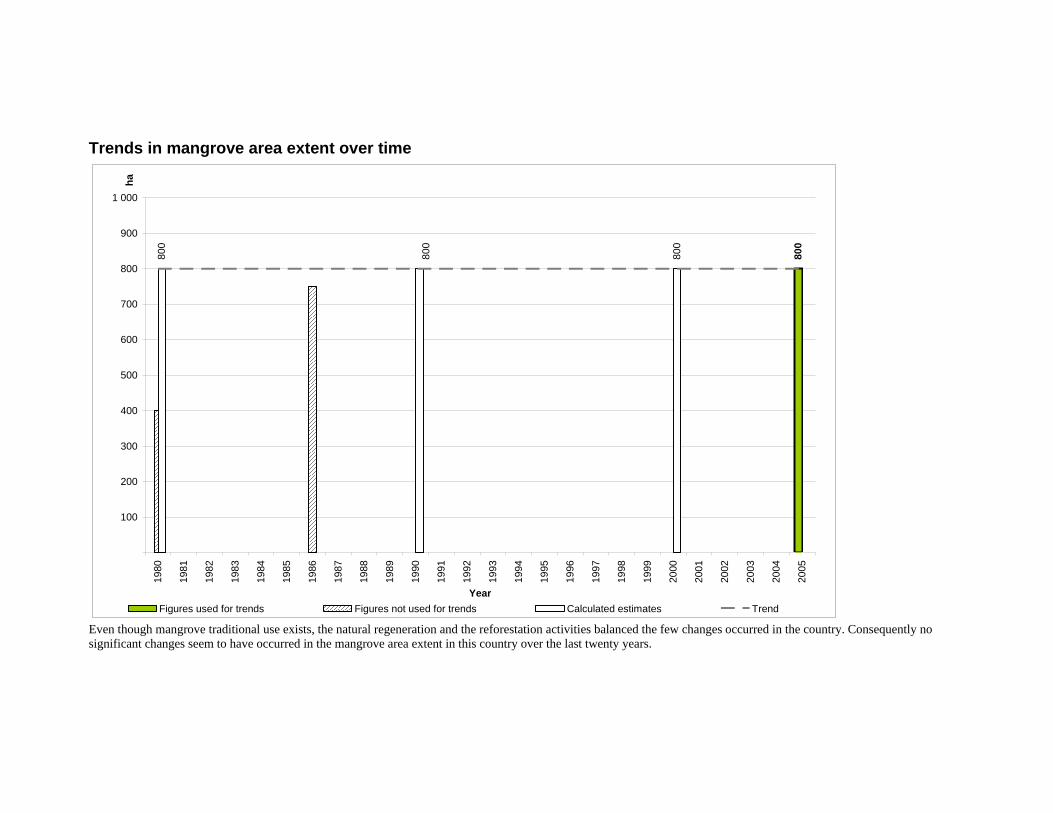
Trends in mangrove area extent over time 8
00
800
800
800
100
200
300
400
500
600
700
800
900
1 000
1980
1981
1982
1983
1984
1985
1986
1987
1988
1989
1990
1991
1992
1993
1994
1995
1996
1997
1998
1999
2000
2001
2002
2003
2004
2005
Year
ha
Figures used for trends Figures not used for trends Calculated estimates Trend Even though mangrove traditional use exists, the natural regeneration and the reforestation activities balanced the few changes occurred in the country. Consequently no significant changes seem to have occurred in the mangrove area extent in this country over the last twenty years.
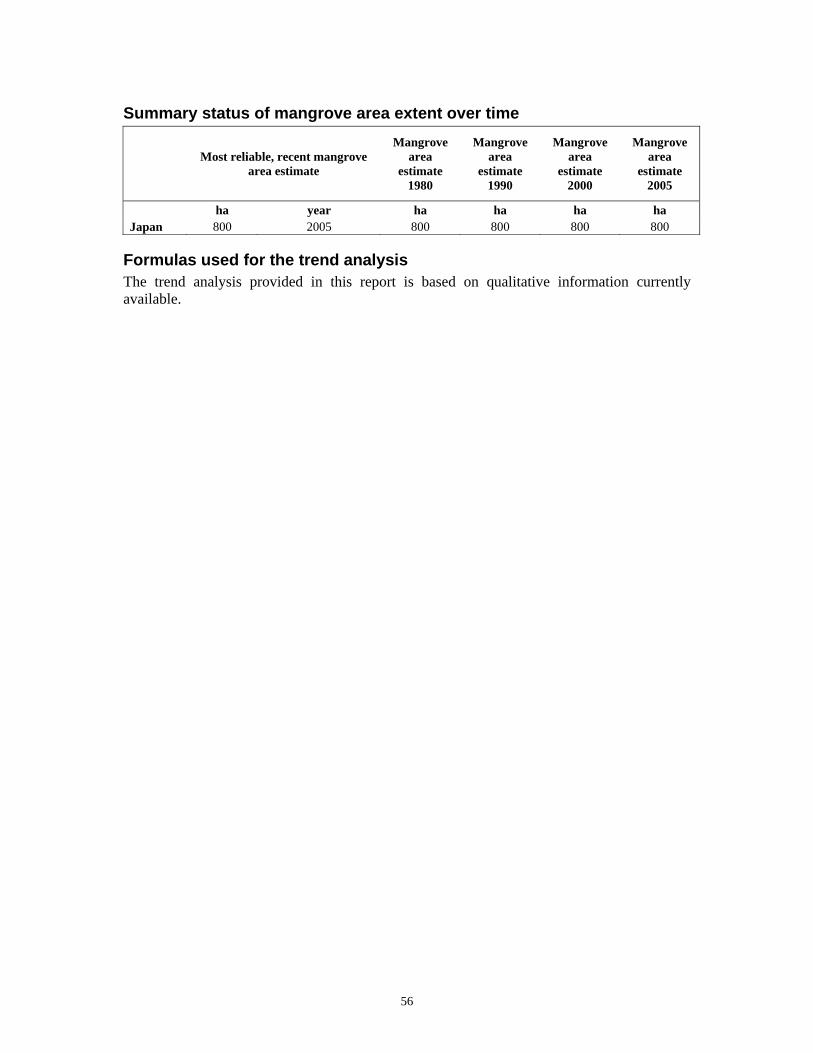
56
Summary status of mangrove area extent over time
Most reliable, recent mangrove area estimate
Mangrove area
estimate 1980
Mangrove area
estimate 1990
Mangrove area
estimate 2000
Mangrove area
estimate 2005
ha year ha ha ha ha Japan 800 2005 800 800 800 800
Formulas used for the trend analysis The trend analysis provided in this report is based on qualitative information currently available.
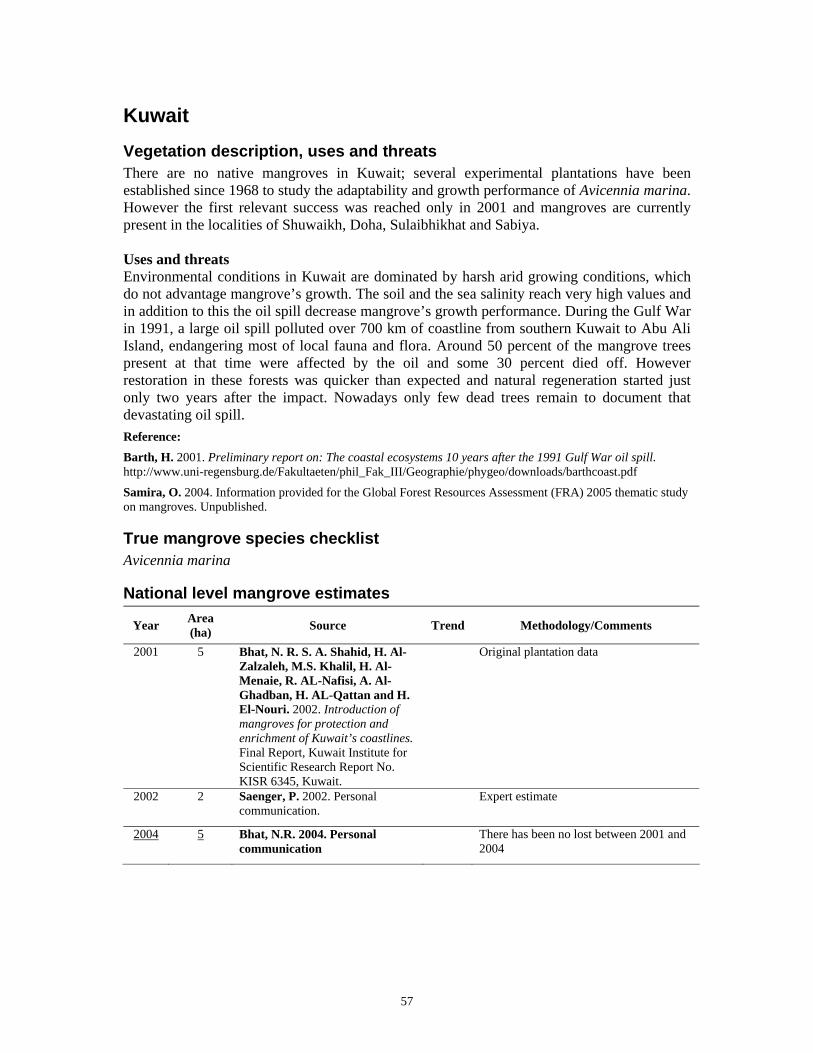
57
Kuwait Vegetation description, uses and threats There are no native mangroves in Kuwait; several experimental plantations have been established since 1968 to study the adaptability and growth performance of Avicennia marina. However the first relevant success was reached only in 2001 and mangroves are currently present in the localities of Shuwaikh, Doha, Sulaibhikhat and Sabiya. Uses and threats Environmental conditions in Kuwait are dominated by harsh arid growing conditions, which do not advantage mangrove’s growth. The soil and the sea salinity reach very high values and in addition to this the oil spill decrease mangrove’s growth performance. During the Gulf War in 1991, a large oil spill polluted over 700 km of coastline from southern Kuwait to Abu Ali Island, endangering most of local fauna and flora. Around 50 percent of the mangrove trees present at that time were affected by the oil and some 30 percent died off. However restoration in these forests was quicker than expected and natural regeneration started just only two years after the impact. Nowadays only few dead trees remain to document that devastating oil spill. Reference: Barth, H. 2001. Preliminary report on: The coastal ecosystems 10 years after the 1991 Gulf War oil spill. http://www.uni-regensburg.de/Fakultaeten/phil_Fak_III/Geographie/phygeo/downloads/barthcoast.pdf
Samira, O. 2004. Information provided for the Global Forest Resources Assessment (FRA) 2005 thematic study on mangroves. Unpublished.
True mangrove species checklist Avicennia marina
National level mangrove estimates
Year Area (ha) Source Trend Methodology/Comments
2001 5 Bhat, N. R. S. A. Shahid, H. Al-Zalzaleh, M.S. Khalil, H. Al-Menaie, R. AL-Nafisi, A. Al-Ghadban, H. AL-Qattan and H. El-Nouri. 2002. Introduction of mangroves for protection and enrichment of Kuwait’s coastlines. Final Report, Kuwait Institute for Scientific Research Report No. KISR 6345, Kuwait.
Original plantation data
2002 2 Saenger, P. 2002. Personal communication.
Expert estimate
2004 5 Bhat, N.R. 2004. Personal communication
There has been no lost between 2001 and 2004
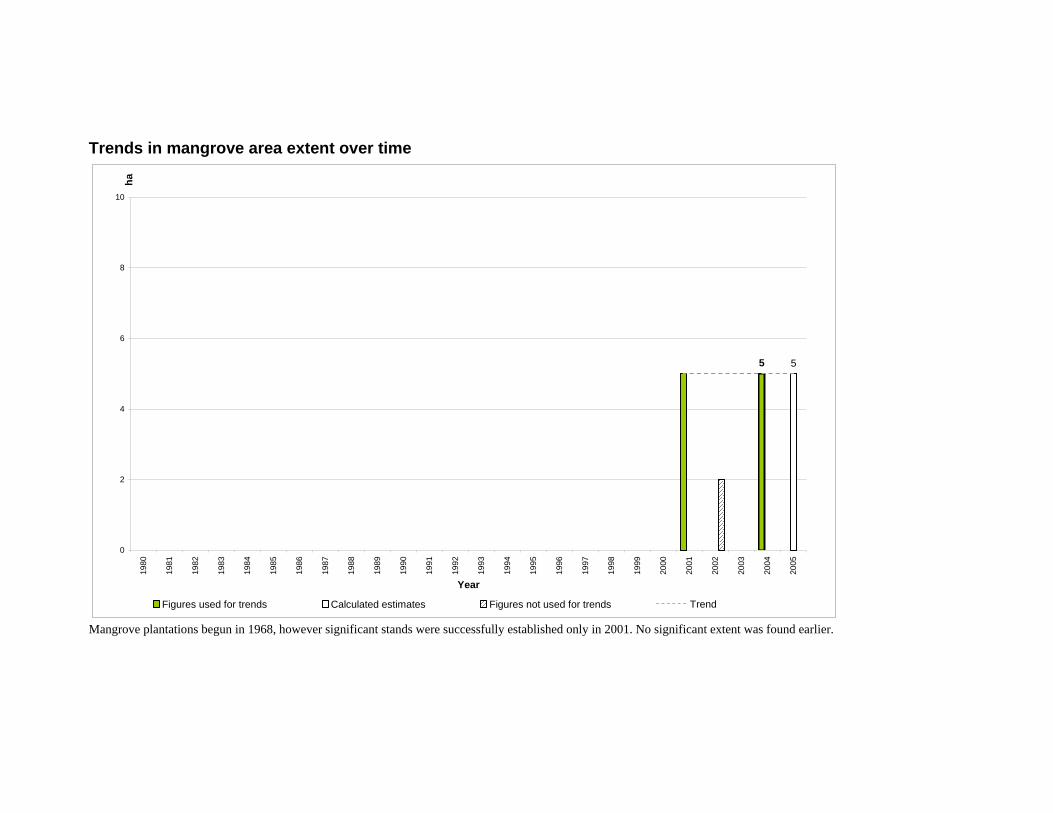
Trends in mangrove area extent over time
55
0
2
4
6
8
10
1980
1981
1982
1983
1984
1985
1986
1987
1988
1989
1990
1991
1992
1993
1994
1995
1996
1997
1998
1999
2000
2001
2002
2003
2004
2005
Year
ha
Figures used for trends Calculated estimates Figures not used for trends Trend
Mangrove plantations begun in 1968, however significant stands were successfully established only in 2001. No significant extent was found earlier.
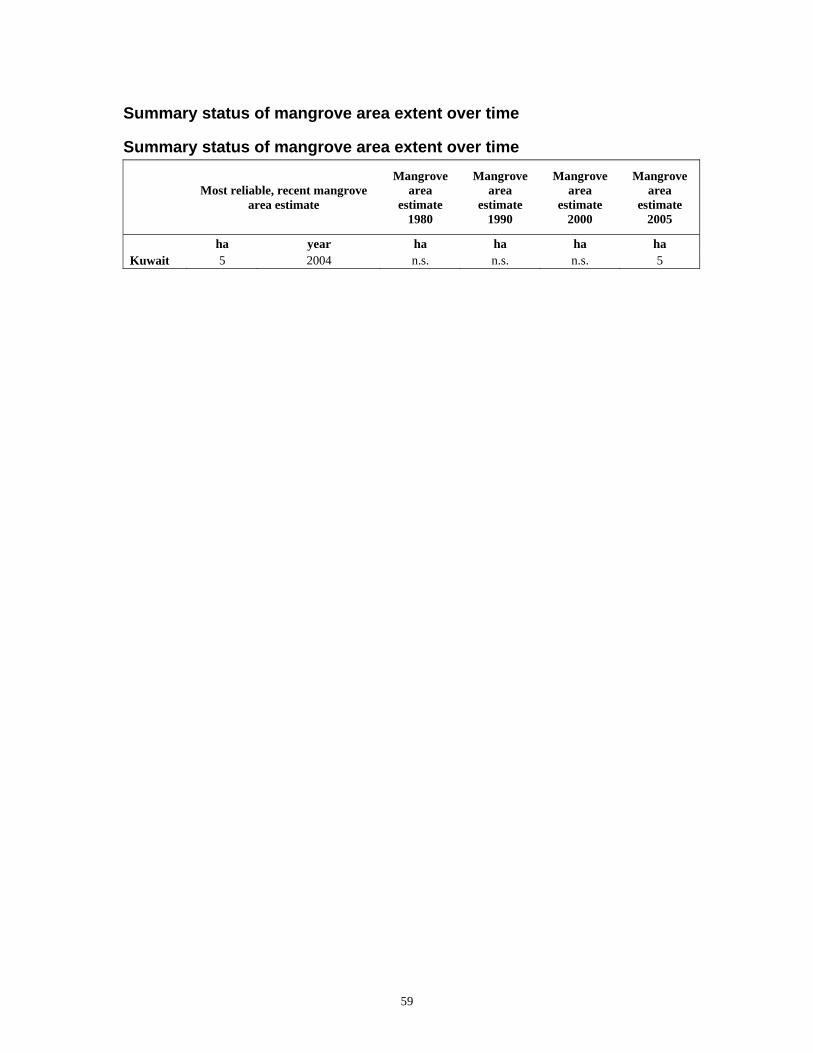
59
Summary status of mangrove area extent over time
Summary status of mangrove area extent over time
Most reliable, recent mangrove area estimate
Mangrove area
estimate 1980
Mangrove area
estimate 1990
Mangrove area
estimate 2000
Mangrove area
estimate 2005
ha year ha ha ha ha Kuwait 5 2004 n.s. n.s. n.s. 5
60
Malaysia Vegetation description, uses and threats Mangroves are found on all coasts of Malaysia, where the climate is generally hot, humid and characterized by a high rainfall. The largest area of mangroves is found on the coast of Sabah, concentrated particularly in the northeast. Considerable areas are also found in Sarawak, mostly in the deltas of the Sarawak, Rajang and Trusan-Lawas rivers. In Peninsular Malaysia, mangroves are concentrated on the more sheltered west coast. In some areas a relatively clear zonation pattern can be observed; typically, there is an Avicennia-Sonneratia community on the seaward sediments, where there is soft and deep mud, or an Rhizophora-Bruguiera forest. More inland, where the soils are firmer, a much wider array of species are found. In riverine areas, Nypa palms form the dominant species, particularly where the freshwater influence is higher. High rates of accretion are also experienced, with some areas in southern Peninsular Malaysia gaining around 40 m per year. Tree height ranges between 7 and 25 m. Malaysia represent one of the world hotspots in term of mangrove biodiversity, and with its 42 different true mangrove species is the second most important country after Indonesia. The use of mangroves as a source of local livelihood has a long history in Malaysia. Traditionally, they were harvested for fuelwood, charcoal, timber, poles and the construction of fish traps. The swamp palm Nypa fruticans is on the other hand used especially for the non wood forest products which can be obtained from it, such as housing thatch, cigarette paper, sugar, alcohol and vinegar. It is worth to cite that Malaysia has one of the mangrove forests with the longest tradition of management in the world, the Matang forest, located on the west coast of Peninsular Malaysia. This forest has been sustainably managed since the beginning of the 1900s and is one of the very few examples of successful sustainable management of a tropical forest ecosystem in the world. In addition to a timber industry employing some 2 400 people, with a revenue of US$ 6 million per year, the associated fishing industry in the area which employs about 10 000 people with an annual revenue of US$ 12-30 million. Aquaculture practices are implemented also in Malaysia and include cockle culture (a bivalve mollusc), floating cages for fish, and prawn culture. Although recent, this activity spread very quickly in the country, especially in Peninsular Malaysia, leading to the reclamation and conversion of large areas of mangroves to ponds. The National Mangrove Committee of Malaysia has strongly commended that strict guidelines should be established for the development of this industry in the future. The development of shrimp farms, together with the conversion of land to agriculture, urban development and in lesser extent over-exploitation of the resources may be identified as the main causes of mangrove clearance in the 1980s. The agriculture activities undertaken in ex-mangrove lands resulted to be often unsuccessful mainly due to the acidification of the soils. Considerable areas are now being reclaimed, again in Peninsular Malaysia, for urban development and the development of tourist resorts. Coastal erosion rates in this country can be high and probably exacerbated by the removal of mangroves from many areas. The increased sea traffic and related oil spills, together with the planning of ports construction are among the major threats to mangroves in this country.
61
All mangroves come under the jurisdiction of the respective State Forest Departments. Only a very small percentage of Malaysian mangroves fall within legally gazetted protected areas: 0.3 percent in Peninsular Malaysia; 0.2 percent in Sarawak; and 1.3 percent in Sabah. Fortunately mangrove plantations are now being implemented also in other areas outside the managed Matang forest, especially after the tremendous 26th December 2004 Indian Ocean Tsunami, when several governments and NGOs called for the plantation/rehabilitation of mangroves. Recognizing the crucial role that mangrove forests played in mitigating loss of life and damage to property by the December 2004 tsunami, Malaysia embarked on a tree-planting programme along its coastline. A national taskforce committee for the “Tree Planting Programme along the Coastline”, headed by the Secretary-General of the Ministry of Natural Resources and Environment was formed; it is supported by the planning and implementation technical committee and the research and development technical committee. Committee members comprise representatives from related government agencies at federal and state levels, the private sector and NGOs. A total of 5 998 hectares along the coastline (including tsunami-affected areas) will be planted over a five-year period under the Ninth Malaysia Plan (2006–2010) with government funding. Selected areas have been allocated to one of three categories: Category 1 (coastal area with severe erosion and unstable land condition); Category 2 (coastal area with moderate erosion and less stable land condition); and Category 3 (coastal area with little or no erosion and stable land condition). The committee has adopted several approaches for implementing the tree-planting programme. By the end of June 2006, about 170 hectares of coastal area (Category 3) had been planted by the Forestry Department Peninsular Malaysia with approximately 480 000 mangrove seedlings and seedlings of other trees species. Three mangrove sites have been declared wetlands of international importance in 2003, Pulau Kukup, an unhabitated and intact mangrove island, Sungai Pulai, home of the rare and endemic Avicennia lanata, and Tanjung Piai. Reference: Chan, H.T. 2005. Information provided for the Global Forest Resources Assessment (FRA) 2005 thematic study on mangroves. Unpublished.
Chan, H.T., J.E. Ong, W.K. Gong and A. Sasekumar. 1993. The socio-economic, ecological and environmental values of mangrove ecosystems in Malaysia and their present state of conservation. The Economic and environmental values of mangrove forests and their present state of conservation in the South-East Asia/Pacific Region. p. 41-81. Mangrove Ecosystems Technical Reports vol.3 ITTO/ISME/JIAM Project PD71/89. Rev. 1(F) Okinawa, Japan, ISME. 202 pp.
Chiew, H. 2005. Change in coastal ecosystems after the tragedy. The Star, Malaysia. 18 Jan. 2005. http://www.ecologyasia.com/news-archives/2005/jan-05/star_050118_1.htm
FAO. 2007. The role of coastal forests in the mitigation of tsunami impacts. Prepared by Forbes, K. FAO Regional Office for Asia and the Pacific. In press
FAO, UNEP. 1981. Tropical Forest Resources Assessment Project, Forest Resources of Tropical Asia. FAO, UNEP, 475 pp. Spalding, M.D., Blasco, F. & Field, C.D., eds. 1997. World Mangrove Atlas. The International Society for Mangrove Ecosystems, Okinawa, Japan. 178 pp.
The Ramsar Convention on Wetlands 2003. The Annotated Ramsar List of Wetlands of International Importance – Malaysia. http://www.ramsar.org/profile/profiles_malaysia.htm
True mangrove species checklist Acanthus ebracteatus Acanthus ilicifolius Acrostichum aureum
62
Acrostichum speciosum Aegiceras corniculatum Aegiceras floridum Avicennia alba Avicennia lanata Avicennia marina Avicennia officinalis Avicennia rumphiana Bruguiera cylindrica Bruguiera gymnorrhiza Bruguiera hainesii Bruguiera parviflora Bruguiera sexangula Ceriops decandra Ceriops tagal Cynometra iripa Cynometra ramiflora Excoecaria agallocha Excoecaria indica
Heritiera globosa Heritiera littoralis Kandelia candel Lumnitzera littorea Lumnitzera racemosa Nypa fruticans Osbornia octodonta Pemphis acidula Rhizophora apiculata Rhizophora mucronata Rhizophora stylosa Rhizophora x annamalayana Rhizophora x lamarckii Scyphiphora hydrophyllacea Sonneratia alba Sonneratia caseolaris Sonneratia griffithii Sonneratia ovata Xylocarpus granatum Xylocarpus mekongensis Xylocarpus rumphii
National level mangrove estimates
Year Area (ha) Source Trend Methodology/Comments
63
Year Area (ha) Source Trend Methodology/Comments
1975 688 634 FAO. 1982. Management and utilization of mangroves in Asia and the Pacific. FAO environment paper 3. 160 pp.
X Compiled information based on: West Malaysia: FAO. 1973. Forestry and forest industries development. Malaysia. A national forest inventory of West Malaysia, 1970-72. Kuala Lumpur. 259 p. DO/DP/MAL/72/009/TR5. Sarawak: Forest Department. 1976. Annual Report of the Forest Department. Sattawak. Sabah: Liew, T.C., Diah, M.N., and Wong Y.C. 1977. Mangrove exploitation and regeneration in Sabah. In: Sastry, C.B., Srivastava, P.B.L. and Ahman, A.M. A new Era in Malaysian Forestry. p. 95-109. Serdang, Malaysia.
1977 655 572 de la Cruz, A. A. 1984. A realistic approach to the use and management of mangrove areas in Southeast Asia. In: Teas, H.J., ed. 1984. Physiology and management of mangroves. Dr. W. Junk Publishers, The Hague. The Netherlands.
Calculated from figures reported in the Proceedings of the Workshop on Mangrove and Estuarine Vegetation. 10 Dec 1977. University Pertanian Malaysia Fakulti Perhutanan, Serdang, Selangor
1978 637 739 Ong, J.E. 1978. Mangroves in Malaysia. In: P. Kunstadter and Snedaker S.C.
Cited in: Snedaker, S.C. 1984. The mangroves of Asia and Oceania: status and research planning. In: Proceedings of the Asian Mangrove Symposium. eds. Soepadmo,E; Rao,AN; McIntosh, DJ. p. 5-15. Percetakan Ardyas Sdn Bhd., Kuala Lumpur. 25-29 August 1980, Kuala Lumpur, Malaysia.
1979 652 219 Sasekumar, A. 1980. Status report on impact of pollution on mangrove ecosystems and related research programmes in Malaysia. Country paper presented during the 12th annual seminar/convention. Federation of Institutions for Marine and Freshwater Sciences.
Cited in: Gomez, E.D. 1980. The present state of Mangrove ecosystems in Southeast Asia and the Impact of Pollution: Regional. Philippines. South China Seas Fisheries Development and Coordinating Programme, FAO, UNEP, Manila. 128 pp.
1980 630 000 FAO. 1984. Mangrove Forests in Asia - Pacific Region A summary of available information. GCP/RAS/106/JPN Field Document 1, Bangkok, 44 pp.
Figure based on information provided by Department of Forestry, Malaysia (1980). It seems a rough estimate.
1980 674 000 FAO, UNEP. 1981. Tropical Forest Resources Assessment Project, Forest Resources of Tropical Asia FAO, UNEP, 475 pp
X Information compiled on the basis of several sources. Updating of aerial photographs and estimation.
64
Year Area (ha) Source Trend Methodology/Comments
1984 642 400 Spalding, M.D., Blasco, F. and Field, C.D., eds. 1997. World Mangrove Atlas. The International Society for Mangrove Ecosystems, Okinawa, Japan. 178 pp.
X Map analysis. Mangrove data for Sabah were taken from Sabah Forestry Department, 1989. This provides a useful representation of forests within the protected and gazetted forests in the Permanent Forest Estate, but gives no indication of the extent (if any) of additional natural state land forests. For Sarawak the main source was Lands and Surveys, 1979. The data for Peninsula Malaysia are taken from Forest Department (n.d.). Although undated, this unpublished map is an updated version of a map published in 1986. Sabah Forestry Department. 1989. Sabah Malaysia, Natural and Plantation Forests. 1:1 270 000. Sabah Forestry Department, Malaysia. Lands and Surveys. 1979. Sarawak: Forest Distribution and Land Use Map. 1:1 000 000. Director of Lands and Surveys, Sarawak, Malaysia. Forest Department. 1989. Peninsular Malaysia: The Forest Area. 1:1 000 000. Hand-coloured map obtained from the Forest Department, Kuala Lumpur in May 1989.
1986 577 000 NATMANCOM. 1981. Guidelines for the use of the mangrove ecosystem for brackish water aquaculture in Malaysia. Paper prepared by the committee formed under the auspices of the National Council for Scientific Research and Development, Ministry of Sciences Technology and Environment.
This figure should be considered as on the lower side of the extent of mangroves. Secondary reference, no primary source provided.
1990 641 172 Anon. 1989. Forestry in Sabah, Malaysia. Sabah Forestry Department Publication. 164pp.; Anon. 1991. Forestry in Sarawak, Malaysia. Sarawak Forestry Department Publication. 47 pp.; Chan, H.T. 1991. The need to develop a management scheme for mangrove forest in South Johor to ensure resource sustenance. In: Chou, L.M. et al. eds. Towards an Integrated Management of Tropical Coastal Resources. 311-315 pp. ICLARM Conference Proceedings 22 Manila, Philippines. 455 pp.
X Cited in: Chan, H.T., J.E. Ong, W.K. Gong and A. Sasekumar. 1993. The socio-economic, ecological and environmental values of mangrove ecosystems in Malaysia and their present state of conservation. The Economic and environmental values of mangrove forests and their present state of conservation in the South-East Asia/Pacific Region. p. 41-81. Mangrove Ecosystems Technical Reports vol.3 ITTO/ISME/JIAM Project PD71/89. Rev. 1(F) Okinawa, Japan, ISME. 202 pp. The "Year" is the average weighted year.
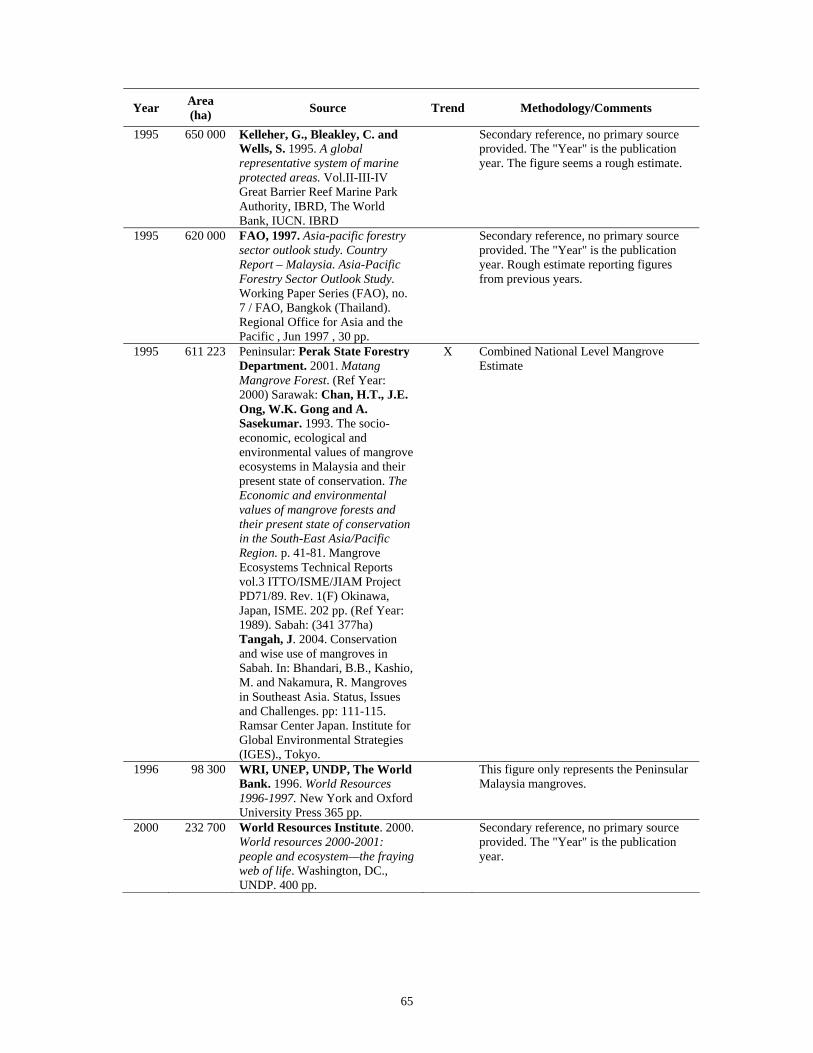
65
Year Area (ha) Source Trend Methodology/Comments
1995 650 000 Kelleher, G., Bleakley, C. and Wells, S. 1995. A global representative system of marine protected areas. Vol.II-III-IV Great Barrier Reef Marine Park Authority, IBRD, The World Bank, IUCN. IBRD
Secondary reference, no primary source provided. The "Year" is the publication year. The figure seems a rough estimate.
1995 620 000 FAO, 1997. Asia-pacific forestry sector outlook study. Country Report – Malaysia. Asia-Pacific Forestry Sector Outlook Study. Working Paper Series (FAO), no. 7 / FAO, Bangkok (Thailand). Regional Office for Asia and the Pacific , Jun 1997 , 30 pp.
Secondary reference, no primary source provided. The "Year" is the publication year. Rough estimate reporting figures from previous years.
1995 611 223 Peninsular: Perak State Forestry Department. 2001. Matang Mangrove Forest. (Ref Year: 2000) Sarawak: Chan, H.T., J.E. Ong, W.K. Gong and A. Sasekumar. 1993. The socio-economic, ecological and environmental values of mangrove ecosystems in Malaysia and their present state of conservation. The Economic and environmental values of mangrove forests and their present state of conservation in the South-East Asia/Pacific Region. p. 41-81. Mangrove Ecosystems Technical Reports vol.3 ITTO/ISME/JIAM Project PD71/89. Rev. 1(F) Okinawa, Japan, ISME. 202 pp. (Ref Year: 1989). Sabah: (341 377ha) Tangah, J. 2004. Conservation and wise use of mangroves in Sabah. In: Bhandari, B.B., Kashio, M. and Nakamura, R. Mangroves in Southeast Asia. Status, Issues and Challenges. pp: 111-115. Ramsar Center Japan. Institute for Global Environmental Strategies (IGES)., Tokyo.
X Combined National Level Mangrove Estimate
1996 98 300 WRI, UNEP, UNDP, The World Bank. 1996. World Resources 1996-1997. New York and Oxford University Press 365 pp.
This figure only represents the Peninsular Malaysia mangroves.
2000 232 700 World Resources Institute. 2000. World resources 2000-2001: people and ecosystem—the fraying web of life. Washington, DC., UNDP. 400 pp.
Secondary reference, no primary source provided. The "Year" is the publication year.
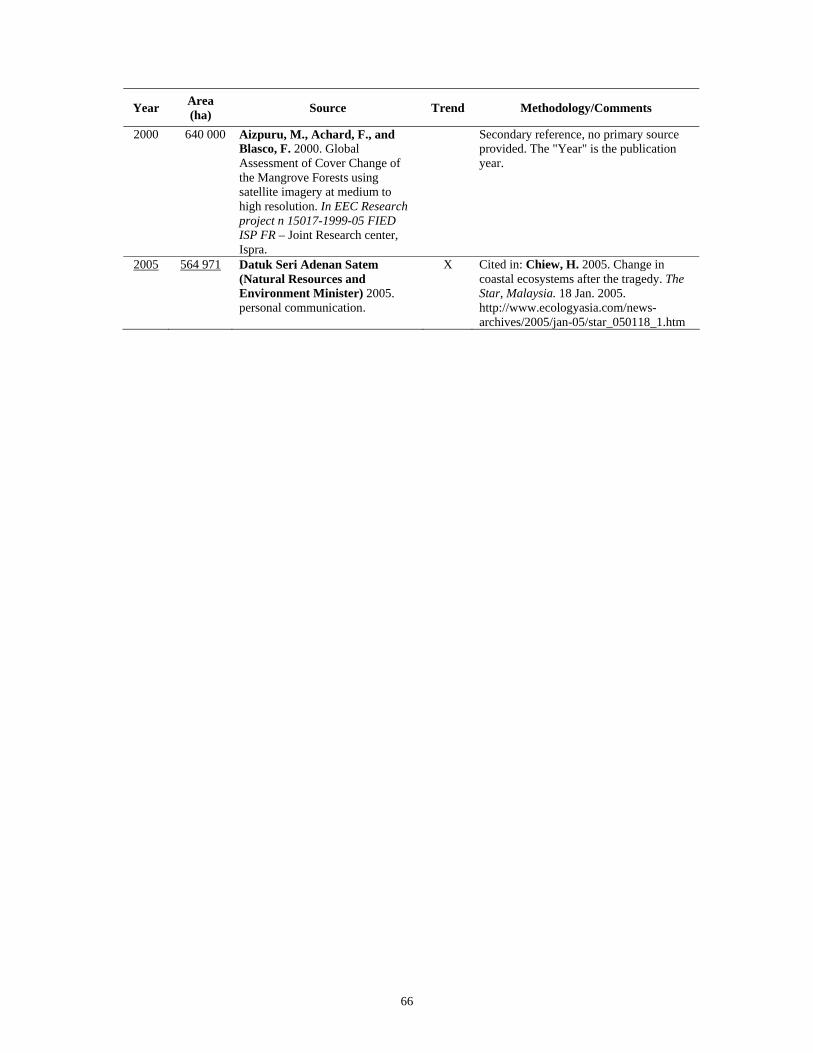
66
Year Area (ha) Source Trend Methodology/Comments
2000 640 000 Aizpuru, M., Achard, F., and Blasco, F. 2000. Global Assessment of Cover Change of the Mangrove Forests using satellite imagery at medium to high resolution. In EEC Research project n 15017-1999-05 FIED ISP FR – Joint Research center, Ispra.
Secondary reference, no primary source provided. The "Year" is the publication year.
2005 564 971 Datuk Seri Adenan Satem (Natural Resources and Environment Minister) 2005. personal communication.
X Cited in: Chiew, H. 2005. Change in coastal ecosystems after the tragedy. The Star, Malaysia. 18 Jan. 2005. http://www.ecologyasia.com/news-archives/2005/jan-05/star_050118_1.htm
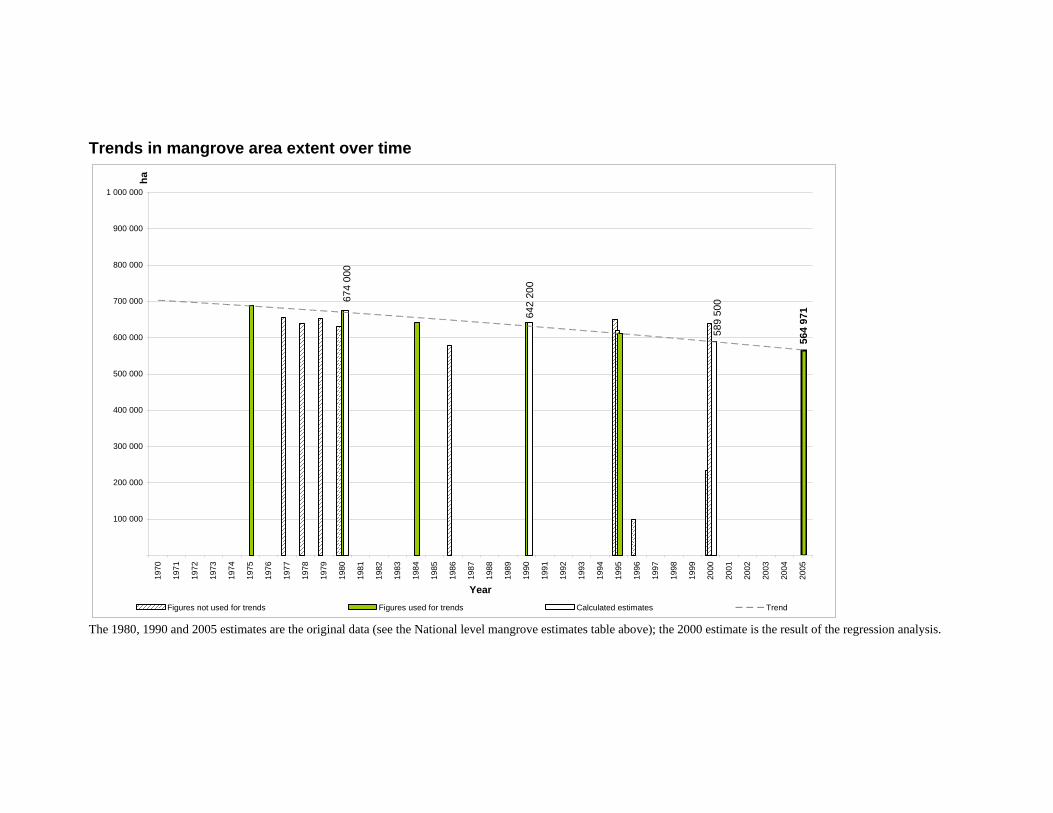
Trends in mangrove area extent over time
564
971 6
42 2
00
589
500 6
74 0
00
100 000
200 000
300 000
400 000
500 000
600 000
700 000
800 000
900 000
1 000 000
1970
1971
1972
1973
1974
1975
1976
1977
1978
1979
1980
1981
1982
1983
1984
1985
1986
1987
1988
1989
1990
1991
1992
1993
1994
1995
1996
1997
1998
1999
2000
2001
2002
2003
2004
2005
Year
ha
Figures not used for trends Figures used for trends Calculated estimates Trend
The 1980, 1990 and 2005 estimates are the original data (see the National level mangrove estimates table above); the 2000 estimate is the result of the regression analysis.

68
Summary status of mangrove area extent over time
Most reliable, recent mangrove area estimate
Mangrove area
estimate 1980
Mangrove area
estimate 1990
Mangrove area
estimate 2000
Mangrove area
estimate 2005
ha year ha ha ha ha Malaysia 564 971 2005 674 000 642 200 589 500 565 000
Formulas used for the trend analysis Polynomial trend line: y=b+c1x+c2x2+c3x3+..+cnxn where b and c1…cn are constants.
69
Maldives Vegetation description, uses and threats The Maldives is an archipelago made up by more than 1 000 islands, none of them very large in area; no rivers nor large freshwater bodies are found in this country. Mangrove stands are found in around 150 islands, and may be grouped in five different types of formations, according to the different environmental conditions as: mangroves growing a) in brackish water in fringe areas of some of the islands where the wind is calm; b) on accumulated deposits of sediments in between two islands, if the water is shallow enough; c) along the borders of small lagoons permanently or d) periodically connected to the sea and finally e) in shallow depression, receiving water when rain accumulates there. Generally mangrove stands in this country are small in size, with the largest and most diverse stands occurring on the northernmost atolls. Even though covering a relatively low extent, this ecosystem is quite rich in species, if compared to mangroves biodiversity of larger size countries in the region, for example Japan, Timor-Leste, or even Mozambique. Thirteen true mangrove species are found growing on Maldivian islands, among which Bruguiera cylindrica (Kan’doo), Bruguiera gymnorrhiza (boda vaki), Rhizophora mucronata (ran’doo), Sonneratia caseolaris (kulhlava), Lumnitzera racemosa (burevi), Ceriops tagal (karamana) and Excoecaria agallocha (thela) are the most common. Being an island nation surrounded by sea, coastal vegetation plays an important role in protecting the islands from salt spray and monsoon winds and has multiple functions with regard to economic, social, educational, conservation and heritage values. Besides the general services and benefits provided by mangrove wetlands (e.g. enhancing fishery productivity, wildlife habitat, protecting the coast against various natural hazards and coastal erosion which is especially important in these low lying countries, etc), information on more specific and local use of mangroves in the Maldives is not abundant. It has been however reported that Bruguiera sp. is an economically important species, particularly for its timber which is mostly used for boat-building. The December 2004 Indian Ocean tsunami seriously impacted coastal vegetation in the Maldives as some islands were completely “over-washed” and there was considerable accumulation of debris. Directly after the tsunami the Ministry of Environment conducted a joint survey with UNEP and the UN Office for the Coordination of Humanitarian Affairs (OCHA) and an inter-ministerial task force was formed to oversee activities. After the Tsunami, the induced coastal erosion and other damages were studied in different islands and it was understood that the degree of damage generated by the hazard was related to the size, orientation and location of the islands. The proportion of passages (open/closed), orientation (east–west, north–south), reef type (faro, patch), island form (ridge, bowl-shaped), island shape (circular, elongated), size (small, medium, large) and modifications (harbour, reclamation) resulted to be important criterias in the impact of the waves. The shape of coral reefs, the height of the island and the development of beach ridges were considered as the main factors influencing the impact of the tsunami on the coasts of Maldives. After the tsunami the awareness of the importance of coastal vegetation has increased among the local communities and planting activities are now being carried out. It has been recognized that the country would need more capacity-building opportunities and short- and long-term funded projects in order to conserve and sustainably use the coastal resource Reference:
70
Ali, M. 2007. Understanding tsunami impacts from reef island perspectives — experience from the Maldives In FAO. Coastal protection in the aftermath of the Indian Ocean tsunami: What role for forests and trees?. Proceedings of the Regional Technical Workshop, Khao Lak, Thailand, 28–31 August 2006. Compiled and edited by Braatz, S., Fortuna, S, Broadhead, J. and Leslie, R. In press. (www.fao.org/forestry/tsunami/coastalprotection)
FAO. 1993. Report to the Government of the Republic of Maldives on mangrove conservation and management. By Choudhury, J.K. FAO, Rome, 86pp.
FAO. 2007. Proceedings of the workshop on coastal area planning and management in Asian tsunami-affected countries, 27–29 September 2006, Bangkok, Thailand. RAP PUBLICATION 2007/06 (www.fao.org/forestry/site/35734/en)
FAO and Ministry of Fisheries, Agriculture and Marine Resources. 2007. Trees and Shrubs of the Maldives. Prepared by V. Selvam. FAO Regional Office for Asia and the Pacific. 246 pp. Spalding, M.D., Blasco, F. & Field, C.D. eds. 1997. World Mangrove Atlas. The International Society for Mangrove Ecosystems, Okinawa, Japan. 178 pp.
Wetlands International. 2007. Identification of mangroves in the Maldives. Preparatory activities to the “Mangrove Habitat at Huraa Islands, Maldives” project (unpublished)
True mangrove species checklist Acrostichum aureum (uncertain) Avicennia marina Bruguiera cylindrica Bruguiera gymnorrhiza Bruguiera sexangula Ceriops tagal Excoecaria agallocha Heritiera littoralis Lumnitzera racemosa Pemphis acidula Rhizophora apiculata Rhizophora mucronata Sonneratia caseolaris Xylocarpus rumphii
National level mangrove estimates Despite concerted efforts, no quantitative data were identified on the extent of mangroves in this country. Mangrove assessments – or an increased awareness of the existing information - are strongly encouraged to identify the current extent of these coastal ecosystems in the Maldives. A mapping of this ecosystem has been already undertaken in few of the islands (e.g. Huraa Islands), however a more comprehensive and national level exercise would be useful. Even though the total mangrove area growing in this country is assumed to be low and does not greatly influence the world total, an assessment of the national resources would be recommended in order to fill in the gaps in current knowledge. This information will also aid in the preparation of sustanaible use plan and management of there resources.
71
Myanmar Vegetation description, uses and threats Mangroves are situated within the tidal limits on alluvial flats in the delta and on sheltered muddy coastal areas. They are stratified depending on how much the area is affected by the daily rise and fall of the tides. The largest areas are in the Ayeyarwady delta, but these are reported as being heavily degraded. There are still some undisturbed mangroves in the country; these pristine areas are mostly concentrated away from the Ayeyarwady in the two other major areas of mangrove in the country: the northern state of Arakan, and in the south, near the border with Thailand in Tenasserim. Mangroves are also found on the offshore islands. In Rakhine and Tanintharyi Rhizophora apiculata and R. mucronata are the predominant species in association with Heritiera fomes, Bruguiera gymnorrhiza, Avicennia spp. Sonneratia spp and Xylocarpus spp; while in the Ayeyarwady delta mangroves colonize river banks. In the western areas of the country there are several forest reserves with scrubby mangroves, although these resources are heavily utilised as a source of fuelwood and charcoal for Rangoon. Conversion of mangroves into human settlements is also an important factor in this country. Excessive fuelwood cutting and conversion of mangroves into rice field are the main causes of changes in mangrove area in the country over the last 20 years, the latter being a current threat together with the conversion to shrimp ponds. The Ayeyarwady delta was the most affected area, while deforestation in Rakhine and Tanintharyi were lower, especially because of the lower human pressure on these areas. Other relevant causes of mangrove area decline were also the large scale commercial fish and prawn farming, which were introduced in the country in 1995. On the other side, mangrove plantation activities (mainly for conservation purposes) begun on a small scale in the 1980s, becoming on large scale in the second half of the 1990s in the Ayeyarwady Division, in Laputta, Bogalay and as minimum scale in Moulamyeing Townships for a total amount of around 14 000 ha. Even if there were some failures at the beginning, gained experience led to success, being Sonneratia apetala one of best growing species. In this framework rural communities play an important role, collaborating to the rehabilitation of mangroves in the Ayeyarwady, and at the same time gaining the ownership of the forest plantation (some 1 800 ha planted up to 2003). Reference: Kermode, D.W.D. 1964. Some aspects of silviculture in Burma Forest. Rangoon, Forest Department
Spalding, M.D., Blasco, F. & Field, C.D., eds. 1997. World Mangrove Atlas. The International Society for Mangrove Ecosystems, Okinawa, Japan. 178 pp. U Sann Lwin. 2005. Information provided for the Global Forest Resources Assessment (FRA) 2005 thematic study on mangroves. Unpublished.
U Won Maung 2004. Conservation & Rehabilitation of the Ayeyarwady Mangroves in Myanmar. In: Bhandari, B.B., Kashio, M. and Nakamura, R. Mangroves in Southeast Asia. Status, Issues and Challenges. pp: 135-150. Ramsar Center Japan. Institute for Global Environmental Strategies (IGES)., Tokyo.
True mangrove species checklist Acanthus ilicifolius Acrostichum aureum Acrostichum speciosum Aegialitis rotundifolia
72
Aegiceras corniculatum Avicennia alba Avicennia marina Avicennia officinalis Bruguiera cylindrica Bruguiera gymnorrhiza Bruguiera parviflora Bruguiera sexangula Ceriops decandra Ceriops tagal Excoecaria agallocha Heritiera fomes Heritiera littoralis Kandelia candel Lumnitzera littorea Lumnitzera racemosa Nypa fruticans Rhizophora apiculata Rhizophora mucronata Sonneratia alba Sonneratia apetala Sonneratia caseolaris Sonneratia griffithii Xylocarpus granatum Xylocarpus mekongensis
National level mangrove estimates
Year Area (ha) Source Trend Methodology/Comments
1972 571 056 Anon. 1979. Situation on the Delta and Coastal Mangroves and Management Proposal.
Cited in: FAO. 1992. Report on Rehabilitation, Conservation and Management of Ayeyarwady Mangroves. By Han, U.S. Feasibility study on mangrove reforestation project. FO:MYA/90/003 Field Document No 5. Yangon, Myanmar. 98 pp.
1972 571 100 Saenger, P., Hegerl E.J. and J.D.S., Davie. 1983. Global status of mangrove ecosystems. Commission on ecology Papers No.3. IUCN. Gland, Switzerland. 88 pp.
Secondary reference, no primary source provided. It seems to be based on Anon, 1979 (see above)
1972 571 071 Hthay, U. T. and U.S. Han. 1984. Mangrove forests of Burma. In: proceedings of the Asian Symposium on Mangrove Environment Research and Management, Kuala Lumpur, August 25-29, 1980. p. 82-85 Edited by E. Soepadmo, A.N. Rao and D.J. MacIntosh. 1984.
X Secondary reference, no primary source provided. The figure reported in the table of the document is 570 070.59 ha
73
Year Area (ha) Source Trend Methodology/Comments
1976 812 000 Wacharakitty, S. 1983. Mangrove Ecosystem in General. In: ESCAP/UNESCO/NRCT Regional Remote Sensing Training Course of Mangrove Ecosystem. p. 22-33. Bangkok, Nov. 28-Dec. 16 1983
Cited in: FAO. 1994. Mangrove forest management guidelines. FAO Forestry Paper 117. Rome, 319 pp. This figure could represent the extent of the wetlands.
1980 800 051 FAO, UNEP. 1981. Tropical Forest Resources Assessment Project, Forest Resources of Tropical Asia. FAO, UNEP, 475 pp.
Based on LANDSAT imagery 1976, estimated rate of deforestation till 1980. Small scale imageries (1:1 000 000 scale colour composites) could have led to an over estimate of the extent of mangroves.
1983 517 100 Saenger, P., Hegerl E.J. and J.D.S., Davie. 1983. Global status of mangrove ecosystems. Commission on ecology Papers No.3. IUCN. Gland, Switzerland. 88 pp.
Secondary reference, no primary source provided. The "Year" is the publication year.
1988 382 423 FAO. 1992. Report on Rehabilitation, Conservation and Management of Ayeyarwady Mangroves. By Han, U.S. Feasibility study on mangrove reforestation project. FO:MYA/90/003 Field Document No 5. Yangon, Myanmar. 98 pp.
No primary source provided.
1994 945 000 FAO. 1994. Feasibility Study on Mangrove Reforestation, Myanmar. Project findings and recommendations. FO:DP/MYA/90/003 Terminal report. FAO, Rome. 14 pp.
Secondary reference, no primary source provided. The "Year" is the publication year.
1994 378 600 Htay U.S.A. 1994. Re-afforestation of mangrove forests in Myanmar. In: Proceedings of the Workshop on ITTO Project: Development and Dissemination of Re-Afforestation Techniques of Mangrove Forests. JAM and NATMANCOM/NRCT.
Cited in: Spalding, M.D., Blasco, F. and Field, C.D., eds. 1997. World Mangrove Atlas. The International Society for Mangrove Ecosystems, Okinawa, Japan. 178 pp.
1995 344 400 Spalding, M.D., Blasco, F. and Field, C.D., eds. 1997. World Mangrove Atlas. The International Society for Mangrove Ecosystems, Okinawa, Japan. 178 pp.
Map analysis. Data for the Ayeyarwady Delta were obtained from Blasco and Bellan, 1995, prepared from LANDSAT MSS, LANDSAT TM and SPOT data. Further data were added based on the mangrove arcs shown on Petroconsultants SA, 1990. Blasco, F and Bellan, M.F. 1995. A Vegetation Map of Tropical Continental Asia. 1:5 000 000. Institut de la Carte Internationale de la Végétation, Toulouse, France. Petroconsultants SA. 1990. MUNDOCART/CD. Version 2.0. 1:1 000 000 world map prepared from the Operational Navigational Charts of the United States Defence Mapping Agency. Petroconsultants (CES) Ltd, London, UK.
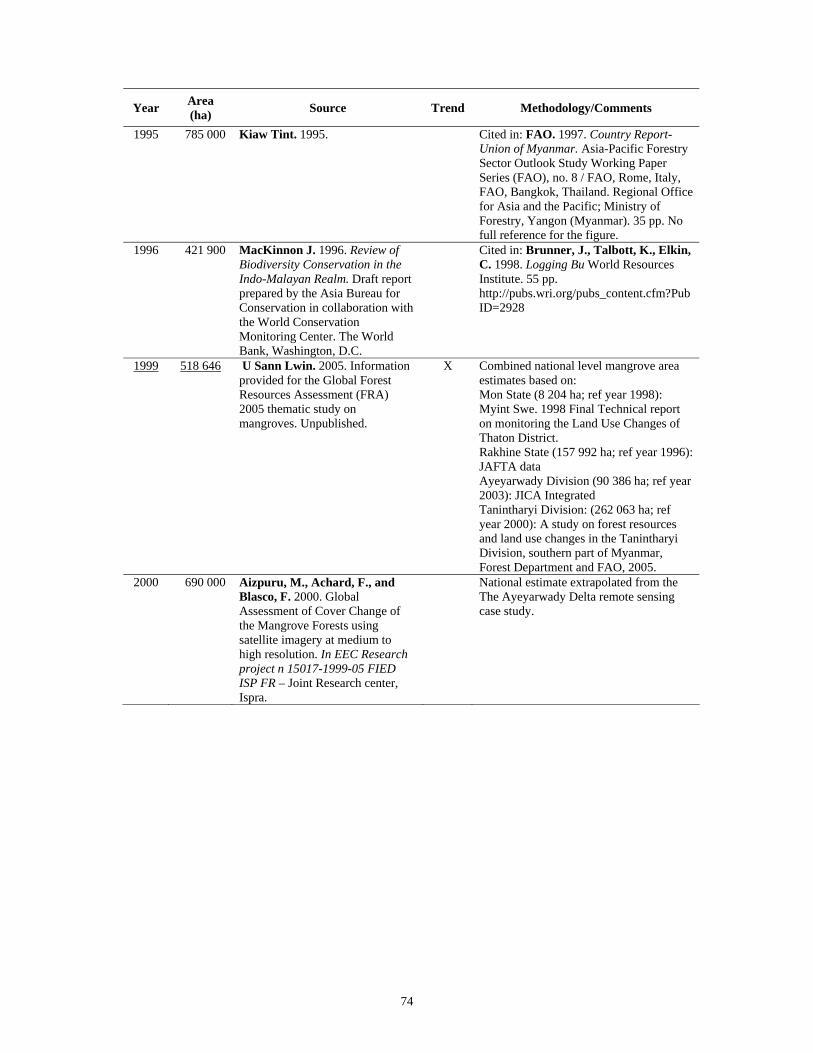
74
Year Area (ha) Source Trend Methodology/Comments
1995 785 000 Kiaw Tint. 1995. Cited in: FAO. 1997. Country Report-Union of Myanmar. Asia-Pacific Forestry Sector Outlook Study Working Paper Series (FAO), no. 8 / FAO, Rome, Italy, FAO, Bangkok, Thailand. Regional Office for Asia and the Pacific; Ministry of Forestry, Yangon (Myanmar). 35 pp. No full reference for the figure.
1996 421 900 MacKinnon J. 1996. Review of Biodiversity Conservation in the Indo-Malayan Realm. Draft report prepared by the Asia Bureau for Conservation in collaboration with the World Conservation Monitoring Center. The World Bank, Washington, D.C.
Cited in: Brunner, J., Talbott, K., Elkin, C. 1998. Logging Bu World Resources Institute. 55 pp. http://pubs.wri.org/pubs_content.cfm?PubID=2928
1999 518 646 U Sann Lwin. 2005. Information provided for the Global Forest Resources Assessment (FRA) 2005 thematic study on mangroves. Unpublished.
X Combined national level mangrove area estimates based on: Mon State (8 204 ha; ref year 1998): Myint Swe. 1998 Final Technical report on monitoring the Land Use Changes of Thaton District. Rakhine State (157 992 ha; ref year 1996): JAFTA data Ayeyarwady Division (90 386 ha; ref year 2003): JICA Integrated Tanintharyi Division: (262 063 ha; ref year 2000): A study on forest resources and land use changes in the Tanintharyi Division, southern part of Myanmar, Forest Department and FAO, 2005.
2000 690 000 Aizpuru, M., Achard, F., and Blasco, F. 2000. Global Assessment of Cover Change of the Mangrove Forests using satellite imagery at medium to high resolution. In EEC Research project n 15017-1999-05 FIED ISP FR – Joint Research center, Ispra.
National estimate extrapolated from the The Ayeyarwady Delta remote sensing case study.
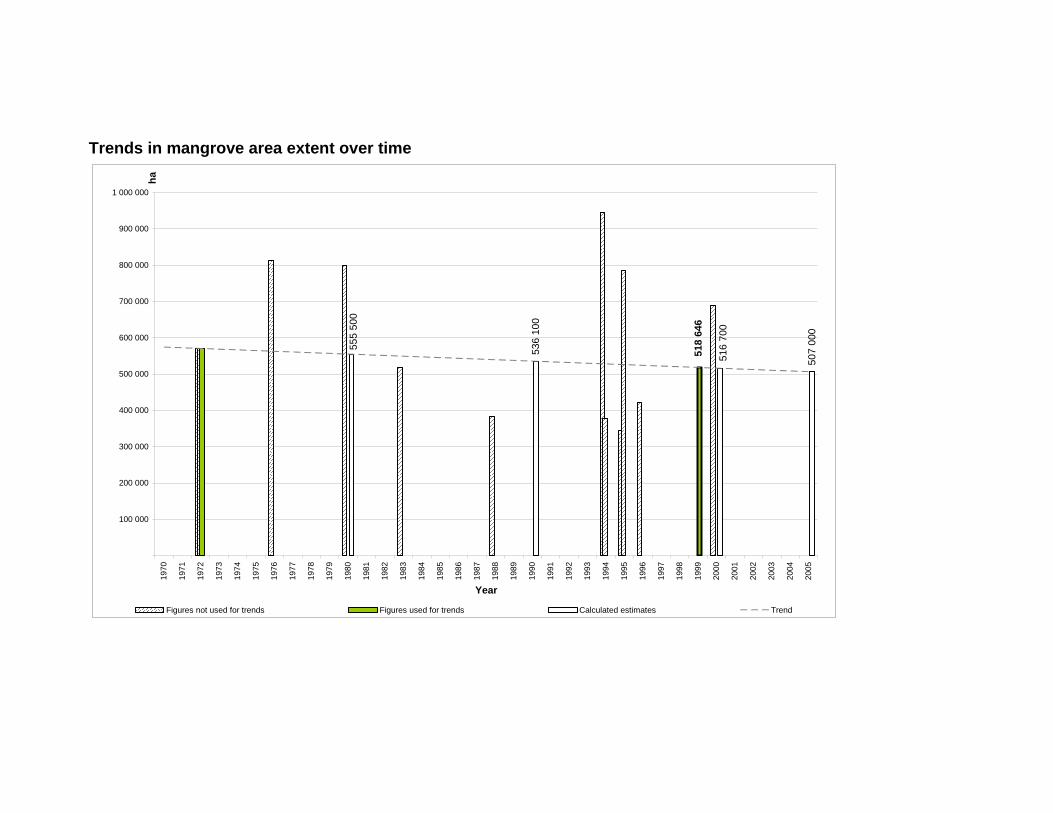
Trends in mangrove area extent over time
507
000
518
646
516
700
555
500
536
100
100 000
200 000
300 000
400 000
500 000
600 000
700 000
800 000
900 000
1 000 000
1970
1971
1972
1973
1974
1975
1976
1977
1978
1979
1980
1981
1982
1983
1984
1985
1986
1987
1988
1989
1990
1991
1992
1993
1994
1995
1996
1997
1998
1999
2000
2001
2002
2003
2004
2005
Year
ha
Figures not used for trends Figures used for trends Calculated estimates Trend
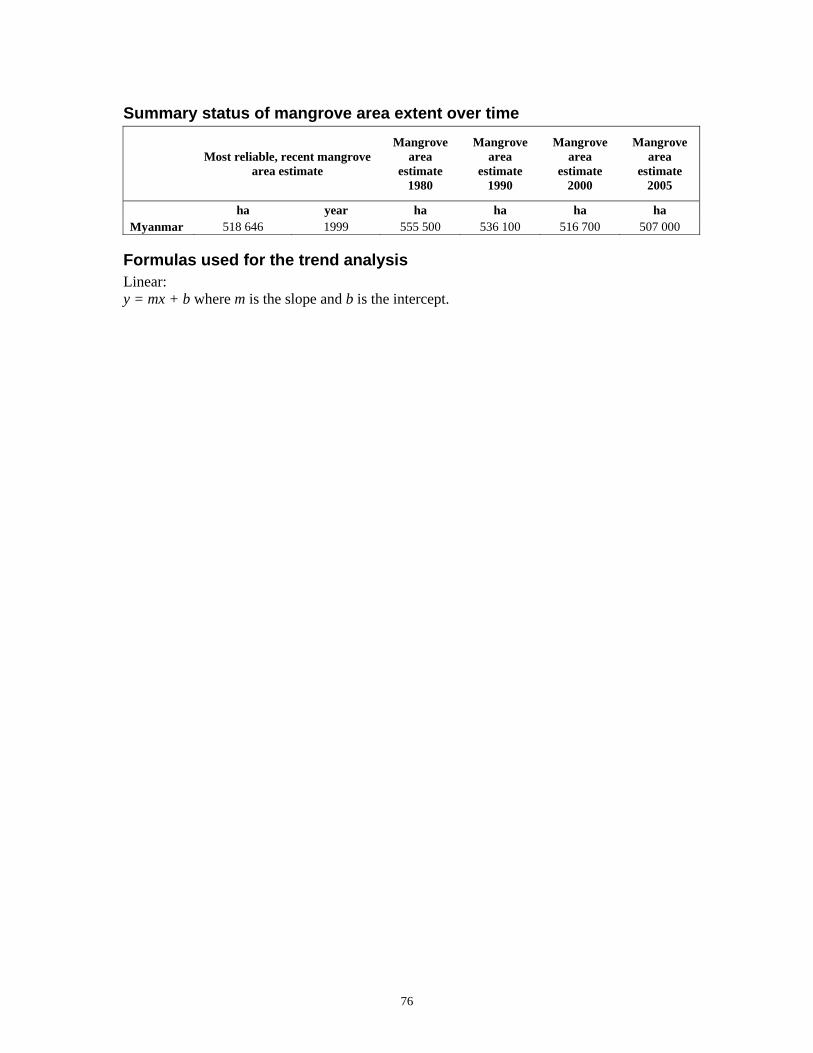
76
Summary status of mangrove area extent over time
Most reliable, recent mangrove area estimate
Mangrove area
estimate 1980
Mangrove area
estimate 1990
Mangrove area
estimate 2000
Mangrove area
estimate 2005
ha year ha ha ha ha Myanmar 518 646 1999 555 500 536 100 516 700 507 000
Formulas used for the trend analysis Linear: y = mx + b where m is the slope and b is the intercept.
77
Oman Vegetation description, uses and threats Oman has scattered but fairly dense stands of mangroves on the northeast coast and some small stands with trees reaching 6 m in height on the southeast coast. Among the fifteen sites with mangroves one of the largest is located in Qurm (Muscat). The forest structure is very simple Avicennia marina is the only species growing in this country, even though there are evidences of Rhizophora sp. previously occurring in some areas. In this country A. marina trees generally grow 2 to 6 m in height. In the Gulf of Oman there is very little human use of the mangroves, although they are used in some areas as cultivated land, fodder for camels, for fuel, and as poles or stakes for fishing. These uses are probably decreasing in line with increasing wealth in the region. Conversely many areas are threatened by pollution, especially caused by oil and landfill associated with urban and industrial development. Natural regeneration and reforestation for environmental protection purposes seem to have balanced the loss of mangroves especially at Batinah, Sharquiya and Dhofar Regions. In addition some attempts of Rhizophora stylosa plantations have been made during the last twenty years on experimental plots in Qurm creek and near Salalah. Reference: Alkathiri, A.M.M. 2004. Information provided for the Global Forest Resources Assessment (FRA) 2005 thematic study on mangroves. Unpublished
Scott, D.A., ed. 1995. A Directory of Wetlands in the Middle East. IUCN, Gland, Switzerland and IWRB, Slimbridge, U.K. xvii + 560pp, 13 maps.
Spalding, M.D., Blasco, F. & Field, C.D., eds. 1997. World Mangrove Atlas. The International Society for Mangrove Ecosystems, Okinawa, Japan. 178 pp.
UNEP. 1999. Overview on Land-based Sources and Activities Affecting the Marine Environment in the ROPME Sea Area. UNEP Regional Seas Reports and Studies No. 168. 127 pp.
True mangrove species checklist Avicennia marina
National level mangrove estimates
Year Area (ha) Trend Source Methodology/Comments
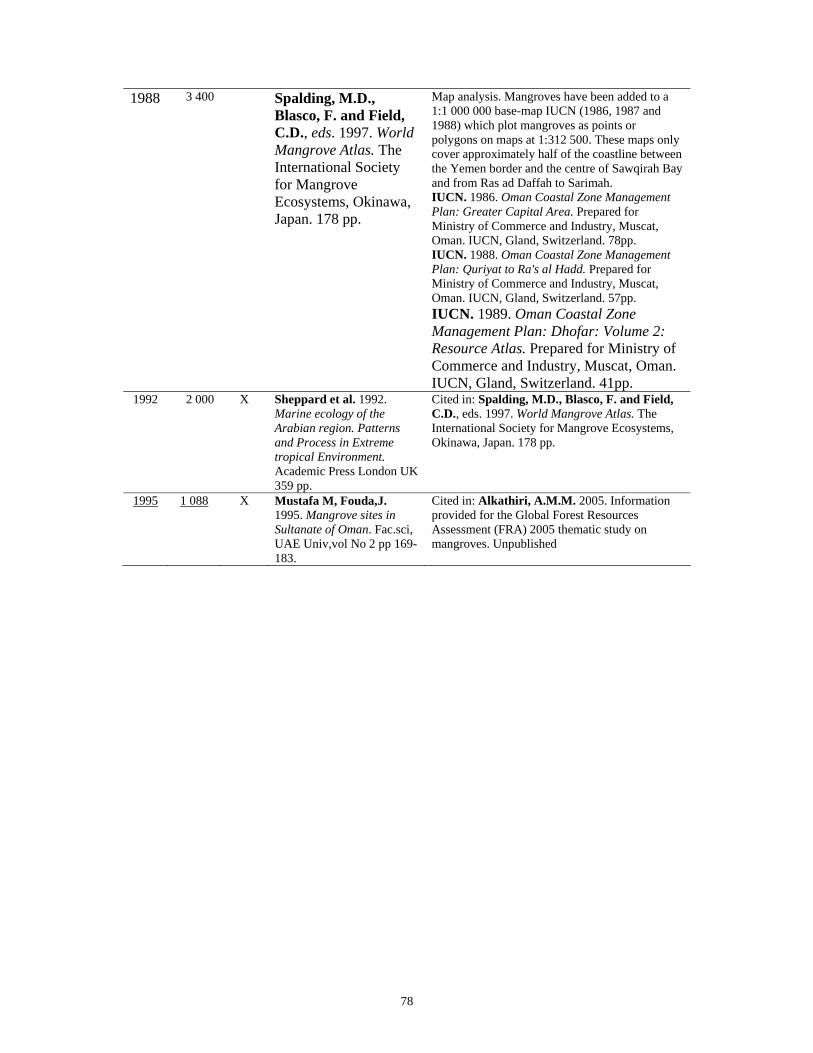
78
1988 3 400 Spalding, M.D., Blasco, F. and Field, C.D., eds. 1997. World Mangrove Atlas. The International Society for Mangrove Ecosystems, Okinawa, Japan. 178 pp.
Map analysis. Mangroves have been added to a 1:1 000 000 base-map IUCN (1986, 1987 and 1988) which plot mangroves as points or polygons on maps at 1:312 500. These maps only cover approximately half of the coastline between the Yemen border and the centre of Sawqirah Bay and from Ras ad Daffah to Sarimah. IUCN. 1986. Oman Coastal Zone Management Plan: Greater Capital Area. Prepared for Ministry of Commerce and Industry, Muscat, Oman. IUCN, Gland, Switzerland. 78pp. IUCN. 1988. Oman Coastal Zone Management Plan: Quriyat to Ra's al Hadd. Prepared for Ministry of Commerce and Industry, Muscat, Oman. IUCN, Gland, Switzerland. 57pp. IUCN. 1989. Oman Coastal Zone Management Plan: Dhofar: Volume 2: Resource Atlas. Prepared for Ministry of Commerce and Industry, Muscat, Oman. IUCN, Gland, Switzerland. 41pp.
1992 2 000 X Sheppard et al. 1992. Marine ecology of the Arabian region. Patterns and Process in Extreme tropical Environment. Academic Press London UK 359 pp.
Cited in: Spalding, M.D., Blasco, F. and Field, C.D., eds. 1997. World Mangrove Atlas. The International Society for Mangrove Ecosystems, Okinawa, Japan. 178 pp.
1995 1 088 X Mustafa M, Fouda,J. 1995. Mangrove sites in Sultanate of Oman. Fac.sci, UAE Univ,vol No 2 pp 169- 183.
Cited in: Alkathiri, A.M.M. 2005. Information provided for the Global Forest Resources Assessment (FRA) 2005 thematic study on mangroves. Unpublished
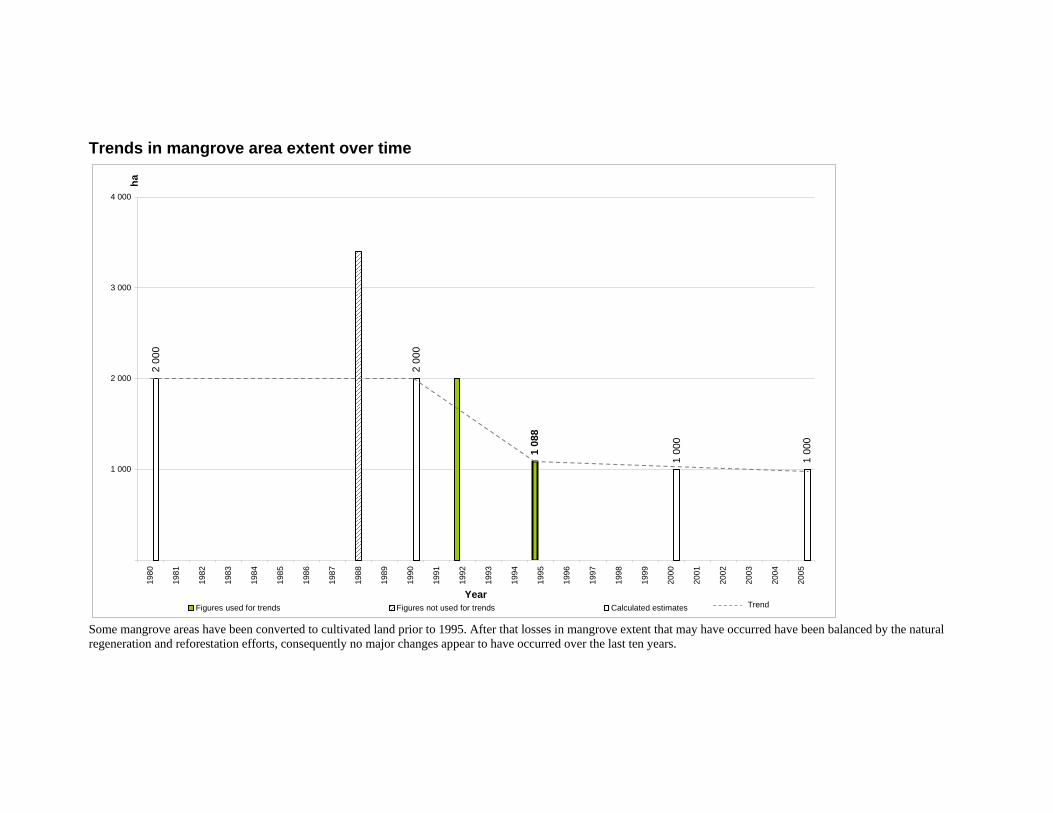
Trends in mangrove area extent over time 2
000
2 0
00
1 0
00
1 0
00
1 0
88
1 000
2 000
3 000
4 000
1980
1981
1982
1983
1984
1985
1986
1987
1988
1989
1990
1991
1992
1993
1994
1995
1996
1997
1998
1999
2000
2001
2002
2003
2004
2005
Year
ha
Figures used for trends Figures not used for trends Calculated estimates Trend
Some mangrove areas have been converted to cultivated land prior to 1995. After that losses in mangrove extent that may have occurred have been balanced by the natural regeneration and reforestation efforts, consequently no major changes appear to have occurred over the last ten years.
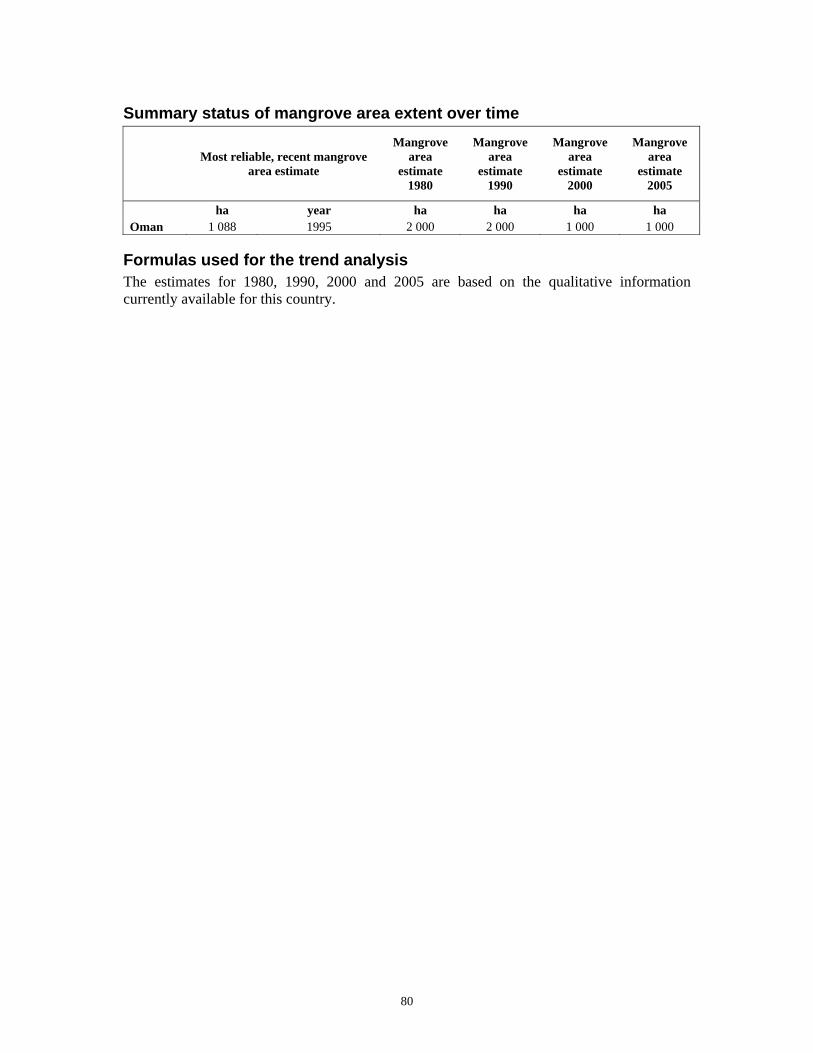
80
Summary status of mangrove area extent over time
Most reliable, recent mangrove area estimate
Mangrove area
estimate 1980
Mangrove area
estimate 1990
Mangrove area
estimate 2000
Mangrove area
estimate 2005
ha year ha ha ha ha Oman 1 088 1995 2 000 2 000 1 000 1 000
Formulas used for the trend analysis The estimates for 1980, 1990, 2000 and 2005 are based on the qualitative information currently available for this country.
81
Pakistan Vegetation description, uses and threats The coastline of Pakistan is essentially arid, with low rainfall, mostly falling during the monsoon period (April to September). This climatic factor plays an important role in the distribution and structure of mangroves in the country. The largest area is found in the Indus Delta and it is almost completely consisting of Avicennia marina; the remainder areas are mostly restricted to small patches in bays and small seasonal river mouths. The biodiversity of these ecosystems in Pakistan is limited to four true mangrove species. In undisturbed areas and where the factors permit it, trees may grow up to 10 m in height. Mangroves in the Indus Delta have been heavily used by man for fuelwood, poles, fodder and camel grazing. There is some collection of timber for supply to markets in Karachi. Artisans and commercial fisherfolk use mangrove areas for prawn and fish capture and, during the fishing season (October to May) they move into the mangroves and establish temporary villages in some of the creeks. In some occasions these activities may represent threats to mangrove stands, because of the over-exploitation of wood, leading to loss and degradation of the areas. Considerable threats also arise from pollution particularly from industrial effluents from Karachi, and from the increasing salinities caused by interruptions to the flow of the Indus with the construction of barrages and diversion of water for irrigation. The reduced flow of the Indus is also reducing the input of silt into the system, which could have further long-term effects, and it also damaged significant extent of cultivable land in the coastal districts of Thatta and Badin. Increasing salinities are likely to further stunt tree growth, and may be the cause of reduced seedling recruitment observed in some areas. Oil pollution discharged from the ships visiting Karachi is a large and increasing threat. Consequently a significant number of species have been negatively affected by anthropogenic impacts. Currently, the continued drought and the increasing demand for fuelwood and timber are still an important threat. On the other hand two large areas within the Indus Delta were declared as protected forest in 1957 and are currently managed by the Forest Department; many efforts are done to establish mangrove plantations along the entire coast for rehabilitation purposes, 19 000 ha of Avicennia marina and Rhizophora mucronata have been rehabilated in Sindh and Balochistan in the 1990 within a collaboration between the Sindh Government and IUCN and around 17 000 ha have been restored in the Indus delta with support of the World Bank in 1999. Reference: FAO, UNEP. 1981. Tropical Forest Resources Assessment Project, Forest Resources of Tropical Asia. FAO, UNEP, 475 pp.
Kanwar, M.S. 2005. Information provided for the Global Forest Resources Assessment (FRA) 2005 thematic study on mangroves. Unpublished.
Khan, M.A. 2005. Information provided for the Global Forest Resources Assessment (FRA) 2005 thematic study on mangroves. Unpublished.
Pakistan Forest Institute. 2004 National Forest and Rangeland Resource Assessment Study. Final Report. Peshawar, Pakistan. Rehman, L.M. and Sheikh, M.I. 1986. Mangroves of Pakistan. The Pakistan Journal of Forestry 36 (4)
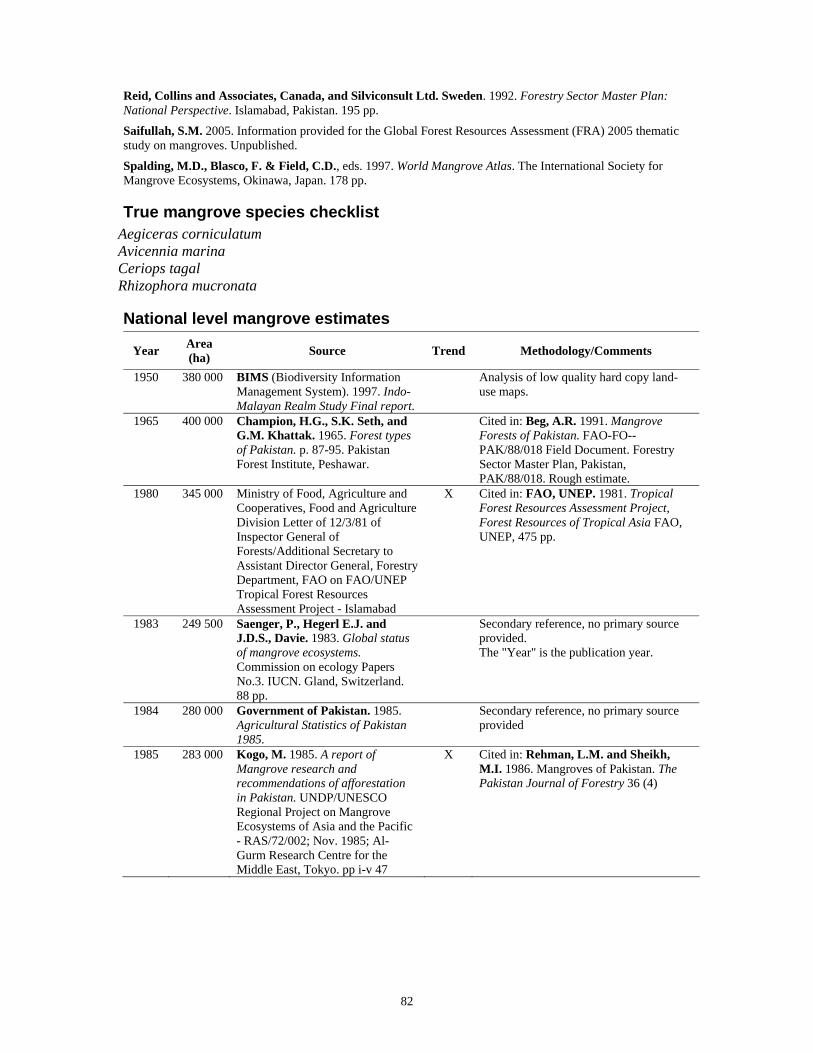
82
Reid, Collins and Associates, Canada, and Silviconsult Ltd. Sweden. 1992. Forestry Sector Master Plan: National Perspective. Islamabad, Pakistan. 195 pp.
Saifullah, S.M. 2005. Information provided for the Global Forest Resources Assessment (FRA) 2005 thematic study on mangroves. Unpublished.
Spalding, M.D., Blasco, F. & Field, C.D., eds. 1997. World Mangrove Atlas. The International Society for Mangrove Ecosystems, Okinawa, Japan. 178 pp.
True mangrove species checklist Aegiceras corniculatum Avicennia marina Ceriops tagal Rhizophora mucronata
National level mangrove estimates
Year Area (ha) Source Trend Methodology/Comments
1950 380 000 BIMS (Biodiversity Information Management System). 1997. Indo-Malayan Realm Study Final report.
Analysis of low quality hard copy land-use maps.
1965 400 000 Champion, H.G., S.K. Seth, and G.M. Khattak. 1965. Forest types of Pakistan. p. 87-95. Pakistan Forest Institute, Peshawar.
Cited in: Beg, A.R. 1991. Mangrove Forests of Pakistan. FAO-FO--PAK/88/018 Field Document. Forestry Sector Master Plan, Pakistan, PAK/88/018. Rough estimate.
1980 345 000 Ministry of Food, Agriculture and Cooperatives, Food and Agriculture Division Letter of 12/3/81 of Inspector General of Forests/Additional Secretary to Assistant Director General, Forestry Department, FAO on FAO/UNEP Tropical Forest Resources Assessment Project - Islamabad
X Cited in: FAO, UNEP. 1981. Tropical Forest Resources Assessment Project, Forest Resources of Tropical Asia FAO, UNEP, 475 pp.
1983 249 500 Saenger, P., Hegerl E.J. and J.D.S., Davie. 1983. Global status of mangrove ecosystems. Commission on ecology Papers No.3. IUCN. Gland, Switzerland. 88 pp.
Secondary reference, no primary source provided. The "Year" is the publication year.
1984 280 000 Government of Pakistan. 1985. Agricultural Statistics of Pakistan 1985.
Secondary reference, no primary source provided
1985 283 000 Kogo, M. 1985. A report of Mangrove research and recommendations of afforestation in Pakistan. UNDP/UNESCO Regional Project on Mangrove Ecosystems of Asia and the Pacific - RAS/72/002; Nov. 1985; Al-Gurm Research Centre for the Middle East, Tokyo. pp i-v 47
X Cited in: Rehman, L.M. and Sheikh, M.I. 1986. Mangroves of Pakistan. The Pakistan Journal of Forestry 36 (4)
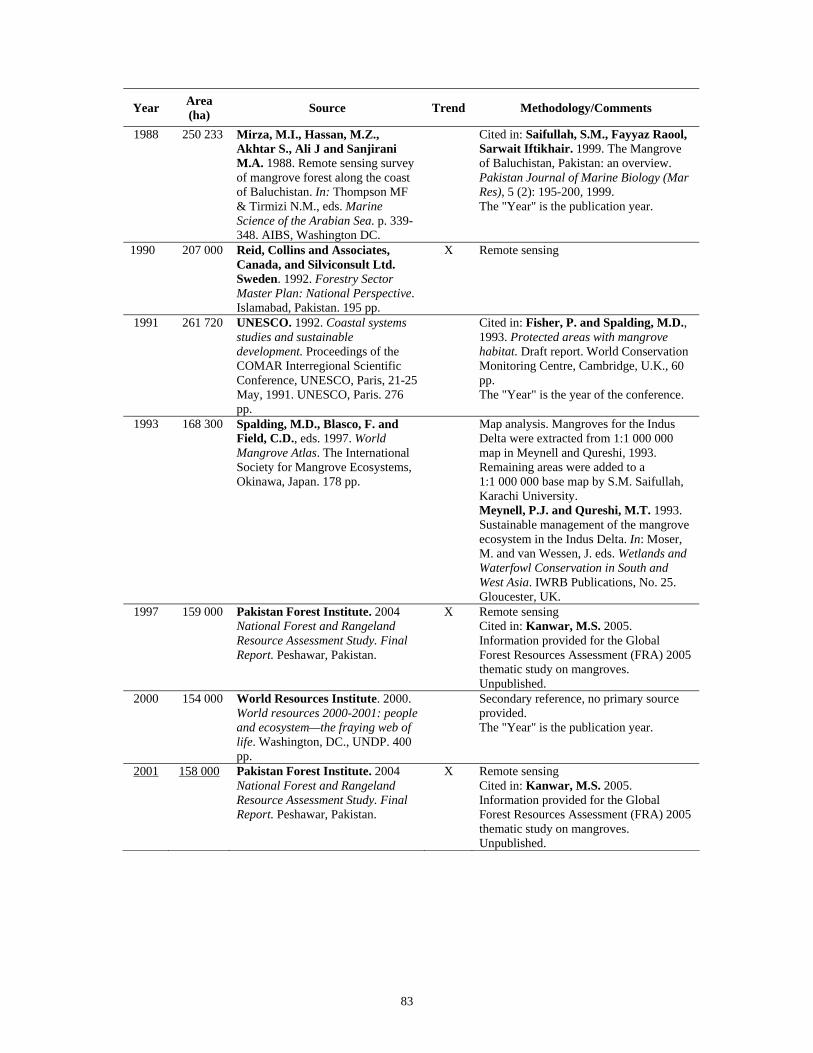
83
Year Area (ha) Source Trend Methodology/Comments
1988 250 233 Mirza, M.I., Hassan, M.Z., Akhtar S., Ali J and Sanjirani M.A. 1988. Remote sensing survey of mangrove forest along the coast of Baluchistan. In: Thompson MF & Tirmizi N.M., eds. Marine Science of the Arabian Sea. p. 339-348. AIBS, Washington DC.
Cited in: Saifullah, S.M., Fayyaz Raool, Sarwait Iftikhair. 1999. The Mangrove of Baluchistan, Pakistan: an overview. Pakistan Journal of Marine Biology (Mar Res), 5 (2): 195-200, 1999. The "Year" is the publication year.
1990 207 000 Reid, Collins and Associates, Canada, and Silviconsult Ltd. Sweden. 1992. Forestry Sector Master Plan: National Perspective. Islamabad, Pakistan. 195 pp.
X Remote sensing
1991 261 720 UNESCO. 1992. Coastal systems studies and sustainable development. Proceedings of the COMAR Interregional Scientific Conference, UNESCO, Paris, 21-25 May, 1991. UNESCO, Paris. 276 pp.
Cited in: Fisher, P. and Spalding, M.D., 1993. Protected areas with mangrove habitat. Draft report. World Conservation Monitoring Centre, Cambridge, U.K., 60 pp. The "Year" is the year of the conference.
1993 168 300 Spalding, M.D., Blasco, F. and Field, C.D., eds. 1997. World Mangrove Atlas. The International Society for Mangrove Ecosystems, Okinawa, Japan. 178 pp.
Map analysis. Mangroves for the Indus Delta were extracted from 1:1 000 000 map in Meynell and Qureshi, 1993. Remaining areas were added to a 1:1 000 000 base map by S.M. Saifullah, Karachi University. Meynell, P.J. and Qureshi, M.T. 1993. Sustainable management of the mangrove ecosystem in the Indus Delta. In: Moser, M. and van Wessen, J. eds. Wetlands and Waterfowl Conservation in South and West Asia. IWRB Publications, No. 25. Gloucester, UK.
1997 159 000 Pakistan Forest Institute. 2004 National Forest and Rangeland Resource Assessment Study. Final Report. Peshawar, Pakistan.
X Remote sensing Cited in: Kanwar, M.S. 2005. Information provided for the Global Forest Resources Assessment (FRA) 2005 thematic study on mangroves. Unpublished.
2000 154 000 World Resources Institute. 2000. World resources 2000-2001: people and ecosystem—the fraying web of life. Washington, DC., UNDP. 400 pp.
Secondary reference, no primary source provided. The "Year" is the publication year.
2001 158 000 Pakistan Forest Institute. 2004 National Forest and Rangeland Resource Assessment Study. Final Report. Peshawar, Pakistan.
X Remote sensing Cited in: Kanwar, M.S. 2005. Information provided for the Global Forest Resources Assessment (FRA) 2005 thematic study on mangroves. Unpublished.
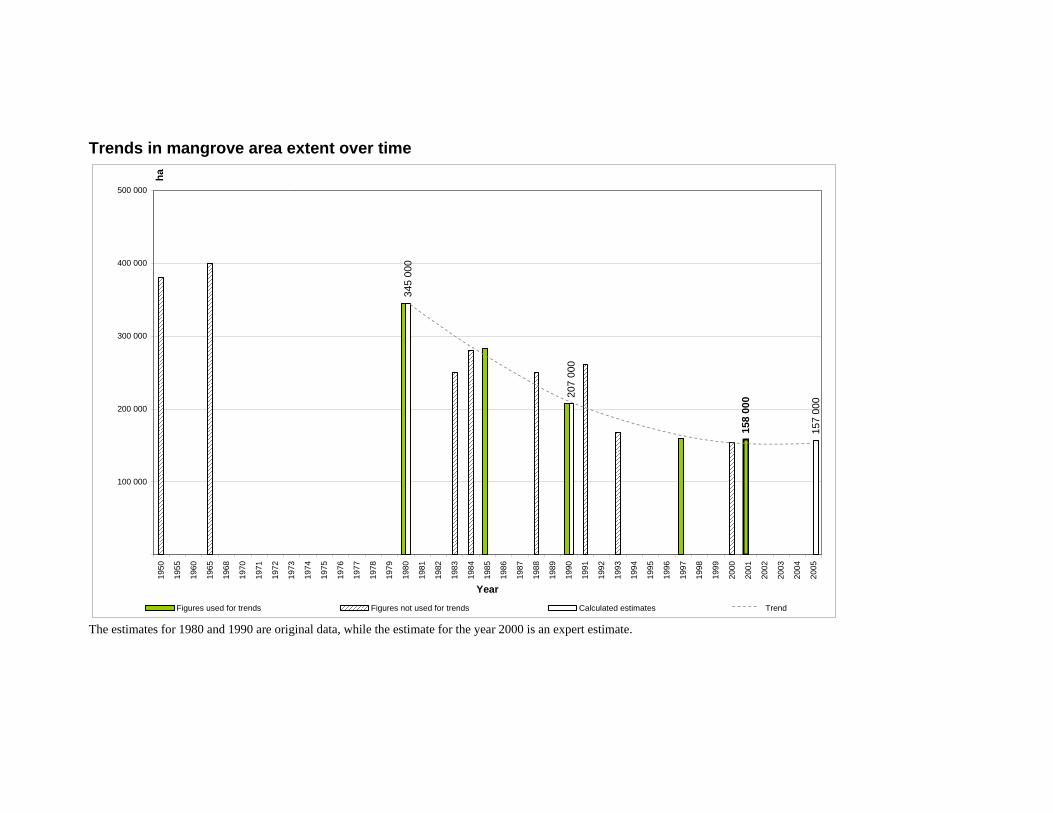
Trends in mangrove area extent over time
345
000
207
000
157
000
158
000
100 000
200 000
300 000
400 000
500 000
1950
1955
1960
1965
1968
1970
1971
1972
1973
1974
1975
1976
1977
1978
1979
1980
1981
1982
1983
1984
1985
1986
1987
1988
1989
1990
1991
1992
1993
1994
1995
1996
1997
1998
1999
2000
2001
2002
2003
2004
2005
Year
ha
Figures used for trends Figures not used for trends Calculated estimates Trend
The estimates for 1980 and 1990 are original data, while the estimate for the year 2000 is an expert estimate.

85
Summary status of mangrove area extent over time
Most reliable, recent mangrove area estimate
Mangrove area
estimate 1980
Mangrove area
estimate 1990
Mangrove area
estimate 2000
Mangrove area
estimate 2005
ha year ha ha ha ha Pakistan 158 000 2001 345 000 207 000 158 000 157 000
Formulas used for the trend analysis Polynomial trend line: y=b+c1x+c2x2+c3x3+..+cnxn where b and c1…cn are constants.
86
Philippines Vegetation description, uses and threats The Philippines are a large archipelago composed by approximately 7 150 islands, with a tropical monsoon climate, with high humidity and rainfall. The largest remaining mangrove forests are located in the south of the archipelago, on Mindanao and Samar islands, and in the west, on Palawan island. Mangrove biodiversity in this country is very high and around 40 true mangrove species are recorded, reaching a complex zonation patterns in undisturbed communities. The dominant tree species are the seaward Avicennia marina and Sonneratia alba mostly found in fringing mangroves, followed by Rhizophora apiculata, Rhizophora mucronata, Ceriops tagal, Ceriops decandra, and Bruguiera gymnorrhiza, in the mid-intertidal. The common upper intertidal or landward species are Excoecaria agallocha, Lumnitzera racemosa, Xylocarpus granatum and Heritiera littoralis. Further upstream, where the water is not so brackish, nipa palm (Nypa fruticans) may form extensive and dense stands. This archipelago is strongly affected by tropical cyclones (20-30 typhoons yearly) which can have a devastating effect on human populations on the coast, and in this country mangroves are well appreciated for their coastal protection services. Mangroves also contribute to stabilizing sediments, reducing shoreline and riverbank erosion, preventing floods and recycling nutrients. Fisheries products collected directly in the mangroves include fish, prawns, shrimps, crabs and bivalves gleaned from mudflats. Important offshore fisheries are also closely linked to mangrove health. Wood products are very requested, firewood, tanbark and timber are mainly used for dwellings, construction, fences, furniture, boats and fishing poles. Minor products in the past were fibers and ropes, corks and floats, mats and paper. The versatile palm Nypa fruticans yields thatch from the leaflets for house construction, sweetmeats from the endosperm and a local drink, vinegar, wine or alcohol from the sap. Over 85 percent of the proof alcohol production in the 1800s were distilled from Nypa sap; each hectare of Nypa could produce between 6 500 and 10 200 liters of alcohol yearly. In addition mangrove forests used to be the source of tan bark for the tannin extract industry, with Ceriops tagal as the preferred species, followed by Rhizophora and Bruguiera. A soluble dye powder extracted from the dried bark was widely used for dyeing fish nets made of cotton before the arrival of nylon nets and for tanning leather. Among the causes of mangrove area changes over time the over-exploitation of the wood resources by coastal communities for domestic fuelwood and by companies for commercial charcoal and timber, together with the conversion of land to agriculture and salt ponds impacted the most these ecosystems. Urban and harbour development, industry, channel construction and mining further contributed to their degradation. However, the large-scale development of milkfish culture ponds caused the greatest mangrove losses in the country; government incentives were released in the form of loans in the 1950s and 1960s and the activity increased from 90 000 ha in 1952 to over 210 000 ha in 1997. Around the 95 percent of brackish water ponds derived from mangroves. Currently the major threats to these forests are represented by the high request of wood for housing and for charcoal production, the increasing population pressure and tourism development in the coastal areas. A whole suite of administrative decrees, orders and
87
proclamations has been promulgated to protect remaining mangrove areas and mitigate widespread deforestation. These include laws on mangrove jurisdiction, zoning, fishpond conversion, protection (the Palawan mangrove forest reserve among others), conservation, rehabilitation and tenure. Unfortunately effective enforcement is hampered by the lack of manpower and resources leading to a weak implementation of the laws. Thus, although some legislation for mangrove protection exists there is little evidence that such protection is effective on the ground. Some mangrove afforestations, notably in the Sulu Archipelago and the central Visayas, including Negros, Bohol and Cebu have been undertaken, much of this carried out at the local and community level; nearly 15 000 ha have also been planted trough the CEP/CMM (Coastal Environment Program/Coastal and Marine Management) and FSPL2 (Forestry Sector Project Loan II of the Department) between 1997 and 2004. Research into afforestation methods and mangrove friendly aquaculture technologies (e.g. mudcrab culture) are underway. Traditional or non-destructive fishing within mangrove areas is still important, notably in Bohol, Sulu and Cebu. Target species include shellfish and crabs as well as fish caught by net or line. These are all step forward in the protection and sustainable use of mangroves, however much still need to be done for a proper awareness among rural populations of the services and benefits provided by these coastal ecosystems. Reference: Barangan, F. 2004. Information provided for the Global Forest Resources Assessment (FRA) 2005 thematic study on mangroves. Unpublished
Bureau of Forest Development. 1981. Philippines Forestry Statistics. Diliman, Quezon City. Cited in: Jara, R. S. 1984. Aquaculture and Mangroves in the Philippines. In: Ong Jin-Eong and Gong Wooi-Khoon, 1984. Productivity of the Mangrove Ecosystem: Management Implications. p. 97-107.
FAO, UNEP. 1981. Tropical Forest Resources Assessment Project, Forest Resources of Tropical Asia. FAO, UNEP, 475 pp.
Philippine Council for Agriculture, Forestry and Natural Resources Research and Development. 1991. The Philippines recommends for mangrove production and harvesting. Philippines Recommends series No.74. PCARRD / DENR. 96pp.
Primavera, J.H., 1993. A critical review of shrimp pond culture in the Philippines. Rev. Fish. Sci. 1, 151-201
Primavera, J.H. 1995. Mangroves and Brackishwater pond culture in the Philippines Hydrobiologia 295: 303-309
Primavera, J.H. 2000. Development and conservation of Philippine mangroves: institutional issues. Ecol. Econ. 35:91-106
Primavera, J.H., R.B. Sadaba, M.J.H.L. Lebata & J.P. Altamirano. 2004. Handbook of Mangroves in the Philippines – Panay. SEAFDEC Aquaculture Department (Philippines) and UNESCO Man and the Biosphere ASPACO Project, 106 pp.
Spalding, M.D., Blasco, F. & Field, C.D., eds. 1997. World Mangrove Atlas. The International Society for Mangrove Ecosystems, Okinawa, Japan. 178 pp.
True mangrove species checklist Acanthus ebracteatus Acanthus ilicifolius Acrostichum aureum Acrostichum speciosum Aegiceras corniculatum Aegiceras floridum Avicennia alba Avicennia marina

88
Avicennia officinalis Avicennia rumphiana Bruguiera cylindrica Bruguiera gymnorrhiza Bruguiera parviflora Bruguiera sexangula Camptostemon philippinensis Ceriops decandra Ceriops tagal Excoecaria agallocha Heritiera littoralis
Kandelia candel Lumnitzera littorea Lumnitzera racemosa Nypa fruticans Osbornia octodonta Pemphis acidula Rhizophora apiculata Rhizophora mucronata Rhizophora stylosa Rhizophora x lamarckii Scyphiphora hydrophyllacea Sonneratia alba Sonneratia caseolaris Sonneratia ovata Xylocarpus granatum Xylocarpus mekongensis Xylocarpus moluccensis Xylocarpus rumphii
National level mangrove estimates
Year Area (ha) Source Trend Methodology/Comments
1918 500 000 Brown and Fisher. 1920. Philippine Mangrove Swamps. Minor Forest Products of the Philippines Vol. I, 22, DANR, Bureau of Forestry Bul. No. 17
Cited in: Melana, E.E. 1994. Mangrove ecosystem: concept and some implications to rehabilitation and management. In: proceedings of the Conference: FSP-DENR Component Trainor's Training for CBMFM Nov.21-Dec 2. Owen's Hotel, Lucena City.
1918 450 000 Philippine Council for Agriculture, Forestry and Natural Resources Research and Development. 1991. The Philippines recommends for mangrove production and harvesting. Philippines Recommends series No.74. PCARRD / DENR. 96pp.
X Secondary reference, no primary source provided.
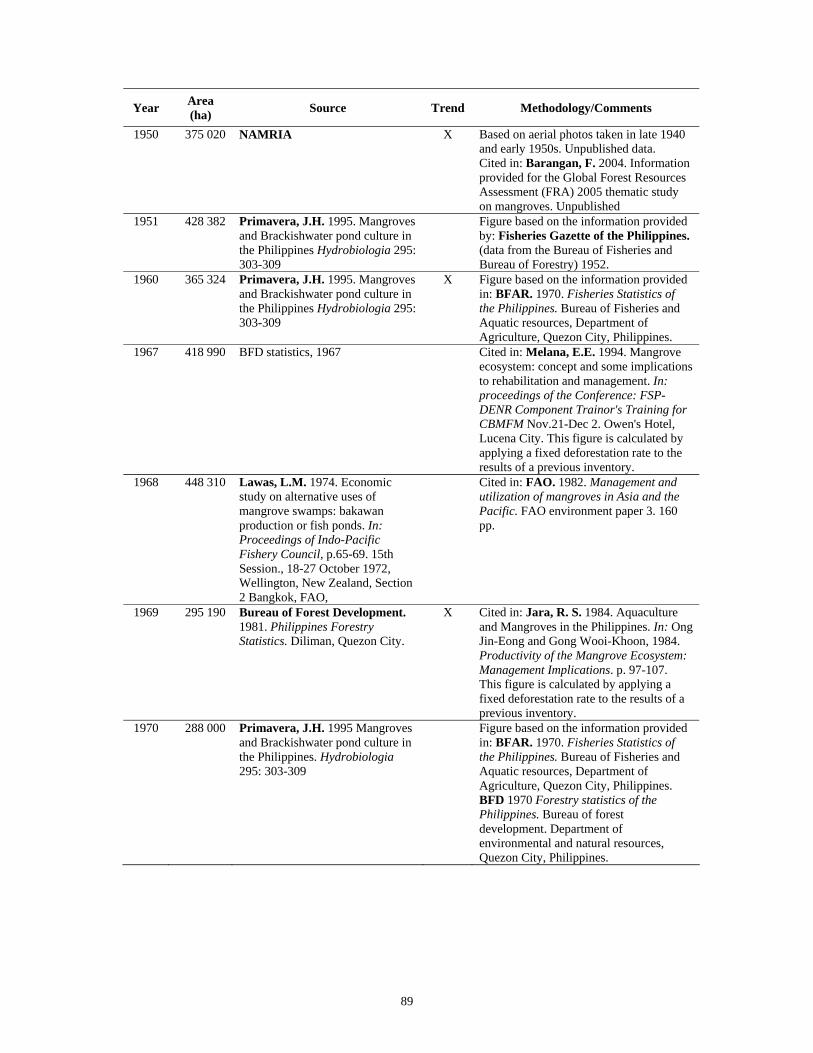
89
Year Area (ha) Source Trend Methodology/Comments
1950 375 020 NAMRIA X Based on aerial photos taken in late 1940 and early 1950s. Unpublished data. Cited in: Barangan, F. 2004. Information provided for the Global Forest Resources Assessment (FRA) 2005 thematic study on mangroves. Unpublished
1951 428 382 Primavera, J.H. 1995. Mangroves and Brackishwater pond culture in the Philippines Hydrobiologia 295: 303-309
Figure based on the information provided by: Fisheries Gazette of the Philippines. (data from the Bureau of Fisheries and Bureau of Forestry) 1952.
1960 365 324 Primavera, J.H. 1995. Mangroves and Brackishwater pond culture in the Philippines Hydrobiologia 295: 303-309
X Figure based on the information provided in: BFAR. 1970. Fisheries Statistics of the Philippines. Bureau of Fisheries and Aquatic resources, Department of Agriculture, Quezon City, Philippines.
1967 418 990 BFD statistics, 1967 Cited in: Melana, E.E. 1994. Mangrove ecosystem: concept and some implications to rehabilitation and management. In: proceedings of the Conference: FSP-DENR Component Trainor's Training for CBMFM Nov.21-Dec 2. Owen's Hotel, Lucena City. This figure is calculated by applying a fixed deforestation rate to the results of a previous inventory.
1968 448 310 Lawas, L.M. 1974. Economic study on alternative uses of mangrove swamps: bakawan production or fish ponds. In: Proceedings of Indo-Pacific Fishery Council, p.65-69. 15th Session., 18-27 October 1972, Wellington, New Zealand, Section 2 Bangkok, FAO,
Cited in: FAO. 1982. Management and utilization of mangroves in Asia and the Pacific. FAO environment paper 3. 160 pp.
1969 295 190 Bureau of Forest Development. 1981. Philippines Forestry Statistics. Diliman, Quezon City.
X Cited in: Jara, R. S. 1984. Aquaculture and Mangroves in the Philippines. In: Ong Jin-Eong and Gong Wooi-Khoon, 1984. Productivity of the Mangrove Ecosystem: Management Implications. p. 97-107. This figure is calculated by applying a fixed deforestation rate to the results of a previous inventory.
1970 288 000 Primavera, J.H. 1995 Mangroves and Brackishwater pond culture in the Philippines. Hydrobiologia 295: 303-309
Figure based on the information provided in: BFAR. 1970. Fisheries Statistics of the Philippines. Bureau of Fisheries and Aquatic resources, Department of Agriculture, Quezon City, Philippines. BFD 1970 Forestry statistics of the Philippines. Bureau of forest development. Department of environmental and natural resources, Quezon City, Philippines.
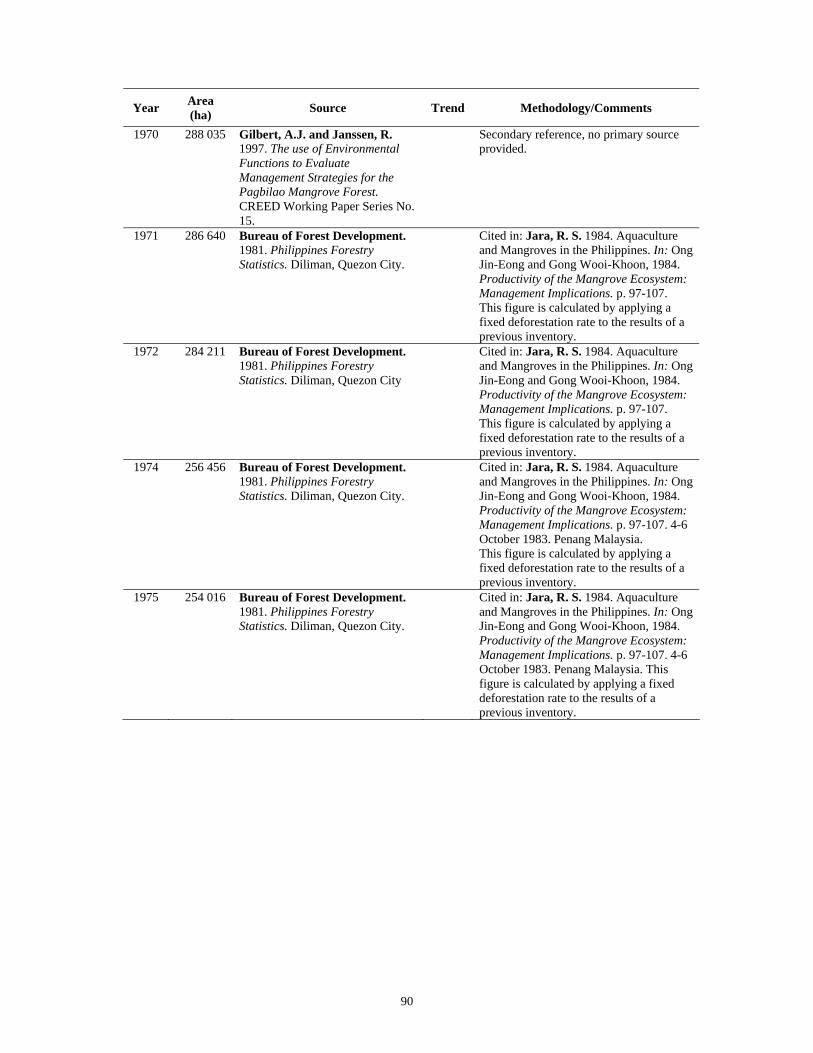
90
Year Area (ha) Source Trend Methodology/Comments
1970 288 035 Gilbert, A.J. and Janssen, R. 1997. The use of Environmental Functions to Evaluate Management Strategies for the Pagbilao Mangrove Forest. CREED Working Paper Series No. 15.
Secondary reference, no primary source provided.
1971 286 640 Bureau of Forest Development. 1981. Philippines Forestry Statistics. Diliman, Quezon City.
Cited in: Jara, R. S. 1984. Aquaculture and Mangroves in the Philippines. In: Ong Jin-Eong and Gong Wooi-Khoon, 1984. Productivity of the Mangrove Ecosystem: Management Implications. p. 97-107. This figure is calculated by applying a fixed deforestation rate to the results of a previous inventory.
1972 284 211 Bureau of Forest Development. 1981. Philippines Forestry Statistics. Diliman, Quezon City
Cited in: Jara, R. S. 1984. Aquaculture and Mangroves in the Philippines. In: Ong Jin-Eong and Gong Wooi-Khoon, 1984. Productivity of the Mangrove Ecosystem: Management Implications. p. 97-107. This figure is calculated by applying a fixed deforestation rate to the results of a previous inventory.
1974 256 456 Bureau of Forest Development. 1981. Philippines Forestry Statistics. Diliman, Quezon City.
Cited in: Jara, R. S. 1984. Aquaculture and Mangroves in the Philippines. In: Ong Jin-Eong and Gong Wooi-Khoon, 1984. Productivity of the Mangrove Ecosystem: Management Implications. p. 97-107. 4-6 October 1983. Penang Malaysia. This figure is calculated by applying a fixed deforestation rate to the results of a previous inventory.
1975 254 016 Bureau of Forest Development. 1981. Philippines Forestry Statistics. Diliman, Quezon City.
Cited in: Jara, R. S. 1984. Aquaculture and Mangroves in the Philippines. In: Ong Jin-Eong and Gong Wooi-Khoon, 1984. Productivity of the Mangrove Ecosystem: Management Implications. p. 97-107. 4-6 October 1983. Penang Malaysia. This figure is calculated by applying a fixed deforestation rate to the results of a previous inventory.
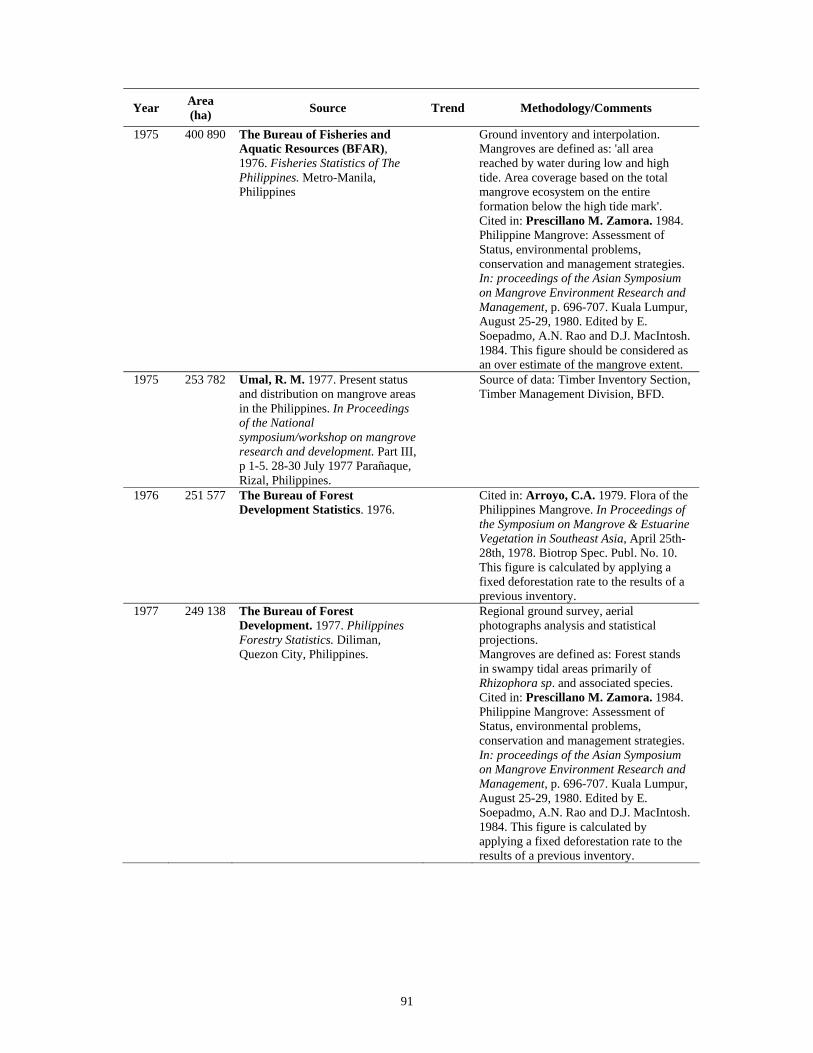
91
Year Area (ha) Source Trend Methodology/Comments
1975 400 890 The Bureau of Fisheries and Aquatic Resources (BFAR), 1976. Fisheries Statistics of The Philippines. Metro-Manila, Philippines
Ground inventory and interpolation. Mangroves are defined as: 'all area reached by water during low and high tide. Area coverage based on the total mangrove ecosystem on the entire formation below the high tide mark'. Cited in: Prescillano M. Zamora. 1984. Philippine Mangrove: Assessment of Status, environmental problems, conservation and management strategies. In: proceedings of the Asian Symposium on Mangrove Environment Research and Management, p. 696-707. Kuala Lumpur, August 25-29, 1980. Edited by E. Soepadmo, A.N. Rao and D.J. MacIntosh. 1984. This figure should be considered as an over estimate of the mangrove extent.
1975 253 782 Umal, R. M. 1977. Present status and distribution on mangrove areas in the Philippines. In Proceedings of the National symposium/workshop on mangrove research and development. Part III, p 1-5. 28-30 July 1977 Parañaque, Rizal, Philippines.
Source of data: Timber Inventory Section, Timber Management Division, BFD.
1976 251 577 The Bureau of Forest Development Statistics. 1976.
Cited in: Arroyo, C.A. 1979. Flora of the Philippines Mangrove. In Proceedings of the Symposium on Mangrove & Estuarine Vegetation in Southeast Asia, April 25th-28th, 1978. Biotrop Spec. Publ. No. 10. This figure is calculated by applying a fixed deforestation rate to the results of a previous inventory.
1977 249 138 The Bureau of Forest Development. 1977. Philippines Forestry Statistics. Diliman, Quezon City, Philippines.
Regional ground survey, aerial photographs analysis and statistical projections. Mangroves are defined as: Forest stands in swampy tidal areas primarily of Rhizophora sp. and associated species. Cited in: Prescillano M. Zamora. 1984. Philippine Mangrove: Assessment of Status, environmental problems, conservation and management strategies. In: proceedings of the Asian Symposium on Mangrove Environment Research and Management, p. 696-707. Kuala Lumpur, August 25-29, 1980. Edited by E. Soepadmo, A.N. Rao and D.J. MacIntosh. 1984. This figure is calculated by applying a fixed deforestation rate to the results of a previous inventory.
92
Year Area (ha) Source Trend Methodology/Comments
1978 223 771 Bureau of Forest Development. 1981. Philippines Forestry Statistics. Diliman, Quezon City.
Cited in: Jara, R. S. 1984. Aquaculture and Mangroves in the Philippines. In: Ong Jin-Eong and Gong Wooi-Khoon, 1984. Productivity of the Mangrove Ecosystem: Management Implications. p. 97-107. 4-6 October 1983. Penang Malaysia. This figure is calculated by applying a fixed deforestation rate to the results of a previous inventory.
1978 245 000 Bureau of Forest Development. 1979. 1978 Philippines Forestry Statistics – Manila.
Cited in: FAO, UNEP. 1981. Tropical Forest Resources Assessment Project, Forest Resources of Tropical Asia FAO, UNEP, 475 pp. This figure is calculated by applying a fixed deforestation rate to the results of a previous inventory.
1978 146 139 Natural Resources Management Center. 1978. Mangrove inventory of the Philippines using LANDSAT data. Diliman, Quezon City, Philippines.
Digital analysis of LANDSAT imageries with the Image 100 System, ground survey and analysis of topographic maps at 1:50,000 scale. The figure should be considered as on the lower side, since it represents only the "pure mangroves", areas with characteristics Rhizophora sp. and associated species wavelenght emissions. Cited in: Prescillano M. Zamora. 1984. Philippine Mangrove: Assessment of Status, environmental problems, conservation and management strategies. In: proceedings of the Asian Symposium on Mangrove Environment Research and Management, p. 696-707. Kuala Lumpur, August 25-29, 1980. Edited by E. Soepadmo, A.N. Rao and D.J. MacIntosh. 1984.
1979 218 000 Bureau of Forest Development. 1981. Philippines Forestry Statistics. Diliman, Quezon City.
Cited in: Jara, R. S. 1984. Aquaculture and Mangroves in the Philippines. In: Ong Jin-Eong and Gong Wooi-Khoon, 1984. Productivity of the Mangrove Ecosystem: Management Implications. p. 97-107. 4-6 October 1983. Penang Malaysia. This figure is calculated by applying a fixed deforestation rate to the results of a previous inventory.
1979 220 241 Gomez, E.D. 1980. The present state of Mangrove ecosystems in Southeast Asia and the Impact of Pollution: Regional. Philippines. South China Seas Fisheries Development and Coordinating Programme, FAO, UNEP, Manila. 128 pp.
Remote sensing. This figure seems to be on a lower side.
1979 200 000 Fortes, M.D. 1979. Studies on farming the seaweed Caulerpa [Clopohita, siphonales] in two mangrove areas in The Philippines. Biotrop Spec. Publ. No. 10.
Secondary reference, no primary source provided. The "Year" is the publication year.
93
Year Area (ha) Source Trend Methodology/Comments
1980 215 793 Bureau of Forest Development. 1981. Philippines Forestry Statistics. Diliman, Quezon City.
Cited in: Jara, R. S. 1984. Aquaculture and Mangroves in the Philippines. In: Ong Jin-Eong and Gong Wooi-Khoon, 1984. Productivity of the Mangrove Ecosystem: Management Implications. p. 97-107. 4-6 October 1983. Penang Malaysia. This figure is calculated by applying a fixed deforestation rate to the results of a previous inventory.
1980 242 000 Primavera, J.H. 1995. Mangroves and Brackishwater pond culture in the Philippines. Hydrobiologia 295: 303-309.
Figure based on the information contained in: BFAR. 1980. Fisheries Statistics of the Philippines. Bureau of Fisheries and Aquatic resources, Department of Agriculture, Quezon City, Philippines. BFD. 1980. Forestry statistics of the Philippines. Bureau of forest development. Deparment of environmental and natural resources, Quezon City, Philippines. This figure is calculated by applying a fixed deforestation rate to the results of a previous inventory.
1980 146 140 Tesoro, F. O. 1984. Traditional utilization of mangrove forests and management implications in the Philippines. Bakawan 3 (4) p: 6-8
The author reports an unofficial estimate done in 1980.
1981 213 350 Bureau of Forest Development. 1981. Philippines Forestry Statistics. Diliman, Quezon City.
Cited in: Jara, R. S. 1984. Aquaculture and Mangroves in the Philippines. In: Ong Jin-Eong and Gong Wooi-Khoon, 1984. Productivity of the Mangrove Ecosystem: Management Implications. p. 97-107. 4-6 October 1983. Penang Malaysia. This figure is calculated by applying a fixed deforestation rate to the results of a previous inventory.
1981 239 382 The Bureau of Forest Development. 1981.
Cited in: Melana, E.E. 1994. Mangrove ecosystem: concept and some implications to rehabilitation and management. In: proceedings of the Conference: FSP-DENR Component Trainor's Training for CBMFM Nov.21-Dec 2. Owen's Hotel, Lucena City. This figure is calculated by applying a fixed deforestation rate to the results of a previous inventory.
1983 240 000 Wacharakitty, S. 1983. Mangrove Ecosystem in General. In: ESCAP/UNESCO/NRCT Regional Remote Sensing Training Course of Mangrove Ecosystem. p. 22-33. Bangkok, Nov. 28-Dec. 16 1983
Cited in: FAO. 1994. Mangrove forest management guidelines. FAO Forestry Paper 117. Rome, 319 pp. Probably based on BFD, 1981 (see above)
1983 246 700 Saenger, P., Hegerl E.J. and J.D.S., Davie. 1983. Global status of mangrove ecosystems. Commission on ecology Papers No.3. IUCN. Gland, Switzerland. 88 pp.
Secondary reference, no primary source provided. The "Year" is the publication year.

94
Year Area (ha) Source Trend Methodology/Comments
1984 233 514 The Bureau of Forest Development. 1984.
Cited in: Rogello C. Serrano and Miguel Fortes. 1987. Perspective on World and Philippine Mangrove Resources. Forestry Research Series No 4/1987 - State of the Art. Mangrove Research. This figure is calculated by applying a fixed deforestation rate to the results of a previous inventory.
1986 232 100 Tech. Staff, Philippine National Mangrove Committee. 1986. Country report: Philippines. In: R.M. Umali et al. Mangrove of Asia and the Pacific: Status and Management. Technical Reports UNDP/UNESCO Regional Mangrove Project RAS/79002, Quezar City Philippines.
Cited in: WCMC. 2000. Coral reefs and mangroves of the world. http://www.wcmc.org.uk/marine/data/coral_mangrove/
1986 149 400 Sweden Satellite technology (SSC). 1988.
Cited in: Fisheries Sector Program. 1994. Mangrove Regeneration and Management. Ecosystem Research and Development Service DENR-Region IV A.
1987 160 700 Spalding, M.D., Blasco, F. and Field, C.D., eds. 1997. World Mangrove Atlas. The International Society for Mangrove Ecosystems, Okinawa, Japan. 178 pp.
Map analysis. Processed satellite imagery has been kindly provided by NAMRIA, 1988, prepared from SPOT images taken in 1987, at a scale of 1:250 000. Some of the smallest islands in the southwest, central and northern parts of the country are not included in the coverage, but are not likely to be making a significant difference to the total area. NAMRIA. 1988. Land cover maps. National Mapping and Resources Information Authority, Manila, Republic of the Philippines.
1988 139 100 NFRI National Forest Resource Inventory. nd
Using combination of aerial photographs or satellite imageries and ground verification. (FMB 1988). Cited in: Fisheries Sector Program. 1994. Mangrove Regeneration and Management. Ecosystem Research and Development Service DENR-Region IV A.
1988 139 725 Primavera, J.H. 1995. Mangroves and Brackishwater pond culture in the Philippines. Hydrobiologia 295: 303-309.
Information based on: National Mapping and Resource Information Authority. 1988. The document provides the breakdown per province.
1989 150 000 Edwino, S., Fernando. 1990. The vegetation of the Philippines Islands and the Situation of the Flowering Plants. In proceedings of the IV International Congress of Systematic and Evolutionary Biology, 01-07 July 1990
Remote sensing. This figure includes the brackish-water forest.
95
Year Area (ha) Source Trend Methodology/Comments
1989 139 000 Edwino, S., Fernando. 1990. The vegetation of the Philippines Islands and the Situation of the Flowering Plants. In proceedings of the IV International Congress of Systematic and Evolutionary Biology, 01-07 July 1990
Aerial photographs and ground survey. This figure seems could be based on NFRI, FMB 1988 (see above).
1990 132 500 Auburn University. 1993. Philippines prawn industry policy study. Prepared for the Coordinating Council of the Philippines Assistance Program and U.S. Agency for international Development. International center for aquaculture and aquatic environments, Auburn
Cited in: Primavera, J.H. 1995. Mangrove habitats as nurseries for juvenile shrimps (Penaeidae) in Guimaras, Philippines. College of Science, University of the Philippines Diliman, Quezon City.
1990 127 610 Melana, E.E. 1994. Mangrove ecosystem: concept and some implications to rehabilitation and management. In proceedings of the Conference: FSP-DENR Component Trainor's Training for CBMFM on Nov.21-Dec 2. Held at Owen's Hotel, Lucena City
Data from: NAMRIA
1993 123 400 Gilbert, A.J. and Janssen, R. 1997. The use of Environmental Functions to Evaluate Management Strategies for the Pagbilao Mangrove Forest. CREED Working Paper Series No. 15
Secondary reference, no primary source provided.
1993 170 400 Fortes, M.D. 1993. Sustainable use of mangroves in the Philippines: reality or an impossible dream? In Proceedings of the Asia-Pacific Symposium on Mangrove Ecosystem, Yuk-Shan Wong and Nora, F.Y. Tam, eds. The Hong Kong University of Science & Technology, 1-3 September, 1993. 368 pp.
Secondary reference, no primary source provided. The "Year" is the publication year.
1995 100 000 Kelleher, G., Bleakley, C. and Wells, S. 1995. A global representative system of marine protected areas. Vol.II-III-IV Great Barrier Reef Marine Park Authority, IBRD, The World Bank, IUCN. IBRD
Secondary reference, no primary source provided. The "Year" is the publication year. Rough estimate.
1996 140 000 WRI, UNEP, UNDP, The World Bank. 1996. World Resources 1996-1997. New York and Oxford University Press 365 pp.
Secondary reference, no primary source provided. The "Year" is the publication year. Probably based on Primavera, 1995 (see above)
1997 112 400 Forest Management Bureau, Dept. of Environment and Natural Resources. 1998. 1997 Phillippine Forestry Statistics.
This figure is calculated by applying a fixed deforestation rate to the results of a previous inventory.
96
Year Area (ha) Source Trend Methodology/Comments
2000 149 000 World Resources Institute. 2000. World resources 2000-2001: people and ecosystem—the fraying web of life. Washington, DC., UNDP. 400 pp.
Secondary reference, no primary source provided. The "Year" is the publication year. Probably based on Sweden Satellite technology, 1988 (see above)
2000 130 000 Aizpuru, M., Achard, F., and Blasco, F. 2000. Global Assessment of Cover Change of the Mangrove Forests using satellite imagery at medium to high resolution. In EEC Research project n 15017-1999-05 FIED ISP FR – Joint Research center, Ispra.
Secondary reference, no primary source. Probably based on Melana, 1994 (see above).
2003 247 362 NAMRIA X Based on digital analysis of LANDSAT data. December 2003. Unpublished data. (248 907 if considering plantations). Cited in: Barangan, F. 2004. Information provided for the Global Forest Resources Assessment (FRA) 2005 thematic study on mangroves. Unpublished
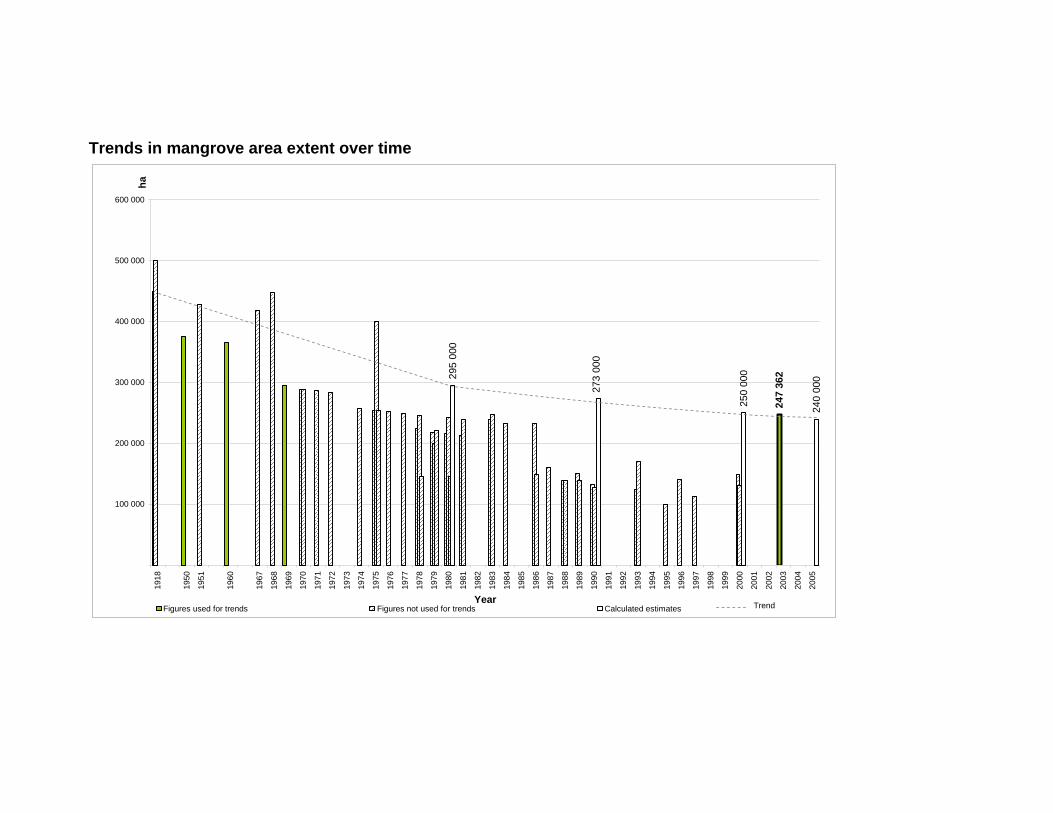
Trends in mangrove area extent over time
295
000
250
000
240
000
247
362
273
000
100 000
200 000
300 000
400 000
500 000
600 000
1918
1950
1951
1960
1967
1968
1969
1970
1971
1972
1973
1974
1975
1976
1977
1978
1979
1980
1981
1982
1983
1984
1985
1986
1987
1988
1989
1990
1991
1992
1993
1994
1995
1996
1997
1998
1999
2000
2001
2002
2003
2004
2005
Year
ha
Figures used for trends Figures not used for trends Calculated estimates Trend
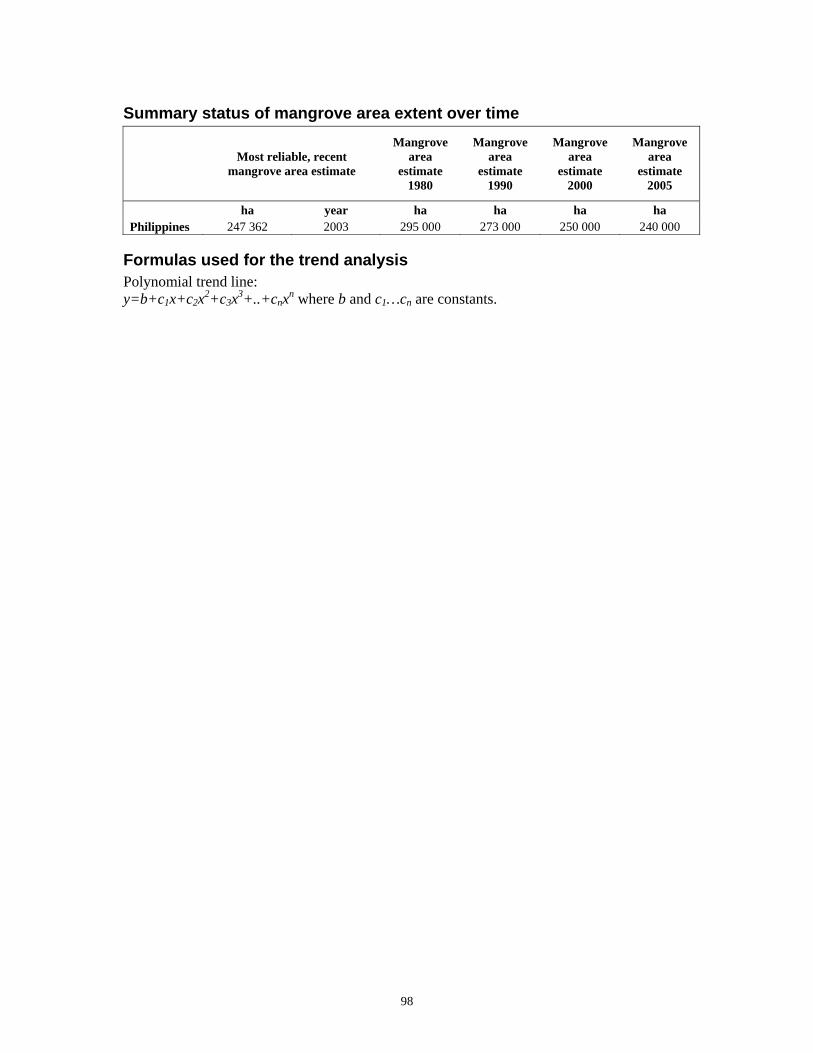
98
Summary status of mangrove area extent over time
Most reliable, recent mangrove area estimate
Mangrove area
estimate 1980
Mangrove area
estimate 1990
Mangrove area
estimate 2000
Mangrove area
estimate 2005
ha year ha ha ha ha Philippines 247 362 2003 295 000 273 000 250 000 240 000
Formulas used for the trend analysis Polynomial trend line: y=b+c1x+c2x2+c3x3+..+cnxn where b and c1…cn are constants.
99
Qatar Vegetation description, uses and threats The mangrove forests in Qatar are mainly located on the easter side of the peninsula, all the way from North to South, with larger stands in marine embayment systems. Significant stands are also found in the northern part of the Al-Khawr area, where vegetation plays an important role in the shaping of the depositional beach, however the only notable area of mangroves in the country is at Al-Dhakhira, a sheltered group of saltwater bays. Avicennia marina is very tolerant of highly saline conditions and it is the only mangrove species found in this country, growing up to 2-3 metres in average. A man-mad mangrove stand is also present in the west coast, however the extreme salinity levels present in the Gulf of Salwa do not permit a natural establishment, and cause slow groth rates. Mangrove products are not use very often in this country, although in some areas these trees are used as fodder for camels, goat and sheep, for fuel, and as stakes for fishing. However, these uses are probably decreasing in line with increasing wealth in the region. Conversely many areas are increasingly threatened by pollution, especially caused by oil, which is widespread in many areas of the Persian Gulf and Straits of Hormuz and, depending on the size and other attributes of the spill, may provoke serious damage to the trees, especially to Avicennia marina, which in some cases may completely die. Landfill associated with urban and industrial development also threatens mangroves in many areas (e.g. Al Khor and Al-Dhakirah). On the other hand a man-made Avicennia marina stand is found at Umm al Hul, on a barren but protected site, at Al Mafjar and at Fuwairat, all wanted by the Government. The Supreme Council for the Environment & Natural Reserves (SCENR) of Qatar has also proclaimed the largest mangrove stand in the country, the Al-Dhakhira lagoon, as a nature reserve, and activities have been initiated to evaluate the possibility to establish a UNESCO Biosphere Reserve. Reference: Böer, B. 2005. Information provided for the Global Forest Resources Assessment (FRA) 2005 thematic study on mangroves. Unpublished.
Böer, B. 1993: Anomalous pneumatophores and adventitious roots of Avicennia marina (Forssk.) Vierh. mangroves two years after the 1991 Gulf War oil spill in Saudi Arabia. Marine Pollution Bulletin 27: 207-211
Scott, D.A. ed. 1995. A Directory of Wetlands in the Middle East. IUCN, Gland, Switzerland and IWRB, Slimbridge, U.K. xvii + 560pp, 13 maps.
Spalding, M.D., Blasco, F. & Field, C.D., eds. 1997. World Mangrove Atlas. The International Society for Mangrove Ecosystems, Okinawa, Japan. 178 pp.
Supreme Council for the Environment & Natural Reserves. 2004. A national biodiversity strategy and action plan – State of Qatar. Final National Biodiversity Strategy and Action Plan. www.biodiv.org/doc/world/qa/qa-nbsap-01-en.doc
UNEP. 1999. Overview on Land-based Sources and Activities Affecting the Marine Environment in the ROPME Sea Area. UNEP Regional Seas Reports and Studies No. 168. 127 pp.
True mangrove species checklist Avicennia marina
National level mangrove estimates Year Area
(ha) Source Trend Methodology/Comments
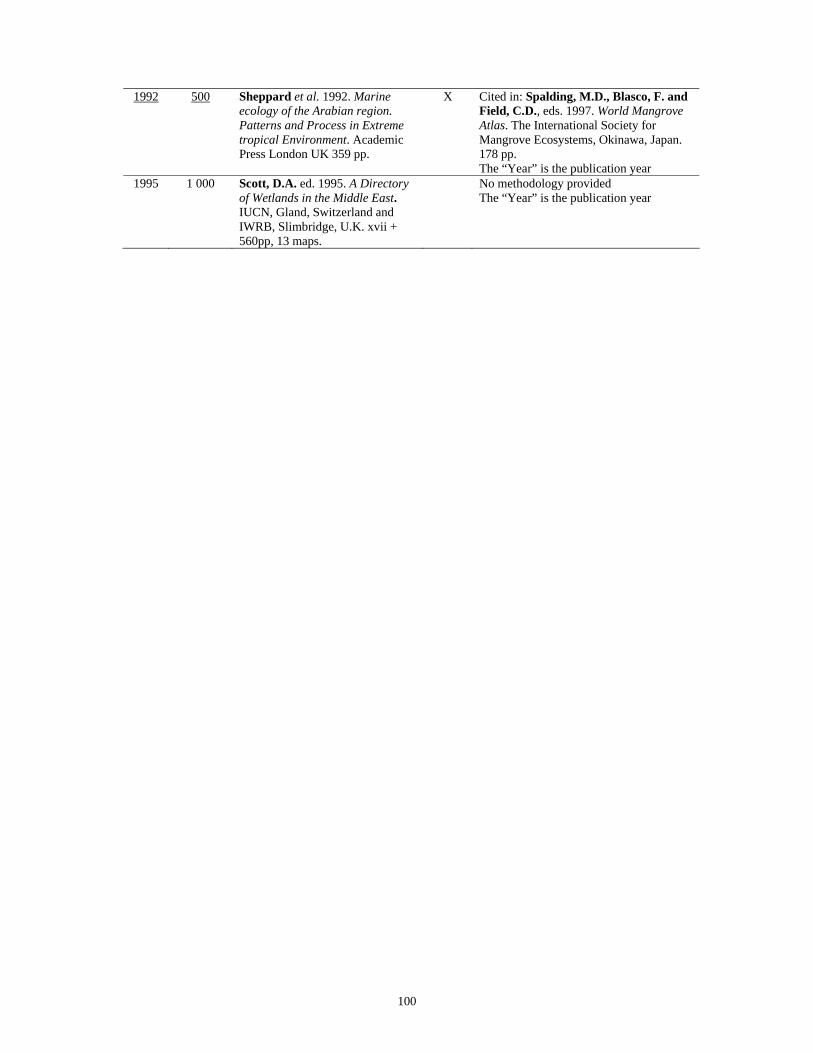
100
1992 500 Sheppard et al. 1992. Marine ecology of the Arabian region. Patterns and Process in Extreme tropical Environment. Academic Press London UK 359 pp.
X Cited in: Spalding, M.D., Blasco, F. and Field, C.D., eds. 1997. World Mangrove Atlas. The International Society for Mangrove Ecosystems, Okinawa, Japan. 178 pp. The “Year” is the publication year
1995 1 000 Scott, D.A. ed. 1995. A Directory of Wetlands in the Middle East. IUCN, Gland, Switzerland and IWRB, Slimbridge, U.K. xvii + 560pp, 13 maps.
No methodology provided The “Year” is the publication year
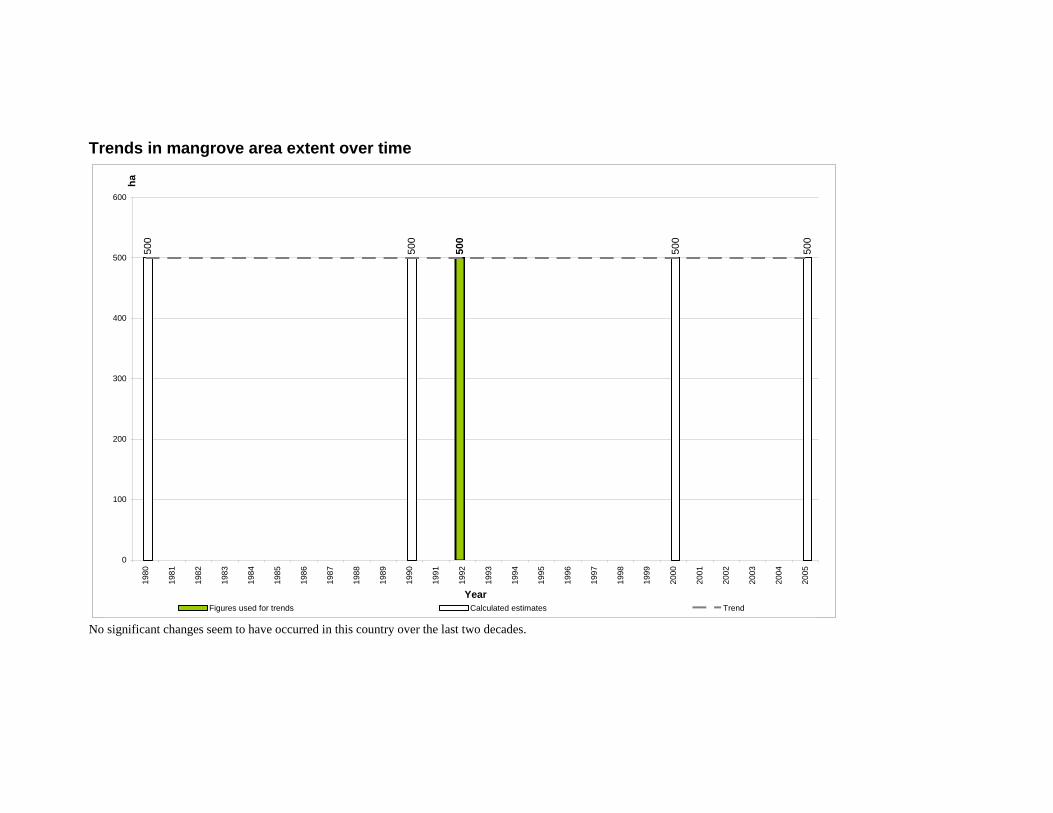
Trends in mangrove area extent over time 50
0
500
500
500
500
0
100
200
300
400
500
600
1980
1981
1982
1983
1984
1985
1986
1987
1988
1989
1990
1991
1992
1993
1994
1995
1996
1997
1998
1999
2000
2001
2002
2003
2004
2005
Year
ha
Figures used for trends Calculated estimates Trend
No significant changes seem to have occurred in this country over the last two decades.

102
Summary status of mangrove area extent over time
Most reliable, recent mangrove area estimate
Mangrove area
estimate 1980
Mangrove area
estimate 1990
Mangrove area
estimate 2000
Mangrove area
estimate 2005
ha year ha ha ha ha Qatar 500 1992 500 500 500 500
Formulas used for the trend analysis The trend analysis provided in this report is based on qualitative information currently available.

103
Saudi Arabia Vegetation description, uses and threats Mangroves are found in the form of fragmented and often very thin stands in many tidal areas on the Red Sea and the Persian Gulf coast. They consist mainly of Avicennia marina trees with Rhizophora mucronata being found in few localities. Tree’s height varies from North to South, being lower in the northern areas; this height differences may be caused by the low temperatures which northern trees are exposed to in winter. On the Red Sea coast Avicennia marina grows from latitude 27° 25’N down to below Jizan, accompanied by some Rhizophora mucronata trees in few sites. They are distributed in several areas along the Red Sea, mostly growing at the end of fresh water streams where the silt and organic material are carried out by the water run off from the valleys to the shore of the Red Sea and the Gulf. The biggest concentration is found on the southern Red sea coast, between Dibain in the north and Jizan in the south. In Al Darb area, at Al Raqabah, Avicennia marina trees form a large ecosystem. Mangroves also occur at Al Qahmah and at Wadi Dhahaban, showing different ranges of height in the sites; the tallest trees (7 m height) are located in Al Qahmah. Avicennia marina is also widespread in Rabigh, Jeddah, Jizan areas and on the Farasan Island, an archipelago of coral islets where also Rhizophora mucronata is present. The area between Khor’Amiq and Al-qahmah has a large stand of mangroves and represent a relatively undisturbed mangrove-fringed lagoon. The Yanbu Royal Commission Zone is composed of three mangrove sites along the delta of Wadi Farrah and represents another well structured forest. Mangrove ecosystems along Persian Gulf are found in tiny patches in the North, on Jazeerat Qurma (which means Mangrove Island) and in the Damman area (Tarut Bay), where they form up well developed communities consisting of Avicennia marina. In the Persian Gulf mangroves have been principally affected by the large oil spill from the Gulf War, and even though they have mostly recovered from this event, oil pollution still represents one of the main threats in the country. Camel grazing has been reported as another relevant threat, especially at Khor Itwad while shrimp aquaculture represents one of the emerging threats to this ecosystem; it first started in Al-Lith in 1983, on a small area of 20 ha which has then been increasing up to 1 000 ha in 1998; other shrimp farms are now being planned at Shuqaiq mangrove. Significant cutting has been reported in different sites, leading to reduction in tree density, abundance of multi-stemmed trees, and passages to the inner parts of the forests for the camels. Mangrove health is also compromised by the modifications of the coastal area topography, desertification and infilling caused by infrastructure development. Consequently, even if the area change over the last two decades may have been relatively small, several sites have been severely degraded and trees are suffering of a high mortality rate. On the other hand, two mangrove planting sites were established in 1981 in Al Khafji both planted with Avicennia marina. Some smaller plots of Rhizophora stylosa, R. racemosa, Lumnitzera racemosa and Bruguiera gymnorrhiza were also prepared. Reference: Böer, B. 2005. Information provided for the Global Forest Resources Assessment (FRA) 2005 thematic study on mangroves. Unpublished.
PERSGA/GEF. 2004. Status of mangroves in the Red Sea and Gulf of Aden. PERSGA Technical Series No 11. PERSGA, Jeddah
Saenger, P. 1993. Management of Mangroves in the Kingdom of Saudi Arabia. Riyadh, Saline Water Conversion Corporation and Ministry for Agriculture and Water.
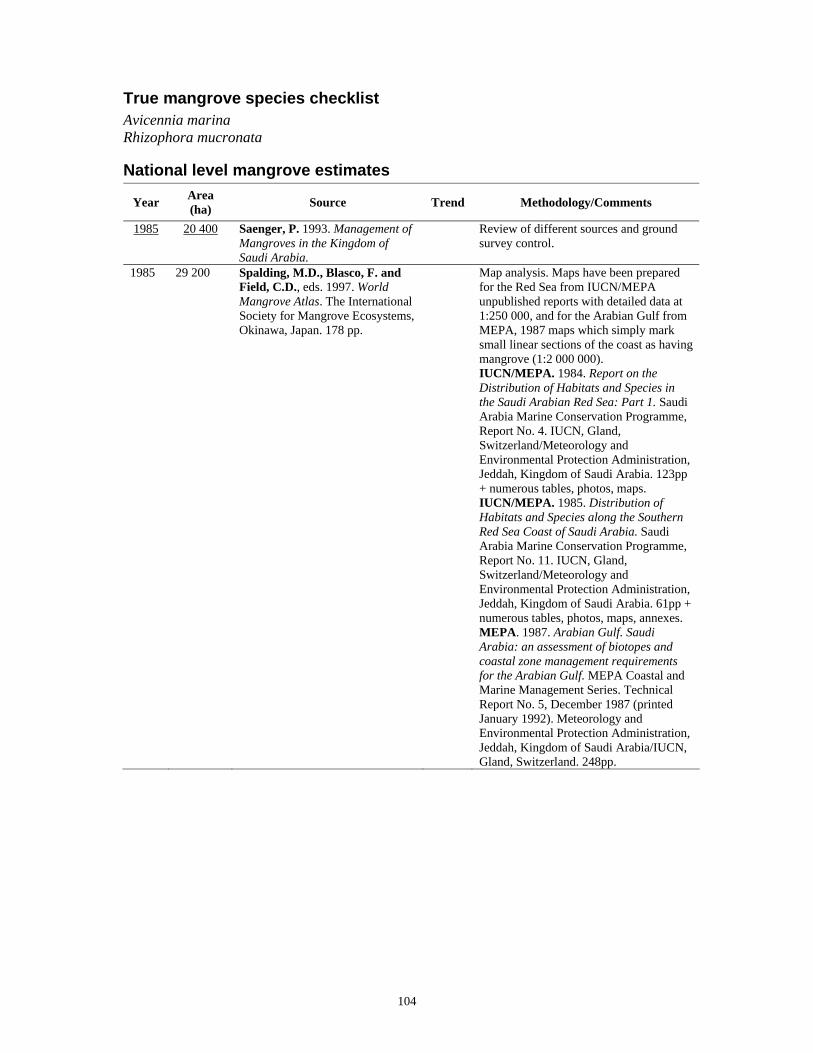
104
True mangrove species checklist Avicennia marina Rhizophora mucronata
National level mangrove estimates
Year Area (ha) Source Trend Methodology/Comments
1985 20 400 Saenger, P. 1993. Management of Mangroves in the Kingdom of Saudi Arabia.
Review of different sources and ground survey control.
1985 29 200 Spalding, M.D., Blasco, F. and Field, C.D., eds. 1997. World Mangrove Atlas. The International Society for Mangrove Ecosystems, Okinawa, Japan. 178 pp.
Map analysis. Maps have been prepared for the Red Sea from IUCN/MEPA unpublished reports with detailed data at 1:250 000, and for the Arabian Gulf from MEPA, 1987 maps which simply mark small linear sections of the coast as having mangrove (1:2 000 000). IUCN/MEPA. 1984. Report on the Distribution of Habitats and Species in the Saudi Arabian Red Sea: Part 1. Saudi Arabia Marine Conservation Programme, Report No. 4. IUCN, Gland, Switzerland/Meteorology and Environmental Protection Administration, Jeddah, Kingdom of Saudi Arabia. 123pp + numerous tables, photos, maps. IUCN/MEPA. 1985. Distribution of Habitats and Species along the Southern Red Sea Coast of Saudi Arabia. Saudi Arabia Marine Conservation Programme, Report No. 11. IUCN, Gland, Switzerland/Meteorology and Environmental Protection Administration, Jeddah, Kingdom of Saudi Arabia. 61pp + numerous tables, photos, maps, annexes. MEPA. 1987. Arabian Gulf. Saudi Arabia: an assessment of biotopes and coastal zone management requirements for the Arabian Gulf. MEPA Coastal and Marine Management Series. Technical Report No. 5, December 1987 (printed January 1992). Meteorology and Environmental Protection Administration, Jeddah, Kingdom of Saudi Arabia/IUCN, Gland, Switzerland. 248pp.
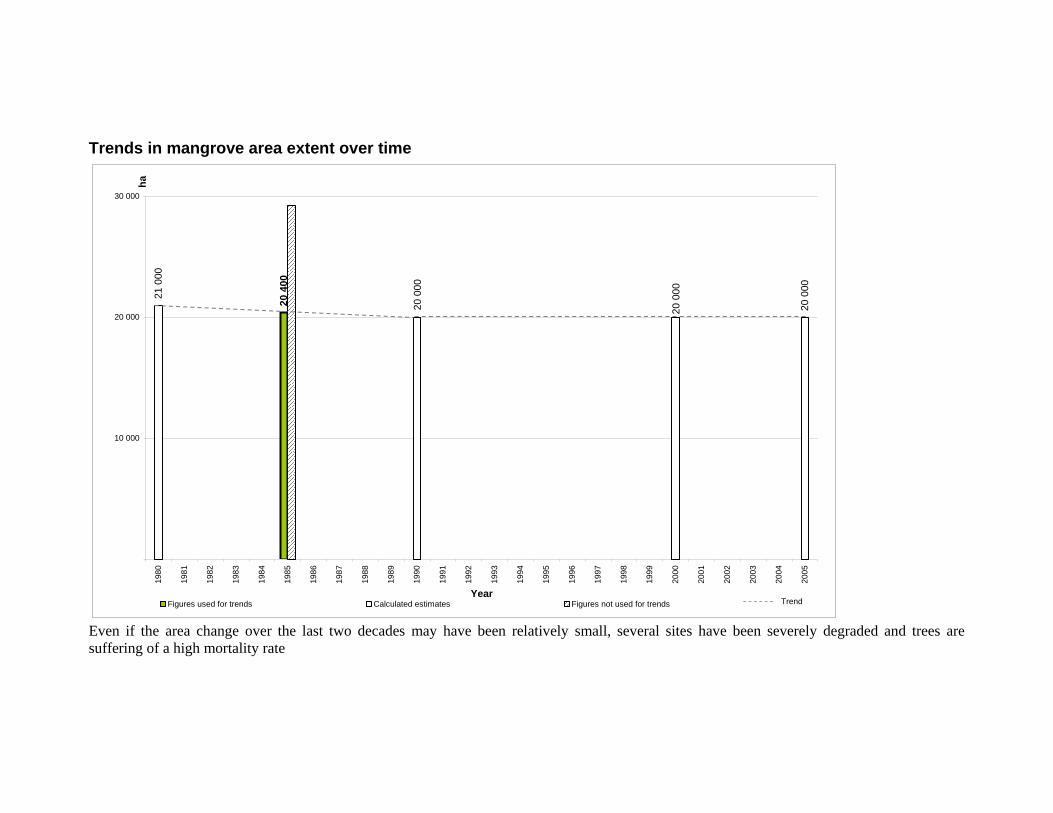
Trends in mangrove area extent over time 2
1 00
0
20
000
20
400
20
000
20
000
10 000
20 000
30 000
1980
1981
1982
1983
1984
1985
1986
1987
1988
1989
1990
1991
1992
1993
1994
1995
1996
1997
1998
1999
2000
2001
2002
2003
2004
2005
Year
ha
Figures used for trends Calculated estimates Figures not used for trends Trend
Even if the area change over the last two decades may have been relatively small, several sites have been severely degraded and trees are suffering of a high mortality rate
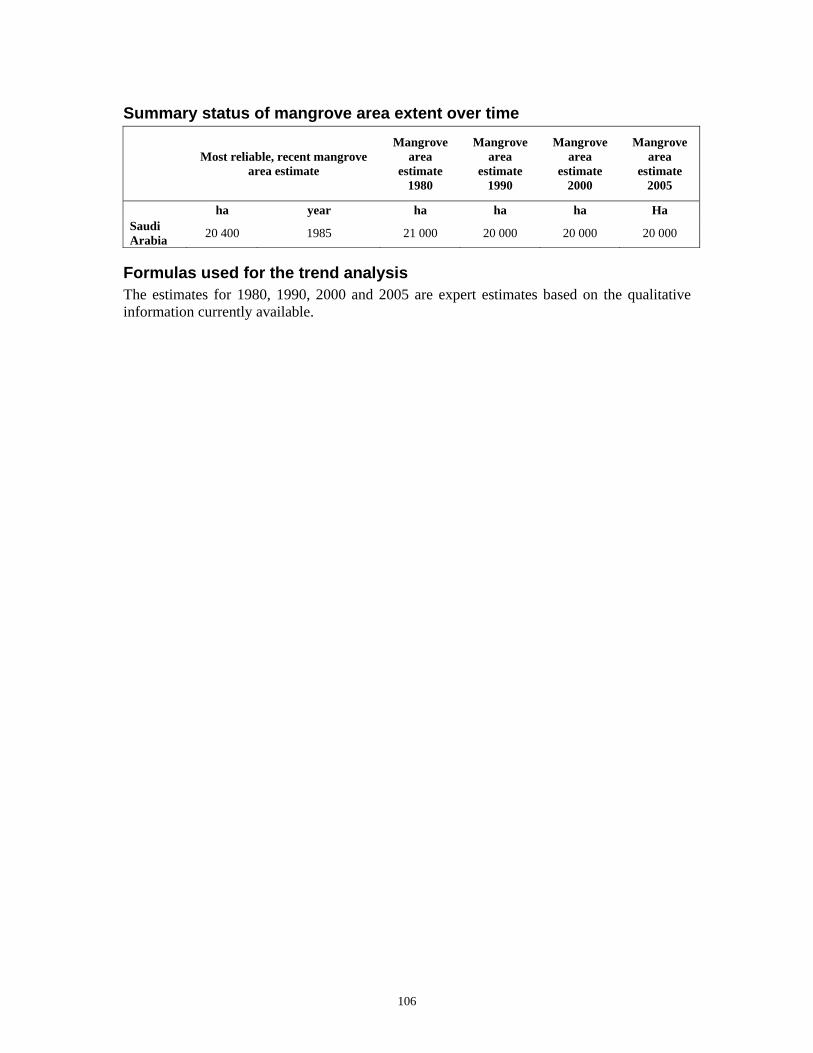
106
Summary status of mangrove area extent over time
Most reliable, recent mangrove area estimate
Mangrove area
estimate 1980
Mangrove area
estimate 1990
Mangrove area
estimate 2000
Mangrove area
estimate 2005
ha year ha ha ha Ha Saudi Arabia 20 400 1985 21 000 20 000 20 000 20 000
Formulas used for the trend analysis The estimates for 1980, 1990, 2000 and 2005 are expert estimates based on the qualitative information currently available.
107
Singapore Vegetation description, uses and threats Singapore is a small, densely populated island at the southern tip of the Malaysian peninsula. At the time of the founding of modern Singapore in 1819, forest covered practically the whole of the main island, and mangroves represented around 13 per cent of the total forest area. Mangroves in this country faced serious degradation and they have now been almost totally destroyed. Nowadays, only few scattered patches of degraded mangroves remain along the north shore and some of the offshore islands. The largest stands are found in the northern part of the main island and on Pulau Tekong, Pulau Ubin and Pulau Semakau. In the western sector, Mandai and Sungei Buloh Nature Park, have an important amount of mangroves. The main tree species found are Rhizophora sp., Bruguiera sp., Avicennia sp. and Sonneratia sp. Original uses of mangroves included fuelwood and charcoal. The first land reclamation activities begun on the Singapore River in 1822 and by the middle of this century large areas had been claimed; shrimp farming was introduced in the 1900s and led to the loss of wide areas of mangroves as brackish water ponds were developed. During the same years, large mangrove areas west of the Causeway were converted for housing and other uses. The most recent, and now widespread, threat is the barraging of all the major non-urban estuaries as freshwater reservoirs. Reference: National Council on the Environment. 1994. A first look a biodiversity in Singapore. Singapore, 163 pp.
National Parks Board. 1997. Biodiversity in the Nature Reserves of Singapore. In: L. Chan & R.T. Corlett, eds. Proceedings of the Nature Reserve Survey Seminar. The Garden's Bulletin, Vol. 49, Part 2.
Peter K. L. Ng & N. Sivasothi eds. 2001. A Guide to Mangroves of Singapore. Volume 1: The Ecosystem and Plant Diversity and Volume 2: Animal Diversity. BP Guide to Nature Series. The Singapore Science Centre, sponsored by British Petroleum
True mangrove species checklist Acanthus ebracteatus Acanthus ilicifolius Acrostichum aureum Acrostichum speciosum Aegiceras corniculatum Avicennia alba Avicennia marina Avicennia officinalis Avicennia rumphiana Bruguiera cylindrica Bruguiera gymnorrhiza Bruguiera parviflora Bruguiera sexangula Ceriops tagal Cynometra ramiflora Excoecaria agallocha Excoecaria indica Heritiera littoralis Kandelia candel

108
Lumnitzera littorea Lumnitzera racemosa Nypa fruticans Pemphis acidula Rhizophora apiculata Rhizophora mucronata Rhizophora stylosa Scyphiphora hydrophyllacea Sonneratia alba Sonneratia caseolaris Sonneratia ovata Xylocarpus granatum Xylocarpus mekongensis
National level mangrove estimates
Year Area (ha) Source Trend Methodology/Comments
1928 22 700 Watson, J.G. 1928. Mangrove forest of the Malay Peninsula. Malay Forest Records No. 6 Singapore, frases & Neave. 275 pp.
Cited in: FAO. 1982. Management and utilization of mangroves in Asia and the Pacific. FAO environment paper 3. 160 pp.
1940 7 500 Spalding, M.D., Blasco, F. and Field, C.D., eds. 1997. World Mangrove Atlas. The International Society for Mangrove Ecosystems, Okinawa, Japan. 178 pp.
The “Year” is dummy date; the authors are referring to it as the original extent.
1978 3 210 Ministry of Culture. 1978. Singapore - Singapore facts and figures, 1978.
Cited in: FAO, UNEP, Zoology Department University of Singapore. 1980. The present state of Mangrove Ecosystems in Southeast Asia and the Impact of Pollution. Singapore. 103 pp. The extent may include waterways and channels.
1979 1 820 Ministry of Culture. 1978. Singapore - Singapore facts and figures, 1978.
X Estimated total mangrove area extent. Cited in: FAO, UNEP, Zoology Department University of Singapore. 1980. The present state of Mangrove Ecosystems in Southeast Asia and the Impact of Pollution. Singapore. 103 pp.
1983 1 800 Saenger, P., Hegerl E.J. and J.D.S., Davie. 1983. Global status of mangrove ecosystems. Commission on ecology Papers No.3. IUCN. Gland, Switzerland. 88 pp.
Secondary reference, no primary source provided. The "Year" is the publication year.
1985 5 600 Corlett, R.T. 1986. Report on the Third Introductory Training Course on Mangrove Ecosystems, UNDP/UNESCO, Singapore, 20 October - 16 November 1985. UNESCO, New Delhi. 46 pp.
Cited in: WCMC. 2000. Coral reefs and mangroves of the world. http://www.wcmc.org.uk/marine/data/coral_mangrove/
1987 1 570 Thang, H. C. 1991. Asean Forest Resource Database Country Report Singapore
X Ground survey

109
Year Area (ha) Source Trend Methodology/Comments
1990 500 Chan, L. and Richard, T. 1997. Biodiversity in the nature reserves of Singapore, Proceedings of the Nature Reserves Survey Seminar, Singapore December 1997. Singapore Gardens Bulletin 49 (II). National Parks Board, Singapore Botanic Gardens, Cluny Road.
X Ground survey
1990 600 Chou, L.M. 1990. Assessing the coastal living resources of Singapore: a study in the ASEAN- Australia Coastal Living Resources Project. Wallaceana Vol.59-60. pp: 7-9.
Cited by: Spalding, M.D., Blasco, F. and Field, C.D., eds. 1997. World Mangrove Atlas. The International Society for Mangrove Ecosystems, Okinawa, Japan. 178 pp.
1997 2 200 McKinnon, J. 1997. Protected Areas Systems Review of the Indo-Malayan Realm.
The “Year” is the publication year.
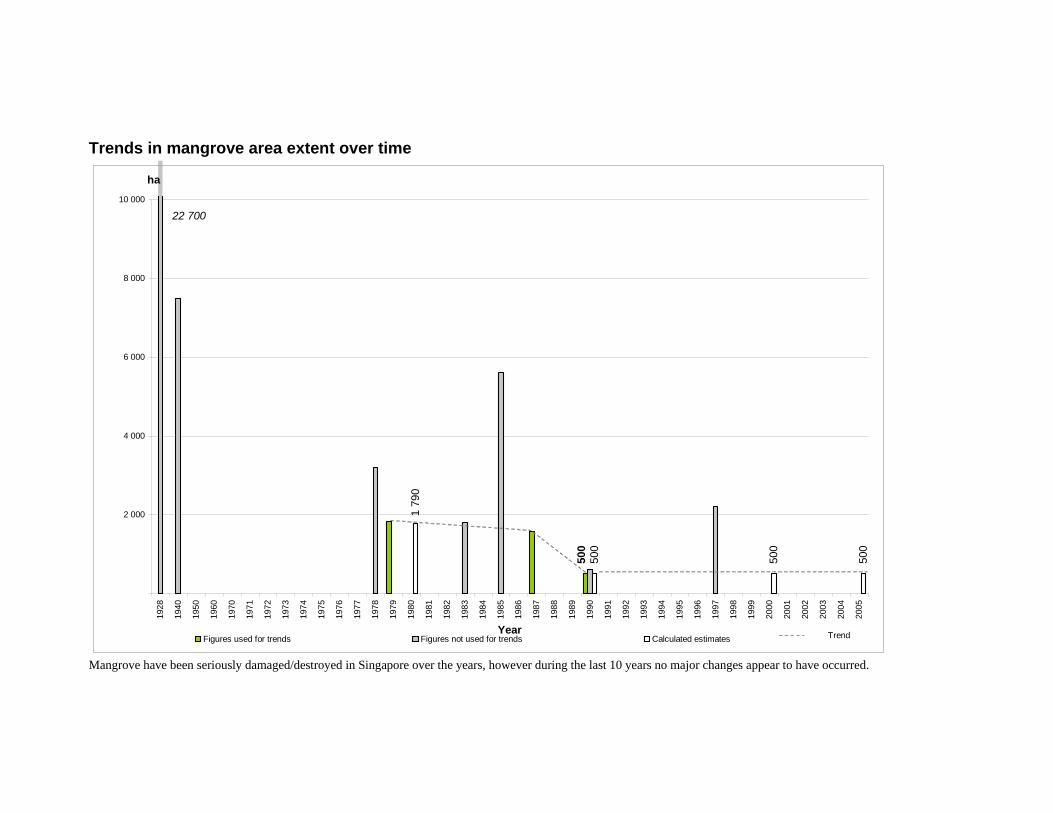
Trends in mangrove area extent over time
1 7
90
500
500
500
500
2 000
4 000
6 000
8 000
10 000
1928
1940
1950
1960
1970
1971
1972
1973
1974
1975
1976
1977
1978
1979
1980
1981
1982
1983
1984
1985
1986
1987
1988
1989
1990
1991
1992
1993
1994
1995
1996
1997
1998
1999
2000
2001
2002
2003
2004
2005
Year
ha
Figures used for trends Figures not used for trends Calculated estimates
22 700
Trend
Mangrove have been seriously damaged/destroyed in Singapore over the years, however during the last 10 years no major changes appear to have occurred.

111
Summary status of mangrove area extent over time
Most reliable, recent mangrove area estimate
Mangrove area
estimate 1980
Mangrove area
estimate 1990
Mangrove area
estimate 2000
Mangrove area
estimate 2005
ha year ha ha ha ha Singapore 500 1990 1 790 500 500 500
Formulas used for the trend analysis Linear: y = mx + b where m is the slope and b is the intercept.
112
Sri Lanka Vegetation description, uses and threats Mangroves in Sri Lanka are found in estuaries and lagoons scattered around all the country, but mainly concentrated along the East and West coasts and around the Jaffna Peninsula in the North. Low tidal ranges throughout the country and high energy coastlines typically reduce the development of wide areas of mangrove, and extended forests do not appear to have ever been present in the country. Here mangroves generally grow in narrow fringes, in protected lagoons and estuaries, with the large areas being found at Puttalam Lagoon on the west coast, and in Trincomalee and Batticaloa districts. Some tidal zonation patterns and five typical mangrove formations have been observed, each composed of its own typical flora. The most common are riverine and fringing, but basin, scrub and overwash mangrove formations are also present. Sri Lanka has a high mangrove diversity and more than 20 different mangrove species are growing in the country and forests are generally dominated by Rhizophora sp., Avicennia officinalis, Bruguiera cylindrica, Sonneratia sp., and Excoecaria agallocha, depending on the sites and coast morphology. Human pressure is generally high on coastal areas of Sri Lanka, and local populations often rely on mangroves for a wide range of services and goods. Mangroves are traditionally used as a source of firewood, tannins, posts and poles (for construction and for large fish traps). Large-scale commercial exploitation of mangrove wood is not common, even though some plantations have been established in the Negombo Lagoon; these plantations are mainly managed for firewood and poles for construction which are then sold in local markets. The extent of these forests in Sri Lanka has been highly reduced by human activities over time and a relatively large amount of mangroves were lost, mainly due to conversion of land for agriculture, especially for coconut plantations. The tourist sector is very important for Sri Lanka national economy and in some cases the conversion of mangrove areas for tourist resort development represented another important cause of deforestation. The overuse of wood resources caused by the high human pressure contributed to further degradation and loss of mangroves in the country. Aquaculture ponds are not as widespread as in other Asian countries, but the sector has been increasing also here and some ponds can be found for example around the Negombo Lagoon. Despite the previous losses a number of mangrove forests are now being protected in the country and the Maduganga, one of the most important mangrove areas in the country, has been declared Ramsar site in 2003 for its relevant importance in biodiversity, for its cultural heritage, and for the service provided in storing water during the monsoon rains and retaining nutrient run-off from nearby cinnamon plantations. The 2004 Indian Ocean Tsunami impacted large coastal areas in Sri Lanka, causing enormous losses of human lives, loss in fishing fleets and damages to natural environments, particularly in the south eastern, eastern and north eastern shores. Frontline mangroves were damaged in Batticaloa and Ampara districts and mangrove trees experienced moderate to severe damage in several sites i.e. Medilla, Wellaodae and Kapuhenwala and in the Oruwella harbour area.
113
on the other hand trees standing behind a 50-100 m patch of forest showed only low damage. The mixed mangrove system in the Walawe river (Wanduruppa area) showed a high impact to trees and further damage has been recorded to mangroves at Negombo. IUCN (2005b) and UNEP (2005b) showed an apparent connection between coasts where vegetation was removed in the past years and a greater impact of the waves. At the same time also in this country the experience highlighted that narrow mangrove forests immediately adjacent to the sea or along the banks of lagoons close to the sea were severely damaged by the tsunami and did not contribute much to the protection of the coast, while dense forests even though the first row trees were broken down, absorbed enough energy such that the damage to the village behind the forest was reduced. Reference: Aruchelvam, K. 1969. Mangroves. The Ceylon Forester 8 (384): 1-34. Cited in: Jayasekara, A.M. 1986. Management strategies for fisheries and aquaculture in mangrove ecosystem in Sri Lanka. In: Mepham, R.H. 1986. Papers contributed to the workshop on strategies for the management of fisheries and aquaculture in mangrove ecosystems. pp 1-9. Bangkok, Thailand, 23-25 June
FAO, UNEP. 1981. Tropical Forest Resources Assessment Project, Forest Resources of Tropical Asia. FAO, UNEP, 475 pp.
FAO. 2007. Coastal protection in the aftermath of the Indian Ocean tsunami: What role for forests and trees? Proceedings of the Regional Technical Workshop, Khao Lak, Thailand, 28–31 August 2006. Compiled and edited by Braatz, S., Fortuna, S, Broadhead, J. and Leslie, R. In press. (www.fao.org/forestry/tsunami/coastalprotection) GOSL. 2000. Forest Cover Mapping 2000. Forest Inventory Division. Forest Department. Sri Lanka Cited in: FAO. 2005. Global Forest Resources Assessment (FRA) 2005 country report – Sri Lanka. By Sathurusinghe, A. FRA 2005 Working Paper No. 123. Unpublished.
IUCN. 2005a. A report on the terrestrial assessment of tsunami impacts on the coastal environment in Rewaka, Ussangoda and Kalametiya (RUK) area of Southern Sri Lanka. http://www.iucn.org/tsunami/docs/ruk-rapid-assessment-report.pdf
IUCN. 2005b. Mangrove forests saved lives in 2004 tsunami disaster, News release, Bangkok, Colombo. Legg and Jewell. 1995. A 1:50 000 scale Forest Map of Sri Lanka: The basis for National Geographic System. Christopher Legg and Nicholas Jewell. The Sri Lanka Forester. Special Issue 1995.
Spalding, M.D., Blasco, F. & Field, C.D. eds. 1997. World Mangrove Atlas. The International Society for Mangrove Ecosystems, Okinawa, Japan. 178 pp.
The Ramsar Convention on Wetlands 2003. The Annotated Ramsar List of Wetlands of International Importance – Sri Lanka. http://www.ramsar.org/profile/profiles_srilanka.htm
UNEP. 2005a. After the Tsunami. Rapid Environmental Assessment. http://www.unep.org/tsunami/reports/TSUNAMI_SRILANKA_LAYOUT.pdf
UNEP. 2005b. Sri Lanka Post-Tsunami Environmental Assessment. United Nations Environment Programme & Ministry of Environment and Natural resources of Sri Lanka.
True mangrove species checklist Acanthus ilicifolius Acrostichum aureum Aegiceras corniculatum Avicennia marina Avicennia officinalis Bruguiera cylindrica Bruguiera gymnorrhiza Bruguiera sexangula Ceriops decandra
114
Ceriops tagal Excoecaria agallocha Heritiera littoralis Lumnitzera racemosa Nypa fruticans Pemphis acidula Rhizophora apiculata Rhizophora mucronata Scyphiphora hydrophyllacea Sonneratia alba Sonneratia apetala Sonneratia caseolaris Xylocarpus granatum
National level mangrove estimates
Year Area (ha) Source Trend Methodology/Comments
1968 3 640 Aruchelvam, K. 1969. Mangroves. The Ceylon Forester 8 (384): 1-34
Cited in: Pinto, M.L. 1982. Distribution and zonation of mangroves in the Northern part of the Negombo Lagoon (Sri Lanka). J. Natn. Sci. coun. Sri Lanka 1982 10 (2): 245-255
1969 10 000 Aruchelvam, K. 1969. Mangroves. The Ceylon Forester 8 (384): 1-34
X Cited in: Jayasekara, A.M. 1986. Management strategies for fisheries and aquaculture in mangrove ecosystem in Sri Lanka. In: Mepham, R.H. 1986. Papers contributed to the workshop on strategies for the management of fisheries and aquaculture in mangrove ecosystems. pp 1-9. Bangkok, Thailand, 23-25 June
1977 120 000 Raphael, Y.I. 1977. Mangrove and estuarine area development: Country statement - Sri Lanka. In Proceedings of the International Workshop on Mangrove and Estuarine Area Development for the Indo-Pacific Region. p. 119-120. 14-19 November 1977. Manila.
This figure should be considered as an overestimate it could include "estuarine" area.
1978 3 200 Seneviratne, E.W. 1978. The Sri Lanka Mangroves.
Cited in: Snedaker, S.C. 1984. The Mangroves of Asia and Oceania: Status and Research Planning. In: proceedings of the Asian Symposium on Mangrove Environment Research and Management, Kuala Lumpur. pp 5-15. August 25-29, 1980. Edited by E. Soepadmo, A.N. Rao and D.J. MacIntosh. 1984.
1982 8 000 World Rainforest movement. 2002. Sri Lanka: politics in forests. http://www.wrm.org.uy/bulletin/29/SriLanka.html
Secondary reference, no primary source provided.

115
Year Area (ha) Source Trend Methodology/Comments
1983 3 600 Saenger, P., Hegerl E.J. and J.D.S., Davie. 1983. Global status of mangrove ecosystems. Commission on ecology Papers No.3. IUCN. Gland, Switzerland. 88 pp.
Secondary reference, no primary source provided. The "Year" is the publication year.
1983 4 000 Wacharakitty, S. 1983. Mangrove Ecosystem in General. In: ESCAP/UNESCO/NRCT Regional Remote Sensing Training Course of Mangrove Ecosystem. p. 22-33. Bangkok, Nov. 28-Dec. 16 1983
Cited in: FAO. 1988. Manual on mapping and inventory of mangroves. Benessalah, D., ed. FAO Rome, 123 pp. Rough estimate.
1986 6 296 Jayasekara, A.M. 1986. Management strategies for fisheries and aquaculture in mangrove ecosystem in Sri Lanka. Papers contributed to the workshop on strategies for the management of fisheries and aquaculture in mangrove ecosystems. Bangkok, Thailand, 23-25 June
Land use maps prepared by the Survey Department as a result of the Sri Lanka-Swiss Remote Sensing Project. This estimate does not include all the country.
1992 8 800 WCMC. 2000. Coral reefs and mangroves of the world. http://www.wcmc.org.uk/marine/data/coral_mangrove/
Data are based on analysis of satellite imagery as of early 1992. An additional 500-700 ha in stands <20 m wide may also exist. Legg in litt.
1992 8 688 Legg and Jewell. 1995. A 1:50 000 scale Forest Map of Sri Lanka: The basis for National Geographic System. Christopher Legg and Nicholas Jewell. The Sri Lanka Forester. Special Issue 1995.
X Remote sensing and ground checking
1994 11 500 Dassanayake, H. 1994. Shri Lanka (environmental situation) In: An Environmental assessment of the Bay of Bengal region. FAO, Rome, p: 209-235
As cited in the document, mangroves extent is between 10 000-13 000 ha. The figure in this list is an average.
1996 9 530 GOSL. 2000. Forest Cover Mapping 2000. Forest Inventory Division. Forest Department. Sri Lanka
X Satellite imageries and aerial photos taken in 1996 and field checking. Cited in: FAO. 2005. Global Forest Resources Assessment (FRA) 2005 country report – Sri Lanka. By Sathurusinghe, A. FRA 2005 Working Paper No. 123. Unpublished.

Trends in mangrove area extent over time
9 6
00
9 3
00
9 0
00
8 8
00
9 5
30
10 000
20 000
30 000
40 000
50 000
1968
1969
1970
1971
1972
1973
1974
1975
1976
1977
1978
1979
1980
1981
1982
1983
1984
1985
1986
1987
1988
1989
1990
1991
1992
1993
1994
1995
1996
1997
1998
1999
2000
2001
2002
2003
2004
2005
Year
ha
Figures not used for trends Figures used for trends Calculated estimates Trend
120 000ha
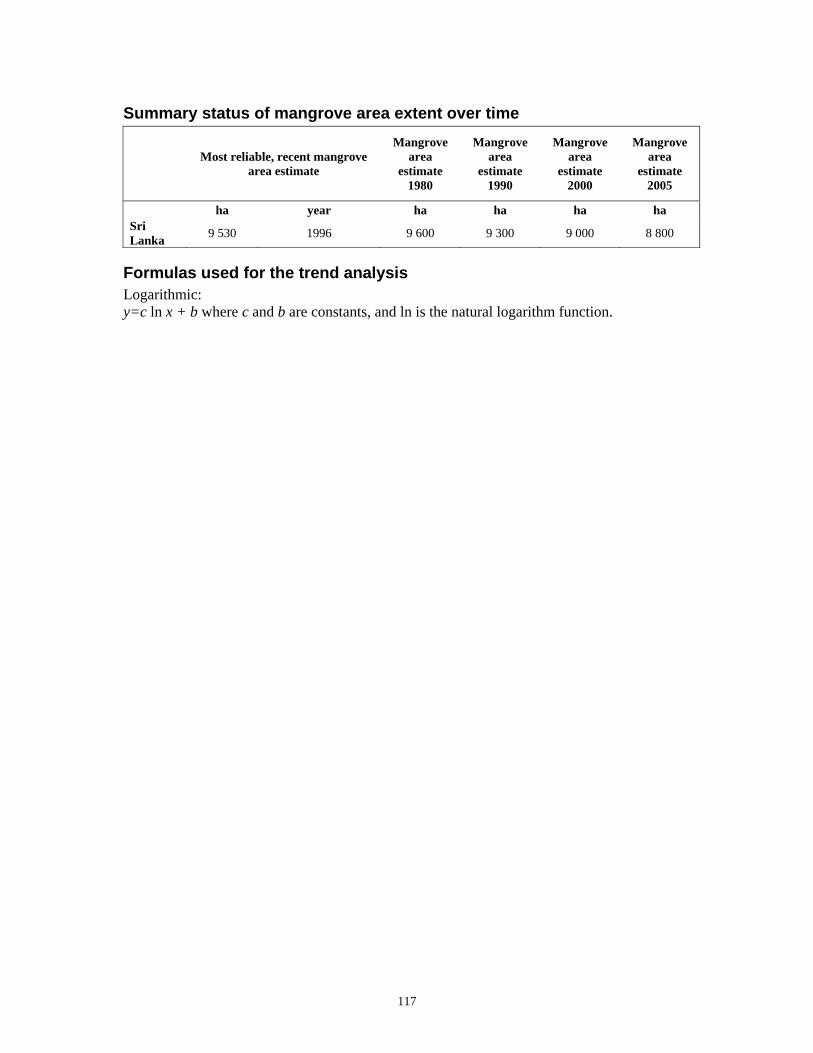
117
Summary status of mangrove area extent over time
Most reliable, recent mangrove area estimate
Mangrove area
estimate 1980
Mangrove area
estimate 1990
Mangrove area
estimate 2000
Mangrove area
estimate 2005
ha year ha ha ha ha Sri Lanka 9 530 1996 9 600 9 300 9 000 8 800
Formulas used for the trend analysis Logarithmic: y=c ln x + b where c and b are constants, and ln is the natural logarithm function.
118
Thailand Vegetation description, uses and threats Mangrove forests in Thailand occur on the muddy tidal flats at the river mouths and along the southern and eastern coasts. Rich and abundant forests are growing in the Andaman Sea coast, but they can be found also in the Gulf of Thailand, with stands growing also in the Chao Phraya delta. The diversity of mangrove tree species is very high in this country and mangrove generally form two-storeyed forests, with an upper layer growing up to 20 m in height, and a lower layer. The upper layer is dominated by Rhizophora apiculata and, to a lesser extent, Rhizophora mucronata (both locally named kongkang), Heritiera littoralis (ngon kai) and Xylocarpus mekongensis (syn X. moluccensis). Common species of the lower layer are Bruguiera cylindrica (thua khao), Bruguiera parviflora (thua dam), Bruguiera sexangula (prasak nu), Ceriops decandra and Ceriops tagal (both called prong). Prasak (Bruguiera gymnorrhiza) is a common species which may occasionally grow up to 40 m in height and 2 m in girth. Landwards dryer soils are overgrown with ferns and herbs and can anticipate evergreen forest. On the edge of creeks the chak palm, Nypa fruticans, is also common. Thailand is home of one of the internationally known examples of well-managed mangrove forests, the well-structured Ranong mangrove forest, located at around 600 km southwest of Bangkok in a narrow coastal plain characterized by many waterways and it was designated as UNESCO-MAB Biosphere Reserve in 1997. The people living in the reserve depend primarily on fishing and shrimp farming. Ecotourism is slowly increasing, also owing to the presence and activities of the Ranong Mangrove Research Center, which has a long history of scientific research in this area, with several research workers and students visiting it yearly. Mangroves have a long history of use in Thailand, for the collection of fish, shellfish (mainly crabs) and wood (mainly for production of charcoal and firewood). Villagers are also indirectly linked to mangroves for the benefits offshore fisheries receive from healthy and well developed mangrove ecosystems. More recently also in this country these forests are increasingly seen as an ecotourism destination. The production on charcoal from Rhizophora apiculata, Rhizophora mucronata, Avicennia marina and Xylocarpus spp wood represents a very high percent of the total wood harvest product (about 90 percent), the 40 percent of which is exported to Hong Kong, Malaysia and Singapore. In the past decades however wide areas of mangroves have been over harvested or have been deforested to give space to shrimp farms, or agriculture, urban, tourist, industrial and coastal development. As a consequence many local communities have experienced a decrease in their income from traditional mangrove use – or from offshore fisheries. Shrimp farming sector in Thailand experienced its boom of activities in the 1970s, particularly on the Gulf coast, which in that time was more accessible than the Andaman coast. Because of the expansion of the sector some of the previously existing forests were removed to give space to ponds. In some cases however, the farms had a very limited lifespan (in some cases only of 3-4 years), and a large number of ponds were then abandoned, leaving large areas of degraded land. Mangrove lands were also, in lesser extent, converted for the production of salt or dedicated to tin mining. As in other parts of the world, local communities and organizations are now planning reforestation and rehabilitation of mangrove lands previously converted to shrimp ponds or other land uses and now abandoned.

119
The tourism sector is highly contributing to the national economy in Thailand, however the development of infrastructures has often taken a toll on natural resources, damaging or destroying coastal forests and wetlands. Even though Thailand has taken several steps forward in the conservation of these valuable ecosystems, mangroves sill have to face important threats such as illegal cutting or the conversion of land to other uses. In addition to human induced losses, these coastal ecosystems have to face also serious erosion processes, especially undergoing in the northern Gulf of Thailand, cyclones, wind and large tsunamis. During severe storms or tsunamis trees in the seaward side may be uprooted and washed away. It has been reported that during the tremendous 26th December 2004 tsunami an area of mangroves estimated between 290 and 320 ha depending on the assessments (Department of Marine and Coastal Resources; Kashio, 2005; UNEP. 2005) was damaged, mostly in Phang Nga province. The tsunami runup and rundown also contributed to an increased deposit of silt on the pneumatophores and sand in the soil which had a negative impact on the natural regeneration of most all mangrove species (with the sole exception of Rhizophora apiculata) and may cause additional long term damages (Siripong. 2007, Wachrinrat, C. 2007). Greenbelts efficiency varied according to coastal topography, however it has been noted that dense and extended mangrove forests helped mitigating the force of the tsunami reducing the damages to the inland territories (Siripong. 2007). Anecdotal evidence on people saved from the devastating impact of tsunami because mangroves are bordering the coast come also from the hardest hit provinces of Phang Nga and Ranong. Other interesting examples suggesting that mangrove forests provided protection for life and property come from Krabi, where only those houses and schools built behind the mangrove forests were not destroyed or damaged or Khura Buri, a small fishing village. A review of studies undertaken to assess the role coastal forests played in protecting lives and properties during the devastating Tsunami of 2004 in Thailand is reported in FAO 2007 and ground surveys conducted specifically to measure the mitigation effects by various tree species demonstrated the value of wide mangrove belts in mitigating the effect of the hazard. Tanaka (Tanaka et al. 2006) effectuated a ground survey in the small islands of Ko Kang, which are situated in the narrow channel between Ra Island and Phra Thong Island (Phang Nga province) and hit by an 8 meter tsunami. In this locality it was found that only the first 50 meters of mangrove, dominated by Rhizophora apiculata and R. mucronata, were broken; Avicennia alba was broken only on the fringe of the vegetation. All of these species were broken at the trunk, just above aerial root system Concerns about the loss of mangrove areas and the benefits which healthy forests could provide have led to the establishment of number of legal and policy measures for the protection and sustainable use of coastal ecosystems. Strict rules are applicable on mangrove concessions to maintain sustainability and three state owned seedling production centres have been created to facilitate reforestation and plantation activities. A percentage of these coastal ecosystems is conserved in national parks and other protected areas (e.g. the Ao Phang-nga National Park, Phang-nga Bay) and since 1998 several wetlands in Thailand have also been included in the Ramsar list of wetlands of international importance. Among these the Kaper Estuary site (Laem son Marine National Park, Ranong and Phang-nga province) is considered to have one among the largest concentrations of mangroves in the entire country. The site is also increasingly used as tourist destination and it is mainly used for research and environmental training and the vegetation composition and zonation pattern is well known; Rhizophora mucronata, Rhizophora apiculata, Bruguiera gymnorrhiza, Bruguiera parviflora and Bruguiera cylindrica dominate the landward side, while specimens of Xylocarpus granatum, X. moluccensis and Acanthus ilicifolius can be found in lesser extent. Sonneratia
120
alba, Avicennia alba, Ceriops tagal, Acanthus ilicifolius and A. volubilis dominate on the seaward side. The surrounding areas though are dedicated to agriculture and shrimp farming and the potential expansion of ponds may threaten the integrity of the wetlands. Reference: Sayaka, A. & Sirasantipong, W. 2004. Current status of mangrove and people’s participation in Thailand. In: Bhandari, Bisnu B., Masakazu Kashio & Reiko Nakamura. 2004. Mangroves in Southeast Asia: Status, Issues and Challenges. pp: 73-80. Tokyo, Ramsar Center Japan/IGES. 266 pp.
FAO. 2007. Coastal protection in the aftermath of the Indian Ocean tsunami: What role for forests and trees? Proceedings of the Regional Technical Workshop, Khao Lak, Thailand, 28–31 August 2006. Compiled and edited by Braatz, S., Fortuna, S, Broadhead, J. and Leslie, R. In press. (www.fao.org/forestry/tsunami/coastalprotection)
FAO, UNEP. 1981. Tropical Forest Resources Assessment Project, Forest Resources of Tropical Asia. FAO, UNEP, 475 pp.
Kashio, M., 2005 personal communication “Mangrove destruction from Tsunami on 26 Dec. 2004. Data from each Mangrove resource development unit” Klankamsorn, B and Charuppat T. 1982. Study on change of mangrove forest areas in Thailand by using LANDSAT imageries. Forest Management Division.
Meepol, W. 2004. Information provided for the Global Forest Resources Assessment (FRA) 2005 thematic study on mangroves. Unpublished.
National Park, Wildlife and Plant Conservation Department. National Park website. Ao Phang-nga National Park fact sheet. http://www.dnp.go.th/parkreserve/asp/style1/default.asp?npid=197&lg=2 (last updated February 2007)
National Park, Wildlife and Plant Conservation Department. National Park website. Laem Son National Park fact sheet. http://www.dnp.go.th/parkreserve/asp/style2/default.asp (last updated February 2007)
Siripong, A. 2007 The role of coastal vegetation in protecting the Thai coast against the 2004 tsunami. In FAO. Coastal protection in the aftermath of the Indian Ocean tsunami: What role for forests and trees?. Proceedings of the Regional Technical Workshop, Khao Lak, Thailand, 28–31 August 2006. Compiled and edited by Braatz, S., Fortuna, S, Broadhead, J. and Leslie, R. In press. (www.fao.org/forestry/tsunami/coastalprotection)
Tanaka, N., Sasaki, Y., Mowjood, M.I.M., Jinadasa, K.B.S.N. and Homchuen, S., 2006. Coastal vegetation structures and their functions in tsunami protection: experience of the recent Indian Ocean tsunami. Landscape and Ecological Engineering, ?: 13.
Tuma, S. 2002. Personal communication
UNEP. 2005. After the Tsunami. Rapid Environmental Assessment. http://www.unep.org/tsunami/reports/TSUNAMI_THAILAND_LAYOUT.pdf Vibulsresth, S., Ketruangrote, C. and Sriplung, N. 1976. Distribution of mangrove forest as revealed by earth resources technology satellite (ERTS-1) imagery. Paper presented at the Seminar/Workshop on Mangrove Ecology, 10-15 January 1976, Phuket, Thailand
Wachrinrat, C. 2007. Outcomes of the project “In-depth assessment of mangroves and other coastal forests affected by the tsunami in Southern Thailand. In FAO. Coastal protection in the aftermath of the Indian Ocean tsunami: What role for forests and trees?. Proceedings of the Regional Technical Workshop, Khao Lak, Thailand, 28–31 August 2006. Compiled and edited by Braatz, S., Fortuna, S, Broadhead, J. and Leslie, R. In press. (www.fao.org/forestry/tsunami/coastalprotection)
True mangrove species checklist Acanthus ebracteatus Acanthus ilicifolius Acrostichum aureum Acrostichum speciosum Aegialitis rotundifolia Aegiceras corniculatum
121
Avicennia alba Avicennia marina Avicennia officinalis Bruguiera cilíndrica Bruguiera gymnorrhiza Bruguiera parviflora Bruguiera sexangula Ceriops decandra Ceriops tagal Cynometra iripa Cynometra ramiflora Excoecaria agallocha Excoecaria indica Heritiera fomes Heritiera littoralis Kandelia candel Lumnitzera littorea Lumnitzera racemosa Nypa fruticans Rhizophora apiculata Rhizophora mucronata Sonneratia alba Sonneratia apetala Sonneratia caseolaris Sonneratia griffithii Sonneratia ovata Xylocarpus granatum Xylocarpus mekongensis
National level mangrove estimates
Year Area (ha) Source Trend Methodology/Comments
1960 360 000 Aksornkoae, S. 1996. Scientific mangrove management in Thailand. In: Aksornkoae, S., Puangchit, L. and Thaiutsa, B.1997. Tropical Forestry in the 21st Century. Vol. 10: Mangrove Ecosystems. p. 118-126. FORTROP'96 International Conference, 25-28 November 1996, Bangkok, Thailand. KUFF / NRCT / RFD.
Secondary reference, no primary source provided.
1960 372 448 Royal Forestry Department, Land Development Department and National Research Institute, 1995. The Ninth National Seminar on Mangrove Ecology, Natural Research Council of Thailand. Royal Forestry Department, Land Development Department & National Research Institute
Original data.

122
Year Area (ha) Source Trend Methodology/Comments
1961 368 100 Sukwong et al. 1976. Status Report on the floristic and forestry aspects of mangrove in Thailand. Paper presented at the Seminar /Workshop on Mangrove Ecology, 10-15 January 1976, Phuket, Thailand. 8p.
Cited in: FAO. 1982. Management and utilization of mangroves in Asia and the Pacific. FAO environment paper 3. 160 pp. Based on aerial photos.
1961 474 400 Silapathong, C. 1992. Utilisation combine d’un système d’information géographique et de la télédétection pour le suivi et l’aménagement des mangroves de Thailande. PhD thesis, Paul Sabatier University, Toulouse, France. 184 pp.
Cited in: Spalding, M.D., Blasco, F. and Field, C.D., eds. 1997. World Mangrove Atlas. The International Society for Mangrove Ecosystems, Okinawa, Japan. 178 pp.
1961 367 900 Klankamsorn, B and Charuppat, T. 1982. Study on changes of mangrove forest areas in Thailand by using LANDSAT imageries. Forest Management Division. Royal Forest Department, Bangkok, Thailand (In Thai)
Cited in: FAO. 1992. Mangrove for charcoal. A vanishing Sustainable Woodfuel Resource System (The case of Yesarn, Upper Gulf of Thailand). FAO Regional Wood Energy Development Programme in Asia. Bangkok, Thailand. By Sanit Aksornkoae Choob Khemnark Mellink, W.H.H. Bangkok, Thailand, 45 pp.
1973 312 732 Vibulsresth, S., Ketruangrote, C. and Sriplung, N. 1976. Distribution of mangrove forest as revealed by earth resources technology satellite (ERTS-1) imagery. Paper presented at the Seminar/Workshop on Mangrove Ecology, 10-15 January 1976, Phuket, Thailand
X LANDSAT Imagery 1973. Cited in FAO. 1982. Management and utilization of mangroves in Asia and the Pacific. FAO environment paper 3. 160 pp. From the text: The apparent discrepancies between 1961 data and 1973 data are due to a different interpretation and classification rather than to changes in the mangrove area between 1961 and 1973
1975 433 700 Silapathong, C. 1992. Utilisation combine d’un système d’information géographique et de la télédétection pour le suivi et l’aménagement des mangroves de Thailande. PhD thesis, Paul Sabatier University, Toulouse, France. 184 pp.
Cited in: Spalding, M.D., Blasco, F. and Field, C.D., eds. 1997. World Mangrove Atlas. The International Society for Mangrove Ecosystems, Okinawa, Japan. 178 pp.
1977 163 349 National Research Council of Thailand. 1977. Report of Thailand National Task Force. Nat Res Council Thailand. Bangkok
Cited in: Snedaker, S.C. 1984. The mangroves of Asia and Oceania: status and research planning. In: Proceedings of the Asian Mangrove Symposium., eds. Soepadmo,E; Rao,AN; McIntosh,DJ. p. 5-15 Percetakan Ardyas Sdn Bhd., Kuala Lumpur. 25-29 August 1980, Kuala Lumpur, Malaysia. This figure should be considered as an under-estimate.
1979 396 400 Silapathong, C. 1992. Utilisation combine d’un système d’information géographique et de la télédétection pour le suivi et l’aménagement des mangroves de Thailande. PhD thesis, Paul Sabatier University, Toulouse, France. 184 pp.
Cited in: Spalding, M.D., Blasco, F. and Field, C.D., eds. 1997. World Mangrove Atlas. The International Society for Mangrove Ecosystems, Okinawa, Japan. 178 pp.

123
Year Area (ha) Source Trend Methodology/Comments
1979 175 864 Royal forestry department. 1979. Personal communication.
Cited in: FAO. 1982. Management and utilization of mangroves in Asia and the Pacific. FAO environment paper 3. FAO, Rome, 160 pp. The “year” is the publication year.
1979 287 308 Klankamsorn, B and Charuppat T. 1982. Study on change of mangrove forest areas in Thailand by using LANDSAT imageries. Forest Management Division.
X Cited in: FAO. 1985. Mangrove management in Thailand, Malaysia, and Indonesia. FAO Environment Paper (FAO), no. 4. FAO, Rome, 62 pp. Based on remote sensing
1980 316 000 FAO, UNEP. 1981. Tropical Forest Resources Assessment Project, Forest Resources of Tropical Asia. FAO, UNEP, 475 pp
Estimation based on: FAO. 1975. Prefeasibility Study for Wood Based Panel Industries in Thailand. By Jaaka Poyry Co. - DP/RAS/74/007-1/FO Helsinki; Christensen, B. 1979. Mangrove forest resources and their management in Asia and the Far East. FAO- Bangkok.
1982 287 200 Royal Forest Department of Thailand. 1998. Forestry Statistics of Thailand 1998.
Based on RFD, 1982. The "Year" is the publication year.
1982 268 693 Klankamsorn B. and Charuppat T. 1982. Study on change of mangrove forest areas in Thailand by using LANDSAT imageries. Forest Management Division.
X Cited in: Fisher, P and Spalding, M.D. 1993. Protected areas with mangrove habitat. Draft Report World Conservation Centre, Cambridge, UK. 60pp.
1983 288 000 Wacharakitty, S. 1983. Mangrove Ecosystem in General. In: ESCAP/UNESCO/NRCT Regional Remote Sensing Training Course of Mangrove Ecosystem. p. 22-33. Bangkok, Nov. 28-Dec. 16 1983
Cited in: FAO. 1988. Manual on mapping and inventory of mangroves. Benessalah, D., ed. FAO Rome, 123 pp. The "Year" is the publication year.
1983 163 400 Saenger, P., Hegerl E.J. and J.D.S., Davie. 1983. Global status of mangrove ecosystems. Commission on ecology Papers No.3. IUCN. Gland, Switzerland. 88 pp.
Secondary reference, no primary source provided. The "Year" is the publication year. The figure seems to refer to National Research Council of Thailand, 1977 (see above).
1984 307 715 de la Cruz, A. A. 1984. A realistic approach to the use and management of mangrove areas in Southeast Asia. In: Teas, H.J., ed. 1984. Physiology and management of mangroves. Dr. W. Junk Publishers, The Hague. The Netherlands.
Average of six values obtained from Dr. Sanit Aksornkoae and from literature. No specific reference is mentioned. The “Year” is the publication year.
1986 245 100 Silapathong, C. 1992. Utilisation combine d’un système d’information géographique et de la télédétection pour le suivi et l’aménagement des mangroves de Thailande. PhD thesis, Paul Sabatier University, Toulouse, France. 184 pp.
Cited in: Spalding, M.D., Blasco, F. and Field, C.D., eds. 1997. World Mangrove Atlas. The International Society for Mangrove Ecosystems, Okinawa, Japan. 178 pp.
124
Year Area (ha) Source Trend Methodology/Comments
1986 196 436 Royal Forest Department of Thailand. 1989. Forestry Statistics of Thailand 1989. Forest Statistics sub-division - Planning Division - Royal Forest Department
Secondary reference. Probably based on Klankamsorn, B. and Charuppat T. 1987. In: Kongsangchai, J., 1988. Conservation and management of mangrove forests in Thailand. Forest Management Division, Royal Forest Department, Bangkok, Thailand
1986 309 700 Baker, I., Kaeoniam, P. 1986. Manual of Coastal Development Planning and Management for Thailand. Supported by UNESCO MAB and COMAR. Prepared at TISTR
Remote sensing
1987 264 100 Spalding, M.D., Blasco, F. and Field, C.D., eds. 1997. World Mangrove Atlas. The International Society for Mangrove Ecosystems, Okinawa, Japan. 178 pp.
Map analysis. Mangrove polygons were prepared from the four-map series (IDRC/NRCT/RFD, 1991) produced as a part of the Remote Sensing and Mangroves Project (Thailand) at a scale of 1:500 000. Sources for these maps were Landsat-MSS data recorded in 1986-1987. IDRC/NRCT/RFD. 1991. Remote Sensing and Mangroves Project (Thailand). Series of four maps prepared at 1:500 000 by the Remote Sensing Division of the National Research Council. International Development Research Centre, National Research Council of Thailand and the Royal Forestry Department.
1987 226 545 Natural Resource Council Thailand. nd.
LANDSAT 5
1989 142 000 FAO. 1989. Project Advisory Committee Meeting. FAO/RWEDP, Bangkok, Thailand
Cited in: FAO. 1992. Mangrove for charcoal. A vanishing Sustainable Woodfuel Resource System (The case of Yesarn, Upper Gulf of Thailand). FAO Regional Wood Energy Development Programme in Asia. Bangkok, Thailand. By Sanit Aksornkoae Choob Khemnark Mellink, W.H.H. Bangkok, Thailand, 45 pp.
1989 180 559 Royal Forest Department of Thailand. 1989. Forestry Statistics of Thailand 1989. Forest Statistics sub-division - Planning Division - Royal Forest Department
The figure is calculated by applying a fixed deforestation rate to the results of previous inventories.
1991 173 821 Royal Forest Department. 1990. Forestry Statistics of Thailand 1990. Bangkok, Thailand
The figure is calculated by applying a fixed deforestation rate to the results of previous inventories.
125
Year Area (ha) Source Trend Methodology/Comments
1992 176 155 Havanond, S., Maxwell, G.S., Piriyayotha, S. and Trakoonsiripanich, C. 1996. Strategies in mangrove restoration: balancing natural biodiversity and pragmatic ecological repair in waterlogged environments. In: Aksornkoae, S., Puangchit, L. and Thaiutsa, B. (1997). Tropical Forestry in the 21st Century. Vol. 10: Mangrove Ecosystems. p.36-56 FORTROP'96 International Conference, 25-28 November 1996, Bangkok, Thailand. KUFF / NRCT / RFD.
Data from NRCT.
1993 168 682 Royal Forest Department of Thailand. 1989. Forestry Statistics of Thailand 1989. Forest Statistics sub-division - Planning Division - Royal Forest Department.
The figure is calculated by applying a fixed deforestation rate to the results of previous inventories.
1995 200 000 Kelleher, G., Bleakley, C. and Wells, S. 1995. A global representative system of marine protected areas. Vol.II-III-IV Great Barrier Reef Marine Park Authority, IBRD, The World Bank, IUCN. IBRD
Secondary reference, no primary source provided. The "Year" is the publication year. Rough estimate.
1996 232 500 WRI, UNEP, UNDP, The World Bank. 1996. World Resources 1996-1997. New York and Oxford University Press 365 pp.
Secondary reference, no primary source provided. The "Year" is the publication year.
1996 167 582 Charuppat, T. 1998. Mangrove Forest Situation of Thailand in the Past 35 Years (1961-1996). Royal Forest Department. Unpublished (Thai).
Results of using Landsat-5 ™ Geocoded at the scale of 1:50 000
2000 194 600 World Resources Institute. 2000. World resources 2000-2001: people and ecosystem—the fraying web of life. Washington, DC., UNDP. 400 pp.
Secondary reference, no primary source provided. The "Year" is the publication year.
2000 252 750 Royal Forest Department 2000. Mangrove Forest Zonation 2000. Technical paper, 53 p. (in Thai.). Unpublished
Cited in: Meepol, W. 2004. Information provided for the "revised world atlas of mangroves". Unpublished. 2000 Landast 5 TM imagery interpretation.
2000 166 400 Bhandari, Bisnu B., Masakazu Kashio & Reiko Nakamura. 2004. Mangroves in Southeast Asia: Status, Issues and Challenges. Tokyo, Ramsar Center Japan/IGES. 266 pp.
Secondary reference, no primary source provided.
2000 244 085 Tuma, S. 2002. Personal communication
X Based on remote sensing, information provided by Natural Resource Council Thailand.
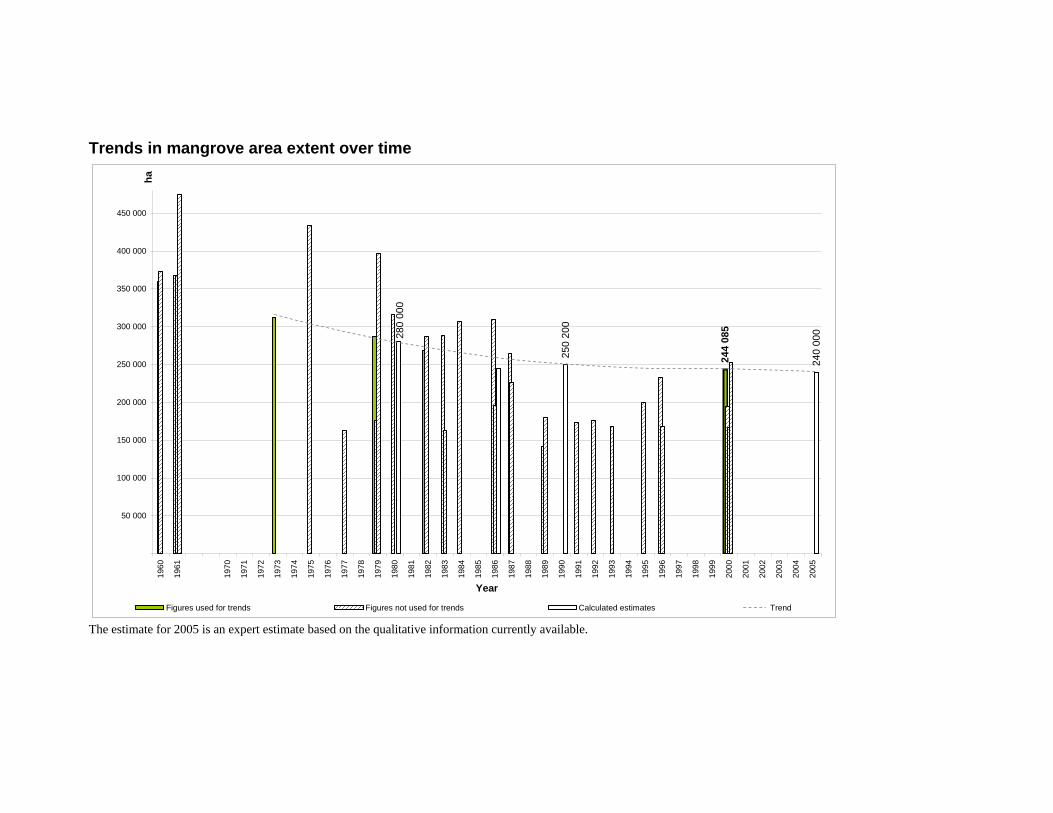
Trends in mangrove area extent over time
250
200
240
000
244
085 280
000
50 000
100 000
150 000
200 000
250 000
300 000
350 000
400 000
450 000
1960
1961
1970
1971
1972
1973
1974
1975
1976
1977
1978
1979
1980
1981
1982
1983
1984
1985
1986
1987
1988
1989
1990
1991
1992
1993
1994
1995
1996
1997
1998
1999
2000
2001
2002
2003
2004
2005
Year
ha
Figures used for trends Figures not used for trends Calculated estimates Trend
The estimate for 2005 is an expert estimate based on the qualitative information currently available.
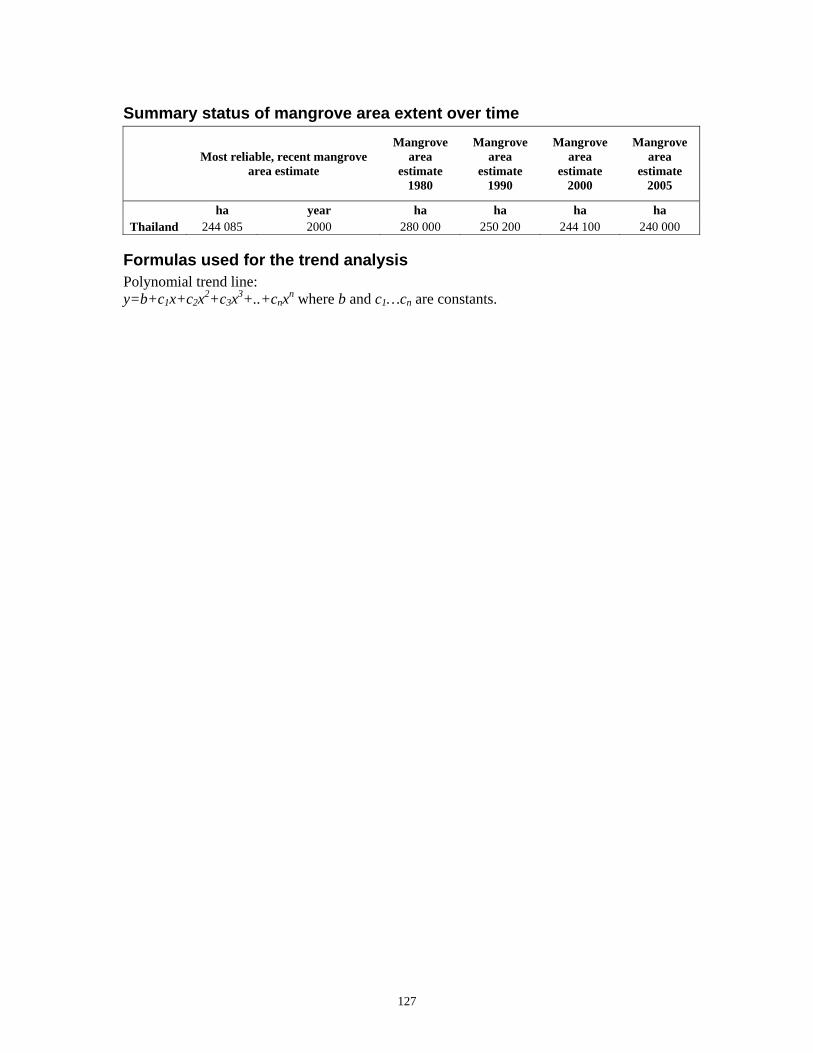
127
Summary status of mangrove area extent over time
Most reliable, recent mangrove area estimate
Mangrove area
estimate 1980
Mangrove area
estimate 1990
Mangrove area
estimate 2000
Mangrove area
estimate 2005
ha year ha ha ha ha Thailand 244 085 2000 280 000 250 200 244 100 240 000
Formulas used for the trend analysis Polynomial trend line: y=b+c1x+c2x2+c3x3+..+cnxn where b and c1…cn are constants.
128
Timor-Leste Vegetation description, uses and threats The Democratic Republic of Timor-Leste was established in May 2002; prior to this date it was under the United Nations Transitional Administration in East Timor (UNTAET, October 1999-May 2002) and under the administration of the Republic of Indonesia (1975 to 1999) and Portugal (16th century-1975). Its coastal morphology allow mangroves to grow only in a relatively small area; the majority of this forest is concentrated along the north coast, where the sea is calmer and more inlets are found, especially at Metinaro, Tibar and Maubara. In the southern area mangroves are only present at streams’ mouths and on swampy soils. Around 10 true mangrove species are growing in this country; in permanent or temporal inundated salty terrain Sonneratia alba and Bruguiera parviflora are found, Rhizophora apiculata and Bruguiera sp. in the mire and, in association with Excoecaria agallocha, in the coralliferous sediment. On the temporally inundated salty terrains the main species found are Rhizophora apiculata, Avicennia marina, Aegiceras corniculatum, Acanthus ilicifolius and Lumnitzera racemosa. Mangroves have been locally used for fuelwood, for tannin extractions and other products. Currently, despite the relatively significant losses occurred in the country the need of their protection has also been recognized by the country’s authorities. Reference: FAO. 2005. Global Forest Resources Assessment 2005 - Timor-Leste. By da Silva, M. FRA 2005 Country Report No. 218. Unpublished.
GOTL. 2005. Forest conservation and fauna protection in East Timor. Agriculture: New Directions for a New Nation – East Timor (Timor-Leste). Ministry of Agriculture, Forestry and Fisheries. Helder da Costa, Colin Piggin, Cesar J da Cruz and James J Fox (eds.) ACIAR Proceedings No. 13 (printed version published in 2003)
UNTAET (United Nations Transitional Administration in East Timor). 2000. East Timor Regulations promulgated by the United Nations Transitional Administration in East Timor. Regulation No. 2000/19. http://www.austlii.edu.au/tp/legis/consol_reg/2000/19.html.
Universidade de Coimbra. nd. The obscure history of East Timor - Flora and fauna http://www.uc.pt/timor/florafauna.html#THE.MANGROVE
True mangrove species checklist Acanthus ilicifolius Acrostichum aureum Aegiceras corniculatum Avicennia marina Bruguiera parviflora Excoecaria agallocha Heritiera littoralis Lumnitzera racemosa Rhizophora apiculata Sonneratia alba Xylocarpus granatum
National level mangrove estimates
Year Area (ha) Source Trend Methodology/Comments
129
1940 9 000 MacKinnon, J.; Beudels R.C, Robinson A.H. 1982. National conservation plan for Indonesia. V. 4: Nusa Tenggara. FAO-FO--INS/78/061 Field report 44.
Secondary reference, no primary source provided. “Original” mangroves extent.
1982 4 000 MacKinnon, J.; Beudels R.C, Robinson A.H. 1982. National conservation plan for Indonesia. V. 4: Nusa Tenggara. FAO-FO--INS/78/061 Field report 45
X Secondary reference, no primary source provided. The "Year" is the publication year.
2000 3 035 The World-Web Virtually Library-East Timor. 2000. Flora and Fauna The obscure history of East Timor - Flora and fauna Universidade de Coimbra. http://www.uc.pt/timor/florafauna.html#THE.MANGROVE
Secondary reference, no primary source provided. The "Year" is the publication year.
2000 1 802 GOTL. 2001. Rapid Rural Land Use Assessment and Model For Land Use Classification and Mapping. Agricultural Land Use and Geographical Information System unit. Timor-Leste.
X Cited in: FAO. 2005. Global Forest Resources Assessment 2005 - Timor-Leste. By da Silva, M. FRA 2005 Country Report No. 218. Unpublished.
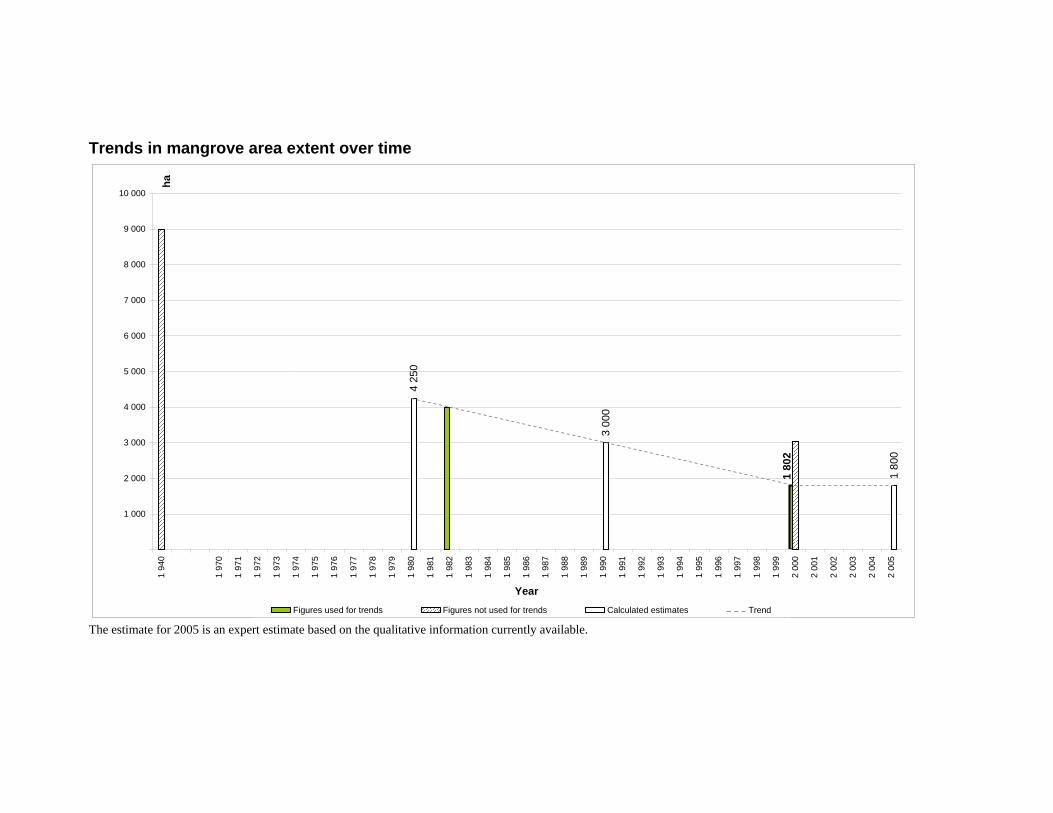
Trends in mangrove area extent over time
4 2
50
3 0
00
1 8
00
1 8
02
1 000
2 000
3 000
4 000
5 000
6 000
7 000
8 000
9 000
10 000
1 9
40
1 9
70
1 9
71
1 9
72
1 9
73
1 9
74
1 9
75
1 9
76
1 9
77
1 9
78
1 9
79
1 9
80
1 9
81
1 9
82
1 9
83
1 9
84
1 9
85
1 9
86
1 9
87
1 9
88
1 9
89
1 9
90
1 9
91
1 9
92
1 9
93
1 9
94
1 9
95
1 9
96
1 9
97
1 9
98
1 9
99
2 0
00
2 0
01
2 0
02
2 0
03
2 0
04
2 0
05
Year
ha
Figures used for trends Figures not used for trends Calculated estimates Trend The estimate for 2005 is an expert estimate based on the qualitative information currently available.

131
Summary status of mangrove area extent over time
Most reliable, recent mangrove area estimate
Mangrove area
estimate 1980
Mangrove area
estimate 1990
Mangrove area
estimate 2000
Mangrove area
estimate 2005
ha year ha ha ha ha Timor-Leste 1 802 2000 4 250 3 000 1 800 1 800
Formulas used for the trend analysis Linear: y = mx + b where m is the slope and b is the intercept.
132
United Arab Emirates Vegetation description, uses and threats Mangrove forests have a patchy distribution in the United Arab Emirates; the majority of the sites have small dimensions, with the exception of Abu Dhabi area, Khor al Bazm Sabkha and Sinaiya Island where they form significant stands. Ancient trees were also recorded at two sites, Khor al Beidah and Khor Kalba. Only two true mangrove species are found in this country, Avicennia marina, occurring on muddy flats or fine texture soils along sheltered localities and Rhizophora mucronata which was re-introduced in 1984. Uses and threats In the Gulf of Oman there is very little human use of the mangroves themselves, although in some areas they are used as fodder for camels, fuel, charcoal, and for the preparation of stakes for fishing. These uses are probably decreasing in line with increasing wealth in the region. Conversely many areas are increasingly threatened by oil and other kind of pollution. Landfill associated with urban and industrial development also threatened mangroves in many areas. Despite any threat, mangrove extent has been increasing over the last twenty years in the UAE, due to natural growth and successful afforestation programme activities, which were started by the Ministry of Agriculture and Fisheries in 1972 in Abu Dhabi. Plantations are critical for the restoration of this ecosystem, and it is highly recommended to undertake it in respect of other coastal vegetation types and in an integrated coastal area management framework. Reference: Anwahi, A.A. 2005. Information provided for the Global Forest Resources Assessment (GFRA) 2005 thematic study on mangroves. Unpublished.
Böer, B. 2002. The coastal and sabkha flora of the United Arab Emirates. In: Sabkha Ecosystems, 303-309.
Khan, M.I.R. 1982. Mangrove forest of the United Arab Emirates. Pakistan Journal of Forestry. 32(2): 36-39.
Scott, D.A. (ed.) 1995. A Directory of Wetlands in the Middle East. IUCN, Gland, Switzerland and IWRB, Slimbridge, U.K. xvii + 560pp, 13 maps.
Spalding, M., Blasco, F. & Field ,C.D., eds. 1997. World mangrove atlas. Okinawa, Japan, The International Society for Mangrove Ecosystems.
True mangrove species checklist Avicennia marina Rhizophora mucronata (re-introduced)
National level mangrove estimates
Year Area (ha) Source Trend Methodology/Comments
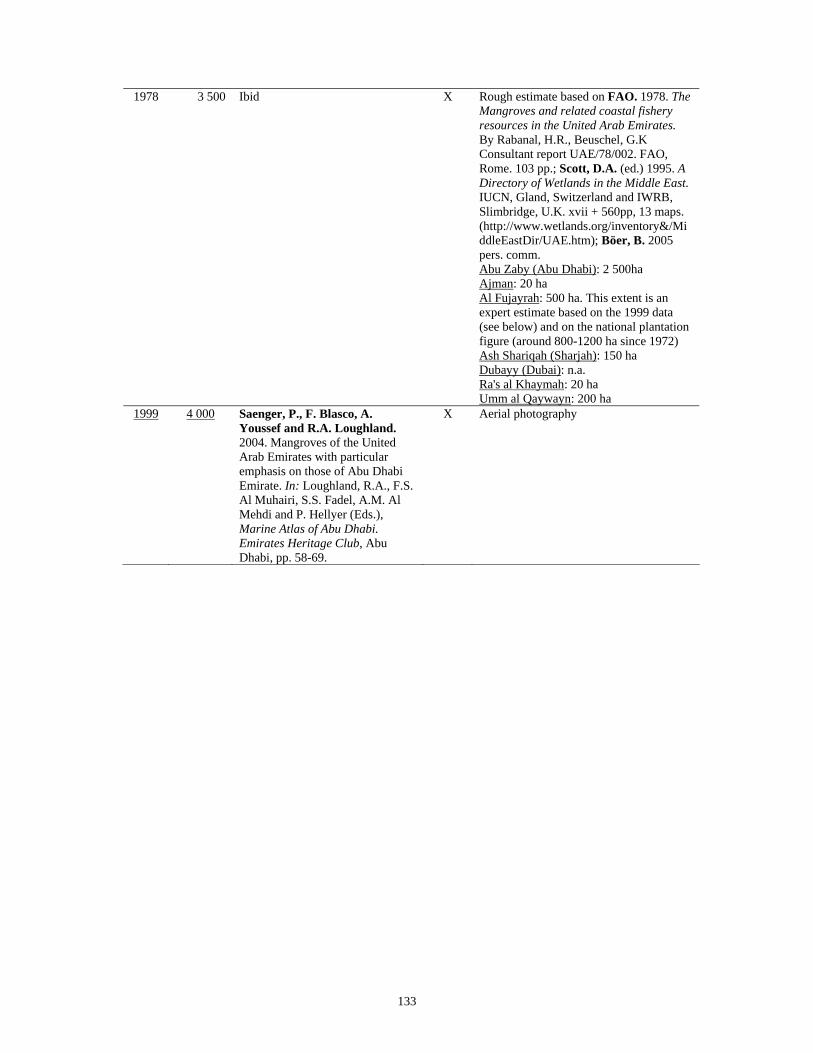
133
1978 3 500 Ibid X Rough estimate based on FAO. 1978. The Mangroves and related coastal fishery resources in the United Arab Emirates. By Rabanal, H.R., Beuschel, G.K Consultant report UAE/78/002. FAO, Rome. 103 pp.; Scott, D.A. (ed.) 1995. A Directory of Wetlands in the Middle East. IUCN, Gland, Switzerland and IWRB, Slimbridge, U.K. xvii + 560pp, 13 maps. (http://www.wetlands.org/inventory&/MiddleEastDir/UAE.htm); Böer, B. 2005 pers. comm. Abu Zaby (Abu Dhabi): 2 500ha Ajman: 20 ha Al Fujayrah: 500 ha. This extent is an expert estimate based on the 1999 data (see below) and on the national plantation figure (around 800-1200 ha since 1972) Ash Shariqah (Sharjah): 150 ha Dubayy (Dubai): n.a. Ra's al Khaymah: 20 ha Umm al Qaywayn: 200 ha
1999 4 000 Saenger, P., F. Blasco, A. Youssef and R.A. Loughland. 2004. Mangroves of the United Arab Emirates with particular emphasis on those of Abu Dhabi Emirate. In: Loughland, R.A., F.S. Al Muhairi, S.S. Fadel, A.M. Al Mehdi and P. Hellyer (Eds.), Marine Atlas of Abu Dhabi. Emirates Heritage Club, Abu Dhabi, pp. 58-69.
X Aerial photography
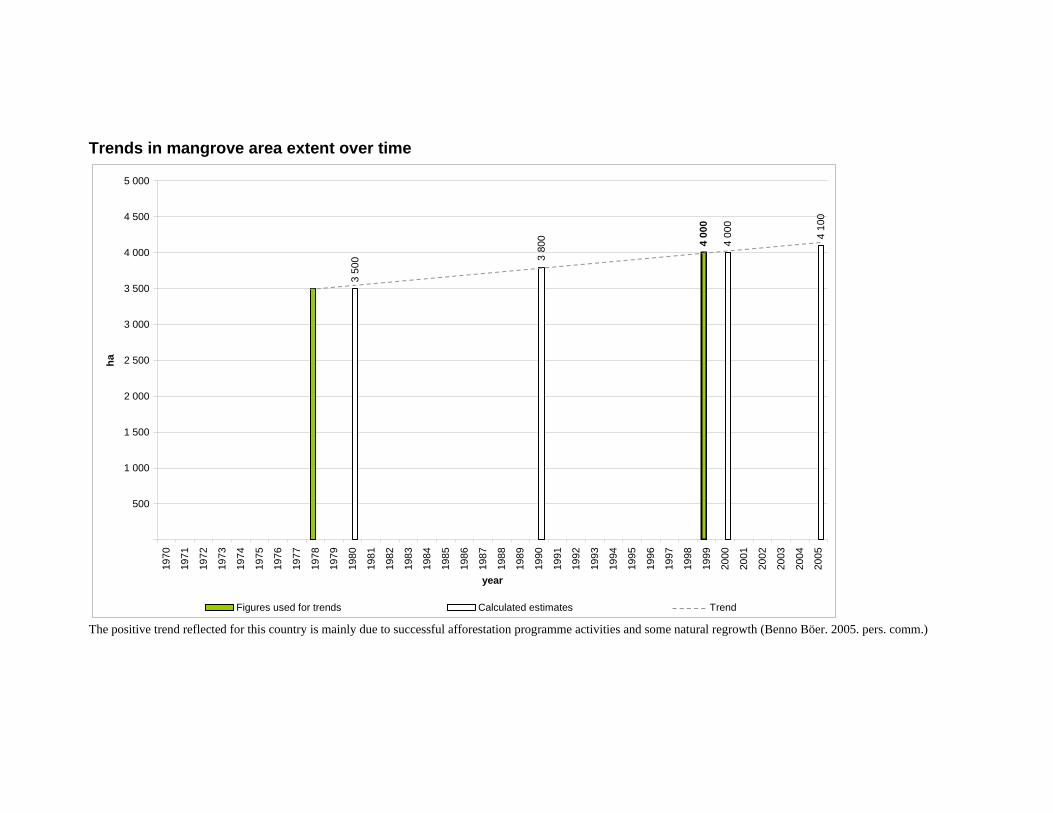
Trends in mangrove area extent over time
3 5
00 3 8
00 4 0
00
4 1
00
4 0
00
500
1 000
1 500
2 000
2 500
3 000
3 500
4 000
4 500
5 00019
70
1971
1972
1973
1974
1975
1976
1977
1978
1979
1980
1981
1982
1983
1984
1985
1986
1987
1988
1989
1990
1991
1992
1993
1994
1995
1996
1997
1998
1999
2000
2001
2002
2003
2004
2005
year
ha
Figures used for trends Calculated estimates Trend
The positive trend reflected for this country is mainly due to successful afforestation programme activities and some natural regrowth (Benno Böer. 2005. pers. comm.)
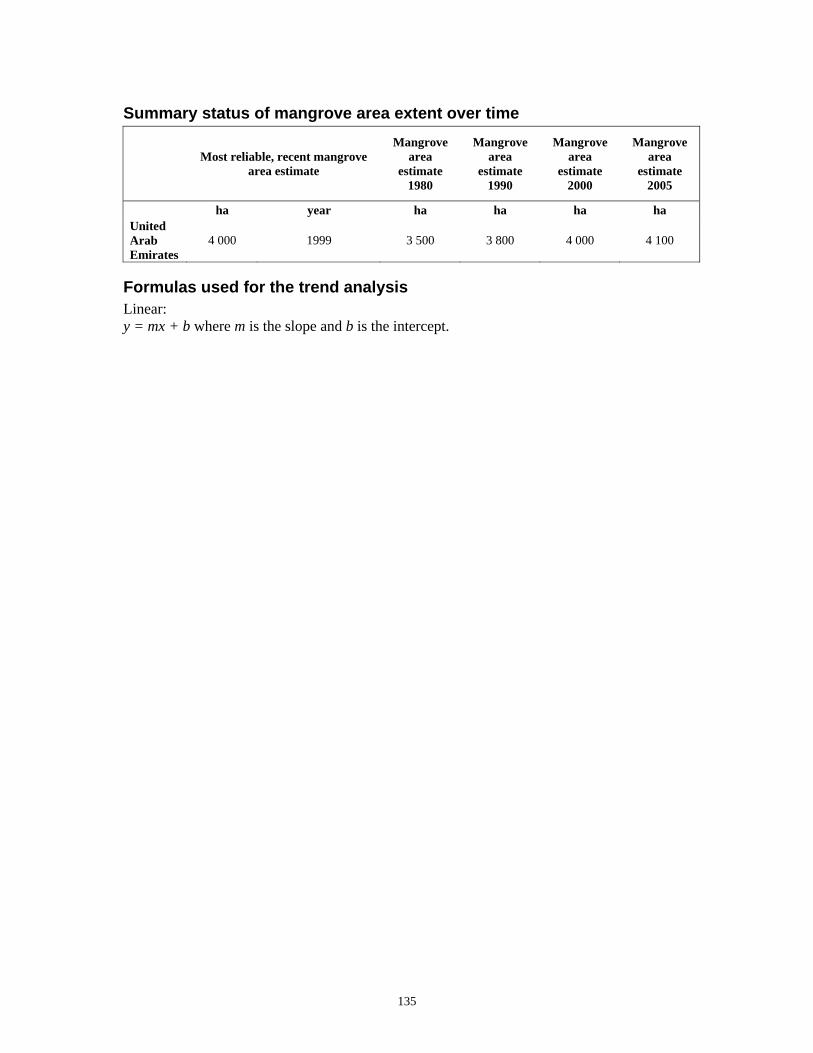
135
Summary status of mangrove area extent over time
Most reliable, recent mangrove area estimate
Mangrove area
estimate 1980
Mangrove area
estimate 1990
Mangrove area
estimate 2000
Mangrove area
estimate 2005
ha year ha ha ha ha United Arab Emirates
4 000 1999 3 500 3 800 4 000 4 100
Formulas used for the trend analysis Linear: y = mx + b where m is the slope and b is the intercept.
136
Viet Nam Vegetation description, uses and threats Viet Nam has a long coastline of about 3 260 kilometres, extending through the territories of 24 provinces and cities and facing the Gulf of Tonkin and the South China Sea. The country is very rich with rivers and on average, river mouths are found every 20 kilometres along the coast. The largest areas of mangroves in the country are those found in the Mekong Delta, near Ho Chi Minh City, in the Songkoi Delta and further south on the Ca Mau peninsula. Along the central parts of the country only few areas are covered by mangroves since the coastline is generally very rocky and influenced by strong water actions and tidal fluctuations are low; in these zone narrow strips of mangroves are found only along the riverbanks. Mangrove biodiversity is quite high in Viet Nam, where 28 different true mangrove species are currently growing, with Rhizophora spp and Bruguiera spp being the most common species. The main mangrove species in the Camau Peninsula are Rhizophora apiculata (syn R. conjugata), Bruguiera gymnorrhiza, Ceriops decandra (syn C. roxburghiana) and Lumnitzera littorea (syn L. coccinea). A lower number of species are growing in the north, possibly due to the lower temperatures. Here mangroves have developed in river deltas, estuaries and on wide tidal flats and even though with a lower diversity some primary forests with mixed stands of trees reaching 8 m in height are found. The use of mangroves in Viet Nam has a very long tradition and a wide range of utilizations, from the production of charcoal (especially produced from Rhizophora apiculata and Bruguiera parviflora), fuelwood, honey and traditional medicines, to the use of wood as timber and thatching materials. The production of charcoal and tannin have recently slowed down namely because of the impoverishment of the resources and because of the replacement with synthetic tannin. Especially in the south of the country many villages are found on the river banks, with houses constructed on stilts and people mainly rely on fisheries and collection of shrimp and crabs for their livelihoods. The overexploitation of the resources, the conversion of mangrove land into agricultural fields, salt ponds, urban infrastructures and since the 1980s shrimp aquaculture (particularly in the southwest) have been identified as the main reasons of mangrove area changes over the past two decades. The use of mangrove lands for agriculture purposes though did not result successful because the soils got quickly degraded. Some of the localities along the Viet Nam coastlines experienced severe erosion also as a direct result of the deforestation occurred; in addition to the clearing of coastal vegetation, additional key factors influencing coastal erosion in this country have been identified in the development of infrastructures (harbour development) and land reclamation. Even though human pressure has been recorded as one of the main causes, to date, the construction of the Dinh Vu Dam seems to have decreased erosion in some regions of the country. Coastal erosion generates many difficulties for the coastal population. Mitigation measures currently in use in Viet Nam are hard structures (for example walls, rip-raps), soft structures (beach nourishment, mangrove plantation) and a combination of the two. The Vietnamese Government is investing in research for effective protective measures. Another important reason of mangrove degradation and reduction has been identified in the chemical warfare (herbicides and napalm) undertaken during the Viet Nam war (1962-1972)
137
as mangrove forests served as bases for military operations. Thousand of hectares of mangroves have been destroyed in the eastern part of the South zone, the coast of the Mekong Delta and the Ca Mau Peninsular, where primary forest is now absent. Remaining forests consist mainly of secondary growth, much of it scrubby, and plantations. Despite the big forest cover changes suffered by the country over time Viet Nam has made considerable efforts to restore mangrove areas, totalizing around 46 600 ha of mangrove plantations. Afforestation efforts begun in 1975, after the unification of the country and were repeated in the early 1990s, when the Government of Viet Nam rehabilitated nearly 53 000 ha. In addition various foreign NGOs supported mangrove rehabilitation projects and around 14 000 ha have been planted from 1991 to 2002 in eight provinces (Quang Ninh, Hai Phong, Ninh Binh, Thanh Hoa, Nghe An, Ha Tinh, Thai Binh and Nam Dinh). Rehabilitation efforts revealed to be successful, thanks to the close cooperation between funding agencies, local authorities and people, and to the mangrove related strategies approved by the Government. In addition, some mangrove nature reserve (i.e. Tien Hai Nature Reserve, the Thanh Phu Nature Reserve and the Bac Lieu Sanctuary) and two national park (i.e. Xuan Thuy National Park and the Ca Mau National Park) have been also set up in recent years. Reference: FAO, UNEP. 1981. Tropical Forest Resources Assessment Project, Forest Resources of Tropical Asia. FAO, UNEP, 475 pp.
Forest Inventory Planning Institute (FIPI), 2001. National forest inventory to the 31st December 1999. Report of FIPI sent to the Government following the Decision No. 03/2001 QD/TTG signed on 5 January 2001.
Cat, N.N, et al.. 2007 Field study presentation: Status of coastal erosion in Vietnam and proposed measures for protection. In FAO. Coastal protection in the aftermath of the Indian Ocean tsunami: What role for forests and trees?. Proceedings of the Regional Technical Workshop, Khao Lak, Thailand, 28–31 August 2006. Compiled and edited by Braatz, S., Fortuna, S, Broadhead, J. and Leslie, R. In press. (www.fao.org/forestry/tsunami/coastalprotection)
Granich, S., Kelly, M. and N. Huu Ninh. 1993. Global Warming and Vietnam. A briefing document. University of East Anglia, Norwich, UK, International Institute for Environment and Development, London, UK, Centre for Environment Research Education and Development, Hanoi, Vietnam. http://www.cru.uea.ac.uk/tiempo/floor0/briefing/vietnam/index.htm#section2
Hong, P.N. and San, H.T. 1993. Mangroves of Vietnam. IUCN The World Conservation Union, Bangkok, Thailand, 173 pp.
Maurand. 1943. Cited in: Phan Nguyen Hong. 2004. Mangrove forest in Vietnam: current status and challenges. In: Bhandari, B.B., Kashio, M. and Nakamura, R. Mangroves in Southeast Asia. Status, Issues and Challenges. pp: 55-71. Ramsar Center Japan. Institute for Global Environmental Strategies (IGES). Tokyo.
Phan Nguyen Hong. 2004. Mangrove forest in Vietnam: current status and challenges. In: Bhandari, B.B., Kashio, M. and Nakamura, R. Mangroves in Southeast Asia. Status, Issues and Challenges. pp: 55-71. Ramsar Center Japan. Institute for Global Environmental Strategies (IGES), Tokyo.
Spalding, M.D., Blasco, F. & Field, C.D., eds. 1997. World Mangrove Atlas. The International Society for Mangrove Ecosystems, Okinawa, Japan. 178 pp.
True mangrove species checklist Acanthus ebracteatus Acanthus ilicifolius Acrostichum aureum Aegiceras corniculatum Aegiceras floridum Avicennia alba Avicennia marina Avicennia officinalis
138
Bruguiera cylindrica Bruguiera gymnorrhiza Bruguiera parviflora Bruguiera sexangula Ceriops decandra Ceriops tagal Excoecaria agallocha Heritiera littoralis Kandelia candel Lumnitzera littorea Lumnitzera racemosa Nypa fruticans Rhizophora apiculata Rhizophora mucronata Rhizophora stylosa Scyphiphora hydrophyllacea Sonneratia alba Sonneratia caseolaris Sonneratia ovata Xylocarpus granatum
National level mangrove estimates
Year Area (ha) Source Trend Methodology/Comments
1943 408 500 Maurand. 1943. X Cited in: Phan Nguyen Hong. 2004. Mangrove forest in Vietnam: current status and challenges. In: Bhandari, B.B., Kashio, M. and Nakamura, R. Mangroves in Southeast Asia. Status, Issues and Challenges. pp: 55-71. Ramsar Center Japan. Institute for Global Environmental Strategies (IGES). Tokyo.
1962 400 000 Ibid. X Calculated basing on Granich, S., Kelly, M. and N. Huu Ninh. 1993. (see below) Before 1960 Viet Nam had 400 000 ha of mangroves; between 1962 and 1971 104 123 ha have been destroyed during the war.
1965 320 000 FAO, UNEP. 1981. Tropical Forest Resources Assessment Project, Forest Resources of Tropical Asia FAO, UNEP, 475 pp
X Remote sensing
1971 295 877 Granich, S., Kelly, M. and N. Huu Ninh. 1993. Global Warming and Vietnam. A briefing document. University of East Anglia, Norwich, UK, International Institute for Environment and Development, London, UK, Centre for Environment Research Education and Development, Hanoi, Vietnam. http://www.cru.uea.ac.uk/tiempo/floor0/briefing/vietnam/index.htm#section2
X Secondary reference, no primary source provided. Before 1960 Viet Nam had 400 000 ha of mangroves; between 1962 and 1971 104 123 ha have been destroyed during the war.
139
Year Area (ha) Source Trend Methodology/Comments
1980 465 000 FAO, UNEP. 1981. Tropical Forest Resources Assessment Project, Forest Resources of Tropical Asia FAO, UNEP, 475 pp
Extent of mangroves and tidal forests.
1980 169 000 FAO, UNEP. 1981. Tropical Forest Resources Assessment Project, Forest Resources of Tropical Asia FAO, UNEP, 475 pp
This figure was calculated by applying a fixed annual deforestation rate to the 1965 mangroves extent (see above). Mainly based on: Westing, A.H. 1976. Ecological consequences of the Second Indochina War. Stockholm International Peace Research Institute.
1982 252 000 Van Ba Tran. 1993. Utilization and management of mangrove ecosystems in Vietnam. In Proceedings of the Asia-Pacific Symposium on Mangrove Ecosystem, Yuk-Shan Wong and Nora, F.Y. Tam, eds. The Hong Kong University of Science & Technology, 1-3 September, 1993. 368 pp.
Secondary reference, no primary source provided.
1982 252 500 Hong, P.N. and San, H.T. 1993. Mangroves of Vietnam. IUCN The World Conservation Union, Bangkok, Thailand, 173 pp.
X Information according to: Forest Inventory and Planning Institute (FIPI, 1983).
1984 286 400 Hamilton, L.S. and Snedaker, S.C., eds. Handbook for Mangrove Area Management. IUCN, Gland, Switzerland. UNESCO Paris & East-West Center, Hawaii; 123 pp
Secondary reference, no primary source provided. The "Year" is the publication year.
1987 272 300 Spalding, M.D., Blasco, F. and Field, C.D., eds. 1997. World Mangrove Atlas. The International Society for Mangrove Ecosystems, Okinawa, Japan. 178 pp.
Map analysis. Data showing mangrove in the Mekong Delta only are taken from Anon. 1987, believed to be the result of a forest inventory in 1987. Anon. 1987. Cac Loai Thuc Vat bi de Doa Dien Hinh va Mot Vung Tap Trung. 1:4 000 000.
1991 260 000 Forest Science Inst. of Vietnam. 1991. Rational utilization, protection and development of the intertidal forest ecosystem to stop soil and environment resources depletion. Forest Science Inst. of Vietnam, Hanoi, Vietnam 84 pp.
Secondary reference, no primary source provided. The "Year" is the publication year.
1995 200 000 Kelleher, G., Bleakley, C. and Wells, S. 1995. A global representative system of marine protected areas. Vol.II-III-IV Great Barrier Reef Marine Park Authority, IBRD, The World Bank, IUCN. IBRD
Secondary reference, no primary source provided. The "Year" is the publication year.

140
Year Area (ha) Source Trend Methodology/Comments
1996 154 000 Tuan, M.S. 1996. Building up the strategy for mangrove management in Vietnam. In proceedings of the ECOTONE V Regional Seminar: Community Participation In Conservation, Sustainable Use and Rehabilitation of Mangroves In Southeast Asia, Ho Chi Minh City, Vietnam, 8-12 January,1996. Mangrove Ecosystem Research Centre (MERC) , Vietnam National University, Vietnam
Cited in: Can Gio Mangrove Management Scheme in Ho Chi Min City. http://www.vista.gov.vn/TestEnglish/tindt/Infotera/2001/s2/tep2.htm Secondary reference, no primary source provided. The "Year" is the publication year.
1999 156 608 Forest Inventory Planning Institute (FIPI), 2001. National forest inventory to the 31st December 1999. Report of FIPI sent to the Government following the Decision No. 03/2001 QD/TTG signed on 5 January 2001.
X Cited in: Phan Nguyen Hong. 2004. Mangrove forest in Vietnam: current status and challenges. In: Bhandari, B.B., Kashio, M. and Nakamura, R. Mangroves in Southeast Asia. Status, Issues and Challenges. pp: 55-71. Ramsar Center Japan. Institute for Global Environmental Strategies (IGES). Tokyo. Of this 96 876 ha are planted and 59 732 ha are natural forests.
2000 250 000 Aizpuru, M., Achard, F., and Blasco, F. 2000. Global Assessment of Cover Change of the Mangrove Forests using satellite imagery at medium to high resolution. In EEC Research project n 15017-1999-05 FIED ISP FR – Joint Research center, Ispra.
Secondary reference, no primary source provided. The "Year" is the publication year. Rough estimate.
2000 157 500 World Atlas of Mangroves initiative www.fao.org/forestry/site/mangrove-atlas
X 2000 LANDSAT imagery interpretation undertaken by UNEP-WCMC.
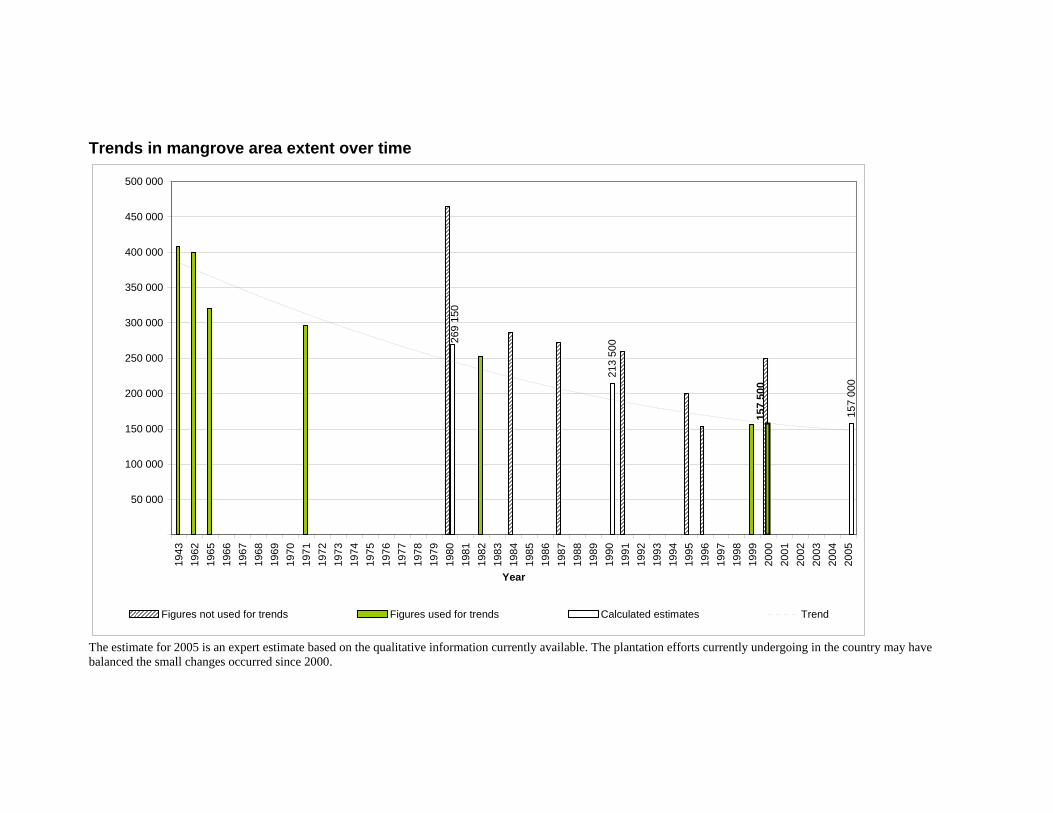
Trends in mangrove area extent over time
213
500
157
000
157
500
269
150
50 000
100 000
150 000
200 000
250 000
300 000
350 000
400 000
450 000
500 00019
4319
6219
6519
6619
6719
6819
6919
7019
7119
7219
7319
7419
7519
7619
7719
7819
7919
8019
8119
8219
8319
8419
8519
8619
8719
8819
8919
9019
9119
9219
9319
9419
9519
9619
9719
9819
9920
0020
0120
0220
0320
0420
05
Year
Figures not used for trends Figures used for trends Calculated estimates Trend
The estimate for 2005 is an expert estimate based on the qualitative information currently available. The plantation efforts currently undergoing in the country may have balanced the small changes occurred since 2000.
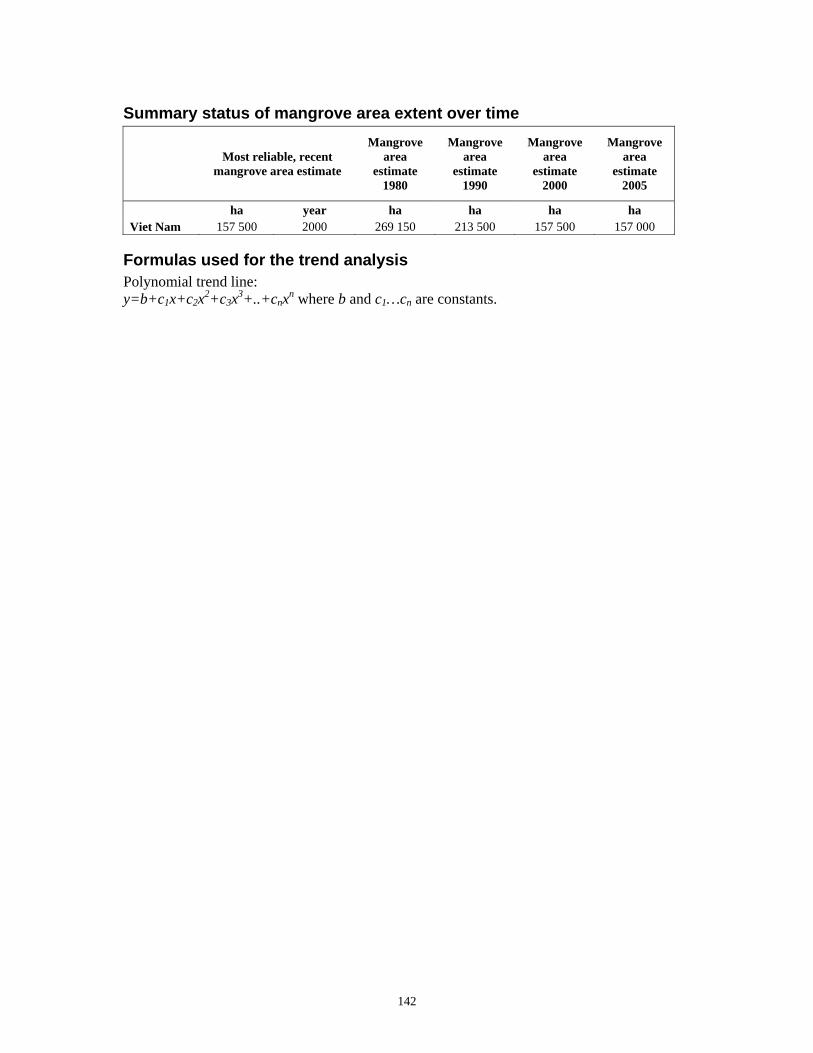
142
Summary status of mangrove area extent over time
Most reliable, recent mangrove area estimate
Mangrove area
estimate 1980
Mangrove area
estimate 1990
Mangrove area
estimate 2000
Mangrove area
estimate 2005
ha year ha ha ha ha Viet Nam 157 500 2000 269 150 213 500 157 500 157 000
Formulas used for the trend analysis Polynomial trend line: y=b+c1x+c2x2+c3x3+..+cnxn where b and c1…cn are constants.
143
Yemen Vegetation description, uses and threats Mangroves in Yemen are found as narrow forests along the shoreline, on near- and off-shore islands and fringe tidal inlets and channels (the “khors”), in the Red Sea and Gulf of Aden area; with the 95 percent localized in the Red Sea coasts. These forests generally grow from 50 to 300 m in width, however they may cover relatively big extents, ranging from 20 to 100 km in length reaching considerable dimensions at Al-Buhays (15º 59’N, 42º 49’E) and Al-Habl (16º 09’N, 42º 49’E). The distribution and density of mangroves have been classified into four categories according to their features, and decreasing in extent and structure from North to South: from Midi to Al-Luhayyah, with dense and extensive stands forming a semi-continuous belt; from Al-Khawbah to Ras Isa, where stands are generally interrupted by relatively large patches of bare shore; from Al-Urj to Al-Hudaydah, where only small stands are growing; and South of Al-Hudaydah to Bab al-Mandab. Although mangroves are mainly found in thin and widely separated stands, there are also few extensive and healthy stands, found where considerable freshwater seepage exists, especially at Al-Ruays and Yakhtul. The majority of the forests are mono-specific stands of Avicenna marina with few exceptions (e.g. Kamaran Island and Al-Hudaydah) where Rhizophora mucronata is also present. A. marina trees usually not exceed 3 to 6 m in height, growing up to 11 m at Al-Urj, which also contains the biggest and oldest A. marina trees in Yemen, while R. mucronata may grow up to 7-9 m in the Kamaran Island, which is also among the most dense and pristine mangrove areas in the country. As in many other arid countries with mangroves, camel grazing is one of the main threats to these forests, which seriously limit its structure and height. Some trees are also cut to fulfil the wood demand, which led to the loss of some stands in the Midi area. Apart from this aquaculture is also a current threat, especially between Midi and Al-Habl IV, which is being converted to shrimp farm. Few other sites are used as harbours for the fishing boats, where mangroves were probably removed in the past (e.g. Al-Luhayyah). A mass mortality of A. marina has been verified at Al-Ghurairah due to the increase in sand dunes which buried the entrance of the khor, leading to the decrease in flow of tidal water; around 2 500 dead trees were recorded. Urban pressure and pollution from domestic wastes (plastic bags, bottles and cans) are negatively impacting on the mangroves in this country, near the high densely populated centres. Reference: PERSGA/GEF. 2004. Status of mangroves in the Red Sea and Gulf of Aden. PERSGA Technical Series No 11. PERSGA, Jeddah
Spalding, M., Blasco, F. & Field C.D., eds. 1997. World mangrove atlas. The International Society for Mangrove Ecosystems, Okinawa, Japan, 178 pp.
True mangrove species checklist Avicennia marina Rhizophora mucronata
National level mangrove estimates
Year Area (ha) Source Trend Methodology/Comments

144
1987 8 100 Spalding, M.D., Blasco, F. and Field, C.D., eds. 1997. World Mangrove Atlas. The International Society for Mangrove Ecosystems, Okinawa, Japan. 178 pp.
Map analysis. Data for the former Yemen Arab Republic (North Yemen) obtained from IUCN, 1987, which contains four maps covering the coast at 1:500 000, based on field surveys. A small area of the coast of the former South Yemen was added from Sheppard et al., 1992 and areas were annotated for the Island of Socotra from RGS (1978). This is reported to be the most accurate data available for the island and has a symbol which describes 'coastal marsh and mangrove'. IUCN. 1987. The Distribution of Habitats and Species along the YAR Coastline. IUCN, The World Conservation Union, Gland, Switzerland. RGS, 1978. Socotra 1:125 000 Royal Geographical Society, London. Sheppard, C., Price, A. and Roberts, C. 1992. Marine Ecology of the Arabian Region: Patterns and Processes in Extreme Tropical Environments. Academic Press, London, UK.
1993 927 Hunting Tech. Services LTD, Woodland Resource Mapping of Yemen. 1993. Woodland Resource Mapping of Yemen.
X Remote sensing, ground survey and interpretation of aerial photography. The document also provides the extent of the coastal plains (8 100 ha)
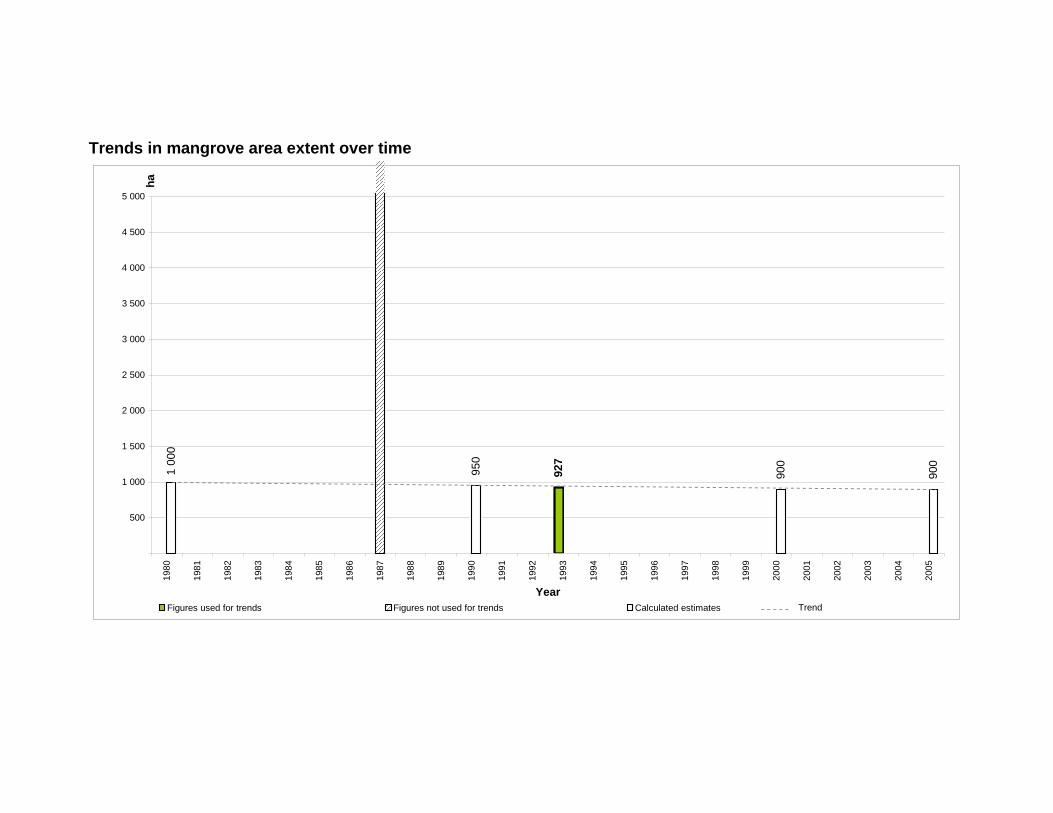
Trends in mangrove area extent over time 1
000
950
900
900
927
500
1 000
1 500
2 000
2 500
3 000
3 500
4 000
4 500
5 000
1980
1981
1982
1983
1984
1985
1986
1987
1988
1989
1990
1991
1992
1993
1994
1995
1996
1997
1998
1999
2000
2001
2002
2003
2004
2005
Year
ha
Figures used for trends Figures not used for trends Calculated estimates Trend
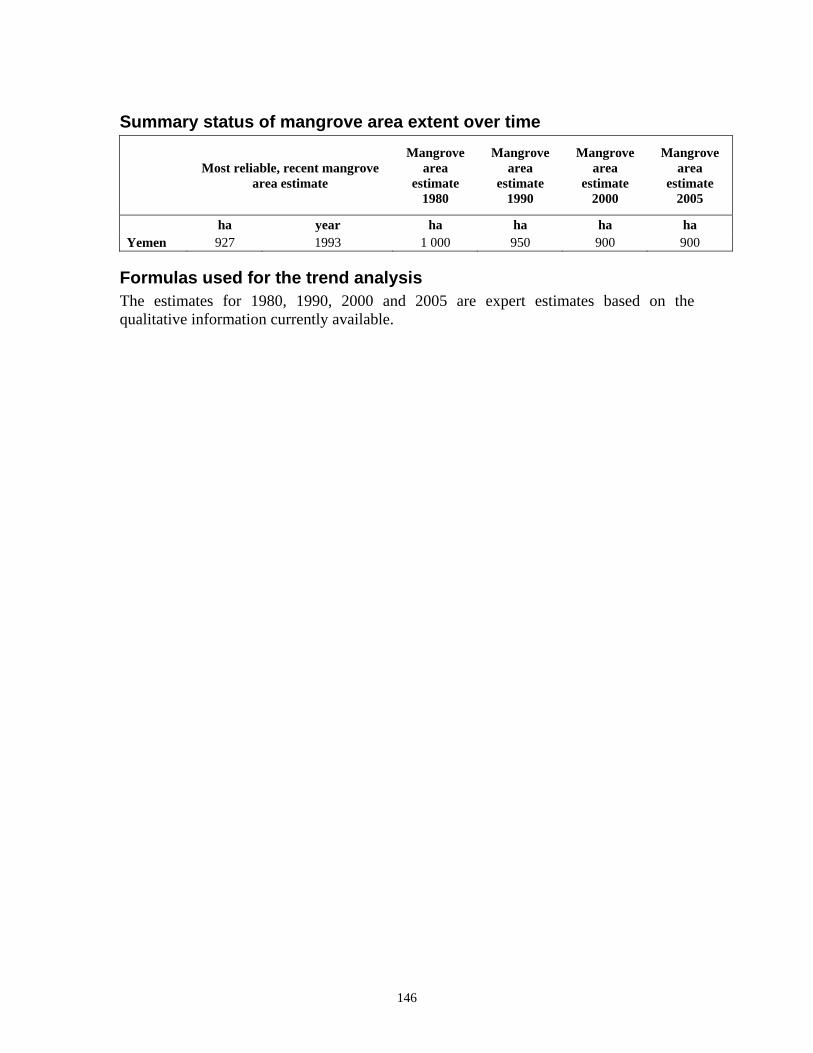
146
Summary status of mangrove area extent over time
Most reliable, recent mangrove area estimate
Mangrove area
estimate 1980
Mangrove area
estimate 1990
Mangrove area
estimate 2000
Mangrove area
estimate 2005
ha year ha ha ha ha Yemen 927 1993 1 000 950 900 900
Formulas used for the trend analysis The estimates for 1980, 1990, 2000 and 2005 are expert estimates based on the qualitative information currently available.
147
Bibliography FAO. 1995. Forest Resources assessment 1990: Global synthesis. FAO Forestry Paper
No. 124. Rome, 46pp. FAO. 2001. Global Forest Resources Assessment 2000: main report. FAO Forestry
Paper No. 140. Rome. www.fao.org/forestry/fo/fra/main/index.jsp FAO. 2003. Status and trends in mangrove area extent worldwide. By Wilkie, M.L. and
Fortuna, S. Forest Resources Assessment Working Paper No. 63. Forest Resources Division. FAO, Rome. (Unpublished) http://www.fao.org/documents/
FAO. 2006. Global Forest Resources Assessment 2005 – progress towards sustainable forest management. FAO Forestry Paper 147. Rome (also available at www.fao.org/forestrysite/fra2005).
FAO. 2007. The world's mangroves 1980-2005. FAO Forestry Paper No. 153. Rome. Saenger, P., Hegerl, E.J. & Davie, J.D.S. 1983. Global status of mangrove ecosystems.
Commission on ecology papers No. 3. Gland, Switzerland, IUCN. Tomlinson, P.B. 1986. The botany of mangroves. Cambridge Tropical Biology Series,
Cambridge, 419 pp. Country specific references used for the preparation of the assessment are reported in the specific country profiles.
148
Annex 1. The world's mangroves 1980-2005: Regional working papers
FAO. 2007a. Mangroves of Africa 1980–2005: country reports. Forest Resources Assessment Working Paper No. 135, Rome. www.fao.org/forestry/site/mangrove/statistics.
Countries included: Angola, Benin, British Indian Ocean Territory, Cameroon, Comoros, Congo, Côte d'Ivoire, Democratic Republic of the Congo, Djibouti, Egypt, Equatorial Guinea, Eritrea, Gabon, Gambia, Ghana, Guinea, Guinea-Bissau, Kenya, Liberia, Madagascar, Mauritania, Mauritius, Mayotte, Mozambique, Nigeria, Sao Tome and Principe, Senegal, Seychelles, Sierra Leone, Somalia, South Africa, Sudan, Togo, United Republic of Tanzania
FAO. 2007b. Mangroves of Asia 1980–2005: country reports. Forest Resources Assessment Working
Paper No. 136. Rome www.fao.org/forestry/site/mangrove/statistics. Countries included: Bahrain, Bangladesh, Brunei Darussalam, Cambodia, China, India, Indonesia, Iran
(Islamic Republic of), Japan, Kuwait, Malaysia, Maldives, Myanmar, Oman, Pakistan, Philippines, Qatar, Saudi Arabia, Singapore, Sri Lanka, Thailand, Timor-Leste, United Arab Emirates, Viet Nam, Yemen
FAO. 2007c. Mangroves of North and Central America 1980–2005: country reports. Forest Resources
Assessment Working Paper No. 137. Rome. www.fao.org/forestry/site/mangrove/statistics. Countries included: Anguilla, Antigua and Barbuda, Aruba, Bahamas, Barbados, Belize, Bermuda,
British Virgin Islands, Cayman Islands, Costa Rica, Cuba, Dominica, Dominican Republic, El Salvador, Grenada, Guadeloupe, Guatemala, Haiti, Honduras, Jamaica, Martinique, Mexico, Montserrat, Netherlands Antilles, Nicaragua, Panama, Puerto Rico, Saint Kitts and Nevis, Saint Lucia, Saint Vincent and the Grenadines, Trinidad and Tobago, Turks and Caicos Islands, United States, United States Virgin Islands
FAO. 2007d. Mangroves of Oceania 1980–2005: country reports. Forest Resources Assessment
Working Paper No. 138. Rome. www.fao.org/forestry/site/mangrove/statistics. Countries included: American Samoa, Australia, Christmas Island, Fiji, French Polynesia, Guam,
Kiribati, Marshall Islands, Micronesia (Federated States of), Nauru, New Caledonia, New Zealand, Niue, Northern Mariana Islands, Palau, Papua New Guinea, Samoa, Solomon Islands, Tokelau, Tonga, Tuvalu, Vanuatu, Wallis and Futuna Islands
FAO. 2007e. Mangroves of South America 1980–2005: country reports. Forest Resources Assessment
Working Paper No. 139. Rome. www.fao.org/forestry/site/mangrove/statistics. Countries included: Brazil, Colombia, Ecuador, French Guiana, Guyana, Peru, Suriname, Venezuela
(Bolivarian Republic of).