Embed Size (px)
Citation preview
Mangrove and Production Risk in Aquaculture in the
Mekong River Delta, Vietnam1
Do Huu Luat
Vietnam – The Netherlands Programme
Truong Dang Thuy
University of Economics HCMC
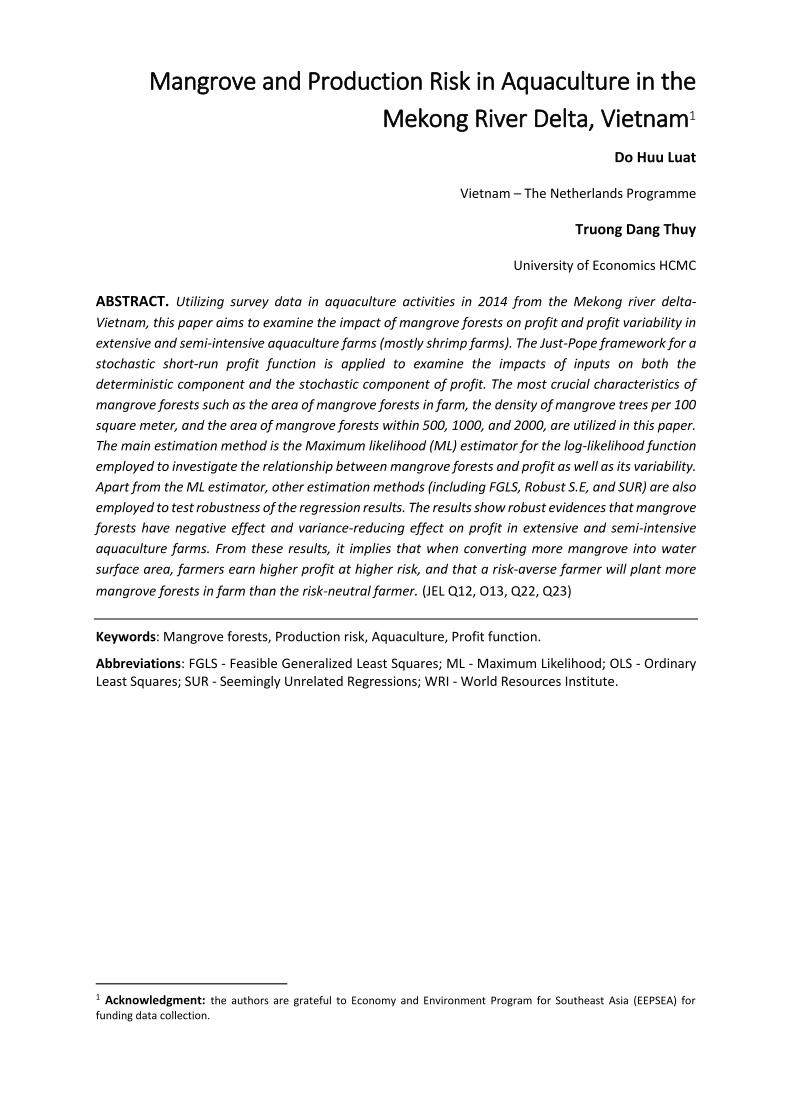
ABSTRACT. Utilizing survey data in aquaculture activities in 2014 from the Mekong river delta-
Vietnam, this paper aims to examine the impact of mangrove forests on profit and profit variability in
extensive and semi-intensive aquaculture farms (mostly shrimp farms). The Just-Pope framework for a
stochastic short-run profit function is applied to examine the impacts of inputs on both the
deterministic component and the stochastic component of profit. The most crucial characteristics of
mangrove forests such as the area of mangrove forests in farm, the density of mangrove trees per 100
square meter, and the area of mangrove forests within 500, 1000, and 2000, are utilized in this paper.
The main estimation method is the Maximum likelihood (ML) estimator for the log-likelihood function
employed to investigate the relationship between mangrove forests and profit as well as its variability.
Apart from the ML estimator, other estimation methods (including FGLS, Robust S.E, and SUR) are also
employed to test robustness of the regression results. The results show robust evidences that mangrove
forests have negative effect and variance-reducing effect on profit in extensive and semi-intensive
aquaculture farms. From these results, it implies that when converting more mangrove into water
surface area, farmers earn higher profit at higher risk, and that a risk-averse farmer will plant more
mangrove forests in farm than the risk-neutral farmer. (JEL Q12, O13, Q22, Q23)
Keywords: Mangrove forests, Production risk, Aquaculture, Profit function.
Abbreviations: FGLS - Feasible Generalized Least Squares; ML - Maximum Likelihood; OLS - Ordinary Least Squares; SUR - Seemingly Unrelated Regressions; WRI - World Resources Institute.
1 Acknowledgment: the authors are grateful to Economy and Environment Program for Southeast Asia (EEPSEA) for
funding data collection.

2
1. INTRODUCTION Mangrove forests are primary ecosystems along coastlines, riverbanks in the tropical and subtropical
regions of the world. They provide protection to deal with extreme climate problems such as storms,
floods, and tsunamis. About 30 mangrove trees per 100 square meters with the depth of 100 meters
may prevent the damage of a tsunami up to 90 percent (Hiraishi and Harada, 2003). Based on
biodiversity, mangroves also provide good habitats as well as nutrients to flora and faunal species, for
instance birds, monkeys, and snakes. Moreover, mangrove forests can alleviate erosion of riverbank
shoreline and alleviate the rising of sea level with allowable and reasonable cost (e.g. Khail, 2008;
Paola, 2012). In addition, mangrove forests contribute a significant part to income of households who
live nearby mangrove forests. Barbier (2007) found that people could earn $12,392 per hectare of
mangrove forest, economic annual value, from wood products, fishery and non-wood products (e.g.
honey, nipa palm).
Nowadays, the area of mangrove forests have been significantly shrunk worldwide since the mid-
twentieth century. Specifically, over one-fifth of mangrove forests have been lost since 1995
(Spalding, Kainuma, & Collins, 2010), and most of mangrove forests decrease occur in Southeast Asia
and Latin America. For example, 70 percent of the mangrove forest was diminished in the period from
1920 to 1990 in Philippines, while this rate in Malaysia was around 17 percent during the period of
1965-1985 (WRI 1996). The area of mangrove forests in 1993 have existed about 54 percent in
comparison with this one in 1975 in Thailand (Sathirathai, 1998).
In Vietnam, the rapid reduction of mangrove forests occurred in the last century. Do (2005) showed
that the mangrove forests area was as much as 400,000 ha in Viet Nam in 1940s, but this area was
reduced to only 170,000 ha in 2010 (Phan and Quan, 2012). There are many reasons for the decrease
in mangrove forest areas such as conversing of forest land to economic activities, harvesting timber
products, and increasing in population; whereas the major factor is the expansion of aquaculture
ponds into mangrove forests (Spalding, Blasco, and Field., 1997; Lewis et al., 2003). Besides, the
deforestation of mangrove forests has significantly increased in recent years in South Asia due to the
use and scale of forest products of local users (Giri et al., 2011).
From the beginning of 1995, in the South of Viet Nam, mangrove forests have been distributed and
contracted to households for the purposes of livelihood and conservation. Some parts of the allotted
mangrove forests, under this policy, can be converted (depending on each province’s policy) to
economic activities comprising aquaculture, agriculture and other fields. In more detail, households
can convert a certain part of mangrove forests in farms to areas utilized for shrimp farming or crops
cultivation. However, the area of mangrove forests allotted to households was over-exploited because
of the poor enforcement of regulations in Vietnam. This over-exploitation has brought some serious
problems to social as well as household’s welfare, for instance floods, hurricanes, and storms.
Therefore, the existence of mangrove forests in production area has contributed to household’s
welfare and helped to alleviate the damage caused by natural disasters in production process.
Researchers have recognized the importance of mangrove forests and the reality of deforestation.
Hence, most of studies have focused on calculating of the value of mangrove forests or finding a good
way to reduce mangrove deforestation. Furthermore, some studies attempt to investigate the
behavior of households towards the conversion of some area of mangrove forests into other land
uses. Nevertheless, whether the existence of mangrove forests have effects on household production
activities in the area of aquaculture or agriculture is still an open question.

3
Therefore, this paper aims to investigate the effects on household production in aquafarming of
mangrove forests in the Mekong river delta through estimating the profit function for various types
of aquaculture comprising extensive, intensive and semi-intensive culture. The proposed hypothesis
is that mangrove forests will improve or mitigate risks in aquaculture production through reducing
cost of water treatment, mitigating damage of climate changes, etc. Since mangrove forests are often
planted inside and outside extensive and semi-intensive aquaculture farms (including mangrove
forests and surface water), this thesis concentrates on analyzing the impacts of mangrove forests on
profit and profit variability in these farms. As a result, the study will provide information local farmers
and authorities about the advantage of mangrove forests and propose recommendation to policy
makers these kinds of aquaculture often contain a certain area of mangrove forest either into or
around farms.
2. THEORETICAL BACKGROUND This section briefly reviews theories about the ecological functions of mangrove forests and their role
in the production process. Additionally, the theory of production risk is also reviewed in this part. To
demonstrate these theories, this paper also represents empirical studies which are analyzed the
impacts on economic activities of mangrove forests and estimated the effects of inputs on production
risk.
2.1 The ecological functions of mangrove forests
Mangroves are diverse huge and pervasive categories of trees and shrubs that live in the tropical and
subtropical regions of the world. They can easily adapt to difficult environmental conditions and are
one of important plants in the ecosystem that have brought a high productivity. “Mangroves provide
a wide range of ecological services like protection against floods and hurricanes, reduction of shoreline
and riverbank erosion, maintenance of biodiversity, etc.” (Rönnbäck, 1999). These functions help
maintain economic activities in coastal areas and in the tropical region such as the Southeast Asia.
Besides, mangrove ecosystems provide local economic activities with natural products which are
directly harvested, for example wood, aquatic products, and birds.
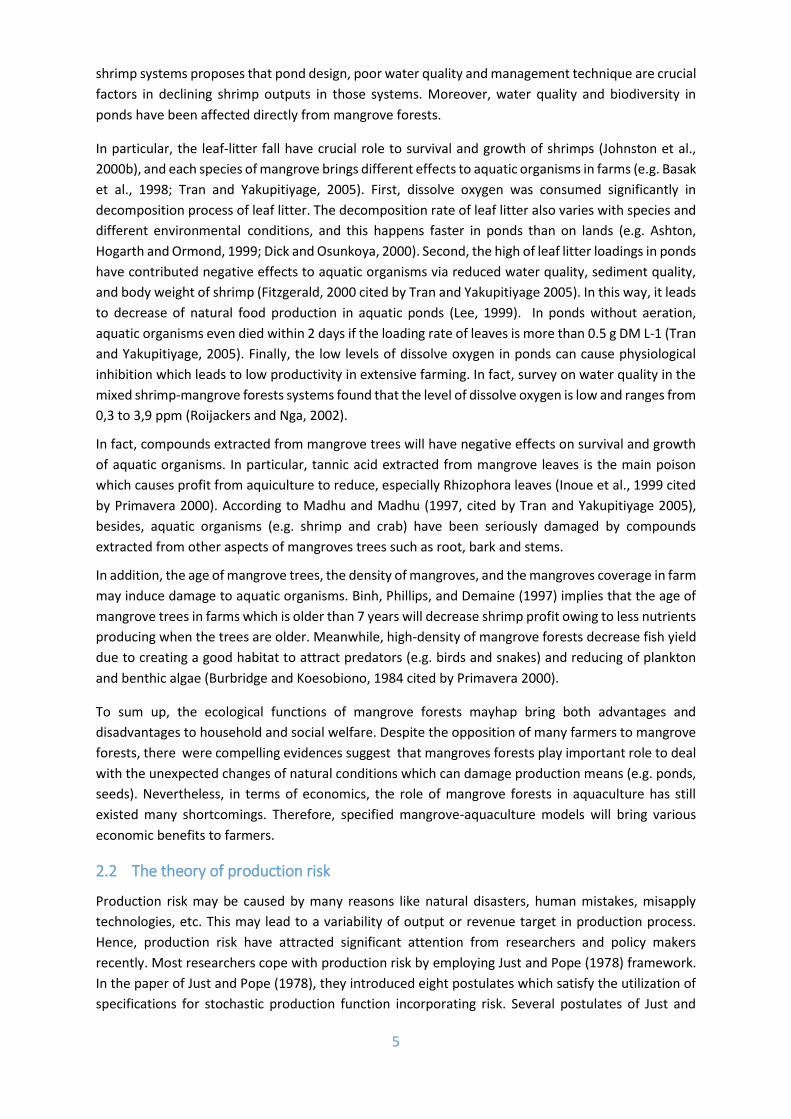
In terms of aquaculture production, the mangroves support some diverse services for production
activities through the mechanisms in Figure 2.1. Above all, mangrove forests play an important role in
alleviating the turbulences of environmental conditions which can destroy aquaculture production in
coastal areas such as floods, hurricanes, and storms.
Secondly, mangrove forests help to sustain the quality of water. This function helps to decrease levels
of pollutants, mitigate variation in salinity and turbidity, etc. Larsson et al. (1994) and Kautsky et al.
(1997) imply that the existence of mangrove forests in semi-intensive farms for shrimp production is
necessary to maintain the water quality. Mangrove forests are also a safe habitat for predators as well
as a good habitat for mollusk species to seek food through this tangled root system (Nagelkerken et
al., 2008). In addition, mangrove forests provide nutrients to the coral reef and flora communities.
This root system also reduces the flow of tidal water, causing the deposition of sediment which may
filter out and treat toxins. It is easy to see that the value of wastewater treatment via mangrove forests
is better than the expense to set up a new wastewater treatment system. Hence, the integrated
shrimp-mangrove farming is being encouraged in recent years.

4
Figure 2.1. The ecological functions of mangrove forests are in seafood production
Source: Rönnbäck (1999)
Moreover, mangroves can produce and supply food inputs to aquatic organisms in aquaculture
activities (Nagelkerken et al., 2008; Hong and San, 1993). The first, organic material and nutrients may
be directly served as a food input to fauna species in the mixed shrimp-mangrove farms (e.g. extensive
and semi-intensive aquaculture). Furthermore, they can be exported to specialized production areas
(e.g. intensive aquaculture). Larsson et al. (1994) found that the area of semi-intensive farm covers
approximately 25% of the area of mangrove forests, whereas it provides about 70% the quantity of
shrimp food in compared with a semi-intensive farm without mangroves. And the rest of shrimp food
is from the bacterial and fungal films on mangrove leaf detritus. The last one is fish and mollusk species
producing from mangrove forest systems can be used as a direct input food or a component in
formulated foods in aquaculture.
Finally, the natural seed production in mangrove forests perhaps express the crucial relationship
between mangroves and aquatic organism farming. The developing of juvenile fishes and shrimps in
mangrove system can be explained by reasons such as the wealth nutrition, diminished water force
caused by the shallow water ecosystems, and sophisticated tangible composition in mangroves (Beck
et al., 2001). These features can affect natural hatcheries for fish and shrimp cultivation, extend
density, and maintain the level of growth as well as the survival of seed. Furthermore, the availability
of seed is low in mangrove forests can reduce the productivity of aquatic organism cultivation (Menzel,
1991). Kautsky et al., (2000) claimed that mangrove forests have directly affected on the productivity
and sustainability of shrimp cultivation. Consequently, these advantages of mangrove forests can
affect the mangrove forest conservation behavior.
Apart from the advantages of mangrove forests, many empirical studies have shown evidences of
adverse effects of mangrove forests on aquaculture. In reality, three systems which combines
mangroves and aquaculture are integrated, associated, and separated mangrove-aquaculture farming
systems. Johnston et al., (2000a and 2000b) with technical evidences from the mixed mangrove-
AQ
UA
CU
LTU
RE
Insurance
Storm and flood protection
Erosion control
Water quality maintenance
Flood and erosion control
Nutrient assimilation
Sediment trapping
Food input
Detritus
Fishmeal
Broodstock
Seed
5
shrimp systems proposes that pond design, poor water quality and management technique are crucial
factors in declining shrimp outputs in those systems. Moreover, water quality and biodiversity in
ponds have been affected directly from mangrove forests.
In particular, the leaf-litter fall have crucial role to survival and growth of shrimps (Johnston et al.,
2000b), and each species of mangrove brings different effects to aquatic organisms in farms (e.g. Basak
et al., 1998; Tran and Yakupitiyage, 2005). First, dissolve oxygen was consumed significantly in
decomposition process of leaf litter. The decomposition rate of leaf litter also varies with species and
different environmental conditions, and this happens faster in ponds than on lands (e.g. Ashton,
Hogarth and Ormond, 1999; Dick and Osunkoya, 2000). Second, the high of leaf litter loadings in ponds
have contributed negative effects to aquatic organisms via reduced water quality, sediment quality,
and body weight of shrimp (Fitzgerald, 2000 cited by Tran and Yakupitiyage 2005). In this way, it leads
to decrease of natural food production in aquatic ponds (Lee, 1999). In ponds without aeration,
aquatic organisms even died within 2 days if the loading rate of leaves is more than 0.5 g DM L-1 (Tran
and Yakupitiyage, 2005). Finally, the low levels of dissolve oxygen in ponds can cause physiological
inhibition which leads to low productivity in extensive farming. In fact, survey on water quality in the
mixed shrimp-mangrove forests systems found that the level of dissolve oxygen is low and ranges from
0,3 to 3,9 ppm (Roijackers and Nga, 2002).
In fact, compounds extracted from mangrove trees will have negative effects on survival and growth
of aquatic organisms. In particular, tannic acid extracted from mangrove leaves is the main poison
which causes profit from aquiculture to reduce, especially Rhizophora leaves (Inoue et al., 1999 cited
by Primavera 2000). According to Madhu and Madhu (1997, cited by Tran and Yakupitiyage 2005),
besides, aquatic organisms (e.g. shrimp and crab) have been seriously damaged by compounds
extracted from other aspects of mangroves trees such as root, bark and stems.
In addition, the age of mangrove trees, the density of mangroves, and the mangroves coverage in farm
may induce damage to aquatic organisms. Binh, Phillips, and Demaine (1997) implies that the age of
mangrove trees in farms which is older than 7 years will decrease shrimp profit owing to less nutrients
producing when the trees are older. Meanwhile, high-density of mangrove forests decrease fish yield
due to creating a good habitat to attract predators (e.g. birds and snakes) and reducing of plankton
and benthic algae (Burbridge and Koesobiono, 1984 cited by Primavera 2000).
To sum up, the ecological functions of mangrove forests mayhap bring both advantages and
disadvantages to household and social welfare. Despite the opposition of many farmers to mangrove
forests, there were compelling evidences suggest that mangroves forests play important role to deal
with the unexpected changes of natural conditions which can damage production means (e.g. ponds,
seeds). Nevertheless, in terms of economics, the role of mangrove forests in aquaculture has still
existed many shortcomings. Therefore, specified mangrove-aquaculture models will bring various
economic benefits to farmers.
2.2 The theory of production risk
Production risk may be caused by many reasons like natural disasters, human mistakes, misapply
technologies, etc. This may lead to a variability of output or revenue target in production process.
Hence, production risk have attracted significant attention from researchers and policy makers
recently. Most researchers cope with production risk by employing Just and Pope (1978) framework.
In the paper of Just and Pope (1978), they introduced eight postulates which satisfy the utilization of
specifications for stochastic production function incorporating risk. Several postulates of Just and

6
Pope (1978) force restrictions on the mean function are similar to the usual deterministic function.
Other postulates are flexible conditions for an output variance function. The key significance in their
specification is marginal risk in input use may be positive, zero or negative. Namely, inputs are
permitted to be either risk-increasing or risk-reducing. As a result, they imply shortcomings on popular
production specifications in production studies such as 𝑦 = 𝑓(𝑥)𝑒𝜀 with 𝜀 is a stochastic disturbance
(𝐸(𝜀) = 0; 𝑉(𝜀) > 0). For such specifications, there are often positive in marginal risk. Besides, for
an additive specification 𝑦 = 𝑓(𝑥) + 𝜀, marginal risk is frequently zero.
To overcome the shortcomings above, a stochastic production function includes the mean and
variance (risk) function, should satisfy eight postulates in the Just and Pope framework; then the
impacts of inputs on each function is specified. The Just and Pope framework seems to be a prior
theory on production risk, so it affects most of later theoretical as well as empirical studies. The Just
and Pope framework for a stochastic production function is presented as:
𝑦 = 𝑓(𝑥) + ℎ12(𝑥)𝜀
Where 𝑓(∙) is the mean function, ℎ1
2(∙) is the risk function, and 𝜀 is production shock with mean of
zero and variance of 𝜎𝜀2. The vector of inputs is represented by x in the mean function, though the risk
function contains not only identical inputs as the mean function but also some other elements.
It is easy to see that the effects of inputs on output and variability of output are separated. In
particular, inputs can exert a positive effect on output, but not necessary to be a positive effect on
variability of output. Thus, the sign of marginal risk and marginal effect of input use on marginal
productivity variability depend on the effect of input on variability of output. These marginal effects
are verified now:
𝜕𝑉(𝑦)
𝜕𝑥𝑖= ℎ𝑖(𝑥)𝜎𝜀
2
𝑉 (𝜕𝑦
𝜕𝑥𝑖) =
ℎ𝑖2(𝑥)𝜎𝜀
2
4ℎ(𝑥)
and 𝜕𝑉(
𝜕𝑦
𝜕𝑥𝑖)
𝜕𝑥𝑖=
ℎ𝑖𝜎𝜀2[ℎ(𝑥)ℎ𝑖𝑖(𝑥)−ℎ𝑖
2(𝑥)]2
2ℎ2(𝑥)
Based on the Just and Pope framework, moreover, it is obvious to see that the risk function seems to
be a disturbance term. It is described as:
𝑦 = 𝑓(𝑥) + 𝑢
where u is the error term, 𝑣𝑎𝑟(𝑢) = ℎ(𝑥)𝜎𝜀2, and mean of zero. According to the theory of
heteroskedasticity, results in estimated parameters are still consistent but not efficient due to bias in
estimated standard errors. To settle this problem, empirical studies have employed some estimation
methods to estimate the mean function and risk function together such as Maximum Likelihood, SUR,
or FGLS.

7
2.3 Empirical studies
This part briefly reviews empirical papers of the impact of mangroves on aquaculture production. In
fact, the studies of this issue in the economic field are limited. Meanwhile, the impact of mangroves
on household’s production has been studied from a biological perspective.
2.3.1 Integrated shrimp‐mangrove farming systems in the Mekong delta of Vietnam (Binh et
al, 1997)
To investigate the integrated shrimp-mangrove system in Ngoc Hien district, Binh et al (1997) used a
sample of 161 households (living on the west and east coast) who operate shrimp farming and directly
took part in the culture. The authors collected primary and secondary data about economy,
environment and technology from the interview survey at Ngoc Hien district (the Forestry Fisheries
Department, the Provincial Fisheries Department, the Provincial Forestry Department, and the State
Forestry Fisheries Enterprises). They find that the negative effects of mangrove density, pond age, and
pH on shrimp yields existed on the east coast, but the same did not occur on the west coast. In terms
of economics, farming systems with about 30%-50% mangrove area in a pond will give the highest
return. On the other hand, a pond with the cleared mangroves will give the lowest annual return.
These results imply that the integrated mangrove-shrimp farming system will get a better economic
return, if mangrove forests are maintained.
2.3.2 Effect of an integrated mangrove-aquaculture system on aquacultural health (Peng et al,
2009).
Based on experiment method, Peng et al (2009) tried to find out whether the traditional method or
integrated mangrove aquaculture farming is better. They classified nine experimental aquaculture
ponds and one control pond without mangrove forests, then all ponds fed two fish species in the first
year and additional crab species in the following year. Through that approach, they can observe for a
period of three years the differences between experimental ponds and control pond in terms of water
quality, production of aquatic organisms, and growth of mangroves in integrated mangrove-
aquaculture farming systems. Their findings imply that water quality of experimental ponds is better
than the control ponds while Aegiceras corniculatum is the best type for improving water quality
compared with the rest. In general, the experimental ponds had higher yield more than the control
pond with 19% in the first year. Particularly, the experimental ponds planted with Kandelia obovata
and Aegiceras corniculatum brought a higher seafood yield than the experimental pond planted with
Sonneratia caseolaris. Moreover, they found that if an aquaculture pond had 15% of its area planted
with Aegiceras corniculatum, the pollutants in production process would be reduced and aquaculture
production quality would be improved.
3. RESEARCH METHODS
3.1 Model specification As mentioned in the literature review above, the economic activities are being effectively protected
and supported by the ecological services of mangrove forests system, then the economic value of that
ecological functions are proved to be evaluated by an indirect approach. Although the worth of these
services is principally non-marketed, the surrogate market valuation can be employed to value
mangrove forests. Travel cost, hedonic pricing methods are standard techniques used to evaluate a
non-marketed good basing on the information of marketed goods that is related to that goods. In

8
particular, those methods find out the derived demand of consumers for the ecological functions of
mangrove forests.
Another approach utilized to evaluate the ecological services of mangrove forests is the production
function approach. The procedure of this approach consists of two steps which examine the physical
impacts of ecological services on economic activities and the impacts of ecological changes on the
change of corresponding economic activities’ output. Thus, this implies that the ecological services of
mangrove may act as an input in the production function, and it could be a proxy for productivity in
the function (e.g. Barbier, 1994; Barbier, 2000).
Under assumption of constant absolute risk aversion (α > 0), Coyle (1992 and 1999) suggests that the
utility function of farmers is a function of farmer’s risk preferences:
𝑈 = �̅� − (𝛼
2)𝜎𝜋
2
where �̅� is expected profit and 𝜎𝜋2 is profit variance.
As mentioned previously in the literature review, the Just and Pope stochastic restricted profit
function is utilized to investigate the effects of mangrove forests on profit and variability of profit in
extensive and semi-intensive aquaculture farms. The profit function and the Just-Pope production
function are:
𝜋 = 𝑝𝑦 − 𝑤𝑥
𝑦 = 𝑓(𝑥) + ℎ12(𝑥)𝜀
The mean and variance of profit are:
�̅�(𝑥) = 𝑝�̅� − 𝑤𝑥 = 𝑝𝑓(𝑥) + 𝑝ℎ12(𝑥)𝜀 − 𝑤𝑥
𝜎𝜋2(𝑥) = 𝑝𝟐𝜎𝑦
2 = 𝑝2ℎ(𝑥)𝜎𝝐2
Based on the previous findings in the primal approach and properties of profit function, moreover,
the proxies for the existence of mangrove forests in aquaculture areas are treated as an input into the
short-run profit function. Besides, the variance function in this research will be specified as Harvey
(1976), and the important property of Harvey’s formulation is that the variability of output should be
positive. The model specification for the restricted profit function and its variance function are
illustrated below:
𝜋𝑖 = 𝑓(𝑝𝑖 , 𝑤𝑖, 𝑥𝑖) + 𝑢𝑖 𝑣𝑎𝑟(𝑢𝑖) = ℎ(𝑧𝑖) = exp(𝑧𝑖𝛽𝑖)
where i subscript denotes ith farm; p and w is a vector of output prices and input prices, respectively;
x is a vector of fixed inputs in the short-run; and z is a vector of inputs in the risk function. Particularly,
empirical variables utilized in this paper will be described in Table 3.1.

9
Table 3.1 Data matrix
Key concepts Empirical variables Unit Notation
Profit Profit per square meter in farm VND properm2
Output price Selling price of aquatic products in farms VND/kg prioutput
Fry price Buying price of fry inputs (e.g. shrimp
seed) VND/ind pribreed
Chemical price Buying price of chemical inputs VND/kg pripes
Labor family The amount of hours worked of labor
family Hours hourlf
Total cultivated area Total area includes mangrove area and
surface water area m2 sumarea
Age of household head Age of household head Years age
Education of household
head
Schooling years of household head Years schyears
The characteristics of
mangrove forests
The ratio of mangrove area to total
cultivated farm (= mangrove area/total
cultivated area)
% mangratio
The density of mangrove trees in farm Trees/100
m2 mangdens
The area of mangroves in the radius of
500, 1000, and 2000 meter m2
mang500;
mang1000;
mang2000
Production scale Total cost of producing aquatic products Million
VND Costm
The linear and linear quadratic functional form for the short-run profit function will be employed in
this study, as described below:
Firstly, a linear mean unrestricted profit function and the risk function are:
𝑝𝑟𝑜𝑝𝑒𝑟𝑚2𝑖 = 𝛼0 + 𝛼1𝑝𝑟𝑖𝑜𝑢𝑡𝑝𝑢𝑡𝑖 + 𝛼2𝑝𝑟𝑖𝑏𝑟𝑒𝑒𝑑𝑖 + 𝛼3𝑝𝑟𝑖𝑝𝑒𝑠𝑖 + 𝛼4ℎ𝑜𝑢𝑟𝑙𝑓𝑖 + 𝛼5𝑠𝑢𝑚𝑎𝑟𝑒𝑎𝑖
+ 𝛼6𝑎𝑔𝑒𝑖 + 𝛼7𝑠𝑐ℎ𝑦𝑒𝑎𝑟𝑠𝑖
+ 𝛼8(𝑚𝑎𝑛𝑔𝑟𝑎𝑡𝑖𝑜𝑖/𝑚𝑎𝑛𝑔𝑑𝑒𝑛𝑠𝑖𝑡𝑦𝑖/𝑚𝑎𝑛𝑔500𝑖/𝑚𝑎𝑛𝑔1000𝑖/𝑚𝑎𝑛𝑔2000𝑖)
+ 𝑢𝑖 (3.6)
var(𝑢𝑖) = 𝑒𝑥𝑝(𝛽0 + 𝛽1𝑐𝑜𝑠𝑡𝑚𝑖
+ 𝛽2(𝑚𝑎𝑛𝑔𝑟𝑎𝑡𝑖𝑜𝑖/𝑚𝑎𝑛𝑔𝑑𝑒𝑛𝑠𝑖𝑡𝑦𝑖/𝑚𝑎𝑛𝑔500𝑖/𝑚𝑎𝑛𝑔1000𝑖
/𝑚𝑎𝑛𝑔2000𝑖)) (3.7)

10
Secondly, a linear quadratic mean unrestricted profit function (3.6 and 3.8) is simply presented with
m input factors (explanatory variables include input prices (prioutput, pripes, pribreed), fixed input
amounts (hourlf and sumarea), farmer characteristics (schyears and age), and the characteristics of
mangrove forest). Also, the risk function (3.7 and 3.9) is described with n risk inputs (including cost
and the characteristics of mangrove forest) with the dependent variable of profit variance (var(ui)),
which is predicted from the mean profit function.
𝑝𝑟𝑜𝑝𝑒𝑟𝑚2𝑖 = 𝛼0 + ∑ 𝛼𝑘𝑚𝑘,𝑖
𝑘
+1
2∑ ∑ 𝛼𝑘𝑗𝑚𝑘,𝑖𝑚𝑗,𝑖
𝑗𝑘
+ 𝑢𝑖 (3.8)
𝑣𝑎𝑟(𝑢𝑖) = 𝑒𝑥𝑝(𝛽0 + ∑ 𝛽𝑘𝑛𝑘,𝑖
𝑘
+1
2∑ ∑ 𝛽𝑘𝑗𝑛𝑘,𝑖𝑛𝑗,𝑖
𝑗𝑘
) (3.9)
3.2 Data collection method
3.2.1 Data requirement
The survey data is required to examine the research objective. The survey types include face to face,
mail, telephone, and internet survey, whereas the most efficient type is face to face survey. Though
other types of survey are easy to carry out, survey results may be less reliable. Therefore, to get
reliable survey data, a face to face survey was chosen.
After the questionnaire had been completed, a pilot survey with a small sample size of farmers was
conducted afterward to test the reasonability of the questions. Then, the questionnaire was revised
before conducting the proper survey. All enumerators were carefully trained by experts in production
economic field. Data was collected over a period of two months. To ensure the high response rate and
the willingness to participate in the research, respondents received an amount of VND 50.000 for
completing the questionnaire. Although the larger sample size will take higher accuracy of estimation,
data was collected as much as possible within the constraint of cost and time.
A cross-sectional data is obtained in the survey. The questionnaire consists of two parts. The first part
consists of general questions about respondent such as schooling years, age, experience years, and so
on; the second one includes information of aquaculture activities last year. For instance, cost, revenue,
input and output prices are mentioned and described in questionnaire (outlined in Appendix A). On
the other hand, questions about mangrove forests are make up the main in part two, and they will be
discussed hereafter in more detail.
3.2.2 Data for mangrove forests
As noted in the literature review above, local residents cultivate aquatic organisms by combining
mangrove plants through the mixed mangrove-aquaculture farming systems such as integrated,
associated, and separated. In the integrated system, mangroves are planted along canals within farms.
In the associated system, mangroves are planted concentrated on surface of ponds. In the separated
system, mangroves are planted outside ponds. These systems is depicted in more detail in Figure 2.2.
Based on the research objective as well as those systems, therefore, the paper will use variables that
reflect the impacts of mangrove forests on household’s production in aquaculture (mostly shrimp
farming), as follow:
The (self-reported) density of mangrove trees in the area of aquaculture farm (trees/100 m2).
The (self-reported) area of mangrove forests in the sum area of aquaculture farm (m2).

11
The calculation mangrove forests in the radius of 500, 1000, and 2000 meter using GIS map
(m2).
3.3 Estimation methods
In this section, tests for production risk known as heteroskedasticity tests that will be applied to this
paper; are Goldfeld-Quandt, Breusch-Pagan-Godfrey, White’s General Heteroskedasticity, and
Breusch-Pagan LM tests. If heteroskedasticity is detected, the estimation methods which can deal with
heteroskedasticity and examine the effects of mangrove forests on profit as well as profit variability
will be applied.
Moreover, the main estimation method which is used to address research questions, is the Maximum
Likelihood estimator for the log-likelihood function. This method is proved to be more consistent than
FGLS (Harvey, 1976 and Saha et al., 1997). Additionally, Wang and Schmidt (2002) also advocated the
use of MLE due to the biasness of two-step estimation. However, other estimation methods (i.e. FGLS,
SUR, and Robust S.E) will be also employed to estimate the models in order to clarify the fundamental
concern of non-robustness of the regression results.
Based on previous studies (Saha et al, 1997; Isik and Devadoss, 2006), the log likelihood function in
this paper is presented as:
𝑙𝑛𝐿𝐹 = −0.5 [𝑁 ∗ ln(2𝜋) + ∑(𝜋𝑖 − 𝑓(𝑥𝑖 , 𝛼))2
exp(𝑧𝑖 , 𝛽)
𝑁
𝑖=1
+ ∑ 𝛽𝑥𝑖
𝑁
𝑖=1
]
All equations for the profit function and the risk function will be in turn substituted to the log likelihood
function. As mentioned above, the unknown coefficients (α, β) with given 𝜋𝑖 will be estimated
simultaneously in one-step estimation via ML estimation. This leads to a better estimator than
separated estimator of each function. Since statistical software packages for the log likelihood
function in this paper are unavailable, the authors will have to program a ML estimator ourselves in
STATA 13.
4. RESEARCH RESULTS
4.1 Descriptive statistic
A data survey was conducted in the Mekong river delta, and a total of 278 aquaculture farms (mostly
shrimp farms) under extensive and semi-intensive cultures was collected. Figure 4.1 presents the area
utilized in agriculture and aquaculture in the Mekong delta. Generally, the area of aquaculture
depicted as the pink areas (including intensive and extensive culture) is larger than other regions of
the whole country. The zones of green-white stripes denote the area of coastal mangrove forests.
Observed aquaculture farms were distributed across the pink areas and the green-white stripes areas
as green triangles.
Due to inadequate or absent data on production details, some observations cannot be analyzed. In
addition, farms with an outstanding proportion in factors seem to be potential outliers in the sample,
those observations were dropped from the sample. As such, a total of 205 observations with
completed information about the ratio of mangrove forests in farms and the density of mangrove

12
forests per 100 square meter were defined in the final analysis. Nonetheless, the number of
observations with completed data for the mangrove area in 500, 1000, and 2000 meter are 194.
Figure 4.1 The distribution of observed aquaculture farms
The descriptions of data presenting the mean, standard deviation, minimum, and maximum values for
each variable is showed in table 4.1. From the table, a mean value of profit per a square meter in
aquaculture is 3,111.65 VND; whereas about 25 percent of observed farms in the sample got loss in
the last season. The average value of output price, chemical price, and fry price (including shrimp,
crab, fish, and blood cockle) is approximately 190,000 VND/kg; 30,000 VND/kg; and 538 VND/ind;
respectively. The average area including surface water area and mangrove area is roughly 27000
square meter, whereas the minimum area is about 1000 square meter and 17 hectare for the
maximum area. The mean number of household's working hours is about 99 hours for the equivalent
to 12 days, whereas some aquaculture farms have not attention of households in production process.
Most of the education level of operators is very low, even illiteracy. Other collected information
including the characteristics of mangrove forests are the ratio between mangrove area and total area,
the density of mangrove trees in farm, and the area of mangrove forests around farm (e.g. 500, 1000,
and 2000 meter). The average value of mangrove ratio, mangrove density, and mangrove area around
farm is approximately 31 percent, 88 trees, as well as 57,000, 190,000 and 550,000 square meter,
respectively. Generally, the degree of variation in the data sample is quite well over the observed
area.

13
Table 4.1 Descriptive statistics of the variables in the sample data
Variables No.
Obs. Mean Std. Dev. Minimum Maximum
properm2 205 3,111.65 5,228.62 -5,100.83 33,042.86
Input and Output prices
prioutput 205 189,577.90 56,287.27 44,813 368,678
pripes 205 29,770.95 18,075.52 1,300 118,462
pribreed 205 537.40 846.28 20 6,514
Fixed inputs
sumarea 205 26,064.42 20,946.59 1,000 100,000
hourlf 205 98.47 189.72 0 1,120
The management ability
age 205 49.73 11.99 23 83
schyears 205 6.04 3.32 0 16
The characteristics of mangroves
mangratio 205 29.65 27.31 0 88.89
mangdens 205 74.78 137.21 0 900
mang500 194 54,816 155,331.70 0 759,038
mang1000 194 183,530 482,494.70 0 2,208,348
mang2000 194 536,244.10 1,162,627 0 5,593,181
Production scale
costm 205 22.43 19.93 0.36 157.75
4.2 Bivariate analysis
4.2.1 Mangrove forests versus profit
The characteristics of mangrove forests including the ratio and density of mangroves within extensive
and semi-intensive farms, and the area of mangroves within 500, 2000 meter are employed to
examine the impact of mangrove forests on profit in aquaculture activities. Figure 4.2 represents

14
scatter diagrams of profit per square meter by the ratio of mangrove area, the density of mangrove
trees in 100 m2, and mangrove area in the radius of 500 and 2000 meter. Graphically, profit per square
meter in extensive and semi-intensive farms tends to decrease with the ratio of mangrove forests and
mangrove tree density in farms. Most the ratio of mangrove areas in farm that have high profit per
square meter is minimal. Moreover, the trend line suggests the uncompelling evidence of negative
relationship between profit and the ratio of mangrove forests in farm. The graph also shows the
majority of farms with zero percentage of mangrove forests. This is simply because many farmers tend
to violate the regulation of mangrove conservation, which resulted in the destruction of mangrove in
extensive and semi-intensive farms.
In addition, from a glance of this figure, we can see that most farms concentrate in the quadrant which
mangrove trees density is less than 100 trees and VND 5,000 for profit per square meter. Interestingly,
farms with high density of mangrove trees per 100 m2 will be less profitable compared to farms with
low density of mangrove trees. The trend line also confirmed the negative association between profit
and mangrove trees density. This relationship is not special and similar to the relationship between
profit and the ratio of mangrove forests in farm. On the other hand, the trend between profit and
mangrove area in the radius of 500 and 2000 meter may be positive. Most farms have no mangrove
forests within as well as outside cultivated area. Visually, these relationships are unclear, and there
seems to be no impact of mangrove forests on profit in aquaculture production.
4.2.2 Mangrove forests versus profit variability
Figure 4.3 illustrates the relationship between production risk and the ratio of mangrove area, the
mangrove tree density, and the mangrove area in the radius of 500 and 2000 meter. There is no
graphical evidence showing that high ratio of mangrove area in farms will take higher production risk.
Interestingly, production risk tends to decrease as the ratio of mangrove forests in farm increases. This
tendency is quietly reasonable because of the presence of ecological services of mangrove forests for
mitigating the damage of natural disasters and human mistakes. Furthermore, the trend line implies
the negative impact of mangrove area in farm on profit variability. However, this negative correlation
between profit and mangrove ratio is not conclusive.
Furthermore, the mangrove density of most farms concentrate in the range from 0 to 100 mangrove
trees per 100 square meter. Besides, the association between production risk and mangrove trees
density is unclear though the trend line is slightly downward. Nevertheless, the relationship between
production risk and the area of mangrove forests in the radius 500 and 2000 meter is not negative.
Visually, farms that have large mangrove area in the radius 500 and 2000 meter take higher risk than
others. The trend line of those scatter diagrams also implies the positive relationship between
production risk and mangrove area in the radius 500 and 2000 meter. Besides, production risk tends
to be less fluctuated for large mangrove areas around farms.
These scatter diagrams above were provided an initial view about the association between mangrove
forest and production risk (profit variability) in aquafarming. Visually, the relationship between
production risk and the ratio of mangrove area and mangrove trees density in farm are negative,
whereas the positive relationship between production risk and the area of mangroves in 500 and 2000
meter potentially exists. Nevertheless, all relationships above need to be confirmed via the regression
analysis to determine causal effects.

15
Figure 4.2 Mangrove characteristics versus Profit per square meter
Figure 4.3 Mangrove characteristics versus Profit variability
0
5
10
15
20
25
0 200000 400000 600000 800000
Pro
du
ctio
n r
isk
mang500
0
5
10
15
20
25
0.00E+00 2.00E+06 4.00E+06 6.00E+06
Pro
du
ctio
n r
isk
mangr2000
-10000
0
10000
20000
30000
40000
0 400000 800000
pro
per
m2
mang500-10000
-5000
0
5000
10000
15000
20000
25000
30000
35000
0 50 100
pro
per
m2
mangratio-10000
0
10000
20000
30000
40000
0.00E+00 4.00E+06
pro
per
m2
mang2000-10000
0
10000
20000
30000
40000
0 500 1000
pro
per
m2
mangdens
0
5
10
15
20
25
0 500 1000
Pro
du
ctio
n r
isk
mangdens
0
5
10
15
20
25
0 50 100
Pro
du
ctio
n r
isk
mangratio

16
4.3 Estimation results
Initially, the restricted profit function is specified by a linear and linear quadratic functional form, but
most of coefficients on most of the square and cross-product terms in a linear quadratic functional
form are not statistically significant to be a difficult to explain in this case study. Thus, empirical results
for a linear functional form will be interpreted and discussed instead of a linear quadratic functional
form in this section.
4.2.3 Testing for production risk
The models will be firstly regressed by OLS, then the presence of heteroskedasticity will be tested.
Most of tests for heteroskedasticity indicate that the null hypothesis for constant variance was
rejected in the models (as represented in Table 4.2). The 5% significance is adopted to conclude
heteroskedasticity problem.
Table 4.2 Heteroskedasticity tests with the models
Heteroskedasticity
tests Model 1 Model 2 Model 3 Model 4 Model 5
White’s test 93.55
(0.0000)
84.87
(0.0000)
96.63
(0.0003)
95.81
(0.0004)
114.08
(0.004)
Breusch-Pagan-
Godfrey test
120.66
(0.0000)
31.44
(0.0001)
33.24
(0.0001)
32.14
(0.0002)
35.98
(0.0002)
Goldfrey-Quandt
test**
1/10 central
observation
omitted
1.17
(0.05)
1.13
(0.05)
1.15
(0.05)
1.15
(0.05)
1.17
(0.05)
Breusch-Pagan LM
test
98.85
(0.0000)
95.24
(0.0000)
98.78
(0.0000)
87.24
(0.0000)
95.41
(0.0000)
HET problem* Yes Yes Yes Yes Yes
Note: F denotes the heteroskedasticity tests which fail to reject the null hypothesis of homoscedasticity.
The p-value is in the brackets
*conclusion at the significant level of 5%.
**the F-statistic
4.2.4 Regression results for the effect of mangroves on profit per square meter
At least one coefficient from each regression models is statistically significant due to the highly
significant of Wald chi-squared coefficients at the 1% level (presented in Table 4.3). Both sign and
value of coefficients are similar in the regression results of all model. As such, the results of models
with difference of variable quantity are robustness.

17
All of compulsory variables such as prioutput, pribreed, and pripes are statistically significant in all
model; and their sign are as expected. The positive effect of price of aquatic products on profit is
recognized through the models, whereas the negative effects of input prices (including fry and
chemistry) are obtained at the significant level of 1 percent. In particular, the coefficient of prioutput
in the models is about 0.013, it means that an increase of 100 VND in the output price will raise by 1.3
VND in profit per square meter, ceteris paribus. The price of fry increases by 100 VND, profit per square
meter will decline by 62.7 VND whereas an increase of 100 VND in the chemical price will lead to a
decrease of 5.1 VND in profit per square meter, other things equal. As such, these effects are suitable
in the properties of profit function as well as in the practice under competitive market.
Table 4.3 Regression results of mangrove forests and profit per a square meter (MLE)
Variables MLE
Model 1 Model 2 Model 3 Model 4 Model 5
prioutput 0.013** (0.005)
0.013** (0.005)
0.013*** (0.005)
0.012** (0.006)
0.012** (0.005)
pribreed -0.627***
(0.227) -0.710***
(0.210) -0.633***
(0.223) -0.754***
(0.198) -0.687***
(0.247)
pripes -0.051***
(0.015) -0.055***
(0.018) -0.051***
(0.015) -0.051***
(0.016) -0.048***
(0.014)
hourlf 1.714
(2.613) 4.220
(3.332) 1.638
(2.585) 1.015
(2.504) -0.132 (2.044)
sumarea -0.042***
(0.014) -0.058***
(0.016) -0.042***
(0.014) -0.056***
(0.016) -0.042***
(0.014)
age -23.166 (21.056)
-24.604 (25.006)
-23.5334 (21.915)
-39.562 (28.223)
-29.112 (21.198)
schoolingyears 108.682 (77.113)
140.062 (85.536)
104.315 (75.970)
140.938 (97.383)
85.495 (84.029)
mangratio -30.828***
(10.824) -
-30.538*** (11.538)
- -33.917***
(12.234)
mangdens - -2.144 (1.698)
-0.333 (1.777)
- -0.315 (1.416)
mang500 - - - 0.002
(0.007) 0.005
(0.003)
mang2000 - - - 0.0002 (0.001)
-0.0003 (0.0002)
Cons 4828.033*** (1696.291)
4296.14** (2000.367)
4896.151*** (1783.091)
4824.296** (1889.945)
5717.691*** (1863.356)
No. Obs 205 205 205 194 194
Wald chi-sq 49.38 43.56 51.15 51.67 60.35
Note: * denotes significant at 10%, ** denotes significant at 5%, *** denotes significant at 1%
Robust standard errors are shown in brackets
Furthermore, the relationship between the total cultured area and profit is found in this paper. At the
significant level of 1 percent, the total cultivated area including the total area of surface water and
mangrove forests in pond has negatively impact on profit per square meter. The coefficient ranges
from -0.042 to -0.058 interpreting that if the total cultured area increases by 1000 square meter, profit
per a square meter declines from 42 to 58 VND, ceteris paribus. This result reveals that a pond with
larger area is more costly than smaller ponds due to higher management cost, fry cost, pond rehab

18
cost, etc. As such, profit will be reduced. This result once supports the theory of production and
empirical studies in agriculture (e.g. Sidhu and Baanante, 1981).
The characteristics of mangrove forests including the ratio of mangroves in farm, the density of
mangroves in farm, and the area of mangroves within 500, 2000 meter are employed to examine the
impact of mangrove forests on profit in aquaculture activities. Specifically, the impact of the mangrove
ratio in farm and the density of mangrove trees per 100 square meter on profit are negative, which
imply that a farm with high area of mangrove forests or high density of trees may lessen space, sunlight
penetration and increase decaying leaves. This will increase production costs or reduce the quantity
of output. The relationship between the area of mangrove forests within 500 as well as 2000 meter
and profit is positive meaning that profit per a square meter may be increased if the mangrove area
in a range of 500 and 2000 meter raises. However, table 4.3 represents that the only ratio of mangrove
forests within pond is statistically significant at the 1% level in the relationship with profit, whereas
the other proxies are not significantly statistic. The coefficient ranges from -30.538 to -33.917
explaining that an increase of one percent in the ratio of mangroves in farm, profit per 1000 square
meter will decrease from 30,538 to 33,917 VND. This negative effect is complying with empirical
studies in biological field (e.g. Primavera, 2000; Alongi et al, 2000; Johnston et al, 1999, 2000a and
2000b).
All the proxies of management ability which are age (age) and education (schyears) of the operator
are considered as productive assets in aquaculture; nevertheless, the results do not support this
relationship. Both age and schyears are statistically insignificant. However, the sign of schyears
coefficient meets the expectation while age does not.
The number of household’s working hours has positive impact on profit in aquaculture. The result can
be interpreted that if members in family spend more time to monitor, guard, and rehabilitate pond,
profit in aquaculture will increase. However, this effect is statistically insignificant in the models. This
can be explained by the difficulty in measuring the number of household’s working hours, due to the
peculiarity of family workers and non-collectability of arbitrary family working hours.
Table 4.4 reports the regression results of the models using other methods (i.e. SUR, FGLS, and Robust
S.E) used to test robustness of the regression results in Table 4.3. Preliminary examination of three
testing estimation methods portrays the consistency in sign and magnitude of compulsory variables’
coefficients compared with the ML estimation such as prioutput, pribreed, and pripes. The variable of
interest represented by the ratio of mangrove forests within pond (mangratio) which shows the same
results with the MLE. The rest proxies of mangrove forests (mangdens, mang500, and mang2000) are
also not statistically significant, and these results are similar to results of the main method.
Furthermore, the total cultivated are (sumarea) has estimated coefficient with the sign as the ML
estimator, but the magnitude of the coefficient is not the same in the estimation methods.

19
Table 4.4 Regression results of mangrove forests and profit per square meter (FGLS and Robust S.E)
Note: * denotes significant at 10%, ** denotes significant at 5%, *** denotes significant at 1%. White heteroskedasticity consistent standard errors are shown in brackets in Robust S.E
Variables FGLS Robust S.E SUR
Model 1 Model 2 Model 3 Model 4 Model 5 Model 1 Model 2 Model 3 Model 4 Model 5 Model 1 Model 2 Model 3 Model 4 Model 5
prioutput 0.007** (0.003)
0.007** (0.003)
0.006* (0.003)
0.005 (0.003)
0.008** (0.004)
0.013** (0.006)
0.012** (0.006)
0.013** (0.006)
0.011* (0.006)
0.012** (0.006)
0.013** (0.006)
0.013** (0.006)
0.013** (0.006)
0.013** (0.006)
0.013** (0.006)
pribreed -0.549***
(0.209) -0.601***
(0.110) -0.539***
(0.207)
-0.556***
(0.193)
-0.659*** (0.140)
--0.765***
(0.216)
-0.741*** (0.203)
-0.768*** (0.217)
-0.837***
(0.238)
-0.805*** (0.247)
-0.701* (0.382)
-0.513 (0.387)
-0.693* (0.382)
-0.721* (0.413)
-0.647 (0.408)
pripes -0.019** (0.009)
-0.017* (0.010)
-0.020** (0.009)
-0.023** (0.011)
-0.021** (0.010)
-0.057***
(0.016)
-0.056*** (0.018)
-0.057*** (0.016)
-0.059***
(0.017)
-0.061*** (0.017)
-0.047** (0.019)
-0.049** (0.019)
-0.048** (0.019)
-0.055*** (0.020)
-0.053*** (0.019)
hourlf 5.464* (2.781)
6.473** (2.682)
5.133* (2.762)
6.836** (2.941)
4.969 (3.097)
4.260 (3.518)
4.887 (3.576)
4.247 (3.533)
4.619 (3.999)
4.075 (4.038)
3.724* (1.763)
4.202** (1.767)
3.709** (1.762)
3.794* (1.969)
3.408* (1.957)
sumarea -0.008 (0.008)
-0.013* (0.008)
-0.012 (0.008)
-0.018** (0.007)
-0.015* (0.008)
-0.052***
(0.015)
-0.061*** (0.016)
-0.052*** (0.015)
-0.064***
(0.017)
-0.055*** (0.016)
-0.046*** (0.016)
-0.051*** (0.016)
-0.045*** (0.016)
-0.053*** (0.016)
-0.048*** (0.016)
age -22.035 (18.050)
-22.773 (18.248)
-22.108 (18.134)
-23.708 (18.569)
-28.898 (18.386)
-24.122 (25.530)
-24.381 (27.099)
-24.710 (26.215)
-24.747 (28.379)
-23.243 (27.463)
-20.786 (27.772)
-22.555 (28.189)
-21.243 (27.834)
-22.219 (28.885)
-19.324 (28.605)
schyears 42.464
(61.957) 80.168
(63.179) 53.401
(62.803) 29.464
(71.616) 63.562
(63.708)
220.165**
(98.448)
179.020* (95.329)
220.721** (98.450)
161.433 (99.193)
208.421**
(104.143)
218.039** (101.261)
162.679 (101.165)
218.863** (101.177)
133.211 (104.027)
216.045**
(104.497)
mangratio -25.811***
(8.365) -
-26.545*** (8.678)
- -24.891***
(8.697)
-32.908**
* (12.448)
- -34.067** (13.188)
- -32.841** (14.421)
-35.124*** (12.554)
- -36.225***
(13.329) -
-35.431** (14.040)
mangdens - -0.150 (1.523)
1.832 (2.066)
- 1.068
(1.933) -
-1.520 (1.961)
0.654 (2.131)
- 0.331
(2.143) -
-1.886 (2.423)
0.507 (2.533)
- 0.182
(2.573)
mang500 - - - -0.001 (0.003)
-0.0003 (0.003)
- - - 0.0007 (0.004)
0.001 (0.004)
- - - 0.0005 (0.004)
0.0006 (0.004)
mang2000 - - - 0.0002
(0.0004) 0.0001
(0.0004) - - -
0.0004 (0.0004)
0.0002 (0.0004)
- - - 0.0004
(0.0005) 0.0002
(0.0006)
Cons 3519.299*
** (1299.847)
2593.066**
(1269.36)
3663.748***
(1295.467)
3664.955***
(1348.26)
3900.202***
(1348.471)
4528.933**
(2031.2)
4166.042**
(2077.76)
4576.725**
(2081.82)
4499.646**
(2166.7)
4838.177**
(2214.10)
4046.846**
(1911.861)
3501.921* (1936.02)
4011.243**
(1918.656)
3741.467*
(1984.66)
4141.58**
(1974.21)
No. Obs 205 205 205 194 194 205 205 205 194 194 205 205 205 194 194

20
4.2.5 Regression results for the impact of mangrove forests on the profit variability
Table 4.5 reports the results of the models using the ML estimator, whereas the results using the other
methods are shown in Table 4.6. The variables represent the mangroves coverage in ponds (i.e.
mangratio and mangdens), which have a risk-reducing effect on profit in aquaculture activities of
extensive and semi-intensive farms. Nevertheless, only mangratio is statistically significant at the
significant level of 1 percent. Furthermore, the sign and magnitude of mangratio remain consistent
when adding various proxies of mangrove forest. The mangratio coefficients of 0.011 in the models
suggest that if the area of mangrove forests increases by 1 percent, the variability of profit per square
meter will reduce by 0.011 percent, ceteris paribus. This result is in accordance with the mangrove
ecological functions of preventing disaster consequences (e.g. flood, erosion, and hurricane).
Table 4.5 The impact of mangrove forests on the profit variability (the variance of profit - var(ui))
Note: * denotes significant at 10%, ** denotes significant at 5%, *** denotes significant at 1%
The robust standard errors are shown in brackets
On the other hand, the rest of mangrove proxies are the area of mangroves within 500 and 2000 (i.e.
mang500 and mang2000) having different effects on the variance of profit. Particularly, mang500 has
a variance-increasing effect on profit in aquaculture while a variance-decreasing effect on profit is
found in mang2000; nonetheless, neither attains statistical significance. Meanwhile, the scale effect
has no statistical significance in the models.
Variables
MLE
Model 1 Model 2 Model 3 Model 4 Model 5
mangratio -0.011***
(0.005) -
-0.010*** (0.003)
- -0.011***
(0.004)
mangdens - -0.001 (0.001)
-0.0003 (0.0007)
- -0.0002 (0.001)
mang500 - - - 1.9e-6
(1.6e-6) 2.6e-6
(1.6e-6)
mang2000 - - - -1.3e-7 (2.4e-7)
-3.4e-7 (2.5e-7)
costm 0.0003 (0.004)
-0.001 (0.004)
0.0002 (0.004)
-0.006 (0.004)
-0.001 (0.004)
Constant 8.662*** (0.137)
8.535*** (0.136)
8.674*** (0.144)
8.513*** (0.149)
8.744*** (0.165)
No.Obs 205 205 205 194 194

21
Table 4.8 The impact of mangrove forests on the profit variability using other methods (FGLS, Robust S.E, and SUR)
Note: * denotes significant at 10%, ** denotes significant at 5%, *** denotes significant at 1%
The standard errors are shown in brackets in FGLS, SUR
White heteroskedasticity consistent standard errors are shown in brackets in Robust S.E
Variables FGLS Robust S.E SUR
Model 1
Model 2
Model 3
Model 4
Model 5
Model 1
Model 2
Model 3
Model 4
Model 5
Model 1
Model 2
Model 3
Model 4
Model 5
mangratio -0.014** (0.007)
- -0.015** (0.007)
- -0.014** (0.007)
-0.014* (0.007)
- -0.015* (0.007)
- -0.014* (0.008)
-0.014** (0.007)
- -0.015** (0.007)
- -0.014** (0.007)
mangdens - -0.001 (0.001)
0.001 (0.001)
- 0.0004 (0.001)
- -0.001 (0.001)
0.001 (0.001)
- 0.0004 (0.001)
- -0.001 (0.001)
0.001 (0.001)
- 0.0004 (0.001)
mang500 - - - 6.5e-7
(2.2e-6) 1.4e-6
(2.2e-6) - - -
6.5e-7 (1.7e-6)
1.4e-6 (1.8e-6)
- - - 4.8e-7
(2.2e-6) 1.3e-6
(2.1e-6)
mang2000 - - - 3.7e-8
(2.9e-7) -1.3e-7 (2.9e-7)
- - - 3.7e-8
(2.2e-7) -1.3e-7 (2.1e-7)
- - - 5.7e-8
(2.9e-7) -1.1e-7 (2.9e-7)
costm 0.001
(0.009) -0.001 (0.008)
0.002 (0.009)
-0.001 (0.009)
-0.010 (0.009)
0.001 (0.010)
-0.001 (0.009)
0.002 (0.010)
-0.0005 (0.010)
-0.010 (0.015)
0.004 (0.009)
0.003 (0.008)
0.005 (0.009)
0.004 (0.009)
-0.006 (0.009)
Constant 15.259*
** (0.336)
15.202***
(0.263)
15.262***
(0.331)
15.078***
(0.291)
15.60***
(0.354)
15.259***
(0.343)
15.202***
(0.246)
15.262***
(0.342)
15.078***
(0.304)
15.599***
(0.421)
15.175***
(0.334)
15.111***
(0.259)
15.178***
(0.326)
14.969***
(0.286)
15.508***
(0.347)
No.Obs 205 205 205 194 194 205 205 205 194 194 205 205 205 194 194

22
Table 4.6 presents the results of the models using other estimation methods (including SUR, FGLS, and
Robust S.E) adopted to test robustness of the regression results in Table 4.5. These estimation
methods yield the similar results to the ML estimator, but the levels of significance of variables are
different. Throughout the results of those methods, the sole proxy of mangrove forest which is the
ratio of mangrove forests coverage in farm (mangratio) is statistically significant and have a risk-
reducing effect on profit. Specifically, mangratio is statistically significant at the level of 5% in the SUR
estimation, and the coefficients of approximately 0.014 implies that an increase of 1 percent in the
ratio of mangrove forests coverage in pond will lead to decrease by 0.015 percent in the variability of
profit, ceteris paribus. Meantime, the coefficients of mangratio are identical in the FGLS and Robust
S.E estimation; however, the standard error in the FGLS estimation is not adjusted to correct for
heteroskedasticity.
5. CONCLUSION AND POLICY IMPLICATION Based on the empirical results from the previous chapter, this chapter will present the conclusion
remarks of the study, from which implication will be inferred from. Some limitations of the research
will also be articulated, and then suggestions to improve for further research will be introduced last.
5.1 Conclusion remarks
Four main findings deriving from the models using the estimation methods can be outlined as follow:
First, the negative relationship between the ratio of mangrove forests in farm and profit per square
meter in aquaculture production is statistically significant at the significant level of 1 percent.
However, the rest proxies of mangrove forests are statically insignificant in the models. These results
are consistent in all estimation methods and in the line with some paper in biological field (e.g. Alongi
et al, 2000; Johnston et al, 1999, 2000a and 2000b).
Second, mangrove forests have a risk-decreasing effect on profit. Thus, the ratio of mangrove forests
coverage in farm has an important role to mitigate the variance of profit in aquaculture. This is
complying with the natural conditions and geographic in Southwestern of Vietnam where usually
confront with natural disasters (e.g. flood, hurricane, and erosion). Mangrove forests have been
evaluated as a good insurance in aquafarming for households to alleviate the damage of those
problems (Rönnbäck, 1999). Therefore, a risk-averse farmer chooses to plant more mangrove forests
in farm than a risk-neutral farmer.
Third, the larger the extensive and semi-intensive aquaculture farms are, the lower the profit per
square meter in aquaculture activities achieved. This is compatible with the reality because these
farms are usually larger than 2 hectare, and this is difficult for households to control and manage
issues related to production process such as providing adequate food for aquatic organisms and
adopting shrimp protection.
Finally, the management ability of the operator have negligible effect on profit in aquaculture
production in extensive and semi-intensive farms. Since the exchange of information and farming
techniques is almost perfect, new entrants may imitate old ones to cultivate aquatic organisms in
extensive and semi-intensive farms.
These results are important for risk-averse farmers who focus on not only the mean profit function
but also factors have a variance-reducing effect and variance-increasing effect on profit. Therefore,
they are expected to decide the optimal input levels that differ from risk-neutral farmers. Mangrove

23
forests are one example. Even if mangrove forests are not statistically significant in the mean profit
function, the increase of mangrove forest areas will decrease the variability of profit in extensive and
semi-intensive aquaculture farms. Thus, the utility of households will increase.
5.2 Policy implication
The purpose of this study is to contribute empirical evidence of the benefits of mangrove forests in
aquaculture activities, especially extensive and semi-intensive farming. Thence, farmers and local
policy makers can make better-informed decisions on mangrove deforestation or reforestation. There
are important policy recommendations as follow:
Above all, mangrove forests are a variance-reducing input on profit in aquafarming so that local
authorities should encourage farmers to plant mangrove forests in the cultivated area for preventing
production risk in aquaculture production.
Since total area (including mangrove forests) has a negative effect on profit in extensive and semi-
intensive aquaculture farms, farmers should subdivide the cultivated area to manage and culture well,
or policy makers should reduce allocated area for each household and increase the number of
household contracted.
5.3 Limitations and further research This study has some limitations that can be overcome in further researches. Above all, although three
characteristics of mangrove forests are employed, this study does not consider other crucial
characteristic of mangrove forests-the number of mangrove species. This characteristic represents
biodiversity of mangrove forests and indicate which mangrove tree species bring benefits or
drawbacks to aquatic organisms in aquaculture production. The second concern belongs to the lost
information about the type of mixed mangrove-aquaculture farming systems each farm as each
system will bring different effects to profit of extensive and semi-intensive farms, which is mentioned
in Chapter 2. Finally, the restrictions of cross-section data are also a remarkable issue. Gujarati (2012)
suggest that cross-section data is not the best selection to analyze complicated behavior models. It
means that some inputs (i.e. mangrove forests) can be highly used to alleviate the effects of weather
variation on production yield over time, so these effects cannot be accurately estimated using a cross-
section data.
Above limitations are expected to be solve in further researches. Mangrove species should be taken
into account when investigating the impact of mangrove forests on profit in extensive and semi-
intensive aquaculture farms, and mangrove species data can be collected by interviewing operators
directly. The limitation of types of mangrove-aquaculture farming systems may be solved by dummy
variables which represent three popular types comprising integrated, associated, and separated
systems. A panel data is necessary to test robustness of results in this paper. In this way, the impact
of mangrove forests on profit variability using a panel data should be obviously examined in the
further research.
Aside from further researches resolving these limitations, the way for future topics are also discussed.
Firstly, the optimal ratio of mangrove forest areas in extensive and semi-intensive aquaculture farms,
especially shrimp farms should be investigated to help policy makers. Secondly, further research
should be not only determine the effects of mangrove forests on output levels and variability but also
the covariance of output among aquatic organisms. Thirdly, further research should not identify and
analyze the technical efficiency scores of extensive and semi-intensive aquaculture, operators have
not invested any machines and applied techniques in production process.

24
REFERENCES Alongi, D. M., Johnston, D. J., & Xuan, T. T. (2000). Carbon and nitrogen budgets in shrimp ponds of
extensive mixed shrimp–mangrove forestry farms in the Mekong Delta, Vietnam. Aquaculture
Research, 31(4), 387-399.
Ashton, E. C., Hogarth, P. J., & Ormond, R. (1999). Breakdown of mangrove leaf litter in a managed
mangrove forest in Peninsular Malaysia. Hydrobiologia, 413, 77-88.
Barbier, E. B. (1994). Valuing environmental functions: tropical wetlands. Land economics, 155-173.
Barbier, E. B. (2000). Valuing the environment as input: review of applications to mangrove-fishery
linkages. Ecological Economics, 35(1), 47-61.
Barbier, E. B. (2007). Valuing ecosystem services as productive inputs. Economic Policy, 22(49), 178-
229.
Basak, U. C., Das, A. B., & Das, P. (1998). Seasonal changes in organic constituents in leaves of nine
mangrove species. Marine and freshwater research, 49(5), 369-372.
Beck, M.W., Heck, K.L., Able, K.W., Childers, D.L., Eggleston, D.B., Gillanders, B.M., Halpern, B., Hays,
C.G., Hoshino, K., Minello, T.J., Orth, R.J., Sheridan, P.F. & Weinstein, M.P. (2001) The
identification, conservation and management of estuarine and marine nurseries for fish and
invertebrates. Bioscience, 51, 633–641.
Binh, C. T., Phillips, M. J., & Demaine, H. (1997). Integrated shrimp‐mangrove farming systems in the
Mekong delta of Vietnam. Aquaculture Research, 28(8), 599-610.
Coyle, B. T. (1992). Risk aversion and price risk in duality models of production: a linear mean-variance
approach. American Journal of Agricultural Economics, 74(4), 849-859.
Coyle, B. T. (1999). Risk aversion and yield uncertainty in duality models of production: a mean-
variance approach. American Journal of Agricultural Economics, 81(3), 553-567.
Dick, T. M., & Osunkoya, O. O. (2000). Influence of tidal restriction floodgates on decomposition of
mangrove litter. Aquatic Botany, 68(3), 273-280.
Giri, C., Ochieng, E., Tieszen, L. L., Zhu, Z., Singh, A., Loveland, T & Duke, N. (2011). Status and
distribution of mangrove forests of the world using earth observation satellite data. Global
Ecology and Biogeography, 20(1), 154-159.
Gujarati, D. N. (2012). Basic econometrics. Tata McGraw-Hill Education.
Hai, T. N., & Yakupitiyage, A. (2005). The effects of the decomposition of mangrove leaf litter on water
quality, growth and survival of black tiger shrimp (Penaeus monodon Fabricius,
1798). Aquaculture, 250(3), 700-712.
Harvey, A. C. (1976): “Estimating Regression Models with Multiplicative Heteroskedasticity.”
Econometrica 44 (1976): 461-465.
Hiraishi, T., & Harada, K. (2003). Greenbelt tsunami prevention in South-Pacific region. Report of the
Port and Airport Research Institute, 42(2), 1-23.

25
Hong, P. N., & San, H. T. (1993). Mangroves of Vietnam (Vol. 7). IUCN.
Johnston, D. D., Clough, B. B., Phillips, M. M., & Xuan, T. T. T. 1999. Mixed shrimp-mangrove forestry
farming systems in Ca Mau Province, Vietnam. Aquaculture Asia-pages: 4: 6-12.
Johnston, D., Van Trong, N., Van Tien, D., & Xuan, T. T. 2000b. Shrimp yields and harvest characteristics
of mixed shrimp–mangrove forestry farms in southern Vietnam: factors affecting
production. Aquaculture, 188(3), 263-284.
Johnston, D.J., Trong, N.V., Tuan, T.T., Xuan, T.T., 2000a. Shrimp seed recruitment in mixed shrimp–
mangrove forestry farming systems in Ca Mau province, Southern Vietnam. Aquaculture 184,
89–104.
Just, R. E., & Pope, R. D. (1978). Stochastic specification of production functions and economic
implications. Journal of Econometrics, 7(1), 67-86.
Kautsky, N., Berg, H., Folke, C., Larsson, J., & Troell, M. (1997). Ecological footprint for assessment of
resource use and development limitations in shrimp and tilapia aquaculture. Aquaculture
research, 28(10), 753-766.
Kautsky, N., Rönnbäck, P., Tedengren, M., & Troell, M. (2000). Ecosystem perspectives on
management of disease in shrimp pond farming. Aquaculture,191(1), 145-161.
Larsson, J., Folke, C., & Kautsky, N. (1994). Ecological limitations and appropriation of ecosystem
support by shrimp farming in Colombia. Environmental management, 18(5), 663-676.
Lee, S.Y., 1999. The effect of mangrove leaf litter enrichment on macrobenthic colonization of
defaunated sandy substrates. Estuar. Coast. Shelf S. 49, 703– 712.
Menzel, W. (1991). Estuarine and marine bivalve mollusk culture. CRC Press.
Nagelkerken, I., Blaber, S. J. M., Bouillon, S., Green, P., Haywood, M., Kirton, L. G., & Somerfield, P. J.
(2008). The habitat function of mangroves for terrestrial and marine fauna: a review. Aquatic
Botany, 89(2), 155-185.
Peng, Y., Li, X., Wu, K., Peng, Y., & Chen, G. (2009). Effect of an integrated mangrove-aquaculture
system on aquacultural health. Frontiers of Biology in China, 4(4), 579-584.
Phan, N. H., & Quan, T. Q. D. (2012). Environmental impacts of shrimp culture in the mangrove areas
of Vietnam.
Primavera, J. H. (2000). Integrated mangrove-aquaculture systems in Asia. Integrated coastal zone
management, 2000, 121-128.
Roijackers, R., & Nga, B. T. (2002). Aquatic ecological studies in a mangrove-shrimp system at The
Thanh Phu state farm, Ben Tre province, Vietnam. InSelected papers of the workshop on
integrated management of coastal resources in the Mekong delta, Vietnam: Can Tho, Vietnam,
August 2000 (No. 24, pp. 85-93).
Rönnbäck, P. (1999). The ecological basis for economic value of seafood production supported by
mangrove ecosystems. Ecological Economics, 29(2), 235-252.

26
Saha, A., Havenner, A., & Talpaz, H. (1997). Stochastic production function estimation: small sample
properties of ML versus FGLS. Applied Economics, 29(4), 459-469.
Sathirathai, S. (1998). Economic valuation of mangroves and the roles of local communities in the
conservation of natural resources: case study of Surat Thani, South of Thailand. South Bridge:
Economy and Environment Program for Southeast Asia.
Sidhu, S. S., & Baanante, C. A. (1981). Estimating farm-level input demand and wheat supply in the
Indian Punjab using a translog profit function. American Journal of Agricultural Economics,
63(2), 237-246.
Spalding, M., Blasco, F., & Field, C. (1997). World mangrove atlas.
Spalding, M., Kainuma, M., & Collins, L. (2010). World Atlas of Mangroves. A collaborative project of
ITTO, ISME, FAO, UNEP-WCMC.

27
APPENDIX
Appendix A: Questionnaire
Code Information Answer choices
PART 1: GENERAL INFORMATION OF THE HOUSEHOLD
B1 Type of farm entity 1. Subsistence; 2. Commercial
B2 Are you the head of the house hold? 1.Yes; 2. No - If the answer is "Yes", go
straight to Question B5
B3 Age of the head of the household Years
B4 Gender of the head of the household 1: Female; 2: Male
B5 Your age Years
B6 Gender 1: Female; 2: Male
B7 Household size (of owner/manager
of the farm)
Number
B8 Education of the head of the
household (total years)
Years
PART 2: SEAFOOD FARMING
S1 Farming area Hectare
S2 Farming method 1. Intensive; 2. Extensive; 3. Semi-
intensive
S3 Tenure type 1. Own land use; 2. Rented land from
other person; 3. Rented land from
government; 4. Unused land without
ownership; 5. Other (specify)
S4 How many (average) number of years
have you used these seafood farming
area?
Years
S5 Total rent paid (per month) if plot is
leased
Currency amount per month
S6 How many months do your seafood
farming processes occur annually?
Months
S7 Annual output from seafood farming
(shrimp, crab, fish, etc.)
Kg
S8 Average output from each rotation Kg
S9 Average price for one kg of outputs VND/kg
S10 Total value of annual output VND

28
S11 Total value of outputs from one
rotation
VND
S12 Number of working days per week Days
S13 Average number of labors working on
the field
Number of labors
S14 Daily average number of working
hours (per labor)
Hours
S15 Average length of one seafood farming
rotation
Days
S16 Value of seafood farming ponds, tools
and machines?
VND
S17 Amount of seafood seed used in
cropping in one rotation
Kg
S18 Average price for one kg of seafood
seed
VND/kg
S19 Cost for seafood seed for one rotation VND (Amount of seafood seed x Average
price)
S20 Cost of antibiotics VND
S21 Are your seafood farming activities
area next to the mangrove site (within
the distance of less than 100m)?
1. Yes; 2. No
S22 Are your seafood farming activities
area covered by the mangrove?
1. Yes; 2. No
S23 Do you waste the sewage from the
process into mangrove site?
1. Yes; 2. No