Embed Size (px)
Citation preview
2013 DAIRY SUMMIT
Dr. Phil Cardoso, DVM, PhD
Dairy Research and Extension
Managing the Transition Cow
January22-23-24
So, how do we help this cow?
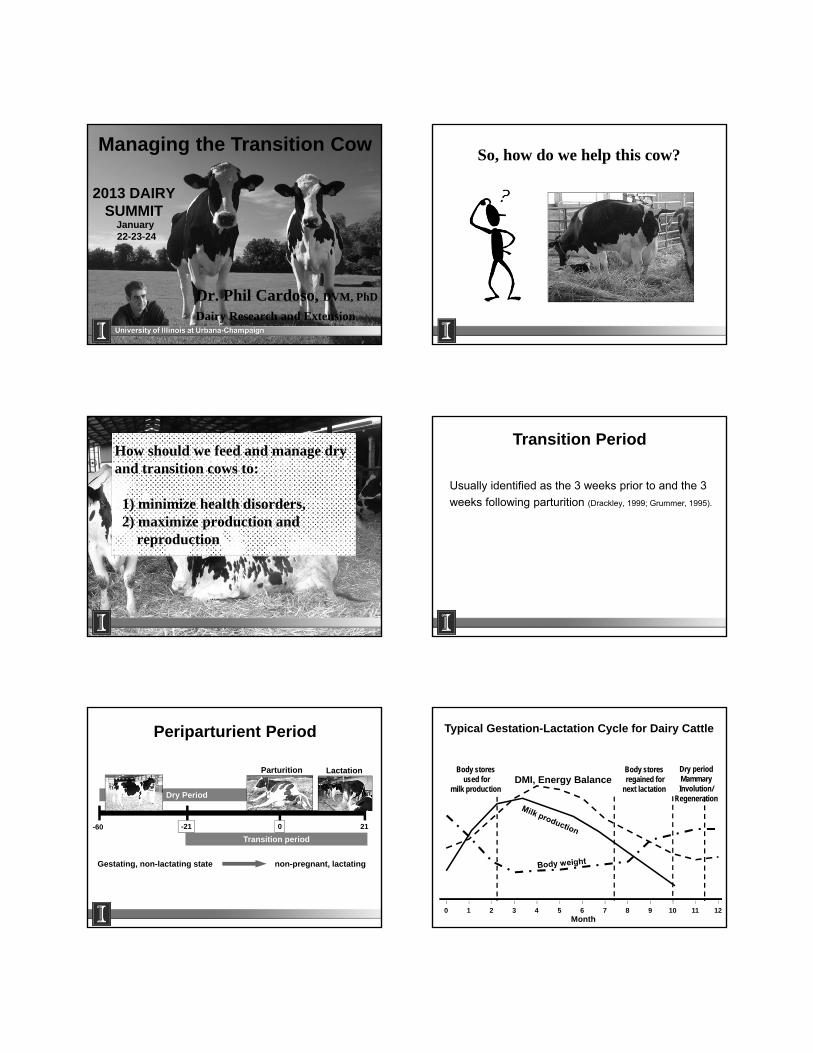
How should we feed and manage dry and transition cows to:
1) minimize health disorders,2) maximize production and
reproduction
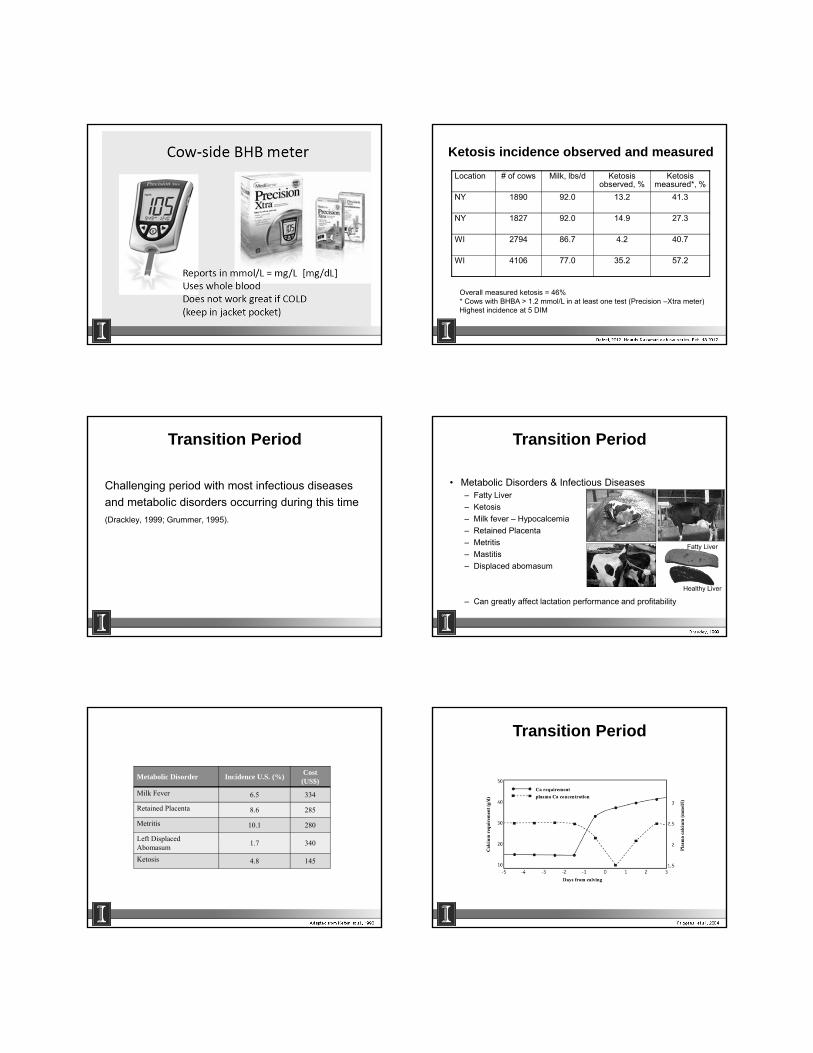
Usually identified as the 3 weeks prior to and the 3
weeks following parturition (Drackley, 1999; Grummer, 1995).
Transition Period
-60 -21 0 21
Dry Period
Transition period
LactationParturition
Gestating, non-lactating state non-pregnant, lactating
Periparturient Period
0 1 2 3 4 5 6 7 8 9 10 11 12Month
DMI, Energy BalanceBody stores
used for milk production
Body storesregained for
next lactation
Dry periodMammary Involution/
Regeneration
Typical Gestation-Lactation Cycle for Dairy Cattle
Ketosis incidence observed and measured
Location # of cows Milk, lbs/d Ketosis observed, %
Ketosis measured*, %
NY 1890 92.0 13.2 41.3
NY 1827 92.0 14.9 27.3
WI 2794 86.7 4.2 40.7
WI 4106 77.0 35.2 57.2
Overall measured ketosis = 46%* Cows with BHBA > 1.2 mmol/L in at least one test (Precision –Xtra meter)Highest incidence at 5 DIM
Oetzel, 2012: Hoards Dairyman webinar series, Feb. 13 2012
Challenging period with most infectious diseases
and metabolic disorders occurring during this time
(Drackley, 1999; Grummer, 1995).
Transition Period
• Metabolic Disorders & Infectious Diseases– Fatty Liver
– Ketosis
– Milk fever – Hypocalcemia
– Retained Placenta
– Metritis
– Mastitis
– Displaced abomasum
– Can greatly affect lactation performance and profitability
Drackley, 1999
Fatty Liver
Healthy Liver
Transition Period
Adapted from Kelton et al., 1998
Metabolic Disorder Incidence U.S. (%)Cost
(US$)
Milk Fever 6.5 334
Retained Placenta 8.6 285
Metritis 10.1 280
Left DisplacedAbomasum
1.7 340
Ketosis 4.8 145
Friggens et al., 2004
Transition Period
Adapted from Chapinal et al., 2012
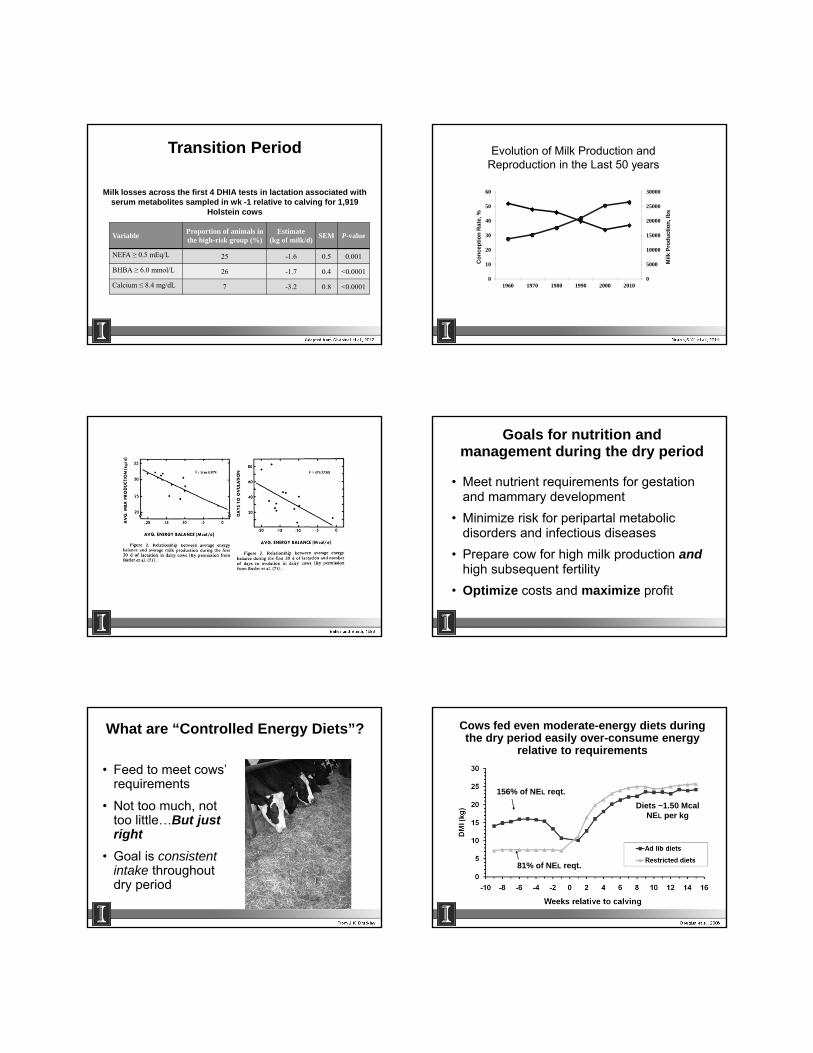
VariableProportion of animals in the high-risk group (%)
Estimate(kg of milk/d)
SEM P-value
NEFA ≥ 0.5 mEq/L 25 -1.6 0.5 0.001
BHBA ≥ 6.0 mmol/L 26 -1.7 0.4 <0.0001
Calcium ≤ 8.4 mg/dL 7 -3.2 0.8 <0.0001
Milk losses across the first 4 DHIA tests in lactation associated with serum metabolites sampled in wk -1 relative to calving for 1,919
Holstein cows
Transition Period
0
5000
10000
15000
20000
25000
30000
0
10
20
30
40
50
60
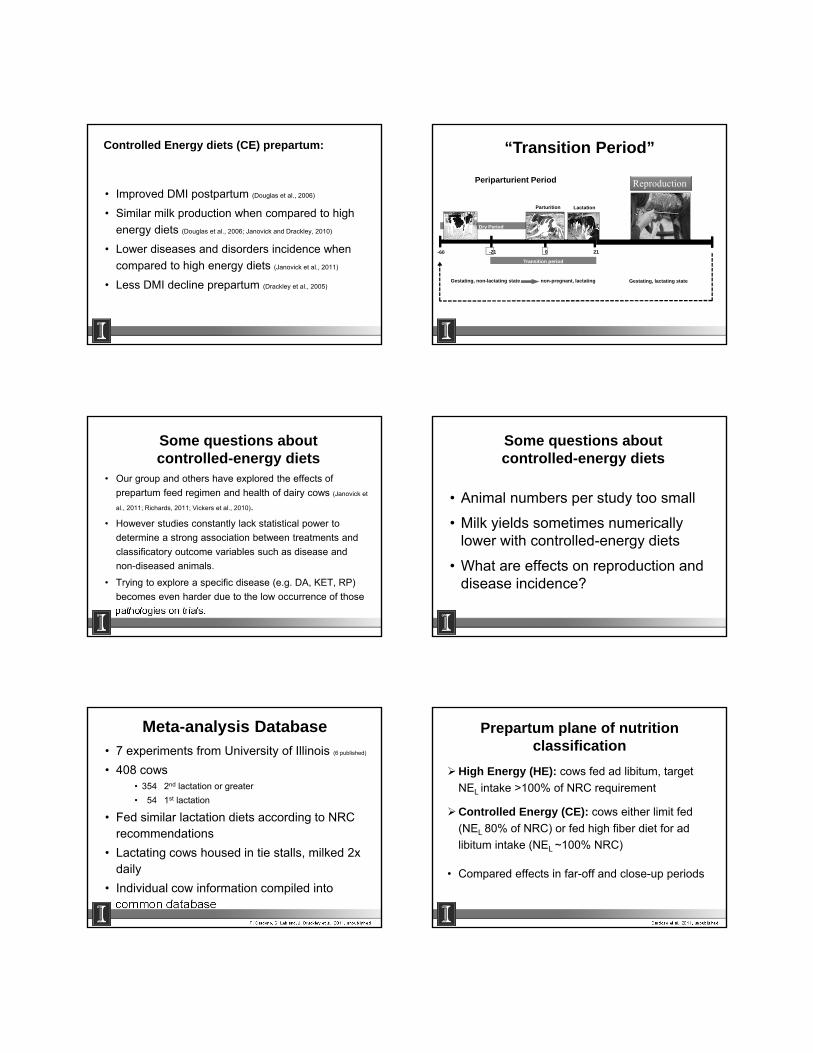
1960 1970 1980 1990 2000 2010
Milk
Pro
du
ctio
n, l
bs
Co
nce
pti
on
Rat
e, %
Walsh,S.W. et al., 2011
Evolution of Milk Production and Reproduction in the Last 50 years
Butler and Smith, 1989
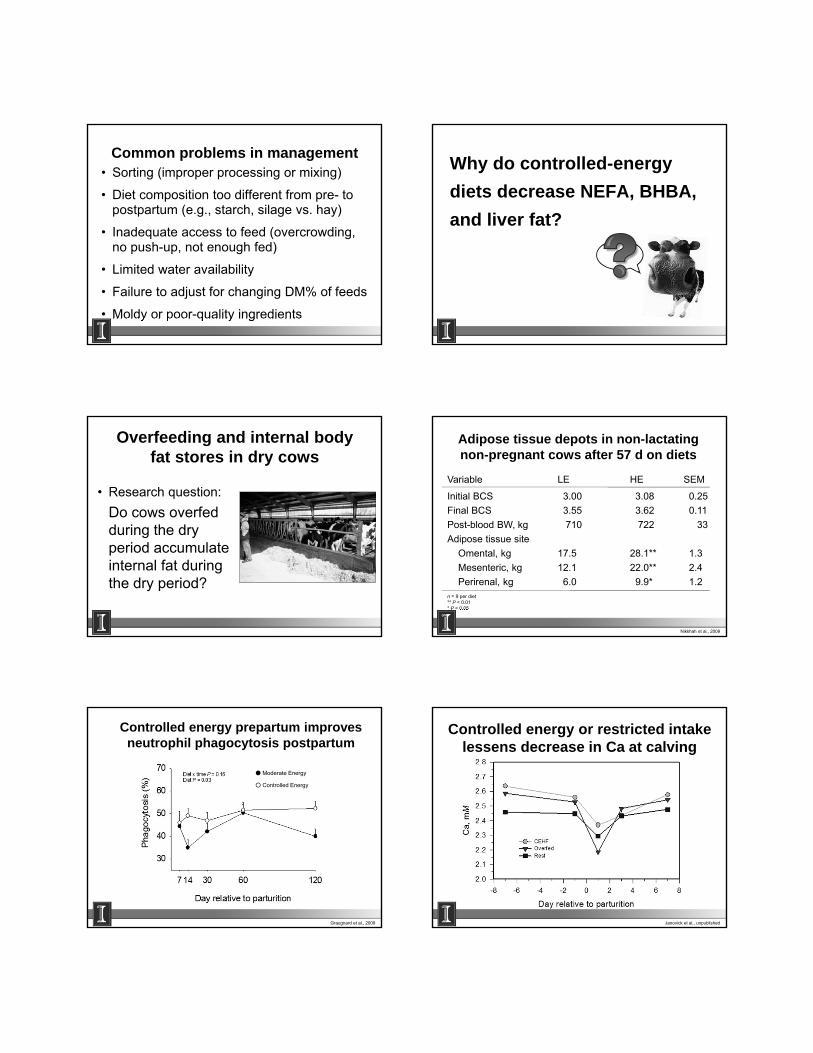
Goals for nutrition and management during the dry period
• Meet nutrient requirements for gestation and mammary development
• Minimize risk for peripartal metabolic disorders and infectious diseases
• Prepare cow for high milk production andhigh subsequent fertility
• Optimize costs and maximize profit
What are “Controlled Energy Diets”?
• Feed to meet cows’ requirements
• Not too much, not too little…But just right
• Goal is consistent intake throughout dry period
From J.K. Drackley
Cows fed even moderate-energy diets during the dry period easily over-consume energy
relative to requirements
156% of NEL reqt.
81% of NEL reqt.
Diets ~1.50 Mcal NEL per kg
Douglas et al., 2006
• Improved DMI postpartum (Douglas et al., 2006)
• Similar milk production when compared to high
energy diets (Douglas et al., 2006; Janovick and Drackley, 2010)
• Lower diseases and disorders incidence when
compared to high energy diets (Janovick et al., 2011)
• Less DMI decline prepartum (Drackley et al., 2005)
Controlled Energy diets (CE) prepartum:
Periparturient Period
-60 -21 0 21
Dry Period
Transition period
LactationParturition
Gestating, non-lactating state non-pregnant, lactating
Reproduction
Gestating, lactating state
“Transition Period”
• Our group and others have explored the effects of
prepartum feed regimen and health of dairy cows (Janovick et
al., 2011; Richards, 2011; Vickers et al., 2010).
• However studies constantly lack statistical power to
determine a strong association between treatments and
classificatory outcome variables such as disease and
non-diseased animals.
• Trying to explore a specific disease (e.g. DA, KET, RP)
becomes even harder due to the low occurrence of those
pathologies on trials.
Some questions about controlled-energy diets
• Animal numbers per study too small
• Milk yields sometimes numerically lower with controlled-energy diets
• What are effects on reproduction and disease incidence?
Some questions about controlled-energy diets
• 7 experiments from University of Illinois (6 published)
• 408 cows• 354 2nd lactation or greater
• 54 1st lactation
• Fed similar lactation diets according to NRC recommendations
• Lactating cows housed in tie stalls, milked 2x daily
• Individual cow information compiled into common database
Meta-analysis Database
F. Cardoso, S. Leblanc, J. Drackley et al., 2011, unpublished
High Energy (HE): cows fed ad libitum, target
NEL intake >100% of NRC requirement
Controlled Energy (CE): cows either limit fed
(NEL 80% of NRC) or fed high fiber diet for ad
libitum intake (NEL ~100% NRC)
• Compared effects in far-off and close-up periods
Prepartum plane of nutrition classification
Cardoso et al., 2011, unpublished
PSPS (% and SD) CE HE
>19 mm 21.8 ± 2.6 6.44 ± 1.3
8-19 mm 35.2 ± 1.7 43.08 ± 1.3
< 8 mm 43 ± 1.4 50.48 ± 3.1
Physical characteristics of dietary prepartum treatments
Cardoso et al., 2011, unpublished
Milk NFar-off
P-valueClose-up
SEM P-valueHE CE HE CE
Sum 4 wk, kg 177 115.5 117.3 0.78 120.2 112.7 3.2 0.26
Slope wk 1-3, % 168 45.4 42.3 0.66 42.1 45.6 4.1 0.62
Milk production from Holstein cows fed different dietary treatments
prepartum
Cardoso et al., 2011, unpublished
Milk production from Holstein cows fed different dietary treatments
prepartum
Cardoso et al., 2011, unpublished
Milk fat percentage from Holstein cows fed different dietary treatments
prepartum
*
*
*
P < 0.05
Cardoso et al., 2011, unpublished
Milk protein percentage from Holstein cows fed different dietary
treatments prepartum
**
P ≤ 0.05
Cardoso et al., 2011, unpublished
Metabolite Week NFar-off
SEM P-valueHE CE
NEFA (μEq/L) 1 346 817 667 1.2 <0.01
2 309 618 508 1.2 0.01
3 331 346 272 1.2 <0.01
Plasma NEFA concentration from cows receiving different treatments
prepartum
Cardoso et al., 2011, unpublished

Metabolite Week NFar-off
SEM P-valueHE CE
NEFA (μEq/L) 1 346 817 667 1.2 <0.01
2 309 618 508 1.2 0.01
3 331 346 272 1.2 <0.01
Disease = yes (NEFA>700μEq/L)
OR = 1.2 (P <0.05)
Cardoso et al., 2011, unpublished
Plasma NEFA concentration from cows receiving different treatments
prepartum
P = 0.01
5.021
P = 0.04
2.097
HE
HE
CE
Association of cows receiving different treatments prepartum and
specific diseases
Cardoso et al., 2011, unpublished
-0.35
-0.39
-0.30
-0.43*
P = 0.04
Body condition score (BCS) loss from wk6 to wk 1 from cows receiving different
treatments prepartum
Cardoso et al., 2011, unpublished
24.1
21.1
22.822.4
* *
P = 0.001
Mean NELI of the first 4 wk after calving from cows receiving different
treatments prepartum
Cardoso et al., 2011, unpublished
Overfeeding in close-up increased days to conception (DTC)
P = 0.04
HR = .689
Hazard ratios and 95% confidence intervals for the association of high energy diet (HE) and control energy diet (CE, referent) with days to conception (DTC) (P = 0.04). PHREG procedure considering experiment as random effect and controlling for the effects of calving season, reproduction pathology, and parity (P < 0.06) . CU: Close-up. FO: Far-off.
Median DTC: HE = 167,CE = 157
Cardoso et al., 2011, unpublished
CEHE
157 167
P = 0.04
Association of cows receiving different treatments prepartum and
days to conception (DTC)
Cardoso et al., 2011, unpublished
Common problems in management• Sorting (improper processing or mixing)
• Diet composition too different from pre- to postpartum (e.g., starch, silage vs. hay)
• Inadequate access to feed (overcrowding, no push-up, not enough fed)
• Limited water availability
• Failure to adjust for changing DM% of feeds
• Moldy or poor-quality ingredients
Why do controlled-energy
diets decrease NEFA, BHBA,
and liver fat?
Overfeeding and internal body fat stores in dry cows
• Research question:
Do cows overfed during the dry period accumulate internal fat during the dry period?
Adipose tissue depots in non-lactating non-pregnant cows after 57 d on diets
Variable LE HE SEM
Initial BCS 3.00 3.08 0.25
Final BCS 3.55 3.62 0.11
Post-blood BW, kg 710 722 33
Adipose tissue site
Omental, kg 17.5 28.1** 1.3
Mesenteric, kg 12.1 22.0** 2.4
Perirenal, kg 6.0 9.9* 1.2n = 9 per diet** P < 0.01* P < 0.05
Nikkhah et al., 2009
● Moderate Energy
○ Controlled Energy
Controlled energy prepartum improves neutrophil phagocytosis postpartum
Graugnard et al., 2009
Controlled energy or restricted intake lessens decrease in Ca at calving
Janovick et al., unpublished
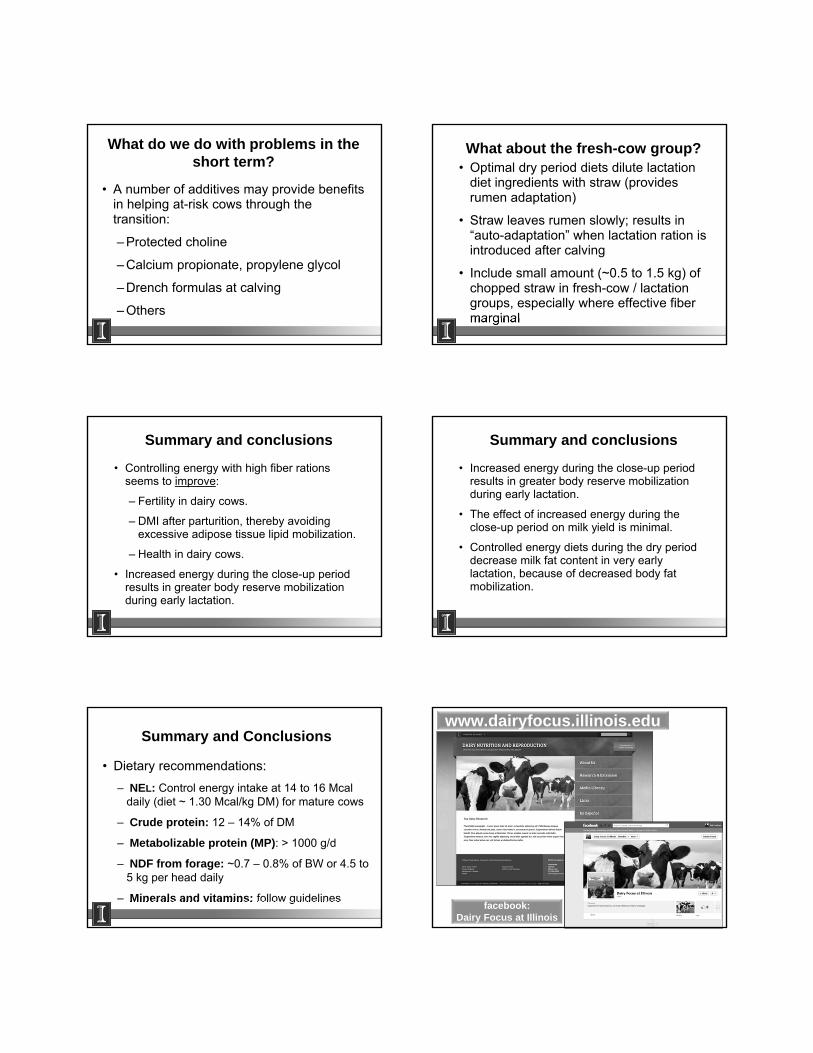
What do we do with problems in the short term?
• A number of additives may provide benefits in helping at-risk cows through the transition:
– Protected choline
– Calcium propionate, propylene glycol
– Drench formulas at calving
– Others
What about the fresh-cow group? • Optimal dry period diets dilute lactation
diet ingredients with straw (provides rumen adaptation)
• Straw leaves rumen slowly; results in “auto-adaptation” when lactation ration is introduced after calving
• Include small amount (~0.5 to 1.5 kg) of chopped straw in fresh-cow / lactation groups, especially where effective fiber marginal
Summary and conclusions
• Controlling energy with high fiber rations seems to improve:
– Fertility in dairy cows.
– DMI after parturition, thereby avoiding excessive adipose tissue lipid mobilization.
– Health in dairy cows.
• Increased energy during the close-up period results in greater body reserve mobilization during early lactation.
Summary and conclusions
• Increased energy during the close-up period results in greater body reserve mobilization during early lactation.
• The effect of increased energy during the close-up period on milk yield is minimal.
• Controlled energy diets during the dry period decrease milk fat content in very early lactation, because of decreased body fat mobilization.
Summary and Conclusions
• Dietary recommendations:
– NEL: Control energy intake at 14 to 16 Mcaldaily (diet ~ 1.30 Mcal/kg DM) for mature cows
– Crude protein: 12 – 14% of DM
– Metabolizable protein (MP): > 1000 g/d
– NDF from forage: ~0.7 – 0.8% of BW or 4.5 to 5 kg per head daily
– Minerals and vitamins: follow guidelines
www.dairyfocus.illinois.edu
facebook:Dairy Focus at Illinois