Embed Size (px)
Citation preview
Managing the Patient with High Triglycerides:
Assessment and Treatment Strategies
February 6, 2014
Ft. Lauderdale, FL
Faculty Harold E. Bays, MD, FTOS, FACE, FNLA
Michael Miller, MD, FACC, FAHA
Session 5: Managing the Patient with High Triglycerides: Assessment and Treatment Strategies Learning Objectives 1. Discuss the role of elevated triglyceride (TG) levels in the assessment and diagnosis of dyslipidemia,
including cardiovascular risk factors 2. Apply best practices in the attainment of TG levels, including the role of fasting and nonfasting states in accurate
evaluation 3. Evaluate the management of hypertriglyceridemia through greater adherence to evidenced based practices and
accepted guidelines 4. Select potential new and emerging therapeutic approaches to manage TG-based dyslipidemia, mixed dyslipidemia,
and associated cardiovascular risk Faculty
Harold E. Bays, MD, FTOS, FACE, FNLA Medical Director and President Louisville Metabolic and Atherosclerosis Research Center Louisville, Kentucky
Dr Harold Bays is medical director and president of Louisville Metabolic and Atherosclerosis Research Center (L-MARC) in Louisville, Kentucky. He earned his medical degree and completed his internship and residency in internal medicine, He then received his fellowship in endocrinology and metabolism at the University of Louisville School of Medicine. Dr Bays has served as an investigator in over 400 Phase I through IV clinical trials for treatments for high cholesterol and other dyslipidemias, obesity, diabetes mellitus, hypertension, osteoporosis, and other metabolic and hormonal disorders. He has written, or served as a contributing author for, over 180 scientific manuscripts and book chapters; and authored over 100 scientific abstracts. His publications have appeared in such peer reviewed journals as the New England Journal of Medicine, Obesity/Obesity Research, Journal of Clinical Endocrinology and Metabolism, and Cell Metabolism.
Michael Miller, MD, FACC, FAHA Professor, Departments of Medicine, Epidemiology & Public Health University of Maryland School of Medicine Director, Center for Preventive Cardiology University of Maryland Medical Center Baltimore, Maryland
Dr Michael Miller is a professor in the departments of medicine, epidemiology & public health at the University of Maryland School of Medicine, Baltimore, Maryland. In addition, he is director of the center for preventive cardiology at the University of Maryland Medical Center. Dr Miller earned his MD from The University of Medicine and Dentistry of New Jersey. Following a medical residency at the University of Cincinnati Hospital, he completed two fellowships at Johns Hopkins, one in lipoprotein metabolism and the second in cardiovascular disease. His major research interests are disorders of lipid and lipoprotein metabolism, molecular studies of HDL cholesterol, triglycerides and the postprandial response to dietary fat, nontraditional coronary risk factors, and clinical trials to reduce atherosclerosis. Dr Miller has authored more than 250 original articles, book chapters and other publications. Original research articles have appeared in BMJ, Circulation, JACC, JAMA, NEJM, PNAS, and Science. He is the coauthor of “The Practice of Coronary Disease Prevention” and the “AMA Guide to Preventing and Treating Heart Disease.”
Faculty Financial Disclosure Statements The presenting faculty reports the following: Dr Bays receives research grants from Alere, Amarin, Amgen, Ardea Inc., Boehringer Ingelheim, California Raisin Board, Catabasis, Eisai, Elcelyx, Eli Lilly, Esperion, Forest, Gilead, Given, GlaxoSmithKline, High Point Pharmaceuticals, LLC, Hoffman LaRoche, Home Access, Isis, Janssen, Merck, Micropharma Limited, Nektar, Novartis, Novo Nordisk, Omthera, Orexigen Therapeutics, Pfizer, Pronovo, Regeneron, Takeda, TIMI, Transtech Pharma, Inc., Trygg Pharmaceuticals, VIVUS, WPU, and Xoma; Consulting Fees from Amarin, Amgen, AstraZeneca, Bristol-Myers Squibb, Catabasis, Daiichi Sankyo, Inc., Eisai, Isis, Merck, Novartis, Pronovo, VIVUS, and WPU; and speaker fees from Amarin, Bristol-Myers Squibb, Daiichi Sankyo, Inc., Eisai, Merck, and VIVUS. Dr Miller receives consulting fees from Amarin. Education Partner Financial Disclosure Statement The content collaborators at Medtelligence, LLC report the following: Ben Caref, PhD, Managing Partner and Chief Medical Officer, develops content and has no financial relationships to disclose. Pamela J. Clark, Director of Editorial Services, provides editorial assistance and has no financial relationship to disclose. Suggested Reading List American Diabetes Association. Standards of medical care in diabetes–2012. Diabetes Care. 2012;35(Suppl 1):S11-S63. Ballantyne CM, Bays HE, Kastelein JJ, et al. Efficacy and safety of eicosapentaenoic acid ethyl ester (AMR101) therapy in statin-treated patients with persistent high triglycerides (from the ANCHOR study). Am J Cardiol. 2012;110(7): 984-992. Bays HE, Ballantyne CM, Kastelein JJ, et al. Eicosapentaenoic acid ethyl ester (AMR101) therapy in patients with very high triglyceride levels (from the Multi-center, plAcebo-controlled, Randomized, double-blINd, 12-week study with an open-label Extension [MARINE] trial). Am J Cardiol. 2011;108(5):682-690. Brinton EA, Ballantyne CM, Bays HE, et al. Effects of icosapent ethyl on lipid and inflammatory parameters in patients with diabetes mellitus-2, residual elevated triglycerides (200–500 mg/dL), and on statin therapy at LDL-C goal: the ANCHOR study. Cardiovasc Diabetol. 2013;12(1):100. Brunzell JD, Davidson M, Furberg CD, et al. Lipoprotein management in patients with cardiometabolic risk: consensus conference report from the American Diabetes Association and the American College of Cardiology Foundation. J Am Coll Cardiol. 2008;51(15):1512-1524. James PA, Oparil S, Carter BL, et al. 2014 Evidence-Based Guideline for the Management of High Blood Pressure in Adults: Report From the Panel Members Appointed to the Eighth Joint National Committee (JNC 8). JAMA. 2013;Dec 18 [Epub ahead of print]. Jellinger PS, Smith DA, Mehta AE, et al; for the AACE Task Force. American Association of Clinical Endocrinologists' Guidelines for Management of Dyslipidemia and Prevention of Atherosclerosis. Endocr Pract. 2012;18(Suppl 1):1-78. Miller M, Stone NJ, Ballantyne C, et al. Triglycerides and cardiovascular disease: a scientific statement from the American Heart Association. Circulation. 2011;123(20):2292-2333. Sniderman AD, Williams K, Contois JH, et al. A meta-analysis of low-density lipoprotein cholesterol, non-high-density lipoprotein cholesterol, and apolipoprotein B as markers of cardiovascular risk. Circ Cardiovasc Qual Outcomes. 2011;4(3):337-345.

Stone NJ, Robinson J, Lichtenstein AH, et al. 2013 ACC/AHA Guideline on the Treatment of Blood Cholesterol to Reduce Atherosclerotic Cardiovascular Risk in Adults: A Report of the American College of Cardiology/American Heart Association Task Force on Practice Guidelines. Circulation. 2013; Nov 12. [Epub ahead of print] Sarwar N, Sandhu MS, Recketts SL, et al: for the Triglyceride Coronary Disease Genetics Consortium and Emerging Risk Factors Collaboration. Triglyceride-mediated pathways and coronary disease: collaborative analysis of 101 studies. Lancet. 2010;375(9726):1634-1639.
1
Managing the Patient with High Triglycerides: Assessment and Treatment Strategies
SPEAKERSHarold E. Bays, MD, FTOS, FACE, FNLA
Michael Miller, MD, FACC, FAHA
SESSION 52:30–3:45pm
Presenter Disclosure Information
►Dr Bays receives research grants from Alere, Amarin, Amgen, ArdeaInc., Boehringer Ingelheim, California Raisin Board, Catabasis, Eisai, Elcelyx, Eli Lilly, Esperion, Forest, Gilead, Given, GlaxoSmithKline, High Point Pharmaceuticals, LLC, Hoffman LaRoche, Home Access, Isis, Janssen, Merck, Micropharma Limited, Nektar, Novartis, Novo Nordisk, Omthera, Orexigen Therapeutics, Pfizer, Pronovo, Regeneron, Takeda, TIMI, Transtech Pharma, Inc., TryggPharmaceuticals, VIVUS, WPU, and Xoma; Consulting Fees from Amarin, Amgen, AstraZeneca, Bristol-Myers Squibb, Catabasis, Daiichi Sankyo, Inc., Eisai, Isis, Merck, Novartis, Pronovo, VIVUS, and WPU; and speaker fees from Amarin, Bristol-Myers Squibb, Daiichi Sankyo, Inc., Eisai, Merck, and VIVUS.
►Dr Miller receives consulting fees from Amarin.
The following relationships exist related to this presentation:
Presenter Disclosure Information
Off-Label/Investigational Discussion
► In accordance with pmiCME policy, faculty have been asked to disclose discussion of unlabeled or unapproved use(s) of drugs or devices during the course of their presentations.
Managing the Patient with High Triglycerides: Assessment and Treatment Strategies
February 6, 2014
Drug Names
Generic name Brand name(s)
Atorvastatin Atorvastatin Calcium, Caduet, Lipitor
Bezafibrate none
Estrogen various
Ezetimibe various
Fenofibrate Antara, Fenoglide, Lipofen, Tricor, Triglide, Trilipix
Fluvastatin Fluvastatin Sodium, Lescol, Lescol XL
Gemfibrozil Gemfibrozil, Lopid
Icosapent Ethyl Vascepa
Isotretinoin various
Lovastatin Advicor, Altoprev, Lovastatin, Mevacor
Generic name Brand name(s)
Metformin various
NiacinNiacin/laropiprant
various
Omega-3-acidethyl esters
Lovaza, Omacor, Vascepa
Pravastatin Pravachol, PravastatinSodium, Pravigard PAC
Rosuvastatin Crestor, Rosuvastatin Calcium, Rosuvastatin Zinc
Simvastatin Zocor, simvastatin
Tamoxifen Nolvadex, Soltamox,Tamoxifen Citrate
Thiazide diuretic various
Learning Objectives
• Discuss the role of elevated triglyceride (TG) levels in the assessment and diagnosis of dyslipidemia, including cardiovascular risk factors
• Apply best practices in the attainment of TG levels, including the role of fasting and non-fasting states in accurate evaluation
• Evaluate the management of hypertriglyceridemia (HTG) through greater adherence to evidence based practices and accepted guidelines
• Select potential new and emerging therapeutic approaches to manage TG-based dyslipidemia, mixed dyslipidemia, and associated cardiovascular risk

2
What Is the Relationship of Hypertriglyceridemia to Increased CVD Risk?
Michael Miller, MD, FACC, FAHAProfessor, Departments of Medicine, Epidemiology, & Public HealthUniversity of Maryland School of MedicineDirector, Center for Preventive CardiologyUniversity of Maryland Medical CenterBaltimore, MD
Prevalence (%) of HTG by Age, Sex, and Ethnicity in NHANES 1999–2008
TG Cut Points, mg/dLa
Demographic ≥150 ≥200 ≥500
Overall (age ≥20 yrs) 31 16 1.1
Men 35 20 1.8
Womenb 27 13 0.5
Mexican American 35 20 1.4
Non-Hispanic, black 16 8 0.4
Non-Hispanic, white 33 18 1.1
Use of TG-lowering medicationsc 18
a Percentage of participants. bExcludes pregnant women. Miller M et al. Circulation. 2011;123:2292-333.c Includes fenofibrate, gemfibrozil, niacin, or statin. Ford ES et al. Arch Intern Med. 2009;169:572-8.dUS Census Age 20 and above, July 1, 2010, was 226,113,653. HTG=hypertriglyceridemia; NHANES=National Health and Nutrition Examination Survey; TG=triglyceride(s); yrs=years.
70 million persons, or ~1/3 of US adults, have elevated TG (≥150 md/dL)d
Fattyliver
Three Atherogenic Consequences of HTG
TG
CE
CETP HDL
Hepatic Lipase
Kidney
Rapid Lossof Apo A-I
HDL-C, HDL-P, & Apo A-I
SDHDL
3
TG
VLDL-C1
CE
TG
CETP
SDLDL
LDL size
Apo B & LDL-PHepatic Lipase
LDL
2
VLDL
FFA/TGand
Fructose(glucose)
CentralAdiposity
FFA /TG
↑VLDL Synthesis
Apo=apolipoprotein; CE=cholesterol ester; CETP=CE transfer protein; FFA=free fatty acid; HDL=high-density lipoprotein; HDL-C=HDL cholesterol; HDL-P=HDL particle; LDL=low-density lipoprotein; LDL-P=LDL particle; SD=small dense; VLDL=very-low-density lipoprotein; VLDL-C=VLDL cholesterol.
Fatty liver & ↑VLDL synthesis are key to ↑TG and consequences
“Atherogenic Dyslipidemia”
1. ↑TG / VLDL-C2. SD LDL / ↑LDL-P3. ↓HDL-C & Apo A-I
112233
Fattyliver
Postprandial TG (Remnants) Increased in CAD Patients
CAD=coronary artery disease. Patsch JR et al. Arterioscler Thromb. 1992;12:1336-45.
Pla
sma
TG
(m
g/d
L)
Hours after meal
*P=0.025; †P0.001.
*
†
†
CAD (n=61)
0
100
200
300
400
0 2 4 6 8
No CAD (n=40)
Elevated TG Associated with ↑SD LDL-P, ↓HDL-C, and ↑Non-HDL-C
Apo B
LDL=130 mg/dL
Fewer Particles More Particles
CE
More Apo B
TC=total cholesterol. Otvos JD et al. Am J Cardiol. 2002;90:22i-29i.
Fasting Lipid Panel:TC 198 mg/dLLDL-C 130 mg/dLTG 90 mg/dLHDL-C 50 mg/dLNon-HDL-C 148 mg/dL
Fasting Lipid Panel:TC 210 mg/dLLDL-C 130 mg/dLTG 250 mg/dLHDL-C 30 mg/dLNon-HDL-C 180 mg/dL
Association Between BMI and HTGNHANES 1999–2004
TG Concentration (mg/dL)
BMI (kg/m2)
<150(n=3250)
<200(n=4057)
≥150(n=1744)
≥200(n=937)
<25 42.7 39.0 20.1 17.5
25 to <30 31.6 33.3 39.9 39.6
≥30 25.6 27.7 39.9 42.9
BMI=body mass index.Miller M et al. Circulation. 2011;123:2292-333.
Percent of participants within a TG category as a function of BMI status
~2.5 greater prevalence
3
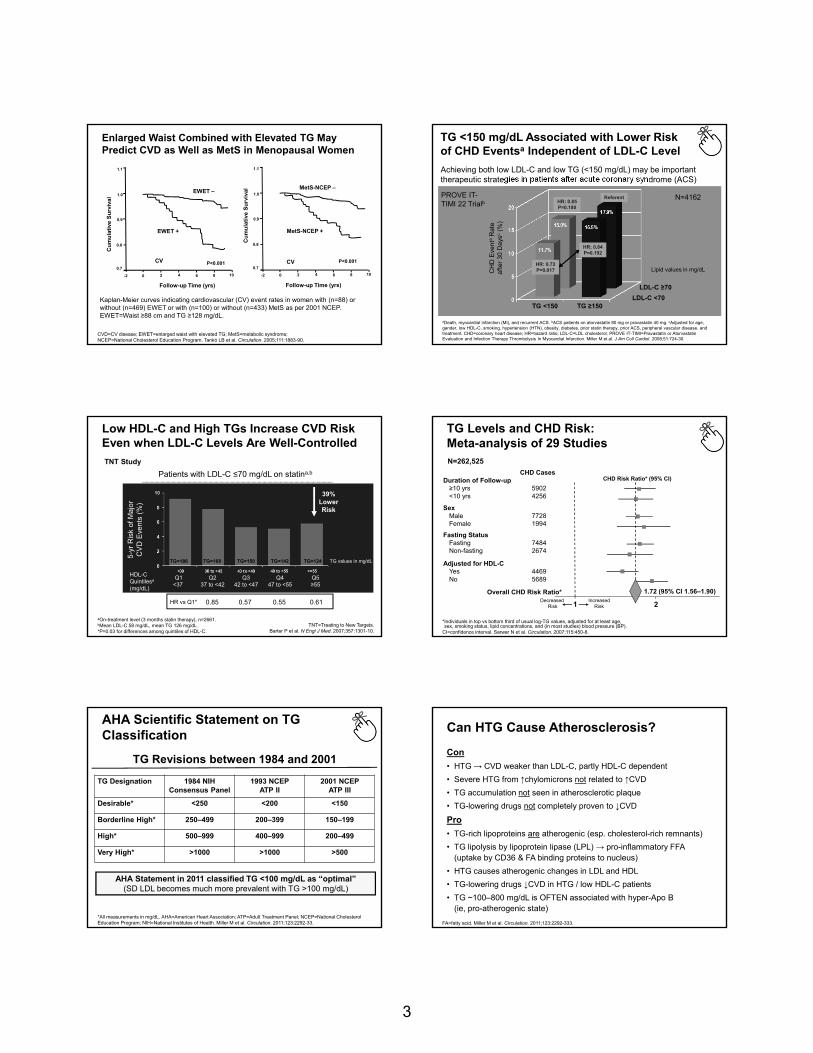
CVD=CV disease; EWET=enlarged waist with elevated TG; MetS=metabolic syndrome; NCEP=National Cholesterol Education Program. Tankó LB et al. Circulation. 2005;111:1883-90.
MetS-NCEP +
EWET –
CV P<0.001
-2 0 2 4 6 8 10
0.7
0.8
0.9
1.0
1.1
Follow-up Time (yrs)
Cu
mu
lati
ve S
urv
ival
Cu
mu
lati
ve S
urv
ival
0.7
0.8
0.9
1.0
1.1
-2 0 2 4 6 8 10
P<0.001
MetS-NCEP –
EWET +
CV
Kaplan-Meier curves indicating cardiovascular (CV) event rates in women with (n=88) or without (n=469) EWET or with (n=100) or without (n=433) MetS as per 2001 NCEP. EWET=Waist ≥88 cm and TG ≥128 mg/dL.
Follow-up Time (yrs)
Enlarged Waist Combined with Elevated TG May Predict CVD as Well as MetS in Menopausal Women
PROVE IT-TIMI 22 Trialb
TG <150 mg/dL Associated with Lower Risk of CHD Eventsa Independent of LDL-C Level
Achieving both low LDL-C and low TG (<150 mg/dL) may be important therapeutic strategies in patients after acute coronary syndrome (ACS)
CH
D E
ven
taR
ate
a
fte
r 3
0 D
ays
c(%
)
aDeath, myocardial infarction (MI), and recurrent ACS. bACS patients on atorvastatin 80 mg or pravastatin 40 mg. cAdjusted for age, gender, low HDL-C, smoking, hypertension (HTN), obesity, diabetes, prior statin therapy, prior ACS, peripheral vascular disease, and treatment. CHD=coronary heart disease; HR=hazard ratio; LDL-C=LDL cholesterol; PROVE IT-TIMI=Pravastatin or Atorvastatin Evaluation and Infection Therapy Thrombolysis In Myocardial Infarction. Miller M et al. J Am Coll Cardiol. 2008;51:724-30.
N=4162
TG <150 TG ≥150
LDL-C ≥70
LDL-C <70
HR: 0.72P=0.017
HR: 0.85P=0.180
HR: 0.84P=0.192
Referent
Lipid values in mg/dL
Low HDL-C and High TGs Increase CVD Risk Even when LDL-C Levels Are Well-Controlled
HDL-C Quintilesa
(mg/dL)
5-yr
Ris
k of
Maj
or
CV
D E
vent
s (%
)
Patients with LDL-C ≤70 mg/dL on statina,b
aOn-treatment level (3 months statin therapy), n=2661.bMean LDL-C 58 mg/dL, mean TG 126 mg/dL.*P=0.03 for differences among quintiles of HDL-C.
Q237 to <42
Q342 to <47
Q5≥55
Q447 to <55
HR vs Q1* 0.85 0.57 0.55 0.61
39% Lower Risk
TG=186 TG=168 TG=150 TG=142 TG=124
TNT=Treating to New Targets.Barter P et al. N Engl J Med. 2007;357:1301-10.
Q1<37
TG values in mg/dL
TNT Study
TG Levels and CHD Risk:Meta-analysis of 29 Studies
*Individuals in top vs bottom third of usual log-TG values, adjusted for at least age, sex, smoking status, lipid concentrations, and (in most studies) blood pressure (BP).
CI=confidence interval. Sarwar N et al. Circulation. 2007;115:450-8.
CHD CasesDuration of Follow-up≥10 yrs 5902<10 yrs 4256
SexMale 7728Female 1994
Fasting StatusFasting 7484Non-fasting 2674
Adjusted for HDL-CYes 4469No 5689
Overall CHD Risk Ratio*Decreased
Risk
CHD Risk Ratio* (95% CI)
1.72 (95% CI 1.56–1.90)
21Increased
Risk
N=262,525
*All measurements in mg/dL. AHA=American Heart Association; ATP=Adult Treatment Panel; NCEP=National Cholesterol Education Program; NIH=National Institutes of Health. Miller M et al. Circulation. 2011;123:2292-33.
TG Revisions between 1984 and 2001
AHA Scientific Statement on TG Classification
TG Designation 1984 NIH Consensus Panel
1993 NCEPATP II
2001 NCEPATP III
Desirable* <250 <200 <150
Borderline High* 250–499 200–399 150–199
High* 500–999 400–999 200–499
Very High* >1000 >1000 >500
AHA Statement in 2011 classified TG <100 mg/dL as “optimal”(SD LDL becomes much more prevalent with TG >100 mg/dL)
Can HTG Cause Atherosclerosis?
Con
• HTG → CVD weaker than LDL-C, partly HDL-C dependent
• Severe HTG from ↑chylomicrons not related to ↑CVD
• TG accumulation not seen in atherosclerotic plaque
• TG-lowering drugs not completely proven to ↓CVD
Pro
• TG-rich lipoproteins are atherogenic (esp. cholesterol-rich remnants)
• TG lipolysis by lipoprotein lipase (LPL) → pro-inflammatory FFA (uptake by CD36 & FA binding proteins to nucleus)
• HTG causes atherogenic changes in LDL and HDL
• TG-lowering drugs ↓CVD in HTG / low HDL-C patients
• TG ~100–800 mg/dL is OFTEN associated with hyper-Apo B (ie, pro-atherogenic state)
FA=fatty acid. Miller M et al. Circulation. 2011;123:2292-333.
4
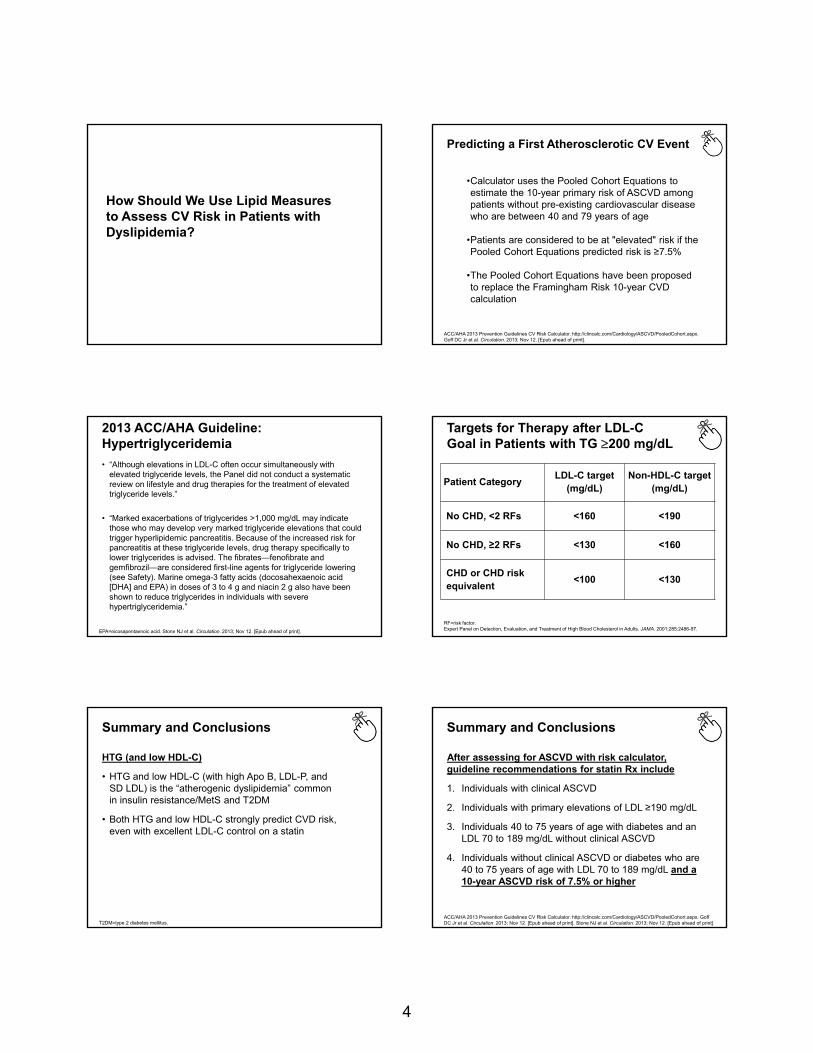
How Should We Use Lipid Measures to Assess CV Risk in Patients with Dyslipidemia?
Predicting a First Atherosclerotic CV Event
ACC/AHA 2013 Prevention Guidelines CV Risk Calculator. http://clincalc.com/Cardiology/ASCVD/PooledCohort.aspx. Goff DC Jr et al. Circulation. 2013; Nov 12. [Epub ahead of print].
•Calculator uses the Pooled Cohort Equations to estimate the 10-year primary risk of ASCVD among patients without pre-existing cardiovascular disease who are between 40 and 79 years of age
•Patients are considered to be at "elevated" risk if the Pooled Cohort Equations predicted risk is ≥7.5%
•The Pooled Cohort Equations have been proposed to replace the Framingham Risk 10-year CVD calculation
2013 ACC/AHA Guideline: Hypertriglyceridemia
• “Although elevations in LDL-C often occur simultaneously with elevated triglyceride levels, the Panel did not conduct a systematic review on lifestyle and drug therapies for the treatment of elevated triglyceride levels.”
• “Marked exacerbations of triglycerides >1,000 mg/dL may indicate those who may develop very marked triglyceride elevations that could trigger hyperlipidemic pancreatitis. Because of the increased risk for pancreatitis at these triglyceride levels, drug therapy specifically to lower triglycerides is advised. The fibrates—fenofibrate and gemfibrozil—are considered first-line agents for triglyceride lowering (see Safety). Marine omega-3 fatty acids (docosahexaenoic acid [DHA] and EPA) in doses of 3 to 4 g and niacin 2 g also have been shown to reduce triglycerides in individuals with severe hypertriglyceridemia.”
EPA=eicosapentaenoic acid. Stone NJ et al. Circulation. 2013; Nov 12. [Epub ahead of print].
Targets for Therapy after LDL-C Goal in Patients with TG 200 mg/dL
RF=risk factor.Expert Panel on Detection, Evaluation, and Treatment of High Blood Cholesterol in Adults. JAMA. 2001;285:2486-97.
Patient CategoryLDL-C target
(mg/dL)Non-HDL-C target
(mg/dL)
No CHD, <2 RFs <160 <190
No CHD, ≥2 RFs <130 <160
CHD or CHD risk equivalent
<100 <130
Summary and Conclusions
HTG (and low HDL-C)
• HTG and low HDL-C (with high Apo B, LDL-P, and SD LDL) is the “atherogenic dyslipidemia” common in insulin resistance/MetS and T2DM
• Both HTG and low HDL-C strongly predict CVD risk, even with excellent LDL-C control on a statin
T2DM=type 2 diabetes mellitus.
Summary and Conclusions
After assessing for ASCVD with risk calculator, guideline recommendations for statin Rx include
1. Individuals with clinical ASCVD
2. Individuals with primary elevations of LDL ≥190 mg/dL
3. Individuals 40 to 75 years of age with diabetes and an LDL 70 to 189 mg/dL without clinical ASCVD
4. Individuals without clinical ASCVD or diabetes who are 40 to 75 years of age with LDL 70 to 189 mg/dL and a 10-year ASCVD risk of 7.5% or higher
ACC/AHA 2013 Prevention Guidelines CV Risk Calculator. http://clincalc.com/Cardiology/ASCVD/PooledCohort.aspx. Goff DC Jr et al. Circulation. 2013; Nov 12. [Epub ahead of print]. Stone NJ et al. Circulation. 2013; Nov 12. [Epub ahead of print].
5
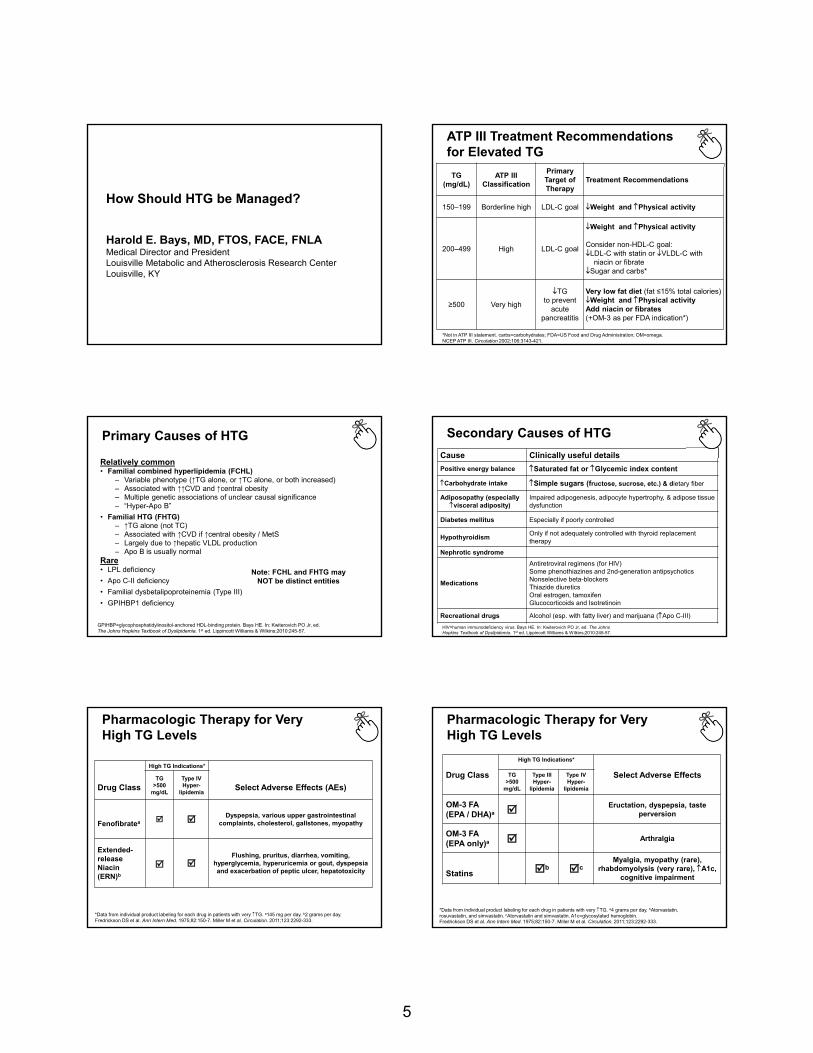
How Should HTG be Managed?
Harold E. Bays, MD, FTOS, FACE, FNLA Medical Director and President Louisville Metabolic and Atherosclerosis Research Center Louisville, KY
ATP III Treatment Recommendations for Elevated TG
TG (mg/dL)
ATP III Classification
Primary Target of Therapy
Treatment Recommendations
150–199 Borderline high LDL-C goal Weight and Physical activity
200–499 High LDL-C goal
Weight and Physical activity
Consider non-HDL-C goal:LDL-C with statin or VLDL-C with
niacin or fibrateSugar and carbs*
≥500 Very high
TGto prevent
acute pancreatitis
Very low fat diet (fat ≤15% total calories)Weight and Physical activityAdd niacin or fibrates(+OM-3 as per FDA indication*)
*Not in ATP III statement. carbs=carbohydrates; FDA=US Food and Drug Administration; OM=omega. NCEP ATP III. Circulation 2002;106:3143-421.
Primary Causes of HTG
Relatively common• Familial combined hyperlipidemia (FCHL)
– Variable phenotype (↑TG alone, or ↑TC alone, or both increased)– Associated with ↑↑CVD and ↑central obesity– Multiple genetic associations of unclear causal significance– “Hyper-Apo B”
• Familial HTG (FHTG)– ↑TG alone (not TC)– Associated with ↑CVD if ↑central obesity / MetS– Largely due to ↑hepatic VLDL production– Apo B is usually normal
Rare• LPL deficiency
• Apo C-II deficiency
• Familial dysbetalipoproteinemia (Type III)
• GPIHBP1 deficiency
GPIHBP=glycophosphatidylinositol-anchored HDL-binding protein. Bays HE. In: Kwiterovich PO Jr, ed. The Johns Hopkins Textbook of Dyslipidemia. 1st ed. Lippincott Williams & Wilkins;2010:245-57.
Note: FCHL and FHTG may NOT be distinct entities
Secondary Causes of HTG
HIV=human immunodeficiency virus. Bays HE. In: Kwiterovich PO Jr, ed. The Johns Hopkins Textbook of Dyslipidemia. 1st ed. Lippincott Williams & Wilkins;2010:245-57.
Cause Clinically useful details
Positive energy balance Saturated fat or Glycemic index content
Carbohydrate intake Simple sugars (fructose, sucrose, etc.) & dietary fiber
Adiposopathy (especially visceral adiposity)
Impaired adipogenesis, adipocyte hypertrophy, & adipose tissue dysfunction
Diabetes mellitus Especially if poorly controlled
HypothyroidismOnly if not adequately controlled with thyroid replacement therapy
Nephrotic syndrome
Medications
Antiretroviral regimens (for HIV) Some phenothiazines and 2nd-generation antipsychoticsNonselective beta-blockers Thiazide diureticsOral estrogen, tamoxifenGlucocorticoids and Isotretinoin
Recreational drugs Alcohol (esp. with fatty liver) and marijuana (Apo C-III)
Pharmacologic Therapy for Very High TG Levels
Drug Class
High TG Indications*
Select Adverse Effects (AEs)TG
>500 mg/dL
Type IV Hyper-
lipidemia
Fenofibratea Dyspepsia, various upper gastrointestinal complaints, cholesterol, gallstones, myopathy
Extended-release Niacin (ERN)b
Flushing, pruritus, diarrhea, vomiting,
hyperglycemia, hyperuricemia or gout, dyspepsia and exacerbation of peptic ulcer, hepatotoxicity
*Data from individual product labeling for each drug in patients with very TG. a145 mg per day. b2 grams per day. Fredrickson DS et al. Ann Intern Med. 1975;82:150-7. Miller M et al. Circulation. 2011;123:2292-333.
Pharmacologic Therapy for Very High TG Levels
Drug Class
High TG Indications*
Select Adverse EffectsTG >500
mg/dL
Type III Hyper-
lipidemia
Type IVHyper-
lipidemia
OM-3 FA (EPA / DHA)a Eructation, dyspepsia, taste
perversion
OM-3 FA (EPA only)a Arthralgia
Statins b cMyalgia, myopathy (rare),
rhabdomyolysis (very rare), A1c, cognitive impairment
*Data from individual product labeling for each drug in patients with very TG. a4 grams per day. bAtorvastatin, rosuvastatin, and simvastatin. cAtorvastatin and simvastatin. A1c=glycosylated hemoglobin.Fredrickson DS et al. Ann Intern Med. 1975;82:150-7. Miller M et al. Circulation. 2011;123:2292-333.
6
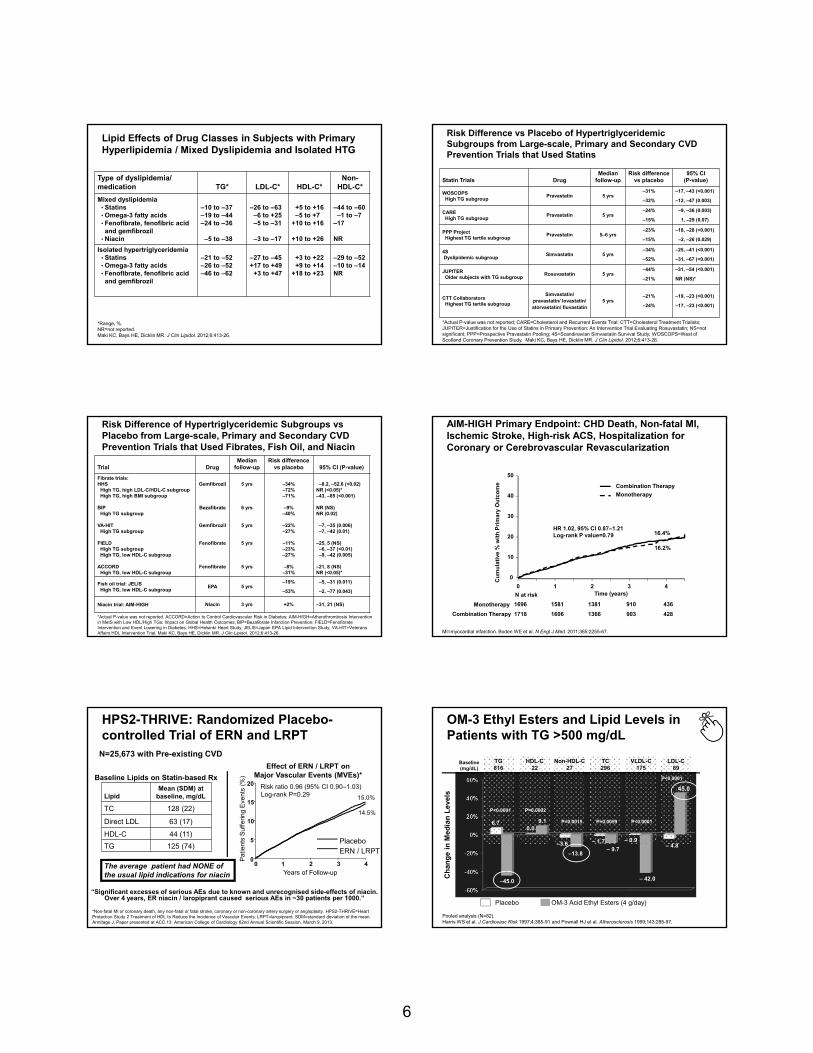
Lipid Effects of Drug Classes in Subjects with Primary Hyperlipidemia / Mixed Dyslipidemia and Isolated HTG
*Range, %.NR=not reported.Maki KC, Bays HE, Dicklin MR. J Clin Lipidol. 2012;6:413-26.
Type of dyslipidemia/ medication TG* LDL-C* HDL-C*
Non-HDL-C*
Mixed dyslipidemia• Statins• Omega-3 fatty acids• Fenofibrate, fenofibric acid and gemfibrozil
• Niacin
–10 to –37–19 to –44–24 to –36
–5 to –38
–26 to –63–6 to +25–5 to –31
–3 to –17
+5 to +16–5 to +7
+10 to +16
+10 to +26
–44 to –60–1 to –7
–17
NR
Isolated hypertriglyceridemia• Statins• Omega-3 fatty acids• Fenofibrate, fenofibric acid and gemfibrozil
–21 to –52–26 to –52–46 to –62
–27 to –45+17 to +49
+3 to +47
+3 to +22+9 to +14
+18 to +23
–29 to –52–10 to –14NR
Risk Difference vs Placebo of Hypertriglyceridemic Subgroups from Large-scale, Primary and Secondary CVD Prevention Trials that Used Statins
*Actual P-value was not reported; CARE=Cholesterol and Recurrent Events Trial; CTT=Cholesterol Treatment Trialists; JUPITER=Justification for the Use of Statins in Primary Prevention: An Intervention Trial Evaluating Rosuvastatin; NS=not significant; PPP=Prospective Pravastatin Pooling; 4S=Scandinavian Simvastatin Survival Study; WOSCOPS=West of Scotland Coronary Prevention Study. Maki KC, Bays HE, Dicklin MR. J Clin Lipidol. 2012;6:413-26.
Statin Trials DrugMedian
follow-upRisk difference
vs placebo95% CI
(P-value)
WOSCOPSHigh TG subgroup
Pravastatin 5 yrs–31%
–32%
–17, –43 (<0.001)
–12, –47 (0.003)
CAREHigh TG subgroup
Pravastatin 5 yrs–24%
–15%
–9, –36 (0.003)
1, –29 (0.07)
PPP ProjectHighest TG tertile subgroup
Pravastatin 5–6 yrs–23%
–15%
–18, –28 (<0.001)
–2, –26 (0.029)
4SDyslipidemic subgroup
Simvastatin 5 yrs–34%
–52%
–25, –41 (<0.001)
–31, –67 (<0.001)
JUPITEROlder subjects with TG subgroup
Rosuvastatin 5 yrs–44%
–21%
–31, –54 (<0.001)
NR (NS)*
CTT CollaboratorsHighest TG tertile subgroup
Simvastatin/ pravastatin/ lovastatin/ atorvastatin/ fluvastatin
5 yrs–21%
–24%
–19, –23 (<0.001)
–17, –23 (<0.001)
Trial DrugMedian
follow-upRisk difference
vs placebo 95% CI (P-value)
Fibrate trials:HHS
High TG, high LDL-C/HDL-C subgroupHigh TG, high BMI subgroup
BIPHigh TG subgroup
VA-HITHigh TG subgroup
FIELDHigh TG subgroupHigh TG, low HDL-C subgroup
ACCORDHigh TG, low HDL-C subgroup
Gemfibrozil
Bezafibrate
Gemfibrozil
Fenofibrate
Fenofibrate
5 yrs
6 yrs
5 yrs
5 yrs
5 yrs
–34%–72%–71%
–9%–40%
–22%–27%
–11%–23%–27%
–8%–31%
–8.2, –52.6 (<0.02)NR (<0.05)*–43, –85 (<0.001)
NR (NS)NR (0.02)
–7, –35 (0.006)–7, –42 (0.01)
–25, 5 (NS)–6, –37 (<0.01)–9, –42 (0.005)
–21, 8 (NS)NR (<0.05)*
Fish oil trial: JELISHigh TG, low HDL-C subgroup
EPA 5 yrs–19%
–53%
–5, –31 (0.011)
–2, –77 (0.043)
Niacin trial: AIM-HIGH Niacin 3 yrs +2% –31, 21 (NS)
*Actual P-value was not reported. ACCORD=Action to Control Cardiovascular Risk in Diabetes; AIM-HIGH=Atherothrombosis Intervention in MetS with Low HDL/High TGs: Impact on Global Health Outcomes; BIP=Bezafibrate Infarction Prevention; FIELD=Fenofibrate Intervention and Event Lowering in Diabetes; HHS=Helsinki Heart Study; JELIS=Japan EPA Lipid Intervention Study; VA-HIT=Veterans Affairs HDL Intervention Trial. Maki KC, Bays HE, Dicklin MR. J Clin Lipidol. 2012;6:413-26.
Risk Difference of Hypertriglyceridemic Subgroups vs Placebo from Large-scale, Primary and Secondary CVD Prevention Trials that Used Fibrates, Fish Oil, and Niacin
MI=myocardial infarction. Boden WE et al. N Engl J Med. 2011;365:2255-67.
Time (years)
Cu
mu
lati
ve %
wit
h P
rim
ary
Ou
tco
me
0
10
20
30
40
50
0 1 2 3 4
Monotherapy
Combination Therapy
HR 1.02, 95% CI 0.87–1.21Log-rank P value=0.79
N at risk
Monotherapy
Combination Therapy
1696
1718
1581
1606
1381
1366
910
903
436
428
16.2%
16.4%
AIM-HIGH Primary Endpoint: CHD Death, Non-fatal MI, Ischemic Stroke, High-risk ACS, Hospitalization for Coronary or Cerebrovascular Revascularization
*Non-fatal MI or coronary death, any non-fatal or fatal stroke, coronary or non-coronary artery surgery or angioplasty. HPS2-THRIVE=Heart Protection Study 2 Treatment of HDL to Reduce the Incidence of Vascular Events; LRPT=laropiprant; SDM=standard deviation of the mean. Armitage J. Paper presented at ACC.13: American College of Cardiology 62nd Annual Scientific Session. March 9, 2013.
LipidMean (SDM) at
baseline, mg/dL
TC 128 (22)
Direct LDL 63 (17)
HDL-C 44 (11)
TG 125 (74)
Baseline Lipids on Statin-based Rx
HPS2-THRIVE: Randomized Placebo-controlled Trial of ERN and LRPT
“Significant excesses of serious AEs due to known and unrecognised side-effects of niacin. Over 4 years, ER niacin / laropiprant caused serious AEs in ~30 patients per 1000.”
Years of Follow-up
Pa
tien
ts S
uff
erin
g E
ven
ts (
%)
15.0%
0 1 2 3 4 0
5
10
15
20
14.5%
Placebo ERN / LRPT
Log-rank P=0.29Risk ratio 0.96 (95% CI 0.90–1.03)
Effect of ERN / LRPT on Major Vascular Events (MVEs)*
N=25,673 with Pre-existing CVD
The average patient had NONE of the usual lipid indications for niacin
OM-3 Ethyl Esters and Lipid Levels in Patients with TG >500 mg/dL
Pooled analysis (N=82).Harris WS et al. J Cardiovasc Risk 1997;4:385-91 and Pownall HJ et al. Atherosclerosis 1999;143:285-97.
Placebo OM-3 Acid Ethyl Esters (4 g/day)
Baseline(mg/dL)
TG816
HDL-C22
Non-HDL-C27
TC296
VLDL-C175
LDL-C89
P<0.0001 P=0.0002
P=0.0015 P=0.0059 P<0.0001
P<0.0001
–45.0
6.70.0
9.1
–3.6
–13.8– 9.7
– 1.7 – 0.9
– 42.0
– 4.8
45.0
Ch
ang
e in
Med
ian
Lev
els
7
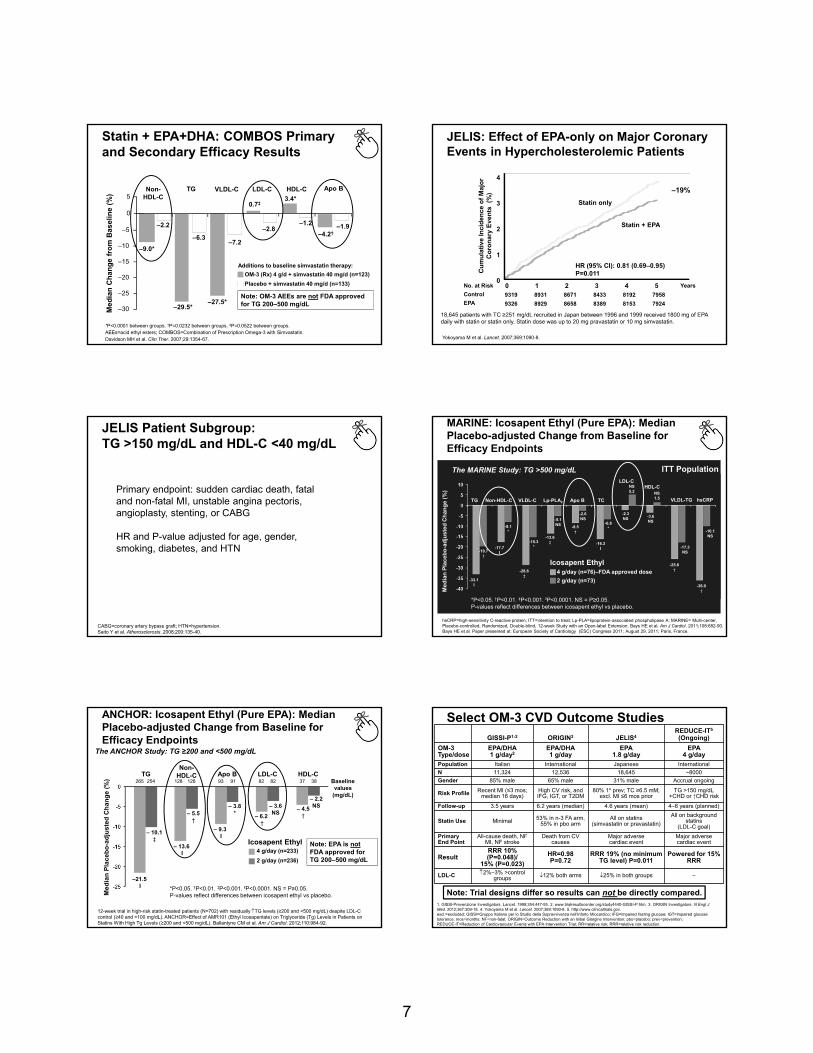
Statin + EPA+DHA: COMBOS Primary and Secondary Efficacy Results
Me
dia
n C
han
ge
fro
m B
asel
ine
(%)
TG LDL-C HDL-CVLDL-C
Additions to baseline simvastatin therapy:
5
–5
–10
–15
–20
–25
–30
3.4*
–6.3–7.2
–1.2–2.8
–29.5*
0.7‡
0
–27.5*
–4.2†–1.9
Apo BNon-HDL-C
–9.0*
–2.2
*P<0.0001 between groups. †P=0.0232 between groups. ‡P=0.0522 between groups.AEEs=acid ethyl esters; COMBOS=Combination of Prescription Omega-3 with Simvastatin.Davidson MH et al. Clin Ther. 2007;29:1354-67.
OM-3 (Rx) 4 g/d + simvastatin 40 mg/d (n=123)
Placebo + simvastatin 40 mg/d (n=133)
Note: OM-3 AEEs are not FDA approved for TG 200–500 mg/dL
JELIS: Effect of EPA-only on Major Coronary Events in Hypercholesterolemic Patients
Yokoyama M et al. Lancet. 2007;369:1090-8.
No. at Risk
Control
EPA
0 1 4 5 Years
9319 8931 8671 8433 8192 7958
9326 8929 8658 8389 8153 7924
Cu
mu
lati
ve
In
cid
en
ce
of
Ma
jor
Co
ron
ary
Ev
en
ts (
%)
4
P=0.011
Statin + EPA
Statin only3
2
1
0
HR (95% CI): 0.81 (0.69–0.95)
↓
2 3
–19%
18,645 patients with TC ≥251 mg/dL recruited in Japan between 1996 and 1999 received 1800 mg of EPA daily with statin or statin only. Statin dose was up to 20 mg pravastatin or 10 mg simvastatin.
CABG=coronary artery bypass graft; HTN=hypertension.Saito Y et al. Atherosclerosis. 2008;200:135-40.
JELIS Patient Subgroup: TG >150 mg/dL and HDL-C <40 mg/dL
Primary endpoint: sudden cardiac death, fatal and non-fatal MI, unstable angina pectoris, angioplasty, stenting, or CABG
HR and P-value adjusted for age, gender, smoking, diabetes, and HTN
MARINE: Icosapent Ethyl (Pure EPA): Median Placebo-adjusted Change from Baseline for Efficacy Endpoints
The MARINE Study: TG >500 mg/dL
TG Non-HDL-C VLDL-C Lp-PLA2 Apo B TC
Me
dia
n P
lace
bo
-ad
just
ed C
han
ge
(%)
LDL-CHDL-C
VLDL-TG
-33.1ǁ
-19.7 †
-17.7ǁ
-8.1*
-28.6‡
-15.3*
-13.6‡
-5.1NS -8.5
†
-2.6NS
-16.3ǁ
-6.8*
-2.3NS
NS5.2
-3.6NS
NS1.5
-25.8†
-17.3NS
4 g/day (n=76)–FDA approved dose
2 g/day (n=73)-36.0
†
-10.1NS
hsCRP
hsCRP=high-sensitivity C-reactive protein; ITT=intention to treat; Lp-PLA=lipoprotein-associated phospholipase A; MARINE= Multi-center, Placebo-controlled, Randomized, Double-blind, 12-week Study with an Open-label Extension. Bays HE et al. Am J Cardiol. 2011;108:682-90. Bays HE et al. Paper presented at: European Society of Cardiology (ESC) Congress 2011; August 29, 2011; Paris, France.
ITT Population
*P<0.05. †P<0.01. ‡P<0.001. ǁP<0.0001. NS = P≥0.05.P-values reflect differences between icosapent ethyl vs placebo.
Icosapent Ethyl
ANCHOR: Icosapent Ethyl (Pure EPA): Median Placebo-adjusted Change from Baseline for Efficacy Endpoints
TGNon-
HDL-C Apo B
Me
dia
n P
lac
eb
o-a
dju
ste
d C
ha
ng
e (
%)
LDL-C HDL-C
–21.5ǁ
– 10.1‡
– 13.6ǁ
– 5.5†
– 9.3ǁ
– 3.8*
– 6.2†
– 3.6NS
– 4.5†
– 2.2NS
254265 8282128128 9193 3837 Baseline values
(mg/dL)
12-week trial in high-risk statin-treated patients (N=702) with residually TG levels (≥200 and <500 mg/dL) despite LDL-C control (≥40 and <100 mg/dL). ANCHOR=Effect of AMR101 (Ethyl Icosapentate) on Triglyceride (Tg) Levels in Patients on Statins With High Tg Levels (≥200 and <500 mg/dL). Ballantyne CM et al. Am J Cardiol. 2012;110:984-92.
*P<0.05. †P<0.01. ‡P<0.001. ǁP<0.0001. NS = P≥0.05.P-values reflect differences between icosapent ethyl vs placebo.
4 g/day (n=233)
2 g/day (n=236)
The ANCHOR Study: TG ≥200 and <500 mg/dL
Note: EPA is notFDA approved for TG 200–500 mg/dL
Icosapent Ethyl
GISSI-P1-2 ORIGIN3 JELIS4REDUCE-IT5
(Ongoing)
OM-3 Type/dose
EPA/DHA1 g/day2
EPA/DHA1 g/day
EPA1.8 g/day
EPA 4 g/day
Population Italian International Japanese International
N 11,324 12,536 18,645 ~8000
Gender 85% male 65% male 31% male Accrual ongoing
Risk Profile Recent MI (≤3 mos; median 16 days)
High CV risk, and IFG, IGT, or T2DM
80% 1o prev; TC ≥6.5 mM; excl. MI ≤6 mos prior
TG >150 mg/dL+CHD or ↑CHD risk
Follow-up 3.5 years 6.2 years (median) 4.6 years (mean) 4–6 years (planned)
Statin Use Minimal 53% in n-3 FA arm, 55% in pbo arm
All on statins(simvastatin or pravastatin)
All on background statins
(LDL-C goal)
Primary End Point
All-cause death, NF MI, NF stroke
Death from CV causes
Major adverse cardiac event
Major adverse cardiac event
ResultRRR 10% (P=0.048)/
15% (P=0.023)
HR=0.98P=0.72
RRR 19% (no minimum TG level) P=0.011
Powered for 15% RRR
LDL-C 2%–3% >control groups 12% both arms 25% in both groups –
Select OM-3 CVD Outcome Studies
1. GISSI-Prevenzione Investigators. Lancet. 1999;354:447-55. 2. www.trialresultscenter.org/study4440-GISSI-P.htm. 3. ORIGIN Investigators. N Engl J Med. 2012;367:309-18. 4. Yokoyama M et al. Lancet. 2007;369:1090-8. 5. http://www.clinicaltrials.gov. excl.=excluded; GISSI=Gruppo Italiano per lo Studio della Sopravvivenza nell’Infarto Miocardico; IFG=impaired fasting glucose; IGT=impaired glucose tolerance; mos=months; NF=non-fatal; ORIGIN=Outcome Reduction with an Initial Glargine Intervention; pbo=placebo; prev=prevention; REDUCE-IT=Reduction of Cardiovascular Events with EPA-Intervention Trial; RR=relative risk; RRR=relative risk reduction.
Note: Trial designs differ so results can not be directly compared.
8
AMR101 4 g/day
Placebo
Study duration ~4–6 yrs
Primary endpoint:
Prevention of 1st major CV
event
N=8000
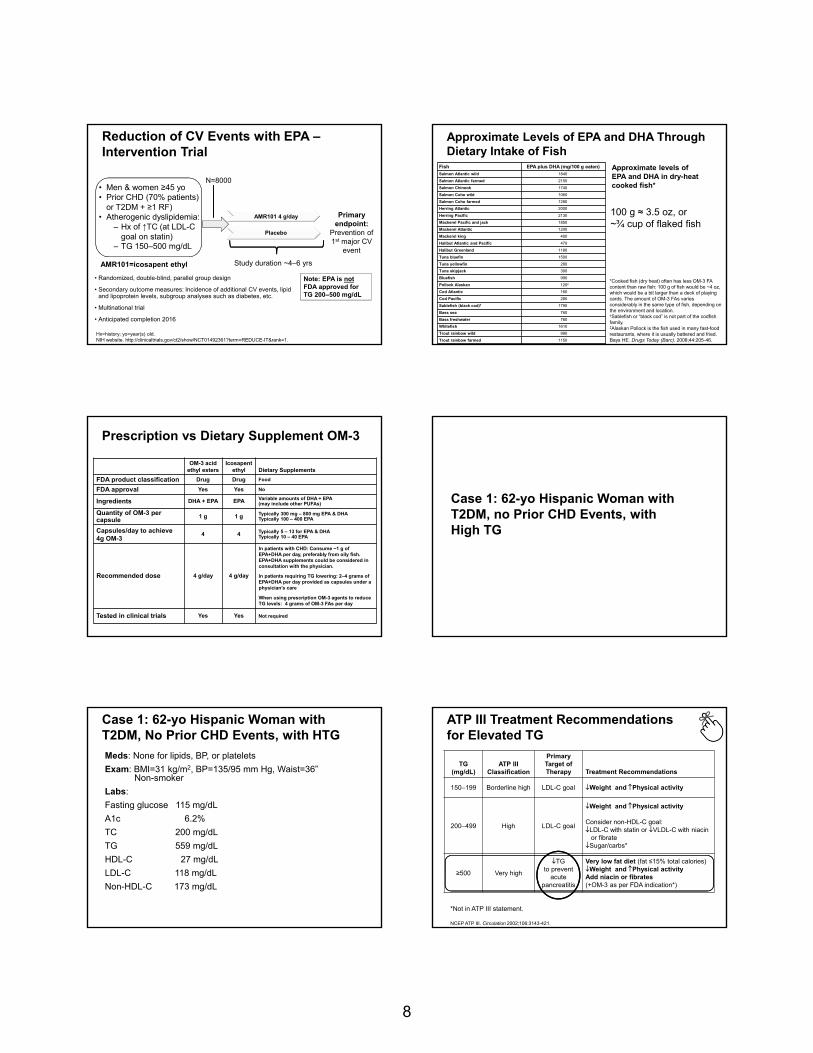
Reduction of CV Events with EPA –Intervention Trial
• Randomized, double-blind, parallel group design
• Secondary outcome measures: Incidence of additional CV events, lipid and lipoprotein levels, subgroup analyses such as diabetes, etc.
• Multinational trial
• Anticipated completion 2016
Hx=history; yo=year(s) old. NIH website. http://clinicaltrials.gov/ct2/show/NCT01492361?term=REDUCE-IT&rank=1.
• Men & women ≥45 yo• Prior CHD (70% patients)
or T2DM + ≥1 RF)• Atherogenic dyslipidemia:
– Hx of ↑TC (at LDL-C goal on statin)
– TG 150–500 mg/dL
AMR101=icosapent ethyl
Note: EPA is notFDA approved for TG 200–500 mg/dL
Approximate Levels of EPA and DHA Through Dietary Intake of Fish
100 g ≈ 3.5 oz, or ~¾ cup of flaked fish
Fish EPA plus DHA (mg/100 g eaten)
Salmon Atlantic wild 1840
Salmon Atlantic farmed 2150
Salmon Chinook 1740
Salmon Coho wild 1060
Salmon Coho farmed 1280
Herring Atlantic 2000
Herring Pacific 2130
Mackerel Pacific and jack 1850
Mackerel Atlantic 1200
Mackerel king 400
Halibut Atlantic and Pacific 470
Halibut Greenland 1180
Tuna bluefin 1500
Tuna yellowfin 280
Tuna skipjack 300
Bluefish 990
Pollock Alaskan 120‡
Cod Atlantic 160
Cod Pacific 280
Sablefish (black cod)† 1790
Bass sea 760
Bass freshwater 760
Whitefish 1610
Trout rainbow wild 990
Trout rainbow farmed 1150
*Cooked fish (dry heat) often has less OM-3 FA content than raw fish: 100 g of fish would be ~4 oz, which would be a bit larger than a deck of playing cards. The amount of OM-3 FAs varies considerably in the same type of fish, depending on the environment and location. †Sablefish or “black cod” is not part of the codfish family. ‡Alaskan Pollock is the fish used in many fast-food restaurants, where it is usually battered and fried.Bays HE. Drugs Today (Barc). 2008;44:205-46.
Approximate levels of EPA and DHA in dry-heat cooked fish*
Prescription vs Dietary Supplement OM-3
OM-3 acid ethyl esters
Icosapent ethyl Dietary Supplements
FDA product classification Drug Drug Food
FDA approval Yes Yes No
Ingredients DHA + EPA EPA Variable amounts of DHA + EPA (may include other PUFAs)
Quantity of OM-3 per capsule
1 g 1 g Typically 300 mg – 800 mg EPA & DHATypically 100 – 400 EPA
Capsules/day to achieve 4g OM-3
4 4 Typically 5 – 13 for EPA & DHATypically 10 – 40 EPA
Recommended dose 4 g/day 4 g/day
In patients with CHD: Consume ~1 g of EPA+DHA per day, preferably from oily fish. EPA+DHA supplements could be considered in consultation with the physician.
In patients requiring TG lowering: 2–4 grams of EPA+DHA per day provided as capsules under a physician’s care
When using prescription OM-3 agents to reduce TG levels: 4 grams of OM-3 FAs per day
Tested in clinical trials Yes Yes Not required
Case 1: 62-yo Hispanic Woman with T2DM, no Prior CHD Events, with High TG
Case 1: 62-yo Hispanic Woman with T2DM, No Prior CHD Events, with HTG
Meds: None for lipids, BP, or platelets
Exam: BMI=31 kg/m2, BP=135/95 mm Hg, Waist=36” Non-smoker
Labs:
Fasting glucose 115 mg/dL
A1c 6.2%
TC 200 mg/dL
TG 559 mg/dL
HDL-C 27 mg/dL
LDL-C 118 mg/dL
Non-HDL-C 173 mg/dL
ATP III Treatment Recommendations for Elevated TG
TG (mg/dL)
ATP III Classification
Primary Target of Therapy Treatment Recommendations
150–199 Borderline high LDL-C goal Weight and Physical activity
200–499 High LDL-C goal
Weight and Physical activity
Consider non-HDL-C goal:LDL-C with statin or VLDL-C with niacin
or fibrateSugar/carbs*
≥500 Very high
TGto prevent
acute pancreatitis
Very low fat diet (fat ≤15% total calories)Weight and Physical activityAdd niacin or fibrates(+OM-3 as per FDA indication*)
*Not in ATP III statement.
NCEP ATP III. Circulation 2002;106:3143-421.

9
Case 2: 49-yo Caucasian Man with T2DM, MI, and PCI 2 yrs Ago with Modestly Elevated TG
Michael Miller, MD
Case 2: 49-yo Caucasian Man with T2DM, MI, and PCI 2 yrs Ago with Modestly Elevated TG
Meds: Metformin 1000 mg bid, ASA 81 mg/d, atorvastatin 40 mg/d
Exam: BMI=29 kg/m2, BP=129/82 mm Hg, Waist=41”
LabsA1c 6.5%
TG 248 mg/dL
LDL-C 75 mg/dL
HDL-C 38 mg/dL
Non-HDL-C 139 mg/dL
ASA=aspirin; PCI=percutaneous coronary intervention.
Case 2: 49-yo Caucasian Man with T2DM, MI, and PCI 2 yrs Ago with Modestly Elevated TG
Meds: Metformin 1000 mg bid, ASA 81 mg/d, atorvastatin 40 mg/d
Exam: BMI=29 kg/m2, BP=129/82 mm Hg, Waist=41”
LabsA1c 6.5%
TG 248 mg/dL
LDL-C 75 mg/dL
HDL-C 38 mg/dL
Non-HDL-C 139 mg/dL
Case 2: Treatment Approach
Establish the patient’s risk status:49-yo man, T2DM, previous MI with PCI 2 yrs ago, non-smoker
Risk factor Patient
Gender: Male Yes: Male
Age: >45 years Yes: 49 years
Previous MI Yes
T2DM Yes: T2DM = CHD risk equivalent
MetS: 3 of 5 RFs1. Waist >40”2. Hyperglycemia3. HDL-C <40 mg/dL4. TG >150 mg/dL5. High BP
Yes: MetS (4 of 5)1. Yes, 41”2. Yes3. Yes, 38 mg/dL4. Yes, 248 mg/dL5. No: BP 129/82 mm Hg
This patient is very high risk
Risk status established, set goals for therapy
Residual CVD Risk in Major Statin Trials
4HPS Collaborative Group. Lancet. 2002;360:7-22. 5Shepherd J et al. N Engl J Med. 1995;333:1301-7.6 Downs JR et al. JAMA. 1998;279:1615-22.
14S Group. Lancet. 1994;344:1383-9.2LIPID Study Group. N Engl J Med. 1998;339:1349-57. 3Sacks FM et al. N Engl J Med. 1996;335:1001-9.
N 4444 4159 20,536 6595 66059014
Secondary High Risk Primary
Pa
tie
nts
Ex
pe
rie
nc
ing
M
ajo
r C
HD
E
ve
nts
, % Placebo
Statin19.4
12.310.2
8.75.5 6.8
28.0
15.913.2 11.8
7.910.9
CHD events occur in patients treated with statins
AFCAPS= Air Force Coronary Atherosclerosis Prevention Study; HPS=Heart Protection Study; LIPID= Long-term intervention with pravastatin in ischemic disease; TexCAPS=Texas Coronary Atherosclerosis Prevention Study.
Case 2: Goals for Therapy
Goal Patient Treatment
BP: Age ≥18 years with T2DM: Initiate Rx treatment when SBP is ≥140 mm Hg or DBP is ≥90 mm Hg (JNC8)*
129/82 mm Hg, Not on BP Rx
No treatment needed at this point
LDL-C: <100 mg/dL, optional <70 mg/dL
75 mg/dLIs relatively low LDL-C misleading? Why? What to do?
Non-HDL-C: <130 (<100 optional)
139 mg/dLNon-HDL-C high on atorva 40! Needs non-HDL-C statin adjunct
TG: <150 mg/dL (target) 248 mg/dLAddress 2o factorsLikely needs TG statin adjunct
HDL-C >40 mg/dL (target) 38 mg/dL May need HDL-C statin adjunct
A1c: <6.5% 6.5% None: He is at goal on metformin
Waist: <40”BMI: 18.5–24.9 kg/m2
(Obese: >30 kg/m2)
41”29 kg/m2
Physical activity: 30–60 minutes of daily moderate aerobic activityDiet: ↓sugars, calories & alcohol
*James PA et al. JAMA. 2013; Dec 18. [Epub ahead of print]. DBP=diastolic BP; JNC=Joint National Committee.
10
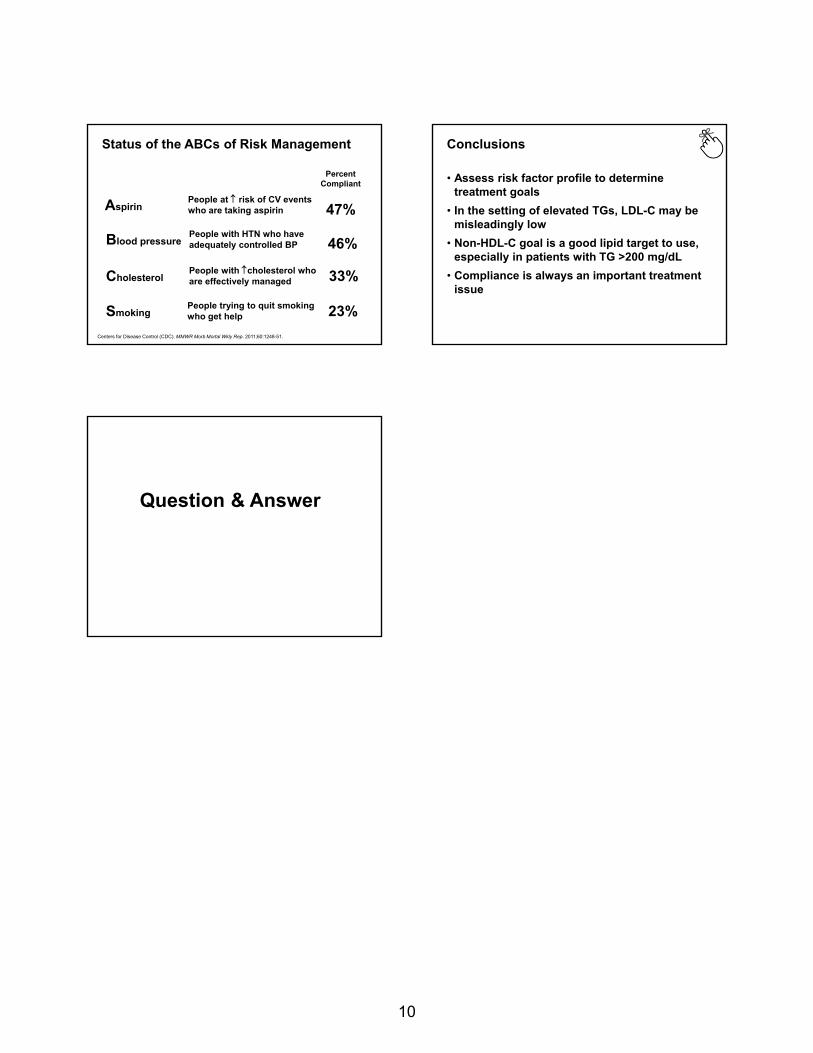
Status of the ABCs of Risk Management
Centers for Disease Control (CDC). MMWR Morb Mortal Wkly Rep. 2011;60:1248-51.
Percent Compliant
AspirinPeople at risk of CV events who are taking aspirin 47%
Blood pressurePeople with HTN who have adequately controlled BP 46%
CholesterolPeople with cholesterol who are effectively managed 33%
SmokingPeople trying to quit smoking who get help 23%
Conclusions
• Assess risk factor profile to determine treatment goals
• In the setting of elevated TGs, LDL-C may be misleadingly low
• Non-HDL-C goal is a good lipid target to use, especially in patients with TG >200 mg/dL
• Compliance is always an important treatment issue
Question & Answer