Embed Size (px)
Citation preview
Managing the land in a changing climate
Adaptation Sub-Committee Progress Report 2013
2 Managing the land in a changing climate | Adaptation Sub-Committee | Progress Report 2013
Contents
Foreword 3
Acknowledgements 5
The Adaptation Sub-Committee 6
Executive summary 8
Chapter 1: Introduction 13
Chapter 2: Provisioning services – agriculture and forestry 19
Chapter 3: Wildlife – semi-natural habitats 51
Chapter 4: Regulating services – upland peat 71
Chapter 5: Regulating services – coastal habitats 93
Chapter 6: Conclusions and forward look 109
Glossary 124
References 128
Images: Covers: Lone tree among the barley, Lincs Wolds. © Nicholas Silkstone 2012 and Chapter 2: © Caitlin Ferguson-Mir, www.Photoexpedition.co.uk
Foreword 3
1
Foreword
A central challenge in planning for the effects of climate change is how to handle uncertainty about the impacts of future climate. Most experts agree, however, that in addition to trends such as warming and sea level rise, we will experience more extreme weather in the future, as the atmosphere warms up and therefore contains more energy.
Although it is not possible to ascribe any one extreme event to climate change, it is likely that the pattern of extreme events seen in recent years will become the new normal. Extreme flooding in India and in Western Canada, and extreme heatwaves in the south-western USA, are just three recent examples. 2011 was the most expensive year on record for natural catastrophes worldwide. Six of the ten costliest global insurance losses since 1970 have been weather related, including the two most expensive hurricanes in US history, Katrina and Sandy.
The UK has not been immune. Last year, when the Adaptation Sub-Committee published its annual progress report, the country had just experienced its wettest spring on record, following on from a period of sustained drought. The 2012 report examined preparedness for both flooding and water scarcity, two of the most significant climate risks facing the country.
This year our report is equally timely. It examines what steps are required to ensure the land can continue supplying important goods and services in the face of a changing climate – specifically supplying food and timber, providing habitat for wildlife, storing carbon in the soil and regulating water flows, and coping with sea level rise on the coast. It comes after the wettest autumn since records began, followed by the coldest spring for more than 50 years. These weather conditions have reduced wheat yields by one third. As a consequence, food manufacturers have had to import nearly 2.5 million tonnes of wheat to meet the shortfall. In a normal year, the UK would export this amount of wheat.
The condition of the land is a key determinant of the country’s response to climate change. However, we find that progress in preparing the land for climate change has been slow. Farmers will only be able to take advantage of a longer growing season resulting from climate change if water or soil resources do not become limiting. Arable and horticultural crops, in particular, are concentrated in the driest parts of the country. There is mixed evidence on whether or not the water intensity of agriculture is increasing. At the same time, farming practices could be reducing soil fertility in some of the richest and most productive soils in the country.
Despite increased efforts in recent years to restore wildlife habitats, the proportion of protected sites in good condition is lower than ten years ago and the number of protected sites has not increased. This will make it harder for species to cope with the additional pressures that climate change brings. In the uplands, climate change will exacerbate habitat degradation and reduce the ability of peat soils to store carbon and regulate water flows.
4 Managing the land in a changing climate | Adaptation Sub-Committee | Progress Report 2013
Wildlife habitats on the coast face particular pressures from climate change. They also play an important role in helping the country cope with sea level rise, because they act as a buffer against storms and waves. However, three-quarters of coastal habitats are at risk of getting squeezed between rising sea levels and fixed defences.
Climate change adds to existing pressures on the land and brings to light difficult choices about how to manage the land so that it can continue to supply a range of goods and services. Our work identifies some important steps for the Government to enable appropriate action. The first is strengthening and streamlining the advice to farmers and other land managers on how to prepare for climate change. The second is ensuring that existing policies to protect and enhance the natural environment are implemented in full. The final is ensuring that the value of the services provided by the land to society are better reflected in the decisions of landowners in how to manage the land.
Lord John Krebs Kt FRS
Acknowledgements 5
1
Acknowledgements
The Adaptation Sub-Committee would like to thank:
The core team that prepared the analysis for this report: this team was led by Sebastian Catovsky and included Kathryn Humphrey, Ibukunoluwa Ibitoye, Kiran Sura, David Thompson, Alex Townsend and Lola Vallejo.
Other members of the secretariat that contributed to the report: Delali Foli and Joanne McMenamin.
Government Economic Service and Masters students that contributed to the report: Suzie Harrison and Thomas Harrison.
Organisations and individuals that carried out research for this report: Cranfield University (Dr Andre Daccache, Dr Anil Graves, Dr Jerry Knox, Prof Joe Morris, and Prof Keith Weatherhead), Scotland’s Rural College (Dr Andy Evans, Naomi Fox, Dr Klaus Glenk, Dr Mike Hutchings, Dr Davy McCracken, Alistair McVittie, Prof Malcolm Mitchell, Prof Dominic Moran, Andrew Moxey, Dr Kairsty Topp, Dr Eileen Wall and Dr Anita Wreford), Environmental Change Institute at the University of Oxford (Simon Abele, Dr Pam Berry, Dr Rob Dunford and Dr Paula Harrison), HR Wallingford (Valerie Bain, Leonore Boelee, Eleanor Hall, Alison Hopkin, Michael Panzeri and Dr Steven Wade) Climate Resilience Ltd (Mike Harley), Forest Research (Dr James Morrison) and URS (Stephen Cox, Lili Pechey, Petrina Rowcroft and Chris White).
Peer reviewers of our research and analysis: Prof Nigel Arnell (Walker Institute, University of Reading), Prof Ian Bateman (University of East Anglia), Prof Ian Crute (Agriculture and Horticulture Development Board), Prof Tim Benton (University of Leeds), Prof Andy Bradbury (University of Southampton), Dr Iain Brown (The James Hutton Institute), Prof Richard Dawson (Newcastle University), Robert Evans (University of East Anglia), Dr Tara Garnett (University of Oxford), Prof Charles Godfray (University of Oxford), Prof David Harvey (University of Newcastle), Prof Dieter Helm (University of Oxford), Prof Sir John Lawton, Prof Gerd Masselink (Plymouth University), Dr Iris Möller (University of Cambridge), Paul Morling (RSPB), Prof Robert Nicholls (University of Southampton), Andres Payo (University of Oxford), Prof Pete Smith (University of Aberdeen), Prof Alan Swinbank (University of Reading), Prof Tim Wheeler (University of Reading) and Prof Andy Whitmore (Rothamsted Research).
Organisations that have provided feedback on our research and analysis: ABPmer, Animal Health and Veterinary Laboratories Agency, Agriculture and Horticulture Development Board, Anglian Water, Atkins, Centre for Ecology and Hydrology, Country Land and Business Association, Department for the Environment, Food and Rural Affairs, Department of Communities and Local Government, Environment Agency, Food and Environment Research Agency, Forestry Commission, Halcrow, Institute of Civil Engineers, International Union of Nature Conservation, Moors for the Future, National Farmers Union, National Trust, Natural England, North Pennines Area of Outstanding Natural Beauty Partnership, Coastal Groups, Local Government Association, Ricardo AEA, Royal Society for the Protection of Birds, Thames Water, UK National Ecosystem Assessment Secretariat, United Utilities and Yorkshire Water.
6 Managing the land in a changing climate | Adaptation Sub-Committee | Progress Report 2013
The Adaptation Sub-Committee
Lord John Krebs, ChairProfessor Lord Krebs Kt FRS is currently Principal of Jesus College Oxford. Previously, he held posts at the University of British Columbia, the University of Wales, and Oxford, where he was lecturer in Zoology, 1976-88, and Royal Society Research Professor, 1988-2005. From 1994-1999, he was Chief Executive of the Natural Environment Research Council and, from 2000-2005, Chairman of the Food Standards Agency. He is a member of the U.S. National Academy of Sciences. He is chairman of the House of Lords Science & Technology Select Committee and President of the British Science Association.
Professor Samuel FankhauserProfessor Samuel Fankhauser is Co-Director of the Grantham Research Institute on Climate Change at the London School of Economics and a Director at Vivid Economics. He is a former Deputy Chief Economist of the European Bank for Reconstruction and Development.
Professor Jim HallProfessor Jim Hall FREng is Director of the Environmental Change Institute at Oxford University where he is Professor of Climate and Environmental Risks. A chartered engineer by background, Prof Hall has pioneered the use of probabilistic methods in flood risk assessment and water resource systems. He is Associate Editor of the Journal of Flood Risk Management and Fellow of the Royal Statistical Society.

The Adaptation Sub-Committee 7
1
Professor Dame Anne JohnsonProfessor Dame Anne Johnson FMedSci is a public health doctor. She is Professor of Infectious Disease Epidemiology and Chair of the Grand Challenge for Global Health at University College London (UCL). She was a member of the UCL/Lancet Commission report on managing the health effects of climate change. She was previously Chair of the Medical Research Council Population Health Sciences Group. She is a Wellcome Trust governor.
Sir Graham WynneSir Graham Wynne is a former Chief Executive and Director of Conservation of the RSPB. He is currently a Special Adviser to the Prince of Wales’ International Sustainability Unit (ISU), a trustee of Green Alliance, a member of the Board of the Institute for European Environmental Policy and Chair of the Harapan Rainforest Foundation in Indonesia, and a Trustee of Green Alliance. He was a member of the Policy Commission on the Future of Farming and Food, the Sustainable Development Commission, the Foresight Land Use Futures Group and England’s Wildlife Network Review Panel. His early career was in urban planning and inner city regeneration.
Professor Martin ParryProfessor Martin Parry is a visiting Professor at Imperial College and was Co-Chair of Working of Group II (Impacts, Adaptation and Vulnerability) of the Intergovernmental Panel on Climate Change’s (IPCC) 2007 Assessment Report. He was chairman of the UK Climate Change Impacts Review Group, and a coordinating lead author in the IPCC first, second and third assessments. He has worked at the Universities of Oxford, University College London, Birmingham and University of East Anglia.
8 Managing the land in a changing climate | Adaptation Sub-Committee | Progress Report 2013
Executive summary
This report is part of a series of annual progress reports by the Adaptation Sub-Committee to assess how the country is preparing for the major risks and opportunities from climate change. Together these reports will provide the baseline evidence for the Committee’s statutory report to Parliament on preparedness due in 2015.
Our report in July 2012 assessed preparedness for two of the largest risks identified by the UK Climate Change Risk Assessment: flood risk to people and property and availability of water for households and businesses.
This year’s report extends the work of the Committee to some of the key ecosystem services provided by the land.1 Specifically, the report addresses the use of land to continue to deliver essential goods and services in the face of a changing climate – supplying food and timber, providing habitat for wildlife, storing carbon in the soil, and coping with sea level rise on the coast. It explores the extent to which decisions about the land are helping the country to prepare for climate change.
Key messages• There are low-regret opportunities to make the natural capital of this country
more resilient to climate change. Ecosystems in good condition are more likely to cope with the additional pressures from climate change. Our analysis identifies early priorities for adaptation, which can yield immediate benefits, including:
– increasing the efficiency of water use in agriculture and on-farm water storage,
– managing agricultural soils sustainably,
– improving the condition and increasing the size of wildlife habitats,
– restoring carbon-rich peat soils in the uplands, and
– realigning some flood defences on the coast to create space for habitats that provide natural defences to migrate inland.
• The Government has set appropriate policy goals in some of these areas, but it is not clear how these goals will be met. In other cases there are policy gaps.
– The Government has a policy goal for half of all protected wildlife sites to be in good condition by 2020. The available data point to a decline in the proportion of sites in good condition from 42% to 37% over the last decade, but a large increase in the proportion that now have a management plan in place.
– Meeting the goal of realigning 10% of the coastline in England by 2030 requires a five-fold increase in the pace of effort from the current level of around 6 km of coastline each year to 30 km each year.
– There are no explicit policy goals on expanding the area of upland peat under restoration or increasing efficiency in agricultural water use.
1 We focus on England in this report, in line with our statutory duty under the UK Climate Change Act (2008) to report on progress in implementation of the UK Government’s National Adaptation Programme. This programme applies only to England for devolved matters, such as the environment. However, we have developed the mode of analysis in such a way that could be used to assess adaptation programmes in the devolved administrations if requested.
Executive summary 9
1
• In order to improve the resilience of ecosystems to climate change, the Government should ensure that current regulations are fully implemented. It should also ensure that the value of ecosystem services is reflected in decision-making.
– The Government should press on with its reform of the abstraction regime so that the price of water reflects its scarcity.
– To improve the condition of wildlife habitats and increase their size, the Government should ensure full implementation of existing regulations for protection of wildlife sites and provide stronger incentives for habitat restoration and creation.
– To increase the pace of peatland restoration, Government policy should establish an appropriate value for the carbon storage and water regulation services provided.
– The Environment Agency and local authorities should work together on a clear implementation programme to speed up the pace of realignment along appropriate stretches of coastline.
Advice and key findings• Providing food. The Government should press on with its reforms of the abstraction
regime to incentivise efficient management of water on farms. Advice to farmers should be strengthened and streamlined to ensure they are able to make the most of the latest research findings on preparing for climate change, including on good soil management and pest and disease control.
– Higher temperatures and longer growing seasons may provide opportunities for farmers in England to increase productivity and so benefit from potential increases in global food prices. However, farmers will not be able to take advantage of these opportunities if the productive capacity of the land becomes limited because of water scarcity, loss of soil fertility or persistent presence of pests and diseases.
– Much of the cropland in England is located in areas where water resources are already over-stretched. These pressures are likely to grow from the combined effects of climate change and increased demand from economic and population growth.
– Our modelling suggests that, if current trends were allowed to continue, a gap could emerge between water supply and demand. In a dry year in the 2020s the gap could be nearly as large as total current agricultural abstraction of 120 billion litres per year.
– Reform of the abstraction regime must ensure that the price of water reflects its scarcity. This is required to incentivise improved irrigation efficiency and investment in on-farm storage, and contribute to ensuring sufficient water supplies in the future to meet growing agricultural demands.
– Current farming practices may be depleting the productive capacity of some of the country’s richest soils. This is particularly the case in the East Anglian Fens, where some recent estimates suggest that the fertile peat topsoil could largely disappear within a few decades. The uptake of soil conservation techniques, such as reduced ploughing, is increasing in some locations. However, uptake is lower on the highest quality soils, posing a potential risk to long-term productive capacity.
10 Managing the land in a changing climate | Adaptation Sub-Committee | Progress Report 2013
– Reduced spending on applied research and knowledge transfer may be partly responsible for slower rates of increase in agricultural efficiency in the UK compared with many other European countries. Effective communication to farmers of new knowledge would enable them to respond better to increased weather variability, new pests and diseases, and growing pressures on water and soil resources.
• Providing habitats for wildlife. The condition and extent of wildlife habitats could be improved through fuller implementation of existing regulations and providing stronger incentives for habitat protection and creation. This will give wildlife the best chance of surviving in the face of the uncertain impacts of climate change.
– If action is not taken, climate change will add to existing pressures on wildlife, potentially accelerating species loss. Around 60% of species studied in this country show evidence of decline in recent decades.
– Wildlife habitats are fragmented as a result of decades of habitat loss and degradation. Only around one quarter of the remaining wildlife habitat in England comprises extensive tracts, mostly in the uplands.
– The proportion of protected wildlife sites that are in good condition has declined from 42% to 37% over the last decade, according to Natural England data. This is despite having some 8,000 km2 benefiting from restoration through agri-environment schemes under the Common Agricultural Policy and investment by water companies and charities. The majority of sites do now have management plans in place, which if fully implemented should result in them returning to good condition in time.
– Around 900 km2 of new habitat (mainly woods and heath) have been created since 1998. However, there have been very few additions to England’s protected sites over the last ten years.
– The Government should strengthen implementation of current regulations to tackle deep-seated and persistent pressures, such as water and air pollution, to restore wildlife sites to good condition, and to expand habitat area. The Government should incentivise further habitat restoration and creation by maintaining funding for agri-environment schemes through reforms to the Common Agricultural Policy and developing effective market mechanisms that place an economic value on nature, such as through biodiversity offsetting and payment for ecosystem services.
• Storing carbon in upland peat and regulating water flows. A tripling of the area of upland peat under restoration could be delivered through enforcing existing regulations and putting a price on the services provided by restored peatlands. This would help secure carbon stores worth billions of pounds against the risk of loss due to climate change and damaging land use practices.
– The majority of the 3,550 km2 of upland peat in England is currently in a degraded condition. The soil is no longer wet enough to allow peat-forming vegetation to develop. In many areas, dried-out peatlands are losing carbon to the atmosphere and into water systems.
Executive summary 11
1
– Restored peatlands are more likely to be able to survive climate change, as this gives new peat-forming vegetation the best chance of developing. Climate change could cause current assemblages of peat-forming vegetation to decline in extent by between one-half and two-thirds in England if the habitats remain degraded. This would increase carbon losses further and reduce the water-holding and filtering capacity of peat.
– There is an economic case for peatland restoration. The case becomes even stronger when risks associated with climate change are taken into account. Despite this, around two-thirds of degraded peat in the uplands currently have no clear plans for restoration.
– The Government should strengthen the policy framework to enable further restoration effort across the uplands. Specifically it should: (i) set an explicit policy goal to increase the area under restoration, (ii) review the enforcement of current regulations, and (iii) improve incentives for landowners to invest in restoration.
• Enhancing flood protection provided by coastal habitats. Realigning coastal defences in undeveloped locations will help to reduce risks of coastal flooding and habitat loss due to sea level rise. The Environment Agency and local authorities should work together on a clear implementation programme in order to speed up the rate of coastal realignment.
– Hard defences currently protect over half the coastline from flooding and erosion. Around half of these defences are buffered against waves and storm surges by coastal habitats. Sea level rise is likely to increase the spending requirement for coastal defence to £200 million each year by 2030, a 60% increase on current spending levels.
– Our analysis suggests that nearly three-quarters of intertidal habitats are at risk from sea level rise where they are blocked from migrating inland due to the presence of hard defences. This is known as “coastal squeeze”.
– Setting the defence line back from the coastline in selected locations, known as “managed realignment”, would help avoid this loss of coastal habitat and reduce the costs of coastal defences. Such action can have net economic benefit where the value of the protected land is relatively low.
– Local authorities have a goal to realign nearly 10% of the coastline by 2030 and nearly 15% by 2050. To meet this goal, the rate of realignment would need to increase five-fold from the current 6 km each year to 30 km each year. To date only 1% of the coast has been realigned, with plans for a further 0.8% to 2016.
– Achieving the 10% goal would create around 60 km2 of additional coastal habitat by 2030 at a cost of between £10 and £15 million each year. Over the long term, this would reduce flood defence costs by between £180 million and £380 million, and deliver environmental benefits worth between £80 million and £280 million. Around one-third of the agricultural land affected is likely to be high-grade, representing around 0.1% of the stock of such land in England. Even without realignment, some of this land may become inviable for conventional agricultural production due to intrusion of saltwater.
– Improving compensation arrangements to account for the value of ecosystem services provided by coastal habitats would help the Environment Agency and local authorities to meet their policy goals for coastal realignment.
12 Managing the land in a changing climate | Adaptation Sub-Committee | Progress Report 2013
Chapter 11.1 Aims of the report
1.2 Existing and future pressures on the supply of ecosystem services
1.3 Vulnerability of the supply of ecosystem services to climate change
1.4 Approach and scope of this report
Chapter 1: Introduction 13
1
Chapter 1:
Introduction
Key messages
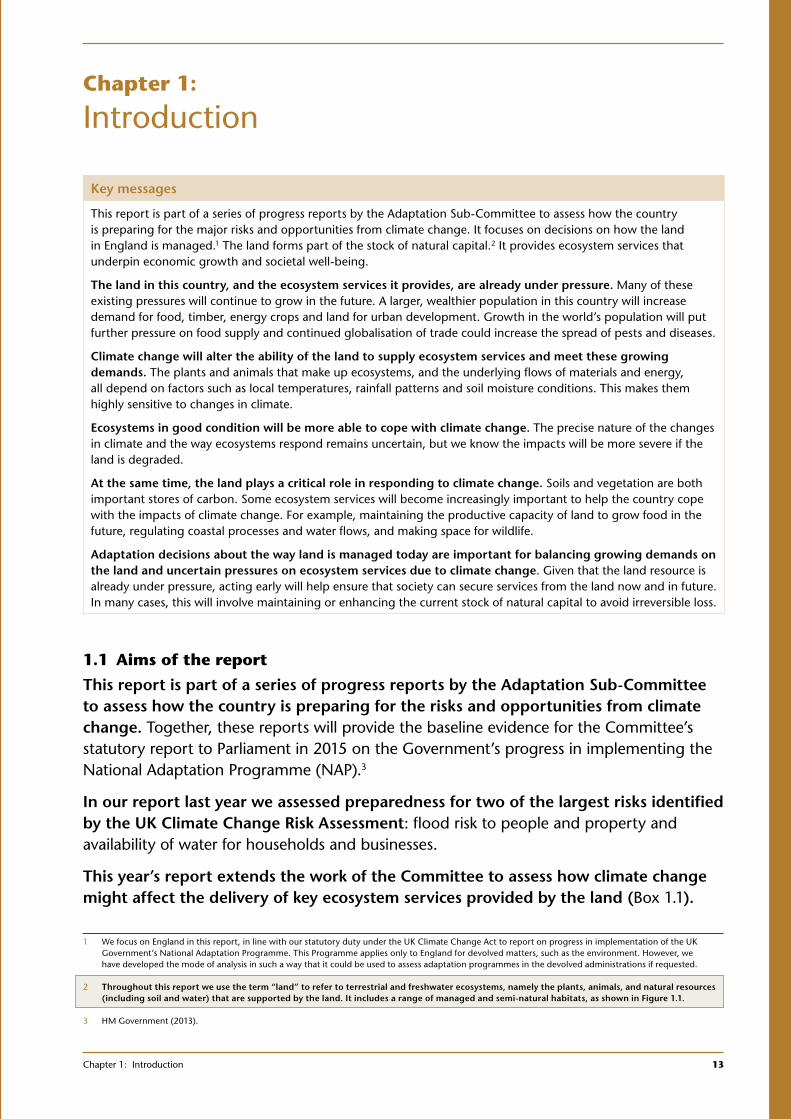
This report is part of a series of progress reports by the Adaptation Sub-Committee to assess how the country is preparing for the major risks and opportunities from climate change. It focuses on decisions on how the land in England is managed.1 The land forms part of the stock of natural capital.2 It provides ecosystem services that underpin economic growth and societal well-being.
The land in this country, and the ecosystem services it provides, are already under pressure. Many of these existing pressures will continue to grow in the future. A larger, wealthier population in this country will increase demand for food, timber, energy crops and land for urban development. Growth in the world’s population will put further pressure on food supply and continued globalisation of trade could increase the spread of pests and diseases.
Climate change will alter the ability of the land to supply ecosystem services and meet these growing demands. The plants and animals that make up ecosystems, and the underlying flows of materials and energy, all depend on factors such as local temperatures, rainfall patterns and soil moisture conditions. This makes them highly sensitive to changes in climate.
Ecosystems in good condition will be more able to cope with climate change. The precise nature of the changes in climate and the way ecosystems respond remains uncertain, but we know the impacts will be more severe if the land is degraded.
At the same time, the land plays a critical role in responding to climate change. Soils and vegetation are both important stores of carbon. Some ecosystem services will become increasingly important to help the country cope with the impacts of climate change. For example, maintaining the productive capacity of land to grow food in the future, regulating coastal processes and water flows, and making space for wildlife.
Adaptation decisions about the way land is managed today are important for balancing growing demands on the land and uncertain pressures on ecosystem services due to climate change. Given that the land resource is already under pressure, acting early will help ensure that society can secure services from the land now and in future. In many cases, this will involve maintaining or enhancing the current stock of natural capital to avoid irreversible loss.
1 2
1.1 Aims of the report
This report is part of a series of progress reports by the Adaptation Sub-Committee to assess how the country is preparing for the risks and opportunities from climate change. Together, these reports will provide the baseline evidence for the Committee’s statutory report to Parliament in 2015 on the Government’s progress in implementing the National Adaptation Programme (NAP).3
In our report last year we assessed preparedness for two of the largest risks identified by the UK Climate Change Risk Assessment: flood risk to people and property and availability of water for households and businesses.
This year’s report extends the work of the Committee to assess how climate change might affect the delivery of key ecosystem services provided by the land (Box 1.1).
1 We focus on England in this report, in line with our statutory duty under the UK Climate Change Act to report on progress in implementation of the UK Government’s National Adaptation Programme. This Programme applies only to England for devolved matters, such as the environment. However, we have developed the mode of analysis in such a way that it could be used to assess adaptation programmes in the devolved administrations if requested.
2 Throughout this report we use the term “land” to refer to terrestrial and freshwater ecosystems, namely the plants, animals, and natural resources (including soil and water) that are supported by the land. It includes a range of managed and semi-natural habitats, as shown in Figure 1.1.
3 HM Government (2013).
14 Managing the land in a changing climate | Adaptation Sub-Committee | Progress Report 2013
It explores the way that land is used in this country and the extent to which decisions about the land are helping the country to prepare for climate change.
Box 1.1: Land use and ecosystem services in England
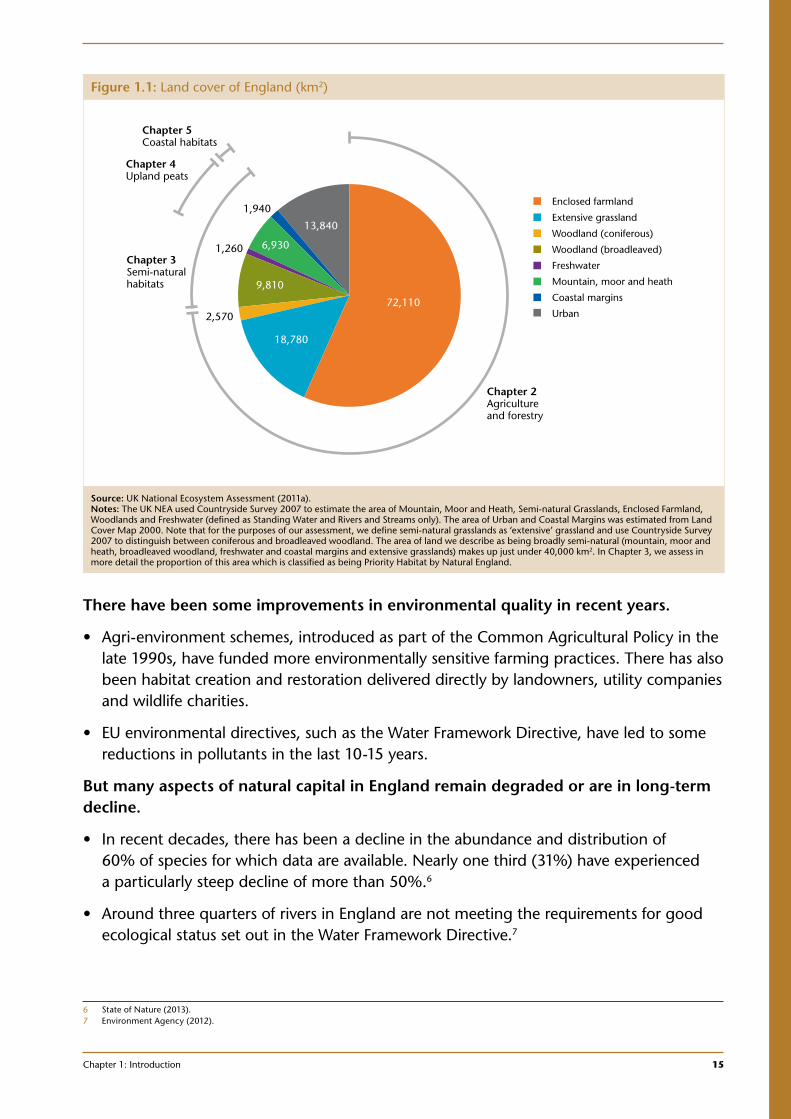
The land in England comprises a range of managed and semi-natural habitats (Figure 1.1). Around three quarters (73%) of the land is enclosed farmland, extensive grassland and coniferous forests primarily used to produce crops, livestock and timber. Around one tenth (11%) is built-up urban environment. The remaining area (16%) is formed of semi-natural land cover including broadleaved woodland, mountain, moor and heath, coastal margins and freshwater areas.
The stock of land provides a flow of ecosystem services that are important for societal well-being. These can be separated into four broad categories:
• Provisioning services – the goods people obtain from ecosystems, such as food and fibre, timber, and fuel in the form of biomass. These services have historically been a major focus of human activity and are generally easiest to value by the market.
• Regulating services – the benefits obtained from the regulation of ecosystem processes. These include the natural processes that provide services important for responding to climate change, including coastal protection, the control of the movement and purification of water, and carbon storage. They also include the regulation of pests and diseases and pollination services that are important for food production.
• Cultural services – the enjoyment of nature by society, such as through recreation. These services are provided by wildlife, semi-natural habitats and greenspaces, as well as by agricultural landscapes.
• Supporting services – the services that provide the basic infrastructure of life. They include the water cycle, soil formation and the capture of energy from the sun to produce complex organic compounds. All other ecosystem services ultimately depend on them.
Together with the marine environment and the atmosphere, the land forms the basis of natural capital in England. In combination with other types of capital, such as manufactured, human and social capital, natural capital forms part of national wealth.
Source: UK National Ecosystem Assessment (2011a) and Natural Capital Committee (2013).
1.2 Existing and future pressures on the supply of ecosystem services
The stock of land in England has been used primarily to produce food. Around 72,000 km2 (57%) of the land is enclosed farmland, mainly managed for crop and intensive livestock production. A further 19,000 km2 (15%) is extensive grassland used for low intensity farming.4
Along with industrialisation and urbanisation, food production has put pressure on other ecosystem services supplied by the land. Two of the main consequences have been:
• Loss and fragmentation of semi-natural habitats caused by the expansion of enclosed farmland in the lowlands and commercial forestry and heavy livestock grazing in the uplands, as well as the building of towns, cities and other infrastructure.
• Pollution, particularly eutrophication5 caused by fertilisers draining into rivers and watercourses, pesticide residues, and the deposition of sulphur and nitrogen from the air.
4 UK National Ecosystem Assessment (2011a). 5 Eutrophication is an increase in the concentration of nutrients in an ecosystem. This can lead to excessive plant growth, especially algae, which often causes
harm to other organisms.
Chapter 1: Introduction 15
1
There have been some improvements in environmental quality in recent years.
• Agri-environment schemes, introduced as part of the Common Agricultural Policy in the late 1990s, have funded more environmentally sensitive farming practices. There has also been habitat creation and restoration delivered directly by landowners, utility companies and wildlife charities.
• EU environmental directives, such as the Water Framework Directive, have led to some reductions in pollutants in the last 10-15 years.
But many aspects of natural capital in England remain degraded or are in long-term decline.
• In recent decades, there has been a decline in the abundance and distribution of 60% of species for which data are available. Nearly one third (31%) have experienced a particularly steep decline of more than 50%.6
• Around three quarters of rivers in England are not meeting the requirements for good ecological status set out in the Water Framework Directive.7
6 State of Nature (2013).7 Environment Agency (2012).
Figure 1.1: Land cover of England (km2)
Enclosed farmland
Extensive grassland
Woodland (coniferous)
Woodland (broadleaved)
Freshwater
Mountain, moor and heath
Coastal margins
Urban72,110
18,780
2,570
9,810
1,260 6,930
13,840
1,940
Chapter 5Coastal habitats
Chapter 4Upland peats
Chapter 3Semi-naturalhabitats
Chapter 2Agricultureand forestry
Source: UK National Ecosystem Assessment (2011a). Notes: The UK NEA used Countryside Survey 2007 to estimate the area of Mountain, Moor and Heath, Semi-natural Grasslands, Enclosed Farmland, Woodlands and Freshwater (defined as Standing Water and Rivers and Streams only). The area of Urban and Coastal Margins was estimated from Land Cover Map 2000. Note that for the purposes of our assessment, we define semi-natural grasslands as ‘extensive’ grassland and use Countryside Survey 2007 to distinguish between coniferous and broadleaved woodland. The area of land we describe as being broadly semi-natural (mountain, moor and heath, broadleaved woodland, freshwater and coastal margins and extensive grasslands) makes up just under 40,000 km2. In Chapter 3, we assess in more detail the proportion of this area which is classified as being Priority Habitat by Natural England.
16 Managing the land in a changing climate | Adaptation Sub-Committee | Progress Report 2013
Demand for services supplied by the land will continue to grow in the future putting further pressure on ecosystem services.
• The total population in England is expected to grow from 53 million today to around 67 million by 2050.8 The wealth of the population is also projected to increase over this period. This growth will increase demand for food, timber and energy crops, and land for urban development.
• The global population is forecast to rise from 7 billion today to 9 billion in 2050.9 This will add to growing demands for food, which in turn could result in higher food prices. This may encourage greater food production for export in England. The spread of pests and diseases could also increase if long-term trends of rising global trade continue.
1.3 Vulnerability of the supply of ecosystem services to climate change
Changes in climate are likely to alter the ability of the land to supply ecosystem services. The precise changes in climate in the future and the way ecosystems respond to them are both uncertain. Both positive and negative impacts on ecosystem services are likely to occur. Many of the downside risks could effectively be irreversible.
• Higher temperatures could have positive effects on agricultural yields and increase the number of growing season days. For example, the Climate Change Risk Assessment (CCRA) suggested that the effects of higher temperatures alone could increase yields for several major crops, including wheat.10 However, warmer temperatures could increase the risk of heat stress for livestock and hasten the spread of pests and diseases.
• Changes in climate space11 could bring some new species from the continent but could also lead to the loss of species at the edge of their range. Changes in animal species ranges have already been observed in the UK with an average northward shift of 14 to 25 km per decade for the most southerly distributed species.12
• Rising sea levels could lead to the loss of coastal habitats that help to prevent flooding and erosion, as well as the loss of agricultural land and increased risk to people and properties.
Changes in climate in other parts of the world will exacerbate pressures on the land in this country.13 International effects of climate change are likely to put additional pressure on global food supply, while population growth, income growth and associated dietary changes are expected to increase the demand for food. Given the UK may have a comparative advantage over food-producing regions at lower latitudes, this could increase the importance of the UK as a food-producing nation.
At the same time, the land plays a critical role in responding to climate change. Some ecosystem services will become increasingly important to help the country cope with the impacts of climate change, including:
8 Office for National Statistics (2011).9 United Nations, Department of Economic and Social Affairs, Population Division (2011).10 HR Wallingford (2012) for Defra.11 The geographical area which is suitable for a particular species, based on the climate parameters within which the species can survive and reproduce. See
Glossary for an extended definition.12 Morecroft, M. and Speakman, L. (eds.) (2013). 13 A recent study by PricewaterhouseCoopers (2013) highlights the importance of these international effects.
Chapter 1: Introduction 17
1
• Coastal habitats, which buffer coastal flood defences by dissipating or absorbing wave energy.
• Upland peats and agricultural soils, which help regulate water run-off and quality, and store carbon. Upland peats store an estimated 140 million tonnes of carbon.14
The effects of climate change will be worse if resources are degraded and habitats are in poor condition. For example:
• The agricultural sector will be less able to take advantage of longer growing seasons if water availability declines, if agricultural soils lose their productivity, or if pests and diseases become more prevalent.
• Species will be prevented from moving to different locations if semi-natural habitats are in poor condition or fragmented by development and other intensive land uses.
• New assemblages of peat-forming vegetation tolerant of warmer and drier conditions will be less able to develop unless peatlands maintain a higher water table.
• Coastal habitats will not be able to migrate inland in response to sea level rise if they are trapped by sea walls and flood embankments.
1.4 Approach and scope of this report
This report explores how decisions on the management of the major land uses in England are affecting the supply of ecosystem services in a changing climate. We explore the role of the land in supplying key ecosystem services (Figure 1.1), including:
• Providing food and timber (Chapter 2). Currently, farmlands in the UK produce the equivalent of 60% of the food consumed in the UK.15 Timber production contributes £1.7 billion in Gross Value Added to the UK economy.16
• Providing habitats for wildlife (Chapter 3). England supports at least 55,000 species within a range of habitats.17 Some of these are of European and global importance.
• Supplying regulating services important for responding to climate change (Chapter 4 and 5). Upland peat soils are important carbon stores and regulate freshwater supplies. Coastal habitats currently help protect 200,000 properties and 1,500 km2 of land from erosion and flooding.18
We identify a number of priority adaptation actions and develop a series of indicators to help measure progress. Our analysis highlights areas where policy could be targeted or better implemented. It focuses on two types of priority adaptation action: low-regret actions that deliver benefits whatever climate unfolds; and decisions involving long-term consequences. For each of the main land uses we develop a series of indicators that can be used to evaluate progress of the NAP.
14 Natural England (2010).15 Defra (2013b).16 Office for National Statistics.17 Lawton et al. (2010).18 Environmental Change Institute et al. (2013) for the Adaptation Sub-Committee.
18 Managing the land in a changing climate | Adaptation Sub-Committee | Progress Report 2013
Chapter 22.1 Agriculture – context
2.2 Water availability
2.3 Soil productivity
2.4 Technological capability and provision of advice to farmers
2.5 Assessing preparedness in forestry
2.6 Conclusions
Chapter 2: Provisioning services – agriculture and forestry 19
1
Chapter 2:
Provisioning services – agriculture and forestry
Key messages
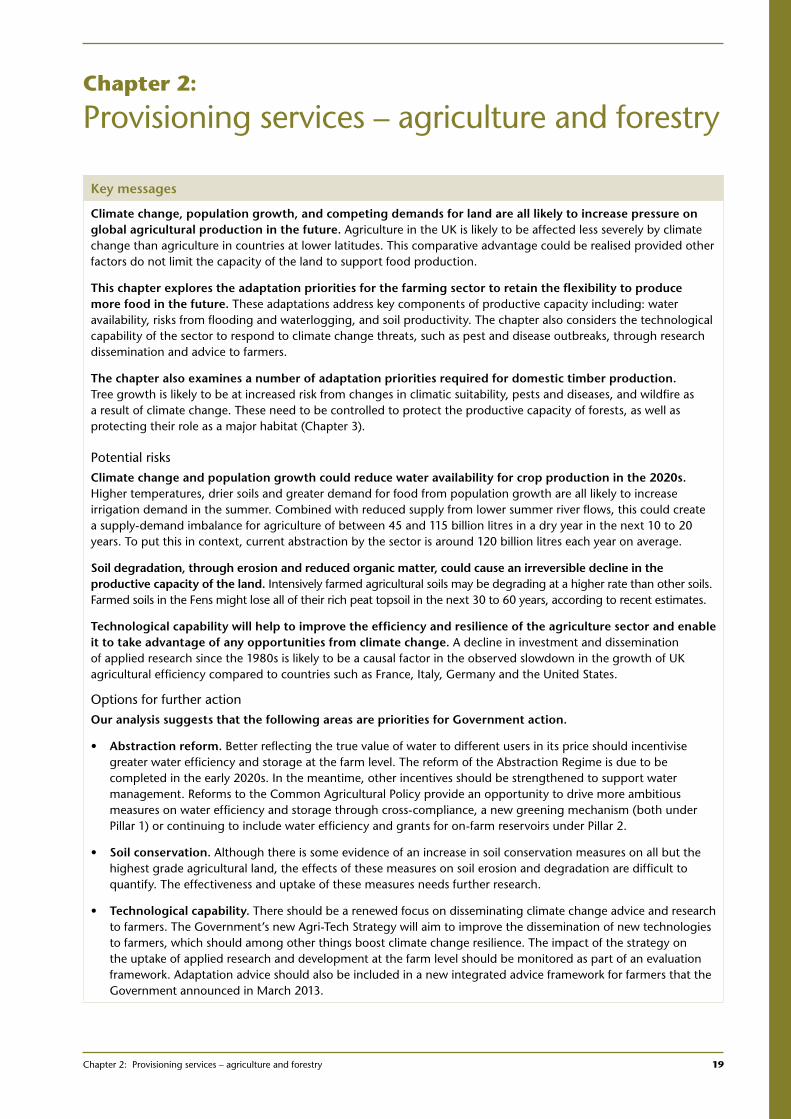
Climate change, population growth, and competing demands for land are all likely to increase pressure on global agricultural production in the future. Agriculture in the UK is likely to be affected less severely by climate change than agriculture in countries at lower latitudes. This comparative advantage could be realised provided other factors do not limit the capacity of the land to support food production.
This chapter explores the adaptation priorities for the farming sector to retain the flexibility to produce more food in the future. These adaptations address key components of productive capacity including: water availability, risks from flooding and waterlogging, and soil productivity. The chapter also considers the technological capability of the sector to respond to climate change threats, such as pest and disease outbreaks, through research dissemination and advice to farmers.
The chapter also examines a number of adaptation priorities required for domestic timber production. Tree growth is likely to be at increased risk from changes in climatic suitability, pests and diseases, and wildfire as a result of climate change. These need to be controlled to protect the productive capacity of forests, as well as protecting their role as a major habitat (Chapter 3).
Potential risksClimate change and population growth could reduce water availability for crop production in the 2020s. Higher temperatures, drier soils and greater demand for food from population growth are all likely to increase irrigation demand in the summer. Combined with reduced supply from lower summer river flows, this could create a supply-demand imbalance for agriculture of between 45 and 115 billion litres in a dry year in the next 10 to 20 years. To put this in context, current abstraction by the sector is around 120 billion litres each year on average.
Soil degradation, through erosion and reduced organic matter, could cause an irreversible decline in the productive capacity of the land. Intensively farmed agricultural soils may be degrading at a higher rate than other soils. Farmed soils in the Fens might lose all of their rich peat topsoil in the next 30 to 60 years, according to recent estimates.
Technological capability will help to improve the efficiency and resilience of the agriculture sector and enable it to take advantage of any opportunities from climate change. A decline in investment and dissemination of applied research since the 1980s is likely to be a causal factor in the observed slowdown in the growth of UK agricultural efficiency compared to countries such as France, Italy, Germany and the United States.
Options for further actionOur analysis suggests that the following areas are priorities for Government action.
• Abstraction reform. Better reflecting the true value of water to different users in its price should incentivise greater water efficiency and storage at the farm level. The reform of the Abstraction Regime is due to be completed in the early 2020s. In the meantime, other incentives should be strengthened to support water management. Reforms to the Common Agricultural Policy provide an opportunity to drive more ambitious measures on water efficiency and storage through cross-compliance, a new greening mechanism (both under Pillar 1) or continuing to include water efficiency and grants for on-farm reservoirs under Pillar 2.
• Soil conservation. Although there is some evidence of an increase in soil conservation measures on all but the highest grade agricultural land, the effects of these measures on soil erosion and degradation are difficult to quantify. The effectiveness and uptake of these measures needs further research.
• Technological capability. There should be a renewed focus on disseminating climate change advice and research to farmers. The Government’s new Agri-Tech Strategy will aim to improve the dissemination of new technologies to farmers, which should among other things boost climate change resilience. The impact of the strategy on the uptake of applied research and development at the farm level should be monitored as part of an evaluation framework. Adaptation advice should also be included in a new integrated advice framework for farmers that the Government announced in March 2013.
20 Managing the land in a changing climate | Adaptation Sub-Committee | Progress Report 2013
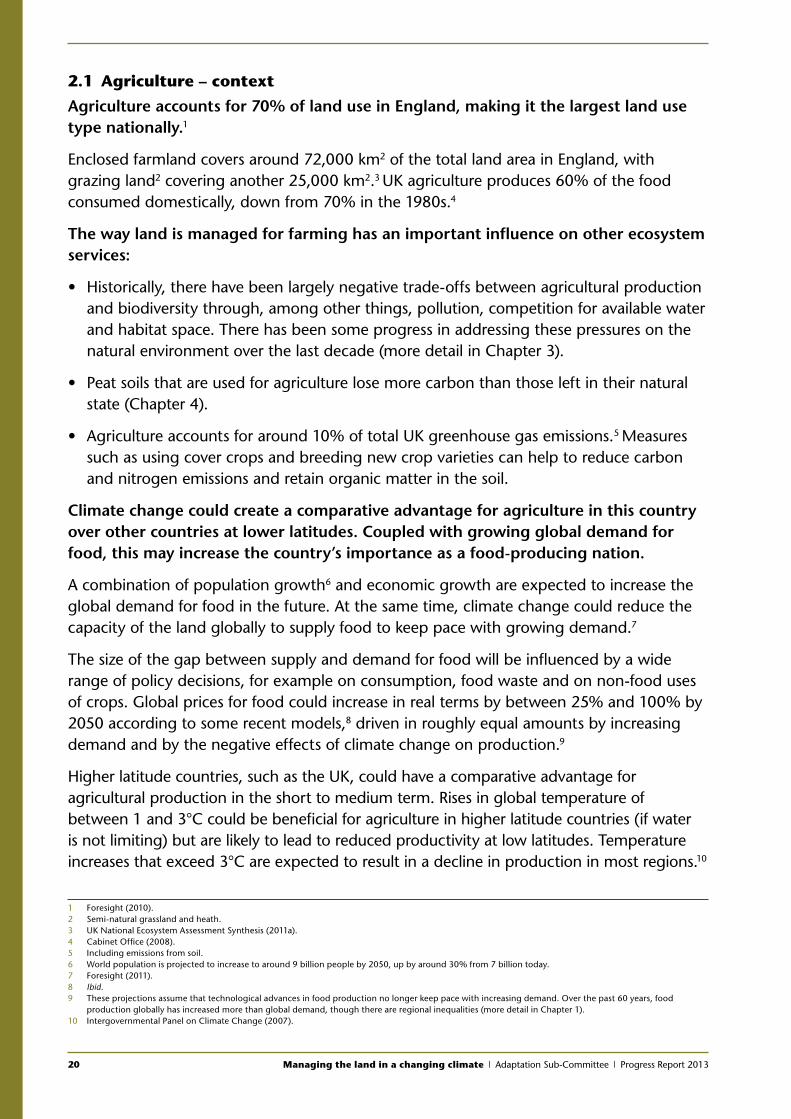
2.1 Agriculture – context
Agriculture accounts for 70% of land use in England, making it the largest land use type nationally.1
Enclosed farmland covers around 72,000 km2 of the total land area in England, with grazing land2 covering another 25,000 km2.3 UK agriculture produces 60% of the food consumed domestically, down from 70% in the 1980s.4
The way land is managed for farming has an important influence on other ecosystem services:
• Historically, there have been largely negative trade-offs between agricultural production and biodiversity through, among other things, pollution, competition for available water and habitat space. There has been some progress in addressing these pressures on the natural environment over the last decade (more detail in Chapter 3).
• Peat soils that are used for agriculture lose more carbon than those left in their natural state (Chapter 4).
• Agriculture accounts for around 10% of total UK greenhouse gas emissions.5 Measures such as using cover crops and breeding new crop varieties can help to reduce carbon and nitrogen emissions and retain organic matter in the soil.
Climate change could create a comparative advantage for agriculture in this country over other countries at lower latitudes. Coupled with growing global demand for food, this may increase the country’s importance as a food-producing nation.
A combination of population growth6 and economic growth are expected to increase the global demand for food in the future. At the same time, climate change could reduce the capacity of the land globally to supply food to keep pace with growing demand.7
The size of the gap between supply and demand for food will be influenced by a wide range of policy decisions, for example on consumption, food waste and on non-food uses of crops. Global prices for food could increase in real terms by between 25% and 100% by 2050 according to some recent models,8 driven in roughly equal amounts by increasing demand and by the negative effects of climate change on production.9
Higher latitude countries, such as the UK, could have a comparative advantage for agricultural production in the short to medium term. Rises in global temperature of between 1 and 3°C could be beneficial for agriculture in higher latitude countries (if water is not limiting) but are likely to lead to reduced productivity at low latitudes. Temperature increases that exceed 3°C are expected to result in a decline in production in most regions.10
1 Foresight (2010).2 Semi-natural grassland and heath.3 UK National Ecosystem Assessment Synthesis (2011a).4 Cabinet Office (2008).5 Including emissions from soil.6 World population is projected to increase to around 9 billion people by 2050, up by around 30% from 7 billion today.7 Foresight (2011).8 Ibid.9 These projections assume that technological advances in food production no longer keep pace with increasing demand. Over the past 60 years, food
production globally has increased more than global demand, though there are regional inequalities (more detail in Chapter 1).10 Intergovernmental Panel on Climate Change (2007).
Chapter 2: Provisioning services – agriculture and forestry 21
1
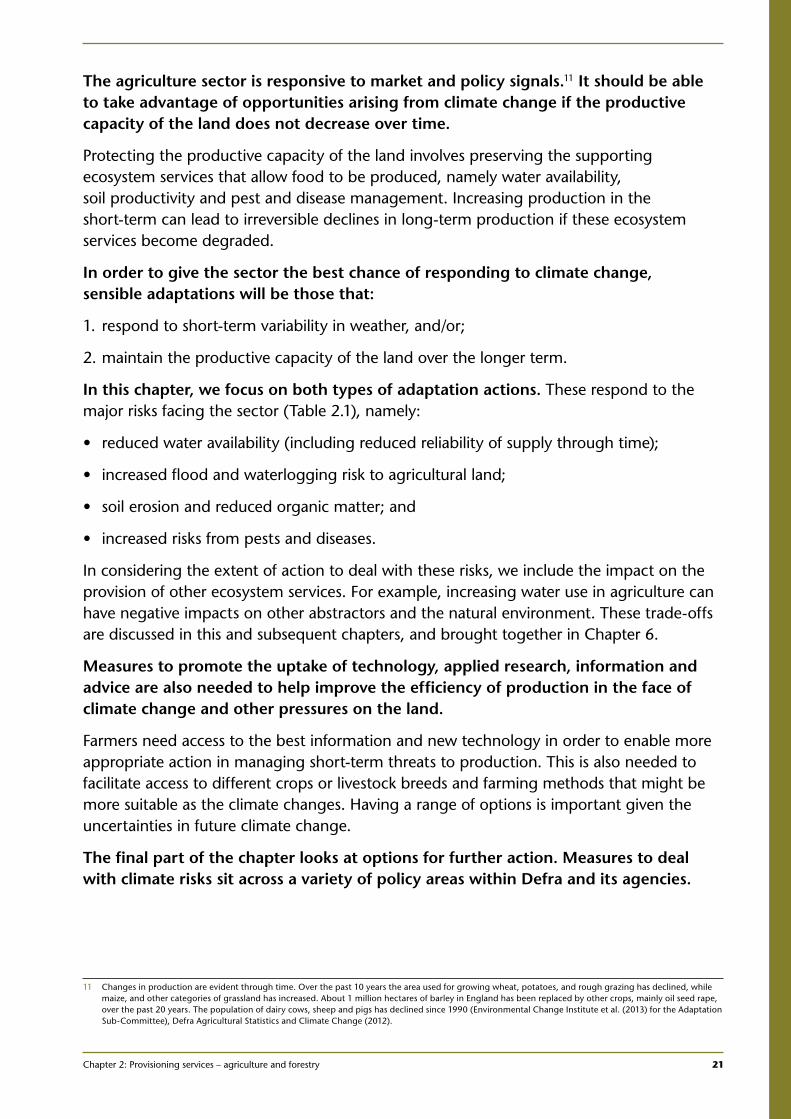
The agriculture sector is responsive to market and policy signals.11 It should be able to take advantage of opportunities arising from climate change if the productive capacity of the land does not decrease over time.
Protecting the productive capacity of the land involves preserving the supporting ecosystem services that allow food to be produced, namely water availability, soil productivity and pest and disease management. Increasing production in the short-term can lead to irreversible declines in long-term production if these ecosystem services become degraded.
In order to give the sector the best chance of responding to climate change, sensible adaptations will be those that:
1. respond to short-term variability in weather, and/or;
2. maintain the productive capacity of the land over the longer term.
In this chapter, we focus on both types of adaptation actions. These respond to the major risks facing the sector (Table 2.1), namely:
• reduced water availability (including reduced reliability of supply through time);
• increased flood and waterlogging risk to agricultural land;
• soil erosion and reduced organic matter; and
• increased risks from pests and diseases.
In considering the extent of action to deal with these risks, we include the impact on the provision of other ecosystem services. For example, increasing water use in agriculture can have negative impacts on other abstractors and the natural environment. These trade-offs are discussed in this and subsequent chapters, and brought together in Chapter 6.
Measures to promote the uptake of technology, applied research, information and advice are also needed to help improve the efficiency of production in the face of climate change and other pressures on the land.
Farmers need access to the best information and new technology in order to enable more appropriate action in managing short-term threats to production. This is also needed to facilitate access to different crops or livestock breeds and farming methods that might be more suitable as the climate changes. Having a range of options is important given the uncertainties in future climate change.
The final part of the chapter looks at options for further action. Measures to deal with climate risks sit across a variety of policy areas within Defra and its agencies.
11 Changes in production are evident through time. Over the past 10 years the area used for growing wheat, potatoes, and rough grazing has declined, while maize, and other categories of grassland has increased. About 1 million hectares of barley in England has been replaced by other crops, mainly oil seed rape, over the past 20 years. The population of dairy cows, sheep and pigs has declined since 1990 (Environmental Change Institute et al. (2013) for the Adaptation Sub-Committee), Defra Agricultural Statistics and Climate Change (2012).
22 Managing the land in a changing climate | Adaptation Sub-Committee | Progress Report 2013
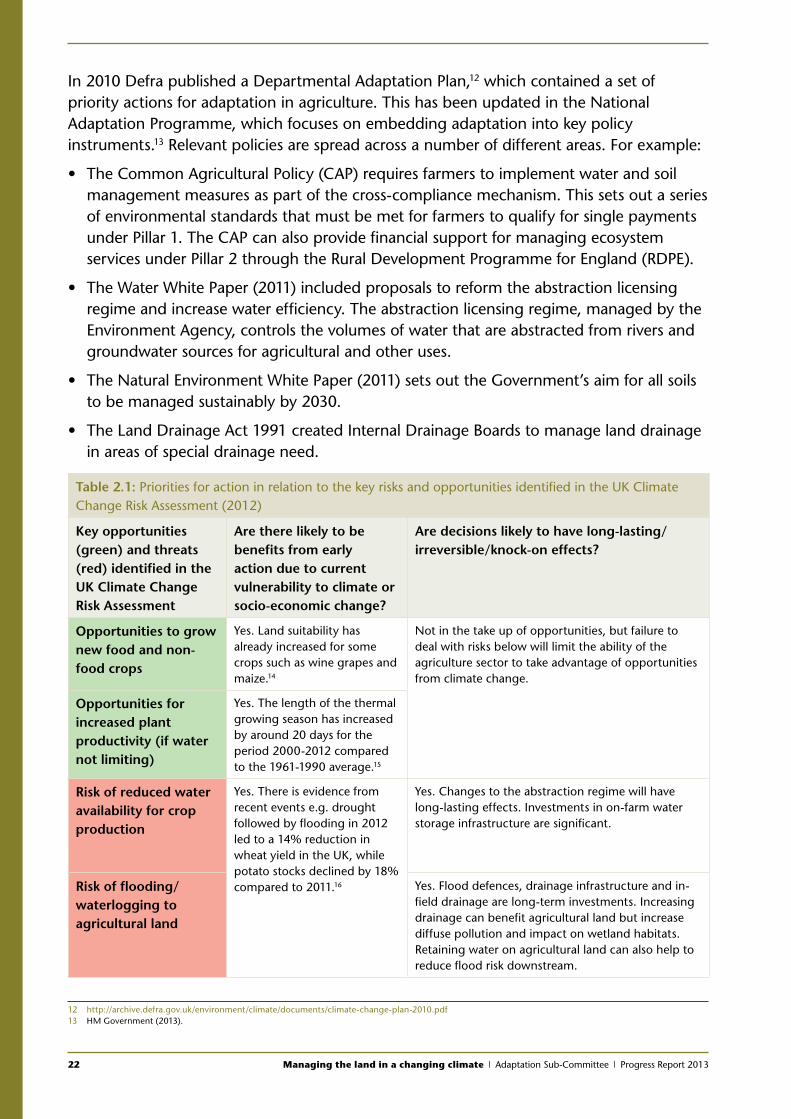
In 2010 Defra published a Departmental Adaptation Plan,12 which contained a set of priority actions for adaptation in agriculture. This has been updated in the National Adaptation Programme, which focuses on embedding adaptation into key policy instruments.13 Relevant policies are spread across a number of different areas. For example:
• The Common Agricultural Policy (CAP) requires farmers to implement water and soil management measures as part of the cross-compliance mechanism. This sets out a series of environmental standards that must be met for farmers to qualify for single payments under Pillar 1. The CAP can also provide financial support for managing ecosystem services under Pillar 2 through the Rural Development Programme for England (RDPE).
• The Water White Paper (2011) included proposals to reform the abstraction licensing regime and increase water efficiency. The abstraction licensing regime, managed by the Environment Agency, controls the volumes of water that are abstracted from rivers and groundwater sources for agricultural and other uses.
• The Natural Environment White Paper (2011) sets out the Government’s aim for all soils to be managed sustainably by 2030.
• The Land Drainage Act 1991 created Internal Drainage Boards to manage land drainage in areas of special drainage need.
Table 2.1: Priorities for action in relation to the key risks and opportunities identified in the UK Climate Change Risk Assessment (2012)
Key opportunities (green) and threats (red) identified in the UK Climate Change Risk Assessment
Are there likely to be benefits from early action due to current vulnerability to climate or socio-economic change?
Are decisions likely to have long-lasting/irreversible/knock-on effects?
Opportunities to grow new food and non-food crops
Yes. Land suitability has already increased for some crops such as wine grapes and maize.14
Not in the take up of opportunities, but failure to deal with risks below will limit the ability of the agriculture sector to take advantage of opportunities from climate change.
Opportunities for increased plant productivity (if water not limiting)
Yes. The length of the thermal growing season has increased by around 20 days for the period 2000-2012 compared to the 1961-1990 average.15
Risk of reduced water availability for crop production
Yes. There is evidence from recent events e.g. drought followed by flooding in 2012 led to a 14% reduction in wheat yield in the UK, while potato stocks declined by 18% compared to 2011.16
Yes. Changes to the abstraction regime will have long-lasting effects. Investments in on-farm water storage infrastructure are significant.
Risk of flooding/waterlogging to agricultural land
Yes. Flood defences, drainage infrastructure and in-field drainage are long-term investments. Increasing drainage can benefit agricultural land but increase diffuse pollution and impact on wetland habitats. Retaining water on agricultural land can also help to reduce flood risk downstream.
12 http://archive.defra.gov.uk/environment/climate/documents/climate-change-plan-2010.pdf 13 HM Government (2013).
Chapter 2: Provisioning services – agriculture and forestry 23
1
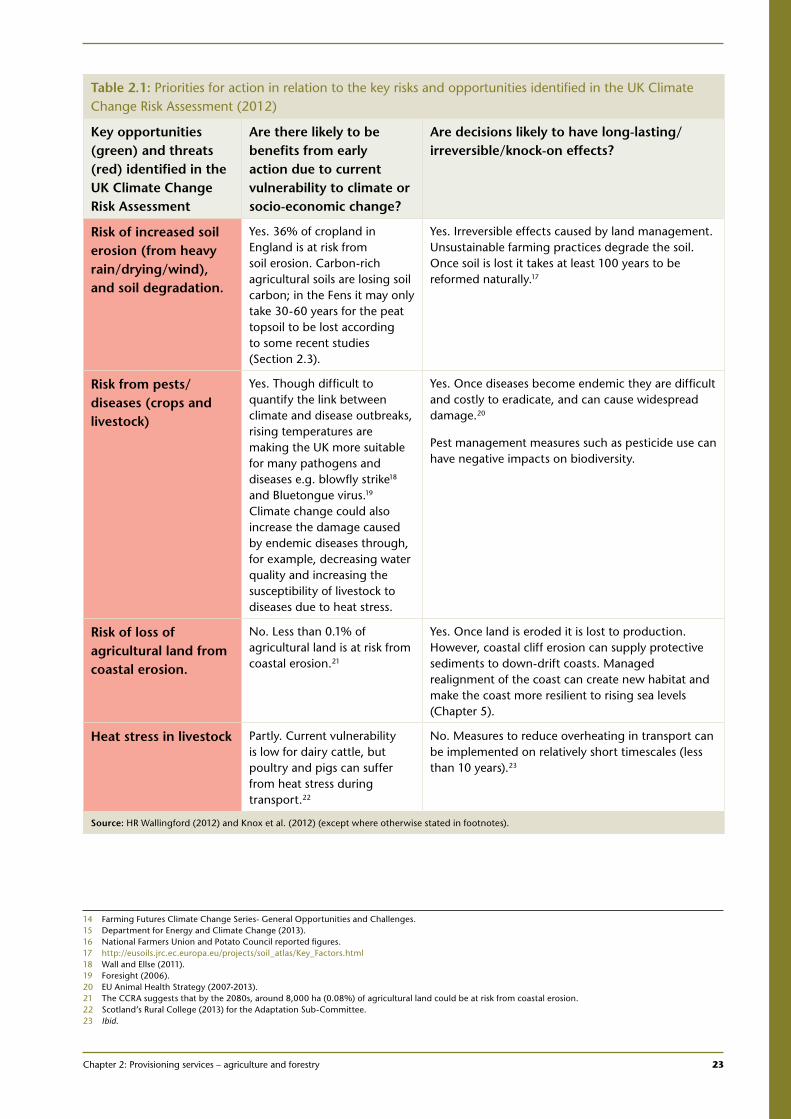
Table 2.1: Priorities for action in relation to the key risks and opportunities identified in the UK Climate Change Risk Assessment (2012)
Key opportunities (green) and threats (red) identified in the UK Climate Change Risk Assessment
Are there likely to be benefits from early action due to current vulnerability to climate or socio-economic change?
Are decisions likely to have long-lasting/irreversible/knock-on effects?
Risk of increased soil erosion (from heavy rain/drying/wind), and soil degradation.
Yes. 36% of cropland in England is at risk from soil erosion. Carbon-rich agricultural soils are losing soil carbon; in the Fens it may only take 30-60 years for the peat topsoil to be lost according to some recent studies (Section 2.3).
Yes. Irreversible effects caused by land management. Unsustainable farming practices degrade the soil. Once soil is lost it takes at least 100 years to be reformed naturally.17
Risk from pests/diseases (crops and livestock)
Yes. Though difficult to quantify the link between climate and disease outbreaks, rising temperatures are making the UK more suitable for many pathogens and diseases e.g. blowfly strike18 and Bluetongue virus.19 Climate change could also increase the damage caused by endemic diseases through, for example, decreasing water quality and increasing the susceptibility of livestock to diseases due to heat stress.
Yes. Once diseases become endemic they are difficult and costly to eradicate, and can cause widespread damage.20
Pest management measures such as pesticide use can have negative impacts on biodiversity.
Risk of loss of agricultural land from coastal erosion.
No. Less than 0.1% of agricultural land is at risk from coastal erosion.21
Yes. Once land is eroded it is lost to production. However, coastal cliff erosion can supply protective sediments to down-drift coasts. Managed realignment of the coast can create new habitat and make the coast more resilient to rising sea levels (Chapter 5).
Heat stress in livestock Partly. Current vulnerability is low for dairy cattle, but poultry and pigs can suffer from heat stress during transport.22
No. Measures to reduce overheating in transport can be implemented on relatively short timescales (less than 10 years).23
Source: HR Wallingford (2012) and Knox et al. (2012) (except where otherwise stated in footnotes). 14 15 16 17 18 19 20 21 22 23
14 Farming Futures Climate Change Series- General Opportunities and Challenges.15 Department for Energy and Climate Change (2013).16 National Farmers Union and Potato Council reported figures.17 http://eusoils.jrc.ec.europa.eu/projects/soil_atlas/Key_Factors.html18 Wall and Ellse (2011). 19 Foresight (2006).20 EU Animal Health Strategy (2007-2013).21 The CCRA suggests that by the 2080s, around 8,000 ha (0.08%) of agricultural land could be at risk from coastal erosion.22 Scotland’s Rural College (2013) for the Adaptation Sub-Committee.23 Ibid.
24 Managing the land in a changing climate | Adaptation Sub-Committee | Progress Report 2013
2.2 Water availability
Adaptation priorities for agricultural water resources
Water is a key input for agriculture. Its availability will be an important determinant of the responsiveness of food production to longer growing seasons with climate change.
The agriculture sector obtains water both from public water supply (around 55-60% of total agricultural water use24) and abstracted directly from surface water and groundwater stores.
Irrigation accounts for a significant proportion of the water abstracted for agriculture. Between 2000 and 2011, around 75% (89 billion litres per year on average) of water directly abstracted by the agriculture sector was used for spray irrigation, with the remaining 25% (30 billion litres per year on average) used for other agricultural uses such as washing down machinery and buildings.25
There are particular risks from climate change to future irrigation for crop production.26
• At present, irrigation during the summer accounts for only around 1% of total freshwater abstractions across all sectors, principally because a large proportion of crop production is rain-fed compared to many other countries.27 There is therefore potential for large increases in irrigation demand if summer rainfall declines.
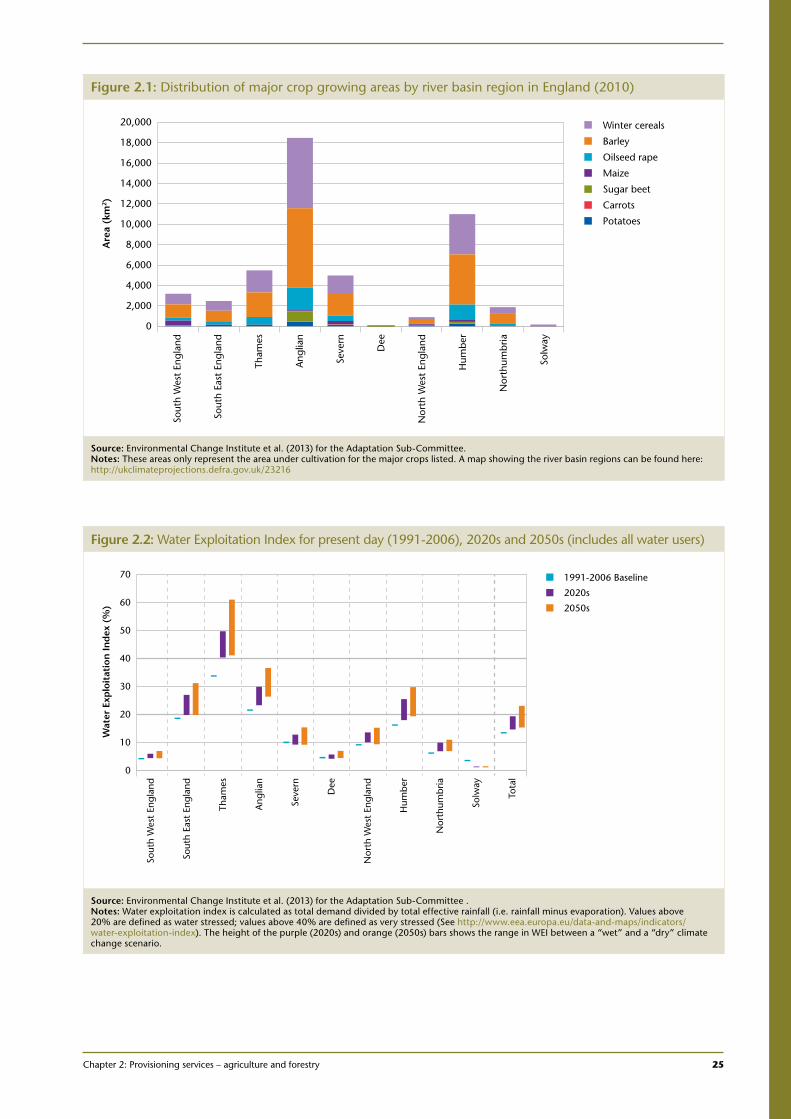
• The majority of cropland in England is located in the south and east of the country (Figure 2.1), areas already facing the highest levels of water stress. In some locations the natural environment is already under stress from reduced water availability. Over-abstraction is causing at least 4% of rivers to fail on achieving good ecological status conditions set out in the Water Framework Directive, and 11% are under investigation.28
This is partly being driven by abstraction for agriculture.29
• The south and east are also the areas likely to experience the largest reductions in summer rainfall due to climate change, and the biggest increase in demand for water due to population growth. Both of these factors could increase the level of water scarcity over this period.30 Our analysis suggests that the Anglian, South-East, Thames, and Humber regions are all at risk from increasing levels of water stress in the 2020s (Figure 2.2).31
24 WRAP (2011).25 Defra (2011).26 This chapter does not consider livestock water use – in part because much of this water is obtained from the public water supply and therefore will be covered
to some extent through Adaptation Sub-Committee indicators on public water supply (Adaptation Sub-Committee 2012 progress report) and in part because livestock is concentrated in more westerly parts of the country where water is not projected to be in such short supply in the future.
27 URS (2013) for the Adaptation Sub-Committee, Daccache et al. (2011).28 http://www.environment-agency.gov.uk/business/topics/water/135357.aspx 29 The Environment Agency is currently assessing how climate change will affect the ability to meet current Water Framework Directive standards.30 Adaptation Sub-Committee (2012). 31 Demand from all users compared to available supply can be assessed using the water exploitation index. Areas are designated as water stressed when their
water exploitation index exceeds 20% and very stressed over 40%.
Chapter 2: Provisioning services – agriculture and forestry 25
1
Figure 2.1: Distribution of major crop growing areas by river basin region in England (2010)
Winter cereals
Barley
Oilseed rape
Maize
Sugar beet
Carrots
Potatoes
Are
a (k
m2 )
Nor
thum
bria
Hum
ber
Nor
th W
est
Engl
and
Dee
Seve
rn
Ang
lian
Tham
es
Sout
h Ea
st E
ngla
nd
Sout
h W
est
Engl
and
Solw
ay
0
2,000
4,000
6,000
8,000
10,000
12,000
14,000
16,000
18,000
20,000
Source: Environmental Change Institute et al. (2013) for the Adaptation Sub-Committee.Notes: These areas only represent the area under cultivation for the major crops listed. A map showing the river basin regions can be found here: http://ukclimateprojections.defra.gov.uk/23216
Figure 2.2: Water Exploitation Index for present day (1991-2006), 2020s and 2050s (includes all water users)
1991-2006 Baseline
2020s
2050s
Wat
er E
xplo
itat
ion
Ind
ex (
%)
Nor
thum
bria
Hum
ber
Nor
th W
est
Engl
and
Dee
Seve
rn
Ang
lian
Tham
es
Sout
h Ea
st E
ngla
nd
Sout
h W
est
Engl
and
Solw
ay
Tota
l
0
10
20
30
40
50
60
70
Source: Environmental Change Institute et al. (2013) for the Adaptation Sub-Committee .Notes: Water exploitation index is calculated as total demand divided by total effective rainfall (i.e. rainfall minus evaporation). Values above 20% are defined as water stressed; values above 40% are defined as very stressed (See http://www.eea.europa.eu/data-and-maps/indicators/water-exploitation-index). The height of the purple (2020s) and orange (2050s) bars shows the range in WEI between a “wet” and a “dry” climate change scenario.
26 Managing the land in a changing climate | Adaptation Sub-Committee | Progress Report 2013
The farming sector could take low-regret adaptation actions to reduce its dependence on summer abstraction for crop production. This would provide a higher degree of resilience and be less risky than assuming a continued ability to abstract more water during summer periods. In the future, peak demands from other sectors such as public water supply (for drinking water and gardening for example) are likely to coincide with reduced availability in the summer.
Scenarios of water supply and demand for crop production
This section of the chapter explores the actions that the sector has available to reduce its demand for water for irrigation, and boost supply without increasing damaging abstractions in the summer.
There are larger uncertainties around future projections of rainfall in England than for temperature. Regional annual mean changes in rainfall could change by -10 to +10% by the 2020s (2010-2039), with changes in summer of between -30 to +20%, and changes in winter of between -10 to +30%. On balance, the evidence suggests that rainfall is more likely to increase in winter and decrease in summer,32 causing lower summer river flows.
There is high confidence that evapo-transpiration will increase rather than decrease because of the driving effect of higher temperatures. This is likely to lead to increased soil moisture deficits, particularly in the 2050s and beyond.33
We constructed scenarios of potential changes in supply and demand for irrigation for the 2020s (2010-2039) to explore the scale of adaptation that might be required (Box 2.1).
• Supply. Based on projections of summer rainfall, we modelled declines of 0-15% in the total amount of water available for abstraction from rivers and groundwater across England in the summer. We used the average amount of water abstracted between 2000 and 2011 as a proxy for the supply available for agriculture (approximately 120,000 megalitres per year).34
• Demand. Rising temperatures and reduced rainfall in summer are likely to increase soil drying. This will drive up the need for additional irrigation for crops. The CCRA suggested that irrigation demand in England could change by between -25,000 and +60,000 megalitres per year in the 2020s, depending on the direction of change in rainfall.35 We used the Environment Agency’s projections, which include both climate-driven soil moisture changes and increases in cropping area driven by population growth. These estimates suggest that by 2025, total agricultural demand could increase in a dry year by 24,000 to 74,000 megalitres per year (15 to 55% over current total demand in a dry year of 141,000 megalitres).36
32 Murphy et al. (2009).33 All of these impacts were assigned a medium confidence rating in the UK Climate Change Risk Assessment.34 Environmental Change Institute et al. (2013) for the Adaptation Sub-Committee.35 As there is a possibility that summer rainfall will increase, these projections include a decline in irrigation demand based on climate change alone.
These estimates do not take into account the effects of changing levels of production to support a growing population, and are therefore likely to be an underestimate of the total scale of risk. As the CCRA provided units in megalitres per day, the figures presented here have been scaled up to megalitres per year by assuming that irrigation occurs during six months of the year.
36 Weatherhead et al. (2008). These estimates exclude other biophysical impacts on crop production in the future including the impacts of carbon dioxide fertilisation, and the potential for new crops to be grown or irrigated.
Chapter 2: Provisioning services – agriculture and forestry 27
1
37 38 39 40
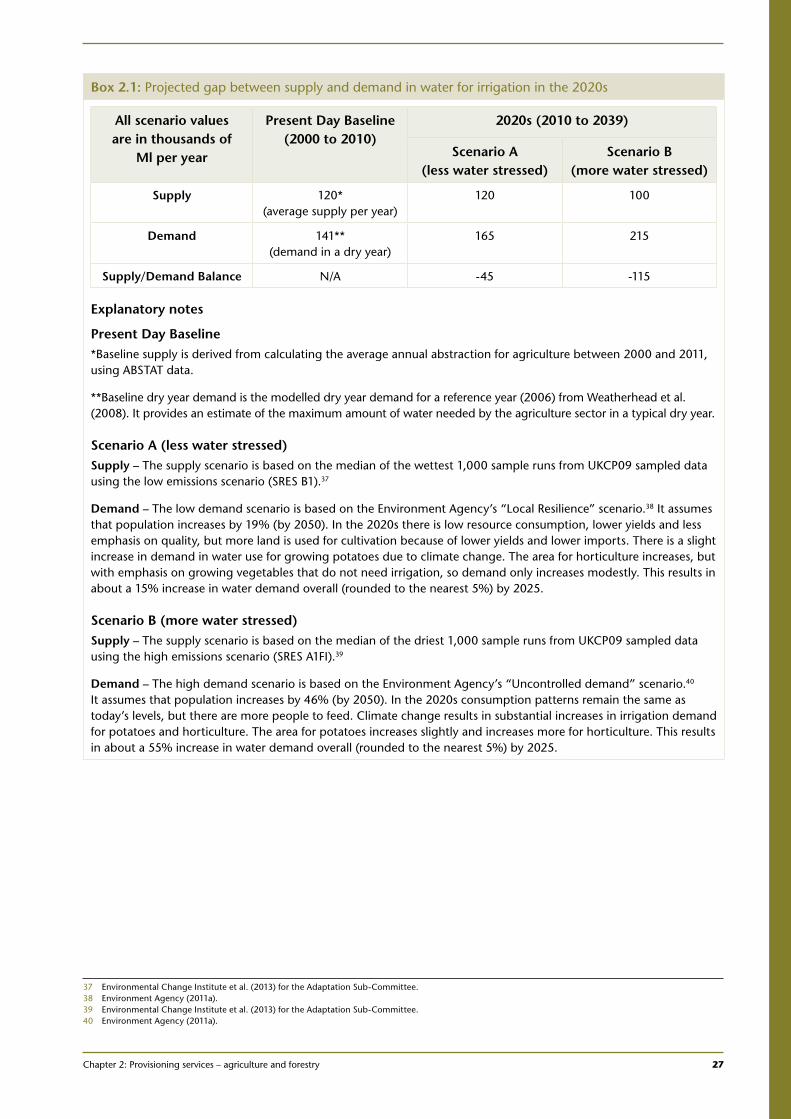
Box 2.1: Projected gap between supply and demand in water for irrigation in the 2020s
All scenario values are in thousands of
Ml per year
Present Day Baseline(2000 to 2010)
2020s (2010 to 2039)
Scenario A (less water stressed)
Scenario B (more water stressed)
Supply 120* (average supply per year)
120 100
Demand 141** (demand in a dry year)
165 215
Supply/Demand Balance N/A -45 -115
Explanatory notes
Present Day Baseline*Baseline supply is derived from calculating the average annual abstraction for agriculture between 2000 and 2011, using ABSTAT data.
**Baseline dry year demand is the modelled dry year demand for a reference year (2006) from Weatherhead et al. (2008). It provides an estimate of the maximum amount of water needed by the agriculture sector in a typical dry year.
Scenario A (less water stressed)Supply – The supply scenario is based on the median of the wettest 1,000 sample runs from UKCP09 sampled data using the low emissions scenario (SRES B1).37
Demand – The low demand scenario is based on the Environment Agency’s “Local Resilience” scenario.38 It assumes that population increases by 19% (by 2050). In the 2020s there is low resource consumption, lower yields and less emphasis on quality, but more land is used for cultivation because of lower yields and lower imports. There is a slight increase in demand in water use for growing potatoes due to climate change. The area for horticulture increases, but with emphasis on growing vegetables that do not need irrigation, so demand only increases modestly. This results in about a 15% increase in water demand overall (rounded to the nearest 5%) by 2025.
Scenario B (more water stressed)Supply – The supply scenario is based on the median of the driest 1,000 sample runs from UKCP09 sampled data using the high emissions scenario (SRES A1FI).39
Demand – The high demand scenario is based on the Environment Agency’s “Uncontrolled demand” scenario.40 It assumes that population increases by 46% (by 2050). In the 2020s consumption patterns remain the same as today’s levels, but there are more people to feed. Climate change results in substantial increases in irrigation demand for potatoes and horticulture. The area for potatoes increases slightly and increases more for horticulture. This results in about a 55% increase in water demand overall (rounded to the nearest 5%) by 2025.
37 Environmental Change Institute et al. (2013) for the Adaptation Sub-Committee.38 Environment Agency (2011a).39 Environmental Change Institute et al. (2013) for the Adaptation Sub-Committee.40 Environment Agency (2011a).
28 Managing the land in a changing climate | Adaptation Sub-Committee | Progress Report 2013
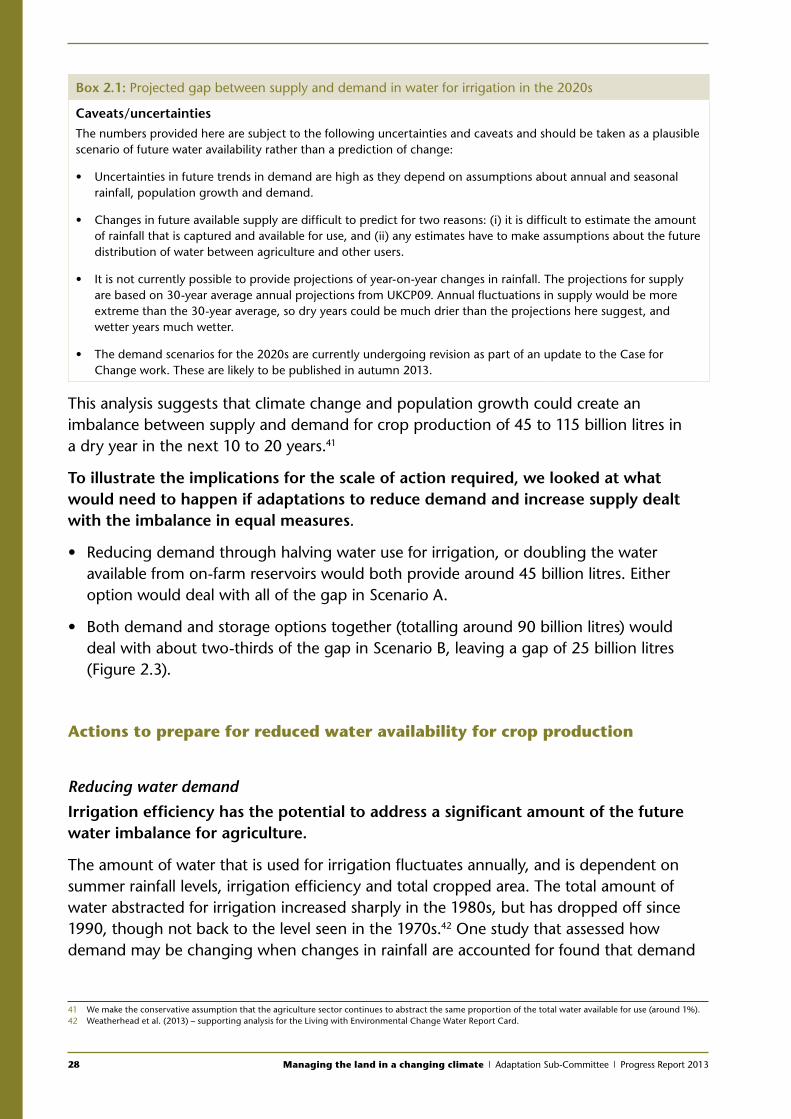
Box 2.1: Projected gap between supply and demand in water for irrigation in the 2020s
Caveats/uncertaintiesThe numbers provided here are subject to the following uncertainties and caveats and should be taken as a plausible scenario of future water availability rather than a prediction of change:
• Uncertainties in future trends in demand are high as they depend on assumptions about annual and seasonal rainfall, population growth and demand.
• Changes in future available supply are difficult to predict for two reasons: (i) it is difficult to estimate the amount of rainfall that is captured and available for use, and (ii) any estimates have to make assumptions about the future distribution of water between agriculture and other users.
• It is not currently possible to provide projections of year-on-year changes in rainfall. The projections for supply are based on 30-year average annual projections from UKCP09. Annual fluctuations in supply would be more extreme than the 30-year average, so dry years could be much drier than the projections here suggest, and wetter years much wetter.
• The demand scenarios for the 2020s are currently undergoing revision as part of an update to the Case for Change work. These are likely to be published in autumn 2013.
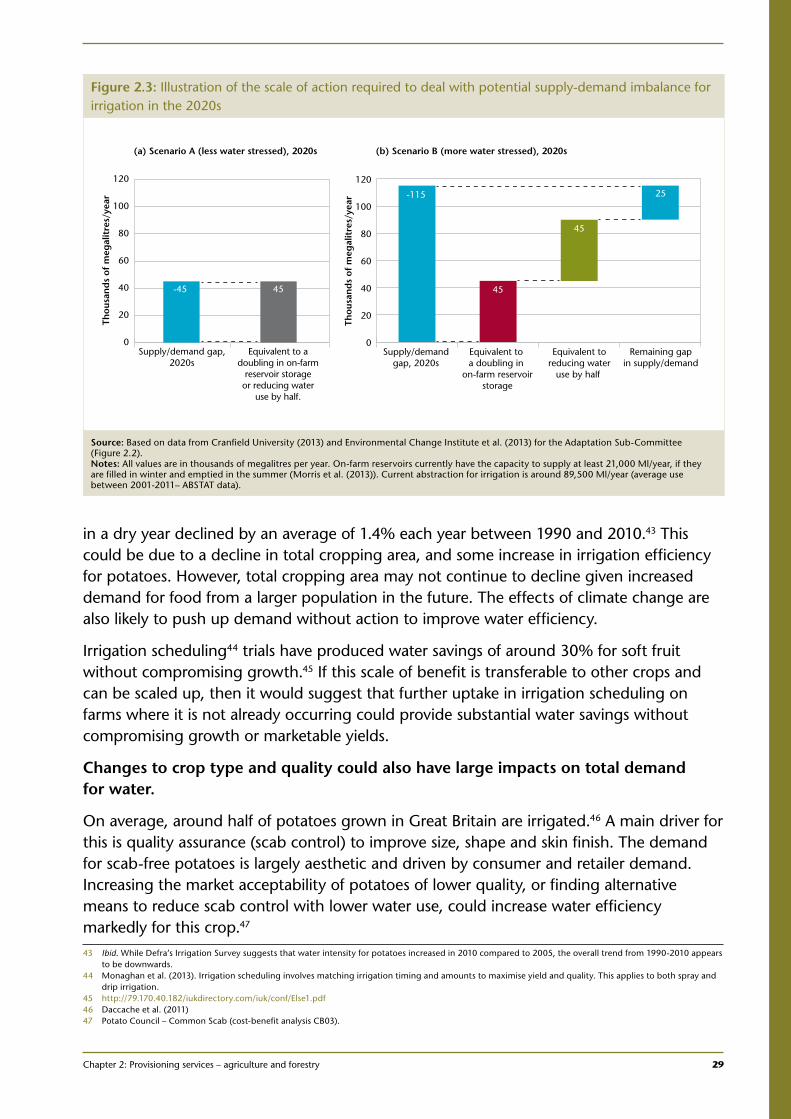
This analysis suggests that climate change and population growth could create an imbalance between supply and demand for crop production of 45 to 115 billion litres in a dry year in the next 10 to 20 years.41
To illustrate the implications for the scale of action required, we looked at what would need to happen if adaptations to reduce demand and increase supply dealt with the imbalance in equal measures.
• Reducing demand through halving water use for irrigation, or doubling the water available from on-farm reservoirs would both provide around 45 billion litres. Either option would deal with all of the gap in Scenario A.
• Both demand and storage options together (totalling around 90 billion litres) would deal with about two-thirds of the gap in Scenario B, leaving a gap of 25 billion litres (Figure 2.3).
Actions to prepare for reduced water availability for crop production
Reducing water demand
Irrigation efficiency has the potential to address a significant amount of the future water imbalance for agriculture.
The amount of water that is used for irrigation fluctuates annually, and is dependent on summer rainfall levels, irrigation efficiency and total cropped area. The total amount of water abstracted for irrigation increased sharply in the 1980s, but has dropped off since 1990, though not back to the level seen in the 1970s.42 One study that assessed how demand may be changing when changes in rainfall are accounted for found that demand
41 We make the conservative assumption that the agriculture sector continues to abstract the same proportion of the total water available for use (around 1%). 42 Weatherhead et al. (2013) – supporting analysis for the Living with Environmental Change Water Report Card.
Chapter 2: Provisioning services – agriculture and forestry 29
1in a dry year declined by an average of 1.4% each year between 1990 and 2010.43 This could be due to a decline in total cropping area, and some increase in irrigation efficiency for potatoes. However, total cropping area may not continue to decline given increased demand for food from a larger population in the future. The effects of climate change are also likely to push up demand without action to improve water efficiency.
Irrigation scheduling44 trials have produced water savings of around 30% for soft fruit without compromising growth.45 If this scale of benefit is transferable to other crops and can be scaled up, then it would suggest that further uptake in irrigation scheduling on farms where it is not already occurring could provide substantial water savings without compromising growth or marketable yields.
Changes to crop type and quality could also have large impacts on total demand for water.
On average, around half of potatoes grown in Great Britain are irrigated.46 A main driver for this is quality assurance (scab control) to improve size, shape and skin finish. The demand for scab-free potatoes is largely aesthetic and driven by consumer and retailer demand. Increasing the market acceptability of potatoes of lower quality, or finding alternative means to reduce scab control with lower water use, could increase water efficiency markedly for this crop.47 43 Ibid. While Defra’s Irrigation Survey suggests that water intensity for potatoes increased in 2010 compared to 2005, the overall trend from 1990-2010 appears
to be downwards.44 Monaghan et al. (2013). Irrigation scheduling involves matching irrigation timing and amounts to maximise yield and quality. This applies to both spray and
drip irrigation.45 http://79.170.40.182/iukdirectory.com/iuk/conf/Else1.pdf46 Daccache et al. (2011)47 Potato Council – Common Scab (cost-benefit analysis CB03).
Figure 2.3: Illustration of the scale of action required to deal with potential supply-demand imbalance for irrigation in the 2020s
Thou
san
ds
of m
egal
itre
s/ye
arSupply/demand
gap, 2020sEquivalent to a doubling in
on-farm reservoirstorage
Equivalent toreducing water
use by half
Remaining gapin supply/demand
0
20
40
60
80
100
120
-115
45
45
25
(b) Scenario B (more water stressed), 2020s
Thou
san
ds
of m
egal
itre
s/ye
ar
Supply/demand gap,2020s
Equivalent to adoubling in on-farm
reservoir storageor reducing water
use by half.
0
20
40
60
80
100
120
-45 45
(a) Scenario A (less water stressed), 2020s
Source: Based on data from Cranfield University (2013) and Environmental Change Institute et al. (2013) for the Adaptation Sub-Committee (Figure 2.2).Notes: All values are in thousands of megalitres per year. On-farm reservoirs currently have the capacity to supply at least 21,000 Ml/year, if they are filled in winter and emptied in the summer (Morris et al. (2013)). Current abstraction for irrigation is around 89,500 Ml/year (average use between 2001-2011– ABSTAT data).
30 Managing the land in a changing climate | Adaptation Sub-Committee | Progress Report 2013
Other potential measures for reducing demand without a reduction in crop yield include better soil management,48 developing more water efficient cultivars, or switching the crop types grown. Irrigating an equivalent area of cereals currently uses only one third of the water used for irrigating the same area of potatoes.49 However, water use will not be the only factor determining crop type. The ability to grow crops in certain areas will also be determined by land suitability (including soil type) and prevalence of pests and diseases. Historically, crop switching has primarily been driven by economic factors such as relative prices of different crops.
Reducing overall demand through tackling food waste might also have positive impacts on total water use, as the total amount of food produced to meet demand could decrease.
Increasing supply through on-farm storage reservoirs
On-farm reservoirs are an important adaptation measure alongside improving water efficiency, as they provide an additional water source for irrigation at times when there is less water available from rivers and groundwater sources.
Farmers with reservoirs can abstract water from rivers and groundwater sources during high-flow periods. This is then stored and used for irrigation at times of low flows, which occurs most often during the summer months when irrigation demand is at its peak. Across England, on-farm reservoirs provided around 21,000 megalitres of water in 2009/10 (around 20% of the total annual volume of water used for irrigation).50
We analysed the costs and benefits of on-farm storage to investigate the potential for increased uptake of this measure by farmers.
The costs of building and maintaining reservoirs were compared to the benefits of avoided damage from over-abstraction from rivers in the summer, which is reflected in an estimate of the value of the water stored. Reservoirs were found to be justified on economic grounds where the value of the water stored was greater than £0.23 per m3.51
• At present, the value of water is estimated to be between £0.23 per m3 in Northern England to well over £1.50 per m3 in Eastern England.52 As such, reservoirs are likely to be cost-beneficial in many locations.
• These estimates are limited in that they do not include an estimate of the value of water to the natural environment, and are therefore likely to be conservative.
Reservoirs become more viable economically as the value of water increases, which is likely to be the case under climate change due to an increased risk of water scarcity in the
48 See Section 2.3.49 Defra (2011).50 Morris et al. (2013). The storage volume is calculated from the highest amount of water which was abstracted in winter to fill reservoirs, which was around
21,000 megalitres in 2009/10. The total capacity is almost certainly larger than this, as not all reservoirs would have been empty and completely filled during the winter of 2009/10. There may also be reservoirs which have been built but are not being used at all at present.
51 Reservoirs reduce the water which is abstracted from rivers in summer. Because water is scarcer in summer, this water is of higher value than water abstracted in winter. The value to society of the water collected in a reservoir can be estimated by considering the benefits of leaving water in rivers in the summer. Scotland’s Rural College (2013) use agricultural and household use values as indicative values for this water, which vary from £0.36/m3 to £1.20/m3.
52 Moran and Dann (2007).
Chapter 2: Provisioning services – agriculture and forestry 31
1
summer.53 Depending on their design and location, reservoirs also have the potential to contribute to other objectives including habitat creation and flood alleviation.
Barriers exist to reservoir uptake. Investing in reservoirs is a more expensive option for farmers than direct summer abstraction.
• On-farm storage has high upfront costs, with typical on-farm reservoirs costing between £50,000 and £400,000 to build depending on size, location and whether an artificial waterproof liner is needed.
• These costs are not balanced out for farmers by cheaper abstraction charges in winter, even where summer water charges per unit of water are higher than in winter by a factor of ten.54
• Before making such a long-term investment, farmers need to be very confident that water will be available to fill the reservoir, and that the farm will still be growing irrigated crops well into the future to make the investment worthwhile through higher returns on irrigated crop production. Farmers therefore tend only to opt for reservoirs to protect crop production where there is a risk of being unable to abstract water in the summer. Being unable to irrigate carries high risks for high-value, water intensive crops such as potatoes. As such, most reservoirs are associated with potato production.55
At present, most farmers require assistance with up-front capital costs for reservoir development to make the investment a sensible business decision.56
Incentivising efficient water management
Having a price for water that better reflects scarcity will provide a stronger incentive for action.
• At present, there is no relationship between water availability and the cost of water to farmers at the regional level (Figure 2.4). The price of water should reflect its scarcity in order to signal the value of water to abstractors.57
• As water scarcity increases, prices should rise, which in turn should drive greater efficiency in water use.58 Agricultural demand for water may start to become elastic as prices approach £0.6 per m3, though potato farmers appear to reduce demand at much lower prices of around £0.12 per m3.59 As the value of water increases, measures such as on-farm reservoirs and more efficient irrigation technology are likely to become more worthwhile financially.
• Pricing water to reflect its value to users would also drive allocation of available resources to the highest value uses. In some cases, this may result in lower agricultural consumption to free up water for other users such as water companies.60
53 Scotland’s Rural College (2013) for the Adaptation Sub-Committee, gives a range in the value of water of between £0.75/m3 and £2.50/m3 by 2100.54 Morris et al. (2013).55 Ibid.56 http://79.170.40.182/iukdirectory.com/iuk/pdfs/Reservoirs.pdf 57 This should include spatial and temporal variations in availability.58 Anglian Water and Frontier Economics (2011).59 Morris et al. (2003).60 URS (2013) for the Adaptation Sub-Committee.
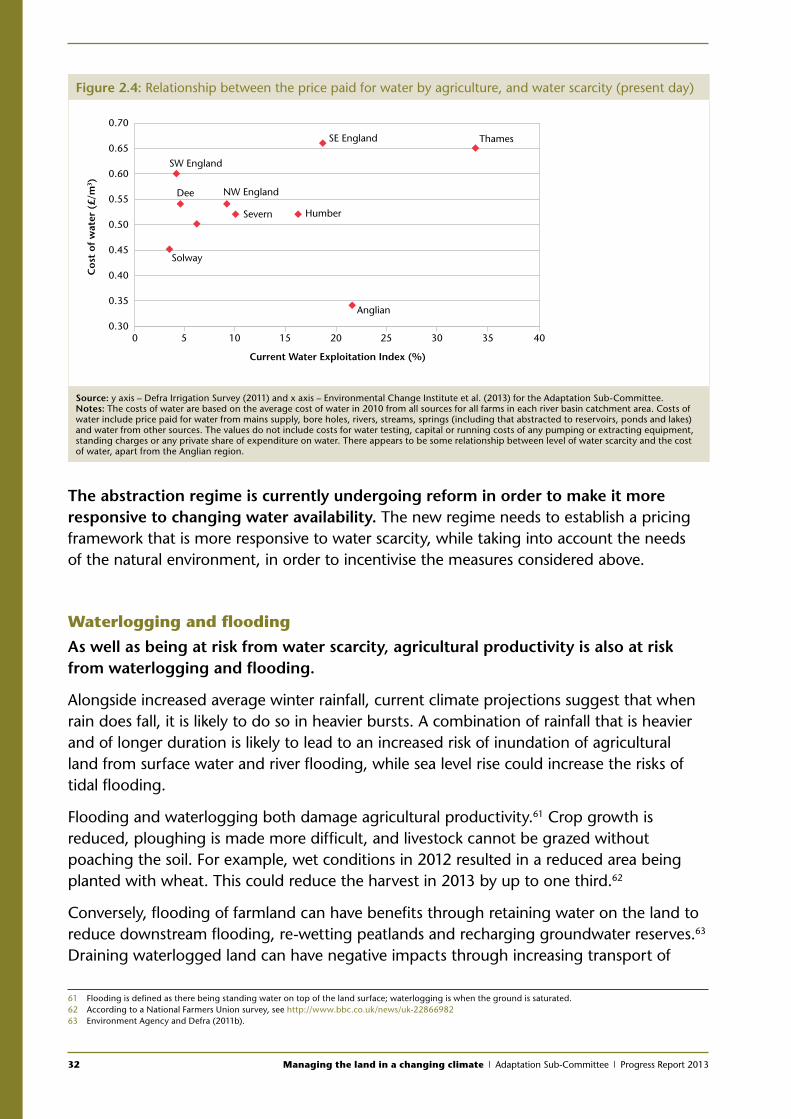
32 Managing the land in a changing climate | Adaptation Sub-Committee | Progress Report 2013
The abstraction regime is currently undergoing reform in order to make it more responsive to changing water availability. The new regime needs to establish a pricing framework that is more responsive to water scarcity, while taking into account the needs of the natural environment, in order to incentivise the measures considered above.
Waterlogging and flooding
As well as being at risk from water scarcity, agricultural productivity is also at risk from waterlogging and flooding.
Alongside increased average winter rainfall, current climate projections suggest that when rain does fall, it is likely to do so in heavier bursts. A combination of rainfall that is heavier and of longer duration is likely to lead to an increased risk of inundation of agricultural land from surface water and river flooding, while sea level rise could increase the risks of tidal flooding.
Flooding and waterlogging both damage agricultural productivity.61 Crop growth is reduced, ploughing is made more difficult, and livestock cannot be grazed without poaching the soil. For example, wet conditions in 2012 resulted in a reduced area being planted with wheat. This could reduce the harvest in 2013 by up to one third.62
Conversely, flooding of farmland can have benefits through retaining water on the land to reduce downstream flooding, re-wetting peatlands and recharging groundwater reserves.63 Draining waterlogged land can have negative impacts through increasing transport of
61 Flooding is defined as there being standing water on top of the land surface; waterlogging is when the ground is saturated.62 According to a National Farmers Union survey, see http://www.bbc.co.uk/news/uk-2286698263 Environment Agency and Defra (2011b).
Figure 2.4: Relationship between the price paid for water by agriculture, and water scarcity (present day)C
ost
of w
ater
(£/
m3 )
0.30
0.35
0.40
0.45
0.50
0.55
0.60
0.65
0.70
0 5 10 15 20 25 30 35 40
Current Water Exploitation Index (%)
SW England
SE England
NW EnglandDee
Severn Humber
Solway
Anglian
Thames
Source: y axis – Defra Irrigation Survey (2011) and x axis – Environmental Change Institute et al. (2013) for the Adaptation Sub-Committee.Notes: The costs of water are based on the average cost of water in 2010 from all sources for all farms in each river basin catchment area. Costs of water include price paid for water from mains supply, bore holes, rivers, streams, springs (including that abstracted to reservoirs, ponds and lakes) and water from other sources. The values do not include costs for water testing, capital or running costs of any pumping or extracting equipment, standing charges or any private share of expenditure on water. There appears to be some relationship between level of water scarcity and the cost of water, apart from the Anglian region.
Chapter 2: Provisioning services – agriculture and forestry 33
1
pollution from agricultural land into water courses. Deciding how, where and when to address land drainage and flood protection therefore involves a complex set of trade-offs between agricultural production, environmental impacts and wider impacts on flood risk elsewhere.64
Responsibility for managing these trade-offs rests across several bodies. Funding for flood risk management is provided primarily through the Environment Agency. Drainage provision and maintenance is carried out by Internal Drainage Boards (IDBs) which are community-funded bodies that undertake works to reduce flood risk and manage water levels. Approximately 10% of land area in England is covered by IDBs, containing around 50,000 farms or land-holdings.65 In other locations, farmers have direct responsibility to install and maintain their own drainage.
While the current risks to agricultural land from flooding and waterlogging are well characterised, there is less evidence about the risks from future climate change.
Around 59% (47,000 km2) of agricultural land in England is at risk from waterlogging, of which 10,000 km2 is not currently drained.66 Around 2,000 km2 of agricultural land has a 10% or greater annual probability of being flooded from rivers or the sea.67
The CCRA suggests that 5,000 km2 of agricultural land could be at significant risk of flooding by the 2080s.68 The future risk from surface water flooding and waterlogging caused by heavy rainfall could not be quantified for the CCRA.
Greater understanding of the net benefits, costs and impacts of land drainage across a range of future climate scenarios, will help to evaluate the case for further drainage.
The National Adaptation Programme includes actions to consider the costs and benefits of widening the scope of the Internal Drainage Boards to take a stronger role in managing water availability risks, and a review of the status of drainage infrastructure. This work should consider the pros and cons of land drainage to manage the future risks to agriculture from extreme or prolonged rainfall.
2.3 Soil productivity
Current and future vulnerability
Soil erosion and loss of soil organic matter have the potential to limit the ability of farmers to take advantage of future opportunities to increase agricultural production.
Soil degradation reduces the depth, volume and quality of soil, and hence limits the productive capacity of agricultural land. It represents a reduction in the capacity for nutrient supply and has negative implications for food production and other ecosystem
64 Whelan et al. (2013).65 Association of Drainage Authorities (2012).66 ADAS (2011).67 Knox et al. (2012).68 Ibid.
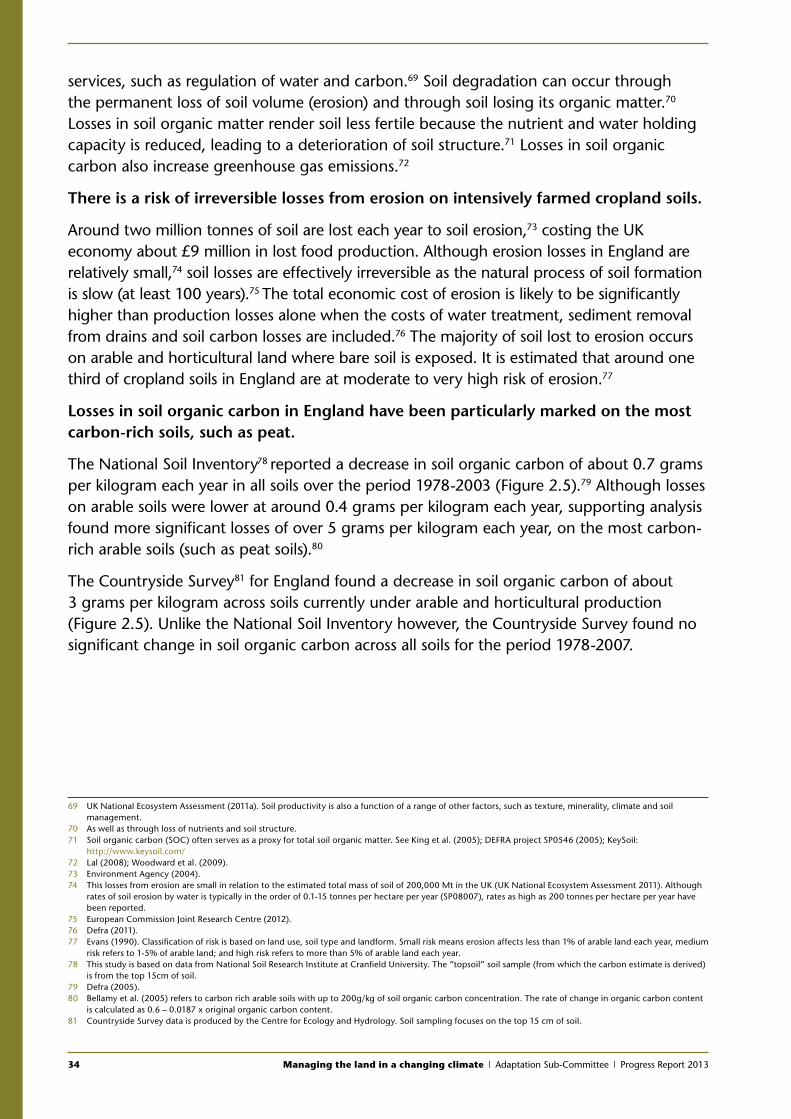
34 Managing the land in a changing climate | Adaptation Sub-Committee | Progress Report 2013
services, such as regulation of water and carbon.69 Soil degradation can occur through the permanent loss of soil volume (erosion) and through soil losing its organic matter.70 Losses in soil organic matter render soil less fertile because the nutrient and water holding capacity is reduced, leading to a deterioration of soil structure.71 Losses in soil organic carbon also increase greenhouse gas emissions.72
There is a risk of irreversible losses from erosion on intensively farmed cropland soils.
Around two million tonnes of soil are lost each year to soil erosion,73 costing the UK economy about £9 million in lost food production. Although erosion losses in England are relatively small,74 soil losses are effectively irreversible as the natural process of soil formation is slow (at least 100 years).75 The total economic cost of erosion is likely to be significantly higher than production losses alone when the costs of water treatment, sediment removal from drains and soil carbon losses are included.76 The majority of soil lost to erosion occurs on arable and horticultural land where bare soil is exposed. It is estimated that around one third of cropland soils in England are at moderate to very high risk of erosion.77
Losses in soil organic carbon in England have been particularly marked on the most carbon-rich soils, such as peat.
The National Soil Inventory78 reported a decrease in soil organic carbon of about 0.7 grams per kilogram each year in all soils over the period 1978-2003 (Figure 2.5).79 Although losses on arable soils were lower at around 0.4 grams per kilogram each year, supporting analysis found more significant losses of over 5 grams per kilogram each year, on the most carbon-rich arable soils (such as peat soils).80
The Countryside Survey81 for England found a decrease in soil organic carbon of about 3 grams per kilogram across soils currently under arable and horticultural production (Figure 2.5). Unlike the National Soil Inventory however, the Countryside Survey found no significant change in soil organic carbon across all soils for the period 1978-2007.
69 UK National Ecosystem Assessment (2011a). Soil productivity is also a function of a range of other factors, such as texture, minerality, climate and soil management.
70 As well as through loss of nutrients and soil structure.71 Soil organic carbon (SOC) often serves as a proxy for total soil organic matter. See King et al. (2005); DEFRA project SP0546 (2005); KeySoil:
http://www.keysoil.com/72 Lal (2008); Woodward et al. (2009).73 Environment Agency (2004).74 This losses from erosion are small in relation to the estimated total mass of soil of 200,000 Mt in the UK (UK National Ecosystem Assessment 2011). Although
rates of soil erosion by water is typically in the order of 0.1-15 tonnes per hectare per year (SP08007), rates as high as 200 tonnes per hectare per year have been reported.
75 European Commission Joint Research Centre (2012).76 Defra (2011). 77 Evans (1990). Classification of risk is based on land use, soil type and landform. Small risk means erosion affects less than 1% of arable land each year, medium
risk refers to 1-5% of arable land; and high risk refers to more than 5% of arable land each year.78 This study is based on data from National Soil Research Institute at Cranfield University. The “topsoil” soil sample (from which the carbon estimate is derived)
is from the top 15cm of soil. 79 Defra (2005).80 Bellamy et al. (2005) refers to carbon rich arable soils with up to 200g/kg of soil organic carbon concentration. The rate of change in organic carbon content
is calculated as 0.6 – 0.0187 x original organic carbon content.81 Countryside Survey data is produced by the Centre for Ecology and Hydrology. Soil sampling focuses on the top 15 cm of soil.
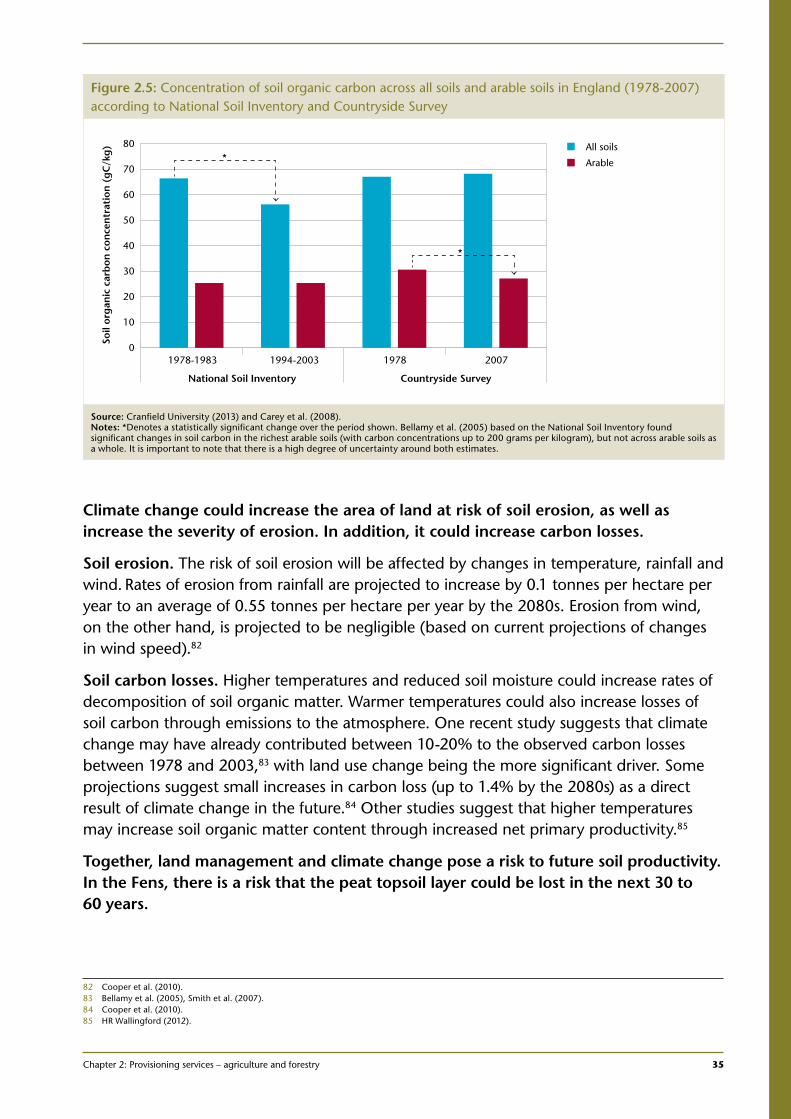
Chapter 2: Provisioning services – agriculture and forestry 35
1Climate change could increase the area of land at risk of soil erosion, as well as increase the severity of erosion. In addition, it could increase carbon losses.
Soil erosion. The risk of soil erosion will be affected by changes in temperature, rainfall and wind. Rates of erosion from rainfall are projected to increase by 0.1 tonnes per hectare per year to an average of 0.55 tonnes per hectare per year by the 2080s. Erosion from wind, on the other hand, is projected to be negligible (based on current projections of changes in wind speed).82
Soil carbon losses. Higher temperatures and reduced soil moisture could increase rates of decomposition of soil organic matter. Warmer temperatures could also increase losses of soil carbon through emissions to the atmosphere. One recent study suggests that climate change may have already contributed between 10-20% to the observed carbon losses between 1978 and 2003,83 with land use change being the more significant driver. Some projections suggest small increases in carbon loss (up to 1.4% by the 2080s) as a direct result of climate change in the future.84 Other studies suggest that higher temperatures may increase soil organic matter content through increased net primary productivity.85
Together, land management and climate change pose a risk to future soil productivity. In the Fens, there is a risk that the peat topsoil layer could be lost in the next 30 to 60 years.
82 Cooper et al. (2010). 83 Bellamy et al. (2005), Smith et al. (2007).84 Cooper et al. (2010).85 HR Wallingford (2012).
Figure 2.5: Concentration of soil organic carbon across all soils and arable soils in England (1978-2007) according to National Soil Inventory and Countryside Survey
All soils
Arable
Soil
org
anic
car
bo
n c
on
cen
trat
ion
(g
C/k
g)
1978-1983 1994-2003 1978 20070
10
20
30
40
50
60
70
80
National Soil Inventory Countryside Survey
*
*
Source: Cranfield University (2013) and Carey et al. (2008).Notes: *Denotes a statistically significant change over the period shown. Bellamy et al. (2005) based on the National Soil Inventory found significant changes in soil carbon in the richest arable soils (with carbon concentrations up to 200 grams per kilogram), but not across arable soils as a whole. It is important to note that there is a high degree of uncertainty around both estimates.
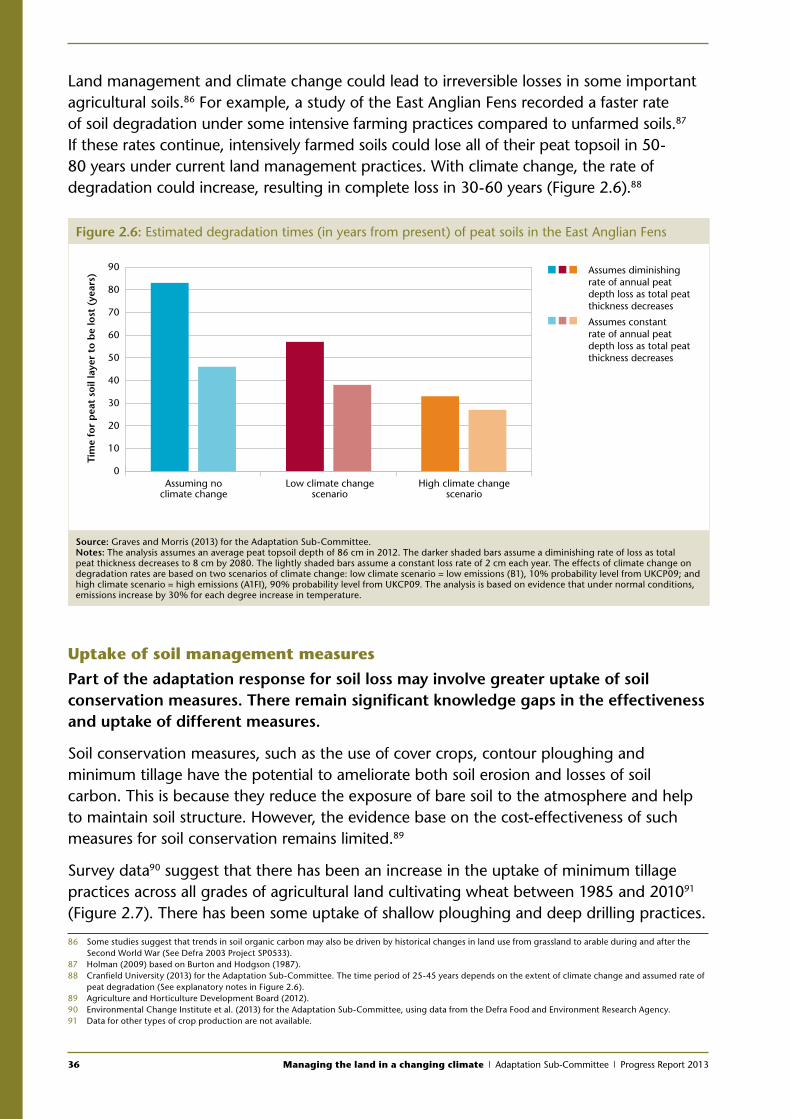
36 Managing the land in a changing climate | Adaptation Sub-Committee | Progress Report 2013
Land management and climate change could lead to irreversible losses in some important agricultural soils.86 For example, a study of the East Anglian Fens recorded a faster rate of soil degradation under some intensive farming practices compared to unfarmed soils.87
If these rates continue, intensively farmed soils could lose all of their peat topsoil in 50-80 years under current land management practices. With climate change, the rate of degradation could increase, resulting in complete loss in 30-60 years (Figure 2.6).88
Uptake of soil management measures
Part of the adaptation response for soil loss may involve greater uptake of soil conservation measures. There remain significant knowledge gaps in the effectiveness and uptake of different measures.
Soil conservation measures, such as the use of cover crops, contour ploughing and minimum tillage have the potential to ameliorate both soil erosion and losses of soil carbon. This is because they reduce the exposure of bare soil to the atmosphere and help to maintain soil structure. However, the evidence base on the cost-effectiveness of such measures for soil conservation remains limited.89
Survey data90 suggest that there has been an increase in the uptake of minimum tillage practices across all grades of agricultural land cultivating wheat between 1985 and 201091 (Figure 2.7). There has been some uptake of shallow ploughing and deep drilling practices.
86 Some studies suggest that trends in soil organic carbon may also be driven by historical changes in land use from grassland to arable during and after the Second World War (See Defra 2003 Project SP0533).
87 Holman (2009) based on Burton and Hodgson (1987).88 Cranfield University (2013) for the Adaptation Sub-Committee. The time period of 25-45 years depends on the extent of climate change and assumed rate of
peat degradation (See explanatory notes in Figure 2.6).89 Agriculture and Horticulture Development Board (2012). 90 Environmental Change Institute et al. (2013) for the Adaptation Sub-Committee, using data from the Defra Food and Environment Research Agency.91 Data for other types of crop production are not available.
Figure 2.6: Estimated degradation times (in years from present) of peat soils in the East Anglian Fens
Tim
e fo
r p
eat
soil
laye
r to
be
lost
(ye
ars)
Assuming noclimate change
Low climate changescenario
High climate changescenario
0
10
20
30
40
50
60
70
80
90 Assumes diminishing rate of annual peat depth loss as total peat thickness decreases
Assumes constant rate of annual peat depth loss as total peat thickness decreases
Source: Graves and Morris (2013) for the Adaptation Sub-Committee.Notes: The analysis assumes an average peat topsoil depth of 86 cm in 2012. The darker shaded bars assume a diminishing rate of loss as total peat thickness decreases to 8 cm by 2080. The lightly shaded bars assume a constant loss rate of 2 cm each year. The effects of climate change on degradation rates are based on two scenarios of climate change: low climate scenario = low emissions (B1), 10% probability level from UKCP09; and high climate scenario = high emissions (A1FI), 90% probability level from UKCP09. The analysis is based on evidence that under normal conditions, emissions increase by 30% for each degree increase in temperature.
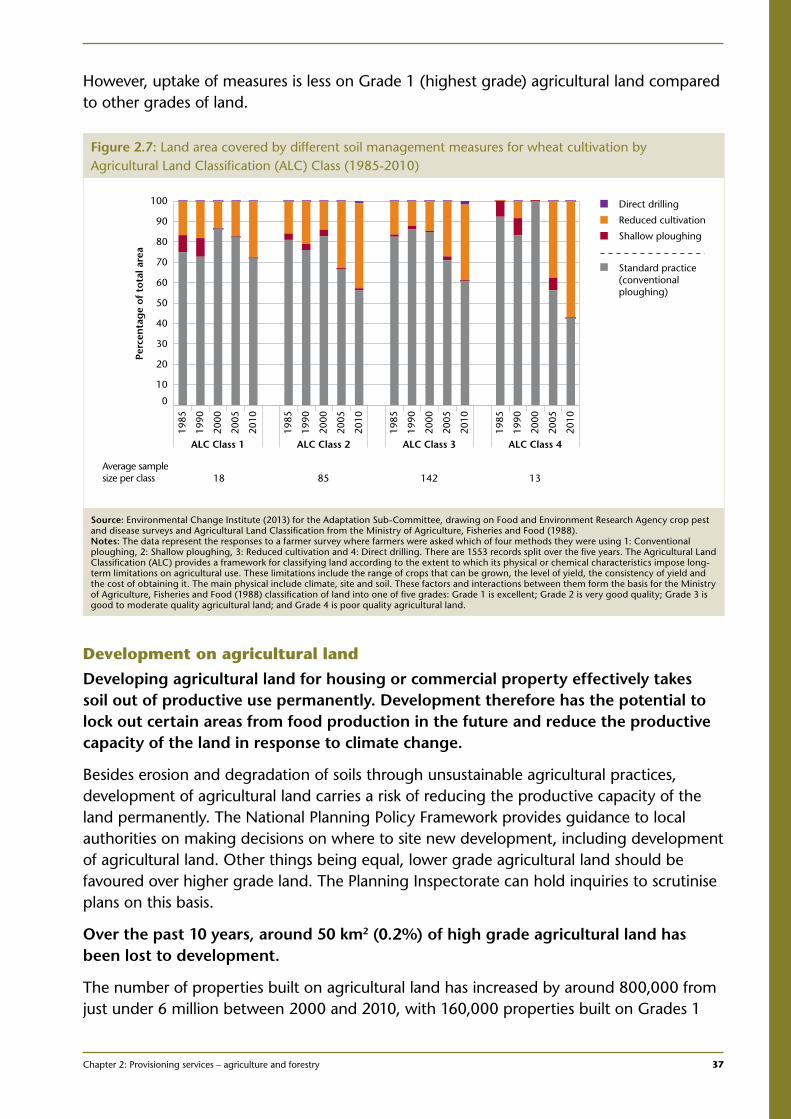
Chapter 2: Provisioning services – agriculture and forestry 37
1
However, uptake of measures is less on Grade 1 (highest grade) agricultural land compared to other grades of land.
Development on agricultural land
Developing agricultural land for housing or commercial property effectively takes soil out of productive use permanently. Development therefore has the potential to lock out certain areas from food production in the future and reduce the productive capacity of the land in response to climate change.
Besides erosion and degradation of soils through unsustainable agricultural practices, development of agricultural land carries a risk of reducing the productive capacity of the land permanently. The National Planning Policy Framework provides guidance to local authorities on making decisions on where to site new development, including development of agricultural land. Other things being equal, lower grade agricultural land should be favoured over higher grade land. The Planning Inspectorate can hold inquiries to scrutinise plans on this basis.
Over the past 10 years, around 50 km2 (0.2%) of high grade agricultural land has been lost to development.
The number of properties built on agricultural land has increased by around 800,000 from just under 6 million between 2000 and 2010, with 160,000 properties built on Grades 1
Figure 2.7: Land area covered by different soil management measures for wheat cultivation by Agricultural Land Classification (ALC) Class (1985-2010)
Direct drilling
Reduced cultivation
Shallow ploughing
Standard practice(conventional ploughing)
Perc
enta
ge
of t
otal
are
a
2005
2000
1990
1985
2010
2005
2000
1990
1985
2010
2005
2000
1990
1985
2010
2005
2000
1990
1985
2010
0
10
20
30
40
50
60
70
80
90
100
ALC Class 3ALC Class 2ALC Class 1 ALC Class 4
1428518 13Average samplesize per class
Source: Environmental Change Institute (2013) for the Adaptation Sub-Committee, drawing on Food and Environment Research Agency crop pest and disease surveys and Agricultural Land Classification from the Ministry of Agriculture, Fisheries and Food (1988).Notes: The data represent the responses to a farmer survey where farmers were asked which of four methods they were using 1: Conventional ploughing, 2: Shallow ploughing, 3: Reduced cultivation and 4: Direct drilling. There are 1553 records split over the five years. The Agricultural Land Classification (ALC) provides a framework for classifying land according to the extent to which its physical or chemical characteristics impose long- term limitations on agricultural use. These limitations include the range of crops that can be grown, the level of yield, the consistency of yield and the cost of obtaining it. The main physical include climate, site and soil. These factors and interactions between them form the basis for the Ministry of Agriculture, Fisheries and Food (1988) classification of land into one of five grades: Grade 1 is excellent; Grade 2 is very good quality; Grade 3 is good to moderate quality agricultural land; and Grade 4 is poor quality agricultural land.
38 Managing the land in a changing climate | Adaptation Sub-Committee | Progress Report 2013
and 2 land.92 Around 50 km2 (0.2% of high grade land) has been lost as a result. 93 If this trend were to continue, around 250 km2 (1% of high grade land) would be lost by 2050 (since 2000).
The rate of development on high grade land between 2000 and 2010 was faster than on lower grades, with a 16% increase in the number of properties on Grades 1 and 2 compared to a 9% increase elsewhere. Agricultural land will come under increasing pressure from development in the future to support a growing population, so although small at present, this rate could accelerate.
2.4 Technological capability and provision of advice to farmers
Technological capability
The agriculture sector has the best chance of adapting to an uncertain future climate and other pressures if it has a range of technologies and information available for managing the land, controlling pests and diseases and having choices of crops/livestock available to best suit the future climate. For example:
• Monitoring and surveillance of pests and diseases is critical as early detection has a large benefit in preventing damages.94 The potential average cost of animal disease outbreaks in the UK in 2010 was estimated to be around £98 million, with £63 million of that from outbreaks of currently unknown or unexpected diseases.95 Around £34 million is spent each year on surveillance. Case studies suggest that that scanning surveillance could deliver benefits of over £200 million each year from reduced disease incidence.96
• New methods of farming can act to reduce vulnerability to changes such as reduced water availability, for example. Irrigation scheduling trials have shown that using better technology can reduce water demand in strawberry plants by one third.97
• Genetic diversity is important to maintain a diverse gene pool for both crops and livestock, in order to source adaptations that may suit the future climate. The UK has 235 native breeds of livestock, of which over 75% are currently under threat of disappearing.98
• Genetic enhancements to both crop and livestock breeds can make a substantial difference to their suitability under a changing climate. For example, drought-resistant wheat varieties are being investigated for use in more arid countries like Australia.99
• Good knowledge transfer programmes are vital to ensure that technologies, once developed, are taken up and used effectively on as wide a scale as possible.
92 Environmental Change Institute et al. (2013) for the Adaptation Sub-Committee.93 This rate is also found in a study for Defra (SP1501) looking at different methods for calculating the area of land lost, which gave a figure of 0.35% of high
grade agricultural land lost between 1998-2008.94 EU Animal Health Strategy (2007-2013).95 Defra (2010).96 Animal Health and Veterinary Laboratories Agency (2011).97 http://79.170.40.182/iukdirectory.com/iuk/conf/Else1.pdf98 Defra (2013d).99 http://sciencewise.anu.edu.au/articles/Drought%20Resistant%20Wheat
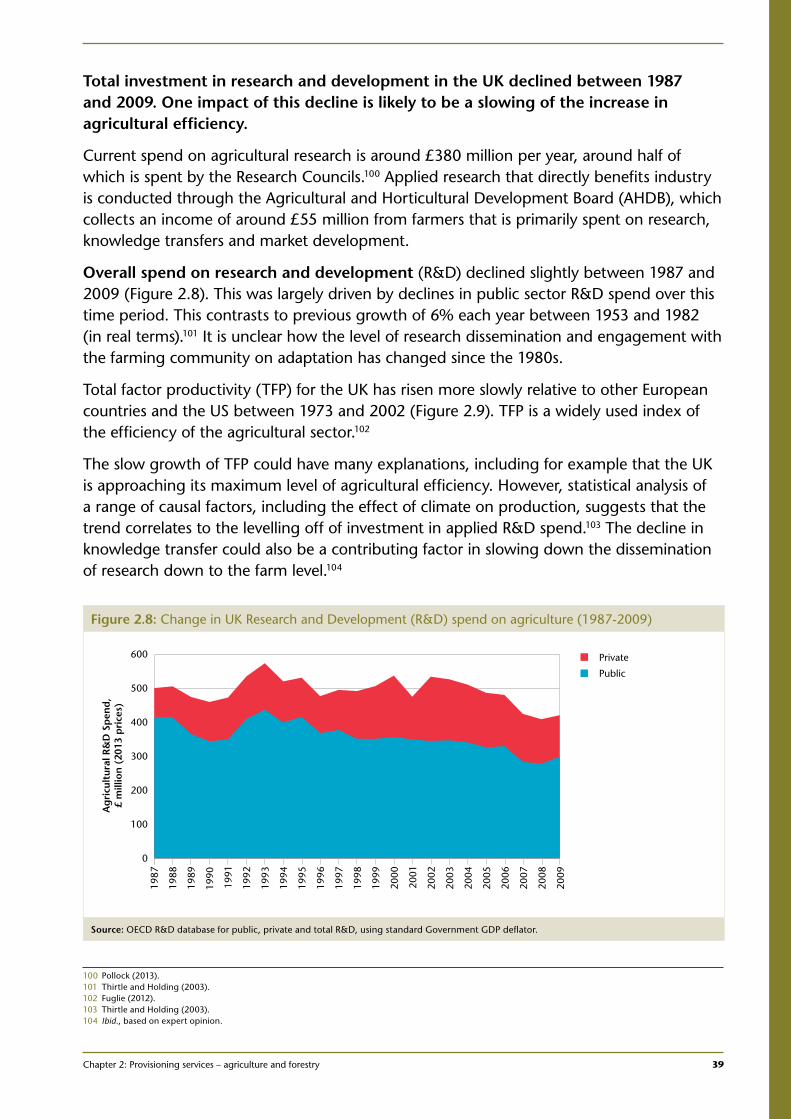
Chapter 2: Provisioning services – agriculture and forestry 39
1
Total investment in research and development in the UK declined between 1987 and 2009. One impact of this decline is likely to be a slowing of the increase in agricultural efficiency.
Current spend on agricultural research is around £380 million per year, around half of which is spent by the Research Councils.100 Applied research that directly benefits industry is conducted through the Agricultural and Horticultural Development Board (AHDB), which collects an income of around £55 million from farmers that is primarily spent on research, knowledge transfers and market development.
Overall spend on research and development (R&D) declined slightly between 1987 and 2009 (Figure 2.8). This was largely driven by declines in public sector R&D spend over this time period. This contrasts to previous growth of 6% each year between 1953 and 1982 (in real terms).101 It is unclear how the level of research dissemination and engagement with the farming community on adaptation has changed since the 1980s.
Total factor productivity (TFP) for the UK has risen more slowly relative to other European countries and the US between 1973 and 2002 (Figure 2.9). TFP is a widely used index of the efficiency of the agricultural sector.102
The slow growth of TFP could have many explanations, including for example that the UK is approaching its maximum level of agricultural efficiency. However, statistical analysis of a range of causal factors, including the effect of climate on production, suggests that the trend correlates to the levelling off of investment in applied R&D spend.103 The decline in knowledge transfer could also be a contributing factor in slowing down the dissemination of research down to the farm level.104
100 Pollock (2013). 101 Thirtle and Holding (2003).102 Fuglie (2012).103 Thirtle and Holding (2003).104 Ibid., based on expert opinion.
Figure 2.8: Change in UK Research and Development (R&D) spend on agriculture (1987-2009)
Ag
ricu
ltur
al R
&D
Sp
end
,£
mill
ion
(20
13 p
rice
s)
2009
2008
2007
2006
2005
2004
2003
2002
2001
2000
1999
1998
1997
1996
1995
1994
1993
1992
1991
1990
1989
1988
1987
0
100
200
300
400
500
600 Private
Public
Source: OECD R&D database for public, private and total R&D, using standard Government GDP deflator.
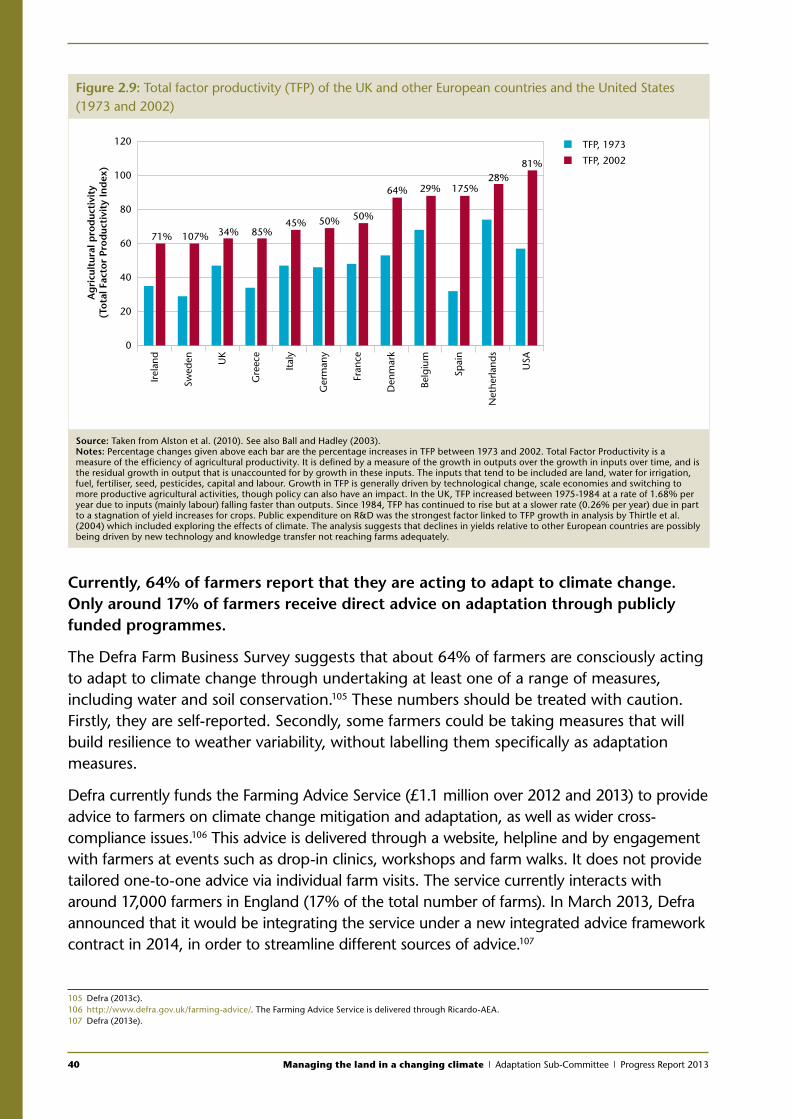
40 Managing the land in a changing climate | Adaptation Sub-Committee | Progress Report 2013
Currently, 64% of farmers report that they are acting to adapt to climate change. Only around 17% of farmers receive direct advice on adaptation through publicly funded programmes.
The Defra Farm Business Survey suggests that about 64% of farmers are consciously acting to adapt to climate change through undertaking at least one of a range of measures, including water and soil conservation.105 These numbers should be treated with caution. Firstly, they are self-reported. Secondly, some farmers could be taking measures that will build resilience to weather variability, without labelling them specifically as adaptation measures.
Defra currently funds the Farming Advice Service (£1.1 million over 2012 and 2013) to provide advice to farmers on climate change mitigation and adaptation, as well as wider cross-compliance issues.106 This advice is delivered through a website, helpline and by engagement with farmers at events such as drop-in clinics, workshops and farm walks. It does not provide tailored one-to-one advice via individual farm visits. The service currently interacts with around 17,000 farmers in England (17% of the total number of farms). In March 2013, Defra announced that it would be integrating the service under a new integrated advice framework contract in 2014, in order to streamline different sources of advice.107
105 Defra (2013c).106 http://www.defra.gov.uk/farming-advice/. The Farming Advice Service is delivered through Ricardo-AEA.107 Defra (2013e).
Figure 2.9: Total factor productivity (TFP) of the UK and other European countries and the United States (1973 and 2002)
Ag
ricu
ltur
al p
rod
ucti
vity
(To
tal F
acto
r Pr
od
ucti
vity
Ind
ex)
Net
herla
nds
Spai
n
Belg
ium
Den
mar
k
Fran
ce
Ger
man
y
Ital
y
Gre
ece
UK
Swed
en
Irel
and
USA
0
20
40
60
80
100
120 TFP, 1973
TFP, 2002
71% 107% 34% 85%45% 50% 50%
64% 29% 175%28%
81%
Source: Taken from Alston et al. (2010). See also Ball and Hadley (2003).Notes: Percentage changes given above each bar are the percentage increases in TFP between 1973 and 2002. Total Factor Productivity is a measure of the efficiency of agricultural productivity. It is defined by a measure of the growth in outputs over the growth in inputs over time, and is the residual growth in output that is unaccounted for by growth in these inputs. The inputs that tend to be included are land, water for irrigation, fuel, fertiliser, seed, pesticides, capital and labour. Growth in TFP is generally driven by technological change, scale economies and switching to more productive agricultural activities, though policy can also have an impact. In the UK, TFP increased between 1975-1984 at a rate of 1.68% per year due to inputs (mainly labour) falling faster than outputs. Since 1984, TFP has continued to rise but at a slower rate (0.26% per year) due in part to a stagnation of yield increases for crops. Public expenditure on R&D was the strongest factor linked to TFP growth in analysis by Thirtle et al. (2004) which included exploring the effects of climate. The analysis suggests that declines in yields relative to other European countries are possibly being driven by new technology and knowledge transfer not reaching farms adequately.
Chapter 2: Provisioning services – agriculture and forestry 41
1
The Government’s new Agri-tech Strategy should be an important lever for delivering greater dissemination of research and technology to the farm. Its effectiveness should be monitored.
The Government published a new Agri-Tech Strategy in July 2013. This aims to improve the productivity, sustainability and competitiveness of the agricultural industry by plugging a gap in applied research and facilitating collaboration between industry and the public and private research base. It also aims to improve the dissemination of research to farmers, including new technology and farming methods that should be beneficial for adaptation. The success of this strategy in terms of outreach to farmers and land managers, and its effect on total factor productivity, should be monitored.
2.5 Assessing preparedness in forestry
Context
Timber production is an important provisioning service alongside agriculture, contributing £1.7 billion in Gross Value Added (GVA) to the UK economy. This section of the report considers adaptation to changing climate space for timber production. Chapter 3 considers the role of woodlands as a habitat.
The Public Forest Estate is the largest timber producer in the country. Managed by Forestry Commission England, it accounts for around 16% of English woodland (2,050 km2).
In addition, the Forestry Commission licenses felling and provides grants to private forest managers for planting, improving and managing woodlands. At present there are about 20,000 grant schemes active. Together with the Public Forest Estate, this means that about 53% of the total woodland area in England is under active management.108
Vulnerability to climate change
Pest and disease outbreaks are currently the largest climate-related threat to tree health. Climate suitability (based on temperature, soil moisture, wind and soil type) for broadleaf and conifer species is expected to become a more significant risk with climate change, as is wildfire damage.
Current vulnerability:
• Current tree losses are caused predominantly by pest and disease outbreaks. In 2012 alone, new outbreaks of Chalara dieback in Ash, sweet chestnut blight, oak processionary moth and Asian longhorn beetle were reported. Pest and disease risk have already led to adaptive measures being taken, such as the moratorium on the planting of Corsican Pine due to Dothistroma needle blight,109 restrictions on the movement of ash and notification requirements for importation of ash, sweet chestnut and plane trees.
108 Forestry Commission Corporate Plan Performance Indicators. Best practice and legal requirements are set out in the UK Forestry Standard, including its Forestry and Climate Change Guidelines.
109 Also known as Red Band Needle Blight.
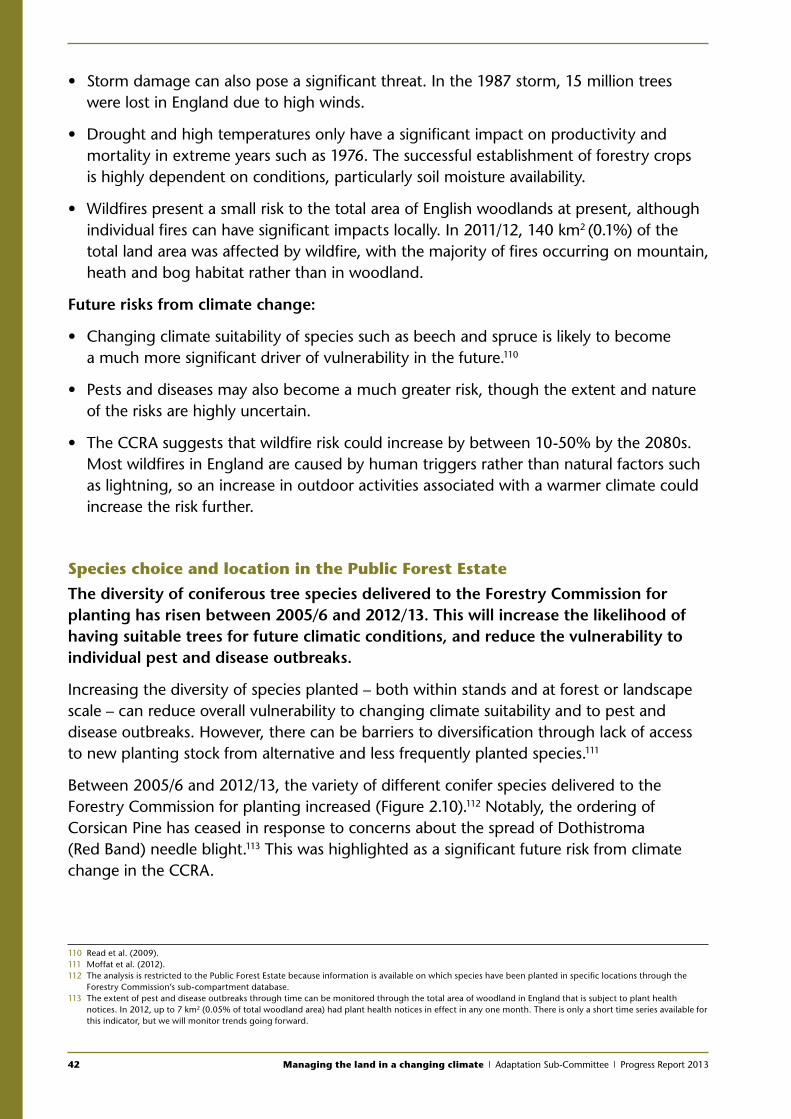
42 Managing the land in a changing climate | Adaptation Sub-Committee | Progress Report 2013
• Storm damage can also pose a significant threat. In the 1987 storm, 15 million trees were lost in England due to high winds.
• Drought and high temperatures only have a significant impact on productivity and mortality in extreme years such as 1976. The successful establishment of forestry crops is highly dependent on conditions, particularly soil moisture availability.
• Wildfires present a small risk to the total area of English woodlands at present, although
individual fires can have significant impacts locally. In 2011/12, 140 km2 (0.1%) of the total land area was affected by wildfire, with the majority of fires occurring on mountain, heath and bog habitat rather than in woodland.
Future risks from climate change:
• Changing climate suitability of species such as beech and spruce is likely to become a much more significant driver of vulnerability in the future.110
• Pests and diseases may also become a much greater risk, though the extent and nature of the risks are highly uncertain.
• The CCRA suggests that wildfire risk could increase by between 10-50% by the 2080s. Most wildfires in England are caused by human triggers rather than natural factors such as lightning, so an increase in outdoor activities associated with a warmer climate could increase the risk further.
Species choice and location in the Public Forest Estate
The diversity of coniferous tree species delivered to the Forestry Commission for planting has risen between 2005/6 and 2012/13. This will increase the likelihood of having suitable trees for future climatic conditions, and reduce the vulnerability to individual pest and disease outbreaks.
Increasing the diversity of species planted – both within stands and at forest or landscape scale – can reduce overall vulnerability to changing climate suitability and to pest and disease outbreaks. However, there can be barriers to diversification through lack of access to new planting stock from alternative and less frequently planted species.111
Between 2005/6 and 2012/13, the variety of different conifer species delivered to the Forestry Commission for planting increased (Figure 2.10).112 Notably, the ordering of Corsican Pine has ceased in response to concerns about the spread of Dothistroma (Red Band) needle blight.113 This was highlighted as a significant future risk from climate change in the CCRA.
110 Read et al. (2009).111 Moffat et al. (2012).112 The analysis is restricted to the Public Forest Estate because information is available on which species have been planted in specific locations through the
Forestry Commission’s sub-compartment database.113 The extent of pest and disease outbreaks through time can be monitored through the total area of woodland in England that is subject to plant health
notices. In 2012, up to 7 km2 (0.05% of total woodland area) had plant health notices in effect in any one month. There is only a short time series available for this indicator, but we will monitor trends going forward.
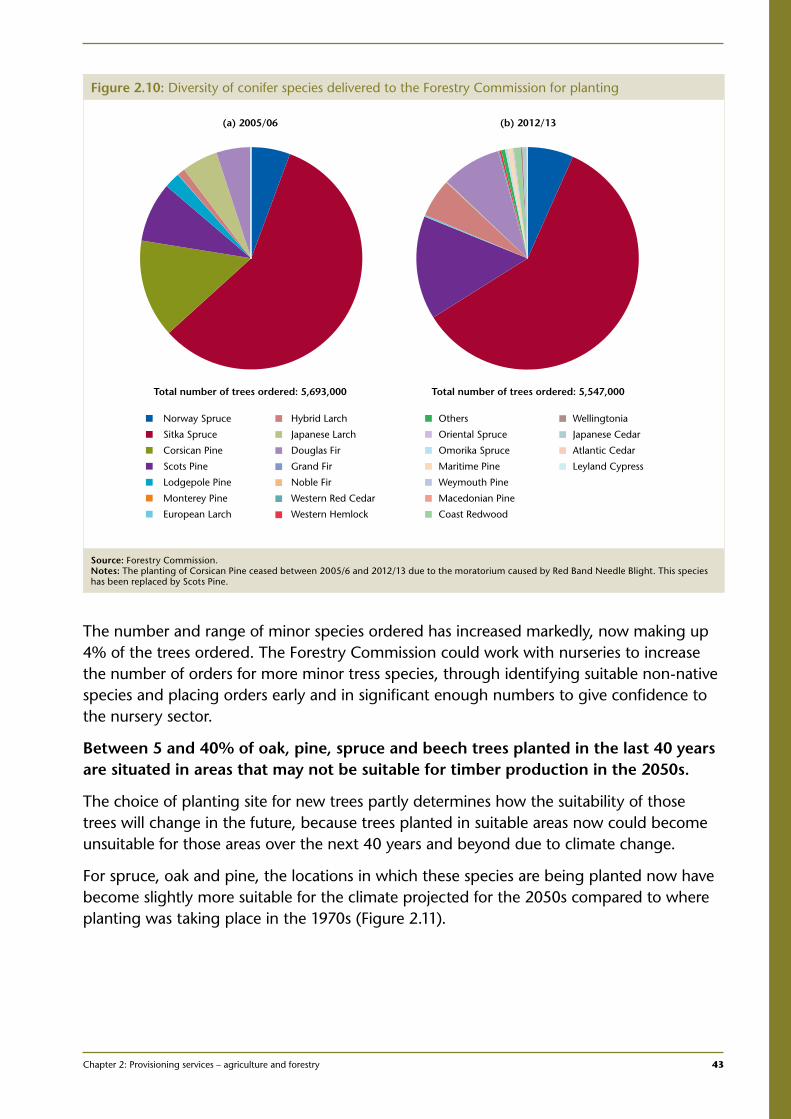
Chapter 2: Provisioning services – agriculture and forestry 43
1
The number and range of minor species ordered has increased markedly, now making up 4% of the trees ordered. The Forestry Commission could work with nurseries to increase the number of orders for more minor tress species, through identifying suitable non-native species and placing orders early and in significant enough numbers to give confidence to the nursery sector.
Between 5 and 40% of oak, pine, spruce and beech trees planted in the last 40 years are situated in areas that may not be suitable for timber production in the 2050s.
The choice of planting site for new trees partly determines how the suitability of those trees will change in the future, because trees planted in suitable areas now could become unsuitable for those areas over the next 40 years and beyond due to climate change.
For spruce, oak and pine, the locations in which these species are being planted now have become slightly more suitable for the climate projected for the 2050s compared to where planting was taking place in the 1970s (Figure 2.11).
Figure 2.10: Diversity of conifer species delivered to the Forestry Commission for planting
Norway Spruce
Sitka Spruce
Corsican Pine
Scots Pine
Lodgepole Pine
Monterey Pine
European Larch
Hybrid Larch
Japanese Larch
Douglas Fir
Grand Fir
Noble Fir
Western Red Cedar
Western Hemlock
Others
Oriental Spruce
Omorika Spruce
Maritime Pine
Weymouth Pine
Macedonian Pine
Coast Redwood
Wellingtonia
Japanese Cedar
Atlantic Cedar
Leyland Cypress
(a) 2005/06 (b) 2012/13
Total number of trees ordered: 5,693,000 Total number of trees ordered: 5,547,000
Source: Forestry Commission.Notes: The planting of Corsican Pine ceased between 2005/6 and 2012/13 due to the moratorium caused by Red Band Needle Blight. This species has been replaced by Scots Pine.
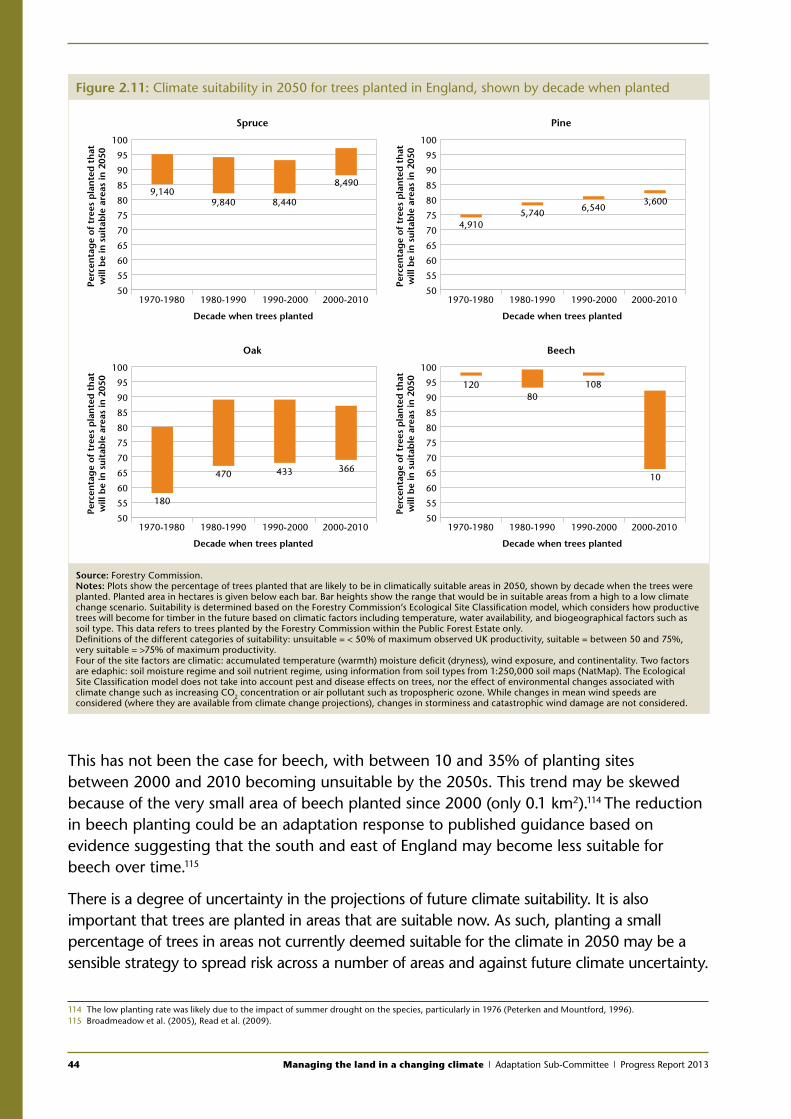
44 Managing the land in a changing climate | Adaptation Sub-Committee | Progress Report 2013
This has not been the case for beech, with between 10 and 35% of planting sites between 2000 and 2010 becoming unsuitable by the 2050s. This trend may be skewed because of the very small area of beech planted since 2000 (only 0.1 km2).114 The reduction in beech planting could be an adaptation response to published guidance based on evidence suggesting that the south and east of England may become less suitable for beech over time.115
There is a degree of uncertainty in the projections of future climate suitability. It is also important that trees are planted in areas that are suitable now. As such, planting a small percentage of trees in areas not currently deemed suitable for the climate in 2050 may be a sensible strategy to spread risk across a number of areas and against future climate uncertainty.
114 The low planting rate was likely due to the impact of summer drought on the species, particularly in 1976 (Peterken and Mountford, 1996).115 Broadmeadow et al. (2005), Read et al. (2009).
Figure 2.11: Climate suitability in 2050 for trees planted in England, shown by decade when planted
50
55
60
65
70
75
80
85
90
95
100
Spruce
1970-1980 1980-1990 1990-2000 2000-2010
Decade when trees planted
9,1409,840 8,440
8,490
Perc
enta
ge
of t
rees
pla
nte
d t
hat
will
be
in s
uita
ble
are
as in
205
0
50
55
60
65
70
75
80
85
90
95
100
Pine
1970-1980 1980-1990 1990-2000 2000-2010
Decade when trees planted
4,9105,740 6,540
3,600
Perc
enta
ge
of t
rees
pla
nte
d t
hat
will
be
in s
uita
ble
are
as in
205
0
50
55
60
65
70
75
80
85
90
95
100
Oak
1970-1980 1980-1990 1990-2000 2000-2010
Decade when trees planted
180
470 433 366
Perc
enta
ge
of t
rees
pla
nte
d t
hat
will
be
in s
uita
ble
are
as in
205
0
50
55
60
65
70
75
80
85
90
95
100
Beech
1970-1980 1980-1990 1990-2000 2000-2010
Decade when trees planted
12080
108
10
Perc
enta
ge
of t
rees
pla
nte
d t
hat
will
be
in s
uita
ble
are
as in
205
0
Source: Forestry Commission.Notes: Plots show the percentage of trees planted that are likely to be in climatically suitable areas in 2050, shown by decade when the trees were planted. Planted area in hectares is given below each bar. Bar heights show the range that would be in suitable areas from a high to a low climate change scenario. Suitability is determined based on the Forestry Commission’s Ecological Site Classification model, which considers how productive trees will become for timber in the future based on climatic factors including temperature, water availability, and biogeographical factors such as soil type. This data refers to trees planted by the Forestry Commission within the Public Forest Estate only. Definitions of the different categories of suitability: unsuitable = < 50% of maximum observed UK productivity, suitable = between 50 and 75%, very suitable = >75% of maximum productivity. Four of the site factors are climatic: accumulated temperature (warmth) moisture deficit (dryness), wind exposure, and continentality. Two factors are edaphic: soil moisture regime and soil nutrient regime, using information from soil types from 1:250,000 soil maps (NatMap). The Ecological Site Classification model does not take into account pest and disease effects on trees, nor the effect of environmental changes associated with climate change such as increasing CO2 concentration or air pollutant such as tropospheric ozone. While changes in mean wind speeds are considered (where they are available from climate change projections), changes in storminess and catastrophic wind damage are not considered.
Chapter 2: Provisioning services – agriculture and forestry 45
1
Timber production in privately owned woodlands
An issue for increasing the preparedness for climate change of timber-producing woodlands in England is bringing more privately owned woodlands into active management.
Around half of woodlands in England do not have management plans and are unlikely to be in active management.116 Landowners can receive grant aid for the preparation of management plans, for restocking woodland and for woodland improvement (Chapter 3), including access and preparation for harvesting, but these on their own may not be a sufficient driver to bring more woodlands into active management.
The lack of active management increases the sector’s vulnerability because it is only possible to implement adaptation measures in actively managed woodland. These measures include species diversification, the planting of species likely to be more suited to the future climate, changes to forest infrastructure (roads, drains and culverts), restructuring to increase resilience to wildfire and the conversion to continuous cover systems of management.117
Currently, the Forestry Commission monitors the percentage of woodlands that are in receipt of grant aid. Incentives to manage woodlands are provided through conditions attached to grant aid and felling licenses based on the UK Forestry Standard’s (UKFS) Forests and Climate Change Guidelines. The Government’s Forestry and Woodlands Policy Statement (2013) includes an aim to increase the proportion of woodland in management, defined as having a UKFS-compliant management plan in place. The Woodland Carbon Task Force also has an aim to increase woodland management.
Woodfuel markets could also act as an additional driver for increased woodland management, including through landowners responding to the Renewable Heat Incentive.
2.6 Conclusions
Our analysis suggests that there are risks to the productive capacity of farmland in England through reduced water availability and soil degradation. If realised, this will limit the ability of the sector to respond to warmer temperatures and higher food prices. These risks are being driven by land management decisions as well as climatic factors.
• Increased temperatures, reductions in summer rainfall and increases in demand for public water supply are likely to be concentrated in the largest crop producing areas in the south and east of England.
• Land use change and land management are the dominant drivers of soil erosion and losses in soil organic carbon. Climate change is likely to exacerbate the risk. Together, these factors could lead to irreversible losses in the productive capacity of some important agricultural soils. There is some evidence that the uptake of soil conservation measures is increasing on all but the highest grade agricultural land.
116 Frontier Economics (2013).117 Stokes and Kerr (2009).
46 Managing the land in a changing climate | Adaptation Sub-Committee | Progress Report 2013
The Government should consider how to incentivise further uptake of low-regret measures; water efficiency, on-farm water storage and soil conservation. These measures will help to manage the risks to productive capacity and retain flexibility about the way land is used.
• A reformed abstraction regime should include a pricing framework that reflects actual water scarcity, including changes in availability through time and space. If the reform process is not implemented until the mid 2020s, the Government should consider how to incentivise increased uptake of water efficiency and storage measures in the intervening period.
• Reforms to the Common Agricultural Policy (CAP) represent both an opportunity and a risk for incentivising uptake of water and soil management measures. The ongoing revision of Pillars 1 and 2 of the CAP present an opportunity to mainstream adaptation into measures for soil and water conservation. However, there is a risk that the level of effort required could be too low to incentivise further action on water and soil management. Funding for the CAP as a whole will decline from 2015, and could lead to reductions in support for water efficiency and storage measures. It is not yet clear what the UK requirements for water and soil management will be under the revised cross compliance mechanism or greening proposals under Pillar 1.
Research is needed to help better understand and build resilience to other threats to productive capacity.
• The risks to agricultural land from flooding and waterlogging are likely to increase with climate change, though the extent of future risk from waterlogging is uncertain. The costs, benefits and impacts of drainage infrastructure are unclear. On one hand, protecting the soil from inundation and waterlogging can protect agricultural productivity. On the other, it can increase the level of diffuse pollution or increase flood risk elsewhere.
• Although it is likely that the risks from pests and diseases for agriculture and forestry will increase, it is difficult to predict which pathogens are likely to become the most problematic under a changing climate. Increased surveillance is likely to be a low-regret response regardless of which pathogens take hold. More research is needed to quantify the relationship between increased surveillance effort and earlier detection of pests and diseases.
Improving the dissemination of applied research to the farm level should increase the resilience of the agriculture sector to future climate uncertainty, as well as improve agricultural efficiency overall.
• There is evidence that the decline in agricultural efficiency is being driven by a reduction in R&D spend and dissemination. More needs to be done through the Agri-tech strategy and on adaptation advice to support farmers in making the best decisions in the face of climate change. Adaptation advice should be included in Defra’s new integrated advice framework.
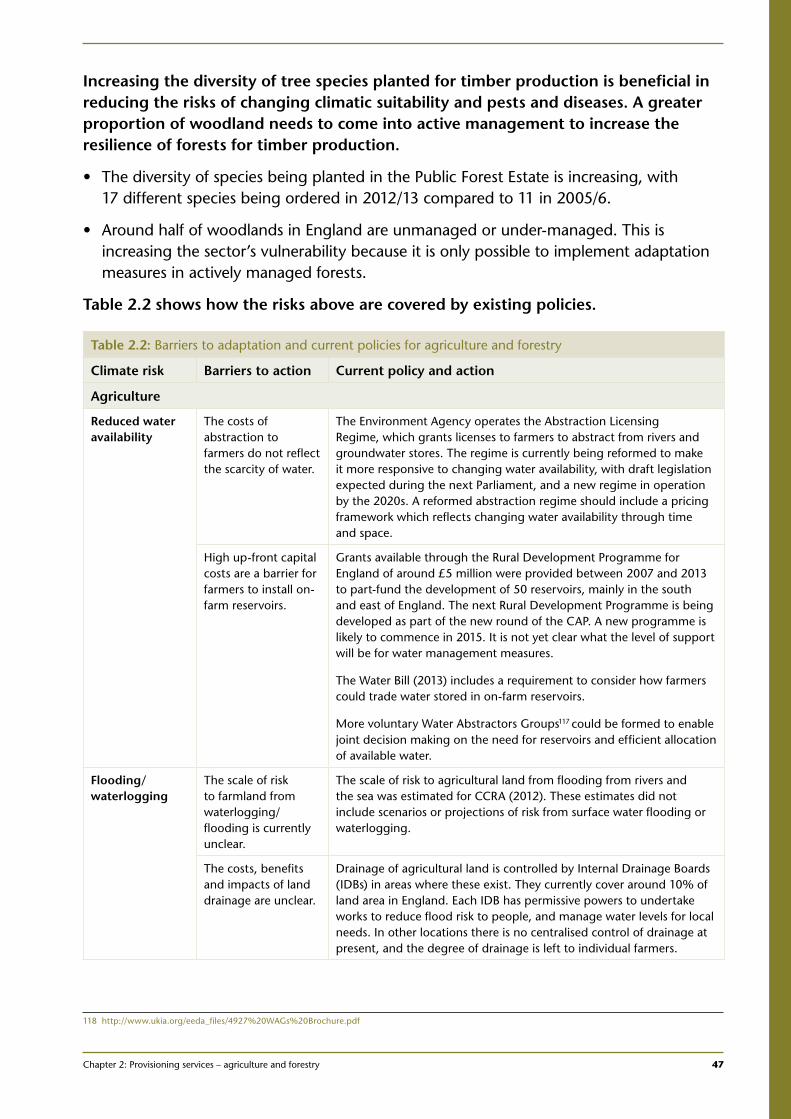
Chapter 2: Provisioning services – agriculture and forestry 47
1
Increasing the diversity of tree species planted for timber production is beneficial in reducing the risks of changing climatic suitability and pests and diseases. A greater proportion of woodland needs to come into active management to increase the resilience of forests for timber production.
• The diversity of species being planted in the Public Forest Estate is increasing, with 17 different species being ordered in 2012/13 compared to 11 in 2005/6.
• Around half of woodlands in England are unmanaged or under-managed. This is increasing the sector’s vulnerability because it is only possible to implement adaptation measures in actively managed forests.
Table 2.2 shows how the risks above are covered by existing policies.118
Table 2.2: Barriers to adaptation and current policies for agriculture and forestry
Climate risk Barriers to action Current policy and action
Agriculture
Reduced water availability
The costs of abstraction to farmers do not reflect the scarcity of water.
The Environment Agency operates the Abstraction Licensing Regime, which grants licenses to farmers to abstract from rivers and groundwater stores. The regime is currently being reformed to make it more responsive to changing water availability, with draft legislation expected during the next Parliament, and a new regime in operation by the 2020s. A reformed abstraction regime should include a pricing framework which reflects changing water availability through time and space.
High up-front capital costs are a barrier for farmers to install on-farm reservoirs.
Grants available through the Rural Development Programme for England of around £5 million were provided between 2007 and 2013 to part-fund the development of 50 reservoirs, mainly in the south and east of England. The next Rural Development Programme is being developed as part of the new round of the CAP. A new programme is likely to commence in 2015. It is not yet clear what the level of support will be for water management measures.
The Water Bill (2013) includes a requirement to consider how farmers could trade water stored in on-farm reservoirs.
More voluntary Water Abstractors Groups117 could be formed to enable joint decision making on the need for reservoirs and efficient allocation of available water.
Flooding/ waterlogging
The scale of risk to farmland from waterlogging/flooding is currently unclear.
The scale of risk to agricultural land from flooding from rivers and the sea was estimated for CCRA (2012). These estimates did not include scenarios or projections of risk from surface water flooding or waterlogging.
The costs, benefits and impacts of land drainage are unclear.
Drainage of agricultural land is controlled by Internal Drainage Boards (IDBs) in areas where these exist. They currently cover around 10% of land area in England. Each IDB has permissive powers to undertake works to reduce flood risk to people, and manage water levels for local needs. In other locations there is no centralised control of drainage at present, and the degree of drainage is left to individual farmers.
118 http://www.ukia.org/eeda_files/4927%20WAGs%20Brochure.pdf
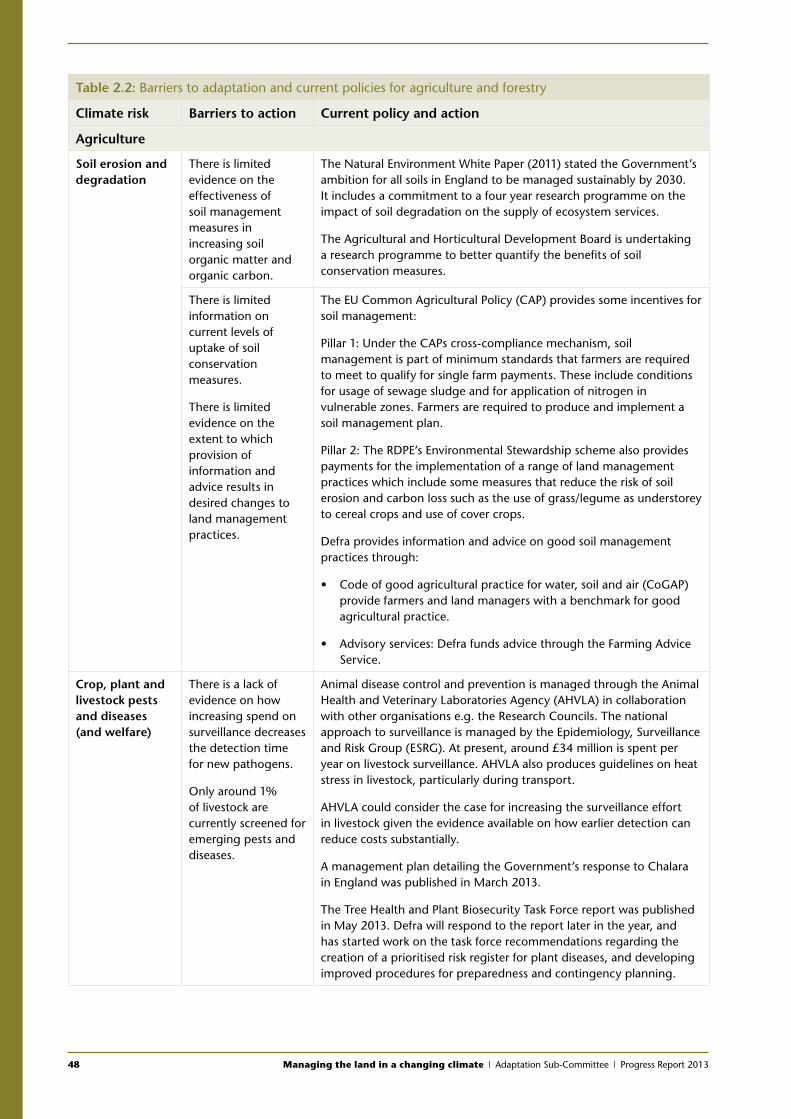
48 Managing the land in a changing climate | Adaptation Sub-Committee | Progress Report 2013
Table 2.2: Barriers to adaptation and current policies for agriculture and forestry
Climate risk Barriers to action Current policy and action
Agriculture
Soil erosion and degradation
There is limited evidence on the effectiveness of soil management measures in increasing soil organic matter and organic carbon.
The Natural Environment White Paper (2011) stated the Government’s ambition for all soils in England to be managed sustainably by 2030. It includes a commitment to a four year research programme on the impact of soil degradation on the supply of ecosystem services.
The Agricultural and Horticultural Development Board is undertaking a research programme to better quantify the benefits of soil conservation measures.
There is limited information on current levels of uptake of soil conservation measures.
There is limited evidence on the extent to which provision of information and advice results in desired changes to land management practices.
The EU Common Agricultural Policy (CAP) provides some incentives for soil management:
Pillar 1: Under the CAPs cross-compliance mechanism, soil management is part of minimum standards that farmers are required to meet to qualify for single farm payments. These include conditions for usage of sewage sludge and for application of nitrogen in vulnerable zones. Farmers are required to produce and implement a soil management plan.
Pillar 2: The RDPE’s Environmental Stewardship scheme also provides payments for the implementation of a range of land management practices which include some measures that reduce the risk of soil erosion and carbon loss such as the use of grass/legume as understorey to cereal crops and use of cover crops.
Defra provides information and advice on good soil management practices through:
• Code of good agricultural practice for water, soil and air (CoGAP) provide farmers and land managers with a benchmark for good agricultural practice.
• Advisory services: Defra funds advice through the Farming Advice Service.
Crop, plant and livestock pests and diseases (and welfare)
There is a lack of evidence on how increasing spend on surveillance decreases the detection time for new pathogens.
Only around 1% of livestock are currently screened for emerging pests and diseases.
Animal disease control and prevention is managed through the Animal Health and Veterinary Laboratories Agency (AHVLA) in collaboration with other organisations e.g. the Research Councils. The national approach to surveillance is managed by the Epidemiology, Surveillance and Risk Group (ESRG). At present, around £34 million is spent per year on livestock surveillance. AHVLA also produces guidelines on heat stress in livestock, particularly during transport.
AHVLA could consider the case for increasing the surveillance effort in livestock given the evidence available on how earlier detection can reduce costs substantially.
A management plan detailing the Government’s response to Chalara in England was published in March 2013.
The Tree Health and Plant Biosecurity Task Force report was published in May 2013. Defra will respond to the report later in the year, and has started work on the task force recommendations regarding the creation of a prioritised risk register for plant diseases, and developing improved procedures for preparedness and contingency planning.
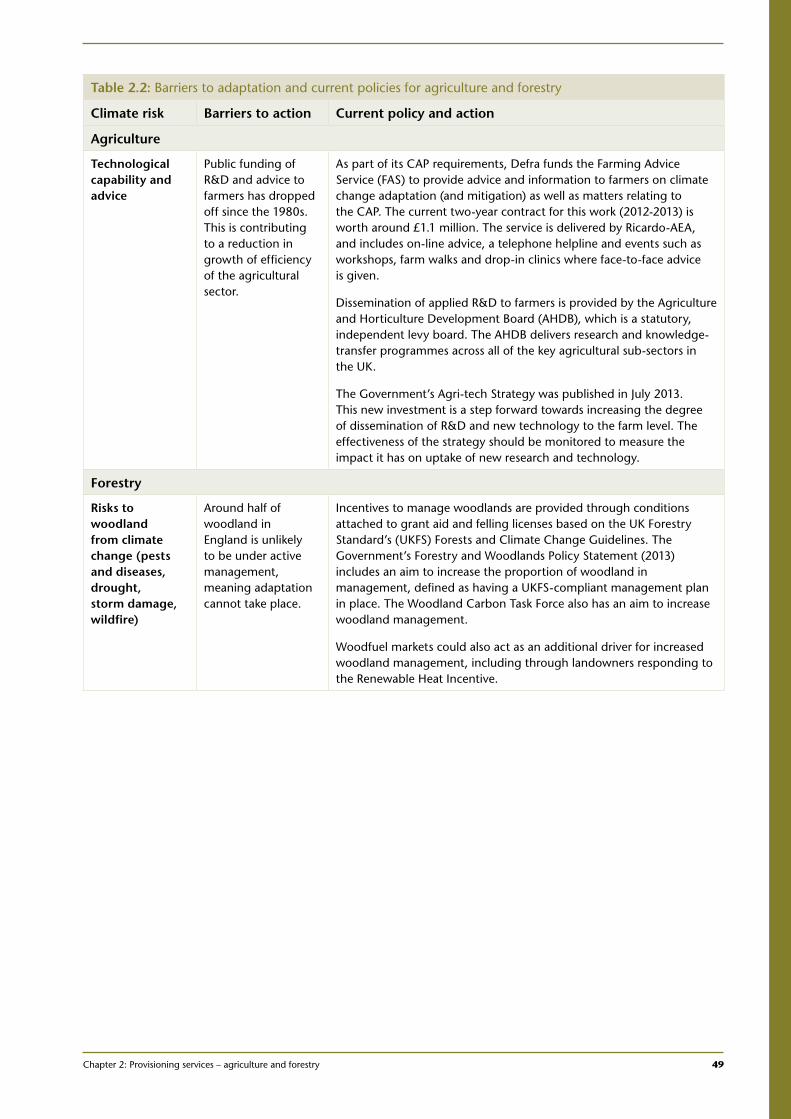
Chapter 2: Provisioning services – agriculture and forestry 49
1
Table 2.2: Barriers to adaptation and current policies for agriculture and forestry
Climate risk Barriers to action Current policy and action
Agriculture
Technological capability and advice
Public funding of R&D and advice to farmers has dropped off since the 1980s. This is contributing to a reduction in growth of efficiency of the agricultural sector.
As part of its CAP requirements, Defra funds the Farming Advice Service (FAS) to provide advice and information to farmers on climate change adaptation (and mitigation) as well as matters relating to the CAP. The current two-year contract for this work (2012-2013) is worth around £1.1 million. The service is delivered by Ricardo-AEA, and includes on-line advice, a telephone helpline and events such as workshops, farm walks and drop-in clinics where face-to-face advice is given.
Dissemination of applied R&D to farmers is provided by the Agriculture and Horticulture Development Board (AHDB), which is a statutory, independent levy board. The AHDB delivers research and knowledge-transfer programmes across all of the key agricultural sub-sectors in the UK.
The Government’s Agri-tech Strategy was published in July 2013. This new investment is a step forward towards increasing the degree of dissemination of R&D and new technology to the farm level. The effectiveness of the strategy should be monitored to measure the impact it has on uptake of new research and technology.
Forestry
Risks to woodland from climate change (pests and diseases, drought, storm damage, wildfire)
Around half of woodland in England is unlikely to be under active management, meaning adaptation cannot take place.
Incentives to manage woodlands are provided through conditions attached to grant aid and felling licenses based on the UK Forestry Standard’s (UKFS) Forests and Climate Change Guidelines. The Government’s Forestry and Woodlands Policy Statement (2013) includes an aim to increase the proportion of woodland in management, defined as having a UKFS-compliant management plan in place. The Woodland Carbon Task Force also has an aim to increase woodland management.
Woodfuel markets could also act as an additional driver for increased woodland management, including through landowners responding to the Renewable Heat Incentive.
50 Managing the land in a changing climate | Adaptation Sub-Committee | Progress Report 2013
Chapter 33.1 Introduction
3.2 Importance of wildlife in England
3.3 Vulnerability of wildlife to climate change
3.4 Priorities for wildlife adaptation
3.5 Assessing the ability of wildlife to adapt to climate change
3.6 Conclusions and policy advice
Chapter 3: Wildlife – semi-natural habitats 51
1
Chapter 3:
Wildlife – semi-natural habitats
Key messages
Wildlife is highly sensitive to climate change. While a warmer climate may bring some new species to this country, on balance the impacts of changes in temperature and rainfall patterns, sea level rise and extreme weather events are likely to be more negative than positive.
The ability of wildlife to adapt to climate change is directly affected by the way land, particularly semi-natural habitat, is managed. Wildlife stands the best chance of surviving and new species will be most able to colonise if there is an available, coherent suite of semi-natural habitats in good ecological condition.
The first priority for adaptation is to conserve and enhance the existing suite of semi-natural habitats and protected wildlife sites. Sustaining species at current sites for as long as possible will buy time for adaptation. This requires:
• Managing sites so that they are in a good ecological condition and restoring them where they are degraded.
• Increasing the size of existing wildlife sites and creating new areas of habitat.
• Enhancing the permeability of the wider landscape for wildlife, by creating stepping stones and restoring natural connections, such as ponds, rivers and hedgerows, and by improving the ecological quality of agricultural landscapes and urban areas.
Other adaptation actions may be needed to accommodate inevitable changes. These are likely to include: translocating some species, and adapting conservation objectives and site management regimes to reflect changing climatic conditions and shifting species distributions. However, these adaptations can only be effective if there is a coherent network of habitats in good condition for species to occupy in the first place.
Potential risksDecades of loss, pollution and fragmentation have resulted in most semi-natural habitats in England being degraded and reduced in extent. As a result, around one-third of priority species are in long-term decline.
Some 8,000 km2 of habitat has benefitted from restoration over the last decade or so. This has laid the foundations for future improvements that could start to reverse the long-term decline, but only if such effort is sustained. In 2012, the Government announced 12 Nature Improvement Areas that aim, through time, to restore and connect nature at a ‘landscape-scale’.
Despite these efforts, our analysis finds that:
• Three-quarters of semi-natural habitat is fragmented. Of the 17,000 km2 of semi-natural habitat in England (13% of land area), only around 4,000 km2 remain as extensive tracts, as for example in the North Pennines and the New Forest.
• Even in the case of protected wildlife sites, the available data points to a decline in the proportion of sites in an ecologically favourable condition, from 42% in 2003 to 37% in 2013. On the positive side, the majority of protected sites (60%) are now classed as ‘recovering’, compared to 14% in 2003. This means they have a management plan in place that should result in the site returning to a favourable condition in time, but only if the plan is fully implemented.
• Despite there being increases in some types of semi-natural habitat, there have been very few additions to the number and extent of protected wildlife sites over the last ten years. Some 540 km2 of new broadleaved woodland and 430 km2 of heathlands were created between 1998 and 2007 and 150 km2 of new wetland and intertidal habitat has been created since 2008. However, the total number of protected sites and the area of land they cover have remained broadly constant, at around 4,100 and 10,000 km2 respectively. Some habitat types have declined in extent over the last decade, such as fen and marsh.
52 Managing the land in a changing climate | Adaptation Sub-Committee | Progress Report 2013
Key messages
Options for further actionAmbitious policy goals have been set to enhance England’s semi-natural habitats by 2020, but it is not clear how these will be met. These goals include getting 50% of protected sites into a favourable condition and increasing the area of semi-natural habitat by 2,000 km2 by 2020. Meeting these goals would do much to sustain the improvements delivered over the last decade and so enhance the ability of wildlife to cope with changing climatic conditions.
To ensure that these policy goals are met, the Government should:
• Increase effort to tackle deep-seated and persistent pressures on semi-natural habitats, particularly from water and air pollution. Some action is underway, including measures to tackle water pollution through the EU Water Framework Directive. However, the continued and long-term decline in the condition and extent of a number of habitats and of the populations and ranges of many species, indicates that more effort is required.
• Strengthen the effectiveness of current regulations to facilitate wildlife adaptation. England has had a regulatory framework in place to protect and enhance wildlife for over 60 years, of which the EU Nature Directives have formed a core part since the 1990s. If implemented in full, the regulations would ensure that England has a coherent network of protected areas that are being managed in ways that support healthy populations of priority species. Going forward, the interpretation of the regulations will increasingly need to accommodate inevitable changes to species distributions.
• Further incentivise habitat restoration and creation. Any significant reduction in funding for conservation from existing schemes, particularly the Rural Development Programme for England (RDPE), would make it extremely challenging to meet the 2020 policy goals. There may be scope to develop effective market mechanisms that place an economic value on nature, such as through payment for ecosystem services and biodiversity offsetting.
3.1 Introduction
This chapter assesses the ability of wildlife in England to adapt to climate change.1 The chapter summarises the importance of wildlife in England; sets out how climate change may compound existing pressures, as well as provide opportunities for new species; explains the priorities for adaptation and explores how far existing actions go towards meeting these priorities. The chapter concludes with advice to Government on how the suite of semi-natural habitats in England can be enhanced so wildlife will be in a better position to cope with changing climatic conditions.
3.2 Importance of wildlife in England
England has a diverse range of wildlife and semi-natural habitats, with some species and habitats of global and European importance. England is home to internationally significant populations of breeding seabirds and wintering waders, over half the European species of mosses and about 10% of the world’s species of bumblebees. In an international context, some of the semi-natural habitats in England are relatively rare, for example England has 18% of the world’s heathlands, over half of all European chalk coasts and one-fifth of Europe’s Atlantic and North Sea estuaries.2
1 The focus of the chapter is on terrestrial and freshwater habitats and species.2 Natural England (2008).
Chapter 3: Wildlife – semi-natural habitats 53
1
As noted in Chapter 1, the natural environment provides a range of services that are vital for wellbeing and economic prosperity. Wildlife and semi-natural habitats are key components of the natural environment and central to the provision of ecosystem services.
Semi-natural habitats in England deliver key regulating services. Woodlands are important for regulating climate by taking up carbon from the atmosphere and can play a role in mitigating flood risk. Peatlands provide vital carbon storage and water purification. Coastal habitats are critically important for buffering flood defences and providing sediment supply. Chapters 4 and 5 assess the resilience of upland peat and coastal habitats to climate change.
Wildlife has great cultural significance. Many people feel a strong emotional connection to nature. Birds of all kinds, butterflies, trees such as oak, ash and beech, and mammals such as badgers, otters and seals collectively have a huge hold over the popular imagination. Public interest in wildlife has grown in recent decades, as seen with the increased membership of conservation charities.3
Wildlife and semi-natural habitats directly contribute to the leisure and tourist industries. Between 2009 and 2010, just over half the adult population in England visited natural environment settings at least once per week. This equated to approximately 2.9 billion leisure visits, generating revenue of £8.8 billion. More than half (55%) of all international visitors to England in 2011 went to countryside destinations.4
Wildlife also provides and supports provisioning services. There is direct economic value from fisheries, game species and honey production.5 Insect pollination (primarily by bees) is vital to crop production, with an estimated value of £370 million per year (8% of the UK cropping markets).6
The importance of conserving and enhancing wildlife in England has long been recognised. There is a history of protecting wildlife and designating nature reserves, starting with the formation of voluntary organisations concerned with nature conservation in late Victorian times. Since then, successive governments have put in place legislation and signed up to commitments to protect and enhance wildlife, both in the UK and internationally.
3.3 Vulnerability of wildlife to climate change
Species evolve to survive in a range of environmental conditions and are therefore highly sensitive to rapid and extreme changes, including from climate change.
All species have a ‘climate space’ within which they can survive and reproduce. As the climate changes, climate space will move. Species will need to track these movements. Their ability to move in line with climate space will depend on the availability of suitable habitat and their natural dispersal capability.
3 In 1944 the National Trust had fewer than 7,000 members; by 2011 it was 3.5 million. The RSPB currently has over 1 million members, compared with just 10,000 in 1960. UK National Ecosystem Assessment (2011a).
4 UK National Ecosystem Assessment (2011a).5 An estimated 3,000 tonnes of honey was produced in 2009. UK National Ecosystem Assessment (2011a).6 UK National Ecosystem Assessment (2011a).
54 Managing the land in a changing climate | Adaptation Sub-Committee | Progress Report 2013
Some species will gain climate space, while others will lose it.
• Many species are expected to gain space in England, as there are more species restricted by cooler northern range margins than warmer southern ones.7
• In the long-term, some species will run out of climate space. The geographical shifts in suitable climate conditions with higher average global temperatures are expected to be significant. For example, modelling suggests that by the end of the century the majority of European bird species will have experienced north and north-easterly shifts in their potential ranges of between 500 and 1,000 kilometres.8 Some species, particularly those associated with cold and mountainous areas, will eventually run out of suitable climate space.
• In the shorter term, some species will not be able to track the rapid changes in climate space expected with climate change, unless steps are taken to ensure suitable habitat is available. Species with limited dispersal abilities will be particularly vulnerable. For example, 30 out of 35 species of butterfly in the UK have failed to track changes in climate space due to warming over the last few decades.9
Some observed changes in the distribution of species in the UK can be attributed to warmer temperatures.
• Some southern species have expanded their range by between 30 and 60 km northwards over the last 25 years.10 Some species have also shifted to higher altitudes, in some cases at a rate of 3 to 10 metres per decade over the same time period. For example, three out of four northern butterfly species have retreated northwards and to higher elevations seeking cooler climate space.11
• A number of recent colonisations in this country, for example the Southern Emerald Damselfly, may have been facilitated by recent warming.12
• Migratory species are responding particularly rapidly. Reduced numbers of coastal wildfowl and wading birds have been recorded in the south and west of the UK. This is most likely because of ‘short-stopping’, where warmer conditions enable birds to remain longer at stop-over sites along their migration flyway in Germany and the Netherlands.13
As well as changes in distribution, there is some evidence that climate change may be directly affecting fundamental bio-physical processes that could have significant implications for wildlife and habitats. There is evidence that some spring and summer events now occur earlier in the year than previously. This includes earlier first leafing dates of trees (for example, oak leafing is occurring on average three weeks earlier than 100 years ago), flight times of moths and butterflies, egg-laying dates in birds, first spawning of amphibians and earlier fruiting of species such as blackberry.14 Such changes could disrupt critical food chains. For example, the timing of peak invertebrate abundance may be out of sync with the food-needs of nesting birds; the flowering times
7 Morecroft and Speakman (eds.) (2013). 8 Huntley et al. (2007) note that the modelling shows wide variation between species, with three-quarters projected to suffer declines in range.9 HR Wallingford (2012) for Defra.10 Morecroft and Speakman (eds.) (2013). 11 Ibid.12 Ibid.13 For example, between 1997 and 2007 winter populations of Berwick’s swan in the UK have declined by 44%. Morecroft and Speakman (eds.) (2013). 14 UK Biodiversity Partnership (2007) for Defra.
Chapter 3: Wildlife – semi-natural habitats 55
1
for some plants may not coincide with the emergence of key insect pollinators.15
Climate change is likely to compound a number of existing pressures facing wildlife. The UK Climate Change Risk Assessment highlighted:16
• Reductions in water availability and quality. Warmer, drier summers could increase soil moisture deficits and low river flows. Reduction in flow levels combined with higher water temperatures would decrease oxygen supplies available for aquatic habitats and increase the likelihood of harmful algal blooms. It is may also lead to the concentration of harmful pollutants in water bodies. These impacts on water quantity and quality will be exacerbated during drought events, when there will be increased demand for water from agriculture, industry and the public.
• Pests and diseases. Low winter temperatures currently act as a climatic control on many pests and diseases that pose a risk to native wildlife and habitats. Milder, wetter winters could increase the risk from damaging pathogens, such as red band needle blight, and increase problems from fungi and related organisms that thrive on high moisture levels. Changed conditions may also facilitate the spread of invasive species, further threatening native species already vulnerable because of other pressures.
• Extreme events. Any increase in the frequency and magnitude of heavy rainfall events, flooding, heatwaves and droughts could cause major damage to wildlife and habitats. Rising sea levels, combined with storm surges, could lead to the irreversible change of some habitats. Fire risk is particularly apparent during hot dry years or unusually dry seasons. At these times, a large-scale fire can cause severe damage to woodlands, heathland, or grassland habitats and the species they support.
On balance, the impacts of changes in climate are likely to be more negative than positive for wildlife. The CCRA, along with other major studies, concluded that climate change this century poses serious threats to wildlife in England and the UK as a whole.
3.4 Priorities for wildlife adaptation
The first priority for adaptation is to ensure that the existing suite of semi-natural habitats and protected wildlife sites are in a good condition and ecologically coherent, in order that wildlife has the best chance of being able to adapt.
The National Adaptation Programme (NAP) highlights the need to build ecological resilience and accommodate inevitable change.17 These are based on principles for conserving wildlife in a changing climate18 developed by the conservation sector over the last decade or so.19
15 See for example, Pearce-Higgins et al. (2004) in relation to golden plover and the availability of their prey, the Tipulid larvae.16 HR Wallingford (2012) for Defra.17 HM Government (2013). The NAP notes that if species populations are in a healthy condition, they stand the best chance of being able to survive the impacts
of climate change. It also highlights that adaptation will require an increasingly dynamic approach to conservation, accepting that species will shift location, current assemblages of wildlife will alter and new species will colonise.
18 Defra (2008). See also Morecroft et al. (2012) for a review of translating adaptation principles into practice. 19 Studies in the late 1990s and early 2000s (such as MONARCH and BRANCH) modelled changes in climate space for a range of UK species. The England
Biodiversity Strategy assessed the vulnerability of priority species and habitats in 2007, from which guidance was developed for conserving biodiversity in a changing climate. The Royal Commission on Environmental Pollution (2010) assessed the capacity of key institutional and legislative frameworks for coping with a changing climate.
56 Managing the land in a changing climate | Adaptation Sub-Committee | Progress Report 2013
An independent review in 2010, chaired by Professor Sir John Lawton, concluded that semi-natural habitats in England are not sufficiently coherent for wildlife to be resilient to climate change (Box 3.1).20
Box 3.1: Ecological coherence and condition of semi-natural habitats in England
The Lawton Review (2010) found that the current suite of semi-natural habitats and protected sites in England lacks the coherence for wildlife to be resilient to climate change. The main reasons for this are:
• Habitat loss and fragmentation: there have been widespread habitat losses over the last 60 years. For example, 97% of species-rich grasslands have been replaced by those managed for more intensive livestock production. Remaining patches of habitat are generally too small and fragmented.21 Many ‘natural connections’ in the landscape (such as rivers, hedgerows and ponds) have either been degraded or lost.22
• Lack of suitable management: many semi-natural habitats are under-managed, often because previous management regimes are no longer economically viable. For example, the cessation of grazing on habitats such as chalk grassland has resulted in scrub-invasion and a loss of the associated specialised wildlife. There has also been a sharp decline in the number of woodlands being regularly coppiced and managed,23 which leads to the canopy closing, causing specialist plants to decline and limiting natural regeneration.24
As well as habitat loss and fragmentation, there are other deep-seated and persistent pressures on wildlife in England.
• Pollution and nutrient enrichment: primarily caused by nitrogen fertilisers draining into watercourses; agricultural pesticides; and sulphur, nitrogen and ammonia emissions to the air. Between 1990 and 2006 there was a 16% increase in the area of crops treated with pesticides. In England, critical loads of nitrogen are currently exceeded across 89% of the area of sensitive habitats. About half of all rivers are failing to meet Good Ecological Status required by the Water Framework Directive (WFD) due to diffuse pollution.
• Low water levels: the abstraction of water for public supply and other uses, including agricultural and industrial, can put pressure on freshwater habitats, particularly during periods of drought. Over-abstraction is estimated to be putting up to 15% of rivers at risk of not meeting Good Ecological Status.25
• Spread of invasive species: some invasive species have detrimental impacts on native wildlife. An audit of England in 2005 found some 2,700 non-native species living in the wild, of which around 100 species, including Grey Squirrels, Sudden Oak Death, and Signal Crayfish, have caused considerable harm.
As a result, most wildlife in England is in decline. The scale of decline was highlighted by the recent State of Nature report, which concluded that 60% of the species for which data are available have declined over recent decades; 31% strongly so.26 Records going back to the 1970s for key indicator species show declines in the abundance of 52% of farmland bird species, 93% of habitat specialist butterflies, 44% of land snails and 89% of flowering plants.
Over the last decade there have been some improvements, but these have not been sufficient to reverse the general downward trend in species populations. The proportion of priority species increasing in abundance rose slightly from 10% in 2002 to 12% in 2008. However, around one-third of priority species in England are continuing to decline in population size and/or range and a small number have been lost over the last decade. The fact that many ‘specialist’ species are in decline, while more adaptable ‘generalists’ tend to be faring better, has profound implications for the future diversity of wildlife in England.27
21 22 23 24 25 26 27
20 Lawton et al. (2010).21 77% of SSSIs and 98% of Local Wildlife Sites are less than 100 hectares. The median size for SSSIs is 25 hectares and for LWS is 5 hectares. Lawton et al.
(2010).22 62% of rivers are heavily modified, 80% of ponds are in a poor condition and there has been a 21% loss of hedgerows between 1984-1990, followed by
a further 6% loss since 1998. Lawton et al. (2010).23 The proportion of broadleaved woodland classified as coppice or scrub fell from 49% in 1947 to 3% in 2007. Kirby et al.(2005).24 Three quarters of specialist woodland plants have declined since 1947. Kirby et al. (2005).25 Environment Agency (2012).26 State of Nature (2013).27 Defra (2012b).
Chapter 3: Wildlife – semi-natural habitats 57
1
The Lawton review summarised the essence of what needs to be done to enhance ecological coherence as: “more, bigger, better and joined” (Table 3.1).
Table 3.1: Action needed to enhance the coherence of semi-natural habitats in England (from Lawton et al. 2010)
Type of action Rationale
Better: improve the quality and heterogeneity of current wildlife sites through better habitat management; restore degraded habitats.
Well managed sites tend to have large populations of species, which are more robust to extreme events and produce more propagates to aid dispersal to new locations. Populations in well-managed sites are less likely to go extinct and produce up to 100 times more emigrants than poorly managed sites, which may colonise new areas.
Better management of remaining wildlife sites and habitats will mean that less new habitat will need to be created.
Bigger and More: make existing sites bigger, including through buffer zones; create new habitats.
Sites must be of a sufficient size so that wildlife populations can be self-sustaining and so more resilient to shocks, such as from extreme weather events.
Smaller sites also suffer from the ‘edge effect’, where the edges of habitats abutting a more hostile environment (e.g. a cereal field) differ from the habitat core, making them less suitable for many species and effectively reducing the working size of the site.
Joined: enhance connections between sites, either through physical corridors, or through ‘stepping stones’.
Ensuring sufficient ecological connections between sites is important, to enable species movement in response to changing climatic conditions and to reduce pressure on protected sites.
Wildlife moves through the countryside in part by using habitat features that act as natural connections, such as rivers, canals, hedgerows and ponds. However, species also need to move between wildlife sites or habitat patches via stepping stones in the wider environment, without using continuous corridors.
Action to enhance connectivity requires planning, as there is a risk it may make it easier for invasive species, pests and diseases to colonise new sites.
Improving the management of protected wildlife sites, such as Sites of Special Scientific Interest (SSSI), is a key adaptation step. Protected sites are the foundations of the semi-natural habitat resource in England. They are the remnants of previously extensive tracts of habitats.28 Improving the management of protected sites, for example, by increasing the structural diversity of vegetation can provide a range of microclimates that can help species adapt to changing climatic conditions at a site level. Recent analysis of changing distributions of seven bird and butterfly species in England found protected sites were colonised four times more frequently than would have been expected solely from the availability of protected sites in the landscape.29
The Lawton Review highlighted that there are areas of the country where delivering ‘more, bigger, better and joined’ requires ‘landscape-scale’ action. The report recommended that large areas should be recognised as Ecological Restoration Zones, where approaches aimed at establishing ecological networks should join up with other activities to achieve multiple benefits for wildlife and people. By working at the landscape-scale, there is also scope to identify and protect potential ‘refugia’ – areas such as north
28 Primarily made up of the Sites of Special Scientific Interest (SSSI) series and the EU Nature Directive sites (Special Protection Areas and Special Areas of Conservation, together known as Natura 2000 sites). Local Wildlife Sites and non-SSSI Ancient Semi-Natural Woodlands are also important, although they do not have a legislative underpinning. See Glossary for more details.
29 Thomas et al. (2012). 75% of new colonisations occurred in SSSIs, which only covered 14% of the area where colonization was being recorded. Records of an additional 256 invertebrate species with less intensive surveys supported these findings and showed 98% of species are disproportionately associated with SSSIs in newly colonised parts of their ranges.
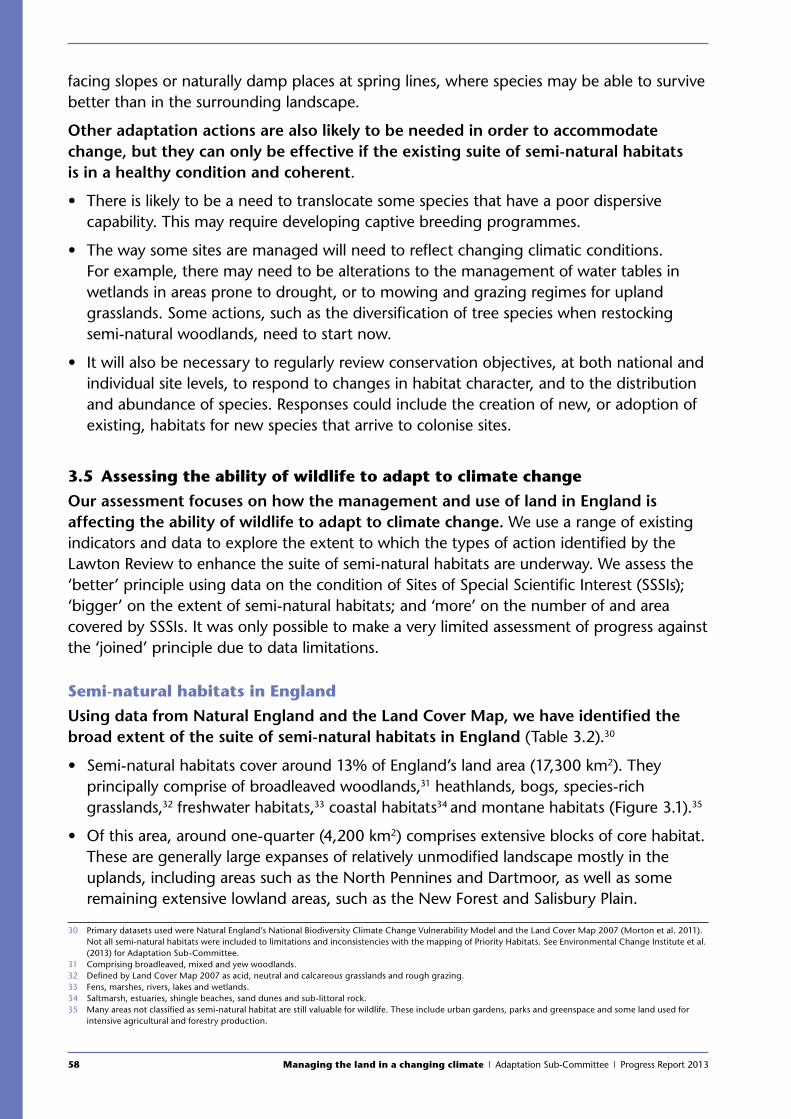
58 Managing the land in a changing climate | Adaptation Sub-Committee | Progress Report 2013
facing slopes or naturally damp places at spring lines, where species may be able to survive better than in the surrounding landscape.
Other adaptation actions are also likely to be needed in order to accommodate change, but they can only be effective if the existing suite of semi-natural habitats is in a healthy condition and coherent.
• There is likely to be a need to translocate some species that have a poor dispersive capability. This may require developing captive breeding programmes.
• The way some sites are managed will need to reflect changing climatic conditions. For example, there may need to be alterations to the management of water tables in wetlands in areas prone to drought, or to mowing and grazing regimes for upland grasslands. Some actions, such as the diversification of tree species when restocking semi-natural woodlands, need to start now.
• It will also be necessary to regularly review conservation objectives, at both national and individual site levels, to respond to changes in habitat character, and to the distribution and abundance of species. Responses could include the creation of new, or adoption of existing, habitats for new species that arrive to colonise sites.
3.5 Assessing the ability of wildlife to adapt to climate change
Our assessment focuses on how the management and use of land in England is affecting the ability of wildlife to adapt to climate change. We use a range of existing indicators and data to explore the extent to which the types of action identified by the Lawton Review to enhance the suite of semi-natural habitats are underway. We assess the ‘better’ principle using data on the condition of Sites of Special Scientific Interest (SSSIs); ‘bigger’ on the extent of semi-natural habitats; and ‘more’ on the number of and area covered by SSSIs. It was only possible to make a very limited assessment of progress against the ‘joined’ principle due to data limitations.
Semi-natural habitats in England
Using data from Natural England and the Land Cover Map, we have identified the broad extent of the suite of semi-natural habitats in England (Table 3.2).30
• Semi-natural habitats cover around 13% of England’s land area (17,300 km2). They principally comprise of broadleaved woodlands,31 heathlands, bogs, species-rich grasslands,32 freshwater habitats,33 coastal habitats34 and montane habitats (Figure 3.1).35
• Of this area, around one-quarter (4,200 km2) comprises extensive blocks of core habitat. These are generally large expanses of relatively unmodified landscape mostly in the uplands, including areas such as the North Pennines and Dartmoor, as well as some remaining extensive lowland areas, such as the New Forest and Salisbury Plain.
30 Primary datasets used were Natural England’s National Biodiversity Climate Change Vulnerability Model and the Land Cover Map 2007 (Morton et al. 2011). Not all semi-natural habitats were included to limitations and inconsistencies with the mapping of Priority Habitats. See Environmental Change Institute et al. (2013) for Adaptation Sub-Committee.
31 Comprising broadleaved, mixed and yew woodlands.32 Defined by Land Cover Map 2007 as acid, neutral and calcareous grasslands and rough grazing. 33 Fens, marshes, rivers, lakes and wetlands.34 Saltmarsh, estuaries, shingle beaches, sand dunes and sub-littoral rock.35 Many areas not classified as semi-natural habitat are still valuable for wildlife. These include urban gardens, parks and greenspace and some land used for
intensive agricultural and forestry production.
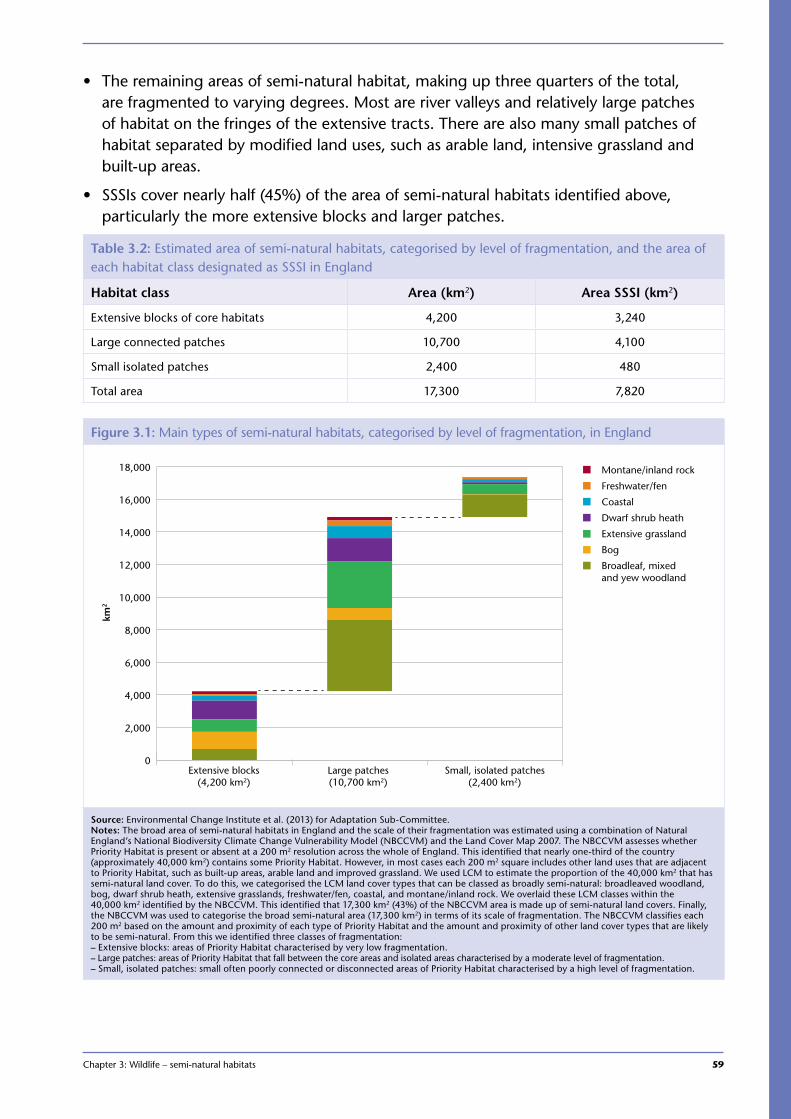
Chapter 3: Wildlife – semi-natural habitats 59
1
• The remaining areas of semi-natural habitat, making up three quarters of the total, are fragmented to varying degrees. Most are river valleys and relatively large patches of habitat on the fringes of the extensive tracts. There are also many small patches of habitat separated by modified land uses, such as arable land, intensive grassland and built-up areas.
• SSSIs cover nearly half (45%) of the area of semi-natural habitats identified above, particularly the more extensive blocks and larger patches.
Table 3.2: Estimated area of semi-natural habitats, categorised by level of fragmentation, and the area of each habitat class designated as SSSI in England
Habitat class Area (km2) Area SSSI (km2)
Extensive blocks of core habitats 4,200 3,240
Large connected patches 10,700 4,100
Small isolated patches 2,400 480
Total area 17,300 7,820
Figure 3.1: Main types of semi-natural habitats, categorised by level of fragmentation, in England
Montane/inland rock
Freshwater/fen
Coastal
Dwarf shrub heath
Extensive grassland
Bog
Broadleaf, mixedand yew woodland
km2
Extensive blocks(4,200 km2)
Large patches(10,700 km2)
Small, isolated patches(2,400 km2)
0
2,000
4,000
6,000
8,000
10,000
12,000
14,000
16,000
18,000
Source: Environmental Change Institute et al. (2013) for Adaptation Sub-Committee.Notes: The broad area of semi-natural habitats in England and the scale of their fragmentation was estimated using a combination of Natural England’s National Biodiversity Climate Change Vulnerability Model (NBCCVM) and the Land Cover Map 2007. The NBCCVM assesses whether Priority Habitat is present or absent at a 200 m2 resolution across the whole of England. This identified that nearly one-third of the country (approximately 40,000 km2) contains some Priority Habitat. However, in most cases each 200 m2 square includes other land uses that are adjacent to Priority Habitat, such as built-up areas, arable land and improved grassland. We used LCM to estimate the proportion of the 40,000 km2 that has semi-natural land cover. To do this, we categorised the LCM land cover types that can be classed as broadly semi-natural: broadleaved woodland, bog, dwarf shrub heath, extensive grasslands, freshwater/fen, coastal, and montane/inland rock. We overlaid these LCM classes within the 40,000 km2 identified by the NBCCVM. This identified that 17,300 km2 (43%) of the NBCCVM area is made up of semi-natural land covers. Finally, the NBCCVM was used to categorise the broad semi-natural area (17,300 km2) in terms of its scale of fragmentation. The NBCCVM classifies each 200 m2 based on the amount and proximity of each type of Priority Habitat and the amount and proximity of other land cover types that are likely to be semi-natural. From this we identified three classes of fragmentation:– Extensive blocks: areas of Priority Habitat characterised by very low fragmentation.– Large patches: areas of Priority Habitat that fall between the core areas and isolated areas characterised by a moderate level of fragmentation. – Small, isolated patches: small often poorly connected or disconnected areas of Priority Habitat characterised by a high level of fragmentation.
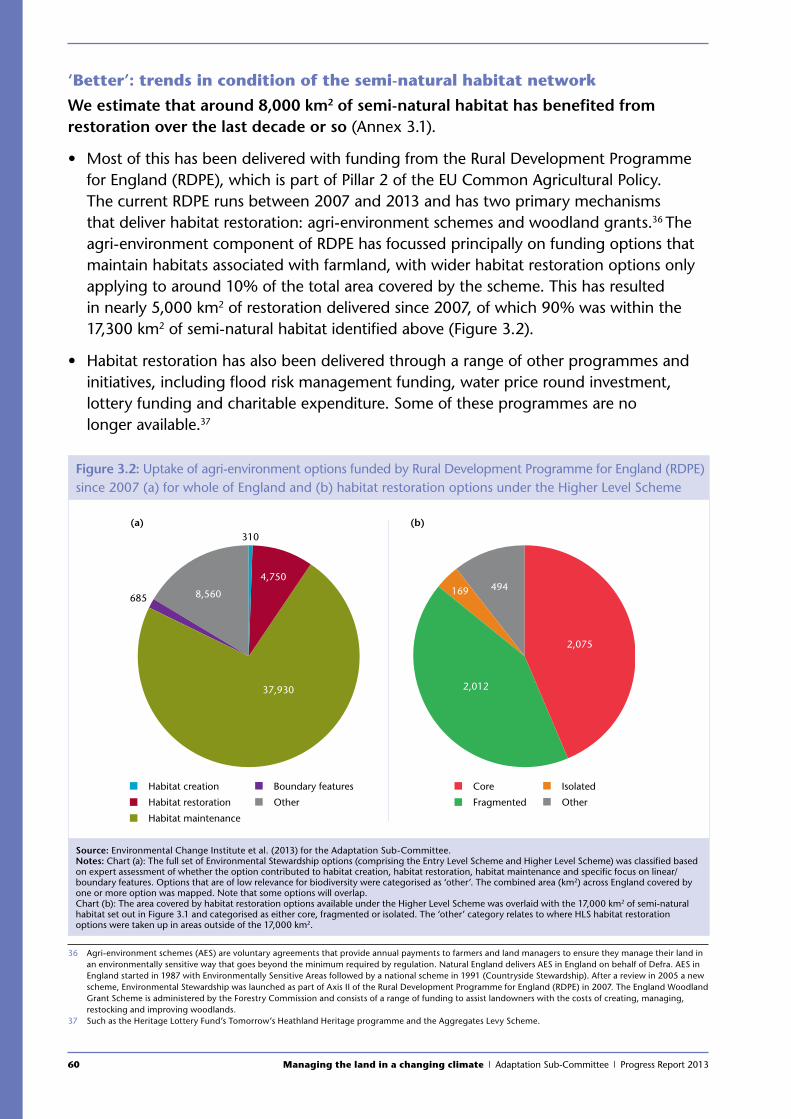
60 Managing the land in a changing climate | Adaptation Sub-Committee | Progress Report 2013
‘Better’: trends in condition of the semi-natural habitat network
We estimate that around 8,000 km2 of semi-natural habitat has benefited from restoration over the last decade or so (Annex 3.1).
• Most of this has been delivered with funding from the Rural Development Programme for England (RDPE), which is part of Pillar 2 of the EU Common Agricultural Policy.
The current RDPE runs between 2007 and 2013 and has two primary mechanisms that deliver habitat restoration: agri-environment schemes and woodland grants.36 The agri-environment component of RDPE has focussed principally on funding options that maintain habitats associated with farmland, with wider habitat restoration options only applying to around 10% of the total area covered by the scheme. This has resulted in nearly 5,000 km2 of restoration delivered since 2007, of which 90% was within the 17,300 km2 of semi-natural habitat identified above (Figure 3.2).
• Habitat restoration has also been delivered through a range of other programmes and initiatives, including flood risk management funding, water price round investment, lottery funding and charitable expenditure. Some of these programmes are no longer available.37
36 Agri-environment schemes (AES) are voluntary agreements that provide annual payments to farmers and land managers to ensure they manage their land in an environmentally sensitive way that goes beyond the minimum required by regulation. Natural England delivers AES in England on behalf of Defra. AES in England started in 1987 with Environmentally Sensitive Areas followed by a national scheme in 1991 (Countryside Stewardship). After a review in 2005 a new scheme, Environmental Stewardship was launched as part of Axis II of the Rural Development Programme for England (RDPE) in 2007. The England Woodland Grant Scheme is administered by the Forestry Commission and consists of a range of funding to assist landowners with the costs of creating, managing, restocking and improving woodlands.
37 Such as the Heritage Lottery Fund’s Tomorrow’s Heathland Heritage programme and the Aggregates Levy Scheme.
Figure 3.2: Uptake of agri-environment options funded by Rural Development Programme for England (RDPE) since 2007 (a) for whole of England and (b) habitat restoration options under the Higher Level Scheme
Habitat creation
Habitat restoration
Habitat maintenance
Boundary features
Other
Core
Fragmented
Isolated
Other
4,750
37,930
8,560685
310
2,075
2,012
494169
(a) (b)
Source: Environmental Change Institute et al. (2013) for the Adaptation Sub-Committee.Notes: Chart (a): The full set of Environmental Stewardship options (comprising the Entry Level Scheme and Higher Level Scheme) was classified based on expert assessment of whether the option contributed to habitat creation, habitat restoration, habitat maintenance and specific focus on linear/boundary features. Options that are of low relevance for biodiversity were categorised as ‘other’. The combined area (km2) across England covered by one or more option was mapped. Note that some options will overlap. Chart (b): The area covered by habitat restoration options available under the Higher Level Scheme was overlaid with the 17,000 km2 of semi-natural habitat set out in Figure 3.1 and categorised as either core, fragmented or isolated. The ‘other’ category relates to where HLS habitat restoration options were taken up in areas outside of the 17,000 km2.
Chapter 3: Wildlife – semi-natural habitats 61
1
Despite these efforts, there has been a decrease in the proportion of SSSIs in favourable condition, from 44% in 2003 to 37% in 2013 (Figure 3.3a). Within the 4,200 km2 of extensive core tracts of semi-natural habitat, the proportion of SSSIs in favourable condition is even lower at 23% (Figure 3.3b). Only around one-tenth of upland SSSIs (blanket bog and upland heath) are in favourable condition. (Figure 3.3c).
At the same time, there has been a four-fold increase in SSSIs classed as ‘unfavourable recovering’, from 14% in 2003 to around 60% in 2013. This classification signifies that Natural England is satisfied that an appropriate management plan is in place for the site to reach favourable condition, assuming the plan is fully implemented. This substantial improvement was the result of a ten year programme, established in 2000, that set a clear target to bring 95% of SSSIs into a favourable or recovering condition by 2010.38 Agri-environment funding has been the main delivery mechanism, with 93% of the SSSI network covered by one or more scheme.39
Uncertainty remains as to the proportion of recovering SSSIs that will reach favourable status by 2020. Having in place an agreed plan for recovery is clearly a positive step, but does not necessarily mean that favourable condition will be achieved, at least in the short-term. Restoration of habitats such as woodlands and blanket bogs can take many decades. Success is also dependent on continued funding to deliver the management plan. Natural England estimates that nearly one-fifth of all SSSIs (covering some 2,050 km2) may be at risk of moving into a declining ecological condition over the next 10 years. They identify two main causes of this risk:40
• Long-term management not continuing. Some 580 km2 of SSSIs do not have management agreements in place and a further 450 km2 are at risk of the land manager either not complying with the agreement or implementation failing due to a lapse in funding.
• Persistent and long-term pressures. These include declines in water quality or changes in water levels (370 km2) and invasive species, disease and deer damage (70 km2).
38 The programme was coordinated by Defra in partnership with those regulating or incentivising SSSI land use (Natural England, Environment Agency and Forestry Commission), as well as major public landowners (Ministry of Defence, Crown Estates), private landowners (water companies) and charitable landowners (National Trust, The Wildlife Trusts and RSPB).
39 Natural England (2011a). One-third (33%) of SSSIs are under Environmental Stewardship and 60% are under the classic schemes (Countryside Stewardship and Environmentally Sensitive Areas).
40 Natural England (2011b) states that by 2020 a “higher proportion” of SSSIs are expected to be in favourable condition if the management agreements in place continue, although they note that “a significant number” will require more than ten years.
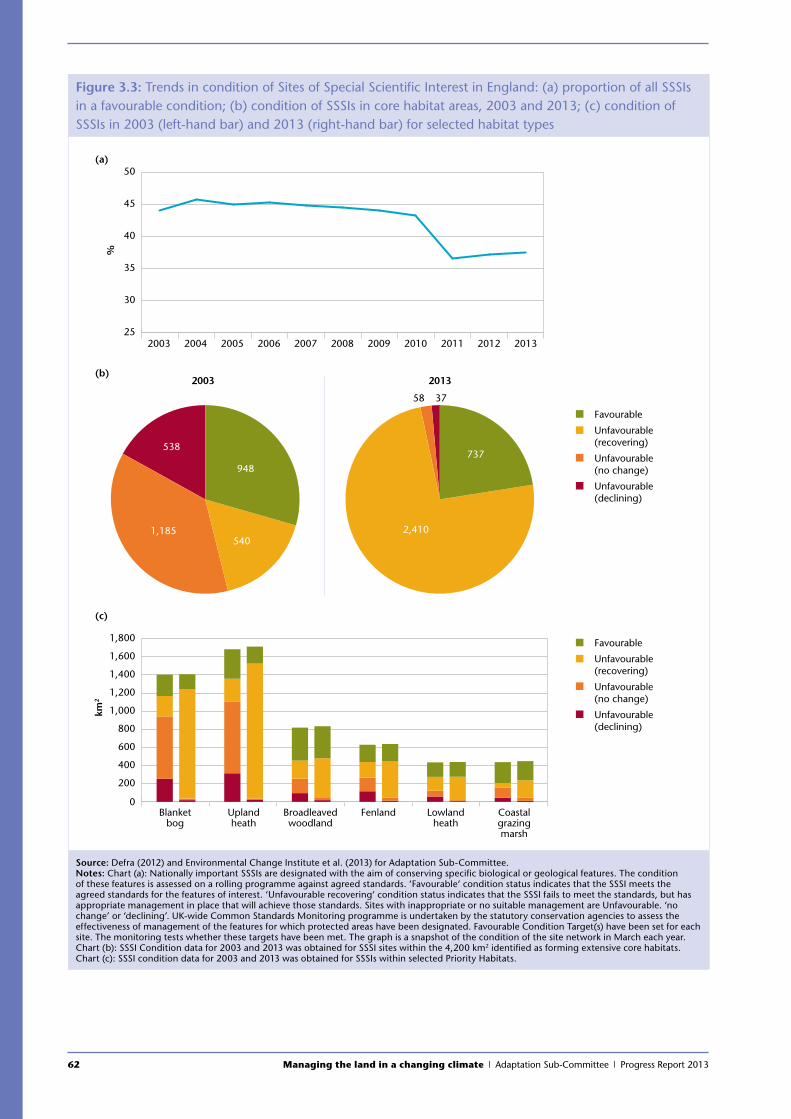
62 Managing the land in a changing climate | Adaptation Sub-Committee | Progress Report 2013
Figure 3.3: Trends in condition of Sites of Special Scientific Interest in England: (a) proportion of all SSSIs in a favourable condition; (b) condition of SSSIs in core habitat areas, 2003 and 2013; (c) condition of SSSIs in 2003 (left-hand bar) and 2013 (right-hand bar) for selected habitat types
25
30
35
40
45
50
2012201120102009200820072006200520042003 2013
%
(a)
Favourable
Unfavourable(recovering)
Unfavourable (no change)
Unfavourable (declining)
Favourable
Unfavourable(recovering)
Unfavourable (no change)
Unfavourable (declining)
948
540
538737
2,410
58
1,185
37
2003 2013(b)
(c)
km2
Blanketbog
Uplandheath
Broadleavedwoodland
Fenland Lowlandheath
Coastalgrazingmarsh
0
200
400
600
800
1,000
1,200
1,400
1,600
1,800
Source: Defra (2012) and Environmental Change Institute et al. (2013) for Adaptation Sub-Committee.Notes: Chart (a): Nationally important SSSIs are designated with the aim of conserving specific biological or geological features. The condition of these features is assessed on a rolling programme against agreed standards. ‘Favourable‘ condition status indicates that the SSSI meets the agreed standards for the features of interest. ‘Unfavourable recovering‘ condition status indicates that the SSSI fails to meet the standards, but has appropriate management in place that will achieve those standards. Sites with inappropriate or no suitable management are Unfavourable. ‘no change’ or ‘declining’. UK-wide Common Standards Monitoring programme is undertaken by the statutory conservation agencies to assess the effectiveness of management of the features for which protected areas have been designated. Favourable Condition Target(s) have been set for each site. The monitoring tests whether these targets have been met. The graph is a snapshot of the condition of the site network in March each year. Chart (b): SSSI Condition data for 2003 and 2013 was obtained for SSSI sites within the 4,200 km2 identified as forming extensive core habitats. Chart (c): SSSI condition data for 2003 and 2013 was obtained for SSSIs within selected Priority Habitats.
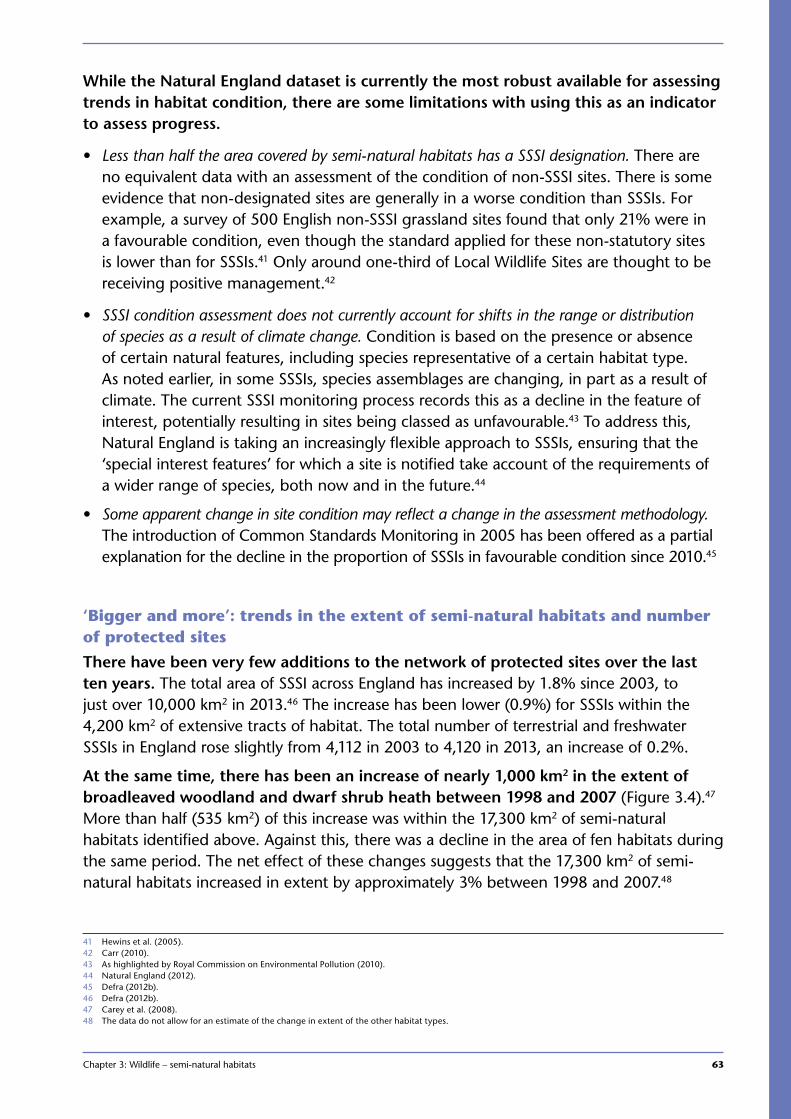
Chapter 3: Wildlife – semi-natural habitats 63
1
While the Natural England dataset is currently the most robust available for assessing trends in habitat condition, there are some limitations with using this as an indicator to assess progress.
• Less than half the area covered by semi-natural habitats has a SSSI designation. There are no equivalent data with an assessment of the condition of non-SSSI sites. There is some evidence that non-designated sites are generally in a worse condition than SSSIs. For example, a survey of 500 English non-SSSI grassland sites found that only 21% were in a favourable condition, even though the standard applied for these non-statutory sites is lower than for SSSIs.41 Only around one-third of Local Wildlife Sites are thought to be receiving positive management.42
• SSSI condition assessment does not currently account for shifts in the range or distribution of species as a result of climate change. Condition is based on the presence or absence of certain natural features, including species representative of a certain habitat type. As noted earlier, in some SSSIs, species assemblages are changing, in part as a result of climate. The current SSSI monitoring process records this as a decline in the feature of interest, potentially resulting in sites being classed as unfavourable.43 To address this, Natural England is taking an increasingly flexible approach to SSSIs, ensuring that the ‘special interest features’ for which a site is notified take account of the requirements of a wider range of species, both now and in the future.44
• Some apparent change in site condition may reflect a change in the assessment methodology. The introduction of Common Standards Monitoring in 2005 has been offered as a partial explanation for the decline in the proportion of SSSIs in favourable condition since 2010.45
‘Bigger and more’: trends in the extent of semi-natural habitats and number of protected sites
There have been very few additions to the network of protected sites over the last ten years. The total area of SSSI across England has increased by 1.8% since 2003, to just over 10,000 km2 in 2013.46 The increase has been lower (0.9%) for SSSIs within the 4,200 km2 of extensive tracts of habitat. The total number of terrestrial and freshwater SSSIs in England rose slightly from 4,112 in 2003 to 4,120 in 2013, an increase of 0.2%.
At the same time, there has been an increase of nearly 1,000 km2 in the extent of broadleaved woodland and dwarf shrub heath between 1998 and 2007 (Figure 3.4).47 More than half (535 km2) of this increase was within the 17,300 km2 of semi-natural habitats identified above. Against this, there was a decline in the area of fen habitats during the same period. The net effect of these changes suggests that the 17,300 km2 of semi-natural habitats increased in extent by approximately 3% between 1998 and 2007.48
41 Hewins et al. (2005).42 Carr (2010). 43 As highlighted by Royal Commission on Environmental Pollution (2010).44 Natural England (2012). 45 Defra (2012b). 46 Defra (2012b). 47 Carey et al. (2008).48 The data do not allow for an estimate of the change in extent of the other habitat types.
64 Managing the land in a changing climate | Adaptation Sub-Committee | Progress Report 2013
• The area of broadleaved woodland in England grew from 9,270 km2 in 1998 to 9,810 km2 in 2007, an increase of 540 km2. Since 2007, a further 160 km2 of new woodland has been created across England through the Woodland Grant Scheme (Annex 3.1). More than half of the new woodland created between 1998 and 2007 was within 17,300 km2 of semi-natural habitat identified above. This suggests that some woodland creation is directly enhancing coherence.49
• Across England, the area of dwarf shrub heath increased by 430 km2 from 2880 km2 to 3310 km2. The majority of this was within the 17,300 km2 of semi-natural habitat. This increase in heathland is likely to be the result of a number of habitat creation schemes noted in Annex 3.1.50
• The combined area of bog and fen declined by 50 km2 from 2,620 km2 to 2,570 km2 across England. It is not clear from the data what land use replaced these habitats.
Action has also been taken to create compensatory habitat under the EU Habitats Directive. For example, the Environment Agency has created some 150 km2 of wetland and intertidal habitat since 2008/09. This has been in order to comply with requirements to provide compensatory habitat for the impact of coastal squeeze on Natura 2000 sites (see Chapter 5 for more detail). In many cases, the Environment Agency has worked in partnership with land-owning charities, such as the RSPB, Wildlife Trusts and National Trust, who have also contributed through their own funds. However, these new wildlife sites are often not designated as they can take time to develop sufficient ecological interest.
49 See also Quine and Watts (2007), who examined how targeted woodland creation has helped to de-fragment agricultural landscapes on the Isle of Wight.50 Specifically the Heritage Lottery Fund’s Tomorrow’s Heathland Heritage programme and the Aggregates Levy Scheme.
Figure 3.4: Changes in extent of broadleaved woodland, dwarf shrub heath, bog and fen between 1998-2007 in England and proportion of change within area currently defined as semi-natural habitat
Outside semi-natural habitat area (as currently defined)
Inside semi-natural habitat area(as currently defined)
km2
19982007199820071998 20070
2,000
4,000
6,000
8,000
10,000
Broadleaved woodland Dwarf shrub heath
Broad semi-natural habitat types
Bog and fen
Source: Environmental Change Institute et al. (2013) for Adaptation Sub-Committee using Countryside Survey 2007 data.Notes: Countryside Survey (2007) data was used to identify changes in the extent of broadleaved woodland, dwarf shrub heath, bog and fen for the whole of England between 1998 and 2007. The area of each of these habitats was then calculated within the suite of semi-natural habitats identified in Figure 3.1 above using LCM2007. Values for 1998 were estimated by applying the changes identified within the Countryside Survey to the LCM data. Note that for the purposes of this assessment, bog and fen were grouped into one category. This was due to the data that was used to identify the 17,000 km2 is based on Natural England mapping of Priority Habitats, which does not match with the Countryside Survey data for these two broad habitat types.
Chapter 3: Wildlife – semi-natural habitats 65
1
’Landscape-scale’ conservation is gaining increasing focus. Initiatives such as the RSPB’s Futurescapes and the Wildlife Trust’s Living Landscapes have pioneered strategic approaches to landscape-scale ecological restoration. In the Natural Environment White Paper, the Government committed to fund the creation of 12 Nature Improvement Areas between 2011 and 2015.51 The areas identify opportunities to restore and create habitats on a significant scale and look to incorporate relevant policies to safeguard sites for potential restoration and creation in local development plans.52
‘Joined’: trends in the connectivity of the wider countryside
Assessing connectivity between areas of semi-natural habitat is not straightforward, either conceptually or practically. Species will often move between wildlife sites or habitat patches without using continuous corridors. Connectivity should, therefore, ideally be measured in terms of the size and distribution of patches of habitat and the relative ease with which species can move between them. However, this will vary from species to species, making it difficult to arrive at a single measure.
Understanding trends in connectivity would be a useful addition to the evidence base. Defra have published an indicator of connectivity for two broad habitat types (broad-leaved woodland and neutral grassland). This calculates the probability of movement of a hypothetical species typical of the habitat type, between habitat patches. However, the indicator is not thought to be sufficiently robust for use at this stage and further work is planned.53
For the purposes of our assessment, we have focussed on assessing trends in the extent and condition of natural ‘stepping stones’ and connections, such as ponds, hedgerows, rivers and streams. Based on data from the most recent Countryside Survey, there is evidence of both positive and negative trends between 1998 and 2007.
• The number of ponds increased by 18% to 37,000 in total, with most of the increase in the eastern half of the country. At the same time, there was a decline in the species richness of ponds, with almost 80% considered to be in poor condition.54
• There was a statistically significant decrease of 6% in the length of managed hedgerows (from 428,000 km to 402,000 km). Over one-fifth of hedgerows present in 1984 had been lost by 2007,55 replaced by lines of individual trees and relict hedges, reflecting a reduction in management intensity.
• The average number of aquatic plant species in headwater streams increased by 44%.56 The physical quality of headwater streams also improved, with an increase in the frequency of natural features, such as gravel bars and bank-side trees.
51 Defra (2012a). 52 This is in line with the National Planning Policy Framework, which states that local authorities should set out a strategic approach in their local plans, planning
positively for the creation, protection, enhancement and management of networks of biodiversity and green infrastructure. 53 Defra (2012b). 54 Based on an assessment of a range of vegetation known to be indicative of degradation. On average, only seven plant species were present per pond,
compared with an expected richness of 20 species in good quality ponds. Only 9% of ponds were assessed as being in a good condition in 2007. Carey et al. (2008).
55 The total length of managed hedgerows in 1984 was 511,000 km. Carey et al. (2008).56 From 2.7 to 3.9 aquatic plant species per stream section. 29 plant species were recorded in 2007 that were not present in previous surveys. Carey et al. (2008).
66 Managing the land in a changing climate | Adaptation Sub-Committee | Progress Report 2013
3.6 Conclusions and policy advice
The last decade has seen some action to improve the condition and coherence of semi-natural habitats in England. The focus has been primarily on getting management plans in place that, if fully implemented, should eventually result in the ecological recovery of the SSSI network. There have also been some innovative examples of habitat restoration and creation beyond protected sites, and the first steps have been taken towards ‘landscape-scale’ approaches. This effort has laid the foundations for future improvements that could begin to reverse some of the long-term trends of wildlife decline. Such an outcome, however, depends critically on the level of habitat management, restoration and creation being sustained and increased.
Ambitious policy goals are in place that would help to enhance the health and coherence of semi-natural habitats. The UK has signed up to international commitments to halt the loss of global biodiversity by 2020. In England, these commitments have been translated into a number of specific goals (Box 3.2). Meeting these goals would do much to increase the ability of wildlife to cope with changing climatic conditions.
It is far from clear, however, how these goals will be delivered. Our analysis suggests a mix of positive and negative trends in terms of both the ecological condition and coherence of semi-natural habitats. However, deep-seated and long-standing pressures on semi-natural habitats continue to cause habitat loss, degradation and fragmentation. At the current rate of progress, the goal of having half of all SSSIs in favourable condition by 2020 is unlikely to be achieved. The rate of habitat creation will also need to be increased for the goal of 2,000 km2 of additional habitat by 2020 to be met. It also is unclear how the remaining policy goals (17% of land and inland water being conserved and 15% of ‘degraded ecosystems’ being restored by 2020) are to be defined.
In order to meet these policy goals, the Government should:
• Ensure concerted effort to tackle deep-seated and persistent pressures on semi-natural habitats, particularly from water and air pollution. Some action is underway, including measures to tackle water pollution through the EU Water Framework Directive. However, the continued and long-term decline in a number of habitats and many species suggests that more effort is required.
Chapter 3: Wildlife – semi-natural habitats 67
1
• Strengthen the implementation of current regulations to facilitate wildlife adaptation. England has had a regulatory framework in place to protect and enhance wildlife for over 60 years. The EU Nature Directives have formed a core part of this framework since the 1990s57 and require action to enhance connectivity through the creation or restoration of habitat.58 However, there is both scope and need for fuller implementation of these regulations so they deliver effectively for adaptation.59 This could include strategically identifying and safeguarding land for habitat creation that coincides with projected changes in climate space. The Nature Improvement Areas provide an important opportunity to take forward this approach. Local authorities outside the NIAs should also proactively seek opportunities for habitat restoration and creation through the planning system.
• Further incentivise habitat restoration and creation: given the public nature of the benefits of wildlife conservation, there is a need to provide incentives to private actors to deliver additional action beyond that required by regulation. Incentives could be enhanced by:
– Providing clarity on the next phase of the Rural Development Plan for England (RDPE). This has provided some £3 billion of funding for agri-environment schemes and improving woodland management between 2007 and 2013.60 Any significant reduction in funding in the next phase of the programme would make it extremely challenging to meet the 2020 policy goals, particularly putting at risk current management agreements to improve the condition of SSSIs.
– Developing effective market mechanisms that place an economic value on nature. The Government is currently considering how it can develop the potential for market mechanisms that deliver additional investment in the natural environment. The Ecosystem Market Task Force recently highlighted biodiversity offsetting as a way of securing net gain for nature through planning and development.61 The recently published action plan for developing the potential of Payment for Ecosystem Services includes possible mechanisms that could deliver additional habitat restoration and creation, including ways to potentially enhance agri-environment schemes in the future.62
57 The Habitats Directive was transposed into the Conservation (Natural Habitats, &c.) Regulations in 1994 (England and Wales).58 Article 3 of the Birds Directive and Article 10 of the Habitats Directive require Member States to take action to restore and create habitat where this will
contribute to the conservation of notified habitat or species. 59 See Cliquet et al. (2009) and Dodd et al. (2010) who both argue there has been an inconsistency across Member States in the implementation of these
provisions, particularly on connectivity and habitat restoration.60 The Rural Development Programme for England (RDPE) has a total budget of £3.7 billion between 2007 and 2013. Of this, the majority (approximately £3.1
billion) is allocated for environmental improvements under Axis II of the programme, which equates to average spend of £446 million a year over the lifetime of the scheme (Natural England, 2011a).
61 The Ecosystem Market Task Force (2013) highlighted that a correctly designed nationwide biodiversity offsetting scheme could deliver the restoration, creation and long-term management of 3000 km2 of semi-natural habitat over the next 20 years. However, the review noted that devising such a scheme will not be simple and that it would need to have a number of safeguards, along with a transparent framework based on accredited standards.
62 Defra (2013a).
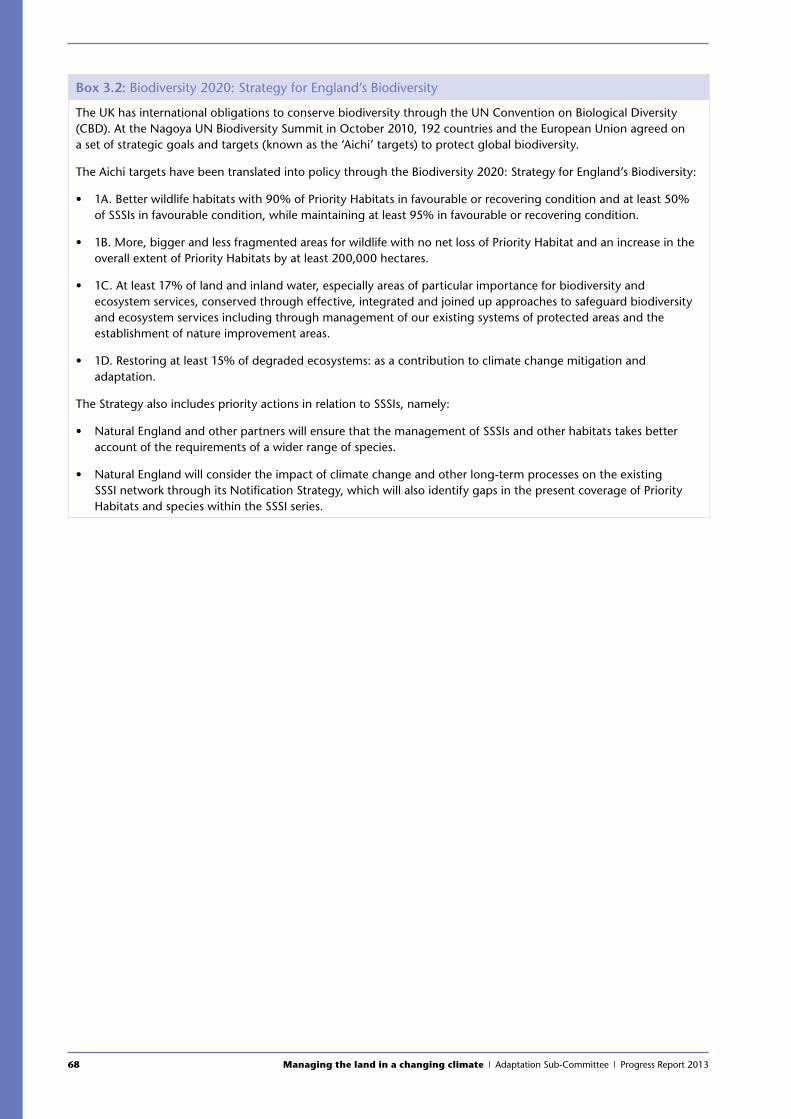
68 Managing the land in a changing climate | Adaptation Sub-Committee | Progress Report 2013
Box 3.2: Biodiversity 2020: Strategy for England’s Biodiversity
The UK has international obligations to conserve biodiversity through the UN Convention on Biological Diversity (CBD). At the Nagoya UN Biodiversity Summit in October 2010, 192 countries and the European Union agreed on a set of strategic goals and targets (known as the ‘Aichi’ targets) to protect global biodiversity.
The Aichi targets have been translated into policy through the Biodiversity 2020: Strategy for England’s Biodiversity:
• 1A. Better wildlife habitats with 90% of Priority Habitats in favourable or recovering condition and at least 50% of SSSIs in favourable condition, while maintaining at least 95% in favourable or recovering condition.
• 1B. More, bigger and less fragmented areas for wildlife with no net loss of Priority Habitat and an increase in the overall extent of Priority Habitats by at least 200,000 hectares.
• 1C. At least 17% of land and inland water, especially areas of particular importance for biodiversity and ecosystem services, conserved through effective, integrated and joined up approaches to safeguard biodiversity and ecosystem services including through management of our existing systems of protected areas and the establishment of nature improvement areas.
• 1D. Restoring at least 15% of degraded ecosystems: as a contribution to climate change mitigation and adaptation.
The Strategy also includes priority actions in relation to SSSIs, namely:
• Natural England and other partners will ensure that the management of SSSIs and other habitats takes better account of the requirements of a wider range of species.
• Natural England will consider the impact of climate change and other long-term processes on the existing SSSI network through its Notification Strategy, which will also identify gaps in the present coverage of Priority Habitats and species within the SSSI series.
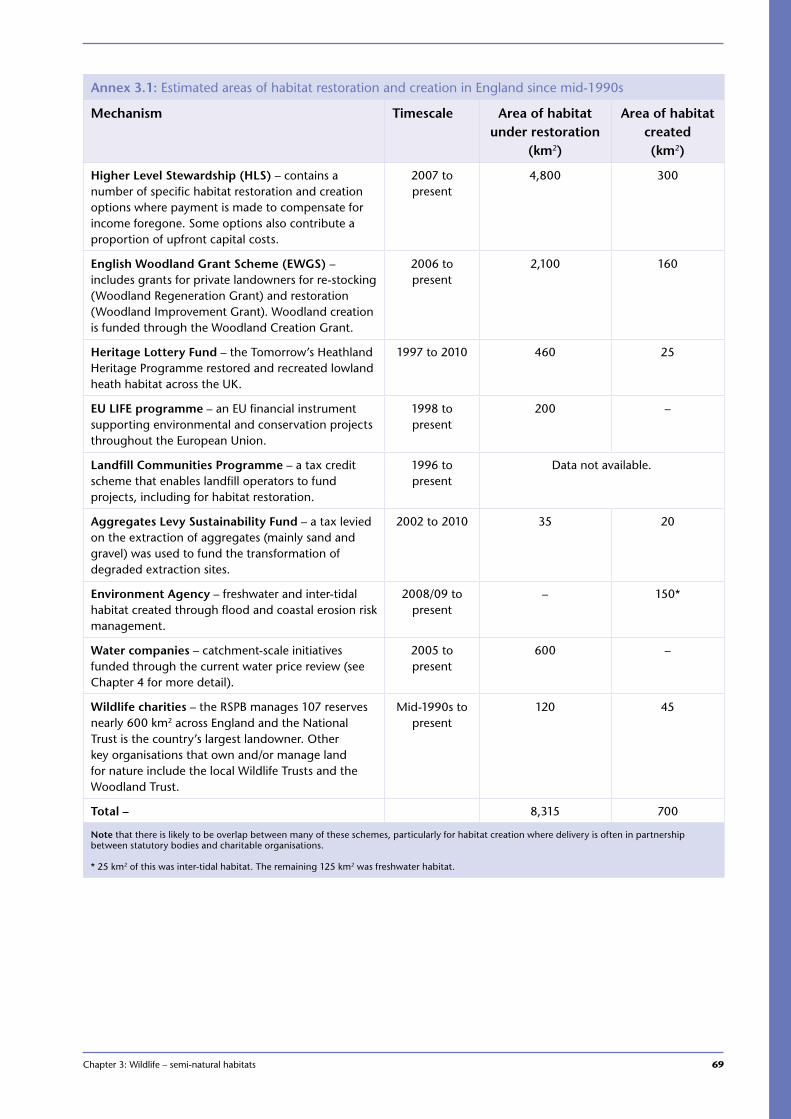
Chapter 3: Wildlife – semi-natural habitats 69
1
Annex 3.1: Estimated areas of habitat restoration and creation in England since mid-1990s
Mechanism Timescale Area of habitat under restoration
(km2)
Area of habitat created (km2)
Higher Level Stewardship (HLS) – contains a number of specific habitat restoration and creation options where payment is made to compensate for income foregone. Some options also contribute a proportion of upfront capital costs.
2007 to present
4,800 300
English Woodland Grant Scheme (EWGS) – includes grants for private landowners for re-stocking (Woodland Regeneration Grant) and restoration (Woodland Improvement Grant). Woodland creation is funded through the Woodland Creation Grant.
2006 to present
2,100 160
Heritage Lottery Fund – the Tomorrow’s Heathland Heritage Programme restored and recreated lowland heath habitat across the UK.
1997 to 2010 460 25
EU LIFE programme – an EU financial instrument supporting environmental and conservation projects throughout the European Union.
1998 to present
200 –
Landfill Communities Programme – a tax credit scheme that enables landfill operators to fund projects, including for habitat restoration.
1996 to present
Data not available.
Aggregates Levy Sustainability Fund – a tax levied on the extraction of aggregates (mainly sand and gravel) was used to fund the transformation of degraded extraction sites.
2002 to 2010 35 20
Environment Agency – freshwater and inter-tidal habitat created through flood and coastal erosion risk management.
2008/09 to present
– 150*
Water companies – catchment-scale initiatives funded through the current water price review (see Chapter 4 for more detail).
2005 to present
600 –
Wildlife charities – the RSPB manages 107 reserves nearly 600 km2 across England and the National Trust is the country’s largest landowner. Other key organisations that own and/or manage land for nature include the local Wildlife Trusts and the Woodland Trust.
Mid-1990s to present
120 45
Total – 8,315 700
Note that there is likely to be overlap between many of these schemes, particularly for habitat creation where delivery is often in partnership between statutory bodies and charitable organisations.
* 25 km2 of this was inter-tidal habitat. The remaining 125 km2 was freshwater habitat.
70 Managing the land in a changing climate | Adaptation Sub-Committee | Progress Report 2013
Chapter 44.1 Introduction
4.2 Importance of upland peat
4.3 Vulnerability of upland peat to climate change
4.4 Assessing the resilience of upland peat in the face of climate change
4.5 Conclusions and policy advice
Chapter 4: Regulating services – upland peat 71
1
Chapter 4:
Regulating services – upland peat
Key messages
Peatlands provide a number of services to society.
• They are significant natural carbon stores, with upland deep peats in England holding an estimated 140 million tonnes of carbon, worth billions of pounds.
• Upland peat plays a key role in regulating the supply and quality of drinking water, as the source of a number of major river catchments in England.
• They also provide highly valued cultural services and are internationally important wildlife habitats.
If functioning peatlands are to survive in a changing climate and continue to provide these services, they need to be in a good condition. The peat archive going back over 9,000 years shows that new assemblages of peat-forming mosses that are tolerant of warmer and drier conditions may develop and continue to lay down peat. But in order for new assemblages to be able to develop, peatlands need to retain their water holding capacity.
Climate change strengthens the case for action to protect and restore peatlands. Warmer and drier conditions in the future are likely to increase the rate of carbon losses from degraded peatlands, and reduce the water-holding and filtering capacity of degraded peat. The longer the delay in reversing degradation, the more expensive it will become to deliver.
Potential risksThe majority of upland peat is not in a sufficiently good condition for peat-forming vegetation to persist or colonise in the face of climate change.
• Of the total area of upland deep peat (3,550 km2), only 160 km2 (4%) is in a favourable ecological condition where mosses are still actively forming peat. This has declined from 210 km2 (6%) in 2003.
• Nearly half (1,600 km2) of the total area of deep peat has been modified to the extent that little, if any, peat-forming vegetation remains. Of this, nearly 1,000 km2 (30% of the deep peat area) has become more like heathland as a result of regular burning.
• Decades of damaging land management practices and pollution have caused widespread degradation: almost all upland peat has been acidified from atmospheric pollution; some 750 km2 (21%) has been drained due to attempts in the 19th century and in the 1970s to modify the land for agriculture; a further 500 km2 (14%) is intersected by deep gullies; some 350 km2 (10%) is over-grazed as a result of the drive to increase sheep stocking levels since the 1950s.
Many upland peats are losing carbon to the atmosphere and erosion of peat into water courses is increasing. This has implications for the provision of regulating services and is adversely affecting wildlife and the amenity value of upland peats.
72 Managing the land in a changing climate | Adaptation Sub-Committee | Progress Report 2013
Key messages
Options for further actionOver the last decade some efforts have been made to restore degraded peats in the uplands.
• Nearly one-third (1,100 km2) of upland peat has management plans in place that, if fully implemented, could return protected sites to a favourable condition. In practice, it may take many decades for degraded peats to recover the full range of services provided by undamaged habitats.
• Payments of £27 million to livestock farmers through the Rural Development Programme for England have reduced grazing intensity in over 40% (some 3,000 km2) of the uplands since 2007.
• Investment of £45 million by water companies between 2005 and 2015, often in partnership with conservation organisations, is funding measures such as re-vegetating bare and gullied peat and blocking drainage channels.
Around two-thirds of degraded peat lack clear plans for restoration. We found limited evidence of reductions in the amount or intensity of burning. Revegetation schemes cover only around one-quarter of bare peat and there has been limited restoration of gullied areas.
In many cases, the benefits of restoration to society outweigh the costs. The case for restoration becomes stronger with climate change. However, some landowners will not experience the full range of benefits from restoration, such as those from reduced carbon emissions and therefore lack incentives to act.
The Government should strengthen the policy framework to enable further restoration effort across the uplands. Specifically, it should:
• Set a clear policy signal on the urgent need to increase restoration. An explicit policy goal would help to drive forward the concerted action required.
• Review the enforcement of existing regulations for protecting and enhancing peat sites. Damaging practices on many protected sites are continuing, despite regulations being in place that require active measures to prevent site deterioration.
• Improve incentives for land-owners to invest in restoration. In some cases, restoration can require a high upfront capital outlay and result in reduced revenues from current activities. It is therefore important to explore ways to manage peatlands that deliver multiple benefits both to society and to landowners. In this regard, effective price and market mechanisms that fully value the services from well-managed peatlands will be required to stimulate further restoration effort.
4.1 Introduction
This chapter assesses the resilience of upland deep peat in England in the face of climate change. We focus on upland peats because it:
• provides a wide range of ecosystem services that are particularly important from a climate change perspective, including carbon storage and water purification;
• is sensitive to changes in climate, particularly reduced water availability and the increased risk of wildfire; and
• has been subject to decades of pollution and modification by land uses, which have increased their vulnerability to the impacts of climate change.
The chapter assesses how climate change may impact on upland peat; reviews how historic and current land uses are likely to have affected its vulnerability; and analyses the types of restoration available and the scale of uptake to date. The chapter concludes with analysis of the costs and benefits of restoration to provide an insight on the appropriateness of current effort.
Chapter 4: Regulating services – upland peat 73
1
4.2 Importance of upland peat
Peatlands are freshwater habitats that, when in good condition, are effectively waterlogged for most of the time. This inhibits the aerobic decomposition of organic matter, which form organic rich peat layers. Over thousands of years of accumulation, these layers can reach depths of many metres. Intact upland peats provide a range of services to society (Box 4.1).
Box 4.1: Ecosystem services provided by intact upland peats
The UK is among the top ten nations of the world in terms of its total peatland area. England has some 6,700 km2 of deep peat1 soils making up 5% of land cover.2 Just over half of deep peats in England (3,550 km2) are located in the uplands.
The main type of semi-natural habitat associated with deep peat in the uplands is ‘blanket bog’, so called because it literally blankets upland plateaus. As their water is sourced solely from rainfall, snow and mist, these habitats only occur where rainfall is very frequent.
The UK is home to 13% of the world’s blanket bog habitat, which is a notified Priority Habitat.3 The main locations in England are Dartmoor, the Peak District, the Lake District and the Pennines, as well as to a lesser extent in the North York Moors and Exmoor.
Regulating servicesClimate regulation through carbon storage
• In an active, peat-forming state, deep peat represents net sinks of carbon dioxide, accumulating between 3 and 7 tonnes of carbon per hectare each year.4 In the UK, many peatland areas have been accumulating carbon since the retreat of the last glaciers 10,000 years ago.
• An estimated 140 million tonnes of carbon is stored in England’s upland deep peats.5 If, over time, this were all to be lost to the atmosphere, it would equate to around 500 million tonnes of of carbon dioxide with a value of billions of pounds based on the price of carbon.
• Due to their waterlogged nature, intact peatlands can also be sources of methane.6 Even though methane has a higher global warming potential than carbon dioxide, it has a shorter lifetime in the atmosphere, meaning that over the long term the amount of carbon sequestered outweighs the amount of methane emitted.7
Water quality regulation (waste detoxification)
• The plant-soil systems of deep peats intercept and retain various atmospheric pollutants, such as sulphur, nitrogen and heavy metals, that would otherwise contaminate drinking waters. These pollutants do, however, contribute to degradation of the peat.
Flood hazard regulation
• As undamaged peatlands are waterlogged, they have very little ability to store additional water during heavy rainfall events.8 Consequently, upland catchments with a high proportion of blanket bog habitat often exhibit a rapid runoff response, so that stream flow rises quickly during rainstorms and returns rapidly afterwards to low-flow conditions.
• The creation of drainage channels accelerates the rate at which water leaves a peatland. Run-off may also be accelerated by the loss of vegetation, where areas of bare peat can become so dry that water will no longer infiltrate.
1 2 3 4 5 6 7 8
1 Defined as being at least 25 cm in depth.2 Additionally, shallow peaty soils and soils with peaty pockets make up a further 5% of England’s land (5,270 km2 and 2,100 km2 respectively). Natural England
(2010). 3 Over 50 Priority Habitats of principal conservation importance have been notified by Natural England under the Natural Environment and Rural Communities
Act 2006. See Chapter 3 for more detail.4 Billett et al. (2010); Worrall et al. (2010).5 Natural England (2010).6 Gorham (1991). 7 Bain et al. (2011).8 Holden et al. (2007).
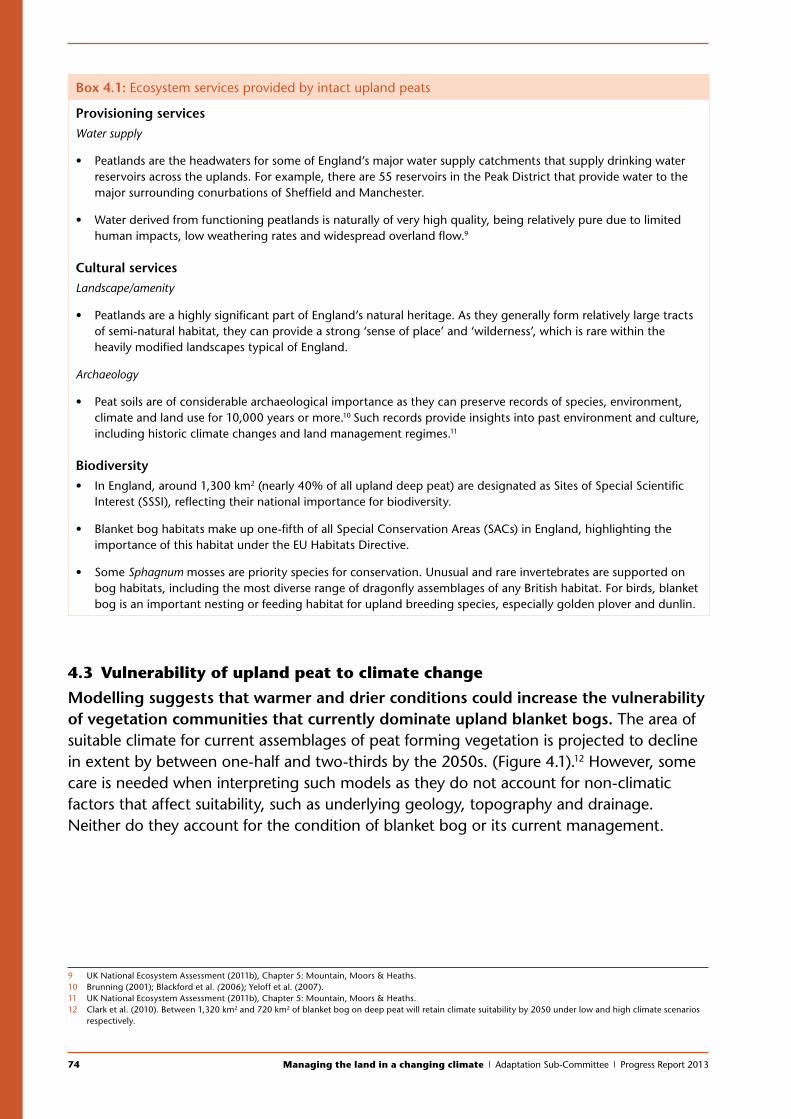
74 Managing the land in a changing climate | Adaptation Sub-Committee | Progress Report 2013
Box 4.1: Ecosystem services provided by intact upland peats
Provisioning services Water supply
• Peatlands are the headwaters for some of England’s major water supply catchments that supply drinking water reservoirs across the uplands. For example, there are 55 reservoirs in the Peak District that provide water to the major surrounding conurbations of Sheffield and Manchester.
• Water derived from functioning peatlands is naturally of very high quality, being relatively pure due to limited human impacts, low weathering rates and widespread overland flow.9
Cultural servicesLandscape/amenity
• Peatlands are a highly significant part of England’s natural heritage. As they generally form relatively large tracts of semi-natural habitat, they can provide a strong ‘sense of place’ and ‘wilderness’, which is rare within the heavily modified landscapes typical of England.
Archaeology
• Peat soils are of considerable archaeological importance as they can preserve records of species, environment, climate and land use for 10,000 years or more.10 Such records provide insights into past environment and culture, including historic climate changes and land management regimes.11
Biodiversity• In England, around 1,300 km2 (nearly 40% of all upland deep peat) are designated as Sites of Special Scientific
Interest (SSSI), reflecting their national importance for biodiversity.
• Blanket bog habitats make up one-fifth of all Special Conservation Areas (SACs) in England, highlighting the importance of this habitat under the EU Habitats Directive.
• Some Sphagnum mosses are priority species for conservation. Unusual and rare invertebrates are supported on bog habitats, including the most diverse range of dragonfly assemblages of any British habitat. For birds, blanket bog is an important nesting or feeding habitat for upland breeding species, especially golden plover and dunlin.
9 10 11
4.3 Vulnerability of upland peat to climate change
Modelling suggests that warmer and drier conditions could increase the vulnerability of vegetation communities that currently dominate upland blanket bogs. The area of suitable climate for current assemblages of peat forming vegetation is projected to decline in extent by between one-half and two-thirds by the 2050s. (Figure 4.1).12 However, some care is needed when interpreting such models as they do not account for non-climatic factors that affect suitability, such as underlying geology, topography and drainage. Neither do they account for the condition of blanket bog or its current management.
9 UK National Ecosystem Assessment (2011b), Chapter 5: Mountain, Moors & Heaths.10 Brunning (2001); Blackford et al. (2006); Yeloff et al. (2007).11 UK National Ecosystem Assessment (2011b), Chapter 5: Mountain, Moors & Heaths.12 Clark et al. (2010). Between 1,320 km2 and 720 km2 of blanket bog on deep peat will retain climate suitability by 2050 under low and high climate scenarios
respectively.
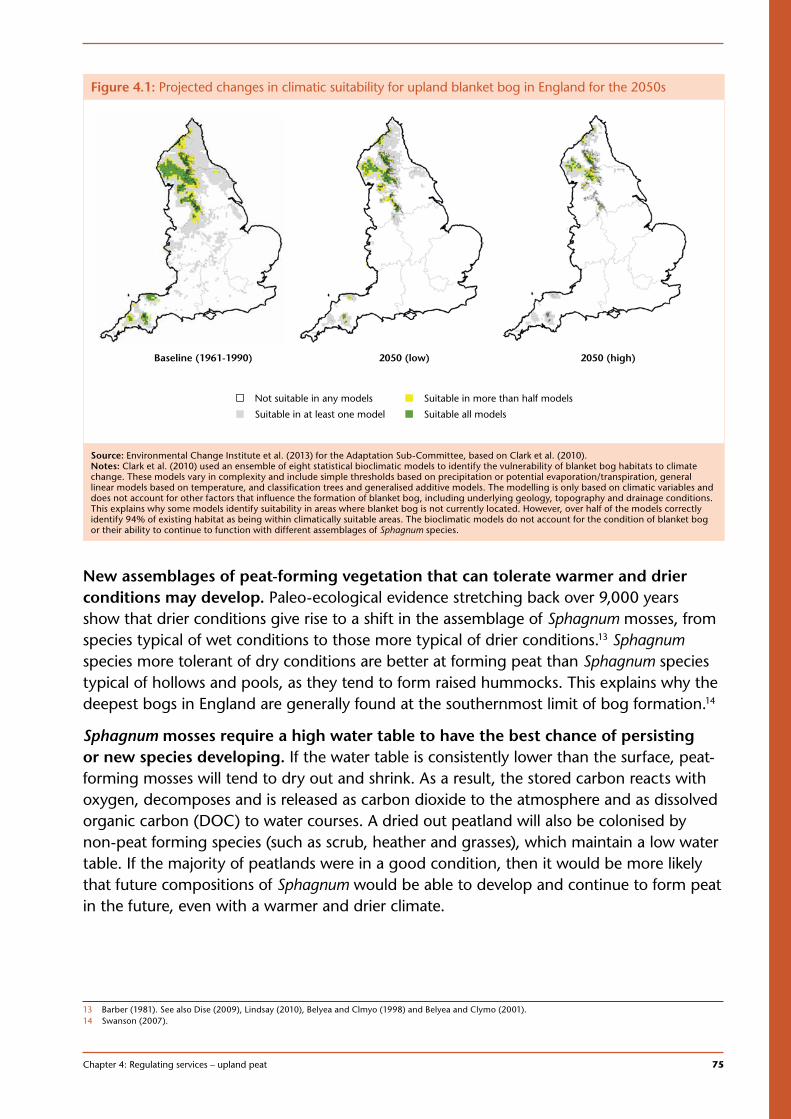
Chapter 4: Regulating services – upland peat 75
1
New assemblages of peat-forming vegetation that can tolerate warmer and drier conditions may develop. Paleo-ecological evidence stretching back over 9,000 years show that drier conditions give rise to a shift in the assemblage of Sphagnum mosses, from species typical of wet conditions to those more typical of drier conditions.13 Sphagnum species more tolerant of dry conditions are better at forming peat than Sphagnum species typical of hollows and pools, as they tend to form raised hummocks. This explains why the deepest bogs in England are generally found at the southernmost limit of bog formation.14
Sphagnum mosses require a high water table to have the best chance of persisting or new species developing. If the water table is consistently lower than the surface, peat-forming mosses will tend to dry out and shrink. As a result, the stored carbon reacts with oxygen, decomposes and is released as carbon dioxide to the atmosphere and as dissolved organic carbon (DOC) to water courses. A dried out peatland will also be colonised by non-peat forming species (such as scrub, heather and grasses), which maintain a low water table. If the majority of peatlands were in a good condition, then it would be more likely that future compositions of Sphagnum would be able to develop and continue to form peat in the future, even with a warmer and drier climate.
13 Barber (1981). See also Dise (2009), Lindsay (2010), Belyea and Clmyo (1998) and Belyea and Clymo (2001).14 Swanson (2007).
Figure 4.1: Projected changes in climatic suitability for upland blanket bog in England for the 2050s
Not suitable in any models
Suitable in at least one model
Suitable in more than half models
Suitable all models
Baseline (1961-1990) 2050 (low) 2050 (high)
Source: Environmental Change Institute et al. (2013) for the Adaptation Sub-Committee, based on Clark et al. (2010). Notes: Clark et al. (2010) used an ensemble of eight statistical bioclimatic models to identify the vulnerability of blanket bog habitats to climate change. These models vary in complexity and include simple thresholds based on precipitation or potential evaporation/transpiration, general linear models based on temperature, and classification trees and generalised additive models. The modelling is only based on climatic variables and does not account for other factors that influence the formation of blanket bog, including underlying geology, topography and drainage conditions. This explains why some models identify suitability in areas where blanket bog is not currently located. However, over half of the models correctly identify 94% of existing habitat as being within climatically suitable areas. The bioclimatic models do not account for the condition of blanket bog or their ability to continue to function with different assemblages of Sphagnum species.
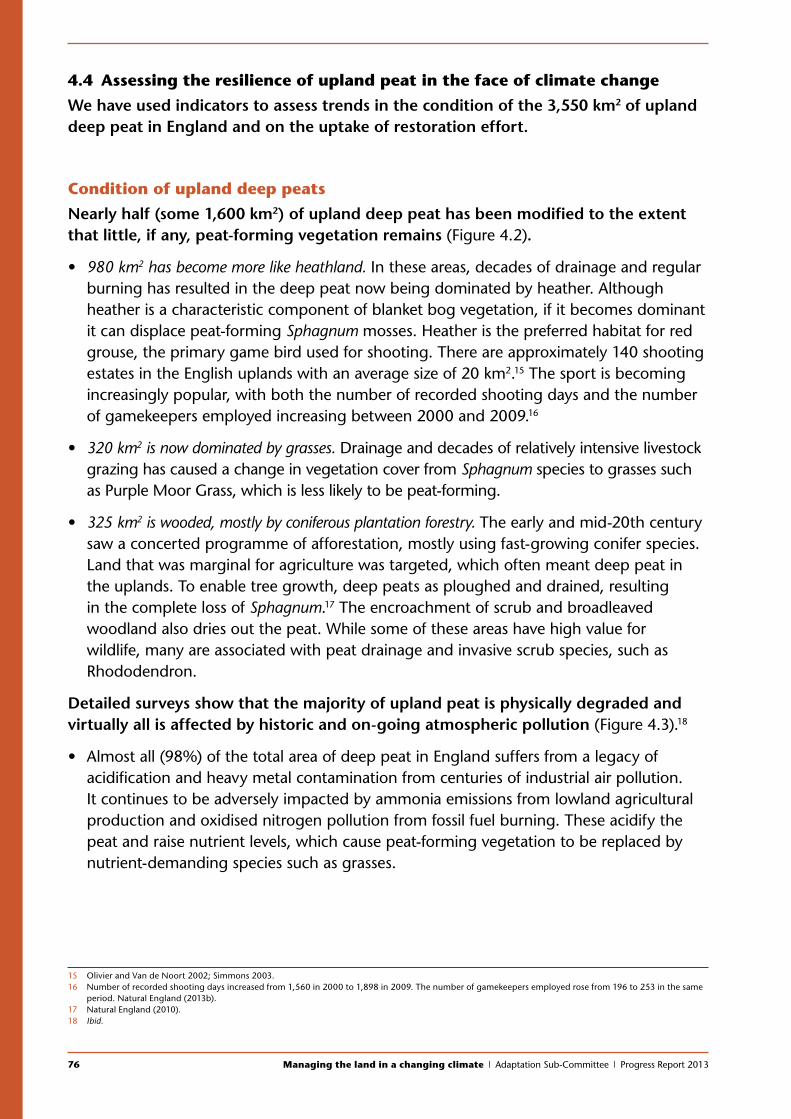
76 Managing the land in a changing climate | Adaptation Sub-Committee | Progress Report 2013
4.4 Assessing the resilience of upland peat in the face of climate change
We have used indicators to assess trends in the condition of the 3,550 km2 of upland deep peat in England and on the uptake of restoration effort.
Condition of upland deep peats
Nearly half (some 1,600 km2) of upland deep peat has been modified to the extent that little, if any, peat-forming vegetation remains (Figure 4.2).
• 980 km2 has become more like heathland. In these areas, decades of drainage and regular burning has resulted in the deep peat now being dominated by heather. Although heather is a characteristic component of blanket bog vegetation, if it becomes dominant it can displace peat-forming Sphagnum mosses. Heather is the preferred habitat for red grouse, the primary game bird used for shooting. There are approximately 140 shooting estates in the English uplands with an average size of 20 km2.15 The sport is becoming increasingly popular, with both the number of recorded shooting days and the number of gamekeepers employed increasing between 2000 and 2009.16
• 320 km2 is now dominated by grasses. Drainage and decades of relatively intensive livestock grazing has caused a change in vegetation cover from Sphagnum species to grasses such as Purple Moor Grass, which is less likely to be peat-forming.
• 325 km2 is wooded, mostly by coniferous plantation forestry. The early and mid-20th century saw a concerted programme of afforestation, mostly using fast-growing conifer species. Land that was marginal for agriculture was targeted, which often meant deep peat in the uplands. To enable tree growth, deep peats as ploughed and drained, resulting in the complete loss of Sphagnum.17 The encroachment of scrub and broadleaved woodland also dries out the peat. While some of these areas have high value for wildlife, many are associated with peat drainage and invasive scrub species, such as Rhododendron.
Detailed surveys show that the majority of upland peat is physically degraded and virtually all is affected by historic and on-going atmospheric pollution (Figure 4.3).18
• Almost all (98%) of the total area of deep peat in England suffers from a legacy of acidification and heavy metal contamination from centuries of industrial air pollution. It continues to be adversely impacted by ammonia emissions from lowland agricultural production and oxidised nitrogen pollution from fossil fuel burning. These acidify the peat and raise nutrient levels, which cause peat-forming vegetation to be replaced by nutrient-demanding species such as grasses.
15 Olivier and Van de Noort 2002; Simmons 2003. 16 Number of recorded shooting days increased from 1,560 in 2000 to 1,898 in 2009. The number of gamekeepers employed rose from 196 to 253 in the same
period. Natural England (2013b).17 Natural England (2010). 18 Ibid.
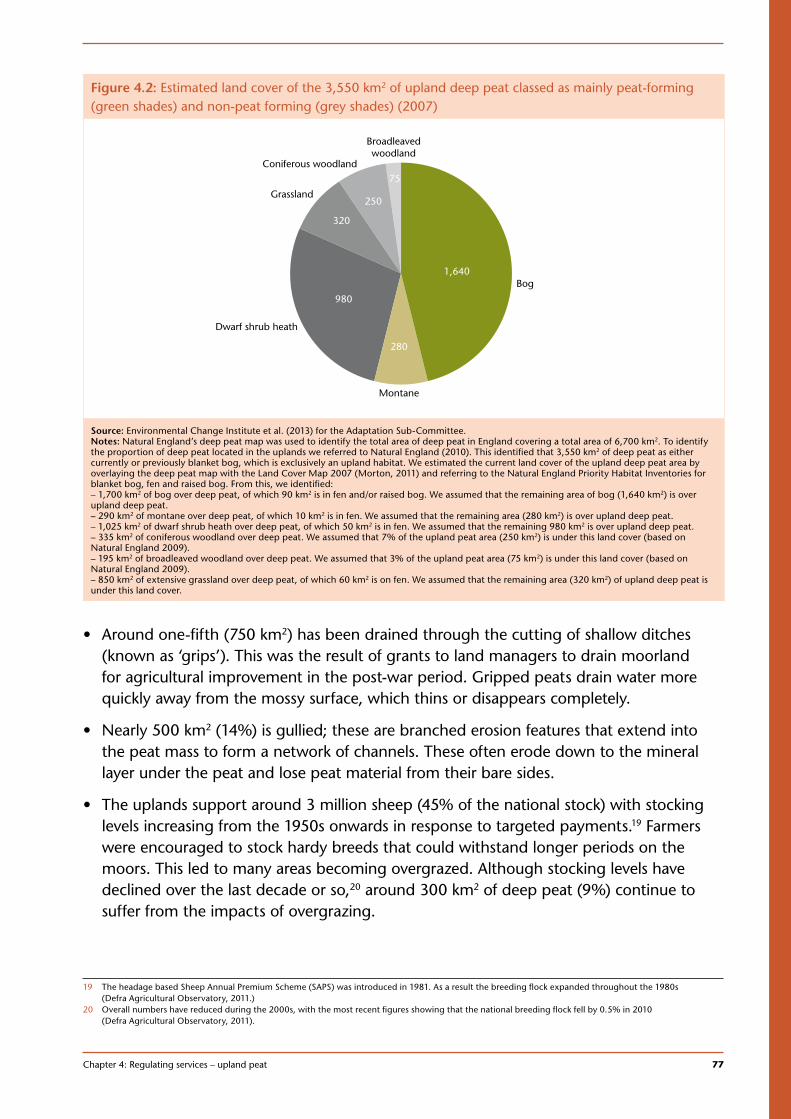
Chapter 4: Regulating services – upland peat 77
1
• Around one-fifth (750 km2) has been drained through the cutting of shallow ditches (known as ‘grips’). This was the result of grants to land managers to drain moorland for agricultural improvement in the post-war period. Gripped peats drain water more quickly away from the mossy surface, which thins or disappears completely.
• Nearly 500 km2 (14%) is gullied; these are branched erosion features that extend into the peat mass to form a network of channels. These often erode down to the mineral layer under the peat and lose peat material from their bare sides.
• The uplands support around 3 million sheep (45% of the national stock) with stocking levels increasing from the 1950s onwards in response to targeted payments.19 Farmers were encouraged to stock hardy breeds that could withstand longer periods on the moors. This led to many areas becoming overgrazed. Although stocking levels have declined over the last decade or so,20 around 300 km2 of deep peat (9%) continue to suffer from the impacts of overgrazing.
19 The headage based Sheep Annual Premium Scheme (SAPS) was introduced in 1981. As a result the breeding flock expanded throughout the 1980s (Defra Agricultural Observatory, 2011.)
20 Overall numbers have reduced during the 2000s, with the most recent figures showing that the national breeding flock fell by 0.5% in 2010 (Defra Agricultural Observatory, 2011).
Figure 4.2: Estimated land cover of the 3,550 km2 of upland deep peat classed as mainly peat-forming (green shades) and non-peat forming (grey shades) (2007)
1,640
280
980
320
250
75
Bog
Montane
Dwarf shrub heath
Grassland
Coniferous woodland
Broadleavedwoodland
Source: Environmental Change Institute et al. (2013) for the Adaptation Sub-Committee. Notes: Natural England’s deep peat map was used to identify the total area of deep peat in England covering a total area of 6,700 km2. To identify the proportion of deep peat located in the uplands we referred to Natural England (2010). This identified that 3,550 km2 of deep peat as either currently or previously blanket bog, which is exclusively an upland habitat. We estimated the current land cover of the upland deep peat area by overlaying the deep peat map with the Land Cover Map 2007 (Morton, 2011) and referring to the Natural England Priority Habitat Inventories for blanket bog, fen and raised bog. From this, we identified: – 1,700 km2 of bog over deep peat, of which 90 km2 is in fen and/or raised bog. We assumed that the remaining area of bog (1,640 km2) is over upland deep peat.– 290 km2 of montane over deep peat, of which 10 km2 is in fen. We assumed that the remaining area (280 km2) is over upland deep peat. – 1,025 km2 of dwarf shrub heath over deep peat, of which 50 km2 is in fen. We assumed that the remaining 980 km2 is over upland deep peat. – 335 km2 of coniferous woodland over deep peat. We assumed that 7% of the upland peat area (250 km2) is under this land cover (based on Natural England 2009). – 195 km2 of broadleaved woodland over deep peat. We assumed that 3% of the upland peat area (75 km2) is under this land cover (based on Natural England 2009). – 850 km2 of extensive grassland over deep peat, of which 60 km2 is on fen. We assumed that the remaining area (320 km2) of upland deep peat is under this land cover.
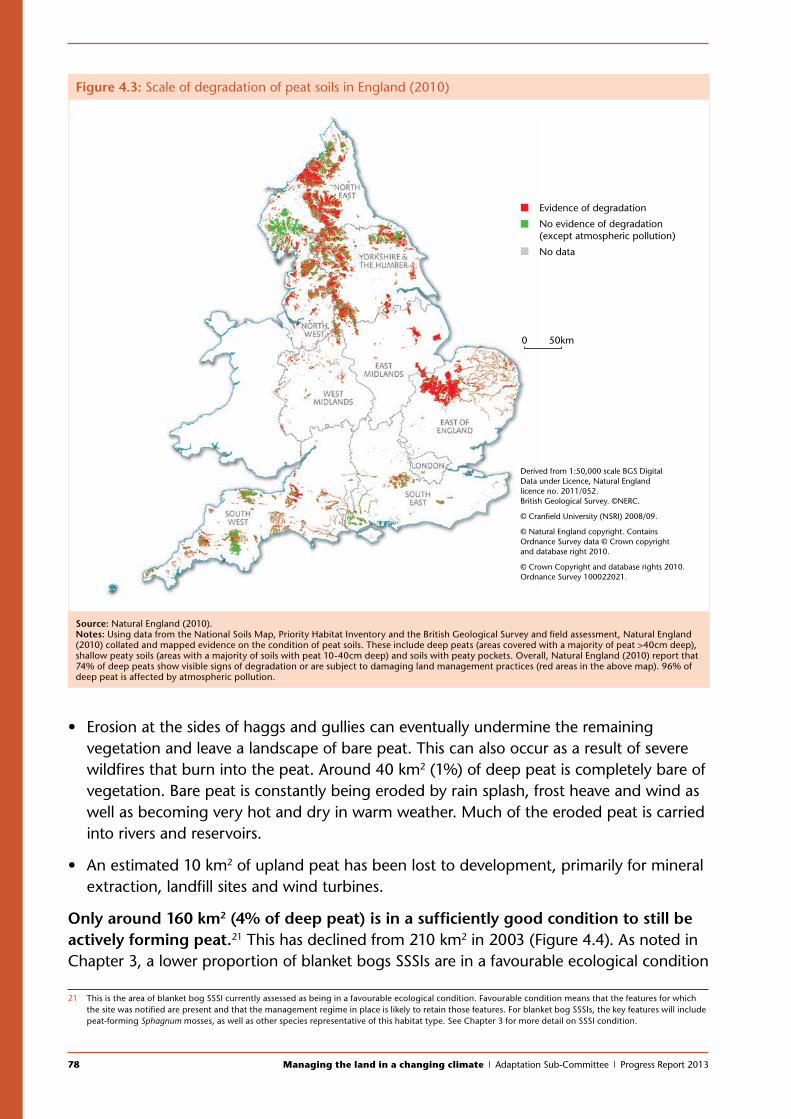
78 Managing the land in a changing climate | Adaptation Sub-Committee | Progress Report 2013
• Erosion at the sides of haggs and gullies can eventually undermine the remaining vegetation and leave a landscape of bare peat. This can also occur as a result of severe wildfires that burn into the peat. Around 40 km2 (1%) of deep peat is completely bare of vegetation. Bare peat is constantly being eroded by rain splash, frost heave and wind as well as becoming very hot and dry in warm weather. Much of the eroded peat is carried into rivers and reservoirs.
• An estimated 10 km2 of upland peat has been lost to development, primarily for mineral extraction, landfill sites and wind turbines.
Only around 160 km2 (4% of deep peat) is in a sufficiently good condition to still be actively forming peat.21 This has declined from 210 km2 in 2003 (Figure 4.4). As noted in Chapter 3, a lower proportion of blanket bogs SSSIs are in a favourable ecological condition
21 This is the area of blanket bog SSSI currently assessed as being in a favourable ecological condition. Favourable condition means that the features for which the site was notified are present and that the management regime in place is likely to retain those features. For blanket bog SSSIs, the key features will include peat-forming Sphagnum mosses, as well as other species representative of this habitat type. See Chapter 3 for more detail on SSSI condition.
Figure 4.3: Scale of degradation of peat soils in England (2010)
Evidence of degradation
No evidence of degradation(except atmospheric pollution)
No data
Derived from 1:50,000 scale BGS Digital Data under Licence, Natural England licence no. 2011/052. British Geological Survey. ©NERC.
© Cranfield University (NSRI) 2008/09.
© Natural England copyright. Contains Ordnance Survey data © Crown copyright and database right 2010.
© Crown Copyright and database rights 2010. Ordnance Survey 100022021.
0 50km
Source: Natural England (2010). Notes: Using data from the National Soils Map, Priority Habitat Inventory and the British Geological Survey and field assessment, Natural England (2010) collated and mapped evidence on the condition of peat soils. These include deep peats (areas covered with a majority of peat >40cm deep), shallow peaty soils (areas with a majority of soils with peat 10-40cm deep) and soils with peaty pockets. Overall, Natural England (2010) report that 74% of deep peats show visible signs of degradation or are subject to damaging land management practices (red areas in the above map). 96% of deep peat is affected by atmospheric pollution.
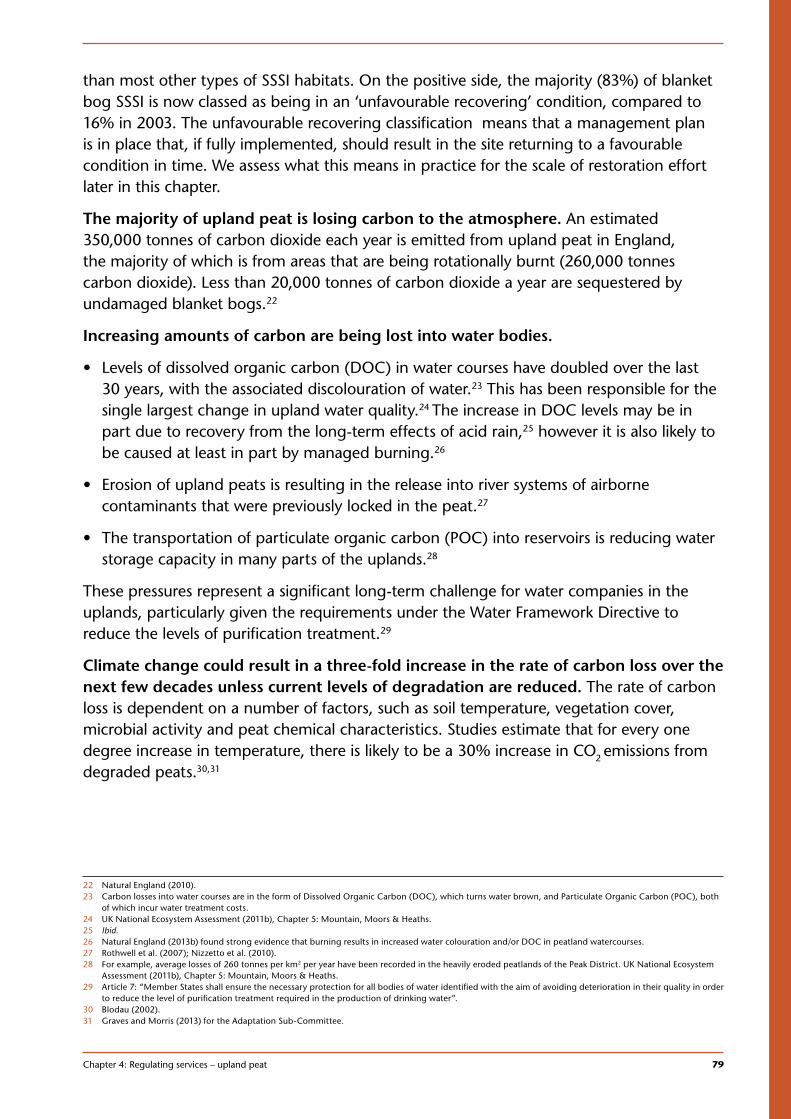
Chapter 4: Regulating services – upland peat 79
1
than most other types of SSSI habitats. On the positive side, the majority (83%) of blanket bog SSSI is now classed as being in an ‘unfavourable recovering’ condition, compared to 16% in 2003. The unfavourable recovering classification means that a management plan is in place that, if fully implemented, should result in the site returning to a favourable condition in time. We assess what this means in practice for the scale of restoration effort later in this chapter.
The majority of upland peat is losing carbon to the atmosphere. An estimated 350,000 tonnes of carbon dioxide each year is emitted from upland peat in England, the majority of which is from areas that are being rotationally burnt (260,000 tonnes carbon dioxide). Less than 20,000 tonnes of carbon dioxide a year are sequestered by undamaged blanket bogs.22
Increasing amounts of carbon are being lost into water bodies.
• Levels of dissolved organic carbon (DOC) in water courses have doubled over the last 30 years, with the associated discolouration of water.23 This has been responsible for the single largest change in upland water quality.24 The increase in DOC levels may be in part due to recovery from the long-term effects of acid rain,25 however it is also likely to be caused at least in part by managed burning.26
• Erosion of upland peats is resulting in the release into river systems of airborne contaminants that were previously locked in the peat.27
• The transportation of particulate organic carbon (POC) into reservoirs is reducing water storage capacity in many parts of the uplands.28
These pressures represent a significant long-term challenge for water companies in the uplands, particularly given the requirements under the Water Framework Directive to reduce the levels of purification treatment.29
Climate change could result in a three-fold increase in the rate of carbon loss over the next few decades unless current levels of degradation are reduced. The rate of carbon loss is dependent on a number of factors, such as soil temperature, vegetation cover, microbial activity and peat chemical characteristics. Studies estimate that for every one degree increase in temperature, there is likely to be a 30% increase in CO2 emissions from degraded peats.30,31
22 Natural England (2010). 23 Carbon losses into water courses are in the form of Dissolved Organic Carbon (DOC), which turns water brown, and Particulate Organic Carbon (POC), both
of which incur water treatment costs.24 UK National Ecosystem Assessment (2011b), Chapter 5: Mountain, Moors & Heaths. 25 Ibid.26 Natural England (2013b) found strong evidence that burning results in increased water colouration and/or DOC in peatland watercourses.27 Rothwell et al. (2007); Nizzetto et al. (2010).28 For example, average losses of 260 tonnes per km2 per year have been recorded in the heavily eroded peatlands of the Peak District. UK National Ecosystem
Assessment (2011b), Chapter 5: Mountain, Moors & Heaths.29 Article 7: “Member States shall ensure the necessary protection for all bodies of water identified with the aim of avoiding deterioration in their quality in order
to reduce the level of purification treatment required in the production of drinking water”.30 Blodau (2002).31 Graves and Morris (2013) for the Adaptation Sub-Committee.
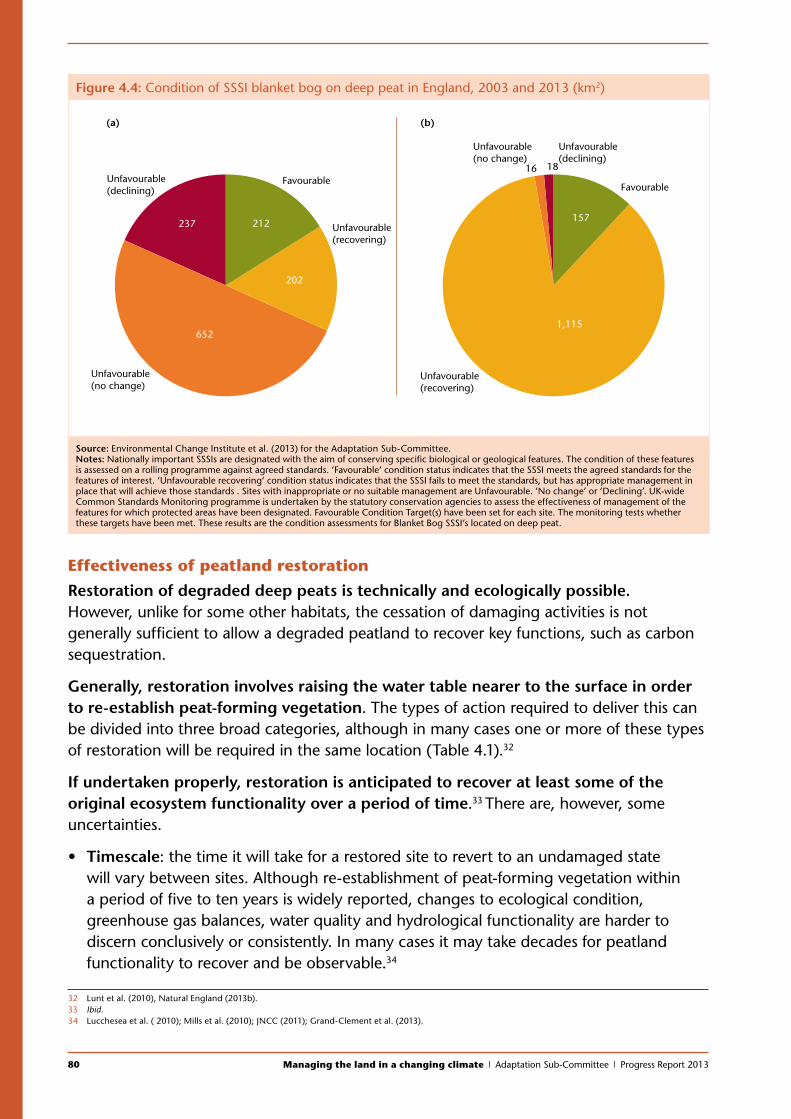
80 Managing the land in a changing climate | Adaptation Sub-Committee | Progress Report 2013
Effectiveness of peatland restoration
Restoration of degraded deep peats is technically and ecologically possible. However, unlike for some other habitats, the cessation of damaging activities is not generally sufficient to allow a degraded peatland to recover key functions, such as carbon sequestration.
Generally, restoration involves raising the water table nearer to the surface in order to re-establish peat-forming vegetation. The types of action required to deliver this can be divided into three broad categories, although in many cases one or more of these types of restoration will be required in the same location (Table 4.1).32
If undertaken properly, restoration is anticipated to recover at least some of the original ecosystem functionality over a period of time.33 There are, however, some uncertainties.
• Timescale: the time it will take for a restored site to revert to an undamaged state will vary between sites. Although re-establishment of peat-forming vegetation within a period of five to ten years is widely reported, changes to ecological condition, greenhouse gas balances, water quality and hydrological functionality are harder to discern conclusively or consistently. In many cases it may take decades for peatland functionality to recover and be observable.34
32 Lunt et al. (2010), Natural England (2013b).33 Ibid.34 Lucchesea et al. ( 2010); Mills et al. (2010); JNCC (2011); Grand-Clement et al. (2013).
Figure 4.4: Condition of SSSI blanket bog on deep peat in England, 2003 and 2013 (km2)
212
202
237 157
1,115
16
652
18
(a) (b)
FavourableFavourable
Unfavourable(recovering)
Unfavourable(recovering)
Unfavourable(no change)
Unfavourable(no change)
Unfavourable(declining)
Unfavourable(declining)
Source: Environmental Change Institute et al. (2013) for the Adaptation Sub-Committee. Notes: Nationally important SSSIs are designated with the aim of conserving specific biological or geological features. The condition of these features is assessed on a rolling programme against agreed standards. ‘Favourable‘ condition status indicates that the SSSI meets the agreed standards for the features of interest. ‘Unfavourable recovering‘ condition status indicates that the SSSI fails to meet the standards, but has appropriate management in place that will achieve those standards . Sites with inappropriate or no suitable management are Unfavourable. ‘No change’ or ‘Declining’. UK-wide Common Standards Monitoring programme is undertaken by the statutory conservation agencies to assess the effectiveness of management of the features for which protected areas have been designated. Favourable Condition Target(s) have been set for each site. The monitoring tests whether these targets have been met. These results are the condition assessments for Blanket Bog SSSI’s located on deep peat.
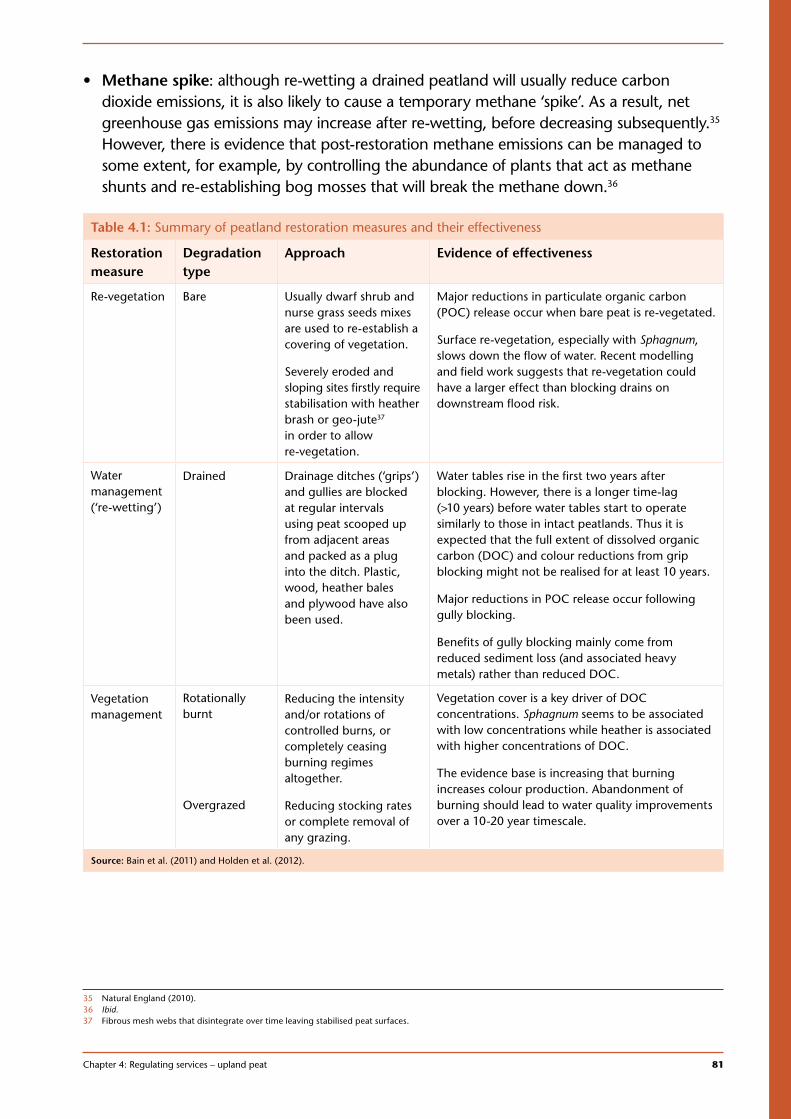
Chapter 4: Regulating services – upland peat 81
1
• Methane spike: although re-wetting a drained peatland will usually reduce carbon dioxide emissions, it is also likely to cause a temporary methane ‘spike’. As a result, net greenhouse gas emissions may increase after re-wetting, before decreasing subsequently.35 However, there is evidence that post-restoration methane emissions can be managed to some extent, for example, by controlling the abundance of plants that act as methane shunts and re-establishing bog mosses that will break the methane down.36
Table 4.1: Summary of peatland restoration measures and their effectiveness
Restoration measure
Degradation type
Approach Evidence of effectiveness
Re-vegetation Bare Usually dwarf shrub and nurse grass seeds mixes are used to re-establish a covering of vegetation.
Severely eroded and sloping sites firstly require stabilisation with heather brash or geo-jute37 in order to allow re-vegetation.
Major reductions in particulate organic carbon (POC) release occur when bare peat is re-vegetated.
Surface re-vegetation, especially with Sphagnum, slows down the flow of water. Recent modelling and field work suggests that re-vegetation could have a larger effect than blocking drains on downstream flood risk.
Water management (‘re-wetting’)
Drained Drainage ditches (‘grips’) and gullies are blocked at regular intervals using peat scooped up from adjacent areas and packed as a plug into the ditch. Plastic, wood, heather bales and plywood have also been used.
Water tables rise in the first two years after blocking. However, there is a longer time-lag (>10 years) before water tables start to operate similarly to those in intact peatlands. Thus it is expected that the full extent of dissolved organic carbon (DOC) and colour reductions from grip blocking might not be realised for at least 10 years.
Major reductions in POC release occur following gully blocking.
Benefits of gully blocking mainly come from reduced sediment loss (and associated heavy metals) rather than reduced DOC.
Vegetation management
Rotationally burnt
Overgrazed
Reducing the intensity and/or rotations of controlled burns, or completely ceasing burning regimes altogether.
Reducing stocking rates or complete removal of any grazing.
Vegetation cover is a key driver of DOC concentrations. Sphagnum seems to be associated with low concentrations while heather is associated with higher concentrations of DOC.
The evidence base is increasing that burning increases colour production. Abandonment of burning should lead to water quality improvements over a 10-20 year timescale.
Source: Bain et al. (2011) and Holden et al. (2012).
37
35 Natural England (2010).36 Ibid.37 Fibrous mesh webs that disintegrate over time leaving stabilised peat surfaces.
82 Managing the land in a changing climate | Adaptation Sub-Committee | Progress Report 2013
Current scale of restoration
The last decade has seen effort to restore around one-third of upland peat. A key driver has been the target of getting 95% of SSSIs into either a favourable or unfavourable recovering condition by 2010.38 As a result, 1,100 km2 of blanket bog SSSI (31% of the total area of deep peat) is now classed as being in a recovering condition, compared to only 200 km2 in 2003 (Figure 4.4). As highlighted in Chapter 3, this means that a management plan is in place that, if implemented, should result in the SSSI eventually reverting to favourable condition in time. There have been two main mechanisms for delivering restoration:
• Environmental Stewardship scheme. Some £27 million has been paid to farmers and landowners who have taken up moorland restoration options under the Higher Level Scheme (HLS) since 2007. These options now cover some 3,500 km2 of the uplands, of which 2,000 km2 are on deep peat.39 The main type of restoration supported by HLS is a reduction in grazing,40 although payments can also be made for grip blocking.41 This would suggest that the main contribution to restoration from the scheme has been to reduce stocking levels across a large area of upland peat. On this basis, it is likely that the 300 km2 of deep peat classed as being over-grazed is being restored and that any SSSIs that were in an unfavourable condition due to over-grazing are now recovering.
• Catchment-scale restoration to improve water quality. Some £45 million will be invested by water companies in partnership with land-owning charities (such as RSPB and the National Trust) between 2010 and 2015, much of which is on SSSI sites (Box 4.2). We estimate that some 600 km2 of upland peat is being restored by these partnerships, which are mostly delivering hydrological restoration (namely grip and gully blocking). As such, it is likely that a relatively high proportion of the 750 km2 of gripped peat and a proportion of the 500 km2 of gullied peat is in the process of being restored. The partnerships have also been re-vegetating around one-quarter of the 40 km2 of bare peat. Many, if not all, of these partnerships have accessed HLS funding to also reduce overgrazing pressure.
It is not clear whether all of the SSSI area classed as recovering is currently being restored. Our analysis suggests that catchment scale partnerships only cover around half of the 1,100 km2 classed as recovering. Although uptake of HLS restoration options is much wider, these are unlikely to be delivering more costly hydrological restoration or revegetation. It is also not clear how the remaining 35 km2 of SSSI classed as being in a declining condition is being restored.
38 See Chapter 3 for more detail on this target and how it was delivered for all SSSIs.39 Natural England data provided at the request of the ASC. See Environmental Change Institute et al. (2013) for Adaptation Sub-Committee. 40 By following an agreed stocking calendar and funding for temporary fencing.41 Data on the amount of grip-blocking supported through this option are not available, but anecdotal evidence suggests it is a low proportion due to the
up-front capital costs.
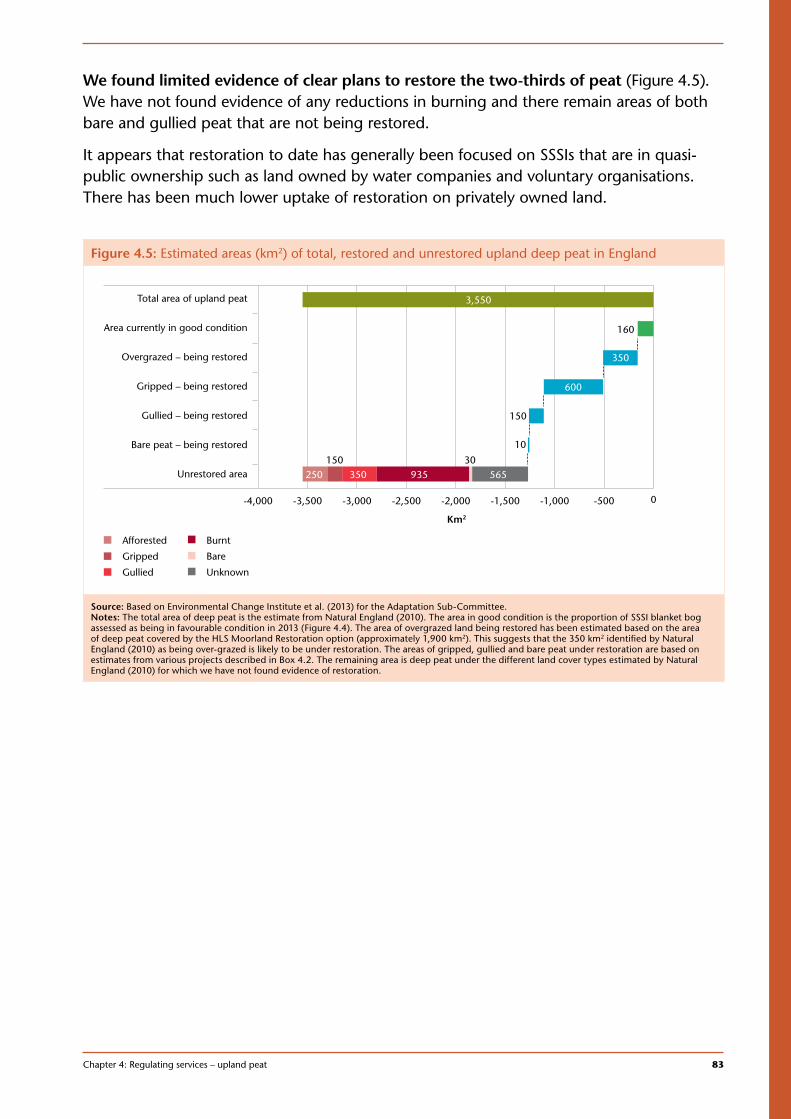
Chapter 4: Regulating services – upland peat 83
1
We found limited evidence of clear plans to restore the two-thirds of peat (Figure 4.5). We have not found evidence of any reductions in burning and there remain areas of both bare and gullied peat that are not being restored.
It appears that restoration to date has generally been focused on SSSIs that are in quasi-public ownership such as land owned by water companies and voluntary organisations. There has been much lower uptake of restoration on privately owned land.
Figure 4.5: Estimated areas (km2) of total, restored and unrestored upland deep peat in England
Total area of upland peat
Area currently in good condition
Overgrazed – being restored
Gripped – being restored
Gullied – being restored
Bare peat – being restored
Unrestored area
-4,000 -3,500 -3,000 -2,500 -2,000 -1,500 -1,000 -500 0
Km2
Afforested
Gripped
Gullied
Burnt
Bare
Unknown
160
350
600
150
10
565935350250150 30
3,550
Source: Based on Environmental Change Institute et al. (2013) for the Adaptation Sub-Committee. Notes: The total area of deep peat is the estimate from Natural England (2010). The area in good condition is the proportion of SSSI blanket bog assessed as being in favourable condition in 2013 (Figure 4.4). The area of overgrazed land being restored has been estimated based on the area of deep peat covered by the HLS Moorland Restoration option (approximately 1,900 km2). This suggests that the 350 km2 identified by Natural England (2010) as being over-grazed is likely to be under restoration. The areas of gripped, gullied and bare peat under restoration are based on estimates from various projects described in Box 4.2. The remaining area is deep peat under the different land cover types estimated by Natural England (2010) for which we have not found evidence of restoration.
84 Managing the land in a changing climate | Adaptation Sub-Committee | Progress Report 2013
Box 4.2: Summary of catchment-scale peat restoration projects in English uplands
At the 2009 price review, the water regulator (Ofwat) supported water companies’ proposals to spend some £60 million on 100 catchment management schemes and investigations over the period 2010-2015, with the aim of helping to address deteriorating water quality in the natural environment. Nearly two-thirds of this expenditure (£45 million) is for work that United Utilities, South West Water and Yorkshire Water are carrying out to restore degraded upland water catchments.
Many of these catchment schemes are being delivered through innovative multi-agency partnerships. Alongside the water industry, National Park Authorities and Areas of Outstanding Natural Beauty (AONBs) bodies play key roles in co-ordinating a number of these partnerships, which have also benefited from funding and advice from the statutory environmental bodies (Natural England, the Environment Agency and Forestry Commission) including through agri-environment payments. Non-governmental organisations, such as the National Trust, RSPB and the Wildlife Trusts, have also made key contributions to these partnerships.
• Sustainable Catchment Management Programme (SCaMP): United Utilities pioneered catchment-scale management in the North-West uplands, in partnership with the RSPB. The project aims to have restored around 205 km2 by 2015. In the first phase of the project between 2005 and 2010, some 55 km2 has been re-wetted through grip blocking and 5 km2 of bare peat has been re-vegetated.
• Yorkshire Peat Partnership: managed by the Yorkshire Wildlife Trust in partnership with Yorkshire Water, two National Park Authorities (Yorkshire Dales and North York Moors) and the National Trust. The partnership aims to restore 425 km2 of degraded blanket bog across the county by 2017. Since 2009, over 30 km2 has been brought into restoration, with over 300 km of grips blocked and 40 km of eroding gullies re-vegetated. Yorkshire Water has also been funding research and monitoring, including an Ecosystem Valuation of the restoration carried out on Keighley Moor. This demonstrated that for every £1 spent in the catchment, society would benefit by £1.31. Conversely, for every £1 not spent on restoration in the catchment, society stands to lose £2.03.42
• Moors for the Future: a ten year partnership between the Peak District National Park Authority, Natural England, Environment Agency, Severn Trent Water, United Utilities, Yorkshire Water, National Trust, Derbyshire County Council and the RSPB to restore bare peat in the Peak District and South Pennines. Since 2003, nearly 500 km2 of the South Pennines Special Area of Conservation has been brought into restoration management, including stabilising around 8 km² of bare and eroding peat. The programme is also being funded by Yorkshire Water to improve the condition of 100 km2 of upland SSSI sites owned by the company across the county. Pioneering work has been developed by the partnership to re-introduce Sphagnum on a landscape-scale.
• North Pennines AONB Partnership’s Peatland Programme: the AONB has almost 30% of England’s blanket bog, a large proportion of which has been drained. Since 2006, effort has focussed primarily on blocking nearly 7000 km of drainage channels, restoring an area of around 70 km2. More recently, the project has begun to restore the 25 km2 of bare peat within the AONB, with around 1 km2 re-vegetated to date.
• Exmoor and Dartmoor Mires on the Moors project: began in 2010 with significant financial support from South West Water as part of its Upstream Thinking initiative. In Exmoor, the project aims to restore 20 km2 of blanket bog and by 2010 had blocked 50 km of ditches, covering nearly 4 km2 of moorland. On Dartmoor, a pilot project has also recently been started with the National Park Authority, the Duchy of Cornwall and Dartmoor Commoners Council.
42
42 Harlow et al. (2012).
Chapter 4: Regulating services – upland peat 85
1
Assessing the scope for additional restoration
Understanding the economics of restoration can help to establish whether or not there is a case for wider restoration effort than is currently being delivered. This section presents results of our analysis on the costs and benefits of restoration.43
The economic case is based on the scale of benefits derived from restored peatlands, relative to the costs of restoration as summarised in Box 4.3.44
Box 4.3: Economics of upland peat restoration as an adaptive response to climate change
Our analysis estimates the net benefits, namely benefits minus operating and opportunity costs but excluding capital costs, of restoring degraded peatlands.45 The value of net benefits is compared to the capital costs of restoration. Restoration projects that deliver net benefits above the capital investments required can be justified on economic grounds, while projects where net benefits are below the capital cost cannot. Net benefits are expressed as a discounted present value of future costs and benefits over 80 years, while the capital costs are one-off (upfront) costs.
Benefits of restoration Restoration of degraded peatlands can recover a number of ecosystem services associated with undamaged peatlands. A key benefit is improved carbon storage, because restoration reduces carbon losses due to degradation and can eventually re-start carbon sequestration. Restoration also improves the condition of habitats for wildlife, as well as delivering water regulation services provided by functioning peatlands.
Our analysis models the benefits of reduced carbon losses as the difference in net carbon emissions between restored and degraded sites, which we estimate to be between 1 and 4 tonnes of CO2 equivalent per hectare per year. These are based on a range of emission factors estimated by Natural England (2010), Artz et al. (2012) and Smyth (2013). The range of emission factors reflects the degree of uncertainty in these estimates, as well as a debate as to whether or not restored sites ever reach the same carbon sequestration levels as undamaged sites.46
Emission savings are valued using DECC central (non-traded) carbon prices which increase from £58 per tonne of CO2 equivalent in 2014 to £284 per tonne of CO2 equivalent in 2100. We account for a short term increase in methane emissions of 2.5 tonnes of CO2 equivalent each year for the first 10 years due to re-wetting and the length of time it takes to re-start peat formation.
Our analysis includes a value of £152 per hectare per year to cover the non-market value of the biodiversity and ecosystem services (other than carbon storage) provided by peatlands.47 While this value is only indicative, other valuations are generally of a similar magnitude.48
Climate change increases the benefits of restoration because warmer temperatures are likely to accelerate carbon losses from degraded peatlands.49 In our analysis we account for the effects of climate change based on a low emissions p10 probability scenario and a high emissions p90 probability scenario from UKCP09. In our model, we assume climate change increases the difference in emission savings between a restored and a degraded site by 0.5% per year under a low climate change scenario, and by 1.5% under a high climate change scenario. This is based on the assumption that emissions from degraded peats increase by 30% for each degree increase in temperature.50
45 46 47 48 49 50
43 Scotland’s Rural College (2013) for the Adaptation Sub-Committee. 44 A full description of the assumptions is included in the report produced by Scotland’s Rural College (2013) for the Adaptation Sub-Committee. 45 Here the term `net benefits’ is used in an unconventional sense, to refer to benefits net of all costs with the exception of capital costs. This approach allows
easy identification of what levels of capital investment are likely to be merited by restoration under a range of benefit scenarios. 46 Lucchesea et al., (2010); Mills et al., (2010); Joint Nature Conservancy Council, (2011); Grand-Clement et al., (2013). 47 Our use of £152 per hectare per year is based on an even split of the marginal valuation of £304 per hectare per year for the biodiversity benefits provided by
UK inland wetlands (from UK National Ecosystem Assessment 2011b, Chapter 22). This is to account for optimism bias (following Harlow et al. 2012).48 For example, Christie et al. (2011) provide estimates of £136 per hectare per year.49 See Orr et al., (2008); Acreman et al., (2009); Clark et al., (2010); Gallego-Sala et al., (2012); Essl et al., (2012). 50 Graves and Morris (2013) for the Adaptation Sub-Committee. Graves & Morris (2013) estimate per hectare emissions in 2020, 2050 and 2080 for different
peatland categories under low and high climate change scenarios. This is based on a relationship described by Blodau (2002) that every one degree increase in temperature results in approximately 30% increase in CO2 emissions. The difference between reported baseline and 2080 emissions per hectare are approximated here by applying a linear annual increase in per hectare emissions of 0.5% and 1.5% for the low and high change scenarios respectively. This is a simplification, not least since the time profile is more likely to be non-linear, but is adequate to illustrate the relative effect of different climate change scenarios.
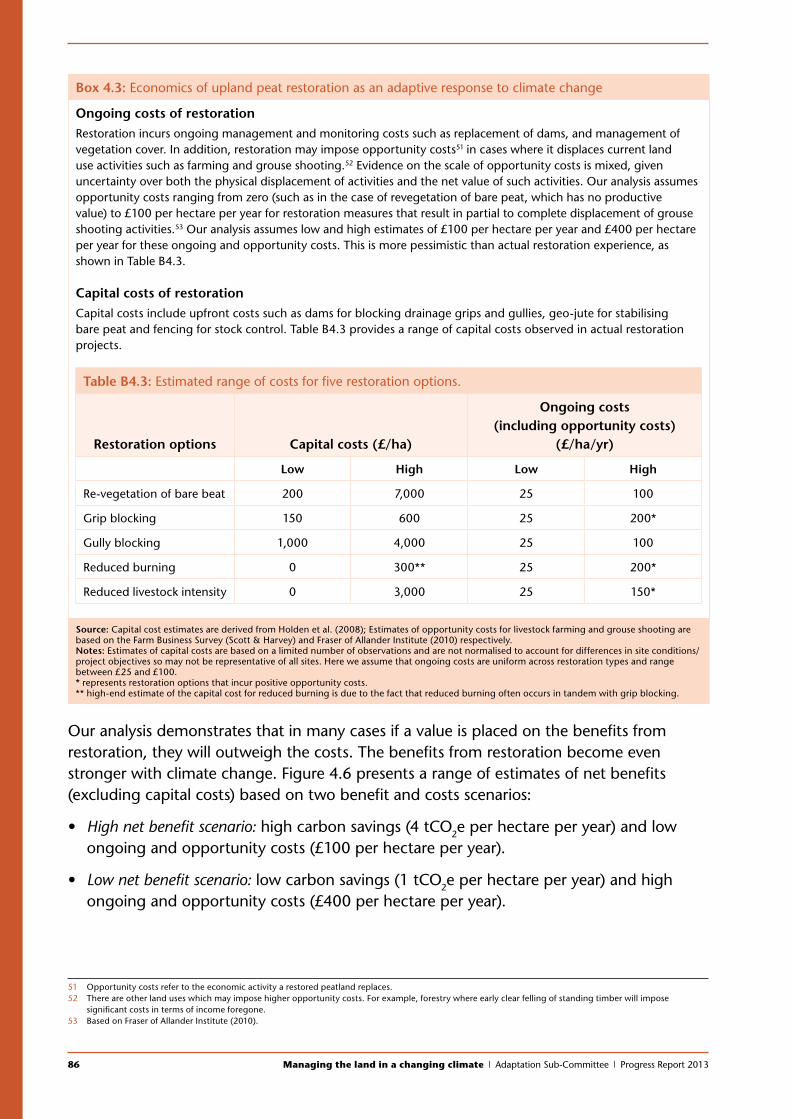
86 Managing the land in a changing climate | Adaptation Sub-Committee | Progress Report 2013
Box 4.3: Economics of upland peat restoration as an adaptive response to climate change
Ongoing costs of restorationRestoration incurs ongoing management and monitoring costs such as replacement of dams, and management of vegetation cover. In addition, restoration may impose opportunity costs51 in cases where it displaces current land use activities such as farming and grouse shooting.52 Evidence on the scale of opportunity costs is mixed, given uncertainty over both the physical displacement of activities and the net value of such activities. Our analysis assumes opportunity costs ranging from zero (such as in the case of revegetation of bare peat, which has no productive value) to £100 per hectare per year for restoration measures that result in partial to complete displacement of grouse shooting activities.53 Our analysis assumes low and high estimates of £100 per hectare per year and £400 per hectare per year for these ongoing and opportunity costs. This is more pessimistic than actual restoration experience, as shown in Table B4.3.
Capital costs of restorationCapital costs include upfront costs such as dams for blocking drainage grips and gullies, geo-jute for stabilising bare peat and fencing for stock control. Table B4.3 provides a range of capital costs observed in actual restoration projects.
Source: Capital cost estimates are derived from Holden et al. (2008); Estimates of opportunity costs for livestock farming and grouse shooting are based on the Farm Business Survey (Scott & Harvey) and Fraser of Allander Institute (2010) respectively. Notes: Estimates of capital costs are based on a limited number of observations and are not normalised to account for differences in site conditions/project objectives so may not be representative of all sites. Here we assume that ongoing costs are uniform across restoration types and range between £25 and £100.* represents restoration options that incur positive opportunity costs. ** high-end estimate of the capital cost for reduced burning is due to the fact that reduced burning often occurs in tandem with grip blocking.
51 52 53
Our analysis demonstrates that in many cases if a value is placed on the benefits from restoration, they will outweigh the costs. The benefits from restoration become even stronger with climate change. Figure 4.6 presents a range of estimates of net benefits (excluding capital costs) based on two benefit and costs scenarios:
• High net benefit scenario: high carbon savings (4 tCO2e per hectare per year) and low ongoing and opportunity costs (£100 per hectare per year).
• Low net benefit scenario: low carbon savings (1 tCO2e per hectare per year) and high ongoing and opportunity costs (£400 per hectare per year).
51 Opportunity costs refer to the economic activity a restored peatland replaces. 52 There are other land uses which may impose higher opportunity costs. For example, forestry where early clear felling of standing timber will impose
significant costs in terms of income foregone.53 Based on Fraser of Allander Institute (2010).
Table B4.3: Estimated range of costs for five restoration options.
Restoration options Capital costs (£/ha)
Ongoing costs (including opportunity costs)
(£/ha/yr)
Low High Low High
Re-vegetation of bare beat 200 7,000 25 100
Grip blocking 150 600 25 200*
Gully blocking 1,000 4,000 25 100
Reduced burning 0 300** 25 200*
Reduced livestock intensity 0 3,000 25 150*
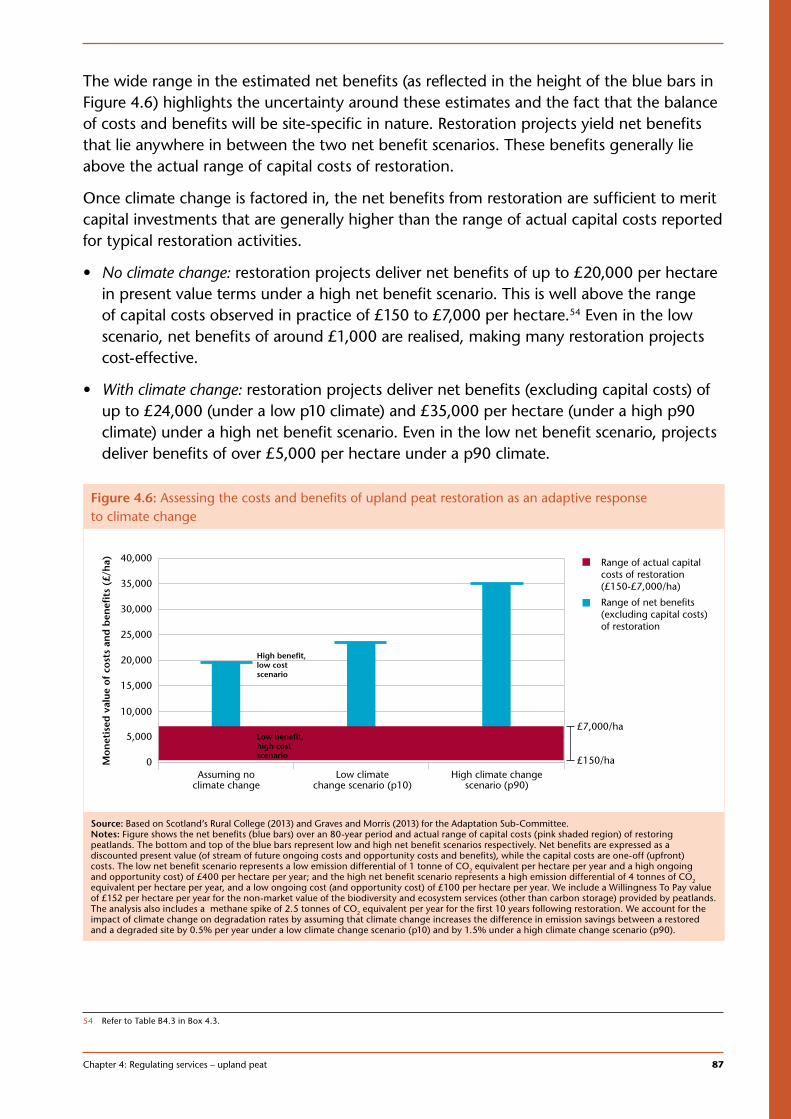
Chapter 4: Regulating services – upland peat 87
1
The wide range in the estimated net benefits (as reflected in the height of the blue bars in Figure 4.6) highlights the uncertainty around these estimates and the fact that the balance of costs and benefits will be site-specific in nature. Restoration projects yield net benefits that lie anywhere in between the two net benefit scenarios. These benefits generally lie above the actual range of capital costs of restoration.
Once climate change is factored in, the net benefits from restoration are sufficient to merit capital investments that are generally higher than the range of actual capital costs reported for typical restoration activities.
• No climate change: restoration projects deliver net benefits of up to £20,000 per hectare in present value terms under a high net benefit scenario. This is well above the range of capital costs observed in practice of £150 to £7,000 per hectare.54 Even in the low scenario, net benefits of around £1,000 are realised, making many restoration projects cost-effective.
• With climate change: restoration projects deliver net benefits (excluding capital costs) of up to £24,000 (under a low p10 climate) and £35,000 per hectare (under a high p90 climate) under a high net benefit scenario. Even in the low net benefit scenario, projects deliver benefits of over £5,000 per hectare under a p90 climate.
54 Refer to Table B4.3 in Box 4.3.
Figure 4.6: Assessing the costs and benefits of upland peat restoration as an adaptive response to climate change
Mo
net
ised
val
ue o
f co
sts
and
ben
efit
s (£
/ha)
Assuming noclimate change
Low climatechange scenario (p10)
High climate changescenario (p90)
0
5,000
10,000
15,000
20,000
25,000
30,000
35,000
40,000 Range of actual capitalcosts of restoration(£150-£7,000/ha)
Range of net benefits(excluding capital costs)of restoration
High benefit, low costscenario
Low benefit, high cost scenario
£7,000/ha
£150/ha
Source: Based on Scotland’s Rural College (2013) and Graves and Morris (2013) for the Adaptation Sub-Committee.Notes: Figure shows the net benefits (blue bars) over an 80-year period and actual range of capital costs (pink shaded region) of restoring peatlands. The bottom and top of the blue bars represent low and high net benefit scenarios respectively. Net benefits are expressed as a discounted present value (of stream of future ongoing costs and opportunity costs and benefits), while the capital costs are one-off (upfront) costs. The low net benefit scenario represents a low emission differential of 1 tonne of CO2 equivalent per hectare per year and a high ongoing and opportunity cost) of £400 per hectare per year; and the high net benefit scenario represents a high emission differential of 4 tonnes of CO2 equivalent per hectare per year, and a low ongoing cost (and opportunity cost) of £100 per hectare per year. We include a Willingness To Pay value of £152 per hectare per year for the non-market value of the biodiversity and ecosystem services (other than carbon storage) provided by peatlands. The analysis also includes a methane spike of 2.5 tonnes of CO2 equivalent per year for the first 10 years following restoration. We account for the impact of climate change on degradation rates by assuming that climate change increases the difference in emission savings between a restored and a degraded site by 0.5% per year under a low climate change scenario (p10) and by 1.5% under a high climate change scenario (p90).
88 Managing the land in a changing climate | Adaptation Sub-Committee | Progress Report 2013
The analysis suggests there is potential for a wider uptake of upland peat restoration than is being delivered at present. Additional uptake would potentially yield large net benefits even under conservative assumptions about emission savings and allowing for high-end capital and ongoing costs. Further restoration effort in areas that meet these conditions could be justified. The public nature of benefits and the private nature of costs suggest that engagement with land managers will be important in identifying appropriate policy structures to align incentives between private land owners and society. Key to this will be developing approaches to managing peatlands in ways that allow landowners to run their businesses, while also delivering benefits to society through protecting and enhancing the supply of regulating services.
4.5 Conclusions and policy advice
Our analysis has highlighted that upland peat in England is generally in a degraded condition due to a combination of land use and management practices, and pollution. Without further action, it is likely that the current level of degradation will increase with climate change. Instead of providing important and valued services, peatlands will increasingly cause costly problems to society that may become irreversible. At the same time, their international importance to biodiversity will continue to decline.
There is a need for additional restoration effort if peatlands are going to have any chance of continuing to provide key regulation services in a changing climate. The longer the delay, the more expensive it will become to reverse the scale of degradation from increasing losses of carbon to the atmosphere and into water supplies. If further action is not taken soon on the two-thirds of upland peats that do not have clear plans for restoration, then it is feasible that the level of degradation could be effectively irreversible by the middle of the century with climate change.
There is a case to strengthen the policy framework to enable additional restoration effort across the uplands. There are already regulations and incentives in place that go some way to protecting upland peats. As highlighted earlier in this chapter, these have had a measure of success in facilitating restoration schemes. There are, however, questions as to whether or not the current policy framework will enable the scale of additional restoration effort required (summarised in Table 4.2). Furthermore, there is no explicit policy goal driving forward additional restoration effort.
To strengthen the policy framework, the Government should:
• Set a clear policy signal on the need to increase restoration effort. The Government has a generic policy of managing all of England’s soils sustainably by 2030.55 In 2013, the Government provided a Statement of Intent to “protect and enhance the natural capital provided by peatlands in the UK”.56 This statement noted that there is “a strong case for improving the condition of our peatlands” due to their importance for regulating
55 HM Government (2011). The only specific provision on peat in the White Paper is the policy goal of making the transition to peat-free alternatives for horticultural uses. This is not relevant to upland blanket bog, as the extraction of peat for horticultural uses in England is only from lowland raised bogs.
56 Joint Ministerial letter to the IUCN Peatland Programme: Securing Benefits from UK Peatlands (February 2013). The statement outlined the actions and intentions of Defra, the Scottish Government, the Welsh Government and the Northern Ireland Executive to enhance UK Peatlands.
Chapter 4: Regulating services – upland peat 89
1
water quality and mitigating climate change . However, the statement did not recognise that climate change accentuates the need for additional action on restoration. Nor did it make any explicit commitment to ensure that a specified proportion of degraded peatlands are restored within an agreed timescale. The goal in the England Biodiversity Strategy of restoring 15% of ‘degraded ecosystems’ by 2020 for climate change mitigation and adaptation benefits is clearly relevant in this regard. However, it is not yet clear how this policy ambition is being defined or how it will be delivered.57
• Review the enforcement of existing regulations for protecting and enhancing peat sites. Our analysis has highlighted that there has been action taken over the last decade to put in place management agreements to improve the condition of protected sites. Despite this, it is also clear that damaging practices are continuing on some protected sites. For example, there is no difference between the rate of managed burning on SSSI and non-SSSI sites.58 A review of the enforcement regime would highlight the extent to which current regulations are being effectively implemented and thus leading to protection and enhancement of upland peat sites. A key issue the review should explore is how much of the protected site network is being regularly burnt and whether such burning is causing damage to the biodiversity interest for which the site was designated or to the supply of regulating services.
• Improve incentives for land owners to invest in restoration. A major barrier to the wider uptake of restoration measures is the lack of adequate financial incentives for landowners, both to underpin the capital outlay and to help address reduced revenue from current activities. There is also uncertainty on the future of some existing incentives, particularly agri-environment payments and water company investment in catchment-scale action to improve water quality. It will be important that the Government pushes forward with its plans to develop effective market mechanisms that deliver additional investment for appropriate management of the natural environment.59 A key priority is the development of a Peatland Carbon Code, which could facilitate private investment in restoration. The value of the benefits could be sold on the voluntary carbon market via the Corporate Social Responsibility (CSR) route, or potentially through companies’ meeting their requirements to report on their corporate greenhouse gas emissions. There are many practical challenges to overcome in developing such a scheme, but if successful, this could unlock additional restoration investment.
57 It is currently not clear how this goal is being defined in terms of the types of ‘degraded ecosystems’ that will be included, or the baseline that will be used by which to assess if the 15% ambition has been met by 2020.
58 Natural England (2013b). 59 Defra have recently published an action plan for developing the potential for Payments for Ecosystem Services (Defra 2013a). This highlights schemes that
aim to improve water quality and restore peatlands, following on from the recommendations of the recent Ecosystem Markets Taskforce report.
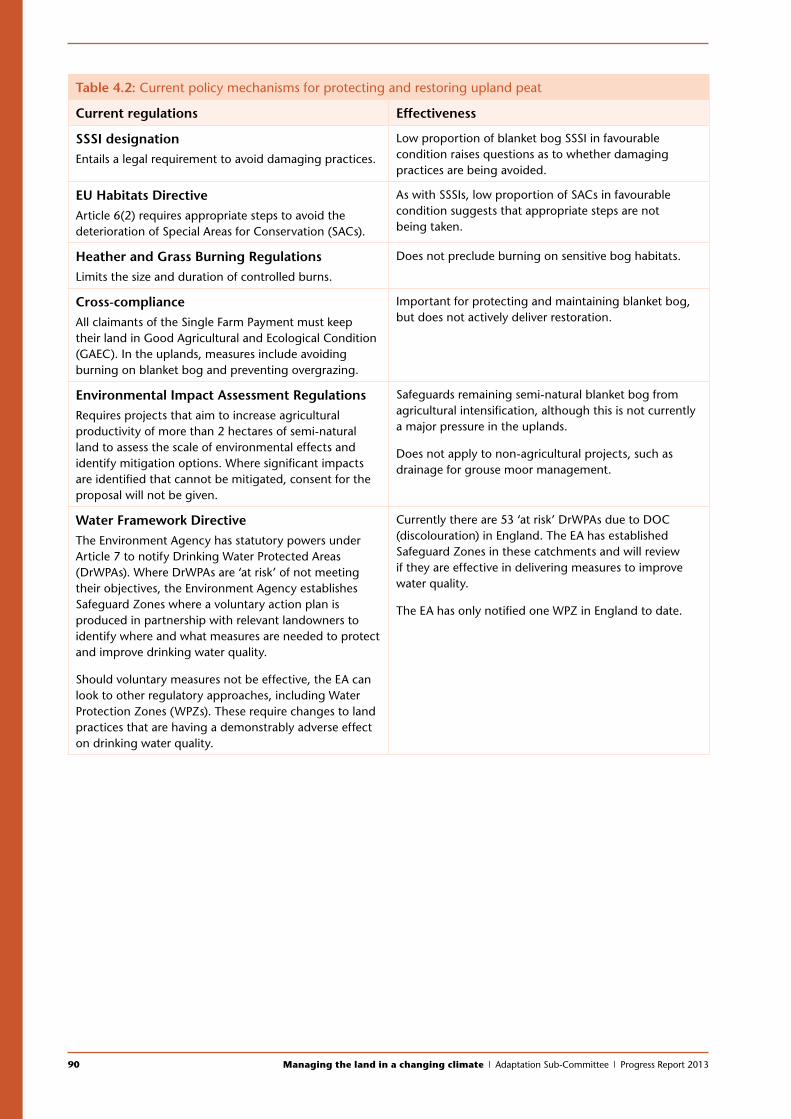
90 Managing the land in a changing climate | Adaptation Sub-Committee | Progress Report 2013
Table 4.2: Current policy mechanisms for protecting and restoring upland peat
Current regulations Effectiveness
SSSI designationEntails a legal requirement to avoid damaging practices.
Low proportion of blanket bog SSSI in favourable condition raises questions as to whether damaging practices are being avoided.
EU Habitats DirectiveArticle 6(2) requires appropriate steps to avoid the deterioration of Special Areas for Conservation (SACs).
As with SSSIs, low proportion of SACs in favourable condition suggests that appropriate steps are not being taken.
Heather and Grass Burning RegulationsLimits the size and duration of controlled burns.
Does not preclude burning on sensitive bog habitats.
Cross-complianceAll claimants of the Single Farm Payment must keep their land in Good Agricultural and Ecological Condition (GAEC). In the uplands, measures include avoiding burning on blanket bog and preventing overgrazing.
Important for protecting and maintaining blanket bog, but does not actively deliver restoration.
Environmental Impact Assessment RegulationsRequires projects that aim to increase agricultural productivity of more than 2 hectares of semi-natural land to assess the scale of environmental effects and identify mitigation options. Where significant impacts are identified that cannot be mitigated, consent for the proposal will not be given.
Safeguards remaining semi-natural blanket bog from agricultural intensification, although this is not currently a major pressure in the uplands.
Does not apply to non-agricultural projects, such as drainage for grouse moor management.
Water Framework DirectiveThe Environment Agency has statutory powers under Article 7 to notify Drinking Water Protected Areas (DrWPAs). Where DrWPAs are ‘at risk’ of not meeting their objectives, the Environment Agency establishes Safeguard Zones where a voluntary action plan is produced in partnership with relevant landowners to identify where and what measures are needed to protect and improve drinking water quality.
Should voluntary measures not be effective, the EA can look to other regulatory approaches, including Water Protection Zones (WPZs). These require changes to land practices that are having a demonstrably adverse effect on drinking water quality.
Currently there are 53 ‘at risk’ DrWPAs due to DOC (discolouration) in England. The EA has established Safeguard Zones in these catchments and will review if they are effective in delivering measures to improve water quality.
The EA has only notified one WPZ in England to date.
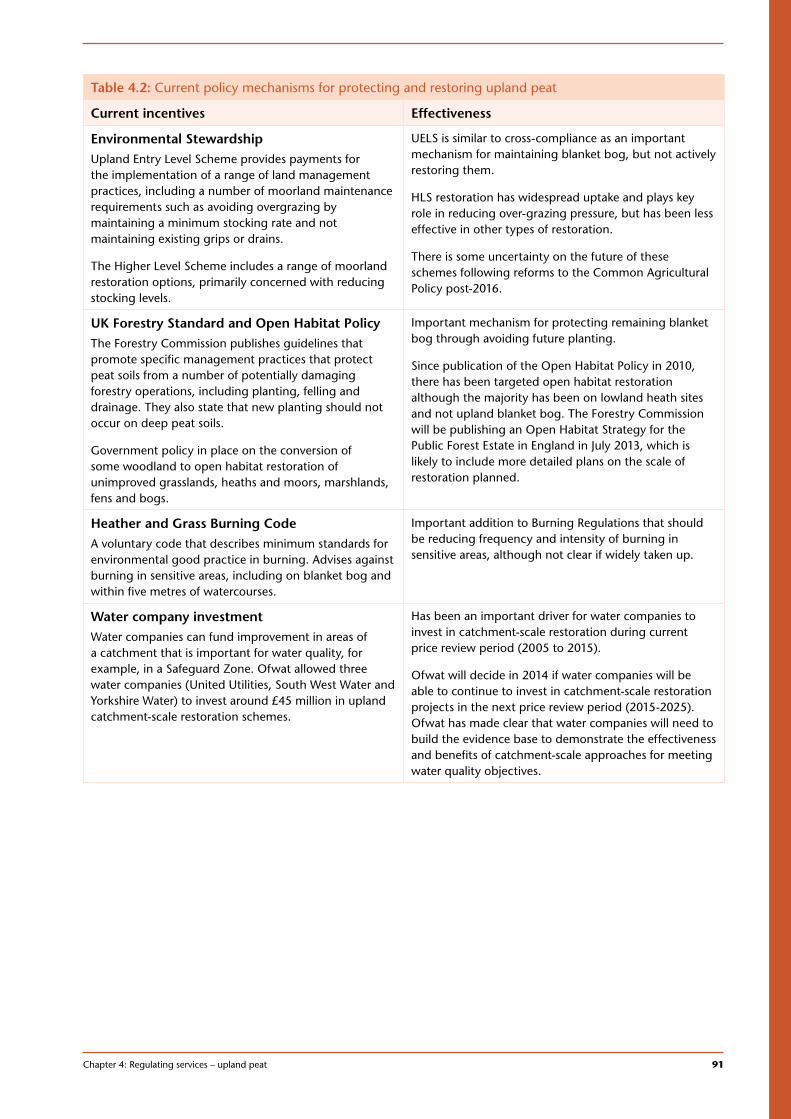
Chapter 4: Regulating services – upland peat 91
1
Table 4.2: Current policy mechanisms for protecting and restoring upland peat
Current incentives Effectiveness
Environmental StewardshipUpland Entry Level Scheme provides payments for the implementation of a range of land management practices, including a number of moorland maintenance requirements such as avoiding overgrazing by maintaining a minimum stocking rate and not maintaining existing grips or drains.
The Higher Level Scheme includes a range of moorland restoration options, primarily concerned with reducing stocking levels.
UELS is similar to cross-compliance as an important mechanism for maintaining blanket bog, but not actively restoring them.
HLS restoration has widespread uptake and plays key role in reducing over-grazing pressure, but has been less effective in other types of restoration.
There is some uncertainty on the future of these schemes following reforms to the Common Agricultural Policy post-2016.
UK Forestry Standard and Open Habitat PolicyThe Forestry Commission publishes guidelines that promote specific management practices that protect peat soils from a number of potentially damaging forestry operations, including planting, felling and drainage. They also state that new planting should not occur on deep peat soils.
Government policy in place on the conversion of some woodland to open habitat restoration of unimproved grasslands, heaths and moors, marshlands, fens and bogs.
Important mechanism for protecting remaining blanket bog through avoiding future planting.
Since publication of the Open Habitat Policy in 2010, there has been targeted open habitat restoration although the majority has been on lowland heath sites and not upland blanket bog. The Forestry Commission will be publishing an Open Habitat Strategy for the Public Forest Estate in England in July 2013, which is likely to include more detailed plans on the scale of restoration planned.
Heather and Grass Burning CodeA voluntary code that describes minimum standards for environmental good practice in burning. Advises against burning in sensitive areas, including on blanket bog and within five metres of watercourses.
Important addition to Burning Regulations that should be reducing frequency and intensity of burning in sensitive areas, although not clear if widely taken up.
Water company investmentWater companies can fund improvement in areas of a catchment that is important for water quality, for example, in a Safeguard Zone. Ofwat allowed three water companies (United Utilities, South West Water and Yorkshire Water) to invest around £45 million in upland catchment-scale restoration schemes.
Has been an important driver for water companies to invest in catchment-scale restoration during current price review period (2005 to 2015).
Ofwat will decide in 2014 if water companies will be able to continue to invest in catchment-scale restoration projects in the next price review period (2015-2025). Ofwat has made clear that water companies will need to build the evidence base to demonstrate the effectiveness and benefits of catchment-scale approaches for meeting water quality objectives.
92 Managing the land in a changing climate | Adaptation Sub-Committee | Progress Report 2013
Chapter 55.1 Introduction
5.2 Importance of coastal habitats
5.3 Vulnerability of coastal habitats to climate change
5.4 Assessing the resilience of coastal habitats in England to climate change
5.5 Conclusions and policy advice
Annex 5.1
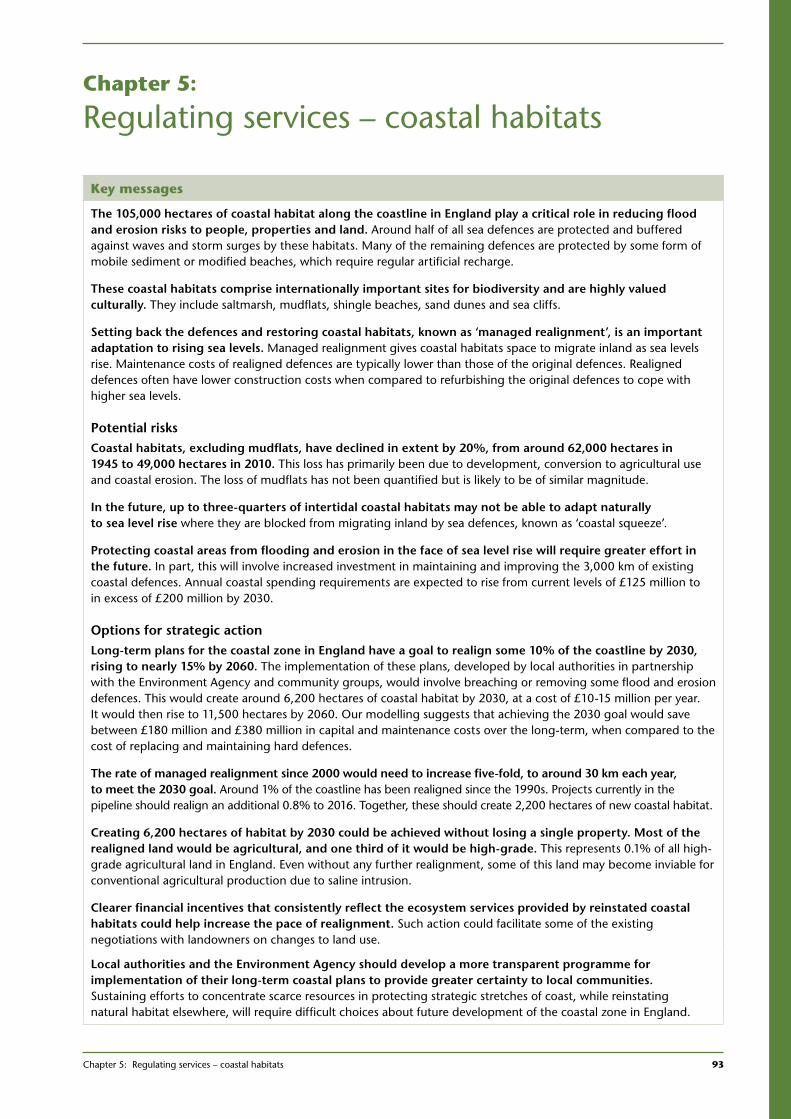
Chapter 5: Regulating services – coastal habitats 93
1
Chapter 5:
Regulating services – coastal habitats
Key messages
The 105,000 hectares of coastal habitat along the coastline in England play a critical role in reducing flood and erosion risks to people, properties and land. Around half of all sea defences are protected and buffered against waves and storm surges by these habitats. Many of the remaining defences are protected by some form of mobile sediment or modified beaches, which require regular artificial recharge.
These coastal habitats comprise internationally important sites for biodiversity and are highly valued culturally. They include saltmarsh, mudflats, shingle beaches, sand dunes and sea cliffs.
Setting back the defences and restoring coastal habitats, known as ‘managed realignment’, is an important adaptation to rising sea levels. Managed realignment gives coastal habitats space to migrate inland as sea levels rise. Maintenance costs of realigned defences are typically lower than those of the original defences. Realigned defences often have lower construction costs when compared to refurbishing the original defences to cope with higher sea levels.
Potential risksCoastal habitats, excluding mudflats, have declined in extent by 20%, from around 62,000 hectares in 1945 to 49,000 hectares in 2010. This loss has primarily been due to development, conversion to agricultural use and coastal erosion. The loss of mudflats has not been quantified but is likely to be of similar magnitude.
In the future, up to three-quarters of intertidal coastal habitats may not be able to adapt naturally to sea level rise where they are blocked from migrating inland by sea defences, known as ‘coastal squeeze’.
Protecting coastal areas from flooding and erosion in the face of sea level rise will require greater effort in the future. In part, this will involve increased investment in maintaining and improving the 3,000 km of existing coastal defences. Annual coastal spending requirements are expected to rise from current levels of £125 million to in excess of £200 million by 2030.
Options for strategic actionLong-term plans for the coastal zone in England have a goal to realign some 10% of the coastline by 2030, rising to nearly 15% by 2060. The implementation of these plans, developed by local authorities in partnership with the Environment Agency and community groups, would involve breaching or removing some flood and erosion defences. This would create around 6,200 hectares of coastal habitat by 2030, at a cost of £10-15 million per year. It would then rise to 11,500 hectares by 2060. Our modelling suggests that achieving the 2030 goal would save between £180 million and £380 million in capital and maintenance costs over the long-term, when compared to the cost of replacing and maintaining hard defences.
The rate of managed realignment since 2000 would need to increase five-fold, to around 30 km each year, to meet the 2030 goal. Around 1% of the coastline has been realigned since the 1990s. Projects currently in the pipeline should realign an additional 0.8% to 2016. Together, these should create 2,200 hectares of new coastal habitat.
Creating 6,200 hectares of habitat by 2030 could be achieved without losing a single property. Most of the realigned land would be agricultural, and one third of it would be high-grade. This represents 0.1% of all high-grade agricultural land in England. Even without any further realignment, some of this land may become inviable for conventional agricultural production due to saline intrusion.
Clearer financial incentives that consistently reflect the ecosystem services provided by reinstated coastal habitats could help increase the pace of realignment. Such action could facilitate some of the existing negotiations with landowners on changes to land use.
Local authorities and the Environment Agency should develop a more transparent programme for implementation of their long-term coastal plans to provide greater certainty to local communities. Sustaining efforts to concentrate scarce resources in protecting strategic stretches of coast, while reinstating natural habitat elsewhere, will require difficult choices about future development of the coastal zone in England.
94 Managing the land in a changing climate | Adaptation Sub-Committee | Progress Report 2013
5.1 Introduction
This chapter assesses the resilience of coastal habitats to climate change in England. We focus on coastal habitats because they:
• provide a wide range of services, including those that are particularly important from an adaptation perspective, namely the regulation of flooding and coastal erosion risks;
• are sensitive to changes in climate, particularly sea level rise; and
• have been subject to decades of degradation from land use change and erosion in some locations. This has increased their vulnerability to the impacts of climate change.
The chapter reviews how land use change has affected the vulnerability of coastal habitats and assesses how climate change may affect them. It focuses on one of the main ways of adapting to the loss of coastal habitats: setting back the defence line or ‘managed realignment’. Finally, the chapter looks at the barriers to managed realignment and provides advice on how these could be overcome.
5.2 Importance of coastal habitats
The 105,000 hectares of coastal habitat in England1 provide a wide range of services (Box 5.1).
Box 5.1: Ecosystem services provided by coastal habitats
Flood and erosion hazard regulation
Coastal habitats, particularly intertidal habitats, can provide a buffer in front of sea defences by dissipating or absorbing wave and tidal energy. Up to half of the wave energy is dissipated in the first 10–20 metres of a vegetated saltmarsh surface.2
Eroding cliffs have the potential to provide large volumes of sediment for each metre of recession, from 10,000 m3 in southern cliffs, to 70,000 m3 in North Norfolk. Depending on the nature of the cliffs, between 20% and 80% of this volume may contribute sand and gravel towards the build-up of beaches.3
Carbon storageCoastal habitats accumulate sediment and therefore act as carbon sinks. Sediment depth remains largely un-quantified. The relatively small extent of these habitats means they do not play a significant role in carbon storage on a national scale.4
Cultural services Many coastal habitats are highly valued for their cultural significance and for tourism. In 2005, there were around 250 million visits to the UK coast. Around one third of these visits were to natural habitats, such as beaches, sand dunes, shingle and cliffs.5
The coast holds an important place in the national psyche. Coasts provide cultural, social, historical, artistic, and physical and mental health benefits to society.
2 3 4 5
1 Environmental Change Institute et al. (2013) for the Adaptation Sub-Committee. The area of coastal habitat was derived from a combination of Natural England’s Priority Habitat Inventories and the Environment Agency’s Saltmarsh Survey (Phelan et al. 2011). Note that the area identified (105,000 ha) is lower than the 194,000 hectares of coastal margins in England identified by the UK National Ecosystem Assessment, as quoted in Figure 1.1. The UK National Ecosystem Assessment figure is derived from the Land Cover Map (LCM) 2007, which is based on satellite imagery, whereas the habitat inventory data is based on vegetation surveys and monitoring in the field.
2 Möller and Spencer (2006). This refers to exposed macro-tidal UK east coast marshes under average tidal inundation depths. 3 James and Lewis (1996).4 The contribution of coastal habitats to carbon storage is currently being investigated as part of a major UK Research Council project: Coastal Biodiversity
Ecosystem Service Sustainability (CBESS).5 UKTS, United Kingdom Tourism Statistics (2006); VisitBritain (2007).
Chapter 5: Regulating services – coastal habitats 95
1
Box 5.1: Ecosystem services provided by coastal habitats
Provisioning services
Saltmarsh can be used for grazing or wildfowling and thus provide meat and wool.6
Mudflat and shallow water enable aquaculture, act as nurseries, grazing and reproduction grounds for fish stocks, and can be used to grow some crops, such as samphire.7
BiodiversityThe coasts of England comprise internationally important wetlands and sites for migratory bird populations.
Coastal habitats make up around 40% of the Special Areas of Conservation (SAC) network in England designated under the EU Habitats Directive.8
Sources: UK National Ecosystem Assessment (2011b), Chapter 11 (Coastal margins) and Chapter 17 (England).
6 7 8
Coastal habitats play an important role in protecting people, property and land from flooding and erosion risk.
• Around 2.3 million people live in the coastal floodplain (680,000 hectares) and 1 million properties are located there. About 10% of these properties (100,000 properties) are at significant risk from coastal flooding.9
• A further 60,000 properties are also located in areas at risk from coastal erosion.10
• Around 60% of the coast line is protected by some form of artificial defence,11 with 390,000 properties protected from a 1 in 200 year coastal flooding event.12
• For just under half (46%) of the protected coastal area, defences are buffered from waves and storms by coastal habitats. Many of the remaining defences are protected by some form of mobile sediment or modified beaches, which require regular artificial recharge.
5.3 Vulnerability of coastal habitats to climate change
Coastal habitats have an important role to play in helping the coastal zone respond to climate change. They are however under threat from development pressures, sea level rise and increasing storminess, particularly where they are blocked from migrating inland by fixed defences such as sea walls.
Coastal habitats are formed and modified by the natural processes of sediment movement (erosion/accretion) and vegetation succession (colonisation/dieback). Most coastal habitats can re-establish themselves after extreme events. When unconstrained they could be resilient to some elements of climate change, such as rising sea levels, through natural processes of submergence and emergence.13
Artificial defences protect properties, agricultural land, communities and infrastructure from coastal flooding and erosion. Such coastal defences can, however, hamper and obstruct coastal
6 Luisetti et al. (2011).7 JNCC, Joint Nature Conservation Committee England site list (2012).8 HR Wallingford (2012) for the Adaptation Sub-Committee.9 Environmental Change Institute et al. (2013) for the Adaptation Sub-Committee.10 These properties are defined as houses located in erodible coastlines that are predicted to be at risk within the next 100 years under a central scenario.11 Nicholls et al. (2013), using Channel Coastal Observatory data. Beach management accounts for 10% while other methods of holding the line, such
asseawalls, revetments, groynes, timber structures, represent almost almost.12 The definition of a 1 in a 200 year event is highly uncertain, as this time scale includes a high degree of predictive uncertainty around meteorological forcing
(see IPCC 2007).13 Rees et al. (2010).
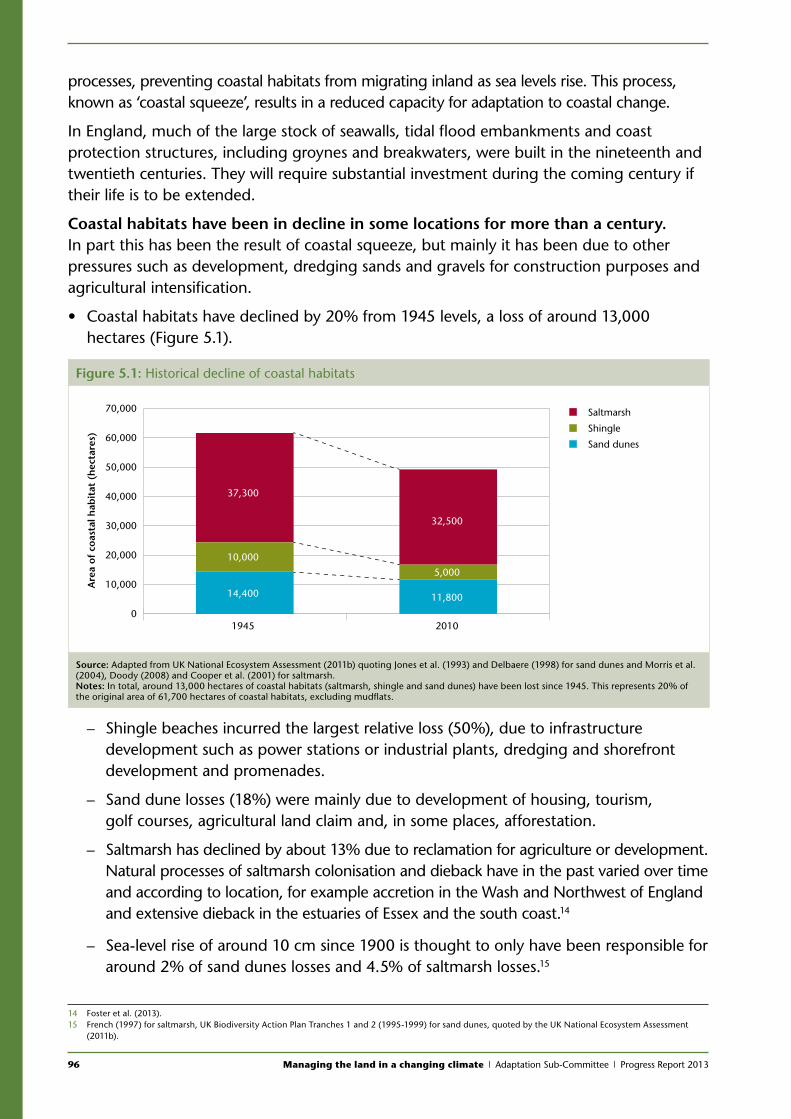
96 Managing the land in a changing climate | Adaptation Sub-Committee | Progress Report 2013
processes, preventing coastal habitats from migrating inland as sea levels rise. This process, known as ‘coastal squeeze’, results in a reduced capacity for adaptation to coastal change.
In England, much of the large stock of seawalls, tidal flood embankments and coast protection structures, including groynes and breakwaters, were built in the nineteenth and twentieth centuries. They will require substantial investment during the coming century if their life is to be extended.
Coastal habitats have been in decline in some locations for more than a century. In part this has been the result of coastal squeeze, but mainly it has been due to other pressures such as development, dredging sands and gravels for construction purposes and agricultural intensification.
• Coastal habitats have declined by 20% from 1945 levels, a loss of around 13,000 hectares (Figure 5.1).
– Shingle beaches incurred the largest relative loss (50%), due to infrastructure development such as power stations or industrial plants, dredging and shorefront development and promenades.
– Sand dune losses (18%) were mainly due to development of housing, tourism, golf courses, agricultural land claim and, in some places, afforestation.
– Saltmarsh has declined by about 13% due to reclamation for agriculture or development. Natural processes of saltmarsh colonisation and dieback have in the past varied over time and according to location, for example accretion in the Wash and Northwest of England and extensive dieback in the estuaries of Essex and the south coast.14
– Sea-level rise of around 10 cm since 1900 is thought to only have been responsible for around 2% of sand dunes losses and 4.5% of saltmarsh losses.15
14 Foster et al. (2013).15 French (1997) for saltmarsh, UK Biodiversity Action Plan Tranches 1 and 2 (1995-1999) for sand dunes, quoted by the UK National Ecosystem Assessment
(2011b).
Figure 5.1: Historical decline of coastal habitats
Saltmarsh
Shingle
Sand dunes
Are
a of
coa
stal
hab
itat
(h
ecta
res)
0
10,000
20,000
30,000
40,000
50,000
60,000
70,000
1945
14,400
10,000
37,300
2010
11,800
5,000
32,500
Source: Adapted from UK National Ecosystem Assessment (2011b) quoting Jones et al. (1993) and Delbaere (1998) for sand dunes and Morris et al. (2004), Doody (2008) and Cooper et al. (2001) for saltmarsh.Notes: In total, around 13,000 hectares of coastal habitats (saltmarsh, shingle and sand dunes) have been lost since 1945. This represents 20% of the original area of 61,700 hectares of coastal habitats, excluding mudflats.
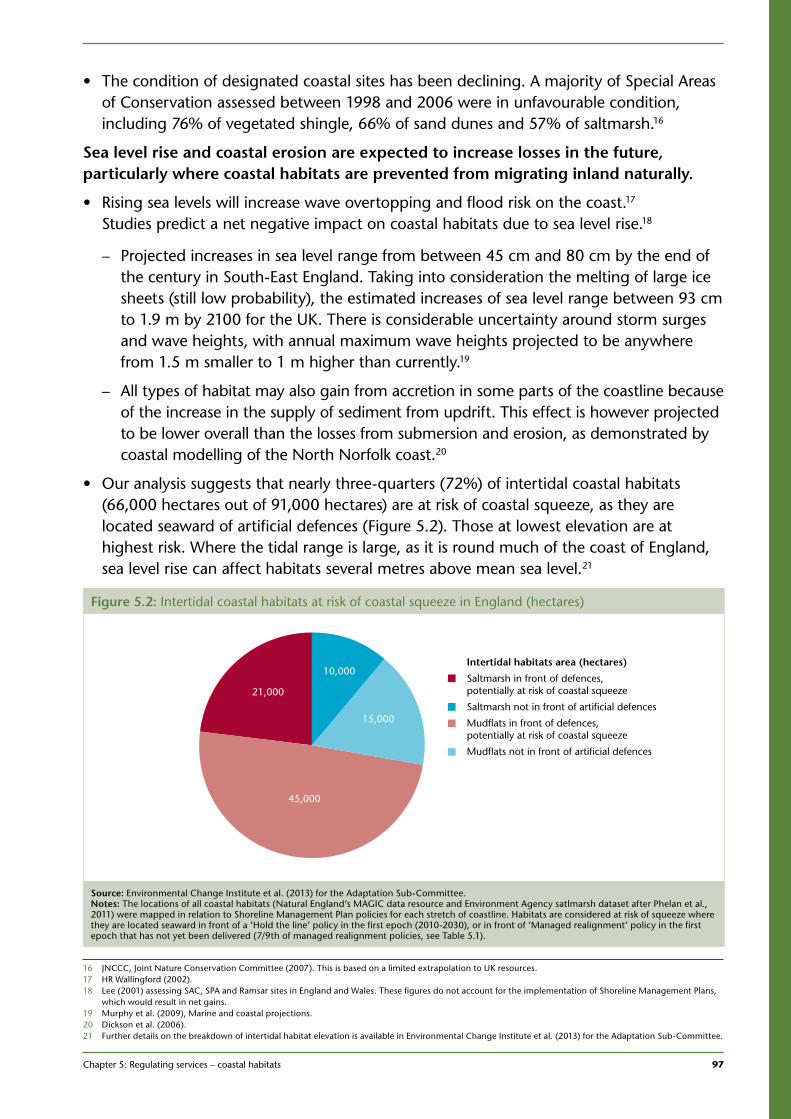
Chapter 5: Regulating services – coastal habitats 97
1
• The condition of designated coastal sites has been declining. A majority of Special Areas of Conservation assessed between 1998 and 2006 were in unfavourable condition, including 76% of vegetated shingle, 66% of sand dunes and 57% of saltmarsh.16
Sea level rise and coastal erosion are expected to increase losses in the future, particularly where coastal habitats are prevented from migrating inland naturally.
• Rising sea levels will increase wave overtopping and flood risk on the coast.17 Studies predict a net negative impact on coastal habitats due to sea level rise.18
– Projected increases in sea level range from between 45 cm and 80 cm by the end of the century in South-East England. Taking into consideration the melting of large ice sheets (still low probability), the estimated increases of sea level range between 93 cm to 1.9 m by 2100 for the UK. There is considerable uncertainty around storm surges and wave heights, with annual maximum wave heights projected to be anywhere from 1.5 m smaller to 1 m higher than currently.19
– All types of habitat may also gain from accretion in some parts of the coastline because of the increase in the supply of sediment from updrift. This effect is however projected to be lower overall than the losses from submersion and erosion, as demonstrated by coastal modelling of the North Norfolk coast.20
• Our analysis suggests that nearly three-quarters (72%) of intertidal coastal habitats (66,000 hectares out of 91,000 hectares) are at risk of coastal squeeze, as they are located seaward of artificial defences (Figure 5.2). Those at lowest elevation are at highest risk. Where the tidal range is large, as it is round much of the coast of England, sea level rise can affect habitats several metres above mean sea level.21
16 JNCCC, Joint Nature Conservation Committee (2007). This is based on a limited extrapolation to UK resources.17 HR Wallingford (2002).18 Lee (2001) assessing SAC, SPA and Ramsar sites in England and Wales. These figures do not account for the implementation of Shoreline Management Plans,
which would result in net gains.19 Murphy et al. (2009), Marine and coastal projections.20 Dickson et al. (2006).21 Further details on the breakdown of intertidal habitat elevation is available in Environmental Change Institute et al. (2013) for the Adaptation Sub-Committee.
Figure 5.2: Intertidal coastal habitats at risk of coastal squeeze in England (hectares)
Intertidal habitats area (hectares)
Saltmarsh in front of defences, potentially at risk of coastal squeeze
Saltmarsh not in front of artificial defences
Mudflats in front of defences, potentially at risk of coastal squeeze
Mudflats not in front of artificial defences
21,000
45,000
10,000
15,000
Source: Environmental Change Institute et al. (2013) for the Adaptation Sub-Committee.Notes: The locations of all coastal habitats (Natural England’s MAGIC data resource and Environment Agency satlmarsh dataset after Phelan et al., 2011) were mapped in relation to Shoreline Management Plan policies for each stretch of coastline. Habitats are considered at risk of squeeze where they are located seaward in front of a ‘Hold the line’ policy in the first epoch (2010-2030), or in front of ‘Managed realignment’ policy in the first epoch that has not yet been delivered (7/9th of managed realignment policies, see Table 5.1).
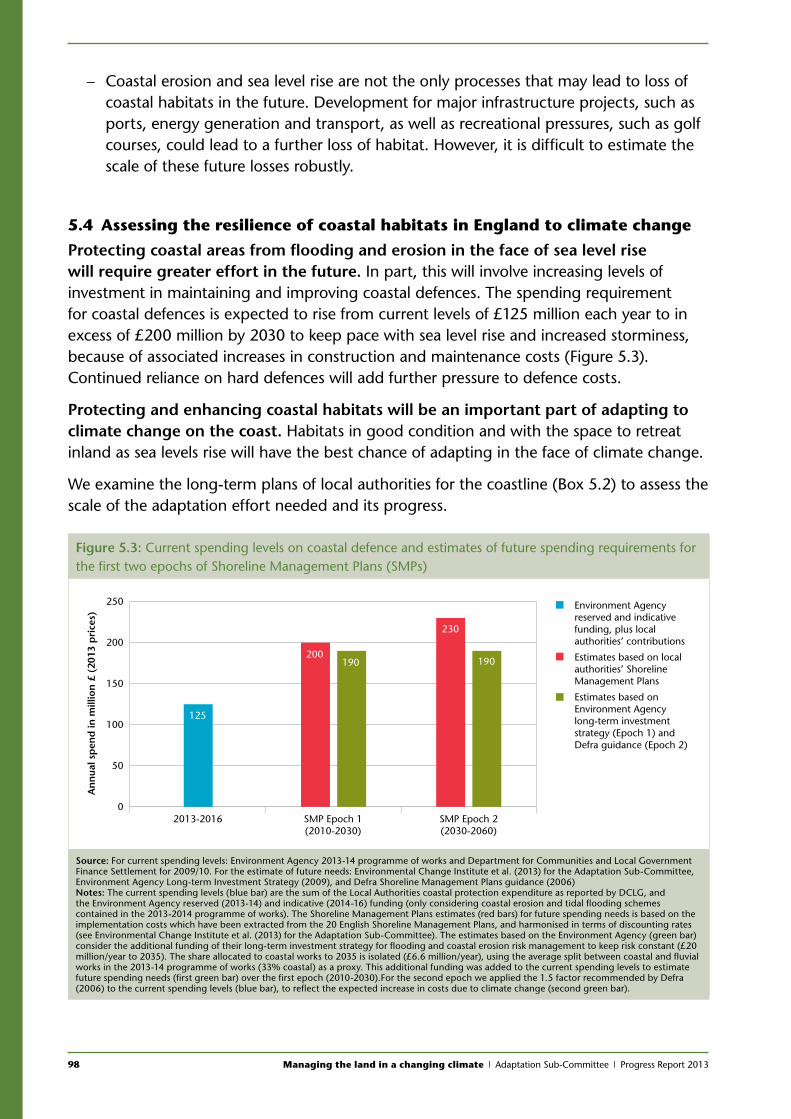
98 Managing the land in a changing climate | Adaptation Sub-Committee | Progress Report 2013
– Coastal erosion and sea level rise are not the only processes that may lead to loss of coastal habitats in the future. Development for major infrastructure projects, such as ports, energy generation and transport, as well as recreational pressures, such as golf courses, could lead to a further loss of habitat. However, it is difficult to estimate the scale of these future losses robustly.
5.4 Assessing the resilience of coastal habitats in England to climate change
Protecting coastal areas from flooding and erosion in the face of sea level rise will require greater effort in the future. In part, this will involve increasing levels of investment in maintaining and improving coastal defences. The spending requirement for coastal defences is expected to rise from current levels of £125 million each year to in excess of £200 million by 2030 to keep pace with sea level rise and increased storminess, because of associated increases in construction and maintenance costs (Figure 5.3). Continued reliance on hard defences will add further pressure to defence costs.
Protecting and enhancing coastal habitats will be an important part of adapting to climate change on the coast. Habitats in good condition and with the space to retreat inland as sea levels rise will have the best chance of adapting in the face of climate change.
We examine the long-term plans of local authorities for the coastline (Box 5.2) to assess the scale of the adaptation effort needed and its progress.
Figure 5.3: Current spending levels on coastal defence and estimates of future spending requirements for the first two epochs of Shoreline Management Plans (SMPs)
Environment Agency reserved and indicative funding, plus local authorities’ contributions
Estimates based on local authorities’ Shoreline Management Plans
Estimates based on Environment Agency long-term investment strategy (Epoch 1) and Defra guidance (Epoch 2)
An
nua
l sp
end
in m
illio
n £
(20
13 p
rice
s)
2013-2016 SMP Epoch 1(2010-2030)
SMP Epoch 2(2030-2060)
0
50
100
150
200
250
125
200190
230
190
Source: For current spending levels: Environment Agency 2013-14 programme of works and Department for Communities and Local Government Finance Settlement for 2009/10. For the estimate of future needs: Environmental Change Institute et al. (2013) for the Adaptation Sub-Committee, Environment Agency Long-term Investment Strategy (2009), and Defra Shoreline Management Plans guidance (2006)Notes: The current spending levels (blue bar) are the sum of the Local Authorities coastal protection expenditure as reported by DCLG, and the Environment Agency reserved (2013-14) and indicative (2014-16) funding (only considering coastal erosion and tidal flooding schemes contained in the 2013-2014 programme of works). The Shoreline Management Plans estimates (red bars) for future spending needs is based on the implementation costs which have been extracted from the 20 English Shoreline Management Plans, and harmonised in terms of discounting rates (see Environmental Change Institute et al. (2013) for the Adaptation Sub-Committee). The estimates based on the Environment Agency (green bar) consider the additional funding of their long-term investment strategy for flooding and coastal erosion risk management to keep risk constant (£20 million/year to 2035). The share allocated to coastal works to 2035 is isolated (£6.6 million/year), using the average split between coastal and fluvial works in the 2013-14 programme of works (33% coastal) as a proxy. This additional funding was added to the current spending levels to estimate future spending needs (first green bar) over the first epoch (2010-2030).For the second epoch we applied the 1.5 factor recommended by Defra (2006) to the current spending levels (blue bar), to reflect the expected increase in costs due to climate change (second green bar).
Chapter 5: Regulating services – coastal habitats 99
1
22 23 24
Box 5.2: Shoreline Management Plans (SMPs)
• Local authorities on the coast have been cooperating with neighbouring authorities to produce long-term strategies to manage a stretch of coastline. Each stretch is broken down into coastal cells, which take into account the large-scale coastal interactions that cross local authority boundaries. The Environment Agency has a statutory responsibility to take a strategic overview of flood and coastal erosion risk management at the national level.
• These regional strategies, known as Shoreline Management Plans (SMPs), start with a large-scale assessment of the risks of flooding and erosion, and the drivers of change on the coast. They then identify policies to reduce these risks to people and the developed, historic and natural environment, in the context of social, economic and environmental priorities for the coastal zone.
– The first generation of Shoreline Management Plans was published in 1995 and subsequently, the second generation of 22 plans covering England and Wales were produced between 2007and 2011.22
– SMPs were mostly led by a local district council or in some cases by a regional office of the Environment Agency, and drafted by a steering ‘Coastal Group’, comprising the Environment Agency, all local authorities covered by the Plan, Natural England and others as required (e.g. port authorities).
• On the same stretch of the coast, different policies can apply over the three epochs considered, spanning a century (0-20, 20-50 and 50-100 years).23 The primary management policies24 are:
– ‘Hold the line’ by maintaining or changing the standard of protection, prioritising the protection of highly valuable assets (e.g. infrastructure) or densely-populated areas.
– ‘No active intervention’, which is mostly applied to coasts that do not have an artificial defence because they are not at risk from flooding or erosion or because they have low human vulnerability.
– ‘Managed Realignment’, which is generally applied to non-built-up previously reclaimed agricultural land and to eroding coastal cliffs. ‘Managed realignment’ involves either (i) removing or deliberately breaching flood defences to allow flooding up to higher ground or a new defence line, or (ii) realignment of coastal cliff frontages to allow cliff erosion up to a new defence line.25 Managed realignment partially or fully reinstates natural processes of inundation, erosion and accretion. It may involve building new defences, set back on the landward side of the original defences.
• Although Shoreline Management Plans are non-statutory, they can influence long-term decision-making for coastal communities.
– In line with Defra’s coastal management framework,26 authorities should use the plans to devise schemes that will implement the Shoreline Management Plans preferred policies. They will therefore influence the Environment Agency’s decision to fund protection schemes for flooding and coastal erosion risk management, and its long term investment strategy.
– Local planning authorities’ development plans and development management decisions should take account of any long-term coastal change identified in the Shoreline Management Plans, as well as the specific preferred policies.
To deliver these plans in estuaries, the Environment Agency also coordinates estuary strategies, such as those in the South-West (Exe, Severn) and the South-East (Cuckmere).
Sources: Defra Shoreline Management Plans guidance (2006).
25 26
22 http://www.environment-agency.gov.uk/research/planning/105014.aspx23 Defra recommends to use 2005 as a baseline year. In this chapter, we use 2010 as a baseline year to reflect the fact that SMPs were published between 2007
and 2011.24 A fourth management policy is to advance the defence line, but in practice this has not been taken up by the Shoreline Management Plans.25 This explains why some, but not all realignment schemes lead to habitat creation.26 Accessible in Defra’s Shoreline Management Plans guidance (2006).
100 Managing the land in a changing climate | Adaptation Sub-Committee | Progress Report 2013
Managed realignment as an adaptation response
Managed realignment allows coastal habitats to respond naturally to sea level rise by removing barriers to inland migration. Managed realignment can help limit the projected increase in the cost of coastal defences in the long term.
• Coastal defences that are buffered from waves and storms by coastal habitats require lower capital and maintenance costs.
• When artificial defences are breached or reach the end of their lifetime, defences built on a realigned line may require lower capital costs for the same standard of defence. Research suggests for instance that, due to wave height reduction, a seawall with vegetated saltmarsh fronting the wall can be 20 cm lower than a wall fronted by unvegetated tidal flats.27
• The Environment Agency have told us that maintenance costs savings may be modest due to additional costs, such as new pumping stations, the need to maintain the breach in the old seawall, and in some cases a continued need to maintain the old wall. Reduced capital costs are also not automatic, as new defences tend to have wider crests and shallower sides.28 Our analysis shows that these factors can considerably affect the cost-effectiveness of the managed realignment schemes, especially when they are smaller (less habitat area created per kilometre of defence).29
Managed realignment can also compensate for habitat loss and provide environmental benefits. Habitat creation provides various environmental benefits (Box 5.1). These have been valued between £680 and £2,500 per hectare, including carbon storage benefits.30
Allowing previously defended cliffs to erode naturally in order to restore sediment movement can also be an appropriate adaptation option when benefits downdrift more than outweigh the localised losses to cliffs. A research case study looking at a stretch of the East Anglian coast showed that artificial defences on eroding cliffs can starve and interrupt sediment supply downdrift. This lowers the protective beaches in front of floodplains, consequently increasing flood risk further down the coast.31 Removing the defences on these cliffs would lead to economic losses on the cliffed coastline, but these losses would be more than outweighed by benefits in flood-prone areas downdrift.
27 Möller et al. (1999), King and Lester (1995), experiment in a macrotidal setting in North Norfolk.28 This is due to maintenance requirements, the quality of available construction material and sea level rise allowances, which can cause crest heights to be as
high as or even higher than the old defences (Environment Agency personal comment).29 Scotland’s Rural College (2013) for the Adaptation Sub-Committee.30 Low estimate derived fromScotland’s Rural College estimated environmental value (£550 ha per year) based on Eftec (2010) median environmental values,
combined with the carbon storage value (£130 ha per year) based on DECC 2012 prices (with £57 per tCO2eq as a central estimate for non-traded carbon). High estimate obtained by summing up the indicative value of saltmarsh and mudflat (£1,500 ha per year in £2011 prices) based on Eftec (2010), and the central estimate for carbon storage (£1,000 ha per year) based on Brander et al. (2008).
31 Dawson et al. (2009).
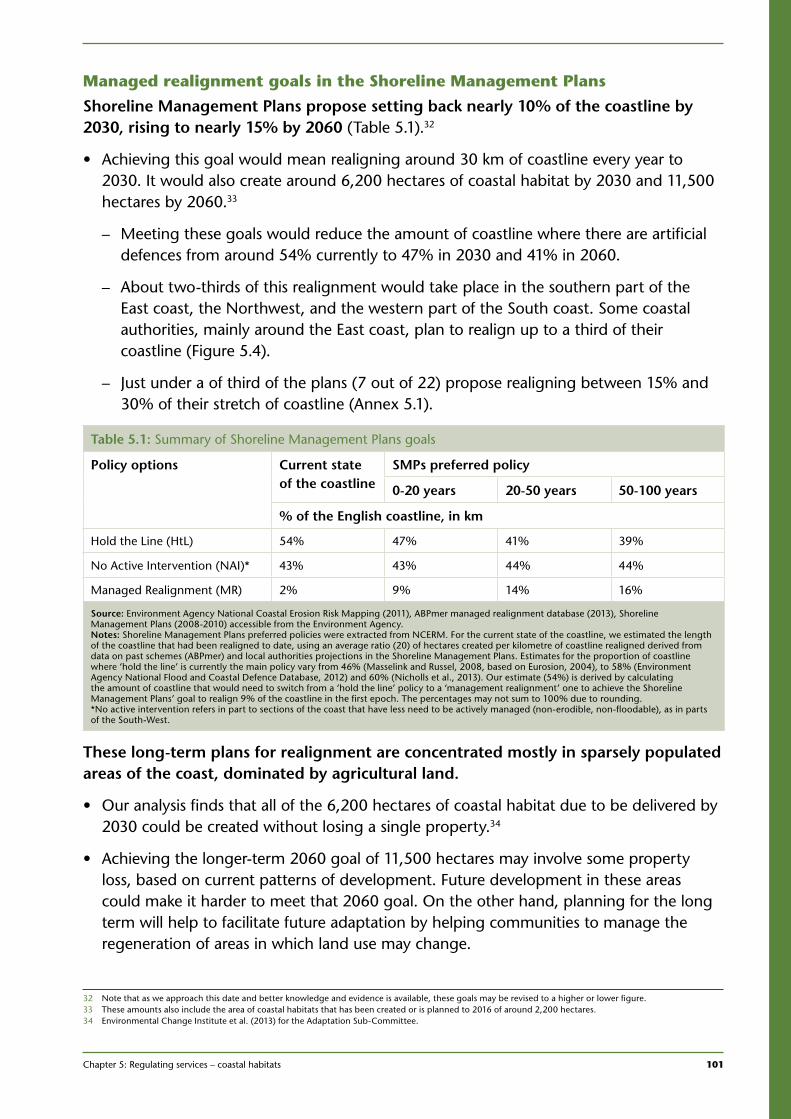
Chapter 5: Regulating services – coastal habitats 101
1
Managed realignment goals in the Shoreline Management Plans
Shoreline Management Plans propose setting back nearly 10% of the coastline by 2030, rising to nearly 15% by 2060 (Table 5.1).32
• Achieving this goal would mean realigning around 30 km of coastline every year to 2030. It would also create around 6,200 hectares of coastal habitat by 2030 and 11,500 hectares by 2060.33
– Meeting these goals would reduce the amount of coastline where there are artificial defences from around 54% currently to 47% in 2030 and 41% in 2060.
– About two-thirds of this realignment would take place in the southern part of the East coast, the Northwest, and the western part of the South coast. Some coastal authorities, mainly around the East coast, plan to realign up to a third of their coastline (Figure 5.4).
– Just under a of third of the plans (7 out of 22) propose realigning between 15% and 30% of their stretch of coastline (Annex 5.1).
Table 5.1: Summary of Shoreline Management Plans goals
Policy options Current state of the coastline
SMPs preferred policy
0-20 years 20-50 years 50-100 years
% of the English coastline, in km
Hold the Line (HtL) 54% 47% 41% 39%
No Active Intervention (NAI)* 43% 43% 44% 44%
Managed Realignment (MR) 2% 9% 14% 16%
Source: Environment Agency National Coastal Erosion Risk Mapping (2011), ABPmer managed realignment database (2013), Shoreline Management Plans (2008-2010) accessible from the Environment Agency.Notes: Shoreline Management Plans preferred policies were extracted from NCERM. For the current state of the coastline, we estimated the length of the coastline that had been realigned to date, using an average ratio (20) of hectares created per kilometre of coastline realigned derived from data on past schemes (ABPmer) and local authorities projections in the Shoreline Management Plans. Estimates for the proportion of coastline where ‘hold the line’ is currently the main policy vary from 46% (Masselink and Russel, 2008, based on Eurosion, 2004), to 58% (Environment Agency National Flood and Coastal Defence Database, 2012) and 60% (Nicholls et al., 2013). Our estimate (54%) is derived by calculating the amount of coastline that would need to switch from a ‘hold the line’ policy to a ‘management realignment’ one to achieve the Shoreline Management Plans’ goal to realign 9% of the coastline in the first epoch. The percentages may not sum to 100% due to rounding. *No active intervention refers in part to sections of the coast that have less need to be actively managed (non-erodible, non-floodable), as in parts of the South-West.
These long-term plans for realignment are concentrated mostly in sparsely populated areas of the coast, dominated by agricultural land.
• Our analysis finds that all of the 6,200 hectares of coastal habitat due to be delivered by 2030 could be created without losing a single property.34
• Achieving the longer-term 2060 goal of 11,500 hectares may involve some property loss, based on current patterns of development. Future development in these areas could make it harder to meet that 2060 goal. On the other hand, planning for the long term will help to facilitate future adaptation by helping communities to manage the regeneration of areas in which land use may change.
32 Note that as we approach this date and better knowledge and evidence is available, these goals may be revised to a higher or lower figure.33 These amounts also include the area of coastal habitats that has been created or is planned to 2016 of around 2,200 hectares.34 Environmental Change Institute et al. (2013) for the Adaptation Sub-Committee.
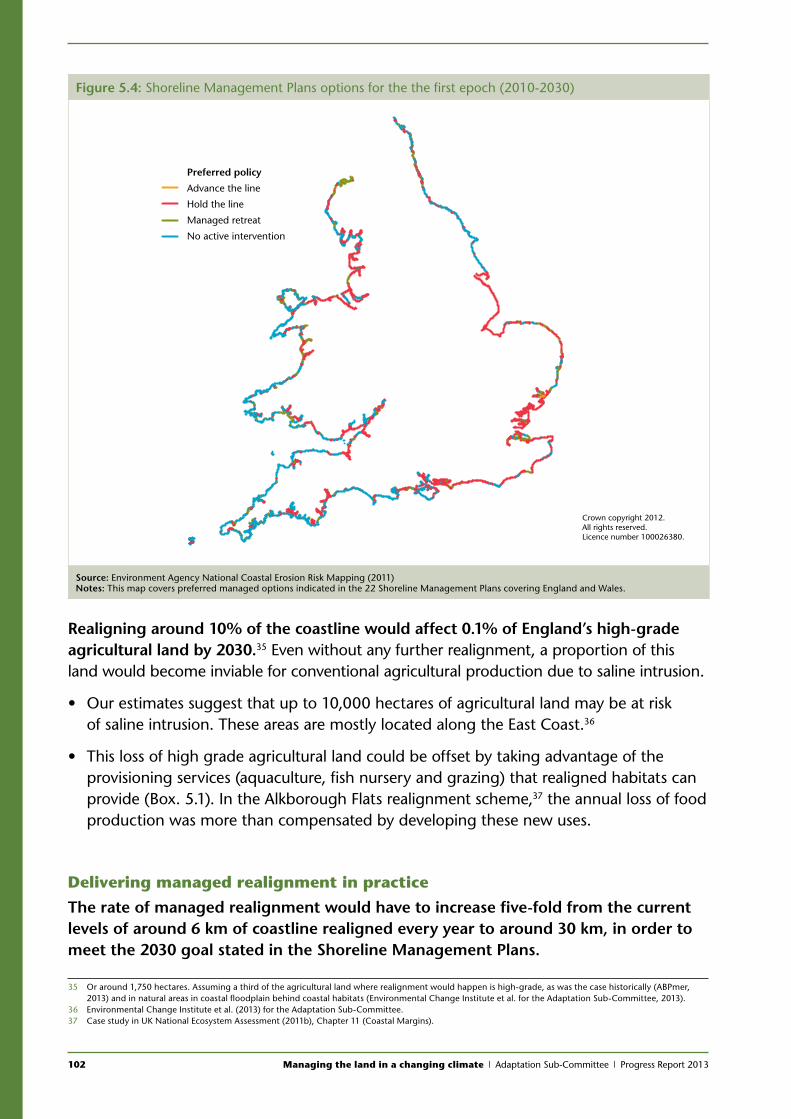
102 Managing the land in a changing climate | Adaptation Sub-Committee | Progress Report 2013
Realigning around 10% of the coastline would affect 0.1% of England’s high-grade agricultural land by 2030.35 Even without any further realignment, a proportion of this land would become inviable for conventional agricultural production due to saline intrusion.
• Our estimates suggest that up to 10,000 hectares of agricultural land may be at risk of saline intrusion. These areas are mostly located along the East Coast.36
• This loss of high grade agricultural land could be offset by taking advantage of the provisioning services (aquaculture, fish nursery and grazing) that realigned habitats can provide (Box. 5.1). In the Alkborough Flats realignment scheme,37 the annual loss of food production was more than compensated by developing these new uses.
Delivering managed realignment in practice
The rate of managed realignment would have to increase five-fold from the current levels of around 6 km of coastline realigned every year to around 30 km, in order to meet the 2030 goal stated in the Shoreline Management Plans.
35 Or around 1,750 hectares. Assuming a third of the agricultural land where realignment would happen is high-grade, as was the case historically (ABPmer, 2013) and in natural areas in coastal floodplain behind coastal habitats (Environmental Change Institute et al. for the Adaptation Sub-Committee, 2013).
36 Environmental Change Institute et al. (2013) for the Adaptation Sub-Committee.37 Case study in UK National Ecosystem Assessment (2011b), Chapter 11 (Coastal Margins).
Figure 5.4: Shoreline Management Plans options for the the first epoch (2010-2030)
Preferred policy
Advance the line
Hold the line
Managed retreat
No active intervention
Crown copyright 2012.All rights reserved.Licence number 100026380.
Source: Environment Agency National Coastal Erosion Risk Mapping (2011)Notes: This map covers preferred managed options indicated in the 22 Shoreline Management Plans covering England and Wales.
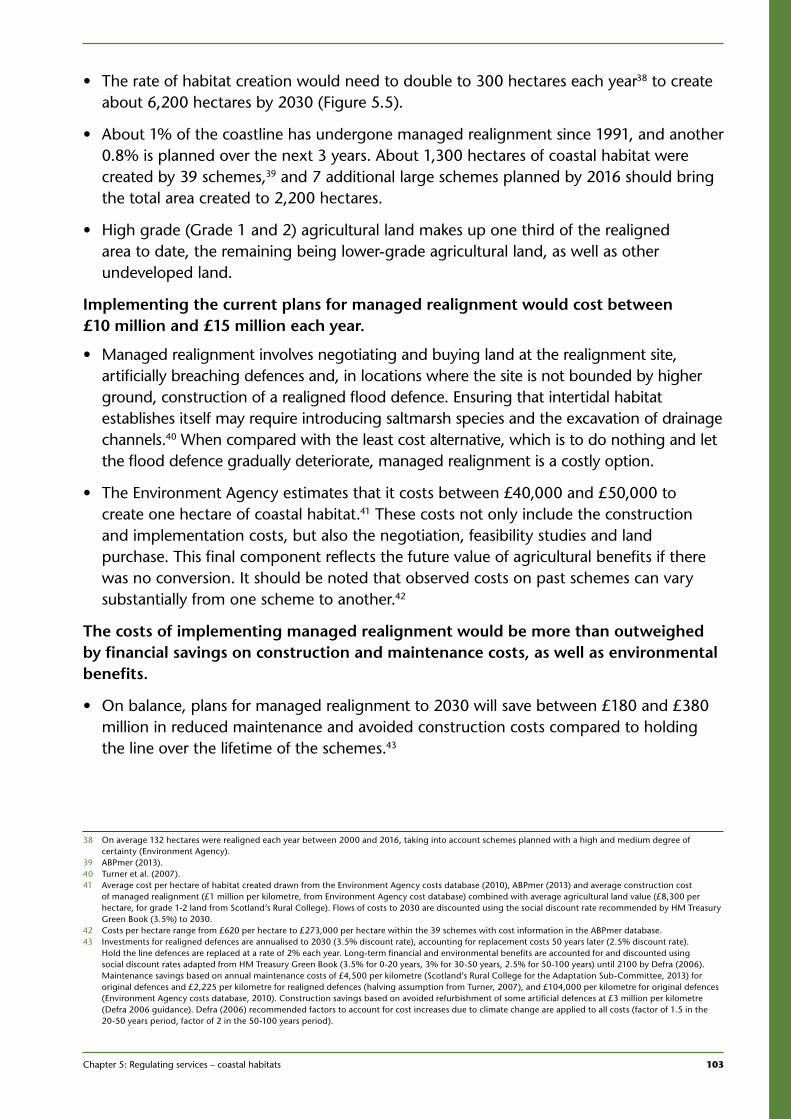
Chapter 5: Regulating services – coastal habitats 103
1
• The rate of habitat creation would need to double to 300 hectares each year38 to create about 6,200 hectares by 2030 (Figure 5.5).
• About 1% of the coastline has undergone managed realignment since 1991, and another 0.8% is planned over the next 3 years. About 1,300 hectares of coastal habitat were created by 39 schemes,39 and 7 additional large schemes planned by 2016 should bring the total area created to 2,200 hectares.
• High grade (Grade 1 and 2) agricultural land makes up one third of the realigned area to date, the remaining being lower-grade agricultural land, as well as other undeveloped land.
Implementing the current plans for managed realignment would cost between £10 million and £15 million each year.
• Managed realignment involves negotiating and buying land at the realignment site, artificially breaching defences and, in locations where the site is not bounded by higher ground, construction of a realigned flood defence. Ensuring that intertidal habitat establishes itself may require introducing saltmarsh species and the excavation of drainage channels.40 When compared with the least cost alternative, which is to do nothing and let the flood defence gradually deteriorate, managed realignment is a costly option.
• The Environment Agency estimates that it costs between £40,000 and £50,000 to create one hectare of coastal habitat.41 These costs not only include the construction and implementation costs, but also the negotiation, feasibility studies and land purchase. This final component reflects the future value of agricultural benefits if there was no conversion. It should be noted that observed costs on past schemes can vary substantially from one scheme to another.42
The costs of implementing managed realignment would be more than outweighed by financial savings on construction and maintenance costs, as well as environmental benefits.
• On balance, plans for managed realignment to 2030 will save between £180 and £380 million in reduced maintenance and avoided construction costs compared to holding the line over the lifetime of the schemes.43
38 On average 132 hectares were realigned each year between 2000 and 2016, taking into account schemes planned with a high and medium degree of certainty (Environment Agency).
39 ABPmer (2013).40 Turner et al. (2007).41 Average cost per hectare of habitat created drawn from the Environment Agency costs database (2010), ABPmer (2013) and average construction cost
of managed realignment (£1 million per kilometre, from Environment Agency cost database) combined with average agricultural land value (£8,300 per hectare, for grade 1-2 land from Scotland’s Rural College). Flows of costs to 2030 are discounted using the social discount rate recommended by HM Treasury Green Book (3.5%) to 2030.
42 Costs per hectare range from £620 per hectare to £273,000 per hectare within the 39 schemes with cost information in the ABPmer database.43 Investments for realigned defences are annualised to 2030 (3.5% discount rate), accounting for replacement costs 50 years later (2.5% discount rate).
Hold the line defences are replaced at a rate of 2% each year. Long-term financial and environmental benefits are accounted for and discounted using social discount rates adapted from HM Treasury Green Book (3.5% for 0-20 years, 3% for 30-50 years, 2.5% for 50-100 years) until 2100 by Defra (2006). Maintenance savings based on annual maintenance costs of £4,500 per kilometre (Scotland’s Rural College for the Adaptation Sub-Committee, 2013) for original defences and £2,225 per kilometre for realigned defences (halving assumption from Turner, 2007), and £104,000 per kilometre for original defences (Environment Agency costs database, 2010). Construction savings based on avoided refurbishment of some artificial defences at £3 million per kilometre (Defra 2006 guidance). Defra (2006) recommended factors to account for cost increases due to climate change are applied to all costs (factor of 1.5 in the 20-50 years period, factor of 2 in the 50-100 years period).
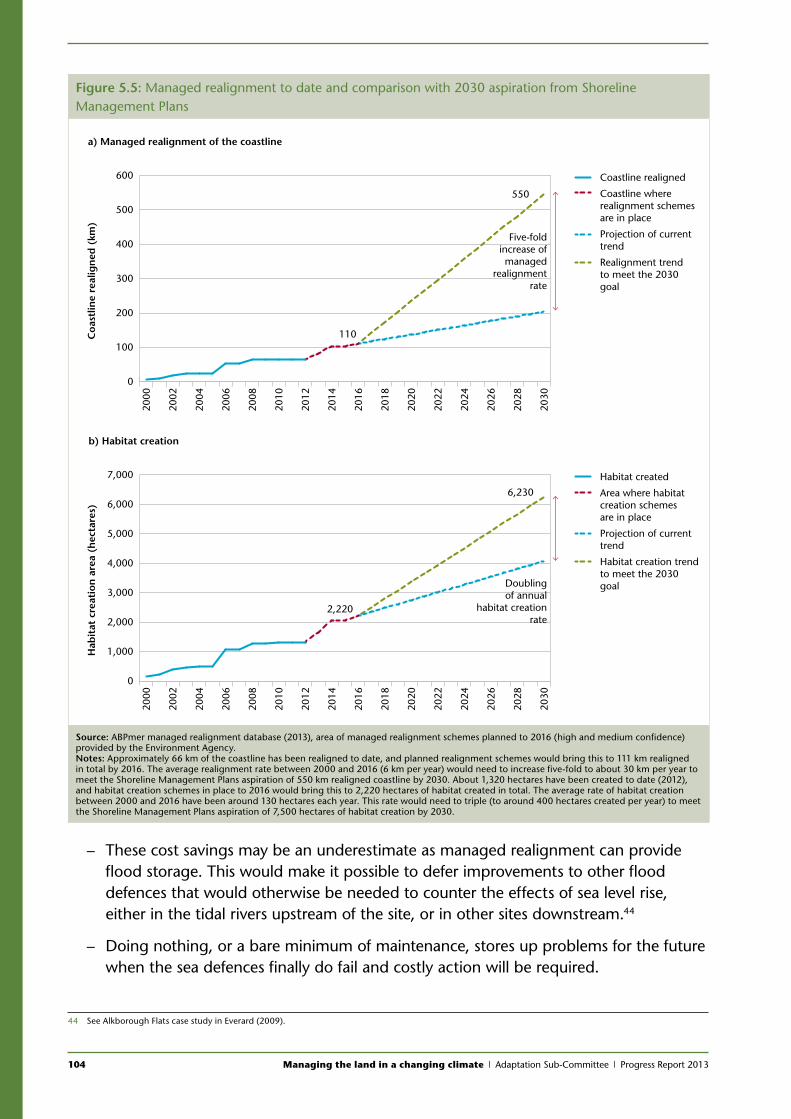
104 Managing the land in a changing climate | Adaptation Sub-Committee | Progress Report 2013
– These cost savings may be an underestimate as managed realignment can provide flood storage. This would make it possible to defer improvements to other flood defences that would otherwise be needed to counter the effects of sea level rise, either in the tidal rivers upstream of the site, or in other sites downstream.44
– Doing nothing, or a bare minimum of maintenance, stores up problems for the future when the sea defences finally do fail and costly action will be required.
44 See Alkborough Flats case study in Everard (2009).
Figure 5.5: Managed realignment to date and comparison with 2030 aspiration from Shoreline Management Plans
Habitat created
Area where habitat creation schemes are in place
Projection of current trend
Habitat creation trendto meet the 2030goal
Hab
itat
cre
atio
n a
rea
(hec
tare
s)
0
1,000
2,000
3,000
4,000
5,000
6,000
7,000
2,220
6,230
550
Doublingof annual
habitat creationrate
2028
2026
2024
2022
2020
2018
2016
2014
2012
2010
2008
2006
2004
2002
2000
2030
b) Habitat creation
Coastline realigned
Coastline where realignment schemes are in place
Projection of current trend
Realignment trendto meet the 2030goal
Coa
stlin
e re
alig
ned
(km
)
0
100
200
300
400
500
600
Five-foldincrease ofmanaged
realignmentrate
2028
2026
2024
2022
2020
2018
2016
2014
2012
2010
2008
2006
2004
2002
2000
2030
a) Managed realignment of the coastline
110
Source: ABPmer managed realignment database (2013), area of managed realignment schemes planned to 2016 (high and medium confidence) provided by the Environment Agency.Notes: Approximately 66 km of the coastline has been realigned to date, and planned realignment schemes would bring this to 111 km realigned in total by 2016. The average realignment rate between 2000 and 2016 (6 km per year) would need to increase five-fold to about 30 km per year to meet the Shoreline Management Plans aspiration of 550 km realigned coastline by 2030. About 1,320 hectares have been created to date (2012), and habitat creation schemes in place to 2016 would bring this to 2,220 hectares of habitat created in total. The average rate of habitat creation between 2000 and 2016 have been around 130 hectares each year. This rate would need to triple (to around 400 hectares created per year) to meet the Shoreline Management Plans aspiration of 7,500 hectares of habitat creation by 2030.
Chapter 5: Regulating services – coastal habitats 105
1
Plans for managed realignment would also compensate for coastal habitat loss, delivering environmental benefits valued at around between £80 and £280 million.45 Not all of the land set aside for realignment is always transformed into intertidal habitats. For instance, a scheme in the Humber estuary created 170 hectares of intertidal habitats permanently exposed to flooding and 230 hectares to be used as a storage capacity during extreme surge events.46
5.5 Conclusions and policy advice
Coastal habitats provide valuable services in reducing the risk of flooding and coastal erosion. These services are threatened by sea level rise. Sea level rise will increase flood and erosion risk on the coast and as a consequence mean higher costs to society to manage this risk in the future. These costs will be even higher if there is continued loss and degradation of coastal habitats as a result of pressures such as development and coastal squeeze.
There has been progress over the last decade in developing long-term strategies for managing the coast. The Shoreline Management Plans are an important step in taking a strategic approach to choosing how to respond to inevitable changes on the coast, based on a scientific understanding of coastal processes. These ‘bottom-up’ strategies have required local communities to work together across administrative boundaries.
The Shoreline Management Plans recognise the financial and environmental benefits of managed realignment and aspire to realign some 10% of the coastline by 2030 and 15% by 2060. Meeting these goals would help to minimise the increase in coastal management costs and help to ensure the resilience of coastal habitats to sea level rise for the next few decades.
However, the current rate of implementation falls well short of what is required to reach the 2030 goal. Each year between now and 2030, an average of 30 km of coastline would need to be realigned to deliver realignment along 9% of the coastline, creating around 6,200 hectares of coastal habitat in total. The schemes delivered to date have only realigned about 6 km each year on average and created some 130 hectares of coastal habitat each year.47
A number of barriers appear to be hindering the implementation of managed realignment schemes.
• High upfront costs: Managed realignment schemes involve upfront costs that are higher than the costs of maintaining an existing defence or allowing a gradual decline in its condition. However, over the long term, the financial and environmental benefits of realignment outweigh these costs.
45 Average environmental benefit (£1500 perhectare peryear) based on Eftec (2010)’ indicative value for saltmarsh. 46 Everard (2009) for the Environment Agency.47 Calculated over the 2000-2016 period.
106 Managing the land in a changing climate | Adaptation Sub-Committee | Progress Report 2013
• Financial incentives: When the Environment Agency embarks on managed realignment schemes, it will compensate landowners by buying up their land when habitat is created. However, satisfactory arrangements can take years to be achieved. For example, the site selection and procurement period for the Wallasea scheme took seven years, whereas the planning and building of the scheme itself took two and a half years.48
• Public perception: Many stakeholders have identified the lack of public support, including local political support, as one of the major barriers to implementation.49 For instance, one study found that potential social and community issues had made it difficult for North Norfolk District Council to accept some of the original Shoreline Management Plan recommendations.50
In order to overcome these barriers, the Government should consider:
• Ensuring appropriate valuation for the services provided by realigned coastal habitats. The current lack of a transparent methodology to account for the value of the ecosystem services means that the benefits of managed realignment are often not fully accounted for in economic appraisals for flood and erosion schemes. Landowners may not receive adequate compensation. On the other hand one study found that that some land has been bought at a premium in the past.51 The Government’s recently published action plan for developing the potential of payment for ecosystem services highlights flood risk management as a specific area of opportunity.52
• Requiring that local authorities and the Environment Agency develop clearer implementation programmes in line with the preferred options set out in the Shoreline Management Plans. Ensuring that existing development plans are fully aligned with Shoreline Management Plan goals is particularly important where managed realignment is the preferred management option at some point in the future. This will help ensure that new development does not hinder the implementation of managed realignment.
• Ensuring an open and realistic approach to adaptation planning on the coast. Gaining public support requires regular consultation and communication with local communities to help them understand the long term changes that are inevitable on the coast and the costs, risks and benefits of coastal management options. Coastal management planning and implementation involves difficult trade-offs and potentially unwelcome changes for some residents. Local authorities need to adopt an integrated approach to planning how coastal communities can thrive socially and economically while they adapt to rising sea levels.
48 Garbutt and Boorman (2009).49 Ledoux et al. (2005).50 Risk and Policy Analysts ltd. et al. (2008) for the North Norfolk Council District.51 Garbutt et al. (2009).52 Defra (2013a). Note that the action plan appears to focus more on the potential for fluvial, rather than coastal, flood risk management payment for ecosystem
services schemes.
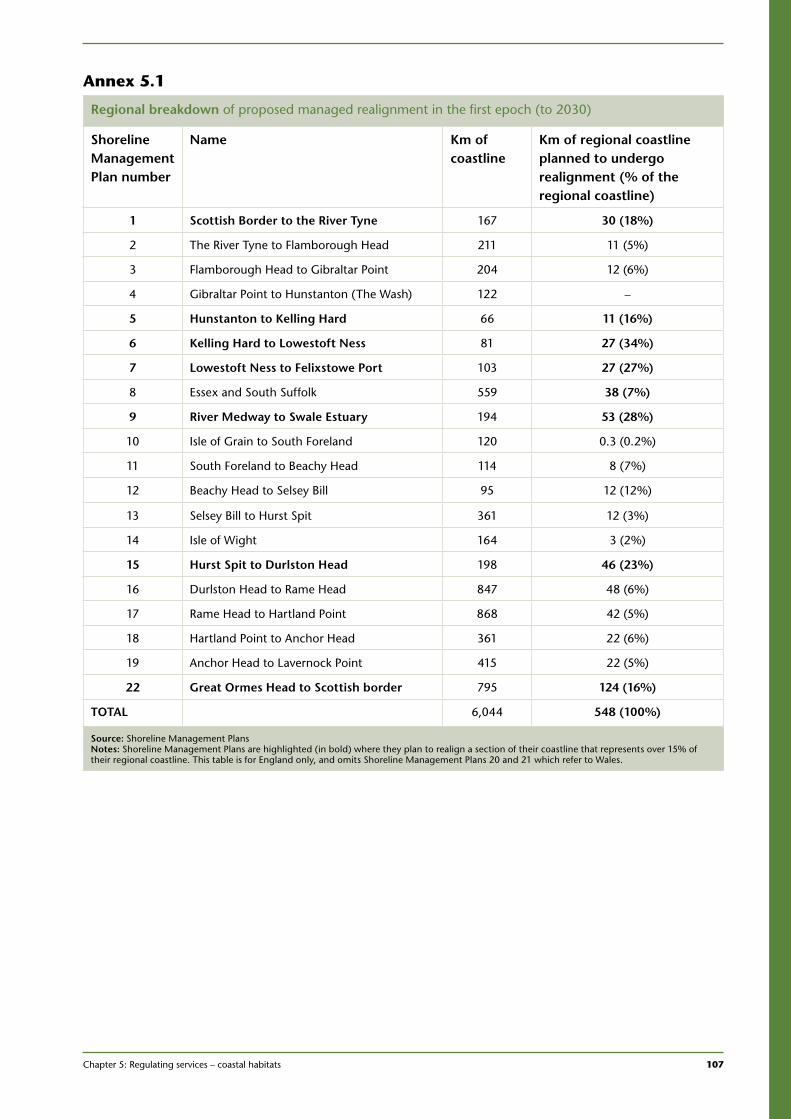
Chapter 5: Regulating services – coastal habitats 107
1
Annex 5.1
Regional breakdown of proposed managed realignment in the first epoch (to 2030)
Shoreline Management Plan number
Name Km of coastline
Km of regional coastline planned to undergo realignment (% of the regional coastline)
1 Scottish Border to the River Tyne 167 30 (18%)
2 The River Tyne to Flamborough Head 211 11 (5%)
3 Flamborough Head to Gibraltar Point 204 12 (6%)
4 Gibraltar Point to Hunstanton (The Wash) 122 –
5 Hunstanton to Kelling Hard 66 11 (16%)
6 Kelling Hard to Lowestoft Ness 81 27 (34%)
7 Lowestoft Ness to Felixstowe Port 103 27 (27%)
8 Essex and South Suffolk 559 38 (7%)
9 River Medway to Swale Estuary 194 53 (28%)
10 Isle of Grain to South Foreland 120 0.3 (0.2%)
11 South Foreland to Beachy Head 114 8 (7%)
12 Beachy Head to Selsey Bill 95 12 (12%)
13 Selsey Bill to Hurst Spit 361 12 (3%)
14 Isle of Wight 164 3 (2%)
15 Hurst Spit to Durlston Head 198 46 (23%)
16 Durlston Head to Rame Head 847 48 (6%)
17 Rame Head to Hartland Point 868 42 (5%)
18 Hartland Point to Anchor Head 361 22 (6%)
19 Anchor Head to Lavernock Point 415 22 (5%)
22 Great Ormes Head to Scottish border 795 124 (16%)
TOTAL 6,044 548 (100%)
Source: Shoreline Management PlansNotes: Shoreline Management Plans are highlighted (in bold) where they plan to realign a section of their coastline that represents over 15% of their regional coastline. This table is for England only, and omits Shoreline Management Plans 20 and 21 which refer to Wales.
108 Managing the land in a changing climate | Adaptation Sub-Committee | Progress Report 2013
Chapter 66.1 Introduction
6.2 The role of the ASC in evaluating the National Adaptation Programme
6.3 Overarching conclusions from 2013 analysis
6.4 Update on flooding and water scarcity
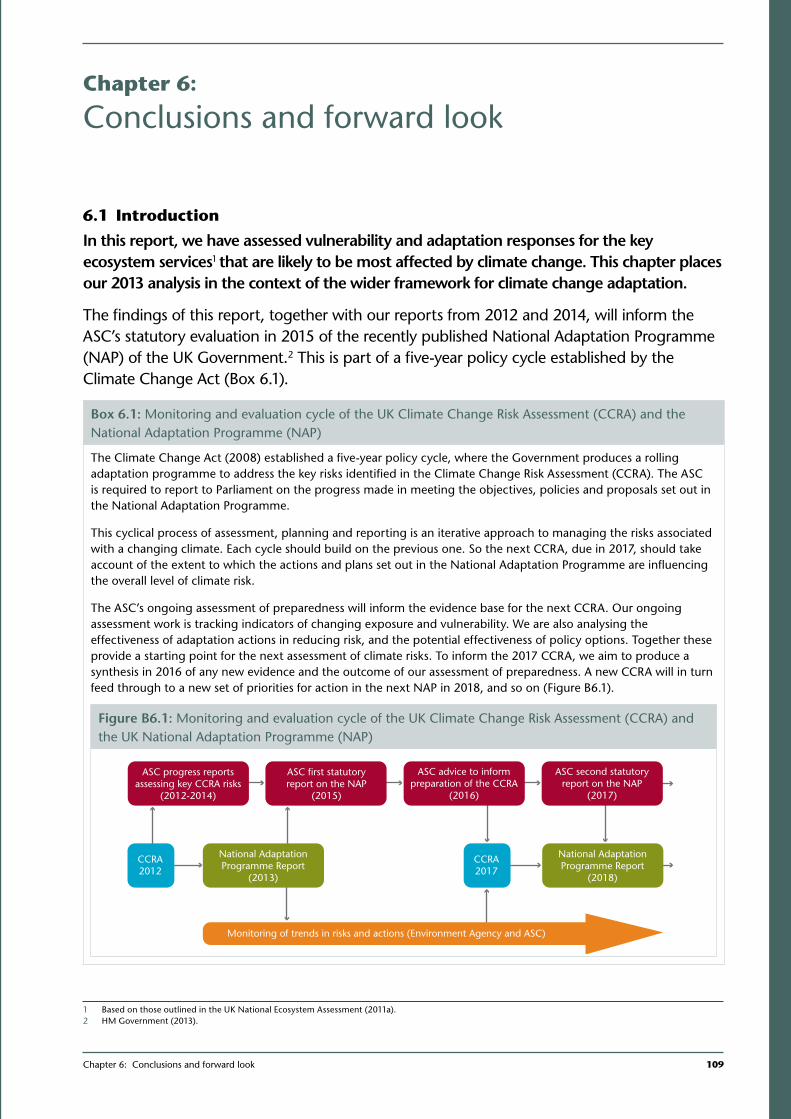
Chapter 6: Conclusions and forward look 109
1
Chapter 6:
Conclusions and forward look
6.1 Introduction
In this report, we have assessed vulnerability and adaptation responses for the key ecosystem services1 that are likely to be most affected by climate change. This chapter places our 2013 analysis in the context of the wider framework for climate change adaptation.
The findings of this report, together with our reports from 2012 and 2014, will inform the ASC’s statutory evaluation in 2015 of the recently published National Adaptation Programme (NAP) of the UK Government.2 This is part of a five-year policy cycle established by the Climate Change Act (Box 6.1).
Box 6.1: Monitoring and evaluation cycle of the UK Climate Change Risk Assessment (CCRA) and the National Adaptation Programme (NAP)
The Climate Change Act (2008) established a five-year policy cycle, where the Government produces a rolling adaptation programme to address the key risks identified in the Climate Change Risk Assessment (CCRA). The ASC is required to report to Parliament on the progress made in meeting the objectives, policies and proposals set out in the National Adaptation Programme.
This cyclical process of assessment, planning and reporting is an iterative approach to managing the risks associated with a changing climate. Each cycle should build on the previous one. So the next CCRA, due in 2017, should take account of the extent to which the actions and plans set out in the National Adaptation Programme are influencing the overall level of climate risk.
The ASC’s ongoing assessment of preparedness will inform the evidence base for the next CCRA. Our ongoing assessment work is tracking indicators of changing exposure and vulnerability. We are also analysing the effectiveness of adaptation actions in reducing risk, and the potential effectiveness of policy options. Together these provide a starting point for the next assessment of climate risks. To inform the 2017 CCRA, we aim to produce a synthesis in 2016 of any new evidence and the outcome of our assessment of preparedness. A new CCRA will in turn feed through to a new set of priorities for action in the next NAP in 2018, and so on (Figure B6.1).
1 Based on those outlined in the UK National Ecosystem Assessment (2011a).2 HM Government (2013).
Figure B6.1: Monitoring and evaluation cycle of the UK Climate Change Risk Assessment (CCRA) and the UK National Adaptation Programme (NAP)
ASC first statutoryreport on the NAP
(2015)
ASC progress reportsassessing key CCRA risks
(2012-2014)
National AdaptationProgramme Report
(2013)
Monitoring of trends in risks and actions (Environment Agency and ASC)
CCRA2012
CCRA2017
National AdaptationProgramme Report
(2018)
ASC advice to informpreparation of the CCRA
(2016)
ASC second statutoryreport on the NAP
(2017)
110 Managing the land in a changing climate | Adaptation Sub-Committee | Progress Report 2013
This chapter takes a look forward towards our statutory report to Parliament in 2015. It includes:
• Details of the ASC’s role in evaluating the National Adaptation Programme.
• A summary of the cross-cutting issues and policy advice raised from the analysis in this report, including a review of the indicators used and key evidence gaps.
• An update on policy developments since the publication of our report on flooding and water scarcity in 2012.
6.2 The role of the ASC in evaluating the National Adaptation Programme
In 2015, the ASC will produce a statutory report to Parliament on progress in meeting the objectives, policies and proposals set out in the National Adaptation Programme. We will update these reports every two years thereafter, as required by the Climate Change Act.
The UK Government published its first National Adaptation Programme in July 2013. The programme sets out the national priorities for action over the next five years in order to address the risks set out in the 2012 UK Climate Change Risk Assessment.
In line with the requirements of the Climate Change Act, the Committee will consider the extent to which:
1. the objectives of the adaptation programme address the key climate change risks where further Government intervention is required;
2. the policies set out meet the objectives of the programme by addressing outstanding barriers and enabling action to prepare for a changing climate; and
3. the policies are being implemented.
We have been applying the ASC assessment toolkit to the major risks and opportunities identified by the CCRA. These are set out in a series of reports from 2012 to 2014. In 2012, we applied the toolkit to two of the largest risks from the CCRA; flooding and water scarcity for households and businesses. This year’s report has considered risks to some of the key ecosystem services provided by the land. In 2014, we plan to cover health, infrastructure and business supply chains. These reports use indicators to measure changes in exposure and vulnerability to climate change and the uptake of adaptation actions to reduce impacts. Decision making is also examined to identify incentives and barriers to adaptation.
In some cases, the ASC has quantified the feasibility and costs of a range of low-regret adaptations. For example, we have used economic analysis to consider the appropriate scale of action for adaptations such as water efficiency, installation of property-level flood defences, uptake of on-farm reservoirs, and upland peat restoration. We have also been able to measure the uptake of these actions to reach a view on how far the current scale of action addresses the risks from climate change.
In other cases, where there is less quantitative evidence on the effectiveness of actions, the ASC will track trends and provide a qualitative evaluation of how the level of risk is likely to be changing. Examples of these indicators are trends in soil quality and the condition and size of semi-natural habitats.
Chapter 6: Conclusions and forward look 111
1
The ASC will work with the Environment Agency and other organisations with relevant data to update the indicators. We will also update the indicator set for 2015 to take account of any additional measurable actions set out in the National Adaptation Programme.
6.3 Overarching conclusions from 2013 analysis
Conclusions and cross-cutting issues
Our analysis of how climate change might affect the important ecosystem services provided by the land has produced three broad conclusions:
• Climate change makes the case for action more compelling.
• Many of the Government’s policy goals for managing the land provide a framework for adaptation, but the speed of implementation is not in line with the policy goal.
• Valuing ecosystem services explicitly will help to incentivise adaptation and reduce some actions that increase exposure and vulnerability to climate change, such as over-exploitation of water resources.
Climate change increases the case for action
There are low-cost opportunities to make the natural capital of this country more resilient to climate change. Our analysis has demonstrated in a number of areas that climate change is likely to increase the risks to the natural capital in this country. This strengthens the case for action.
• Reduced rainfall could lower agricultural water supply by up to 15% by the 2020s. Increases in soil moisture deficits of around 40%, on top of rising pressure on water resources from population growth, could increase demand by between 15% and 55%.
• Climate change is projected to increase the rate of loss of degraded peat soils, potentially leading to complete loss in parts of the lowlands within between 30 and 60 years.3 Taking action to restore degraded upland peat becomes more cost-beneficial once the risks of climate change are taken into account.
• Local authorities project a 60% increase in their coastal defence costs by 2030 in the face of sea level rise. Further losses of coastal habitats from coastal squeeze and development would put greater pressure on the coastal defence budget.
Implementation of policy goals
Many of the actions required to prepare ecosystems for a changing climate are simply good land management. The Government has set appropriate policy goals in some cases, but implementation of these policy goals is not on track. In other cases there are policy gaps.
3 Compared to complete loss in 80 years if climate change is not included in the projections.
112 Managing the land in a changing climate | Adaptation Sub-Committee | Progress Report 2013
Our analysis has identified examples of policy goals, outlined below,4 that would make a significant contribution to addressing key risks to ecosystem services from climate change if they were implemented over the next decade:
• Reforming the abstraction regime for water, to allow for flexibility in the system to respond to changes in water availability (Water White Paper, 2011).
• Managing all soils sustainably by 2030 (Natural Environment White Paper, 2011).
• Enhancing the condition and extent of semi-natural habitats (Biodiversity 2020 – England Biodiversity Strategy, 2011).
• Realigning nearly 10% of the coastline length by 2030 and nearly 15% by 2060 (set out in Shoreline Management Plans).
However, in most cases implementation remains slow:
• Our analysis suggests that there are potentially large risks to water availability for crop production in the 2020s, driven by climate change and increased demand from other abstractors. Changes to the abstraction regime to set up a pricing framework are not due to be completed until 2020 at the earliest. This mechanism will therefore not drive required action on supply and demand measures in the next ten years. The Water Bill contains little on incentivising more efficient use of water in agriculture or other sectors.
• Given the decline in the proportion of wildlife sites classed as in good condition over the past 10 years, it is unclear whether the Government will meet its policy goal for half of all protected sites to be in a favourable condition by 2020. Similarly, there is a question over whether or not the goal of increasing the extent of semi-natural habitats by 2,000 km2 by 2020 will be met.
• Only 1% of the coastline has been realigned since 1990, with another 0.8% planned in the next three years. This is about five times slower than the rate needed to meet the 10% plan of coastal authorities for realignment by 2030. There is no evidence of a detailed implementation programme to deliver the Shoreline Management Plans.
Although around 40% of upland peat is protected under the Habitats Directive, there is no explicit policy on peatland restoration, other than on managing soils more generally.
In our 2015 report to Parliament, we will consider how far the Government is on track to meet its policy goals, and consider what other incentives and barriers are affecting levels of action.
Valuing ecosystem services
Improving the resilience of ecosystem services to climate change can involve trade-offs with other policy objectives. These trade-offs are more likely to be managed effectively if the value of ecosystem services is taken into account in the decision-making process.
4 The goals are set out in the documents listed in brackets.
Chapter 6: Conclusions and forward look 113
1
Some adaptations have few negative trade-offs. These are often low-regret options that make sense to implement in any plausible future climate scenario, for example improving the water efficiency of crop production or undertaking surveillance for new pests and diseases.
However, in some cases, increasing the resilience of one ecosystem service can have negative impacts for others. Many trade-offs emerge due to the allocation of scarce resources such as water and soil, and choices about land use. For example:
• Restoring upland peat areas can displace current activities, such as livestock farming and grouse shooting. It can be possible for these land uses to co-exist to some extent.
• Realignment of coastal defences can improve the resilience and cost-effectiveness of coastal defences, but agricultural land can be lost in the process. Realigned coastal areas can provide opportunities for alternative forms of production, such as aquaculture, fish nurseries, or saltmarsh beef production.
• Increasing abstraction of water for agriculture could reduce the amount available for the natural environment.
• Increasing drainage of agricultural land could improve agricultural productivity, but at the same time could increase flood risk elsewhere or increase diffuse pollution.
These trade-offs are currently difficult to resolve because the total value of ecosystem services is often not reflected in market prices. For example, not having a price for water that reflects its scarcity is leading to environmental damage in some catchments. The costs of this damage are not currently included in the price of abstraction for farmers.
The UK National Ecosystem Assessment (2011), Natural Environment White Paper (2012) and Natural Capital Committee report (2013) progressively set out the development of a system for better valuing ecosystem services by Government. Reflecting the value of ecosystem services in private decisions will require further measures, either in the form of government intervention (such as taxes and subsidies) or other market-based mechanisms. The Government’s recently published Payments for Ecosystem Services Action Plan5 is exploring ways to develop the potential for additional investment in the natural environment through placing an economic value on the services provided by natural capital.
Summary of Indicators
For this report, we have developed indicators of progress in adaptation using both existing publicly available metrics and our own analysis to develop new datasets. Annex 6.1 lists these indicators, including a summary of recent trends.
In some cases, data do not exist to track progress for risks and actions that we would like to monitor. There are also some areas where our understanding of risks or the effectiveness of actions is limited. Annex 6.2 outlines gaps in evidence related to the analysis in this report that need to be filled to assess progress more robustly.
5 Defra (2013a).
114 Managing the land in a changing climate | Adaptation Sub-Committee | Progress Report 2013
6.4 Update on flooding and water scarcity
In our 2012 progress report, we considered the level of preparedness for risks from flooding to the built environment and future water scarcity in public water supply. The report included advice on decision making and barriers to action. Table 6.1 provides an update on decisions and actions that have been taken over the past year in relation to our advice.
Flooding
In our 2012 report, we considered how investment in flood defences, the uptake of property level flood defence measures and land-use planning decisions could help to address the increased risks of flooding expected with climate change. We concluded that current investment in flood defences would not keep pace with increasing flood risk, that there was greater scope for the uptake of property level measures and a need for more transparent implementation of planning policy in relation to development in flood risk areas.
In the 2012 Autumn Statement the Government announced an additional £120 million of capital funding to be spent on building new flood defences over the remainder of the current spending review period. In the June 2013 Spending Round the Government also announced £370 million would be spent on building new flood defences in 2015/16, a rise from the £344 million allocated in 2014/15, and that this will rise with inflation. These announcements mean that over the current decade spending on flood defences will match previous spending levels, after accounting for inflation. However, this remains below the amount the Environment Agency estimated in their 2009 Long-Term Investment Strategy would be required to keep pace with climate change.6
Updated guidance for local authorities on how they should account for flood risk when planning for development has not yet been published. However, an independent review for Government into streamlining planning guidance for local authorities identified flood risk as a priority issue.7
Water scarcity
In our 2012 report, we compared the balance of effort on supply and demand measures in public water supply, and concluded there was greater scope to reduce demand in household water usage. Some progress has been made in the last year to put in place measures to achieve this. The Environment Agency has produced a new draft methodology for designating water stressed areas that includes the future impacts of climate change. This will allow water companies to consider compulsory metering where there is a future risk of water scarcity from climate change. This has not been the case to date.
Defra’s strategic guidance to Ofwat has stressed the need to consider demand management options (such as metering and pricing) fully before making an economic case for supply options such as new reservoirs. The next Price Review in 2014 will be a
6 Environment Agency (2009).7 External Review of Government Planning Practice Guidance by Lord Taylor of Gross Moor (2012).
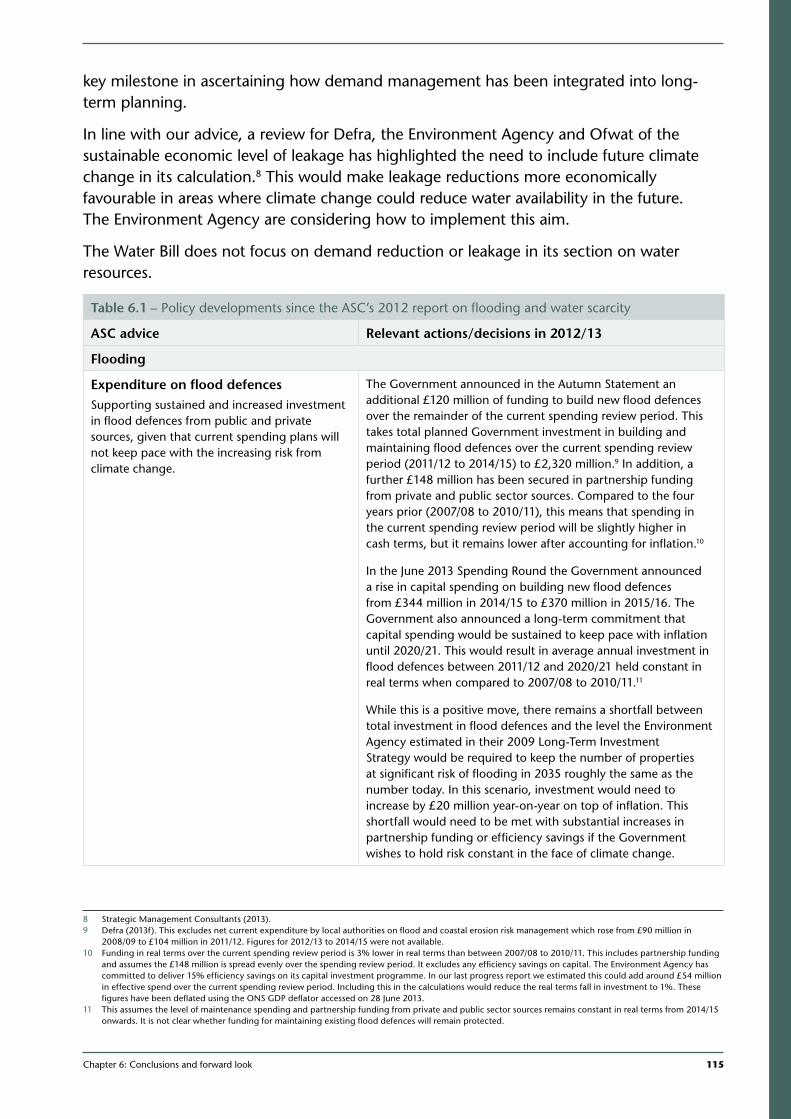
Chapter 6: Conclusions and forward look 115
1
key milestone in ascertaining how demand management has been integrated into long-term planning.
In line with our advice, a review for Defra, the Environment Agency and Ofwat of the sustainable economic level of leakage has highlighted the need to include future climate change in its calculation.8 This would make leakage reductions more economically favourable in areas where climate change could reduce water availability in the future. The Environment Agency are considering how to implement this aim.
The Water Bill does not focus on demand reduction or leakage in its section on water resources.
Table 6.1 – Policy developments since the ASC’s 2012 report on flooding and water scarcity
ASC advice Relevant actions/decisions in 2012/13
Flooding
Expenditure on flood defencesSupporting sustained and increased investment in flood defences from public and private sources, given that current spending plans will not keep pace with the increasing risk from climate change.
The Government announced in the Autumn Statement an additional £120 million of funding to build new flood defences over the remainder of the current spending review period. This takes total planned Government investment in building and maintaining flood defences over the current spending review period (2011/12 to 2014/15) to £2,320 million.9 In addition, a further £148 million has been secured in partnership funding from private and public sector sources. Compared to the four years prior (2007/08 to 2010/11), this means that spending in the current spending review period will be slightly higher in cash terms, but it remains lower after accounting for inflation.10
In the June 2013 Spending Round the Government announced a rise in capital spending on building new flood defences from £344 million in 2014/15 to £370 million in 2015/16. The Government also announced a long-term commitment that capital spending would be sustained to keep pace with inflation until 2020/21. This would result in average annual investment in flood defences between 2011/12 and 2020/21 held constant in real terms when compared to 2007/08 to 2010/11.11
While this is a positive move, there remains a shortfall between total investment in flood defences and the level the Environment Agency estimated in their 2009 Long-Term Investment Strategy would be required to keep the number of properties at significant risk of flooding in 2035 roughly the same as the number today. In this scenario, investment would need to increase by £20 million year-on-year on top of inflation. This shortfall would need to be met with substantial increases in partnership funding or efficiency savings if the Government wishes to hold risk constant in the face of climate change.
9 10 11
8 Strategic Management Consultants (2013).9 Defra (2013f). This excludes net current expenditure by local authorities on flood and coastal erosion risk management which rose from £90 million in
2008/09 to £104 million in 2011/12. Figures for 2012/13 to 2014/15 were not available.10 Funding in real terms over the current spending review period is 3% lower in real terms than between 2007/08 to 2010/11. This includes partnership funding
and assumes the £148 million is spread evenly over the spending review period. It excludes any efficiency savings on capital. The Environment Agency has committed to deliver 15% efficiency savings on its capital investment programme. In our last progress report we estimated this could add around £54 million in effective spend over the current spending review period. Including this in the calculations would reduce the real terms fall in investment to 1%. These figures have been deflated using the ONS GDP deflator accessed on 28 June 2013.
11 This assumes the level of maintenance spending and partnership funding from private and public sector sources remains constant in real terms from 2014/15 onwards. It is not clear whether funding for maintaining existing flood defences will remain protected.
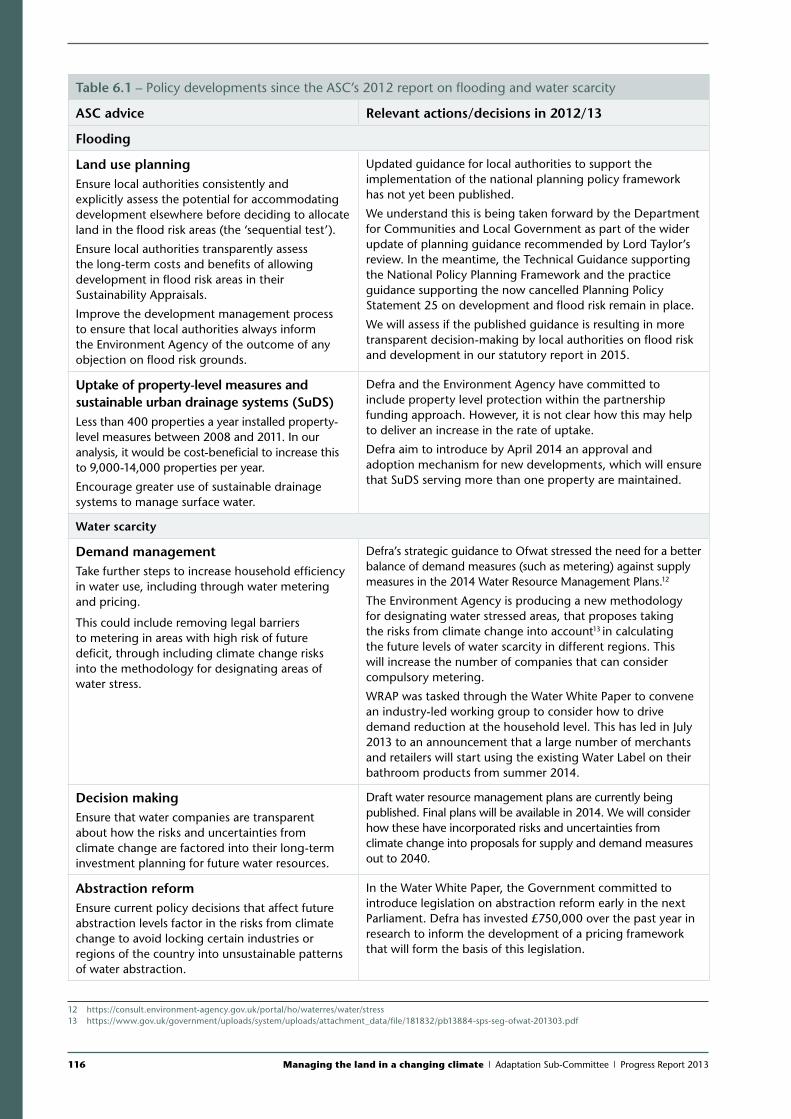
116 Managing the land in a changing climate | Adaptation Sub-Committee | Progress Report 2013
Table 6.1 – Policy developments since the ASC’s 2012 report on flooding and water scarcity
ASC advice Relevant actions/decisions in 2012/13
Flooding
Land use planningEnsure local authorities consistently and explicitly assess the potential for accommodating development elsewhere before deciding to allocate land in the flood risk areas (the ‘sequential test’).
Ensure local authorities transparently assess the long-term costs and benefits of allowing development in flood risk areas in their Sustainability Appraisals.
Improve the development management process to ensure that local authorities always inform the Environment Agency of the outcome of any objection on flood risk grounds.
Updated guidance for local authorities to support the implementation of the national planning policy framework has not yet been published.
We understand this is being taken forward by the Department for Communities and Local Government as part of the wider update of planning guidance recommended by Lord Taylor’s review. In the meantime, the Technical Guidance supporting the National Policy Planning Framework and the practice guidance supporting the now cancelled Planning Policy Statement 25 on development and flood risk remain in place.
We will assess if the published guidance is resulting in more transparent decision-making by local authorities on flood risk and development in our statutory report in 2015.
Uptake of property-level measures and sustainable urban drainage systems (SuDS)Less than 400 properties a year installed property-level measures between 2008 and 2011. In our analysis, it would be cost-beneficial to increase this to 9,000-14,000 properties per year.
Encourage greater use of sustainable drainage systems to manage surface water.
Defra and the Environment Agency have committed to include property level protection within the partnership funding approach. However, it is not clear how this may help to deliver an increase in the rate of uptake.
Defra aim to introduce by April 2014 an approval and adoption mechanism for new developments, which will ensure that SuDS serving more than one property are maintained.
Water scarcity
Demand managementTake further steps to increase household efficiency in water use, including through water metering and pricing.
This could include removing legal barriers to metering in areas with high risk of future deficit, through including climate change risks into the methodology for designating areas of water stress.
Defra’s strategic guidance to Ofwat stressed the need for a better balance of demand measures (such as metering) against supply measures in the 2014 Water Resource Management Plans.12
The Environment Agency is producing a new methodology for designating water stressed areas, that proposes taking the risks from climate change into account13 in calculating the future levels of water scarcity in different regions. This will increase the number of companies that can consider compulsory metering.
WRAP was tasked through the Water White Paper to convene an industry-led working group to consider how to drive demand reduction at the household level. This has led in July 2013 to an announcement that a large number of merchants and retailers will start using the existing Water Label on their bathroom products from summer 2014.
Decision makingEnsure that water companies are transparent about how the risks and uncertainties from climate change are factored into their long-term investment planning for future water resources.
Draft water resource management plans are currently being published. Final plans will be available in 2014. We will consider how these have incorporated risks and uncertainties from climate change into proposals for supply and demand measures out to 2040.
Abstraction reformEnsure current policy decisions that affect future abstraction levels factor in the risks from climate change to avoid locking certain industries or regions of the country into unsustainable patterns of water abstraction.
In the Water White Paper, the Government committed to introduce legislation on abstraction reform early in the next Parliament. Defra has invested £750,000 over the past year in research to inform the development of a pricing framework that will form the basis of this legislation.
12 13
12 https://consult.environment-agency.gov.uk/portal/ho/waterres/water/stress13 https://www.gov.uk/government/uploads/system/uploads/attachment_data/file/181832/pb13884-sps-seg-ofwat-201303.pdf
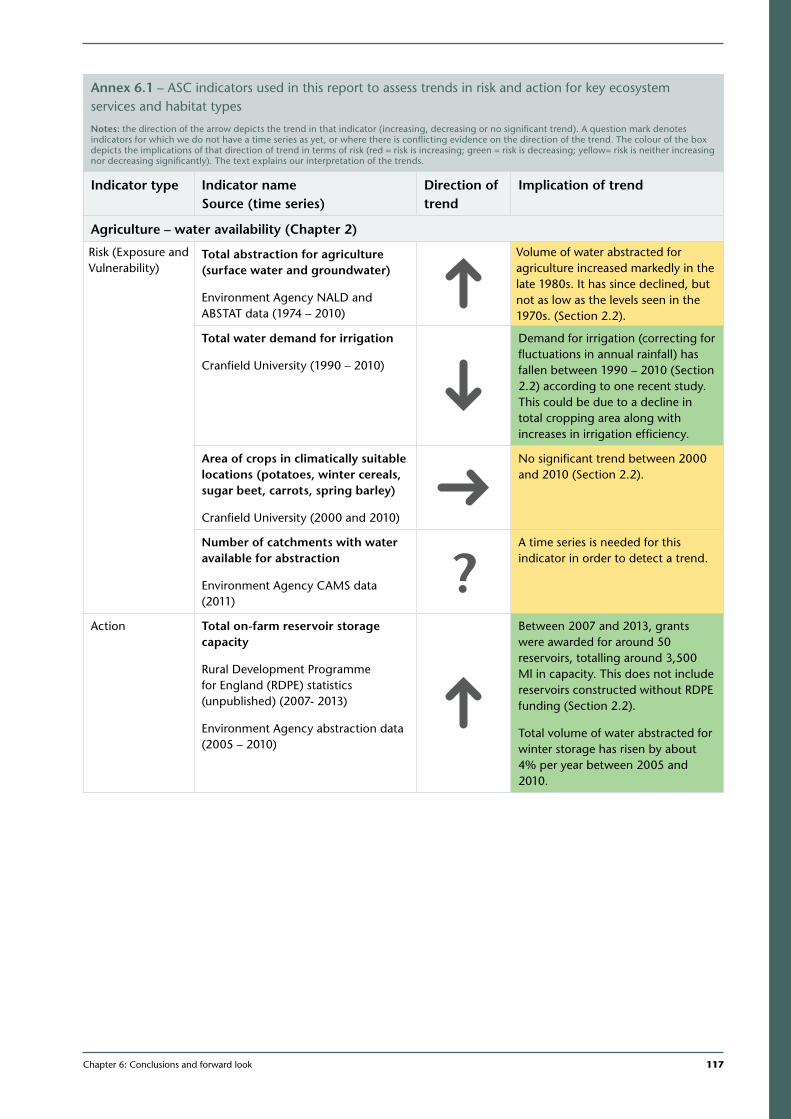
Chapter 6: Conclusions and forward look 117
1
Annex 6.1 – ASC indicators used in this report to assess trends in risk and action for key ecosystem services and habitat types
Notes: the direction of the arrow depicts the trend in that indicator (increasing, decreasing or no significant trend). A question mark denotes indicators for which we do not have a time series as yet, or where there is conflicting evidence on the direction of the trend. The colour of the box depicts the implications of that direction of trend in terms of risk (red = risk is increasing; green = risk is decreasing; yellow= risk is neither increasing nor decreasing significantly). The text explains our interpretation of the trends.
Indicator type Indicator name Source (time series)
Direction of trend
Implication of trend
Agriculture – water availability (Chapter 2)
Risk (Exposure and Vulnerability)
Total abstraction for agriculture (surface water and groundwater)
Environment Agency NALD and ABSTAT data (1974 – 2010)
Volume of water abstracted for agriculture increased markedly in the late 1980s. It has since declined, but not as low as the levels seen in the 1970s. (Section 2.2).
Total water demand for irrigation
Cranfield University (1990 – 2010)
Demand for irrigation (correcting for fluctuations in annual rainfall) has fallen between 1990 – 2010 (Section 2.2) according to one recent study. This could be due to a decline in total cropping area along with increases in irrigation efficiency.
Area of crops in climatically suitable locations (potatoes, winter cereals, sugar beet, carrots, spring barley)
Cranfield University (2000 and 2010)
No significant trend between 2000 and 2010 (Section 2.2).
Number of catchments with water available for abstraction
Environment Agency CAMS data (2011)
?A time series is needed for this indicator in order to detect a trend.
Action Total on-farm reservoir storage capacity
Rural Development Programme for England (RDPE) statistics (unpublished) (2007- 2013)
Environment Agency abstraction data (2005 – 2010)
Between 2007 and 2013, grants were awarded for around 50 reservoirs, totalling around 3,500 Ml in capacity. This does not include reservoirs constructed without RDPE funding (Section 2.2).
Total volume of water abstracted for winter storage has risen by about 4% per year between 2005 and 2010.
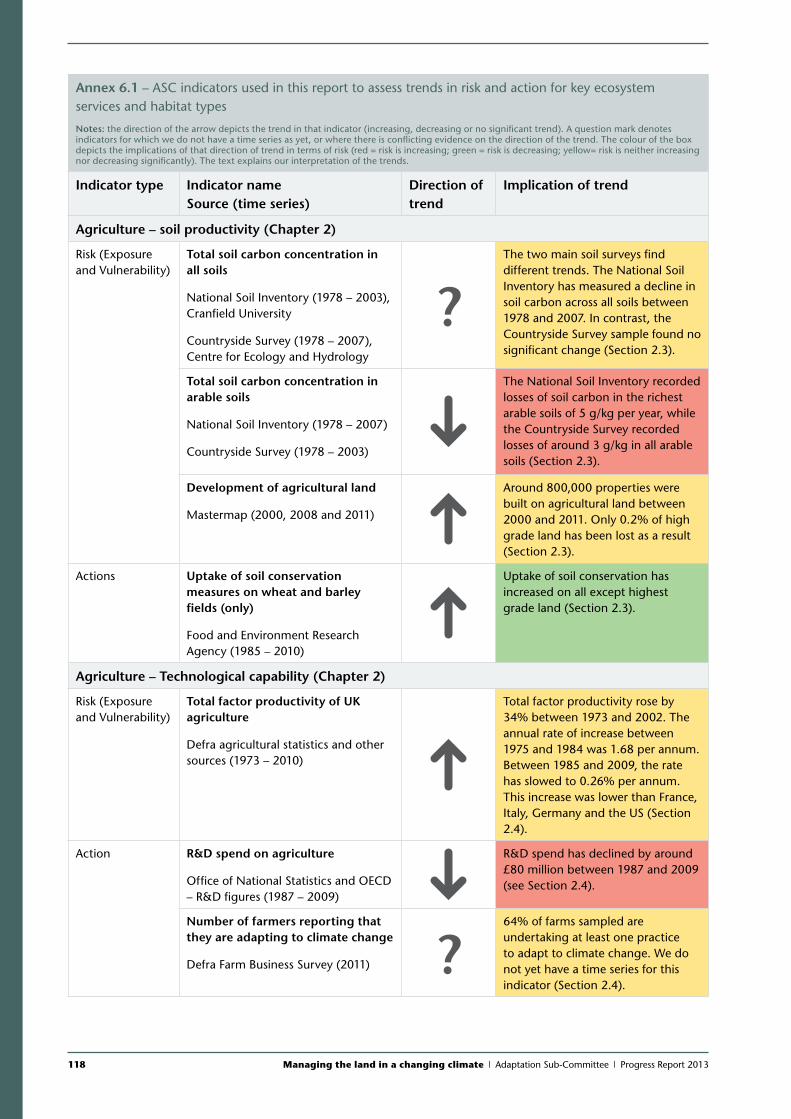
118 Managing the land in a changing climate | Adaptation Sub-Committee | Progress Report 2013
Annex 6.1 – ASC indicators used in this report to assess trends in risk and action for key ecosystem services and habitat types
Notes: the direction of the arrow depicts the trend in that indicator (increasing, decreasing or no significant trend). A question mark denotes indicators for which we do not have a time series as yet, or where there is conflicting evidence on the direction of the trend. The colour of the box depicts the implications of that direction of trend in terms of risk (red = risk is increasing; green = risk is decreasing; yellow= risk is neither increasing nor decreasing significantly). The text explains our interpretation of the trends.
Indicator type Indicator name Source (time series)
Direction of trend
Implication of trend
Agriculture – soil productivity (Chapter 2)
Risk (Exposure and Vulnerability)
Total soil carbon concentration in all soils
National Soil Inventory (1978 – 2003), Cranfield University
Countryside Survey (1978 – 2007), Centre for Ecology and Hydrology
?The two main soil surveys find different trends. The National Soil Inventory has measured a decline in soil carbon across all soils between 1978 and 2007. In contrast, the Countryside Survey sample found no significant change (Section 2.3).
Total soil carbon concentration in arable soils
National Soil Inventory (1978 – 2007)
Countryside Survey (1978 – 2003)
The National Soil Inventory recorded losses of soil carbon in the richest arable soils of 5 g/kg per year, while the Countryside Survey recorded losses of around 3 g/kg in all arable soils (Section 2.3).
Development of agricultural land
Mastermap (2000, 2008 and 2011)
Around 800,000 properties were built on agricultural land between 2000 and 2011. Only 0.2% of high grade land has been lost as a result (Section 2.3).
Actions Uptake of soil conservation measures on wheat and barley fields (only)
Food and Environment Research Agency (1985 – 2010)
Uptake of soil conservation has increased on all except highest grade land (Section 2.3).
Agriculture – Technological capability (Chapter 2)
Risk (Exposure and Vulnerability)
Total factor productivity of UK agriculture
Defra agricultural statistics and other sources (1973 – 2010)
Total factor productivity rose by 34% between 1973 and 2002. The annual rate of increase between 1975 and 1984 was 1.68 per annum. Between 1985 and 2009, the rate has slowed to 0.26% per annum. This increase was lower than France, Italy, Germany and the US (Section 2.4).
Action R&D spend on agriculture
Office of National Statistics and OECD – R&D figures (1987 – 2009)
R&D spend has declined by around £80 million between 1987 and 2009 (see Section 2.4).
Number of farmers reporting that they are adapting to climate change
Defra Farm Business Survey (2011) ?64% of farms sampled are undertaking at least one practice to adapt to climate change. We do not yet have a time series for this indicator (Section 2.4).
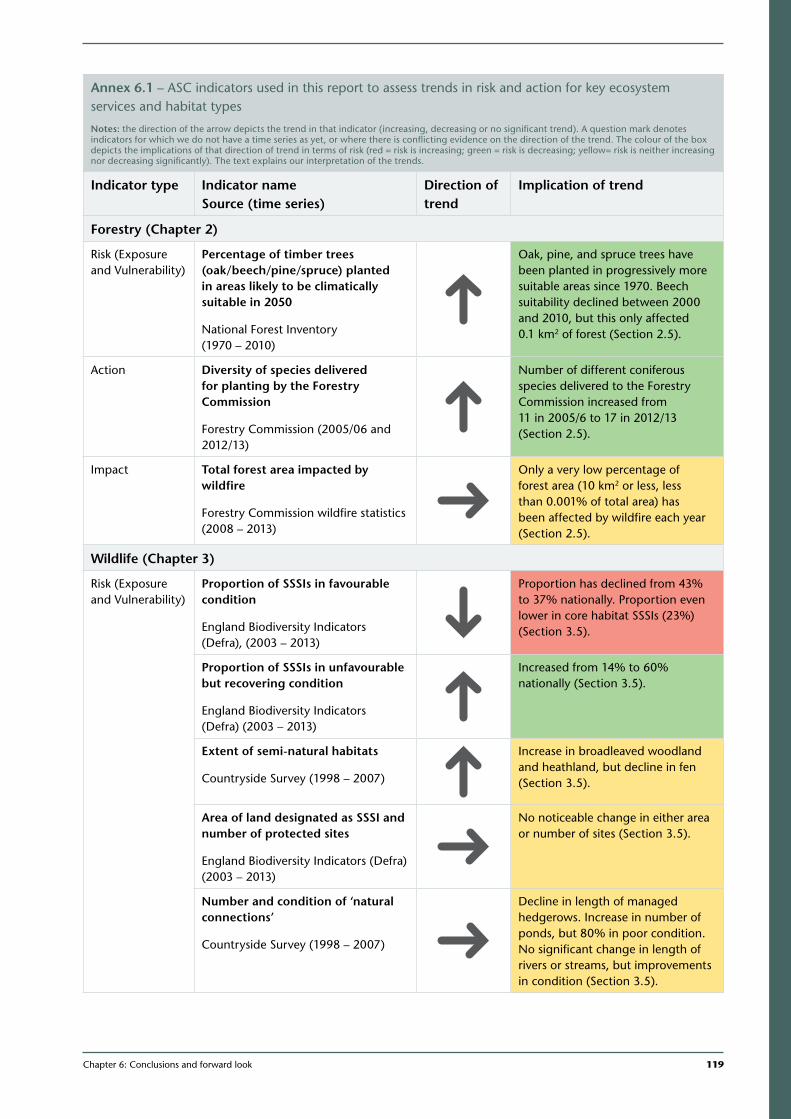
Chapter 6: Conclusions and forward look 119
1
Annex 6.1 – ASC indicators used in this report to assess trends in risk and action for key ecosystem services and habitat types
Notes: the direction of the arrow depicts the trend in that indicator (increasing, decreasing or no significant trend). A question mark denotes indicators for which we do not have a time series as yet, or where there is conflicting evidence on the direction of the trend. The colour of the box depicts the implications of that direction of trend in terms of risk (red = risk is increasing; green = risk is decreasing; yellow= risk is neither increasing nor decreasing significantly). The text explains our interpretation of the trends.
Indicator type Indicator name Source (time series)
Direction of trend
Implication of trend
Forestry (Chapter 2)
Risk (Exposure and Vulnerability)
Percentage of timber trees (oak/beech/pine/spruce) planted in areas likely to be climatically suitable in 2050
National Forest Inventory (1970 – 2010)
Oak, pine, and spruce trees have been planted in progressively more suitable areas since 1970. Beech suitability declined between 2000 and 2010, but this only affected 0.1 km2 of forest (Section 2.5).
Action Diversity of species delivered for planting by the Forestry Commission
Forestry Commission (2005/06 and 2012/13)
Number of different coniferous species delivered to the Forestry Commission increased from 11 in 2005/6 to 17 in 2012/13 (Section 2.5).
Impact Total forest area impacted by wildfire
Forestry Commission wildfire statistics (2008 – 2013)
Only a very low percentage of forest area (10 km2 or less, less than 0.001% of total area) has been affected by wildfire each year (Section 2.5).
Wildlife (Chapter 3)
Risk (Exposure and Vulnerability)
Proportion of SSSIs in favourable condition
England Biodiversity Indicators (Defra), (2003 – 2013)
Proportion has declined from 43% to 37% nationally. Proportion even lower in core habitat SSSIs (23%) (Section 3.5).
Proportion of SSSIs in unfavourable but recovering condition
England Biodiversity Indicators (Defra) (2003 – 2013)
Increased from 14% to 60% nationally (Section 3.5).
Extent of semi-natural habitats
Countryside Survey (1998 – 2007)
Increase in broadleaved woodland and heathland, but decline in fen (Section 3.5).
Area of land designated as SSSI and number of protected sites
England Biodiversity Indicators (Defra) (2003 – 2013)
No noticeable change in either area or number of sites (Section 3.5).
Number and condition of ‘natural connections’
Countryside Survey (1998 – 2007)
Decline in length of managed hedgerows. Increase in number of ponds, but 80% in poor condition. No significant change in length of rivers or streams, but improvements in condition (Section 3.5).
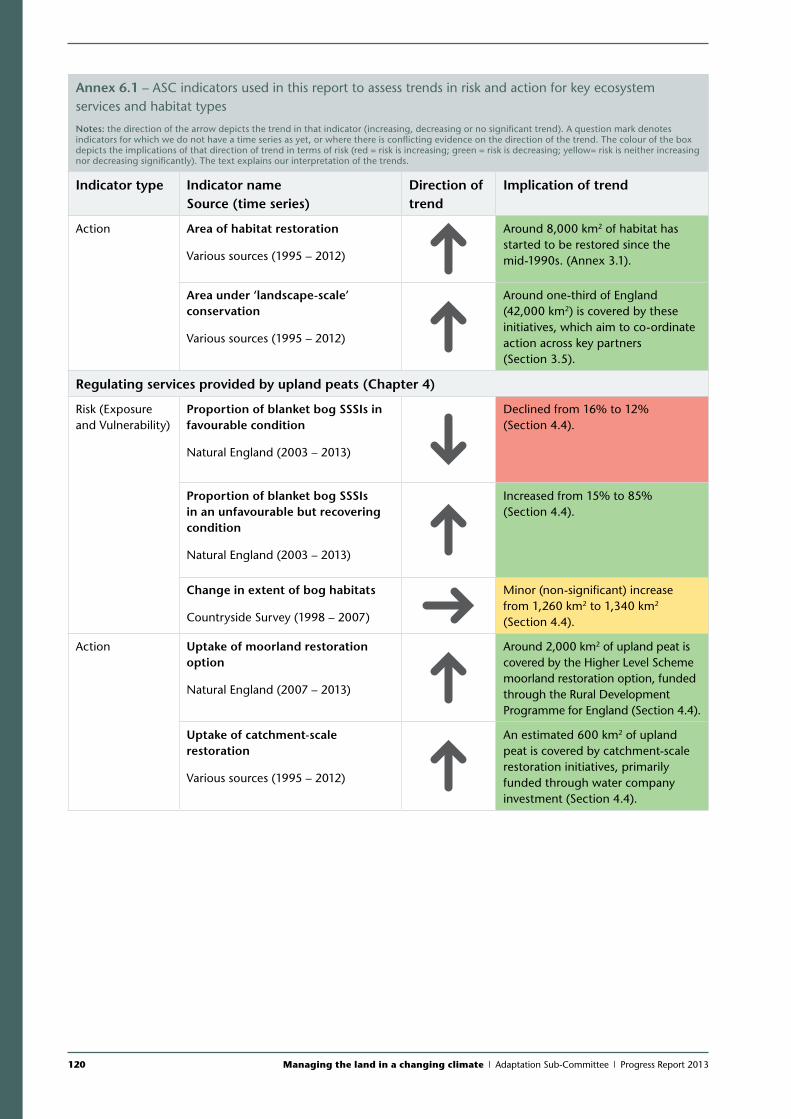
120 Managing the land in a changing climate | Adaptation Sub-Committee | Progress Report 2013
Annex 6.1 – ASC indicators used in this report to assess trends in risk and action for key ecosystem services and habitat types
Notes: the direction of the arrow depicts the trend in that indicator (increasing, decreasing or no significant trend). A question mark denotes indicators for which we do not have a time series as yet, or where there is conflicting evidence on the direction of the trend. The colour of the box depicts the implications of that direction of trend in terms of risk (red = risk is increasing; green = risk is decreasing; yellow= risk is neither increasing nor decreasing significantly). The text explains our interpretation of the trends.
Indicator type Indicator name Source (time series)
Direction of trend
Implication of trend
Action Area of habitat restoration
Various sources (1995 – 2012)
Around 8,000 km2 of habitat has started to be restored since the mid-1990s. (Annex 3.1).
Area under ‘landscape-scale’ conservation
Various sources (1995 – 2012)
Around one-third of England (42,000 km2) is covered by these initiatives, which aim to co-ordinate action across key partners (Section 3.5).
Regulating services provided by upland peats (Chapter 4)
Risk (Exposure and Vulnerability)
Proportion of blanket bog SSSIs in favourable condition
Natural England (2003 – 2013)
Declined from 16% to 12% (Section 4.4).
Proportion of blanket bog SSSIs in an unfavourable but recovering condition
Natural England (2003 – 2013)
Increased from 15% to 85% (Section 4.4).
Change in extent of bog habitats
Countryside Survey (1998 – 2007)
Minor (non-significant) increase from 1,260 km2 to 1,340 km2 (Section 4.4).
Action Uptake of moorland restoration option
Natural England (2007 – 2013)
Around 2,000 km2 of upland peat is covered by the Higher Level Scheme moorland restoration option, funded through the Rural Development Programme for England (Section 4.4).
Uptake of catchment-scale restoration
Various sources (1995 – 2012)
An estimated 600 km2 of upland peat is covered by catchment-scale restoration initiatives, primarily funded through water company investment (Section 4.4).
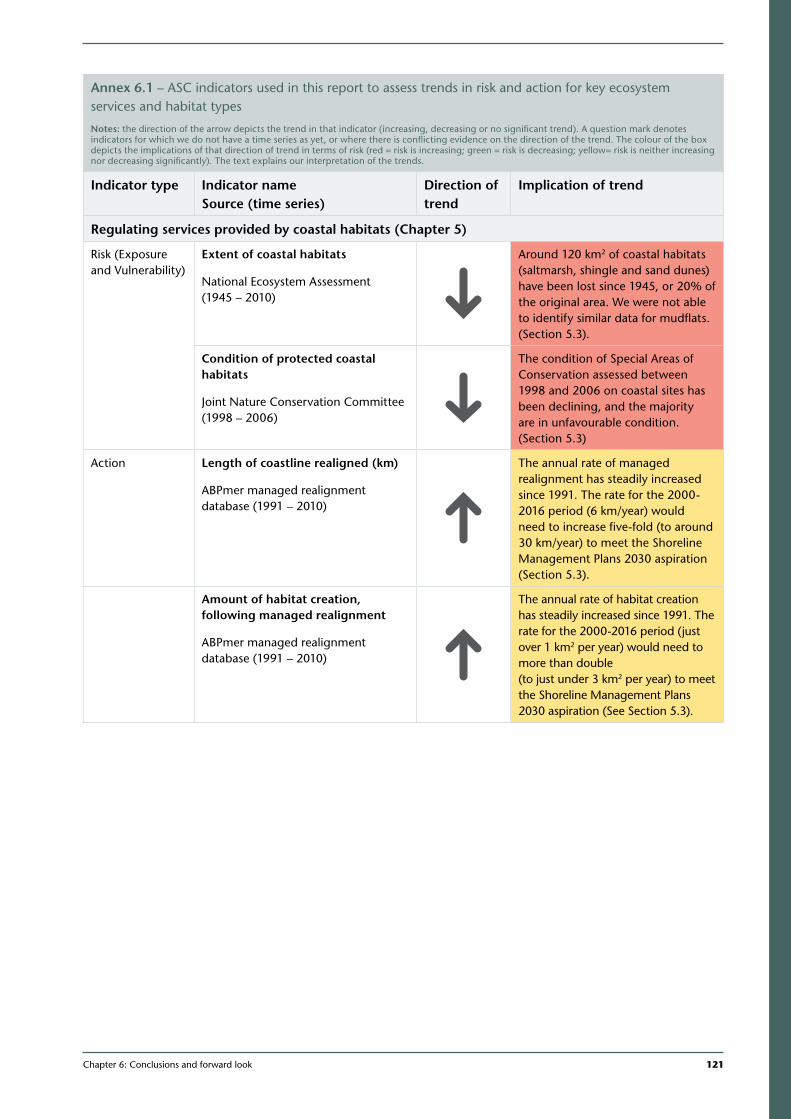
Chapter 6: Conclusions and forward look 121
1
Annex 6.1 – ASC indicators used in this report to assess trends in risk and action for key ecosystem services and habitat types
Notes: the direction of the arrow depicts the trend in that indicator (increasing, decreasing or no significant trend). A question mark denotes indicators for which we do not have a time series as yet, or where there is conflicting evidence on the direction of the trend. The colour of the box depicts the implications of that direction of trend in terms of risk (red = risk is increasing; green = risk is decreasing; yellow= risk is neither increasing nor decreasing significantly). The text explains our interpretation of the trends.
Indicator type Indicator name Source (time series)
Direction of trend
Implication of trend
Regulating services provided by coastal habitats (Chapter 5)
Risk (Exposure and Vulnerability)
Extent of coastal habitats
National Ecosystem Assessment (1945 – 2010)
Around 120 km2 of coastal habitats (saltmarsh, shingle and sand dunes) have been lost since 1945, or 20% of the original area. We were not able to identify similar data for mudflats. (Section 5.3).
Condition of protected coastal habitats
Joint Nature Conservation Committee (1998 – 2006)
The condition of Special Areas of Conservation assessed between 1998 and 2006 on coastal sites has been declining, and the majority are in unfavourable condition. (Section 5.3)
Action Length of coastline realigned (km)
ABPmer managed realignment database (1991 – 2010)
The annual rate of managed realignment has steadily increased since 1991. The rate for the 2000-2016 period (6 km/year) would need to increase five-fold (to around 30 km/year) to meet the Shoreline Management Plans 2030 aspiration (Section 5.3).
Amount of habitat creation, following managed realignment
ABPmer managed realignment database (1991 – 2010)
The annual rate of habitat creation has steadily increased since 1991. The rate for the 2000-2016 period (just over 1 km2 per year) would need to more than double (to just under 3 km2 per year) to meet the Shoreline Management Plans 2030 aspiration (See Section 5.3).
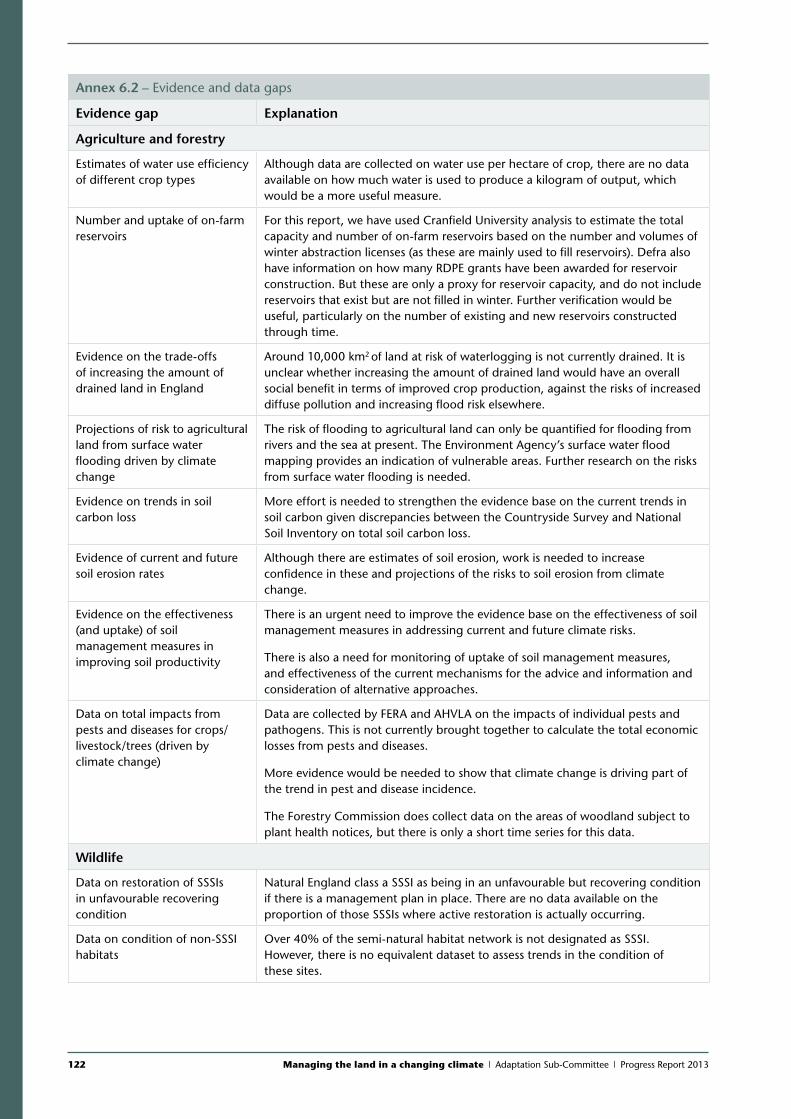
122 Managing the land in a changing climate | Adaptation Sub-Committee | Progress Report 2013
Annex 6.2 – Evidence and data gaps
Evidence gap Explanation
Agriculture and forestry
Estimates of water use efficiency of different crop types
Although data are collected on water use per hectare of crop, there are no data available on how much water is used to produce a kilogram of output, which would be a more useful measure.
Number and uptake of on-farm reservoirs
For this report, we have used Cranfield University analysis to estimate the total capacity and number of on-farm reservoirs based on the number and volumes of winter abstraction licenses (as these are mainly used to fill reservoirs). Defra also have information on how many RDPE grants have been awarded for reservoir construction. But these are only a proxy for reservoir capacity, and do not include reservoirs that exist but are not filled in winter. Further verification would be useful, particularly on the number of existing and new reservoirs constructed through time.
Evidence on the trade-offs of increasing the amount of drained land in England
Around 10,000 km2 of land at risk of waterlogging is not currently drained. It is unclear whether increasing the amount of drained land would have an overall social benefit in terms of improved crop production, against the risks of increased diffuse pollution and increasing flood risk elsewhere.
Projections of risk to agricultural land from surface water flooding driven by climate change
The risk of flooding to agricultural land can only be quantified for flooding from rivers and the sea at present. The Environment Agency’s surface water flood mapping provides an indication of vulnerable areas. Further research on the risks from surface water flooding is needed.
Evidence on trends in soil carbon loss
More effort is needed to strengthen the evidence base on the current trends in soil carbon given discrepancies between the Countryside Survey and National Soil Inventory on total soil carbon loss.
Evidence of current and future soil erosion rates
Although there are estimates of soil erosion, work is needed to increase confidence in these and projections of the risks to soil erosion from climate change.
Evidence on the effectiveness (and uptake) of soil management measures in improving soil productivity
There is an urgent need to improve the evidence base on the effectiveness of soil management measures in addressing current and future climate risks.
There is also a need for monitoring of uptake of soil management measures, and effectiveness of the current mechanisms for the advice and information and consideration of alternative approaches.
Data on total impacts from pests and diseases for crops/livestock/trees (driven by climate change)
Data are collected by FERA and AHVLA on the impacts of individual pests and pathogens. This is not currently brought together to calculate the total economic losses from pests and diseases.
More evidence would be needed to show that climate change is driving part of the trend in pest and disease incidence.
The Forestry Commission does collect data on the areas of woodland subject to plant health notices, but there is only a short time series for this data.
Wildlife
Data on restoration of SSSIs in unfavourable recovering condition
Natural England class a SSSI as being in an unfavourable but recovering condition if there is a management plan in place. There are no data available on the proportion of those SSSIs where active restoration is actually occurring.
Data on condition of non-SSSI habitats
Over 40% of the semi-natural habitat network is not designated as SSSI. However, there is no equivalent dataset to assess trends in the condition of these sites.
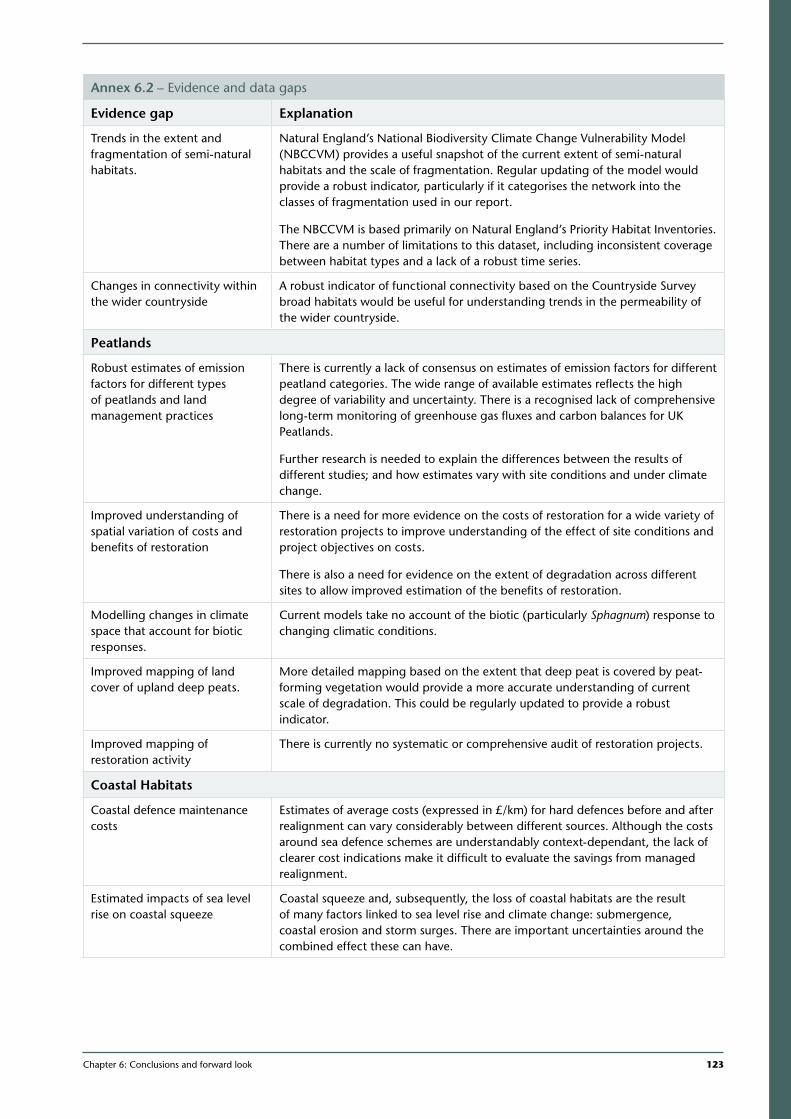
Chapter 6: Conclusions and forward look 123
1
Annex 6.2 – Evidence and data gaps
Evidence gap Explanation
Trends in the extent and fragmentation of semi-natural habitats.
Natural England’s National Biodiversity Climate Change Vulnerability Model (NBCCVM) provides a useful snapshot of the current extent of semi-natural habitats and the scale of fragmentation. Regular updating of the model would provide a robust indicator, particularly if it categorises the network into the classes of fragmentation used in our report.
The NBCCVM is based primarily on Natural England’s Priority Habitat Inventories. There are a number of limitations to this dataset, including inconsistent coverage between habitat types and a lack of a robust time series.
Changes in connectivity within the wider countryside
A robust indicator of functional connectivity based on the Countryside Survey broad habitats would be useful for understanding trends in the permeability of the wider countryside.
Peatlands
Robust estimates of emission factors for different types of peatlands and land management practices
There is currently a lack of consensus on estimates of emission factors for different peatland categories. The wide range of available estimates reflects the high degree of variability and uncertainty. There is a recognised lack of comprehensive long-term monitoring of greenhouse gas fluxes and carbon balances for UK Peatlands.
Further research is needed to explain the differences between the results of different studies; and how estimates vary with site conditions and under climate change.
Improved understanding of spatial variation of costs and benefits of restoration
There is a need for more evidence on the costs of restoration for a wide variety of restoration projects to improve understanding of the effect of site conditions and project objectives on costs.
There is also a need for evidence on the extent of degradation across different sites to allow improved estimation of the benefits of restoration.
Modelling changes in climate space that account for biotic responses.
Current models take no account of the biotic (particularly Sphagnum) response to changing climatic conditions.
Improved mapping of land cover of upland deep peats.
More detailed mapping based on the extent that deep peat is covered by peat-forming vegetation would provide a more accurate understanding of current scale of degradation. This could be regularly updated to provide a robust indicator.
Improved mapping of restoration activity
There is currently no systematic or comprehensive audit of restoration projects.
Coastal Habitats
Coastal defence maintenance costs
Estimates of average costs (expressed in £/km) for hard defences before and after realignment can vary considerably between different sources. Although the costs around sea defence schemes are understandably context-dependant, the lack of clearer cost indications make it difficult to evaluate the savings from managed realignment.
Estimated impacts of sea level rise on coastal squeeze
Coastal squeeze and, subsequently, the loss of coastal habitats are the result of many factors linked to sea level rise and climate change: submergence, coastal erosion and storm surges. There are important uncertainties around the combined effect these can have.
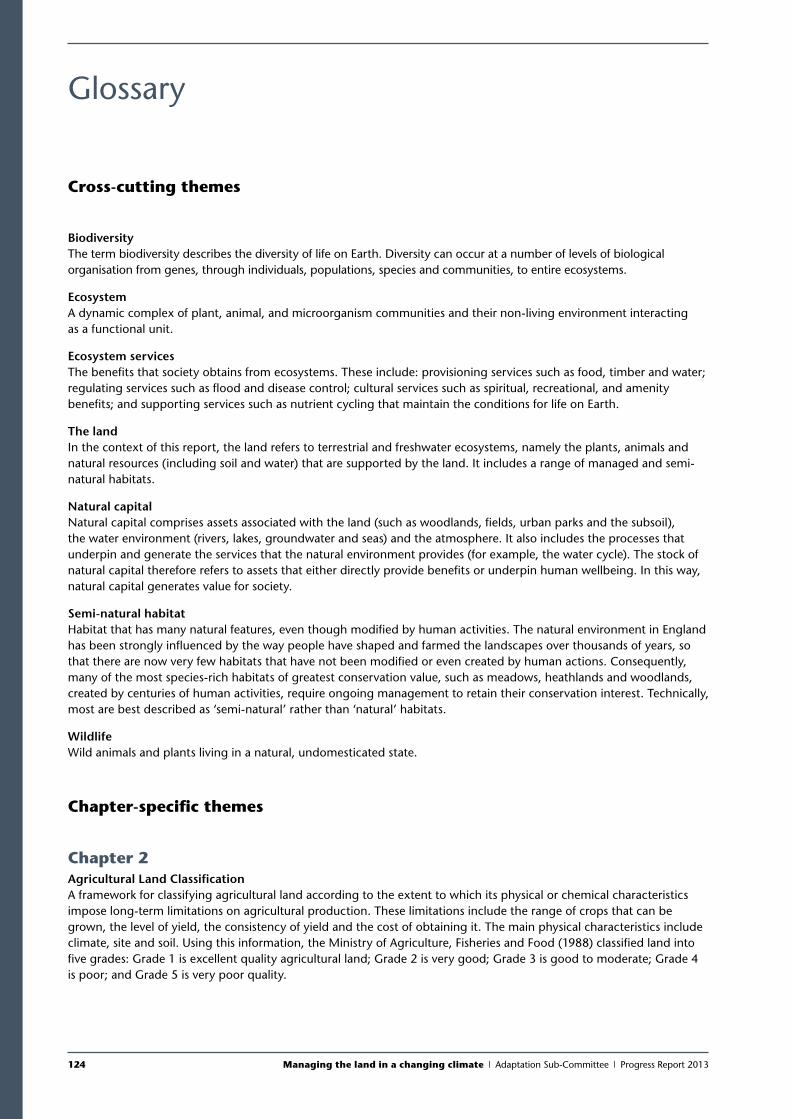
124 Managing the land in a changing climate | Adaptation Sub-Committee | Progress Report 2013
Glossary
Cross-cutting themes
Biodiversity The term biodiversity describes the diversity of life on Earth. Diversity can occur at a number of levels of biological organisation from genes, through individuals, populations, species and communities, to entire ecosystems.
Ecosystem A dynamic complex of plant, animal, and microorganism communities and their non-living environment interacting as a functional unit.
Ecosystem services The benefits that society obtains from ecosystems. These include: provisioning services such as food, timber and water; regulating services such as flood and disease control; cultural services such as spiritual, recreational, and amenity benefits; and supporting services such as nutrient cycling that maintain the conditions for life on Earth.
The land In the context of this report, the land refers to terrestrial and freshwater ecosystems, namely the plants, animals and natural resources (including soil and water) that are supported by the land. It includes a range of managed and semi-natural habitats.
Natural capital Natural capital comprises assets associated with the land (such as woodlands, fields, urban parks and the subsoil), the water environment (rivers, lakes, groundwater and seas) and the atmosphere. It also includes the processes that underpin and generate the services that the natural environment provides (for example, the water cycle). The stock of natural capital therefore refers to assets that either directly provide benefits or underpin human wellbeing. In this way, natural capital generates value for society.
Semi-natural habitat Habitat that has many natural features, even though modified by human activities. The natural environment in England has been strongly influenced by the way people have shaped and farmed the landscapes over thousands of years, so that there are now very few habitats that have not been modified or even created by human actions. Consequently, many of the most species-rich habitats of greatest conservation value, such as meadows, heathlands and woodlands, created by centuries of human activities, require ongoing management to retain their conservation interest. Technically, most are best described as ‘semi-natural’ rather than ‘natural’ habitats.
Wildlife Wild animals and plants living in a natural, undomesticated state.
Chapter-specific themes
Chapter 2Agricultural Land Classification A framework for classifying agricultural land according to the extent to which its physical or chemical characteristics impose long-term limitations on agricultural production. These limitations include the range of crops that can be grown, the level of yield, the consistency of yield and the cost of obtaining it. The main physical characteristics include climate, site and soil. Using this information, the Ministry of Agriculture, Fisheries and Food (1988) classified land into five grades: Grade 1 is excellent quality agricultural land; Grade 2 is very good; Grade 3 is good to moderate; Grade 4 is poor; and Grade 5 is very poor quality.
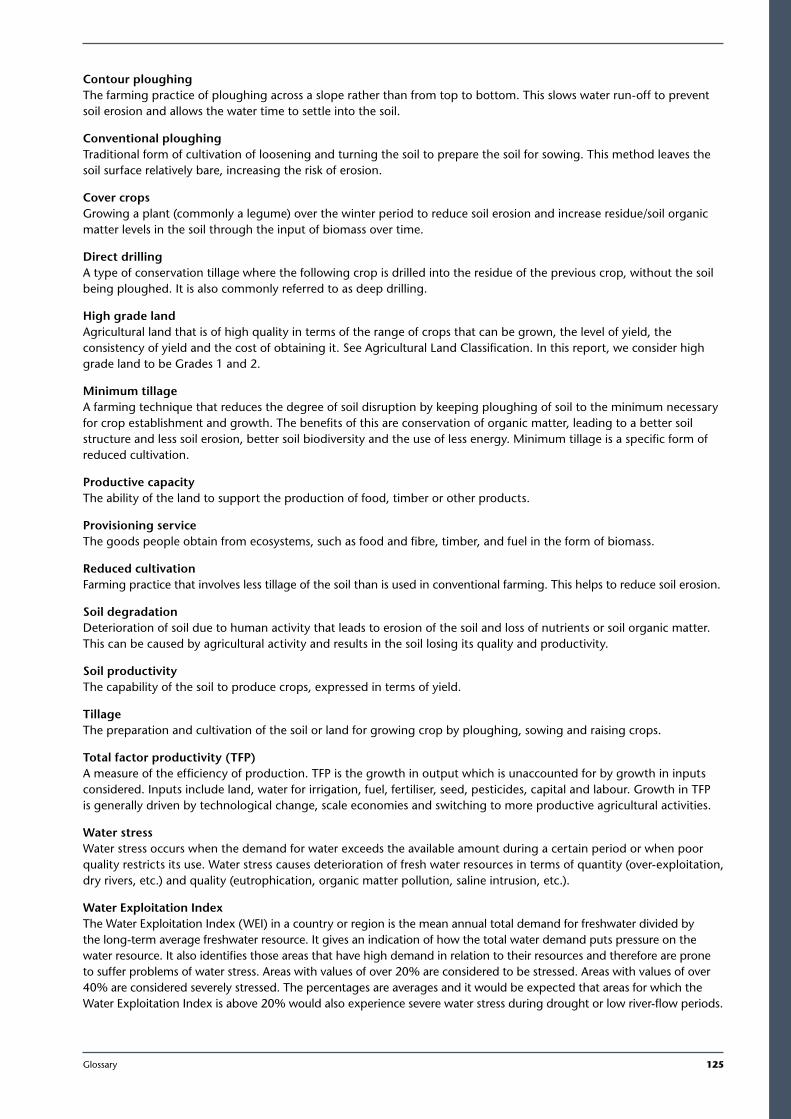
Glossary 125
1
Contour ploughing The farming practice of ploughing across a slope rather than from top to bottom. This slows water run-off to prevent soil erosion and allows the water time to settle into the soil.
Conventional ploughing Traditional form of cultivation of loosening and turning the soil to prepare the soil for sowing. This method leaves the soil surface relatively bare, increasing the risk of erosion.
Cover crops Growing a plant (commonly a legume) over the winter period to reduce soil erosion and increase residue/soil organic matter levels in the soil through the input of biomass over time.
Direct drilling A type of conservation tillage where the following crop is drilled into the residue of the previous crop, without the soil being ploughed. It is also commonly referred to as deep drilling.
High grade land Agricultural land that is of high quality in terms of the range of crops that can be grown, the level of yield, the consistency of yield and the cost of obtaining it. See Agricultural Land Classification. In this report, we consider high grade land to be Grades 1 and 2.
Minimum tillage A farming technique that reduces the degree of soil disruption by keeping ploughing of soil to the minimum necessary for crop establishment and growth. The benefits of this are conservation of organic matter, leading to a better soil structure and less soil erosion, better soil biodiversity and the use of less energy. Minimum tillage is a specific form of reduced cultivation.
Productive capacity The ability of the land to support the production of food, timber or other products.
Provisioning service The goods people obtain from ecosystems, such as food and fibre, timber, and fuel in the form of biomass.
Reduced cultivation Farming practice that involves less tillage of the soil than is used in conventional farming. This helps to reduce soil erosion.
Soil degradation Deterioration of soil due to human activity that leads to erosion of the soil and loss of nutrients or soil organic matter. This can be caused by agricultural activity and results in the soil losing its quality and productivity.
Soil productivity The capability of the soil to produce crops, expressed in terms of yield.
Tillage The preparation and cultivation of the soil or land for growing crop by ploughing, sowing and raising crops.
Total factor productivity (TFP) A measure of the efficiency of production. TFP is the growth in output which is unaccounted for by growth in inputs considered. Inputs include land, water for irrigation, fuel, fertiliser, seed, pesticides, capital and labour. Growth in TFP is generally driven by technological change, scale economies and switching to more productive agricultural activities.
Water stress Water stress occurs when the demand for water exceeds the available amount during a certain period or when poor quality restricts its use. Water stress causes deterioration of fresh water resources in terms of quantity (over-exploitation, dry rivers, etc.) and quality (eutrophication, organic matter pollution, saline intrusion, etc.).
Water Exploitation Index The Water Exploitation Index (WEI) in a country or region is the mean annual total demand for freshwater divided by the long-term average freshwater resource. It gives an indication of how the total water demand puts pressure on the water resource. It also identifies those areas that have high demand in relation to their resources and therefore are prone to suffer problems of water stress. Areas with values of over 20% are considered to be stressed. Areas with values of over 40% are considered severely stressed. The percentages are averages and it would be expected that areas for which the Water Exploitation Index is above 20% would also experience severe water stress during drought or low river-flow periods.
126 Managing the land in a changing climate | Adaptation Sub-Committee | Progress Report 2013
Chapter 3Climate space The geographical area which is suitable for a particular species, based on the climate parameters within which the species can survive and reproduce. Climate space does not take into account other factors, such as topography, food or water availability that might impact upon the species actual geographical range. As the climate changes, so too climate space will move, and to survive species will need to track these movements. This results in changes to species’ local and regional distributions.
Natural colonisation The process by which a species naturally spread into new areas or regions due to changes in the natural environment.
Community composition A group of species that coexist in space, interacting directly or indirectly. The composition of this community is the proportion of species relative to the total in a given area.
Site of Special Scientific Interest (SSSI) Nationally important sites designated by Natural England under the Wildlife and Countryside Act 1981 for being ‘of special interest by reason of any of its flora, fauna, or geological or physiographical features’. Legislation and policy provides a high level of protection for these sites.
Special Areas of Conservation (SACs) Protected sites designated under the Conservation (Natural Habitats, &c.) Regulations 1994 in transposition of the EU Habitats Directive. The Directive requires the establishment of a European network of high-quality conservation sites that will make a significant contribution to conserving the habitats and species identified in Annexes I and II of the Directive. Along with SPAs, these form the ‘Natura 2000’ series of sites. All terrestrial SACs are also designated as SSSIs.
Special Protection Areas (SPAs) Protected sites designated under the Conservation (Natural Habitats, &c.) Regulations 1994 in transposition of the EU Birds Directive. The Directive requires the identification and classification of Special Protection Areas (SPAs) for rare or vulnerable species listed in Annex I of the Directive, as well as for all regularly occurring migratory species, paying particular attention to the protection of wetlands of international importance. Together with SACs, these form the ‘Natura 2000’ series of sites. All terrestrial SPAs are also designated as SSSIs.
Local Wildlife Sites (LWS) Non-statutory sites identified by Local Wildlife Site partnerships, which are often led by local authorities and partnered by a range of local interests. Government policy is to provide protection to LWS through the planning system.
Ancient Woodland sites Areas that have had continuous woodland cover since 1600. Government policy is to provide protection to ancient woodland through the planning system and through forestry policy and guidance.
Species assemblage The various species making up a community of organisms in a habitat.
Landscape scale conservation A term commonly used to refer to action that covers a large spatial scale, usually addressing a range of ecosystem processes, conservation objectives and land uses.
Priority Habitats and species Section 41 of the Natural Environment and Rural Communities Act (2006) requires the Secretary of State to publish a list of habitats and species which are of principal importance for the conservation of biodiversity in England. The list has been drawn up in consultation with Natural England, as required by the Act.
Fifty-six habitats of principal importance are included on the S41 list. They include terrestrial habitats such as upland hay meadows and lowland mixed deciduous woodland, and freshwater and marine habitats such as ponds and subtidal sands and gravels. There are 943 species of principal importance included on the S41 list.
Ecological network A suite of high quality sites which collectively contain the diversity and area of habitat that are needed to support species and which have ecological connections between them.
Glossary 127
1
Chapter 4Blanket bog habitat Priority Habitat that form where rainfall is very frequent and cloud cover is high. This allows peat to develop over large areas of wide flat land with a variable depth of peat. Rainfall, snow and mist are the sole source of scare nutrients; the plants that can tolerate these conditions include Sphagnum bog mosses and cotton grasses, along with heathers. Golden plover and dunlin nest in these remote areas, as do hen harriers and short-eared owls.
Carbon sequestration The removal and storage of carbon from the atmosphere in carbon sinks, such as forest or peat, through physical or biological processes.
Deep peat Organic material (the remains of wetland plants and animals) that has built up in more or less permanently saturated conditions over thousands of years, and represents a large store of carbon captured from the atmosphere. In an undamaged state, peat usually remains wet at the surface all year round and will continually accumulate organic matter as carbon. Peat soils in England have been accumulating carbon since the retreat of the last glaciers approximately 10,000 years ago. Deep peaty soils are usually categorised as those covered with a majority of peat at least 25cm in depth. Some peat soils have reached depths of eight metres or more.
Chapter 5Accretion Land increasing due to sediment being added to it.
Artificial defences Artificial defence engineering options dissipate wave energy and protect against flooding, either under the form of sea walls, groynes, or rock armouring. Other non-engineered artificial defences include beach nourishment, replacing sand or shingle beach or cliff material that has been removed by erosion, or longshore drift.
Coastal cell A section of coastline along which the transport of coarse sediment (sand and shingle) is self contained over time-scales of years to decades.
Coastal erosion Wearing away and breaking up of rock or removal of deposited sediment caused by wave, tide, or wind action at the coast.
Coastal flooding Inundation due to storm surges or extreme high tides in low-lying coastal areas (episodic flooding), or due to sea level rise (longer-term flooding), or wave-induced breaching of natural or artificial barriers.
Coastal habitats Supra-tidal (sand dunes, shingle) and intertidal (saltmarsh, mudflat) habitats.
Coastal processes Erosion, transportation and deposition of sediment under the action of waves, wind and tides. The movement of material sideways along the coast, due to oblique wave breaking and oblique swash with backwash directed downslope is called longshore drift.
Coastal squeeze The process by which coastal habitats and natural features are progressively lost or drowned, caught between coastal defences and rising sea levels.
Managed realignment The process by which the coastline is allowed to move landwards or seawards, with some management to control or limit that movement.
128 Managing the land in a changing climate | Adaptation Sub-Committee | Progress Report 2013
References
Research commissioned by the Adaptation Sub-CommitteeEnvironmental Change Institute, HR Wallingford, Climate Resilience Ltd and Forest Research (2013) for the Adaptation Sub-Committee. Assessing the preparedness of England’s natural resources for a changing climate: exploring trends in vulnerability to climate change using indicators.
Graves, A. and Morris, J. (2013) for the Adaptation Sub-Committee. Restoration of Fenland Peatland under Climate Change. Cranfield University, Bedford, UK.
Scotland’s Rural College (2013) for the Adaptation Sub-Committee. Assessing the preparedness of England’s natural resources for a changing climate: Assessing the type and level of adaptation action required to address climate risks in the ‘vulnerability hotspots’.
URS (2013) for the Adaptation Sub-Committee. Optimal water allocation under climate change.
These references are all available on the Committee on Climate Change website: http://www.theccc.org.uk/publications/
General referencesAdaptation Sub-Committee (2012). Climate Change: is the UK preparing for flooding and water scarcity?
Defra, Department for Environment, Food and Rural Affairs (2013a). Developing the potential for Payments for Ecosystem Services: an Action Plan.
HR Wallingford (2012) for the Department for Environment, Food and Rural Affairs. The UK Climate Change Risk Assessment Evidence Report.
HM Government (2011). The Natural Choice: securing the value of nature.
HM Government (2013). The National Adaptation Programme – Making the country resilient to a changing climate.
Jenkins, G. J., Murphy, J. M., Sexton, D. M. H., Lowe, J. A., Jones, P. and Kilsby, C. G. (2009). UK Climate Projections: Observed Trends. Met Office Hadley Centre, Exeter, UK.
Murphy, J.M., Sexton, D.M.H., Jenkins, G.J., Boorman, P.M., Booth, B.B.B., Brown, C.C., et al. (2009). UK Climate Projections Science Report: Climate Change Projections. Met Office Hadley Centre, Exeter, UK.
Natural Capital Committee (2013). The State of Natural Capital: Towards a framework for measurement and valuation.
Parry, M.L., Canziani, O.F., Palutikof, J.P., Van der Linden P.J. and Hanson, C.E., eds. (2007). Climate Change Impacts, Adaptation and Vulnerability. Contribution of Working Group II to the Fourth Assessment Report of the Intergovernmental Panel on Climate Change.
UK National Ecosystem Assessment (2011a). The UK National Ecosystem Assessment: Synthesis of Key Findings. UNEP-WCMC, Cambridge.
UK National Ecosystem Assessment (2011b). The UK National Ecosystem Assessment: Technical Report. UNEP-WCMC, Cambridge.
Chapter 1Defra, Department for Environment, Food and Rural Affairs (2013b). Food Statistics Pocketbook 2012 (in year update).
Environment Agency (2012), Summary of the 2012 Water Framework Directive classification status for surface waters.
References 129
1
Lawton, J.H., Brotherton, P.N.M., Brown, V.K., Elphick, C., Fitter, A.H., Forshaw, J., et al. (2010). Making Space for Nature: A review of England’s wildlife sites and ecological network.
Morecroft, M. and Speakman, L., eds. (2013). Terrestrial Biodiversity Climate Change Impacts Summary Report. Living with Environment Change.
Natural England (2009). Mapping values: the vital nature of our uplands. An atlas linking environment and people (Project NE209).
Natural England (2010). England’s peatlands: carbon storage and greenhouse gases (Project NE257).
Office for National Statistics (2011). National Population Projections, 2010-Based Statistical Bulletin.
PricewaterhouseCoopers (2013) for the Department for Environment, Food and Rural Affairs. International Threats and Opportunities of Climate Change to the UK.
State of Nature (2013). State of Nature report. RSPB.
United Nations, Department of Economic and Social Affairs, Population Division (2011). World Population Prospects: The 2010 Revision.
Chapter 2ADAS (2003). Initial assessment of the projected trends of soil organic soils in English arable soils. Report for Defra (Project SP0533).
ADAS (2011). Agricultural Field Under Drainage Installation in the United Kingdom. Report for Defra (Project AC1104), Appendix E.
AHVLA, Animal Health and Veterinary Laboratories Agency (2011). Sustainable Scanning Surveillance in England and Wales. Report from the AHVLA Sustainable Surveillance Project.
Anglian Water and Frontier Economics (2011). A Right to Water.
Association of Drainage Authorities (2012). An Introduction to Internal Drainage Boards (IDBs).
Bellamy, P.H., Loveland, P.J., Bradley, R.I., Lark, R.M. and Kirk, G.J.D. (2005). Carbon losses from all soils across England and Wales 1978-2003. Nature 437, 245-248.
Broadmeadow, M.S.J., Ray, D., and Samuel, C.J.A. (2005). The future for broadleaved tree species in Britain. Forestry 78, 145-161.
Burton, R.G.O., and Hodgson, J.M. (1987). Lowland Peat in England and Wales. Soil Survey Special Survey No. 15. Soil Survey of England and Wales, Harpenden.
Cabinet Office (2008) Food Matters – Towards a Strategy for the 21st Century (Government Strategy Unit). The Government Office for Science, London.
Carey, P.D., Wallis, S., Emmett, B.A., Maskell, L.C., Murphy, J.; Norton, L.R., et al. (2008). Countryside Survey: UK Headline Messages from 2007. NERC/Centre for Ecology and Hydrology, 30pp. (Project C03259).
Cranfield University (2005). Soil organic matter as an indicator of soil health. Report for Defra (Project SP0546).
Cranfield University (2006). Scoping study of soil loss through wind erosion, tillage erosion and soil co-extracted with root vegetables. Report for Defra (Project SP8007).
Cranfield University (2011). The Total Costs of Soils Degradation in England and Wales. Report for Defra (Project CTE0946).
Cranfield University (2013). National Soil Inventory Database (Topsoil data for 1983 and 1995).
Cooper, D., Foster, C., Goodey, R., Hallett, P., Hobbs, P., Irvine, B. et al. (2010). Use of ‘UKCIP08 Scenarios’ to determine the potential impact of climate change on the pressures/threats to soils in England and Wales. Report for Defra (Project SP0571).
130 Managing the land in a changing climate | Adaptation Sub-Committee | Progress Report 2013
Daccache A., Knox J.W., Weatherhead E.K., Stalham M.A. (2011). Impacts of climate change on irrigated potato production in England. Agricultural and Forest Meteorology. 151 (2011) 1641-1653.
Defra, Department for Environment, Food and Rural Affairs (2010). Draft Animal Health Bill.
Defra, Department for Environment, Food and Rural Affairs (2011). Water Usage in Agriculture and Horticulture. Results from the Farm Business Survey 2009/10 and the Irrigation Survey 2010.
Defra, Department for Environment, Food and Rural Affairs (2013c). Greenhouse gas mitigation practices – England Farm Practices Survey 2013 and Farm Business Survey 2011/12.
Defra, Department for Environment, Food and Rural Affairs (2013d). UK Country Report on Farm Animal Genetic Resources.
Defra, Department for Environment, Food and Rural Affairs (2013e). Review of environment advice, incentives and partnership approaches for the farming sector in England.
Department for Energy and Climate Change (2013). Thermal Growing Season in Central England.
European Commission Joint Research Centre (2012). The State of Soil in Europe – A contribution of the JRC to the European Environment Agency’s Environment State and Outlook Report.
Environment Agency (2004). The state of soils in England and Wales.
Environment Agency (2011a). Water – Planning ahead for an uncertain future. Water in the 2050s.
Environment Agency and Department for Food, Environment and Rural Affairs (2011b). National Flood and Coastal Erosion Risk Management Strategy for England.
Evans R., (1990). Soils at risk of accelerated erosion in England and Wales. ‘Soil Use and Management’ 6, 125-131.
FERA, Food and Environment Research Agency (2013). Crop Pest and Disease Surveys.
Foresight (2006). Infectious Diseases, Preparing for the Future. Final Project Report.
Foresight (2010). Land Use Futures: Project Final Project Report.
Foresight (2011). The Future of Food and Farming: Final Project Report.
Frontier Economics (2013) for Department for Environment, Food and Rural Affairs. Economics of Climate Resilience- Agriculture and Forestry theme: Forestry (Project CA0401).
Fuglie K. O. (2012). Productivity Growth and Technology Capital in the Global Agricultural Economy.
Holman, I.P., (2009). An estimate of peat reserves and loss in the East Anglian Fens. Unpublished report for the Royal Society for the Protection of Birds.
Knox J.W., Hurford, A., Hargreaves, L. And Wall, E. (2012). Climate change risk assessment for the agriculture sector.
Knox, J.W., Daccache, A., Weatherhead, E.K., Groves, S., and Hulin, A. (2013) for Department for Environment, Food and Rural Affairs. Assessing climate and land use impacts on water demand for agriculture and opportunities for adaptation: Current and future demand, Phase I (Project FFG1129).
Lal, R. (2008). Carbon sequestration. Philosophical Transactions of the Royal Society B, 363, 815-830.
Ministry of Agriculture, Fisheries and Food (1988). Agricultural land classification of England and Wales.
Moffat, A. J., Morison, J. I. L., Nicoll, B. And Bain, V. (2012). Climate change risk assessment for the forestry sector.
Monaghan, J.M., Daccache, A., Vickers, L., Hess, T.M., Weatherhead, E.K., Grove, I.G., and Knox, J.W. (2013). More ‘crop per drop’ – constraints and opportunities for precision irrigation in European agriculture. Journal of the Science of Food and Agriculture 93(5):977-80.
Moran, D. and Dann, S. (2007). The Economic value of water use: implications for implementing the Water Framework Directive in Scotland. Journal of Environmental Management 87: 3 pp 484-496.
References 131
1
Morris, J., Vasileiou, K., Weatherhead, E., Knox, J., Leiva-Baron, F. (2003). The Sustainability of Irrigation in England and the Impact of Water pricing and regulation policy options, in Advances in Water Supply Management, edited. Taylor and Francis, UK.
Morris, J., Weatherhead, K., Knox, J., Daccache, A., and Kay, M. (2013) for Department for Environment, Food and Rural Affairs. An updated assessment of the economics of on-farm irrigation reservoirs. (Project FFG1112).
Peterken, G.F. and Mountford, E.P. (1996). Effect of drought on beech in Lady Park Wood, an unmanaged mixed deciduous woodland. Forestry 69, 117-128.
Pollock C. (2013). Feeding the Future. Innovation requirements for primary food production in the UK to 2030 (Joint Commissioning Group report).
Read, D.J., Freer-Smith, P.H., Morison, J.I.L., Hanley, N., West, C.C., and Snowden, P., eds. (2009). Combating Climate Change – a role for UK forests. An assessment of the potential of the UK’s trees and woodlands to mitigate and adapt to climate change.
Smith, P., Chapman, S.J., Scott, A.W., Black, H.J., and Wattenbach, M., Milne, R., et al. (2007). Climate change cannot be entirely responsible for soil carbon loss observed in England and Wales, 1978-2003. Global Change Biology 13, 2605-2609.
Stokes, V. and Kerr, G. (2009). The evidence supporting the use of continuous cover forestry in adapting Scotland’s forests to the risks of climate change. Report to the Forestry Commission Scotland by Forest Research.
Thirtle, C. and Holding, J. (2003). Productivity of UK Agriculture – Causes and Constraints. Final report for Defra (Project ER0001/3).
Wall, R. and Ellse, L.S. (2011). Climate change and livestock parasites: integrated management of sheep blowfly strike in a warmer environment. Global Change Biology 17: 1770-1777.
Weatherhead, K. (2008). Spray Irrigation Demand Forecasting, Technical Report to Environment Agency, Cranfield University.
Weatherhead, K., Knox, J., Hess, T., and Daccache, A. (2013). Assessing future water demand for agricultural irrigation in England and Wales – an updated analysis. Supporting paper for Living with Environmental Change (LWEC) water climate change report card (in publication).
Whelan, M., Tediosi, A., Gandolfi, C., Rienzner, M., Rushton, K., Pullan, S. (2013). Modelling herbicide transfers from land to water in the Upper Cherwell catchment UK. Geophysical Research Abstracts.
Woodward, F.I., Bardgett, R.D., Raven, J.A. and Hetherington, A.M. (2009). Biological approaches to global environment change mitigation and remediation. Current Biology, 19, R615-R623.
WRAP (2011). Freshwater Use in the UK. Annex to final report on freshwater availability and use in the UK.
Chapter 3Carey, P.D., Wallis, S., Emmett, B.A., Maskell, L.C., Murphy, J.; Norton, L.R., et al. (2008). Countryside Survey: UK Headline Messages from 2007. NERC/Centre for Ecology and Hydrology, 30pp. (Project C03259).
Carr, D. (2010). Environmental targets – councils’ performance. ENDS report. May 2010: 32-35.
Cliquet, A., Backes, C., Harris, J.and Howsam, P. (2009). Adaptation to climate change – legal challenges for protected areas. Utrecht Law Review 5, Issue 1: 158-175.
Defra, Department for Environment, Food and Rural Affairs (2008). England Biodiversity Strategy: Climate Change Adaptation Principles. Conserving biodiversity in a changing climate.
Defra, Department for Environment, Food and Rural Affairs (2012a). Biodiversity 2020: A strategy for England’s wildlife and ecosystem services.
Defra, Department for Environment, Food and Rural Affairs (2012b). Biodiversity 2020 Indicators: 2012 Assessment.
132 Managing the land in a changing climate | Adaptation Sub-Committee | Progress Report 2013
Dodd, A., Hardiman, A., Jennings, K. And Williams, G. (2010). Protected areas and climate change – reflections from a practitioner’s perspective. Utrecht Law Review 6, Issue 1 pp141-150.
Ecosystem Markets Task Force (2013). Realising nature’s value: The Final Report of the Ecosystem Markets Task Force.
Environment Agency (2012). Summary of the 2012 Water Framework Directive classification status for surface waters.
Hewins, E., Pinches, C., Arnold, J., Lush, M., Robertson, H. and Escott, S. (2005). The condition of lowland BAP priority grasslands: results from a sample of non-statutory stands in England. English Nature Research Report No. 636. English Nature: Peterborough.
Huntley, B., Green, R., Collingham, Y., and Willis, G,S. (2007). A climatic atlas of European breeding birds. Lynx Edicions in partnership with RSPB and Birdlife International.
Kirby, K.J., Smart, S.M., Black, H.I.J., Bunce, R.G.H., Corney, P.M. and Smithers, R.J. (2005). Long-Term Ecological Change in British Woodland (1971-2001). English Nature Research Report no. 653. English Nature: Peterborough.
Lawton, J.H., Brotherton, P.N.M., Brown, V.K., Elphick, C., Fitter, A.H., Forshaw, J., et al. (2010). Making Space for Nature: a review of England’s wildlife sites and ecological network. Report to Defra.
Morecroft, M,D., Crick, H,Q,P., Duffield, S,J. and Macgegor, N,A.(2012). Resilience to climate change: translating principles into practice. Journal of Applied Ecology 49, 547-551.
Morecroft, M. and Speakman, L., eds. (2013). Terrestrial Biodiversity Climate Change Impacts Summary Report. Living with Environment Change.
Morton, D., Rowland, C., Wood, C. Meek, L., Marston, C., Smith, G., et al. (2011). Final Report for LCM2007 – the new UK land cover map. Countryside Survey Technical Report No 11/07 NERC/Centre for Ecology and Hydrology 112pp. (CEH Project Number: C03259).
Natural England (2008). State of the Natural Environment. (Project NE085).
Natural England (2011a). Agri-environment schemes in England 2009. A review of results and effectiveness (Project NE194).
Natural England (2011b). Protecting England’s natural treasures: Sites of Special Scientific Interest (Project NE306).
Natural England (2012). Natural England Designation Strategy (Project NE353).
Natural England Research Report (in press). National biodiversity climate change vulnerability model.
Pearce-Higgins, J.W. and Yalden, D.W. (2004). Habitat selection, diet, arthropod availability and growth of a moorland wader: the ecology of European Golden Plover Pluvialis apricaria chicks. Ibis 146: 335–346.
Quine, C,P, and Watts, K. (2009). Successful de-fragmentation of woodland by planting in an agricultural landscape? An assessment based on landscape indicators. Journal of Environmental Management 90.
Royal Commission on Environmental Pollution (2010). Adapting Institutions to Climate Change. 28th Report.
RSPB, Royal Society for the Protection of Birds (2005). Climate Change and the European Union Birds Directive- advice to the RSPB by Dr. David Wolfe, Matrix Chambers.
State of Nature (2013). State of Nature report, RSPB.
Thomas, C.D, Gillingham, P,K., Bradbury, R,B., Roy, D,B., Anderson, B,J., Baxter, J,M., et al. (2012). Protected areas facilitate species’ range expansions. Proceedings of the National Academy of Science (PNAS) 109, 14063-14068.
UK Biodiversity Partnership (2007) for the Department for Environment, Food and Rural Affairs. Conserving biodiversity in a changing climate: guidance on building capacity to adapt.
References 133
1
Chapter 4Acreman, M.C., Blake, J.R., Mountford, O., Stratford, C., Prudhomme, C., Kay, A., et al. (2009). Guidance on using wetland sensitivity to climate change tool-kit. A contribution to the Wetland Vision Partnership. Centre for Ecology and Hydrology, Wallingford.
Artz, R.R.E., Chapman, S.J., Donnelly, D. and Matthews, R.B. (2012). Potential Abatement from Peatland Restoration. Policy Briefing to the Scottish Government, Centre of Expertise on Climate Change, 8 pp.
Bain, C.G, Bonn, A., Stoneman, R., Chapman, S., Coupar, A. et al (2011). IUCN UK Commission of Inquiry on Peatlands. IUCN UK Peatland Programme, Edinburgh.
Barber, K.E. (1981). Peat stratigraphy and Climate change: A palaeological test of the theory of cyclic peat bog vegetation. Rotterdam AA BAlkema.
Belyea, L.R. and Clymo, R.S. (1998). Do hollows control the rate of peat bog growth? In Standen, Tallis and Meade, eds. Patterned mires and mire pools, p55-65, London Britsih Ecological Society.
Belyea, L.R. and Clymo, R.S. (2001). Feedback control on the rate of peat formation. Proceedings of the Royal Society of London B 268 1315-1321.
Billet, M., Charman, D.J., Clark, J.M., Evans, C., Evans, M., Ostle, N., et al. (2010). Carbon balance of UK peatlands: current state of knowledge and future research challenges. Climate Research, 45, 13-29.
Blackford, J.J., Innes, J.B., Hatton, J.J. and Caseldine, C.J. (2006). Mid-holocene environmental change at Black Ridge Brook, Dartmoor, SW England: A new appraisal based on fungal spore analysis. Review of Palaeobotany and Palynology, 141:189-201.
Blodau, C. (2002). Carbon cycling in peatlands – A review of processes and controls. Environmental Reviews, 10, 111-134.
Brunning, R. (2001). Archaeology and peat wastage on the Somerset Moors. Environment and Property Department, Somerset County Council.
Christie, M., Hyde, T., Cooper, R., Fazey, I., Dennis, P., Warren, J., et al. (2011). Economic valuation of the benefits of ecosystem services delivered by the UK Biodiversity Action Plan. Report to Defra, London.
Clark, J.M., Gallego-Sala, A.V., Allott, T.E.H., Chapman, S. J., Farewell, T., Freeman, C., et al. (2010). Assessing the vulnerability of blanket peat to climate change using an ensemble of statistical bioclimatic envelope models. Climate Research.
Defra Agricultural Observatory (2011). Available on-line.
Dise, N. (2009). Peatland response to global change. Science, 326, 810-811.
Essl, F., Dullinger, S., Moser, D., Rabitsch, W. and Kleinbauer, I. (2012). Vulnerability of mires under climate change: implications for nature conservation and climate change adaptation. Biodiversity and Conservation, 21/3, pp 655-669.
Fraser of Allander Institute (2010). An economic study of grouse moors. A report by the Fraser of Allander Institute to the Game and Wildlife Conservation Trust Scotland.
Gallego-Sala, A. and Prentice, I.C. (2012). Blanket peat biome endangered by climate change. Nature Climate Change.
Gorham, E. (1991). Northern peatlands: role in the carbon cycle and probable response to climatic warming. Ecological Applications, 1: 182-195.
Grand-Clement, E., Anderson, K., Smith, D., Luscombe, D., Gatis, N., Ross, M. and Brazier, R. (2013). Evaluating ecosystem goods and services after restoration of marginal upland peatlands in South-West England. Journal of Applied Ecology.
Harlow, J., Clarke, S., Phillips, M. and Scott, A. (2012). Valuing land-use and management changes in the Keighley and Watersheddies catchment. Natural England Research Report No.44, Peterborough.
Holden, J., Shotbolt, L., Bonn, A., Burt, T.P., Chapman, P.J.,Dougill, A.J., et al. (2007). Environmental change in moorland landscapes. Earth- Science Reviews, 82: 75-100.
Joint Nature Conservancy Council (2011). Towards an assessment of the state of UK Peatlands. Report No. 445.
134 Managing the land in a changing climate | Adaptation Sub-Committee | Progress Report 2013
Lindsay, R. (2010). Peatbogs and carbon: a critical synthesis to inform policy development in oceanic peat bog conservation and restoration in the context of climate change. Report for RSPB.
Lucchesea, M., Waddington, J., Poulin, M., Pouliot, R., Rochefort, L. and Strack, M. (2010). Organic matter accumulation in a restored peatland: Evaluating restoration success. Ecological Engineering 36, 482-488.
Lunt, P., Allot, T., Anderson, P., Buckler, M., Coupar, A., Jones, P., et al. (Ed. Evans, M) (2010). Peatland Restoration. Scientific Review for IUCN Peatland Programme.
Mills, J., Short, C., Ingram, J., Griffiths, B., Janet Dwyer, J., McEwen, L., et al. (2010). Review of the Exmoor Mires Restoration Project Final Report. A report by the Countryside and Community Research Institute.
Natural England (2009). Mapping values: the vital nature of our uplands. An atlas linking environment and people (Project NE209).
Natural England (2010). England’s peatlands: carbon storage and greenhouse gases (Project NE257).
Natural England (2013a). Restoration of degraded blanket bog (Project NEER003).
Natural England (2013b). The effects of managed burning on upland peatland biodiversity, carbon and water (Project NEER004).
Nizzetto, L., Macleod, M., Borga, K., Cabrerizo, A., Dachs, J., Di Guardo, A., et al. (2010). Past, Present, and Future Controls on Levels of Persistent Organic Pollutants in the Global Environment, Environmental Science and Technology, 44: 6526-6531.
Olivier, A., and Van de Noort, R. (2002). English Heritage strategy for Wetlands, English Nature and University of Exeter.
Orr, H.G., Wilby, R.L., McKenzie Hedger, M., Brown, I. (2008). Climate change in the uplands: a UK perspective on safeguarding regulatory ecosystem services. Clim Res 37:77-9.
PACEC, Public and Corporate Economic Consultants (2006). The economic and environmental impact of sporting shooting. Report on behalf of BASC, CA, and CLA and in association with GCT.
Rothwell, J.J., Evans, M.G. and Allott, T.E.H. (2007). Lead contamination of fluvial sediments in an eroding blanket peat catchment. Applied Geochemistry, 22: 446-459.
Simmons, I.G. (2003). The moorlands of England and Wales. An environmental history 8000 BC-AD 2000. Edinburgh University Press, Edinburgh.
Smyth, M.A. (2013). Crichton Centre first approximations for standard GHG fluxes from blanket bog peatland ecosystem states. Pers Comm.
Swanson, D. (2007). Interaction of mire microtopography, water supply, and peat accumulation in boreal mires Suo 58/2, pp37-47.
Worrall, F., Chapman, P., Holden, J., Evans, C., Artz,R., Smith, P. et al. (2010). Peatlands and Climate Change. Report to IUCN Peatland Programme, Edinburgh.
Yeloff, D., Charman, D., van Geel, B. and Mauquoy, D. (2007). Reconstruction of hydrology, vegetation and past climate change in bogs using fungal microfossils. Review of Palaeobotany and Palynology, 146: 102.
Chapter 5ABPmer managed realignment database (2013). Accessible online.
Brander, L.M., Ghermandi, A., Kuik, O., Markandya, A., Nunes, P., Schaafsma, M., et al. (2008). Scaling up ecosystem services values: methodology, applicability and a case study. Report to European Environment Agency.
Cooper, N.J., Cooper, T. and Burd, F. (2001). 25 years of salt marsh erosion in Essex: Implications for coastal defence and nature conservation. Journal of Coastal Conservation, 9, 31–40.
References 135
1
Dawson, R.J., Dickson, M.E., Nicholls, R.J., Hall, J.W., Walkden, M.J.A., Stansby, P., et al. (2009). Integrated analysis of risks of coastal flooding and cliff erosion under scenarios of long term change. Climatic Change, 95(1-2), 249-288.
Defra, Department for Environment, Food and Rural Affairs (2006). Shoreline Management Plans guidance- Volume 1: Aims and requirements, Volume 2: Procedures.
Delbaere B.C.W. (1998). Facts and figures on European biodiversity; state and trends 1998–1999. European Centre for Nature Conservation. Tilburg, the Netherlands.
Dickson, M. E., Walkden, M. J. A. and Hall, J. W. (2006). Systemic impacts of climate change on an eroding coastal region over the twenty-first century. Climatic change.
Doody, J.P. (2008). Saltmarsh conservation, management and restoration. Coastal Systems and Continental Margins Series. Springer, USA.
Eftec, Economics for the Environment Consultancy (2010). Flood and Coastal Erosion Risk Management: Economic Valuation of Environmental Effects. Handbook for the Environment Agency for England and Wales.
Environment Agency (2009). Investing for the future. Flood and coastal risk management in England – a long term investment strategy.
Environment Agency (2011). National Coastal Erosion Risk Mapping. NCERM.
Everard, M. (2009). Ecosystem services case studies: Better regulation science programme. Peterborough, Environment Agency, 101p.
French, P.W. (1997). Coastal and Estuarine Management. Routledge Environmental Management Series, Pp. 251. Routledge, London.
Foster, N. M., Hudson, M. D., Bray, S. and Nicholls, R. J. (2013). Intertidal mudflat and saltmarsh conservation and sustainable use in the UK: A review. Journal of Environmental Management, 126, 96-104.
Garbutt A. and Boorman L. (2009). Managed Realignement: recreating intertidal habitat on formerly reclaimed land, in Coastal Wetlands: An Integrated Ecosystem Approach, edited by Perillo, G., Wolanski, E., Cahoon, D., Brinson, M.
HR Wallingford (2002). Coastal Defence Vulnerability 2075, Report SR 590.
HR Wallingford (2012) for Adaptation Sub-Committee. Development of spatial indicators to monitor changes in exposure and vulnerability to flooding and the uptake of adaptation actions to manage flood risk in England.
James, J. W. C., and Lewis, P. M. of the British Geographical Survey coastal geology group (1996) for the Environment Agency. Sediment input from coastal cliff erosion. Operational investigation 577, Technical Report 577/4/A.
Jones, C.R., Houston, J.A., Bateman, D. (1993). A history of human influence on the coastal landscape. The Sand Dunes of the Sefton Coast (eds. D. Atkinson and J.A. Houston), pp.3–20. Liverpool Museum, Liverpool.
JNCC, Joint Nature Conservation Committee (2007). Second Report by the UK under Article 17 on the implementation of the Habitats Directive from January 2001 to December 2006.
King S.E. and Lester J. N. (1995). The Value of Salt Marsh as a Sea Defence. Pollution Economics, Marine Pollution Bulletin, Vol. 30, No. 3, pp. 180-189.
Ledoux, L., Cornell S., O’Riordan, T., Harvey, R. and Banyard, L., (2005). Towards sustainable flood and coastal management: identifying drivers of, and obstacles to, managed realignment. Land Use Policy, 22(2), 129-144.
Lee, M. (2001). Coastal defence and the habitats directive: Predictions of habitat change in England and Wales. The Geographical Journal, 167, pp. 139-56.
Luisetti, T., Turner, R. K., Bateman, A. J., Morse-Jones, S., Adams, C. (2011). Coastal and marine ecosystem services valuation for policy and management: Managed realignment case studies in England, Ocean and Coastal Management 54.
Möller, I., Spencer, T., French, J.R., Leggett D. J., and M. Dixon (1999). Wave Transformation Over Salt Marshes: A Field and Numerical Modelling Study from North Norfolk, England, Estuarine, Coastal and Shelf Science 49, 411-426.
136 Managing the land in a changing climate | Adaptation Sub-Committee | Progress Report 2013
Möller, I. and Spencer, T. (2006). Wave dissipation over macro-tidal saltmarshes: Effects of marsh edge typology and vegetation change, Journal of Coastal Research, Special Issue 36, pp. 506-521.
Morris, R. K. A., Reach, I. S., Duffy, M. J., Collins, T. S. and Leafe,R. N. (2004). On the loss of salt marshes in south-east England and the relationship with Nereis diversicolor. Journal of Applied Ecology, 41, 787–791.
Nicholls, R. J., Townend, I. H., Bradbur, A. P., Ramsbottom, D., Day S. A. (2013). Planning for long-term coastal change: Experiences from England and Wales. Ocean Engineering.
Phelan, N., Shaw, A., Baylis, A., (2011) for the Environment Agency. The extent of saltmarsh in England and Wales: 2006-2009.
Risk and Policy Analysts Limited, Collingwood Environmental Planning, Green Dart Consulting Limited, Edwin Watson Partnership, for the North Norfolk District Council (2008). North Norfolk Coastal Management Plan Evidence Gathering Study 01: Final report.
Rees, S., Angus, S., Rhind P., and Doody, J.P. (2010). Coastal Margin Habitats in MCCIP Annual Report Card 2010-11. MCCIP Science Review, 21pp.
Shoreline Management Plans (2008-2010). Accessible online from the Environment Agency website.
Turner, R.K., Burgess, D., Hadley, D., Coombes, E., Jackson, N. (2007). A cost–benefit appraisal of coastal managed realignment policy. Global Environmental Change 17, pp. 397–407
UKTS, United Kingdom Tourism Statistics (2006). Tourism volumes and values in 2006.
VisitBritain (2007). England Tourism Day Visits 2005. VisitBritain, London.
Chapter 6Defra, Department for Environment, Food and Rural Affairs (2013f). Funding for Flood and Coastal Erosion Risk Management in England.
Environment Agency (2009). Investing for the future. Flood and coastal risk management in England – a long term investment strategy.
Strategic Management Consultants (2013) for Department for Environment, Food and Rural Affairs, Environment Agency and Ofwat. Review of the calculation of sustainable economic level of leakage and its integration with water resource management planning (Project 26777).
Taylor Review (2012). External Review of Government Planning Practice Guidance.
Committee on Climate Change 7 Holbein Place London SW1W 8NR
www.theccc.org.uk
@theCCCuk
Designed and typeset by The Digital Parent Company Ltd, www.digitalparentcompany.com