Embed Size (px)
Citation preview
Managing the Farm Environment
Most discussions of environmental crime focus upon large-scale pollution; e.g. of rivers or oceans, where there is no clear victim. This research examined environmental crime that occurs on farms where individual farmers are victims. The study also gathered information on the things farmers are currently doing on their properties and in their communities that contribute to environmental sustainability. All too often farmers are blamed for environmental degradation, and the positive contribution that farmers make to environmental sustainability is overlooked. Farmers’ attitudes to various environmental issues were also explored. The results presented here come from the 1,926 respondents to a survey mailed in May 2008 to 5,000 farmers located across Australia.
This research was supported by a grant from the Department of the Environment Water Heritage and the Arts: Commonwealth Environment Research Facilities Fund. The views expressed are the responsibility of the author and are not necessarily
those of the funding body.
For further information contact:
Dr Elaine Barclay
Institute for Rural FuturesUniversity of New England
Armidale, NSW 2351 ph: 02 6773 5141
Email: [email protected]
The participants
Of those who responded to the survey, 80.4% were males and 19.6% were females. Males were over-represented, as approximately one third of Australian farmers are women. Ages ranged between 21 and 91 years (average 58 years). This is older than the national average for farmers of 52 years. However, the sample reflects the continuing trend of the aging of farmers in Australia. Almost all participants were farm owners. They had been farming their current property between one and 90 years (average 37 years). Most had lived in their district for at least 20 years or most of their lives. Only 19 farmers were relative newcomers to the district; less than three years. Just over half were on land previously owned by relatives.
Best practice land management on farms
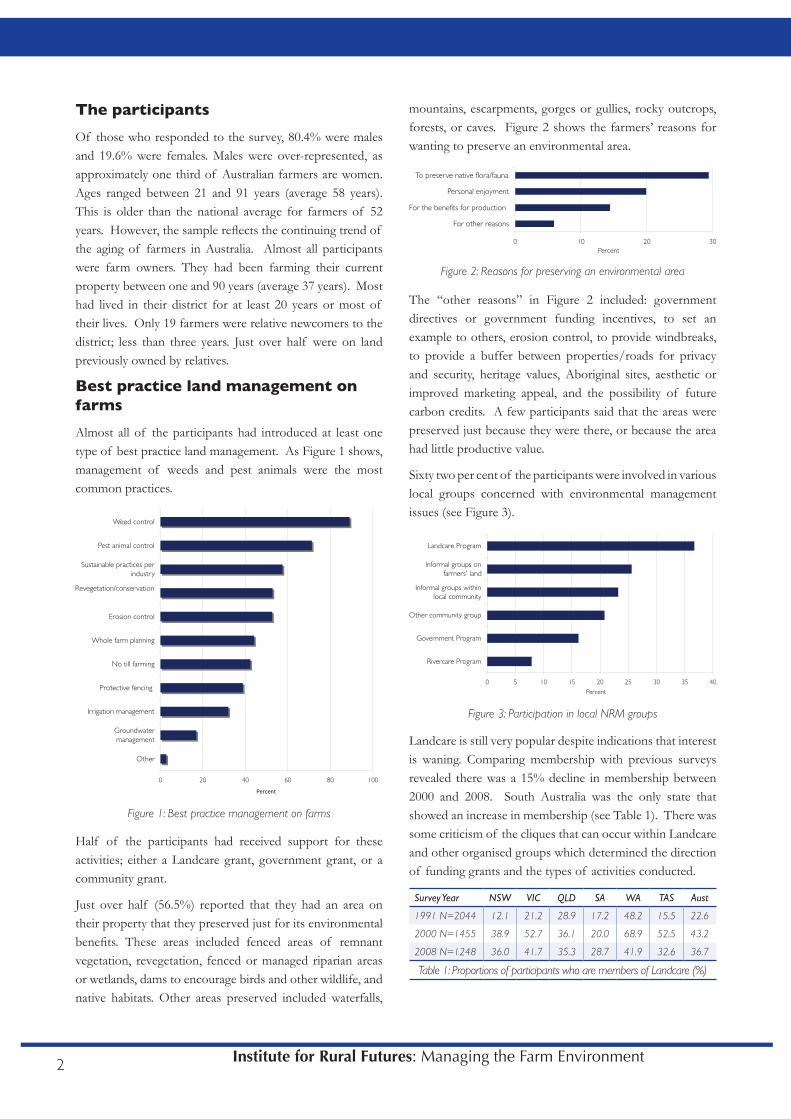
Almost all of the participants had introduced at least one type of best practice land management. As Figure 1 shows, management of weeds and pest animals were the most common practices.
0 20 40 60 80 100
Other
Groundwatermanagement
Irrigation management
Protective fencing
No till farming
Whole farm planning
Erosion control
Revegetation/conservation
Sustainable practices perindustry
Pest animal control
Weed control
Percent
Figure 1: Best practice management on farms
mountains, escarpments, gorges or gullies, rocky outcrops, forests, or caves. Figure 2 shows the farmers’ reasons for wanting to preserve an environmental area.
0 10 20 30
For other reasons
For the benefits for production
Personal enjoyment
To preserve native flora/fauna
Percent
Figure 2: Reasons for preserving an environmental area
0 5 10 15 20 25 30 35 40
Rivercare Program
Government Program
Other community group
Informal groups withinlocal community
Informal groups onfarmers' land
Landcare Program
Percent
Figure 3: Participation in local NRM groups
Landcare is still very popular despite indications that interest is waning. Comparing membership with previous surveys revealed there was a 15% decline in membership between 2000 and 2008. South Australia was the only state that showed an increase in membership (see Table 1). There was some criticism of the cliques that can occur within Landcare and other organised groups which determined the direction of funding grants and the types of activities conducted.
Survey Year NSW VIC QLD SA WA TAS Aust
1991 N=2044 12.1 21.2 28.9 17.2 48.2 15.5 22.6
2000 N=1455 38.9 52.7 36.1 20.0 68.9 52.5 43.2
2008 N=1248 36.0 41.7 35.3 28.7 41.9 32.6 36.7
Table 1: Proportions of participants who are members of Landcare (%)
The “other reasons” in Figure 2 included: government directives or government funding incentives, to set an example to others, erosion control, to provide windbreaks, to provide a buffer between properties/roads for privacy and security, heritage values, Aboriginal sites, aesthetic or improved marketing appeal, and the possibility of future carbon credits. A few participants said that the areas were preserved just because they were there, or because the area had little productive value.
Sixty two per cent of the participants were involved in various local groups concerned with environmental management issues (see Figure 3).
2 Institute for Rural Futures: Managing the Farm Environment
Half of the participants had received support for these activities; either a Landcare grant, government grant, or a community grant.
Just over half (56.5%) reported that they had an area on their property that they preserved just for its environmental benefits. These areas included fenced areas of remnant vegetation, revegetation, fenced or managed riparian areas or wetlands, dams to encourage birds and other wildlife, and native habitats. Other areas preserved included waterfalls,
0 10 20 30 40 50 60 70
Loss of habitat
Nutrient run off
Other
Loss native vegetation
Degradation of creeks (sediment, weeds)
Water logging
Water qualilty decline
Urban sprawl
Dryland Salinity
Neighbours' management practices
Soil erosion
Water availability
Drought
Pest animals
Weeds
Percent
0 10 20 30 40 50 60 70
Lack of interest
Lack of cooperation from neighbours
Lack of information
Other
It would affect bottom line
Don’t want to introduce something that can't bereversed
Other priorities
Property is too small
Preserved area may harbour weeds/pests
Lack of support
Climatic extremes (drought)
Lack of time
Lack of money
Percent
Figure 4: Factors preventing environmental improvements
Impact of land use changes on neighbouring farms
A quarter of participants (24.9%) were affected by land use changes made by neighbours or others in their district such as:
Blue gum plantations with more pest animals, birds and • weeds, and reduced water run off.Wildlife corridors and therefore more pest animals.• Reserves (national parks etc) with more pest animals.• Hobby farms or lifestyle blocks and poor farm management • which has led to more weeds, pests and disease (ticks or lice).Urban encroachment and complaints from new neighbours • regarding normal farm practices.Mining resulting in a reduction to the water table and loss • of water to farms, and more noise and dust.
Olive groves, vineyards, or other irrigated horticulture • lowering water tables, spreading olive tree seedlings and limiting chemical weed control.Dams or irrigation development causing reduced water • flow or in other cases causing flooding and crop damage.
Overall, pest animals were identified as a major detrimental impact from the activities of farm neighbours.
Just below a fifth of participants (16.7%) reported they had made land use changes to their property which had elicited a reaction from their neighbours: 9.3% reported a positive response, 5% had a negative response and 1.5% had both positive and negative reactions. The types of changes reported varied from property development, to different types of farming, to environmental conservation activities. The importance of community acceptance for what a farmer did on his/her property was a strong theme among participants. Many of the neighbour complaints concerned differences of opinion about farming practices between long time farmers and newcomers, such as hobby/lifestyle farmers.
Main environmental problems on farms
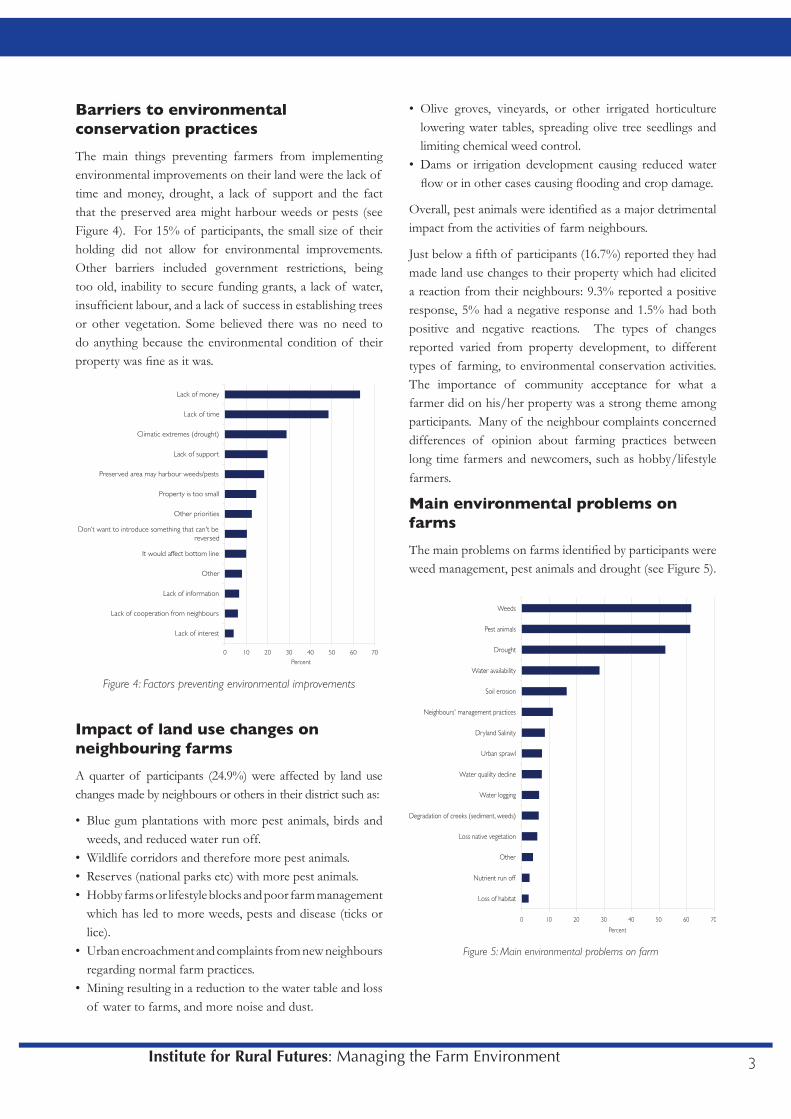
The main problems on farms identified by participants were weed management, pest animals and drought (see Figure 5).
Barriers to environmental conservation practices
The main things preventing farmers from implementing environmental improvements on their land were the lack of time and money, drought, a lack of support and the fact that the preserved area might harbour weeds or pests (see Figure 4). For 15% of participants, the small size of their holding did not allow for environmental improvements. Other barriers included government restrictions, being too old, inability to secure funding grants, a lack of water, insufficient labour, and a lack of success in establishing trees or other vegetation. Some believed there was no need to do anything because the environmental condition of their property was fine as it was.
Figure 5: Main environmental problems on farm
3Institute for Rural Futures: Managing the Farm Environment
Human caused problems: Environmental Crime
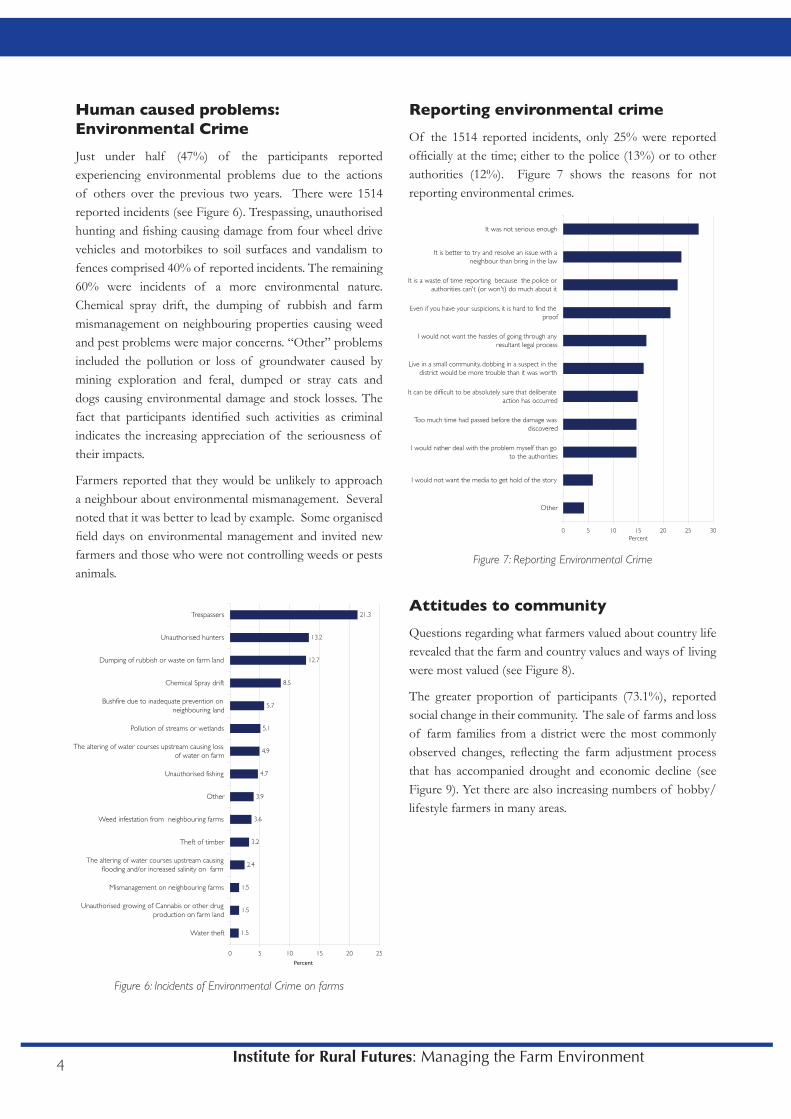
Just under half (47%) of the participants reported experiencing environmental problems due to the actions of others over the previous two years. There were 1514 reported incidents (see Figure 6). Trespassing, unauthorised hunting and fishing causing damage from four wheel drive vehicles and motorbikes to soil surfaces and vandalism to fences comprised 40% of reported incidents. The remaining 60% were incidents of a more environmental nature. Chemical spray drift, the dumping of rubbish and farm mismanagement on neighbouring properties causing weed and pest problems were major concerns. “Other” problems included the pollution or loss of groundwater caused by mining exploration and feral, dumped or stray cats and dogs causing environmental damage and stock losses. The fact that participants identified such activities as criminal indicates the increasing appreciation of the seriousness of their impacts.
Farmers reported that they would be unlikely to approach a neighbour about environmental mismanagement. Several noted that it was better to lead by example. Some organised field days on environmental management and invited new farmers and those who were not controlling weeds or pests animals.
1.5
1.5
1.5
2.4
3.2
3.6
3.9
4.7
4.9
5.1
5.7
8.5
12.7
13.2
21.3
0 5 10 15 20 25
Water theft
Unauthorised growing of Cannabis or other drugproduction on farm land
Mismanagement on neighbouring farms
The altering of water courses upstream causingflooding and/or increased salinity on farm
Theft of timber
Weed infestation from neighbouring farms
Other
Unauthorised fishing
The altering of water courses upstream causing lossof water on farm
Pollution of streams or wetlands
Bushfire due to inadequate prevention onneighbouring land
Chemical Spray drift
Dumping of rubbish or waste on farm land
Unauthorised hunters
Trespassers
Percent
Figure 6: Incidents of Environmental Crime on farms
Figure 7: Reporting Environmental Crime
0 5 10 15 20 25 30
Other
I would not want the media to get hold of the story
I would rather deal with the problem myself than goto the authorities
Too much time had passed before the damage wasdiscovered
It can be difficult to be absolutely sure that deliberateaction has occurred
Live in a small community, dobbing in a suspect in thedistrict would be more trouble than it was worth
I would not want the hassles of going through anyresultant legal process
Even if you have your suspicions, it is hard to find theproof
It is a waste of time reporting because the police orauthorities can't (or won't) do much about it
It is better to try and resolve an issue with aneighbour than bring in the law
It was not serious enough
Percent
Reporting environmental crime
Of the 1514 reported incidents, only 25% were reported officially at the time; either to the police (13%) or to other authorities (12%). Figure 7 shows the reasons for not reporting environmental crimes.
4 Institute for Rural Futures: Managing the Farm Environment
Attitudes to community
Questions regarding what farmers valued about country life revealed that the farm and country values and ways of living were most valued (see Figure 8).
The greater proportion of participants (73.1%), reported social change in their community. The sale of farms and loss of farm families from a district were the most commonly observed changes, reflecting the farm adjustment process that has accompanied drought and economic decline (see Figure 9). Yet there are also increasing numbers of hobby/lifestyle farmers in many areas.
0 10 20 30 40 50 60 70 80 90 100
The mix of newcomersand long term residents
The town amenities
Being involved in thecommunity
Social networks andfriendships
Country values andways of life
The flora and fauna
The physical landscape
My land and farmoperation
Percent
Highly Valued Partly Valued Valued a little Not valued at all
Figure 8: What is valued in country life
0 20 40 60 80 100
Other
Urban sprawl into farmland
Farms divided into smallerholdings
Increasing numbers ofhobby/lifestyle farmers
Farms combined in tolarger holdings
Farms sold and peoplehave left the district
Percent
Figure 9 : Social change in farming areas over past 5 years
Other changes included increasing mining and gas exploration and loss of farm labour to the mines, the increase in the number of farms sold to Managed Investment Schemes, the change in types of agricultural production such as dairying and tobacco, and the increasing amount of farm land converted to blue gum plantations. Over half (57.3%) described the changes as negative, 7.7% considered them to be positive, while 35% believed they were neither positive nor negative.
Figure 10: Level of agreement with the statement: “I don’t believe there is any such thing as climate change”
15.3%
22.9%27.4% 25.5%
8.9%
Strongly Agree Agree Neutral or Unsure Disagree Strongly Disagree
Attitudes to environmental resource management
Participants were asked to rate property owners, governments and other agencies according to the degree to which they believed they were responsible for environmental resource management. The majority believed property owners were mainly responsible (see Figure 11).
0 10 20 30 40 50 60 70 80 90 100
Regional NRM groups
Industry Bodies
Local NRM groups
Local Government
CMAs
Federal Government
State Governmentagencies
Property ownersthemselves
Percent
Mainly responsible Partially responsible Least responsible
Figure 11: Perceptions of responsibility for environmental management on farms
Attitudes to Climate Change
As Figure 10 shows, there was no consensus amongst the farmers regarding the reality of climate change. Many remain undecided. These responses were irrespective of gender or education. However, younger farmers were more likely to believe in the existence of climate change than older farmers.
5Institute for Rural Futures: Managing the Farm Environment
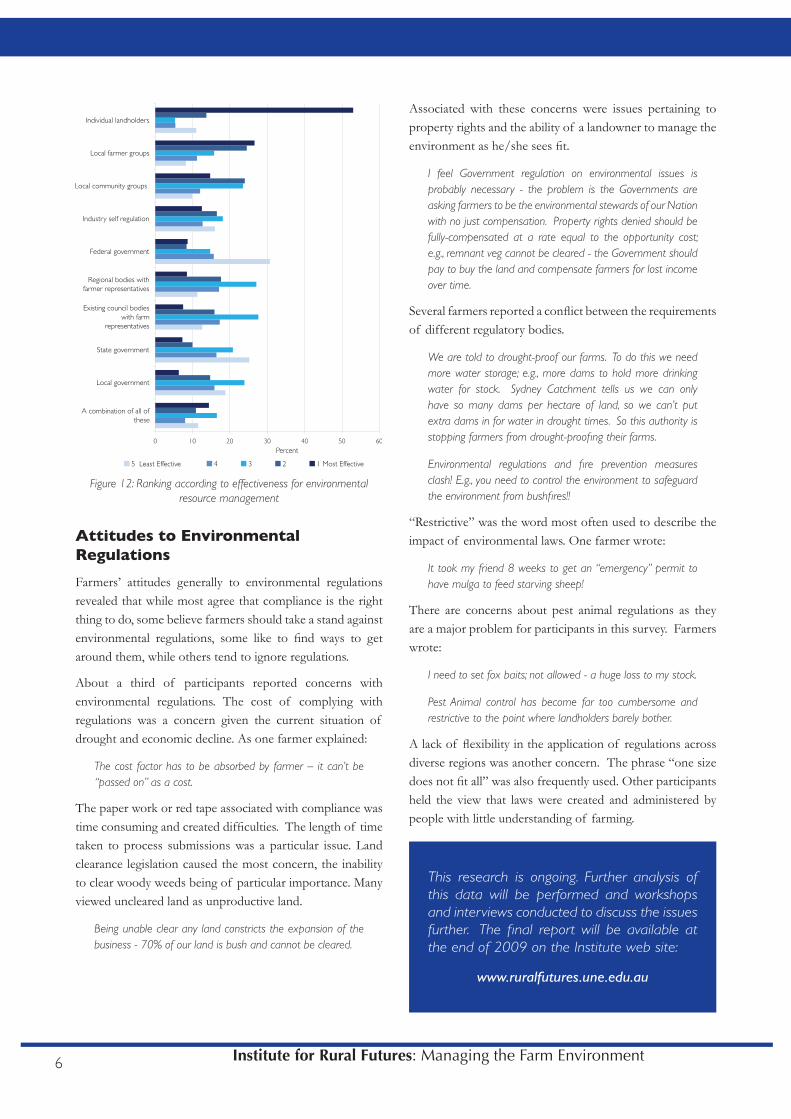
Farmers rated various groups according to their effectiveness for environmental and resource management. Individual landowners were rated as the most effective, followed by local farmer and local community groups (see Figure 12).
Associated with these concerns were issues pertaining to property rights and the ability of a landowner to manage the environment as he/she sees fit.
I feel Government regulation on environmental issues is probably necessary - the problem is the Governments are asking farmers to be the environmental stewards of our Nation with no just compensation. Property rights denied should be fully-compensated at a rate equal to the opportunity cost; e.g., remnant veg cannot be cleared - the Government should pay to buy the land and compensate farmers for lost income over time.
Several farmers reported a conflict between the requirements of different regulatory bodies.
We are told to drought-proof our farms. To do this we need more water storage; e.g., more dams to hold more drinking water for stock. Sydney Catchment tells us we can only have so many dams per hectare of land, so we can’t put extra dams in for water in drought times. So this authority is stopping farmers from drought-proofing their farms.
Environmental regulations and fire prevention measures clash! E.g., you need to control the environment to safeguard the environment from bushfires!!
“Restrictive” was the word most often used to describe the impact of environmental laws. One farmer wrote:
It took my friend 8 weeks to get an “emergency” permit to have mulga to feed starving sheep!
There are concerns about pest animal regulations as they are a major problem for participants in this survey. Farmers wrote:
I need to set fox baits; not allowed - a huge loss to my stock.
Pest Animal control has become far too cumbersome and restrictive to the point where landholders barely bother.
A lack of flexibility in the application of regulations across diverse regions was another concern. The phrase “one size does not fit all” was also frequently used. Other participants held the view that laws were created and administered by people with little understanding of farming.
This research is ongoing. Further analysis of this data will be performed and workshops and interviews conducted to discuss the issues further. The final report will be available at the end of 2009 on the Institute web site:
www.ruralfutures.une.edu.au
Attitudes to Environmental Regulations
Farmers’ attitudes generally to environmental regulations revealed that while most agree that compliance is the right thing to do, some believe farmers should take a stand against environmental regulations, some like to find ways to get around them, while others tend to ignore regulations.
About a third of participants reported concerns with environmental regulations. The cost of complying with regulations was a concern given the current situation of drought and economic decline. As one farmer explained:
The cost factor has to be absorbed by farmer – it can’t be “passed on” as a cost.
The paper work or red tape associated with compliance was time consuming and created difficulties. The length of time taken to process submissions was a particular issue. Land clearance legislation caused the most concern, the inability to clear woody weeds being of particular importance. Many viewed uncleared land as unproductive land.
Being unable clear any land constricts the expansion of the business - 70% of our land is bush and cannot be cleared.
6 Institute for Rural Futures: Managing the Farm Environment
Figure 12: Ranking according to effectiveness for environmental resource management
0 10 20 30 40 50 60
A combination of all ofthese
Local government
State government
Existing council bodieswith farm
representatives
Regional bodies withfarmer representatives
Federal government
Industry self regulation
Local community groups
Local farmer groups
Individual landholders
Percent
5 Least Effective 4 3 2 1 Most Effective


![FARM TAPS 2019.pptx [Read-Only]Farm Taps • Exercise of Enforcement Discretion Regarding Farm Taps – Issued March 28, 2019 • Choice of managing risk to farm taps by either §192.740](https://img.pdfslide.us/doc/110x75/600e7275e0429a22ec32de4b/farm-taps-2019pptx-read-only-farm-taps-a-exercise-of-enforcement-discretion.jpg)