Embed Size (px)
Citation preview

Electronic copy available at: http://ssrn.com/abstract=1787144
Managing Risk Management*
Gordon M. Bodnar SAIS, Johns Hopkins University Washington DC, 20036, USA
John Graham
Fuqua School of Business, Duke University Durham, NC 27708, USA
and National Bureau of Economic Research
Cambridge, MA 02912, USA
Campbell R. Harvey Fuqua School of Business, Duke University
Durham, NC 27708 USA and
National Bureau of Economic Research Cambridge, MA 02912, USA
and
Richard C. Marston Wharton School, University of Pennsylvania
Philadelphia, PA 19104 USA
Draft: March 2011
Abstract:
We survey and analyze risk management goals, policies, and perceptions of risk managers in businesses and
organizations around the world. With more than 1,100 responses and a global scope, we ask specific questions
about risk management behavior in six risk areas: interest rate, foreign exchange, commodity, energy, credit, and
geopolitical risk. We question risk managers about their firm’s exposures to these risks areas as well as their
financial and operational methods used to in risk management. In addition, we pose specific questions about the
interaction between risk management and the firm's investing and financing policies as well as explore the impact
of recent and possible changes to derivatives market regulation on the firm's derivative usage. As some questions
in the survey are drawn directly from earlier surveys we are able to assess changes in policy and practice over time.
Finally, we link the personal characteristics of risk managers to their practices. For example, we are able to
determine whether a manager’s personal risk aversion is linked to the risk management policy that manager
oversees. Overall the results suggest that in the post global financial crisis world, risk management is an
important part of corporate activities and that best practice in risk management policy and behavior has become
global.
*The survey was carried out with support from CFO Publishing, The Global Association of Risk Professionals, the International Swap and Derivatives Association, and the Weiss Center for International Finance at the Wharton School of the University of Pennsylvania.

Electronic copy available at: http://ssrn.com/abstract=1787144
Managing Risk Management
Abstract:
We survey and analyze risk management goals, policies, and perceptions of risk managers in businesses and
organizations around the world. With more than 1,100 responses and a global scope, we ask specific questions
about risk management behavior in six risk areas: interest rate, foreign exchange, commodity, energy, credit, and
geopolitical risk. We question risk managers about their firm’s exposures to these risks areas as well as their
financial and operational methods used to in risk management. In addition, we pose specific questions about the
interaction between risk management and the firm's investing and financing policies as well as explore the impact
of recent and possible changes to derivatives market regulation on the firm's derivative usage. As some questions
in the survey are drawn directly from earlier surveys we are able to assess changes in policy and practice over time.
Finally, we link the personal characteristics of risk managers to their practices. For example, we are able to
determine whether a manager’s personal risk aversion is linked to the risk management policy that manager
oversees. Overall the results suggest that in the post global financial crisis world, risk management is an
important part of corporate activities and that best practice in risk management policy and behavior has become
global.
Keywords: Corporate risk management, Global survey
JEL Classification: G32

Electronic copy available at: http://ssrn.com/abstract=1787144
1
1. Introduction
Unlike other areas of finance, risk management is a practice that is difficult for outsiders to observe.
While disclosure about risk management activities has become more prevalent in the past decade, such disclosures
tell only part of the story about firm behavior and very little about the underlying thinking of the managers making
the risk management decisions within the firm. One of the few ways to understand both risk management
practice as well as philosophy within the business community is to survey and interview managers.1
This study is designed to provide a benchmark of the state of business risk management in the post global
financial crisis world. While part of this survey is modeled loosely on the earlier Wharton survey structures in
order to allow for comparisons across similar questions to examine changes in behavior over time, (Bodnar et al,
(1995, 1996 and 1998)) this survey is different from past surveys in several important ways. First, it is much more
expansive in coverage, both in terms of the risk areas it covers as well as the global expanse of its sample. The
survey questions managers about risk in six different areas: interest rate, foreign exchange, energy, commodity,
credit and geo‐political. In terms of the breadth of the sample, we include both financial and nonfinancial firms,
and geographically this survey is one of the first that is truly global in coverage rather than examining just a single
country.2 This allows for an unprecedentedly large response group from which we draw representative
conclusions about current risk management practice and philosophy, both for the sample as a whole as well as for
key subgroups.
Second, in comparison to many of the earlier surveys that focus only the use of derivatives for managing
risk, this survey is more comprehensive, questioning managers about both financial as well as operational methods
for managing risk. As we will see, this is an important expansion of investigation as for many of the risk areas
examined; it will be operational methods rather than financial methods that are more commonly used by firms to
manage these risks.
Third, we link the demographic characteristics of both firms and managers to risk management practices.
We use psychometric methods to assess manager risk aversion and link this as well as other manager and firm
1 See Appendix 1 for a (non exhaustive) list of past surveys of derivative use and risk management practice 2 A survey of Deutche Bank customers risk management policies by Servaes et al (2009) was also global in its sample structure but much smaller in size than this survey .

2
specific characteristics to the firms’ risk management policy. In addition, the survey is able to determine why
managers choose not to hedge—something that is impossible to observe with standard empirical methods.
The next section provides a discussion of the survey design, the sample creation and the survey
distribution. Section 3 contains the summary of sample demographics, while Section 4 summarizes the responses
to the general questions about risks and the firms’ risk management programs. Section 5 discusses the responses
to questions for the specific risk areas and Section 6 analyzes the link between managerial and firm characteristics
and hedging policies. Some concluding remarks are offered in Section 7.
2. Survey Design, Sample and Survey Distribution
Our survey starts off with questions identifying the types of risks the respondent’s firm faces and
manages. If the firm indicates that they use financial derivatives there is a second section that with detailed
questions about their derivatives use and control. If firms do not use derivatives, the survey directs them to
questions investigating their non‐use of derivatives. The survey follows this “branching” method for all size area of
risk management.
The core of our sample is the firms that participate in the Duke Quarterly CFO survey. We also gained the
assistance of a few large trade organizations, the International Swaps and Derivatives Association (ISDA)
membership and the Global Association of Risk Professionals (GARP). Our initial sample list had over 50,000 email
addresses. This group included both private and public firms, non‐profit organizations and associations as well as
some government owned/controlled entities. The survey is anonymous and, hence, any demographic information
comes from our survey—not traditional sources like Compustat.
The survey was put on‐line and email requests were sent out the last week of February 2010. Subsequent
emails were sent out in March and the survey site was closed at the end of April 2010. In all we received 1,161
responses. Although this translates into a response rate of only about 2%, a large percentage of the original email
list consisted of people other than business risk management officers and so were not suitable participants. We
screened respondents who accessed the survey website and turned away those who indicated that they were not
involved in risk management at their firm or entity or were not at a business related entity (i.e., regulators or trade
3
associations). Nonetheless, with 1,161 responses, this is, to our knowledge, the largest collection of responses on
risk management ever collected.
With our survey consisting of eight sections, some with as many as 10 ‐12 questions, it would be too
burdensome to ask each respondent to fill out the entire survey, especially if they faced risk in each of the six
areas. As a result, we designed a randomization structure for the survey participants. All survey participants filled
out the general sections on risk management and derivative use or non use and the demographic section.
However, if they indicated that they managed risk in more than one of the six areas, we randomized which sections
(up to two) that they would have to fill out. To address survey fatigue, we also randomized the order in which the
sections were presented.3
3. Sample Characteristics
A demographic breakdown of the respondents is given in Tabl/e 1. The table shows the breakdown by
region (location of headquarters), basic industry by broad sector, size in terms of annual gross sales (in USD),
structure of ownership (whether publicly traded, privately owned, government owned or a non‐profit) and credit
rating (self reported). The sample is very diverse in all dimensions. Casual observation suggests that the response
group appears to be titled towards North American firms, financial firms, large firms, privately held firms and firms
with strong credit ratings, relative to overall population. However, given our large sample size we can study
various subsamples to assess any impacts on the overall results from any particular subsample of respondents. In
many cases, in addition to the overall top‐line results, we will try to show interesting differences between financial
and non‐financial firms as well as North American versus foreign (Rest of the World) firms.
4. Summary of Survey Responses for General Sections
4.1 Section with General Risk Management Questions
The first section was designed to identify the risks the firms face and manage as well as learn some features of
a given firms’ overall risk management program. We began by asking firms about whether they face “material” risk
3 There is no evidence that the order of the presentation of the sections affected the responses.

4
in each of the six following areas: interest rate (IR) , foreign exchange (FX) , energy (EN), commodity (CM), credit
(CR) and geo‐political (GP).4 Figure 1a shows that a majority of respondents report facing material risk in three of
the six areas , IR (71% of respondents), FX (63%), and CR (56%). EN, CM and GP were material risks for one‐third
or less of the respondents. Figure 1B shows the results of this question for two sets of subgroups: financial versus
non‐financial and North American versus foreign (Non‐ North American). Financial firms were notably more likely
to indicate material risk in IR (91%), FX (85%), and CR (85%), while relatively fewer non‐financial firms indicated
material risk in IR and FX (58% for each) and CR (40%). Slightly more non‐financial firms indicated material risk to
EN (35%) and CM (39%) than for the full sample. Geographically, while similar percentages of North American
firms and foreign firms felt material risk to interest rates (64%), the big difference is in FX where fewer North
American firms reported facing material risk (43%) compared to the foreign firms (69%). North American firms
reported slightly higher percentages of material risk in the other areas except for CR where more foreign firms
(57%) felt material risk compared to North American firms (44%).
For the firms facing material risk in a given area, we asked them to indicate whether they actively manage
this risk either through derivatives/other financial contracts or through the operational structure or decisions.
Figure 2 shows the percentage of firms facing material risk in each area that actively manage the risk in each
manner. Interestingly, operational risk management is used by more firms in all of the risk areas except for FX,
where the use of derivatives and financial contracts is more common. While derivatives/financial contracts are
used by more than half of the firms in only three risk areas, operational risk management is used by at least two‐
thirds of the firms in all of the risk areas. This suggests that risk management is more often done via operational
changes than through financial contracts.
For the subgroups, financial firms reported broadly similar results with CM in addition to FX risk being
more commonly managed with derivatives /financial contacts than operations (CM = 82% vs. 72%, FX = 82% vs.
64%). For non‐financial firms operational risk management is far more common than financial risk management in
all areas, with IR and FX being the only risks managed with derivatives / financial contracts by more than half of
the firms while 70% or more of the firms facing risks actively managed them through operations. Across the
4 We provided no definition of “material” risk, so firms made this assessment themselves.

5
board, the non‐financial firms are less likely than the financial firms to be using derivatives/financial contracts to
manage their material risks. Geographically, no differential patterns emerged as operational risk management was
more common than derivatives/financial contracts in all areas except FX.
Combining these two sets of responses, we determine the percentage of firms that indicate that they face
a material risk but do not indicate that they actively managed this risk. The survey responses suggest that in most
risk areas a relatively small percentage of firms indicate that they face a material risk do not (or did not tell us) that
they actively managed that risk. For FX risk, only 9% of firms indicate facing material FX risk do not indicate any
active risk management responses. This proportion trends up slowly and then balloons to 24% for GP risk.
Notwithstanding, the vast majority of firms facing a material risk have some sort of active risk management
strategy.
The next question measures the perception of how the level of risk in these areas is evolving. We ask the
respondents to indicate their perceptions of how the level of risk in the areas that they face material risk has
changed relative to 2006 (prior to the global financial crisis). Table 2 shows the responses. A majority of firms in
each risk category indicate that they perceive the level of risk as of the survey time (Spring 2010) to have increased
relative to 2006. Credit risk was perceived as having increased by the largest percentage of firms; not a surprise
given its role in the global financial crisis. On the other end of the spectrum, IR risk stood out with more than 20%
of respondents indicating that they perceived it had decreased relative to 2006. Financial firms were more likely to
have perceived risk increases in IR, FX and CR, while non‐financial firms report increases in EN and CM. There was
little difference in responses based on geographical breakdown.
The natural follow‐up question asks the respondents about the change in the degree or intensity of their
firm’s risk management activity over the same period. Not surprisingly, the responses are very similar, as most
firms responded to the perception of increased levels of risk with increases in the degree of risk management
activity. Only a small percentage of firms indicate that they reduced the intensity of their risk management
activity (in any of the areas) relative to 2006.
The final question on change was what impact the global financial crisis had on their firm’s overall
approach to risk management. The overwhelming majority of respondents, 81%, indicate that the crisis caused

6
them to pay more attention to risk management issues. This percentage was slightly higher for financial firms and
for foreign firms. Almost all of the rest indicated that it had no impact on their risk management activities.
In order to gauge which risk is the most important to these respondents we ask them to rank the top three
risks they face in order of importance. As displayed in Table 3a, in terms of the number of most important votes,
the top spot goes to CR with 26% of respondents indicating it is the most important risk they face. Interest rate
risk is a close second with 25% of the top spot votes and FX is third 20% of the top votes. The other three risks all
score low in top spot votes, with 15% or less of the firms ranking them as the most important risk.
This ranking of most important risk differs across the subgroups. Table 3b reveals that for financial firms only
two risks rank as highly important. Not surprisingly these are CR with 46% and IR with 37% of the top spot votes;
no other risk received 10% of the top spot votes from the financial firms. On the other hand, for the non‐financial
firms, FX risk has the most top spot votes (26%) with CM (19%) and IR (18%) next in line. As for the geographic
breakdown, more North American firms rank IR as the most important risk (29%) while foreign firms showed more
concern with CR (31%) and FX (24%).
We get a very different story in terms of importance when we consider the ranking of most important risk as a
percentage of just the firms indicating material risk in that area. Table 3a also shows the rankings for most
important risk conditional on just the firms facing material risk in that area. For the full sample, CR still comes out
on top, with 51% of firms facing credit risk indicating that CR is their most important risk, but the next highest
percentage goes to CM (44%) followed by IR (38%) and EN (37%). Clearly in these risk areas which are faced by a
smaller subset of firms, the firms are more likely to see that particular risks are their most important risk. This
pattern continues over into the subsample analysis as displayed in Table 3b. Credit risk (57%) and IR (42%) are still
most prevalent for financial firms under this measure, a majority of non‐financial firms facing CM risk (54%)
considered it their most important risk, followed closely by FX (48%) and EN (44%). Credit risk is also the top
concern among those facing this risk among the North American firms (56%), while for the foreign firms, nearly half
with energy risk exposure (41%) rated it their most important risk. In all cases, GP risk has the lowest percentage
of firms indicating it was the most important risk facing the firm. Thus although CR, IR and FX are the most
prevalent risks in the sample, in terms of concern, the CM and EN risks are equally if not more concerning to the
smaller set of firms that face material risk in these areas.

7
Beyond indentifying important risks, we also want to try to understand the firms’ purpose behind their risk
management program. In managing risk, each firm presumably has some set of goals or identifiable benefits in
mind that they are hoping to achieve through their risk management efforts. To gain some insight into what these
goals are, we provide 13 possible objectives for a risk management program drawn from theoretical and practical
sources, and ask the respondents to rate the importance of each goal, as well as identify the most important goal
with regard to their firm’s risk management policy.5 The responses for the full sample are provided in Panel A of
Table 4. The goals that frequently rate as very important are “avoid large losses from unexpected price
movements” with 50% of the respondents “increase firm value” with 41%, followed closely by “increase expected
future cash flows” and “shareholders expect us to manage risk” with 39% and 38%, respectively. In terms of goals
that frequently rate as “not important” are “increase the amount we can borrow” and “reduce cost of equity” with
23% and 22%, respectively, followed by “decrease the volatility of share price” and with 18%, and “reduce the cost
of debt” with 13% . No other goal received more than 10% “not important” votes.
In terms of the being rated as the most important goal of the firm’s risk management policy, the largest
percentage of firms, 18%, indicate that this is “avoid large loss from unexpected price movement”, essentially
highlighting the primary role of risk management as an insurance function. Other goals that rate 10% or higher in
the most important category are “increase expected future cash flow” (15%), “increase firm value” (14%), “ability
to pursue investment opportunities even in difficult times” (11%) and “increase reported earnings predictability”
(10%).
In terms of the subgroups, financial firms rank “avoid large losses from unexpected price movements” as most
important (24%) while non‐financial firms go with “increase expected cash flows” as the most important goal
(20%). The other interesting distinction in this breakdown is a notably higher rating as most important for “ability
to pursue investments even in difficult times” by the financial firms and a greater emphasis on “reduce operating
cash flow volatility” as most important by non‐financial firms. The differences are less notable in the North
American and foreign firm breakdown. Foreign firms have a higher percentage rating “avoid large loss from
unexpected price movement” as most important than North American firms, while the opposite is true for
5 The rating scale was “Very Important”, “important”, “Somewhat important”, and “Not Important”

8
“increase expected future cash flow” and “improve corporate decision making environment”. This suggests that
North American firms are focused on the general benefits of volatility reduction more so than the insurance impact
against losses from an unexpected price change. Panel B of Table 4 shows the results of the most important votes
for the various goals/objectives methods by subgroups. The patterns are reasonably similar to the overall results,
with the exceptions that financial firms are more keyed into “avoiding losses from unexpected price movements”
while non‐financials are more into “increasing expected future cash flows”. Geographically the differences in votes
are quite minor.
We move onto a set of questions about the firm’s risk management program structure. The first question is
whether the firm has a formal documented risk management policy. Of the 1,110 responses, 65% of the firms
indicate that they do have a formal documented risk management policy, while 35% indicate that they did not.
These proportions are driven largely by financial firms of whom 87% have a formal documented policy and foreign
firms of whom 73% have a formal documented risk management policy. Surprisingly, 47% of non‐financial and
44% of North American firms report not having a formal documented policy regarding their firms risk management
activities. 6
Another important issue with respect to a risk management policy is how frequently results are reported
to and reviewed by oversight bodies within the firm. We asked he respondents whether their firm has a regular
schedule for reviewing and reporting its risk management strategy. Seventy‐two percent indicate a regular
schedule, of which 90% are firms that had indicated above that they have a formal documented risk management
policy. In terms of the frequency of this reporting, the most commonly reported frequency is quarterly (43%),
followed by monthly (27%) and annually (13%). Results on subgroups are generally similar. Financial firms have a
significantly higher percentage of firms with a regular reporting schedule and there is a slight shift towards more
frequent reporting periods.
Academics have developed a variety of economic explanations for why firms should manage risk. One set
of these relate to the hedging for the purpose of avoiding market imperfections in the financial markets related to
6 This contrasts with the 79% of US non‐financial firms that indicated having a formal documented policy regarding the use of derivatives from the Wharton risk management survey done in late 1997/early 1998. (Bodnar et al, 1998).

9
financing investments or obtaining liquidity. To investigate the extent to which practitioners think in a similar way
we ask a few specific questions about whether risk management is done with any thought towards funding
investments or the access to liquidity. The first question asks whether risk management decisions are made to
enhance the firm’s ability to fund attractive investment opportunities. Forty‐six percent indicated that it is and
54% indicated that it is not, suggesting that a majority of firms do not focus on any link between risk management
and future financing challenges. Only for financial firms did a majority (57%) indicate that such a link was
important. In a follow up question, of the 46% of the full sample indicating that risk management did involve some
thought to the firm’s ability to fund future investment opportunities, 49% indicate that risk management helped
better match the availability of internal funding sources to the need for funds to make investments, while 27%
indicate that risk management helped better match their access to external funding sources to the need for funds
to make investments, and the remaining 24% indicate that the risk management helped reducing the cost of the
external funding for investments. These proportions do not differ substantially across the subgroups.
It is well known that a good substitute for active risk mitigation is access to a large pool of liquid assets. As
such we ask firms whether the size of their surplus cash holdings or access to guaranteed lines of credit influence
the breadth or intensity of their risk management activities. Once again, the majority of firms (56%) said that their
cash positions or access to lines of credit have no impact on their risk management policy. Interestingly, of the
firms that did indicate an effect, a follow up question indicates that both greater surplus cash holdings and access
to guaranteed lines of credit result in an increase in breadth or intensity of risk management activities for a larger
number of firms than result in a decrease. Again, these results are quite uniform over the subgroups.
In two final academic‐driven questions on general risk management, we ask the firms for their view on the
breakdown of the risk reduction from their risk management activities between idiosyncratic risk (risk which is firm
specific and uncorrelated with priced risk factors), and systematic risk (risk which is common across assets and
carries with it a risk premium in terms of expected return). Interestingly, the average breakdown is that the risk
reduction is 58% systematic risk and 42% idiosyncratic risk. Surprisingly these averages did not vary much across
the subgroups. This is interesting as with the exception of CR, most of the risks that firms are managing have
exposures that are relatively firm‐ specific and do not have significant risk premium in terms of the hedging costs.
The other academic question relates to the assumptions firms most commonly make about the future price

10
distribution when assessing future outcome risk from an exposure (e.g., as part of a Value at Risk exercise or a
spreadsheet simulation). We offered a series of likely responses. The responses are displayed in Table 5. The
most common response is use of a simple normal distribution with a mean and variance based upon historical data
(28%). This is troubling as we know the tail issues are a critical issue in risk management. Equally worrisome is that
assuming a normal distribution with the mean and variance taken from some other source was the selection of
another 21% of respondents. Nineteen percent of the respondents indicate that they modify a normal distribution
to worry about fat tails, while another 16% used a non‐normal distribution with fatter tails and potential skewness.
Finally, 13% let the data define an arbitrary distribution and 3% do something akin to a combination of these
methods. So despite what the recent financial crisis taught use about simple distributional assumptions, nearly
50% of the respondents indicate that they basically use a normal distribution when doing simulations involving
future financial prices.
To end this section on general risk management activity and transition into the next section on use of
financial derivatives, the survey asks firms whether they use financial derivatives (specifically forwards, futures,
options, and/or swaps) in their risk management program. Panel A of Table 6 shows the results for the full sample.
For the full sample, 64% of the respondents indicate that they used financial derivatives in their risk management
program.
Since this is probably the most commonly asked question in risk management surveys, we consider a
variety of cross tabulations of this result with our firm demographics. Panel B of Table 6 shows the cross tabulation
of the responses by geographic location of headquarters and economic sector, with the non‐financial sector also
broken down into primary product, manufacturing and service sectors. Financial sector firms report derivative
usage as part of their risk management strategy in much higher proportions (78%) than the non‐financial firms
(56%). This is not surprising given that a good portion of financial firms are likely in the business of dealing in
financial derivatives both for their own risk management as well as part of their business. Geographically, foreign
firms report derivative usage at a 10% higher proportion than the North American firms (68% vs. 58%). These
results are consistent with findings of previous surveys. Derivative usage in European countries has typically been
much higher than in the United States (see, e.g., Bodnar and Gebhardt (1999) and Bodnar, de Jong and Macrae
(2003)). In the cross tabulations, prevalence of financial derivative use is highest amongst foreign financial firms at

11
81% and lowest amongst the North American non‐financial firms at 56%. This latter number compares closely with
the findings in Bodnar et al. (1998) which reports that derivative usage amongst US non‐financial firms in the
1990’s varied between 35 – 50%. Slightly more than a decade later, the derivatives usage rate for nonfinancial –
North American firms in our sample is 54%.
The pattern of usage across the non‐financial sectors is also consistent with the earlier survey findings.7
Usage is most prevalent in the primary products sector (basic materials, utilities, transportation) with 71% of firms,
followed by the manufacturing sector with derivative usage by 67% of firms, and the service sector firms reporting
only a minority of firms (46%) using derivatives as part of their risk management strategy. The differences in these
results on a regional basis are relatively minor. The only exception is that the proportion of foreign service‐sector
firms using derivatives is nearly 10% higher than the percentage of North American service‐sector firms using
derivatives.
In Panel C of Table 6, the usage of financial derivatives is broken down by firm size, measured in USD
sales. The results reveal a perfectly monotonic relation between the six firm size groups and the percentage of
firms in each group that use financial derivatives. Amongst the smallest firms, those with sales of less than
USD25M, only 35% used financial derivatives, with the percentage growing consistently as we move up the size
groupings. Amongst the firms in the largest size grouping, those with sales of more than USD5B, 85% indicate that
they use financial derivatives. This finding matches the common finding in previous studies in that firm size is
positively related to the likelihood of using derivatives.
In the last two panels of Table 6 we show the proportion of firms indicating derivatives use by ownership
form of the business (Panel D) and credit rating (Panel E). As for ownership structure, we ask respondents to
classify their firms into one of four classes of ownership: publicly traded, private, government owned, or non‐
profit. The results suggest that this is an important characteristic in explaining whether the firm uses derivatives.
It turns out that use of derivative use is most prevalent amongst the publicly traded firms at 78%, with government
owned firms next at 70%. Privately held firms are notably less likely to use derivatives with only 53% indicating use
while non‐profits report the lowest proportion of use at 43%. As for credit rating, of the 917 firms that provided
7 See, e.g., Bodnar et al (1996)

12
this information, there is an interesting relation between the derivative use and credit rating. All of the firms with
ratings BB and above use derivatives in greater frequency than the sample as a whole. Interestingly the heaviest
percentage users are the bottom two groups in this category, BBB and BB at 73% and 76%, respectively. Firms
rated less than BB as well as those that indicate they are not rated are less likely to use derivatives at 57% and 47%,
respectively.
The survey concludes the first section with a question only for those that indicated that they did not use
financial derivatives in their risk management program. Non‐users are asked to rank the top three reasons they
did not use financial derivatives from a pre‐selected list. Table 7 displays these results. Three of the eights choices
provided garnered most of the responses for the top reason. The most important reason with 34% of the most
important votes is that the “firm’s exposure to the financial price risk was not sufficient to warrant using
derivatives”. This is followed with 31% of the top votes by the equally rational “exposures are more effectively
managed by other means”. The other top vote getter, with 25% is the individual cost‐benefit assessment by the
firms that “costs of establishing and maintaining a derivatives program exceed the expected benefits”. Among the
firms that selected “other”, as the most important reason for not using derivatives, the reasons provided most
commonly relates to lack of a local market for derivatives, legal restrictions against holding derivatives, or a lack of
expertise with derivatives. The choices that relate to outside perception or issues with pricing, accounting or
disclosure requirements appear to be much less of a deterrent to firms using derivatives in their risk management
program. Results by sector and geographic area are again quite comparable.
4.2 Section with Questions on the Use of Financial Derivatives
Having identified the firms that use derivatives in their risk management program the next section of the
survey asks this group specific questions about their derivatives usage and control policy. The first question we
look at this section is what concerns firms have about their derivative usage. This question is based closely on a
similar question asked in the Wharton surveys more than a decade ago so we can explore how the answers have
evolved over time. The survey provided seven areas of concern regarding the use of derivatives and asked the
firms to rate them as being either a high concern, a moderate concern, a low concern, or no concern. The
responses to this question are displayed in Panel A Table 8.

13
The results suggest that “market risk (risk of unforeseen changes in the value of derivatives)” and
“counterparty credit risk related to derivatives” are the two issues with the largest percentage of firms indicating
high concern at 49% and 31 respectively. Interestingly all of the issues are rated as a moderate concern by
between 30 and 40% of the respondents with monitoring and evaluating hedge results getting the highest
moderate concern rating of 41%. At the low end of the concern spectrum, more firm indentified “reaction by
analysts or investors”, “disclosure requirements” and “accounting treatment” as the areas of either low or no
concern. The last column of Panel A shows a weighted average level of concern score for each issue related to
derivative use. The score is based upon a scale of a 4 being high concern and a 1 being no concern. Clearly
“market risk of derivative values” is the area of concern with the highest overall score thus being the most pressing
concern related to derivatives usage for these firms. The score for “reaction by analysts or investors” is the lowest
suggesting that this is the least important concern related to derivative usage for these firms.
Panel B of Table 8 shows the score for each are of concern by the two different subgroupings. While the
rankings of concerns across these groups are similar to the full sample, the scores for the financial firms are
notably higher than for the non‐financial firms, suggesting a higher average level of concern about these issues
associated with derivative usage for financial firms than non‐financial firms. Similarly the North American firms
have a lower score for each concern in comparison to the foreign firms.
Because this question is identical to one asked in the 1998 Wharton survey of US non‐financial firms, it is
interesting to compare the results for similar groups. The Wharton 1998 survey showed a plot of US non‐financial
firms indicating higher or low levels of concern for each of these areas related to derivative use. In Figure 3 we
produce a similar plot for our sample using only the North American non‐financial firms as a comparable sample
and show this plot against the plot reported in the Wharton 1998 survey report as a comparison of how levels
concern about these issues associated with derivative use have changes over time. Two things jump out from
Figure 3. First the percentage of firms reporting high concern about any of these areas today is lower than in 1998
and in most cases the percentage of firms reporting low concern is higher than in 1998. This suggests that the
overall level of concern about derivative issues is lower today than in 1998. Second, in 1998 accounting treatment
as was monitoring and evaluating hedges were big concern (with more high concern votes than low concern
votes).

14
Another question in this section is whether the global financial crisis of 2008/09 with its underpinnings of
collateralized debt obligations and credit default swaps had any impact on their firm’s use of financial derivatives.
Overall the impact was quite minimal. Of 624 respondents, 27% indicated that the crisis caused them to decrease
their usage, while 23% said that it caused them to increase their usage. The rest of the firms (50%) indicated that it
had no effect on their use. There was little difference across sub groups: financial firms were more likely to
indicate that it caused them to decrease usage (35%) relative to increase usage (28%) while non‐financials were
evenly split at 20% increase and 20% decrease. Geographically a majority of foreign firms were more affected but
with decreases (36%) outpacing increases (29%), while North American firms were again slightly more likely to
decrease than increase (24% vs. 20%). Overall, it appears that the crisis did not have a significant impact on firm
derivative usage.
We next move on to ask some questions related to the oversight and control of derivatives positions
within the firm. We asked both about the frequency with which the financial derivatives contracts were valued
and the source of the valuation information. In addition we asked to whom within the firm the information about
derivative positions is reported. As shown in Table 9, the most common frequency for valuation of derivative
positions is daily and monthly. These two horizons are driven almost completely by the industrial sector of the
firm. Financial firms predominantly (63%) value their positions daily, while the most common horizon for non‐
financial firms is monthly (42%). About 11% of the firms report having no fixed schedule for valuation of financial
derivatives, again with this skewed more towards non‐financial than financial firms. There is relatively less
difference in response patterns on a geographic basis, with foreign firms tending towards more frequent valuation.
When asked to identify the main source of information for valuation (or re‐valuation) of their derivative
positions, 38% of the firms indicated they used the original derivatives dealer, 33% indicated that they did the
valuation themselves internally while 27% indicated that they used some other deal than the originating dealer.
Only 2% of the firms indicated that their main source of information for re‐valuing derivative positions was some
other source, and these tended to be some other outside source such as Bloomberg or some other market data
provider or an outside custodian.
The other question in this set is to whom within the firm is information about the derivatives activity
reported. The survey offered the choices of the senior management of the firm, the Board of Directors, or some

15
other group, and allowed for multiple choices if appropriate. For the full sample, of the 579 responders, 81%
indicate they report activity about their financial derivatives positions to the senior management, with 50%
reporting only to the senior management and 29% also reporting to the Board of Directors. While 46% indicated
that they report to the Board of Directors 13% did so exclusively. Only 6% of respondents indicated reporting on
financial derivative activity to some other party or parties.
The final set of questions in this section relate to the firms’ actual or potential reaction in terms of
derivative usage to some regulatory rules that have occurred or are being considered in light of the recent financial
crisis. Currently, both the FASB standards in the US and the IFRP standards globally mandate that the firm carry
out periodic tests on the effectiveness of their derivative position as hedges of the underlying exposure. We asked
the firms if such tests have results in any impact on the amount their companies use financial derivatives. For the
vast majority (76%) of the 596 respondents these mandated tests have had no impact on the firms’ use of financial
derivatives. However, 16% of the responding firms indicated that they had reduced their use of financial derivative
contracts as a result of these hedging effective tests. When we pressed these firms who decreased derivative
usage to indicate the impact on risk management, about 60 % indicated that the end result of the reduction in the
use of derivatives was an overall decrease in hedging activity while 40% indicated that it results in their using more
non‐financial hedging methods. The pattern of responses to the entire question is very similar across the sector
and geographic subgroups. Overall these results suggest that the mandated hedging effectiveness tests had only a
mildly negative impact on overall risk management with only about 10% (60% of 16%) of firms reducing their
overall hedging activity as a result.
The other two questions relative to possible changes in derivative market rules that may come about as a
result of regulatory changes imposed upon the derivatives market as a result of post‐financial crisis legislation.
One of these possible changes is restrictions on customized over‐the‐counter derivatives and a move to all
standardized, exchange‐traded contracts. As displayed in Panel A of Table 10, a majority (54%) of the 604
respondents indicated that a restriction on OTC derivatives with replacement by standardized exchange‐traded
contracts would result in no change in their derivative usage. While a small percentage (10%) indicated that such a
move would increase their use of derivatives, the more interesting result is that 32% of firms indicated that such a
regulatory change would reduce their use of derivatives with 3% (19 firms) indicating that such a change would

16
cause them to discontinue use of derivatives entirely. In looking at the sub groups, financial firms showed a
greater propensity to react to such a policy change with both a higher proportion indicating increased (15%) and
decreased (43%) usage of derivatives in response. Non‐financial firms were more relaxed, with 66% indicating that
such a policy change would not impact their derivative usage and just 24% indicating that they would decrease
derivative usage. Geographically, the North American firms were less reactive than the foreign firms. There was
very little variability across any of the subgroups in the percentage of firms that would discontinue their derivative
use entirely in response to a restriction on OTC instruments.
Panel B of Table 10 shows the responses to the second policy question: If your firm were required to post
cash collateral or to post more collateral than has traditionally been required against all over‐the‐counter
derivatives, what would be your most likely response? Firms appear to be much more sensitive to this issue in
terms of its impact on their derivative use. For the full set of respondents, 52% indicated that having to post
collateral on OTC instruments or post more collateral that traditionally has been required would result in a
decrease in derivative usage. In addition, 7% indicated that such a move would cause them to discontinue
derivative use entirely. Only 35% indicated that such a policy would have no effect on their usage. So in
comparison to a policy of restricting OTC instruments in favor of exchange‐traded instruments, far more firms
indicates that they would react negatively (be decreasing or quitting derivative use) to a policy of imposing or
increasing cash collateral on OTC instruments.8 Interestingly, when looking at the results by subgroups, the
negative reaction is more intense in the non‐financial firms (64% reacting with decrease of discontinuation of
derivatives) than the financial firms (53%), and also more intense amongst North American firms (64%) than
foreign firms (56%). Hopefully regulators will consider this issue carefully as imposing such a rule could reduce the
degree to which firms actually manage their risks.
5. Summary of Responses for Management of Specific Risk Areas
In the remainder of the survey we asked sets of specific questions about the management of areas of risk
the firm indicated they faced. For these sections, in order to reduce survey fatigue for firms that faced more than
8 As we shall see later, this may be related to the fact that a majority of firms prefer OTC instruments to exchange traded ones.

17
two risks, respondents were randomized as to which risk section they were asked to respond, so the sample sizes
for these sections are smaller than the number of firms that indicated that they faced that risk.
5.1 Interest Rate Risk Management
The first risk area whose management we investigated is interest rate risk. The firms that where eligible
to respond to the questions in this section where those that had indicated that they faced material interest rate
risk in the earlier section. In principle all of the firms responding to these questions faced interest rate risk. In total
there were 666 firms that saw the questions in this section.
To begin we wanted to get an idea of how large firms believed their risk to interest rates to be and how
effective they believed their management program to be in reducing this risk. To do this we asked a series of
questions requiring the respondents to estimate the size and direction of the impact of a sudden 100 basis point
rise in interest rates on their firm’s value both with and without their current interest rate risk management
strategy.9 Table 11 shows the results of these questions. The first column of numbers shows the distribution of
responses for the impact of the 100 basis point increase in interest rates on firm value assuming that the firms had
no risk management program in place. Of the 410 responses, 54% indicated that the sudden interest rate increase
would have a negative impact on firm value. The average estimate of this negative impact was ‐13.9%. In contrast,
only 5% of the firms indicated that they believed the interest rate risk would increase their firm value. The average
estimate of the increase was 15.4%.10 Surprisingly, 41% of the respondents indicated that the sudden rise in
interest rates would have no impact on firm value, even without any risk management policy in place.
To gain some insight into the impact of the firm’s IR risk management strategy, we also asked firms to
estimate the change in firm value resulting from the sudden interest rate rise given their current IR risk
management program. These results are displayed in the top row of Table 11. The first result to note is that some
9 Note the focus on the impact on firm’s value is intended as a generalization of all of the impacts of the risk (or its elimination of the firm. This requires the respondents to estimate the impact of risks and risk management (net of cost) on firm value. It is possible that non traded firms do not think about exposure with respect to firm value and are biased towards answering no change in value to this question. Tabulations, not shown, do not support this claim as the ratio of unhedged positive, no change and negative responses to the interest rate rise are roughly similar for publicly traded firms versus non‐traded firms. 10 These are supposedly firms that are positively exposed to interest rate fluctuations as evidenced by the negative change in firm value response due to hedging. .

18
firms hedging programs appear to be to be effective at eliminating the exposure as now 61% of the firms that
respond indicate that the interest rate change would have no impact on firm value. With hedging, only 30% of the
firms still indicate that they would experience a decrease in firm value, with the average decrease being ‐9.5%.
With their IR risk management programs, a somewhat larger 9% of respondents indicate the interest rate rise
would lead to an increase in firm value, with the average increase being 10.9%.
To estimate the impact of the firm’s IR risk management program, we examine the conditional responses
of the firms that replied to both questions and measure the average change in the impact of the interest rate rise
on firm value. These tabulations are shown in the bold box in the lower right corner of Table 11. In addition to
showing the number of firms with the conditional value responses, the cells show the average of the difference in
this impact of the 100 basis point rise in interest rates on firm value between the case with the firms’ risk
management program and the case where the risk is not managed at all (hedged impact minus unhedged impact).
So for example, consider the center column of the bottom row which shows 67 and [9.1%]. These
numbers mean that 67 firms indicated that the interest rate rise would decrease firm value with no risk
management program and would result in no change in firm value with its risk management program. The 9.1%
number means that for these 67 firms the average expected impact of the interest rate rise on firm value with
hedging is 9.1% more positive (less negative) than without hedging (in this case hedging reduced the impact of the
interest rate rise on firm value from an average of ‐9.1% to zero for these firms). Looking at the lower right cell in
the conditional table suggests that for the firms that claim to be negatively affected by the interest rate rise
without any risk management program the majority are still negatively affected with even their risk management
program, though the negative impact on these 104 firms is 7.7% less than with no hedging. In addition to the 67
firms that feel that they completely hedge their underlying downside exposure to the interest rate rise, there are
17 firms that believe that their IR risk management program actually results in their firm switching to where it
gains from the interest rate rise. For these firms the hedging policy changes the impact of the depreciation on
firm value by over 20%. Of the 20 firms that were positively affected by the interest rate rise, even after allowing
for their hedging program, 16 of these firms indicate that they would still be positively impacted, though the
average impact on firm value is 2.1% smaller than without their hedging programs. Overall, the table appears to

19
support the view that firms’ interest rate risk management programs are reducing the impact on firm value of
sudden changes in interest rates.
To investigate what kinds of exposure firms are managing with interest rate derivatives, we asked firms to
indicate how frequently they used IR derivatives to accomplish certain interest rate risk management activities.
We selected four common purposes for interest rate derivative transactions and asked them to indicate if they did
these transactions “frequently”, “sometimes”, or “seldom/never”. Table 12 displays the sum total percentages of
“frequent” and “sometimes” responses for the full set of 502 firms that responded to the questions as well as their
breakdown into financial and non‐financial subgroups. The table reveals that for all respondents, entering
contracts to swap from floating to fixed interest rates was the most common IR derivative activity with 58%
indicating they do so frequently or sometimes. The other activities: swap from fixed rate to floating rate, fix in
advance the rate or spread on new debt, and reduce or lock in a rate based upon a market view were done
frequently or sometimes by about 45% of the respondents. The breakdown of the sample into financial and non‐
financial firms shows several interesting distinctions. First of all, financial firms are much more likely to use IR
derivative frequently or sometime to do almost all of these activities than non‐financial firms. Second, financial
firms are most likely to swap from fixed for floating rate than non‐financial firms (68% vs. 25%), consistent with
their activity of extending fixed rate loans to non‐financial customers and then deal with the interest rate risk by
swapping into a floating rate.
The next question was to identify which interest rate contracts/positions the firms are using to manage
their interest rate risk. We provided seven different IR derivative contracts and one operational activity commonly
used to mange IR risk and asked the respondents to indicate if they used any of these to manage their interest rate
risk. We also asked them to indicate their most used contract or activity. Again, Table 13 shows the responses to
these questions for all 514 respondents as well as the financial and non‐financial firm breakdown. Not surprisingly,
the interest rate swap received the largest percentage of firms indicating usage at 67%. A distant second were
forward rate agreements with 45% of firms indicating use, and then another large drop to 32% of firms varying the
maturity of debt as a risk management technique and 30% indicating use of interest rate futures and 26%
indicating use of option combinations (i.e. caps and collars, etc.). Less than 20% of respondents indicated use of
interest rate swaptions (18%), exchange traded IR options (14%) and OTC IR options (13%). In terms of most

20
common, the column displays the percentage of firms indicating use of a position/activity that voted it as their
number one most commonly used method.11 The ranking of top methods is very similar to the overall usage
ranking.
In looking at the distinction between financial and non‐financial firms, financial firms were much more apt
to use swaps and interest rate futures than non‐financial firms. However, non‐financial firms were much more
diverse in their choices for most‐used as evidenced by the higher percentages down this column as compared to
the financial firms most‐used column. This pattern of top choice in conjunction with the lower percentages in the
use column, suggest that non‐financial firms are more likely to have picked a particular method for managing IR
risk and stick to it as their most used method.
Given the broad nature of our sample, an interesting question to ask derivative users is about their mix of over‐
the‐counter and exchange rated instruments in the firm’s derivatives portfolio. Table 14 shows responses when
the respondents were asked to indicate their mix. For all 498 respondents, 35% use only OTC IR instruments with
another 25% using mostly OTC instruments. A mere 12% indicated that they had a roughly equal mix between the
two while only 13% indicated that they used only exchange‐traded instruments. Results for the sub groups were
relatively similar, though non‐financial were much more likely to be with OTC only or exchange‐traded only while
financial firms were more likely to use some combination of the two. Interestingly North American firms were
more than twice as likely to use exchange‐traded only derivatives as compared to foreign firms (19% vs. 8%). With
regard to the OTC interest rate instruments, we also asked whether they were generic or bespoke. Across the
board, it was about an 80‐20 split: 80% of the OTC instruments were generic (i.e., plain vanilla) and about 20% of
the OTC instrument were bespoke (i.e., custom made).
With regard to measuring the success of the firm’s interest rate risk management policy, we asked firms
about the benchmark used for evaluating their risk management performance. We offered five possibilities, three
involving a cost of funds measure and one a volatility measure along with an “other” option as well as a chance to
indicate the they do not use a benchmark. The results are displayed in Table 15. The most common choice (43% of
firms) was to compare their cost of funds relative to a benchmark (such as LIBOR). The next most common choice
11 To determine the percentage of total respondents that ranked a particular method as their number one choice, simply multiply the use percentage and the ranked most used percentage.

21
(for all columns except for the financial firms) was that the firm did not use a benchmark, which leads one to
wonder how the firms evaluate IR risk management. The cost of funds relative to a target portfolio (specific fixed
to floating ratio) was third while the duration targeting and volatility of interest expense were least commonly
used. Results were basically similar across the subgroups though foreign firms were greater users of the target
(fixed/floating) portfolio while financial firms were more likely to use a duration target portfolio.
The final questions were whether the shape of the home currency’s yield curve impacts the size or
amount of the firm’s interest rate hedge positions and how important the firm’s forecast/outlook for interest rate
is for the extent the firm hedges IR risk. As displayed in Panel A of Table 16, 57% of the 553 respondents indicated
that the shape of the yield curve does impact their interest rate hedging. These firms were predominantly financial
firms or foreign firms, as less than 50% of the non‐financial and North American firms indicated that the shape of
the yield curve affected their IR hedge positions. Panel B of Table 16 shows a similar story for the importance of a
market view on interest rates for IR hedging decisions. Of the 4 possible responses, the table shows the
percentage of firms indicating very important and important versus the percentage of firms indicating somewhat
important or not important. For the 561 firms responding, 60% indicated that their market view on interest rates
was very important (18%) or important (42%) for the extent to which they hedge or manage IR risk. Looking at the
breakdown across subgroups again we see that financial firms are much more likely to have their forecast of
interest rates influence their IR hedging than non‐financial firms. As with the yield curve, foreign firms again
showed a slightly greater tendency to take their market view into account relative to North American firms.
5.2 Foreign Currency Risk Management
This section was viewed by the set of firms that indicated that they faced material FX risk and that they
managed that risk by either financial or operations means. Of this group, 540 firms responded to at least one
question in this section.
We begin the FX section with the same type of question as we began the IR section. To get an idea of how
large firms believe their risk to foreign currency interest rate changes to be and how effective their management
program as in reducing this risk, we asked the same series of questions as before asking the firms to estimate the
size and direction of the impact of 10% decline in the value of their home currency (relative to all other currencies)

22
on their firm’s value both with and without their current foreign currency risk management strategy. Table 17
shows the results of these questions in the same fashion as Table 11 did for IR risk. The first column of numbers
shows the distribution of responses for the impact of the 10% decline in the value of the home currency on firm
value if they did not manage or hedge their FX exposure. Of the 345 responses, a surprising 45% indicated that the
home currency depreciation would reduce the value of their unhedged firm, suggesting that they these firms have
an inherently short foreign currency exposure. The average estimate of the value impact for these firms is ‐11.9%
from the 10% home currency depreciation, suggesting a relatively large FX exposure. Another 15% of the
respondents indicated that the home currency depreciation would increase the value of their unhedged firm
suggesting along foreign currency exposure. The average estimate of this increase was 9.8%. Interestingly, 40% of
the firms indicated that even without their risk management program the impact of the exchange rate change on
firm value would be essentially no change. This could be because they actually have a very small exposure or that
they have different exposures to various currencies that offset one another so the overall effect of a 10%
depreciation of the home currency is close to zero.12
To assess the impact of the firm’s FX risk management strategy, we also asked firms to estimate the
change in firm value resulting from a 10% home currency depreciation given their current FX risk management
programs. These results are displayed in the top row of Table 17. Again we note that that some firms’ FX hedging
programs appear to be to be effective at eliminating the exposure as now 50% of the responding firms indicate
that the home currency depreciation would have no impact on firm value with their FX risk management program.
Even with their hedging program, 31% of the firms still indicate that they would experience a decrease in firm
value, with the average decrease being ‐7.7%. On the other hand, the presence of the FX hedging program raises
the percentage of firms that would experience an increase in firm value due to the home currency deprecation
from 15% to 18%., with the average increase for these firms being 7.9%.
12 These proportional are essentially defining the firm’s perception of the size and sign of its foreign currency exposure with respect to firm value. It is possible that non‐publically traded firms do not thing about exposure with respect to firm value and are biased towards answering no change in value to this question. Tests, not shown, do not support this claim as the ratio of unhedged positive, no change and negative responses to the 10% home currency depreciation are roughly similar for publicly traded firms versus private firms.

23
To estimate the average value impact of the FX risk management programs, we examine the conditional
responses of the firms that replied to both questions and measure the average change in impact of the home
currency depreciation on firm value. These tabulations are shown in the bold box in the lower right corner of Table
17. In addition to the number of firms with the conditional value responses, the cells show the average of the
difference of the impact of the 10% home currency depreciation on firm value between the case where the risk is
managed and the case where the risk is not managed (hedged impact minus unhedged impact).
Consider the center column of the bottom row which shows 32 and [6.5%]. These numbers mean that 32
firms indicated that the home currency deprecation would decrease firm value with no risk management program
and indicated that the home currency depreciation would result in no change in firm value with its risk
management program. The 6.5% number means that the impact on firm value with hedging was 6.5% more
positive that without hedging (in this case hedging reduced the impact of the depreciation on firm value from an
average of ‐6.5% to zero for these firms). Overall, the conditional section of the table suggests that for the firms
that claim to be negatively affected by a home currency depreciation without any risk management program the
majority are still negatively affected with their risk management program, though the negative impact on these
104 firms is 5.9% less than with no hedging. In addition to the 32 firms that feel that they completely hedge their
underlying downside exposure to the home currency depreciation, there are 10 firms that believe that their FX risk
management program actually results in their firm switching to where it gains from the 10% home currency
depreciation. For these firms the hedging program changes the impact of the depreciation on firm value by over
15%. For the 51 firms that believe that the home currency depreciation is inherently good for firm value, only 6 of
these firms believe that their hedging program makes their firm value unaffected by the depreciation. For these
firms the impact of the hedging is to reduce the impact on the depreciation on firm value by an average of ‐5.0%.
The vast majority of positively exposed firms remain positively exposed even with their risk management program,
though the FX risk management program reduces the impact of the depreciation by 2.5%. Again, the table appears
to support the view that firms’ FX risk management programs are reducing the impact of FX fluctuations on firm
value.
We next moved to looking at FX derivative usage, both in terms of what firms are using FX derivatives for
and which FX derivatives they are using. Table 18, shows the percentage of respondents that indicated that within

24
the past three years they have “frequently” or “sometimes” used FX derivatives to manage various different
sources of FX risk. For the 459 firms that responded, with the exception of anticipated transaction in more than
one year, all of the other sources of risk have a majority of firms indicating that they frequently or sometimes have
used FX derivatives in the past three years to manage these risks. The highest percentage of (76%) firms indicated
recorded commitments (i.e., booked transaction such as receivables and payables). This is consistent with most
prior studies looking at FX risk management in that simple transaction exposure is the most commonly hedged FX
exposure (see .e.g., Bodnar et all (1999)). Also popular for FX derivative usage is anticipated transaction with in the
year, identified by 70% of firms. Obviously the one‐year horizon plays some important role as the anticipated
transactions in more than one year had the lowest percentage of votes (48%).
Looking at the responses by subgroups, there are a few interesting features. Financial firms are more
likely to use derivatives to hedge anticipated transaction in more than one year compared to non‐financial firms,
while foreign firms are much more likely to use derivatives to hedge contractual commitments (unbooked
contracts) as compared to North American firms. The North American firms are most likely to be using derivatives
on a regular basis to hedge foreign repatriations.
A related question regarding the FX risk areas that has been asked in previous surveys is what percentage
of the exposure in each area does the firm hedge. Past surveys have found that these percentages seldom higher
on average than 50%13. The results for our firms are shown in Figure 4. With 138 firms responding, the results
here are similar to previous finding. Only for recorded commitments is the percentage of exposure hedged greater
than 50%.14 Other than this the average percent of these other exposures that gets hedges is around 45%, with
the exception of anticipated exposures in more than one year where the average amount hedged is just over one
quarter of the size of the exposure. Obviously complete hedging is not a high priority for these firms. It would
appear that hedging is done to reduce the exposure to a low enough level where it can be comfortable tolerated
by the firm.
13 See e.g., Bodnar et al (1999) 14 The percentage excludes firms that entered zero percent and did not indicate that they used derivatives for this risk source in the previous question.

25
Table 19 shows the results of the question asking firms which types of FX contracts and or positions they
use to manage their FX risk. The survey offered nine possible forms of derivative contracts and other FX positions
and asked the firm to indicate all that apply to their risk management program. Panel A of Table 18 shows the
percentage of firms that indicate they use each choice, and Panel B shows the percentage for users of each choice
that rank that that choice as the number 1 most used contract or position in their FX risk management program. In
terms of percentage of firms using, by far and away the winner is the simple FX forward contract. 64% of firms
indicate that they use forward contracts in their FX risk management program. Only three other contracts
/positions were selected by more than 30% of the firms, these are cross currency swaps (38%), futures contracts
(32%), and money market deposits/loans (31%). The only other choice that had more than a 20% response rate
was foreign currency debt financing at 27%. All the other choices, exchange‐traded options, option combinations,
OTC options and non deliverable forwards had usage rates of 17% or less.
In terms of subgroups the results suggest that forwards top every group’s list as the most used instrument
in FX risk management. Beyond this, financial firms are generally users of more contracts/positions instruments
than non‐financial firms and substantially more financial firms use cross currency swaps, futures contracts and OTC
options than do non‐financial firms. Geographically the differences are less substantial, but foreign firms are more
likely to be users of money market hedges, OTC options and non deliverable forwards as compared to North
American firms.
In Panel B of Table 19 we see the percentage of users of each FX contract or position that rated it as their
most commonly used instrument. Once again, the forward contract is the big winner. 75% of the users indicated it
as their most common contract. Other contracts or positions that were frequently rates as number one by their
users include foreign currency debt financing (42% of users), money market hedging (37%) and cross currency
swaps (31%). Interestingly, even 7 of the 64 users of non deliverable forwards (11%) rated this instrument as their
most commonly used contract for FX risk management. Conditionally, the results are again relatively similar to the
overall results. Forwards are the top choice for all subgroups, especially so for non‐financial firms and North
American firms. Among the other methods, it appears that for non‐financial firms and North American firms,
although usage of other methods is relatively small, users of many of these methods are much more likely to rate
them as their most commonly used method in contrast to the financial and foreign firms. Non‐financial users of

26
money market hedges, exchange rated options and option combinations rate these as their most commonly used
method as compared in much higher percentages than financial users. The same is true of North American users
of money market hedges, cross currency swaps, futures contracts, exchange traded options and non deliverable
forwards in comparison to foreign users.
Academics like to divide the economic exposure firms face from exchange rate changes into two different
forms: one from existing transactions, called transaction exposure, and the other from the ability to generate new
transactions In the future, call operating exposure. As we saw in the very first section, firms manage risks both
through the use of financial contracts and operational structure and decisions. To investigate the use of
operational structure or decisions to manage FX risk, we begin by asking firms o tell us how they perceive their
firm’s exposure to exchange rate changes in terms of the breakdown of the total exposure between transaction
exposure and operating exposure. The 340 firms that responded to this question break down the exposure on
average as 60% transaction exposure and 40% operating exposure. There is very little variation in this ratio across
subgroups, though financial firms see slightly more of their exposure as transactional (63%) rather than operating
and North American firms see the split as more balanced (56% transaction and 44% operating).
To investigate operational structure and decisions to manage FX risk more fully, we asked firms to indicate
what percentage of their total FX exposure they thought they were managing with operational structures and
decisions as compared to what percentage of total FX risk they thought they were managing with financial
contracts and derivatives. We then asked them to indicate usage across a set of operational methods for managing
FX risk. The results of this question are displayed in Table 20. In all, 332 respondents provided usage answers. The
results in Panel A of Table 20 give the breakdown of the average percent of total FX risk managed via operational
methods versus financial instruments. For all respondents, on average they believed that they managed 31% of
their FX risk with operational methods, with 4% indicating that they managed 100% of their FX risk operationally.
In contrast, firms believed that they on average managed 37% of their total FX risk with financial instruments and
derivatives, with 7% of firms indicating that they managed 100% of the total FX risk this way. There is some
variation in these numbers across the sectoral or geographic subgroups. Non‐financial firms are more titled
towards operational hedging over financial hedging of total FX exposure (35% vs. 29%) while financial firms are
more tilted towards financial hedging over operational hedging (49%.vs. 28%). Geographically North American

27
firms are roughly equally balanced at 31% of total FX exposure hedged with both operational and financial
methods, while foreign firms tend to hedge more with financial methods than operational methods (41% vs. 33%).
In terms of the operational methods firms used to manage FX risk, Panel B of Table 20 ranks them from
most commonly used to least commonly used. Pricing strategies is the most common method, used by 55% of all
responding firms, followed closely by the use of foreign currency debt (45% of respondents). Two less common
methods used by a quarter and a fifth of the firms is to use product strategies, (altering product mix) and shifting
the location of production. Two other offered choices that received 15% and 8% usage votes were increasing
productivity and promotional strategies (altering promotional spending or targeting the spending in certain
locations). Nine percent of firms choose “other” and listed their methods, which included most frequently
increasing geographic diversification, and better matching of the currencies of revenues and costs. In terms of
subgroups, non‐financial firms were more likely to use pricing strategies, consider shifting production location and
push on increasing productivity as operational ways to deal with FX risk as compared to financial firms, who much
preferred use of foreign currency debt and altering product strategies. Geographically differences in usage of
operational methods are quite minor with the exception of a greater use of shifting production location by North
American firms.
To finish up the foreign currency hedging section we asked some similar question to those at the end of
the interest rate risk management section. Namely, what is the mix of over‐the‐counter versus exchange traded
instruments in your FX derivative portfolio? The responses are summarized in Table 21. More so than with IR
derivatives, the FX derivatives used by our respondents are even more titled towards the over‐the‐counter variety.
Nearly 40% used only OTC instruments while with another 23% using mostly OTC instrument. Only 12% indicated
that they used only exchange‐traded instruments. When slicing the responses into subgroups, non‐financial are
even more titled towards OTC only with 47% of firms but also have a large groups that are committed to exchange
–traded instruments (16%). Similarly, North American firms are slightly more dedicated to one extreme or the
other of the OTC exchange–traded spectrum than are foreign firms.
The last questions we asked were about how macroeconomic conditions influence FX hedging strategy
and the influence of the firms market view on its hedging program. For macro influences on the exchange rate we
focus on the firm’s home country’s current account balance and the domestic national government budget

28
balance. Figure 5 displays the response rates for firm that indicated these macroeconomic variables do affect their
hedging strategy in terms of the amount hedged or the timing of the hedges. For both measures, less than one
third of the 452 responding firms indicate that these measures influence their FX hedging strategy. The rate of
influence is slightly higher for financial firms and foreign firms. Interesting for North American firms which are
predominantly US where both of these measures are in significant imbalance, only a quarter of the firms indicate
that they have any influence on FX hedging behavior.
As for the market view question, again we asked firms about the importance of their market view of
exchange rates in the FX hedging decisions. The results of this question are shown in Table 22. Only 45% of the
561 responding firms indicated that their market view on exchange rates was very important or important to their
FX hedging decisions with the complement of 55% indicating that it is only somewhat important or not important.
This result is a reversal of the 60%‐ 40% split in favor of a market view on interest rates being important to IR
hedging strategy. There are also some significant differences across the subgroups. Financial firms line up 60%–
40% against their market view on exchange rates being important for their hedging strategy while non‐financials
are equally split, 50% ‐50% on the issue. Geographically, there is obviously some difference of opinion on the
importance of a market forecast. North American firms line up 58%‐42% in favor of their market view being very
important or important while foreign firms are lined up 39%‐61% in favor of the market view being only somewhat
or not important. Interestingly this last result contrasts with the foreign firm’s result for the importance of an
interest rate view in which 64% indicated it was important and only 36% said it was not important. Perhaps
managers at foreign firms have different assessment of their ability for forecast exchange rates relative to interest
rates.
5.3 Commodity and Energy Risk Management
This section as seen by a subset of firms that indicated that they managed with commodity or energy risk.
We combined these two risks as the management of them is often done in a similar way and in order to keep the
survey from becoming too long for the respondents to answer fully. A total of 240 respondents answered at least
one question in this section.
To get a handle on how important commodity and energy risks are for the firms that participated in this
section, we started with a question asking how many commodity and energy risks did the firm evaluate and how

29
many did they manage. A summary of the responses are given in Table 23. Of the 119 firms that faced commodity
risk, 51% of these firms indicated that they evaluated 2 or more sources of commodity risks while of the 140 firms
that faced energy risk, 44% evaluated 2 or more sources of energy risk. So about half of the firms exposed to
commodity or energy risk are worrying about more than one source of commodity or energy risk.
Given the potential specific impacts of energy or commodity risk on specific parts of a firm, we asked firms
to indicate which group within the firm was responsible for managing these risks. Interestingly, for 47% of the 214
firms that responded to this question the risks were managed by the purchasing department while for only 29% of
firms is the hedging handled by treasury. In the other 23% of the firms the hedging is either done by a combination
of purchasing and treasury or with the oversight of some other senior group within the firm.
The main question for commodity and energy risk management is to ascertain the contracts and other
methods firms use to manage these risks. In Table 24 we display the results of the question asking firms to indicate
their use of eight different instruments and methods for managing commodity and energy risks. According to the
table, for all 193 respondents to the question, forward contracts the most commonly used method with 39% of
firms indicating use. The next most used method for commodity and energy risk management are futures
contracts (34%) and fixed pricing contracts (34%). Less commonly used methods are swaps (17%), OTC options
(13%) and option combinations (e.g., collars caps) (12%). The least commonly used methods are exchange‐traded
options (9%) and debt contracts with embedded (commodity or energy) options (2%). When each firm was asked
to vote for most used method, the rankings come out relatively the same. Forwards are the most important
method for 61% of the firms that use forwards. Fixed price contract are considered the most important method by
57% of the firms that use this method while futures contracts are rated as most important by 54% of their users.
Interestingly, even the less commonly used methods are rated as most important by roughly 25% of their users
suggesting that firms have a wide variety of favorite methods for managing these risks.
Given the small number of financial firms that answered questions in this section (28), it does not make
sense to look at a financial – non‐financial firms, so Table 24 we look only a the geographic breakdown of North
American vs. foreign firms. As we have often seen previously there are not major differences in the results
between North American and foreign firms. North American firms have a greater propensity to use fixed pricing
contracts and option combinations, while foreign firms have a greater propensity to use forward contracts. In

30
terms of most favored methods, the same three methods fill the top ranked slots, though the order of the top
three is reversed between the two sub groups.
As with the other risk areas, we ask about the mix of financial contracts between OTC instruments and
exchange‐traded instruments. These results are displayed in Table 25. As with the FX derivatives, a majority of
firms are primarily using OTC instruments. 41% of the 150 responding firms indicate that they use only OTC
derivative instruments, while 14% indicate they use of only exchange‐traded instruments. Geographically,
although also majority OTC, North American firms show a slight tilt towards exchange traded instruments when
compared to foreign firms.
Finally, we asked about the level of discretion allowed in the firms’ commodity and energy hedging
approach. Firms were asked to categorize their commodity and/or energy risk management policy as either
discretionary, non‐discretionary or some combination of discretion and rules–referred to as a variable policy in the
survey.
The results of this question are displayed in Table 26. Of the 182 responses, 31% indicate that their risk
management approach for commodity and energy risks is discretionary, while 37% indicate that their approach is
non‐discretionary. A variable policy best describes the approach for 25% of the firms while another 7% indicated
some other approach.
These results show some interesting differences when we break down the results geographically. North
American firms are less likely to have a discretionary policy than foreign firms (26%) to (37%). Nearly 46% of the
North American firms indicate that their approach in non discretionary compared to just 27% of foreign firms.
5.4 Credit Risk Management
Due to the global financial crisis on 2008 – 2009, credit risk has become a hot topic. We saw earlier than
credit risk was one of the most important risks faced by firms responding to our survey. In this section we ask
some basic questions about the credit risk firms face and the instrument or methods they used to manage it. Again
by design, not all firms that faced credit risk were directed to answer questions in this section. There were 245
firms that saw this section and answered at least part of one question.

31
The first question was to learn about the forms of credit risk that these firms faced. We set out a list of
seven forms of credit risk and asked the respondents to indicate whether they faced each form of credit risk. The
results of this questioning are displayed in Table 27. The most commonly faced form of credit risk is the standard
risk on trade credits or accounts receivables from customers. This form of credit risk was faced by 67% of the 231
respondents. On the investment side, credit risk on corporate bonds in an investment portfolio was next most
commonly faced risk 39% of firms followed closely by long term contracts with customers denoted by 38% of the
firms and counterparties on financial derivatives with 36% of the respondents. The remaining three forms of credit
risk, long term contracts with suppliers, loan guarantees and loans to vendors were cited by less than 25% of the
respondents.
Not surprisingly there was substantial difference is the results across financial and non‐financial firms.
Financial firms showed more involvement with investment based credit risks. Of the 120 financial firms, 66% faced
credit risk from corporate bond investments and 54% on counterparties on financial derivatives. Of the 108 non‐
financial firms, 91% faced credit risk from trade credit and account receivable. Their other major sources were
long terms contracts with supplies (35%) and long term contracts with customers (32%). Geographically the
differences were not so sharp. Generally more foreign firms indicated that they faced more forms of credit risk
than the North American firms. Of the 132 foreign firms, 4% cited long term contracts with customers compared
to only 27% of the 99 North American firms. Also 27% of the foreign firms mentioned loan guarantees in contrast
to only 14% of North American firms.
The next question was to ask what methods or contracts the firms used for managing these credit risks.
Again we offered seven choices of methods or contracts. In total 212 firms responded to this question and the
results are displayed in Table 28. Interesting standard operating methods dominated over financial contracts for
managing credit risk. The most common method, chosen by 65% of the respondents was simply to impose a
minimum credit rating for their counterparties. Also popular was to impose strict caps on exposure to any single
counterparty, (61%) and simply require the use of collateral (56%). The use of loan guarantees (cosigning of loans
by another creditworthy party) was used by 29% of respondents and led all of the financial contract options offers,
including credit default swaps, credit insurance and total return swaps, all with less than 20% usage.

32
Within the subgroups there are some large differences in use of various methods. The 120 financial firms
are much more likely than the 92 non‐financial firms to impose minimum credit ratings (75% vs. 52%), require
collateral (78% vs., 27%) and use credit default swaps (28% vs. 4%) and total return swaps (16% vs. 1%). However,
the non‐financial are more likely to use credit insurance than the financial firms (24% vs. 13%). Once again
geographically the differences are not so significant. Overall, the 124 foreign firms appear to use a greater number
of methods per firm than the 88 North American firms. In particular, the minimum credit rating and credit
insurance are more popular with foreign firms than with US firms.
Not just because it turned out to be the most commonly used methods of dealing with credit risk, but
primarily because it has been asked in previous surveys, we asked a specific question about the minimum credit
rating for a counterparty in a derivative transaction. As had been done historically we asked it both for short term
contracts (maturity within 12 months) and long term contracts (maturity of more than 12 months). The responses
for the 128 firms that had such a policy are displayed in Figure 6. The results display is a triangular shaped pattern
peaking at 40% of firms having a minimum credit rating of A for contracts of less than 12 months and 31% of firms
having a minimum credit rating of A for contracts with a maturity of more than 12 months. Not surprisingly, the
distribution for the minimum credit rating is shifted up slightly towards AA and AAA for the longer maturity
contracts. Despite the importance of this method of dealing with credit risk, it is surprising that 88 firms (41% of
the respondents) responded to this question that they do not have a set policy on a minimum credit rating for a
derivative contract counterparty.
In sub group analysis what is amazing is the variation in the percentage of firms with no set policy on
minimum credit rating for counterparties. Among the 116 financial firms that responded to the question, only 19%
indicated having no policy. However, for the 100 non‐financial firms that responded, a whopping 66% indicate no
set policy on a minimum credit rating for counterparties. This disparity continues over to the geographical
breakdown. Of the 92 North American firms that responded, 54% had no set policy while only 31% of the 124
foreign firms indicated that they had no set policy. One might expect that in light of the credit issues of the past
few years, more firms would consider developing such a policy to help manage credit risk.

33
5.5 Geopolitical Risk Management
The final area specific set of questions are on geopolitical risk. Once again, to reduce survey fatigue, not
all firms that indicated they faced geopolitical risk were directed to this section. In all, we had 236 firms directed to
and answer at least one question in this section.
Geopolitical risk management has not generally been studied past survey of corporate risk management.
So to get some idea of how make geopolitical risk management decisions we started with asking for what
circumstances they consider geopolitical risk. We chose to focus the question around investment size and location.
The first version of the question we ask whether the firm evaluates geopolitical risk for investments over a certain
minimum size for any size, and in the second version we ask whether the firms evaluate geopolitical risk for
investments in select foreign countries, all foreign countries and/or home. The results of this questioning for the
full set of 193 respondents as well as the standard subgroups are shown in Figure 7 and Figure 8.
With respect to investment size, From Figure 7 it appears that a majority of firms (58%) evaluate political
risk only for investment over some minimum size. This result is consistent across subgroups except for North
American firms where it is slightly more common for these firms to evaluate geopolitical risk for investments of any
size. As for the location of the investment, Figure 8 suggests that the most common response is for firms to
evaluate geopolitical risk only for investments in select foreign countries (43%). This is followed by the other
extreme whereby firms evaluate investments for geopolitical risk in all foreign countries as well as in the home
market. This was the response of 25% of the respondents. The choices of all foreign countries and select foreign
countries and home were each the choice of just 16% of the respondents. Interestingly if we cross tabulate these
questions it turns out that 52 firms (24%) evaluate geopolitical risk only for investments over a certain size and in
select foreign countries while only 25 respondents (13%) evaluate geopolitical risk for investments of any size and
in all markets.
By subgroups, financial firms were more likely to use less discretion, with 20% indicating all foreign
countries and 27% all locations including the home country. Non‐financial firms were much more apt to use
discretion with 52% indicating evaluation for only select foreign countries. North American firms showed the least
discretion with 20% and 29% in the all foreign countries and all foreign plus the home country categories,
respectively.

34
Many people have argued that the events of September 11, 2001, changed the market’s perceptions
about the possibility of geopolitical risks and heightened the awareness of this risk with in the business community.
To see if this event has had any impact on how firms think about geopolitical risk we asked firms to indicate the
events of 9/11 changed the role of geopolitical risk management at their firm. The results are supportive of the
common view. Of the 215 firms that responded to this question, only 2 indicated that the events of September
11th resulted in less emphasis on geopolitical risk in their firm. A substantial 43% of the respondents indicated
that that these events had not changed the emphasis within their firm on geopolitical risk management. However,
46% indicated that these events had resulted in more emphasis on geopolitical risk with a further 8% of indicating
that they had resulted in “much more” emphasis on geopolitical risk within their firm. These results varied very
little across the sectoral and geographic subgroups.
To learn about the popularity of methods firms were using to manage geopolitical risk, we offered a broad
list with 14 methods of dealing with geopolitical risk and asked firms to indicate whether they used any of these
methods. The results of this question are displayed in Panel A of Table 29. Of the 210 firms that responded to this
question, the most commonly used method to manage geopolitical risk was simply to “avoid investments in certain
countries”. This was chosen by 50% of the respondents. Two other methods were used by 40% or more of the
firms, these were “increasing research before new investments”, and “diversifying investments across more
countries”. Both of these are standard operating approached methods to reduce risk. Two other methods were
used by 26% of the respondents, “lower the company profile in the risky country” and “increase the hurdle rate on
projects in the risky country”. The remaining seven suggested methods were used by between 15% and 19% of the
firms. These included increasing use of currency or commodity hedging, increase use of political risk analysts,
increase in the use of security personnel, alerting supply chain management, diversifying investment across more
industries, use of political risk insurance and enhancing public relations in the risky region. That all 14 methods had
at least 15% of the firms indicate some usage, suggests that firms are using multiple approached to deal with
geopolitical risk.
In terms of the subgroups, financial firms are much more likely than non‐financial firms to manage
geopolitical risks by diversification of their investment either across countries (59% vs. 25%) or industries (27% vs.
8%), as well as make increased use of political risk analysts (26% vs. 12%). On the flip side, non‐financial firms are
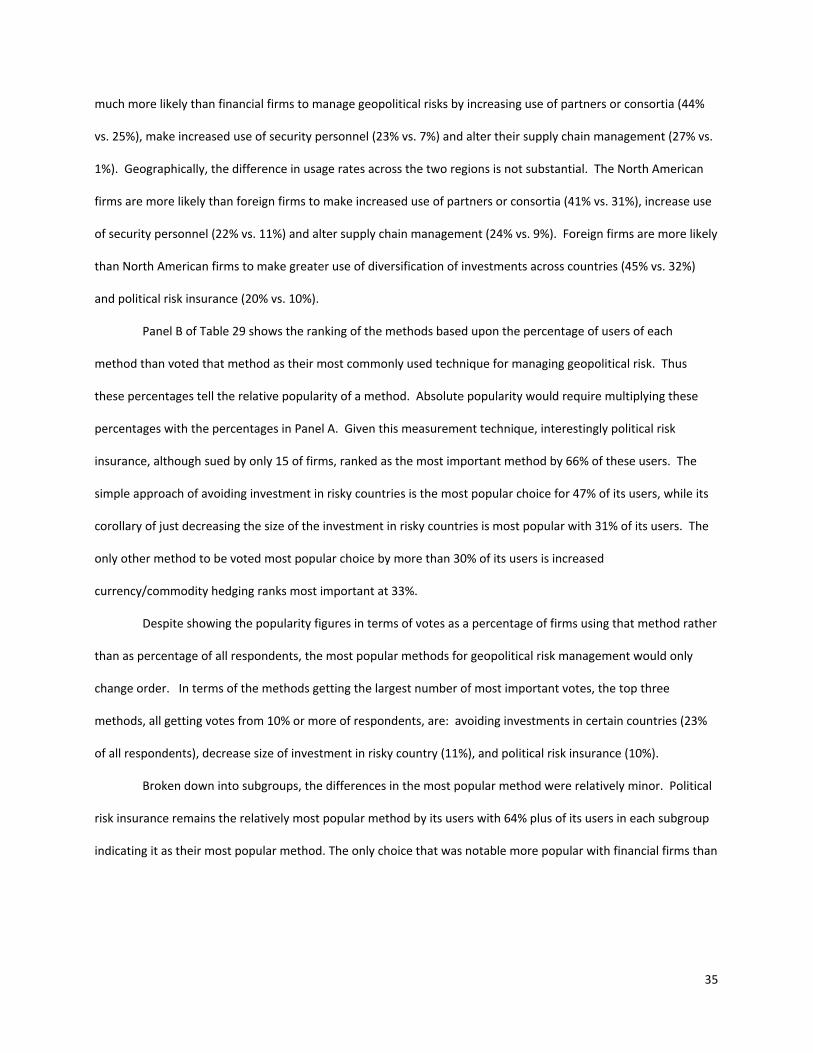
35
much more likely than financial firms to manage geopolitical risks by increasing use of partners or consortia (44%
vs. 25%), make increased use of security personnel (23% vs. 7%) and alter their supply chain management (27% vs.
1%). Geographically, the difference in usage rates across the two regions is not substantial. The North American
firms are more likely than foreign firms to make increased use of partners or consortia (41% vs. 31%), increase use
of security personnel (22% vs. 11%) and alter supply chain management (24% vs. 9%). Foreign firms are more likely
than North American firms to make greater use of diversification of investments across countries (45% vs. 32%)
and political risk insurance (20% vs. 10%).
Panel B of Table 29 shows the ranking of the methods based upon the percentage of users of each
method than voted that method as their most commonly used technique for managing geopolitical risk. Thus
these percentages tell the relative popularity of a method. Absolute popularity would require multiplying these
percentages with the percentages in Panel A. Given this measurement technique, interestingly political risk
insurance, although sued by only 15 of firms, ranked as the most important method by 66% of these users. The
simple approach of avoiding investment in risky countries is the most popular choice for 47% of its users, while its
corollary of just decreasing the size of the investment in risky countries is most popular with 31% of its users. The
only other method to be voted most popular choice by more than 30% of its users is increased
currency/commodity hedging ranks most important at 33%.
Despite showing the popularity figures in terms of votes as a percentage of firms using that method rather
than as percentage of all respondents, the most popular methods for geopolitical risk management would only
change order. In terms of the methods getting the largest number of most important votes, the top three
methods, all getting votes from 10% or more of respondents, are: avoiding investments in certain countries (23%
of all respondents), decrease size of investment in risky country (11%), and political risk insurance (10%).
Broken down into subgroups, the differences in the most popular method were relatively minor. Political
risk insurance remains the relatively most popular method by its users with 64% plus of its users in each subgroup
indicating it as their most popular method. The only choice that was notable more popular with financial firms than

36
the general population was increased currency /commodity hedging,15 while for non‐financial firms it was
diversifying across more industries. Geographically North American firms were more likely to rank increased use of
political risk analysts as their top choice than the general population while foreign firms were much fonder of
increased currency/commodity hedging.
One difficulty with geopolitical risk is that there is not a general consensus on how to take it into account
when doing valuation of projects facing this risk. To see what methods these firms used, we asked them to
indicate usage of various methods of incorporating geopolitical risk in to a valuation decision for an investment.
We offer 4 prescribed methods, 1) adding a risk premium to the required rate of return, 2) using risk‐adjusted
expected cash flows, 3) using scenario/simulation analysis, and 4) pricing in political risk insurance costs. The
results of this questioning are shown in Table 30. For the 206 firms that responded to this question, 57% used the
simple approach of adding a risk premium to the required rate of return. The second most commonly used
method was scenario/simulation analysis selected by 36% of the firms. Risk adjusted expected cash flows was
selected by 28% of the firms while only 15% selected pricing in political risk insurance. This could be because only
15% of the sample indicated that they used political risk insurance, but pricing in the costs to account for the risk in
valuation does not require that the firm need to actually be using political risk insurance.16
The responses to this question are relatively the same across the subgroups. Financial firms are more
likely to use multiple methods, and do scenario /simulation analysis proportionally more often that non‐financials.
Geographically, the foreign firms tend to be more likely to price in political risk insurance than North American
firms.
To end the discussion with political risk insurance, our last question in this section was a very straight
forward, do you hold any political risk insurance contracts? For the 218 respondents, 18% indicated that they held
at least one such contract. Conditionally the ryes response rate varied only slightly: for financial firms it was 18%
and for non‐financial firms it was 15%. For North American firms it was 13% and for foreign firms it was 19%.
15 The financial firms sample displays a 100% result for Alter supply chain management in Panel B of table 30. This is because only one financial firm indicated use of this method and they ranked it as their most commonly sued method. Thus its popularity in this case is idiosyncratic to this one particular firm. 16 This conclusion is supported by comparing the subgroup analysis where pricing in political risk premiums is selected by 18% of financial firms while in Panel A of Table 10 we see that only 13% of financial firms actually use political risk insurance.

37
6. Conditional Analysis based on Manager and Firm Characteristics
[to be competed]
7. Conclusion
The results of this survey provide a broad understanding of the current state of corporate risk
management around the world. Exposure to the six area of risk we study in this survey, interest rate, foreign
exchange, commodity, energy, credit and geopolitical is quite prevalent, especially for interest rate, credit risk and
foreign exchange risk. The vast majority of firms that face material risk in these areas are managing this risk in
some form, more so with operational hedges than via is financial hedging. Financial derivatives are used by only
64% of the firms in the sample.
Beyond just derivative usage, the survey highlights the wide variety of goals and policies associated with
firms risk management programs. While concern issues associated with derivatives usage continues, the degree
of concern, especially about regulatory and accounting issues seems to have decreased relative to the 1990s.
However, respondents do indicate that possible regulatory changes may have some affect on their overall level of
risk management
For specific forms of financial risk, such as interest rate, foreign exchange, and commodity, firms
generally uses a mix of financial and operational methods to manage their risk; if they use financial derivatives,
they tend to favor over the counter instruments relative to exchange traded ones. In choosing amongst financial
instruments firms overwhelmingly prefer basic instruments, with forward contracts generally being the most
popular derivative instrument. Interestingly, the popularity of options and option combinations appears to have
decreased relative to the evidence in some earlier surveys.
The survey also provides insight into new types of risk not generally covered in previous surveys. Credit
risk, which was the most important risk area for a majority of respondents, is basically handled via operational
methods. Geopolitical risk is also a concern, though for fewer firms, and the approach to its evaluation and
methods of dealing with it tend to vary even more widely than for other sources of risk.
Overall, our analysis suggests that risk management is an important part of corporate activities. Most
firms focus on the sources of risks that are most significant to them and manage these risks through operations,

38
with about two thirds also using financial derivatives as part of the risk management program. We document
substantial and predictable differences in behavior between financial and non‐financial firms; however, in most
cases, the differences on the basis of geographic location are relatively minor. This is in contrast to studies from
the 1990s and suggests that best practice risk management policy and behavior has become global.

39
Annex 1 –Previous surveys
Authors Year Country Focus of the study / tools of risk management
Block and Gallagher . 1986 United States Interest rate risk management..
Dolde 1993 United States Exchange and interest rate risk management tools
Bodnar, Hayt, Marston, and Smithson . 1995 United States Study about derivatives use to define the evolution of derivatives usage in the time.
Bodnar, Hayt, and Marston. 1996 United States Study about derivatives use to define the evolution of derivatives usage in the time.
Berkman and Bradbury . 1996 New Zealand Study about derivatives use
Hakkarainen, Kasanen and Puttonen 1997 Finland Study about interest rate risk management tools. Particularly, comparison with other country
Berkman, Bradbury and Magan. 1997 New Zealand Study about derivatives use and comparison with American studies
Bodnar, Hayt, and Marston 1998 United States Study about derivatives use to define the evolution of derivatives usage in the time.
Alkebäck and Hagelin 1999 Sweden Study about derivatives use and comparison with U.S. and New Zealand study.
Bodnar and Gebhardt 1999 Germany Study about derivatives use in risk management activity
Jalilvand 1999 Canada Study about derivatives use and comparison with U.S. and New Zealand study.
Fatemi and Glaum . 2000 Germany Study about risk managers’ activity. Particularly, financial and non‐financial risk management.
Mallin, Ow‐Yong, and Reynolds 2001 United Kingdom Study about derivatives use and comparison with Bodnar, Hayt and Marston (1995).
Bodnar,‐de Jong, and Macrae 2003 Netherlands Study about derivatives use conditioned by institutional rule, comparison with Bodnar et al (1998)
El‐Masry. 2006 United Kingdom Study about derivatives use in risk management
Servaes, Tameyo, and Tufano P. 2009 Global Study about risk management activity as from global corporate survey of corporate activities

40
References:
Alkebäck, P. and Hagelin, N., "Derivatives usage by non‐financial firms in Sweden with an international
comparison", Journal of international financial management and accounting Vol. 10, n°2 (1999).
Berkman, H. and Bradbury, M. E., "Empirical evidence on corporate use of derivatives", Financial Management Vol.
25, n°2 (1996), pp. 5‐13.
Berkman, H.; Bradbury, M. E. and Magan, S., "An international comparison of derivatives use", Financial
Management Vol. 26 n°4 (1997), pp. 69‐73.
Block, S. B. and Gallagher, T. J., "An empirical study of the utilization of futures and options by corporate
management", (1986).
Bodnar, G. M.; G. S. Hayt, R.C Marston, and C. W. Smithson ., Wharton Survey of Derivative Usage by U.S. Non‐
Financial Firms, Financial Management, Vol. 24, No. 2, (1995), pp. 104‐114.
Bodnar, G. M.; G. S. Hayt, and R.C. Marston, Wharton 1995 Survey of Derivative Usage by U.S. Non‐Financial Firms,
Financial Management, Vol. 25 No. 4, Winter, (1996), pp. 113‐133.
Bodnar, G. M.; G. S. Hayt, and R.C. Marston, "1998 Wharton survey of financial risk management by US non‐
financial firms" Financial Management vol. 27, no. 4 (1998), pp. 70‐91
Bodnar, G. M. and G. Gebhardt, "Derivatives Usage in Risk Management by US and German Non‐Financial Firm: A
comparative Survey", Journal of International Financial Management and Accounting 10:3 (1999), pp. 158‐
87.
Bodnar, G. M.; A. de Jong, and V. Macrae., "The impact of Institutional Differences on Derivatives Usage: a
Comparative Study of US and Dutch Firms”, European Financial Management vol. 9, no. 3 (2003), pp. 271‐
297.
Dolde, W., "The trajectory of corporate financial risk management", Journal of Applied Corporate Finance, Vol. 6, n°
3, (1993).
El‐Masry, A., "Derivatives use and risk management practices by UK nonfinancial companies”, Managerial Finance,
32 n. 2, (2006) 137‐159
Fatemi, A. and Glaum, M., "Risk management practices of German Firms", Managerial Finance, (2000).
Hakkarainen, A; Kasanen, E. and Puttonen, V., "Interest rate risk management in major Finnish firms”, European
Financial Management Vol. 3, No. 3 (1997), pp. 255‐268.
Jalilvand, A., "Why firms use derivatives: evidence from Canada", Canadian Journal of Administrative Sciences Vol.
16, n° 3 (1999), pp. 213‐228.
Mallin, C.; Ow‐Yong, K. and Reynolds, M., "Derivatives usage in UK non‐financial listed companies", The European
Journal of Finance Vol. 7 (2001), pp. 63‐91.
Servaes, H., A, Tamayo, and P. Tufano, The Theory and Practice of Corporate Risk Management, Journal of Applied
Corporate Finance, Vol 21, No. 4, (2009) pp. 60‐78

41
Figures
71%63%
26%31%
56%
33%
0%
20%
40%
60%
80%
Interest Rate
(IR)
Foreign
Exchange (FX)
Energy (EN
)
Commodity
(CM)
Credit (CR)
Geo
political
(GP)
Percentage
facing"material" risk
Figure 1a: Firms facing material risk ‐ by risk area
0%
20%
40%
60%
80%
100%
IR FX EN CM CR GPpercentage facing "m
aterial risk"
Figure 1b: Firms facing material risk ‐ by subsample
Financial firms Non‐financial firmsNorth American firms Foreign firms

42
65% 73%
50%
46%
40%
20%
72%
66%
86%
83% 88%
83%
0%
20%
40%
60%
80%
100%
IR FX EN CM CR GP
% of firm
s facing
material risk in that area
Figure 2: Firms managing material risk
Derivatives / Financial contracts
Operational Structures and Decisions
55%
43%
44%
42%
45%
27%
0% 20% 40% 60%
Recorded commitments
Anticipated exposures within one year
Foreign repatriations
Contractual commitments
Translation of foreign financial statements
Anticipated exposures in more than one year
Figure 4: Percent of FX exposures hedgedn =138
Figure 3: Concerns about derivatives – Comparison with Wharton 1998 survey responses

43
33%
42%
26%
24%
37%
31% 38%
24%
25% 33%
0%
10%
20%
30%
40%
50%All
responden
ts
Financial firms
Non‐financial
firm
s
North
American
firms
Foreign firms
percentage of firm
s
Figure 5: Does your country's current account or federal budget surplus/deficit affect the amount and timing of your FX hedging strategy? Yes responsesn = 460 Current account Federal budget
5%
23%
40%
20%
12%16%
28% 31%
16%
9%
0%
10%
20%
30%
40%
50%
AAA AA A BBB <BBB
percentage of firm
s
minimum credit rating for counterparty
Figure 6: Minimun credit rating for counterparty by contract maturity n = 128 contracts with <12 months maturity
contracts with > 12 months maturity

44
58%
64%
53%
47%
66%
42%
36%
47%
53%
34%
0% 20% 40% 60% 80% 100%
ALL (n = 193)
Financial firms (n = 81)
Non‐financials (n = 109)
North American firms (n = 83)
Foreign firms (n = 107)
percentage of respondents
Figure 7: For what size investments does your firm evaluate geopolitical risks?(best choice)
Over a certain size Any size
43%
34%
52%
37%
49%
16%
20%
13%
20%
13%
16%
19%
14%
13%
18%
25%
27%
21%
29%
20%
0% 20% 40% 60% 80% 100%
ALL (n = 169)
Financial firms (n = 71)
Non‐financials (n = 95)
North American firms (n = 66)
Foreign firms (n = 100)
percentage of respondents
Figure 8: For investment in what locations does your firm evaluate geopolitical risks?(best choice)
Select foreign countries
All foreign countries
Select foregin countries and home country
All foreign countries and home country
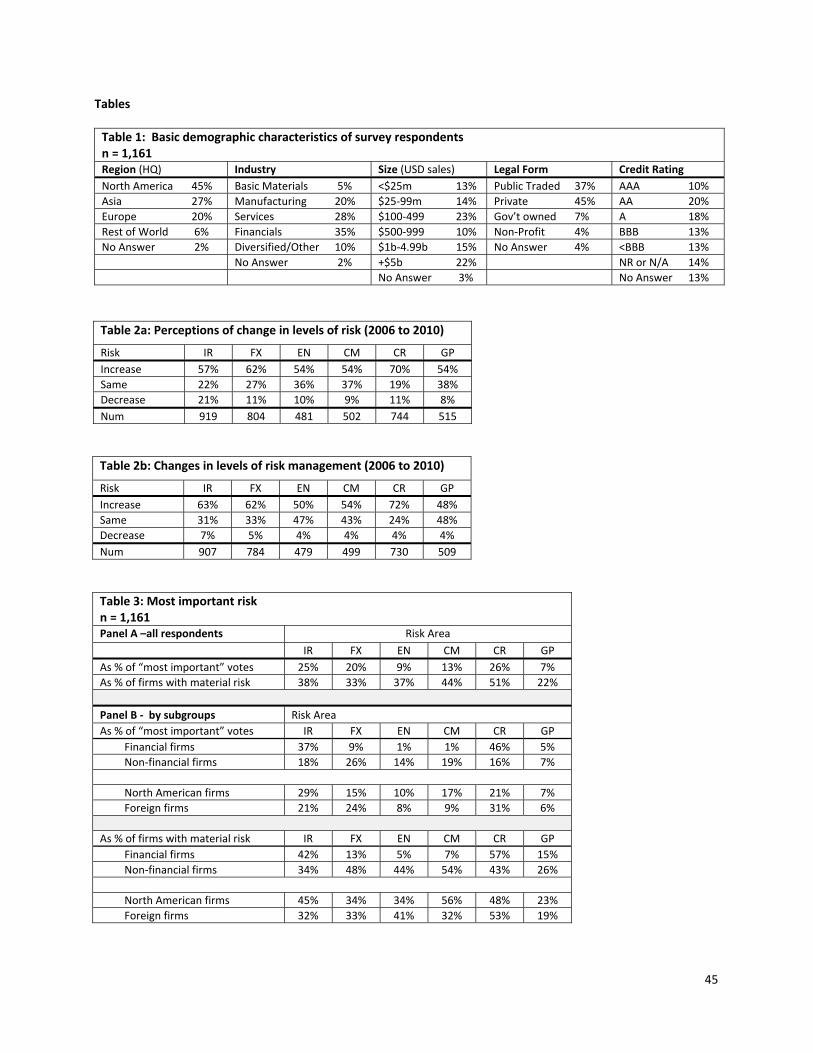
45
Tables
Table 1: Basic demographic characteristics of survey respondents n = 1,161 Region (HQ) Industry Size (USD sales) Legal Form Credit Rating
North America 45% Basic Materials 5% <$25m 13% Public Traded 37% AAA 10%
Asia 27% Manufacturing 20% $25‐99m 14% Private 45% AA 20%
Europe 20% Services 28% $100‐499 23% Gov’t owned 7% A 18%
Rest of World 6% Financials 35% $500‐999 10% Non‐Profit 4% BBB 13%
No Answer 2% Diversified/Other 10% $1b‐4.99b 15% No Answer 4% <BBB 13%
No Answer 2% +$5b 22% NR or N/A 14%
No Answer 3% No Answer 13%
Table 2a: Perceptions of change in levels of risk (2006 to 2010)
Risk IR FX EN CM CR GP
Increase 57% 62% 54% 54% 70% 54%
Same 22% 27% 36% 37% 19% 38%
Decrease 21% 11% 10% 9% 11% 8%
Num 919 804 481 502 744 515
Table 2b: Changes in levels of risk management (2006 to 2010)
Risk IR FX EN CM CR GP
Increase 63% 62% 50% 54% 72% 48%
Same 31% 33% 47% 43% 24% 48%
Decrease 7% 5% 4% 4% 4% 4%
Num 907 784 479 499 730 509
Table 3: Most important risk n = 1,161 Panel A –all respondents Risk Area
IR FX EN CM CR GP
As % of “most important” votes 25% 20% 9% 13% 26% 7%
As % of firms with material risk 38% 33% 37% 44% 51% 22%
Panel B ‐ by subgroups Risk Area
As % of “most important” votes IR FX EN CM CR GP
Financial firms 37% 9% 1% 1% 46% 5%
Non‐financial firms 18% 26% 14% 19% 16% 7%
North American firms 29% 15% 10% 17% 21% 7%
Foreign firms 21% 24% 8% 9% 31% 6%
As % of firms with material risk IR FX EN CM CR GP
Financial firms 42% 13% 5% 7% 57% 15%
Non‐financial firms 34% 48% 44% 54% 43% 26%
North American firms 45% 34% 34% 56% 48% 23%
Foreign firms 32% 33% 41% 32% 53% 19%

46
Table 4: Importance of various goals to risk management program
Panel A: All respondents n = 1,131
Number in “very Important” column is percentage of firms that rated that goal/objective as very important. Number in “not Important” column is percentage of firms that rated that goal/objective as not important. Importance score is weighted average measure of importance for that goals across all respondents, with 4 = very important, 3 = important, 2 = somewhat important and 1 = not important . Number in rated as “most important” column is percentage of firms ranking that goal/objective as the most important to the firm.
Goals /Objective of Risk Management Program
Rating (votes) Importance Score*
Rated as “Most
Important” “Very
Important” “Not
Important”
g. Avoid large losses from unexpected price movements 50% 3% 3.69 18%
l. Shareholders expect us to manage risk 41% 3% 3.66 5%
k. Increase firm value 39% 4% 3.55 14%
e. Increase expected future cash flows 38% 3% 3.63 15%
f. Improve or maintain credit rating 31% 8% 3.34 4%
m. Ability to pursue investment opportunities even in difficult times 29% 8% 3.33 11%
a. Increase reported earnings predictability 29% 9% 3.33 10%
h. Improve corporate decision making environment 28% 4% 3.47 7%
b. Reduce operating cash flow volatility 28% 5% 3.42 8%
d. Reduce cost of debt 23% 13% 3.13 5%
j. Reduce cost of equity 13% 18% 2.79 1%
i. Decrease volatility of share price 12% 22% 2.65 0%
c. Increase the amount we can borrow 12% 23% 2.64 1%
Panel B: Rated as “most important” by subgroups
Goals /Objective of Risk Management Program
Financial
firms
N = 393
Non‐
financial
firms
N = 705
North
American
firms
N 513
Foreign
firms
N = 585
g. Avoid large losses from unexpected price movements 24% 15% 15% 21%
l. Shareholders expect us to manage risk 9% 3% 5% 6%
k. Increase firm value 16% 13% 14% 14%
e. Increase expected future cash flows 6% 19% 17% 12%
f. Improve or maintain credit rating 7% 2% 3% 4%
m. Ability to pursue investment opportunities even in difficult times 14% 9% 11% 10%
a. Increase reported earnings predictability 7% 12% 9% 11%
h. Improve corporate decision making environment 5% 9% 9% 6%
b. Reduce operating cash flow volatility 4% 11% 10% 8%
d. Reduce cost of debt 5% 5% 5% 5%
j. Reduce cost of equity 1% 1% 0% 1%
i. Decrease volatility of share price 1% 0% 1% 0%
c. Increase the amount we can borrow 1% 2% 1% 1%

47
Table 5: What assumption do you most commonly make about the future price distribution when doing scenario analyses or financial simulations? n = 1,095
Assume a normal distribution with mean and variance taken from historic data 28%
Assume a normal distribution with mean and variance from some other source (estimated or market implied forecasts) 21%
Modify a normal distribution with assumptions to make it more conservative (e.g. treating the 5% tail as if it were the 10% tail) 19%
Assume a non‐normal distribution that allows for fatter tails and potential skewness 16%
Let the historic data determine the shape of some arbitrary distribution 13%
Other 3%
Table 6: Firms indicating that they use financial derivatives in their risk management program
Panel A: Full Sample
n = 1,161
Yes No
64% 36%
Panel B: By Geographic Region and Economic Sector
All Regions North America n = 525 Foreign n = 609
Yes No Yes No Yes No
Financial sector firms n = 404 78% 22% 72% 28% 81% 19%
Non‐financial sector firms n = 730 56% 44% 54% 46% 59% 41% Primary product sector firms n= 109 71% 29% 72% 28% 70% 30%
Manufacturing sector firms n = 229 67% 33% 68% 32% 64% 36%
Service sector firms n = 392 46% 54% 42% 58% 51% 49%
All Sectors 58% 42% 68% 32%
Panel C: By Firm Size ‐ USD Sales (2009 dollars) (n = 1,077 with usable responses) Yes No
< USD25M n = 115 35% 65%
USD 25M – 99M n = 157 44% 56%
USD 100M – 499M n = 260 54% 46%
USD 500M – 999M n = 114 76% 24%
USD 1.0B – 4.9B n = 179 80% 20%
USD 5.0B and more n = 252 85% 15%
Panel D: By Ownership Structure n = 1,080 with usable responses Yes No
Publicly Traded n= 427 78% 22%
Private n = 515 53% 47%
Government Owned n = 87 70% 30%
Non‐Profit n = 51 43% 57%
Panel E: By Credit Rating n = 917 with usable responses Yes No
AAA n = 118 72% 28%
AA n = 228 65% 35%
A n = 181 69% 31%
BBB n = 153 73% 27%
BB n = 83 76% 24%
< BB n = 69 57% 43%
Not Rated n = 85 47% 53%

48
Table 7: Most important reasons for not using financial derivatives n = 380 Num %
a. Insufficient exposure to financial or commodity prices 132 34%
b. Exposures are more effectively managed by other means 71 31%
g. Costs of establishing and maintaining a derivatives program exceed the expected benefits 56 25%
c. Difficulty pricing and valuing derivatives 41 18%
f. Concerns about perceptions of derivative use by investors, regulators and the public 31 13%
h. Other 30 13%
e. Accounting treatment 14 6%
d. Disclosure requirements of the SEC or the FASB 9 4%
Table 8 Degree of concern with issues related to derivative usePanel A: All responses, n = 601
Area of Concern High
concernModerate concern
Low concern
No concern
Concernscore *
c. Market risk (unforeseen change in value of derivative) 39% 39% 15% 7% 3.10
b. Counterparty credit risk 31% 37% 22% 10% 2.89
e. Monitoring and evaluating hedge results 23% 41% 26% 11% 2.75
d. Secondary market liquidity 23% 39% 24% 14% 2.71
a. Accounting treatment 21% 35% 27% 16% 2.60
g. Disclosure requirements 14% 31% 30% 24% 2.36
f. Reaction by analysts or investors 11% 32% 31% 26% 2.28 * Concern score is weighted average with high concern = 4, moderate concern =3, low concern = 2 and no concern = 1
Panel B: Concern score by subgroup
Area of Concern
Financial firms n = 254
Non‐financialfirms n = 348
North American firms n = 266
Foreign firms n = 335
c. Market risk (unforeseen change in value of derivative) 3.28 2.97 2.95 3.22
b. Counterparty credit risk 3.23 2.65 2.74 3.02
e. Monitoring and evaluating hedge results 2.87 2.67 2.57 2.9
d. Secondary market liquidity 3.02 2.49 2.53 2.85
a. Accounting treatment 2.72 2.52 2.53 2.66
g. Disclosure requirements 2.48 2.27 2.28 2.41
f. Reaction by analysts or investors 2.45 2.16 2.14 2.4
Table 9: Frequency of derivative valuation
Frequency
All respondents
n = 595
Financial Firms n = 254
Non‐financial firms n = 341
North American firms n = 263
Foreign firms n =332
Daily 34% 63% 13% 27% 40%
Weekly 12% 9% 13% 9% 14%
Monthly 31% 17% 42% 36% 27%
Quarterly or less 12% 5% 17% 16% 8%
No schedule 11% 6% 15% 11% 11%

49
Table 10: Reaction to possible changes in regulatory rules for derivative instruments
Panel A: Reaction to restriction on OTC derivatives and push towards all standardized exchange‐traded contracts
Impact on firm’s usage of derivatives
All respondents
n = 604
Financial firms n = 256
Non‐financial firms n= 348
North American firms n = 265
Foreign firms n = 339
Increase in usage 10% 15% 7% 6% 13%
No change in usage 54% 39% 66% 65% 47%
Decrease in usage 32% 43% 24% 28% 36%
Discontinue usage 3% 3% 3% 2% 4%
Panel B: Reaction to required cash collateral or increased collateral positions for all OTC derivatives
Impact on firm’s usage of derivatives
All respondents
Financial firms
Non‐financial firms
North American firms
Foreign firms
Increase in usage 6% 9% 3% 4% 7%
No change in usage 35% 38% 32% 33% 37%
Decrease in usage 52% 51% 53% 55% 50%
Discontinue usage 7% 2% 11% 9% 6%
Table 11: Impact on firm value from a sudden 100 basis point rise in interest rates For the top row and first column top number is the number of responses, the second is the percentage of responses for each category and the number in brackets in the average change in firm value. In the heavy lined conditional block, top number is number of conditional responses to both questions and the diff= [X.X%] is the average difference in the IR change on firm value between hedged case and unhedged case.
Impact on firm value of a sudden 100 basis point rise in interest rates
WITH FIRM’S CURRENT RISK MANAGEMENT PROGRAM
All Increase No Change Decrease
WITHOUT FIRM’S CURRENT RISK MANAGEMENT PROGRAM
All
432 410
40 9%
[10.9%]
262 61% [0%]
130 30%
[‐9.5%]
Increase 20 5%
[15.4%]
16 diff = [‐2.1%]
3 diff =
[‐12.3%]
1 diff =
[70.0%]
20
No Change 170 41% [0%]
1 diff = [5.0%]
160 diff = [0%]
2 diff =
[‐12.5%]
163
Decrease 220 54%
[‐13.5%]
17 diff = [20.5%]
67 diff = [9.1%]
113 diff = [7.7%]
197
34 230 116 380
Table 12: Firms that have “frequently” or “sometimes” used interest rate derivatives in past three years for the following purposes…
Use of Interest rate derivatives to …
All respondents
n = 502
Financial firms n = 224
Non‐financial firms n = 266
a. Swap from fixed rate to floating rate 44% 68% 25%
b. Swap from floating rate to fixed rate 58% 65% 54%
c. Fix in advance the rate or spread on new debt 45% 51% 39%
d. Reduce or lock in rate based upon market view 47% 56% 40%

50
Table 13: Use of various interest rate contracts /positions to manage IR risk
All respondents
n = 514 Financial firms
n = 238 Non‐financial firms
n = 264
Interest rate contracts/positions UseRanked as most used* Use
Ranked as most used Use
Ranked asmost used
c. Interest rate swaps 67% 71% 75% 63% 61% 81%
a. Forward rate agreements 45% 47% 52% 33% 38% 64%
h. Varying the maturity of the debt 32% 43% 36% 39% 28% 45%
b. Interest rate futures 30% 31% 50% 27% 13% 39%
g. Option combinations (e.g., caps, collars) 26% 13% 34% 7% 20% 50%
d. Interest rate swaptions 18% 13% 31% 6% 7% 25%
f. Exchange traded IR option contracts 14% 8% 23% 4% 6% 24%
e. OTC IR options 13% 4% 24% 1% 4% 16%
* Ranked as most used is a percentage of the number one ranking votes relative to all firms that indicate use
Table 14: Mix of over‐the‐counter and exchange‐traded IR derivatives
Mix
All respondents
n = 498
Financial firms n = 237
Non‐financial firms n = 287
North American firms n = 242
Foreign firms n = 282
Over‐the‐counter only 35% 24% 45% 38% 32%
Mostly OTC 25% 30% 21% 20% 29%
Equal mix 12% 18% 7% 9% 15%
Mostly exchange‐traded 14% 21% 9% 14% 16%
Exchange‐traded only 13% 8% 18% 19% 8%
Table 15: Benchmark for evaluating IR risk management
Benchmark
All respondents
n = 498
Financial firms n = 237
Non‐financial firms n = 287
a. Cost of funds relative to a target (fixed/floating) portfolio 35% 24% 45%
b. The volatility of interest expense relative to target portfolio 25% 30% 21%
c. Cost of funds relative to an Index (e.g., LIBOR) 12% 18% 7%
d. Cost of funds relative to a target duration portfolio 14% 21% 9%
e. Our firm does not use a benchmark 13% 8% 18%
Table 16: Influence of market conditions on IR risk management
Panel A: Does the shape of the yield curve impact the size or amount of your interest rate hedge positions?
All respondents
n = 553
Financial firms n = 248
Non‐financial firms n = 293
North American firms n = 245
Foreign firms n = 296
Yes 57% 75% 43% 48% 65%
No 43% 25% 57% 52% 35%
Panel B: How Important is your firm’s forecast outlook for interest rates for the extent you hedge IR risk
All respondents
n = 561
Financial firms n = 248
Non‐financial firms n = 299
North American firms n = 250
Foreign firms n = 297
Very Important or Important
60%
71% 49% 54% 64%
Somewhat Important or not important
40% 29% 51% 46% 36%

51
Table 17: Impact on firm value from a sudden 10% decline in value of home currency For the top row and first column top number is the number of responses, the second is the percentage of responses for each category and the number in brackets in the average change in firm value. In the heavy lined conditional block, top number is number of conditional responses to both questions and the diff= [X.X%] is the average difference in the FX change on firm value between hedged case and unhedged case.
Impact on firm value of a sudden 10% decline in value of home currency
WITH FIRM’S CURRENT RISK MANAGEMENT PROGRAM
All Increase No Change Decrease
conditional totals
WITHOUT FIRM’S CURRENT RISK
MANAGEMENT
PROGRAM
All
357 345
65 18% [7.9%]
180 50% [0%]
112 31%
[‐7.7%]
Increase 51 15% [9.9%]
44 diff = [‐2.5%]
6 diff = [‐5.0%]
0 diff = [‐]
50
No Change 138 40% [0%]
2 diff = [7.5%]
130 diff = [0%]
4 diff = [‐5.8%]
136
Decrease 156 45%
[‐11.9%]
10 diff = [15.7%]
32 diff = [6.5%]
104 diff = [5.9%]
146
Conditional totals 56 168 108 332
Table 18: Firms that have “frequently” or “sometimes” used foreign currency derivatives in past three years to manage risk from...
Use of foreign currency derivatives to manage risk from …All firms n = 459
Financial firms n = 160
Non‐financial firms n = 265
North American firms n = 147
Foreign firms n = 278
b. Recorded commitments (e.g., booked contracts) 76% 75% 76% 72% 77%
d. Anticipated transactions/investments within one year 70% 75% 67% 64% 73%
a. Foreign repatriations (e.g., dividends, royalties) 68% 69% 68% 73% 65%
c. Contractual commitments (e.g., unbooked contracts) 66% 70% 63% 55% 71%
f. Translation of foreign subsidiary financial statements 58% 62% 55% 58% 58%
e. Anticipated transactions/investments in more than one year 48% 59% 41% 43% 51%

52
Table 19: Use of various foreign currency contracts /positions to manage FX risk
Panel A: Use of foreign currency contracts /positions (as percentage of all respondents)
All firms n = 427
Financial firms n = 180
Non‐financial firms n = 240
North American firms n = 140
Foreign firms n = 280
a. Forward contracts 64% 62% 66% 55% 69%
h. Cross currency swaps 38% 54% 27% 36% 40%
c. Futures contracts 32% 45% 23% 33% 32%
b. Money market deposits/loans 31% 39% 25% 19% 37%
i. Foreign currency debt financing 27% 29% 25% 27% 27%
f. Exchange‐traded options 17% 24% 13% 16% 18%
g. Option combinations (e.g., caps, collars) 17% 22% 13% 17% 17%
e. OTC options 17% 26% 9% 9% 20%
d. Non deliverable forwards (NDFs) 15% 22% 10% 9% 18%
Panel B: FX instrument/position ranked as #1 most commonly used (as percentage of users of that instrument/position above)
All firms n = 427
Financial firms
Non‐financial firms
North American firms
Foreign firms
a. Forward contracts 75% 66% 80% 78% 73%
i. Foreign currency debt financing 42% 37% 44% 39% 41%
b. Money market deposits/loans 37% 30% 46% 52% 34%
h. Cross currency swaps 31% 32% 28% 44% 24%
c. Futures contracts 25% 20% 33% 37% 19%
e. OTC options 21% 19% 23% 15% 21%
f. Exchange‐traded options 15% 7% 27% 27% 10%
g. Option combinations (e.g., caps, collars) 14% 8% 22% 17% 13%
d. Non deliverable forwards (NDFs) 11% 10% 13% 23% 8%
Table 20: Percentage of total foreign currency risk managed via operational methods vs. financial derivatives and the popularity of various methods used for operational hedging of FX risk
All firms n = 332
Financial firms n = 135
Non‐financial firms n = 190
North American firms n = 115
Foreign firms n = 232
Panel A: Percentage of total FX risk managed. . .
Using operational activities 31% 28% 35% 31% 32%
indicating 100% of risk managed with operational activities 4% 1% 5% 3% 3%
Using financial derivatives 37% 49% 29% 31% 41%
indicating 100% of risk managed with financial derivatives 7% 14% 2% 3% 11%
Panel B: Popularity of various methods of operational hedging for FX risk
b. Pricing strategies 55% 44% 62% 59% 53%
a. Foreign currency debt 45% 56% 39% 44% 47%
e. Product strategies 25% 34% 19% 21% 27%
c. Shifting production location 21% 14% 25% 32% 15%
f. Increase productivity 15% 6% 19% 13% 15%
g. Other 9% 9% 9% 9% 9%
d. Promotional strategies 8% 6% 8% 9% 7%

53
Table 21: Mix of over‐the‐counter and exchange‐traded FX derivative instruments
Mix All firms n = 387
Financial firmsn = 179
Non‐financial firms n = 202
North American firms n = 121
Foreign firmsn = 260
Over‐the‐counter only 39% 31% 47% 41% 38%
Mostly OTC 23% 30% 16% 20% 24%
Equal mix 12% 13% 10% 11% 12%
Mostly exchange‐traded 14% 18% 11% 12% 16%
Exchange‐traded only 12% 8% 16% 17% 10%
Table 22: Importance of firm’s market view in FX hedging decisions
Category of importance All firms n = 454
Financial firmsn = 183
Non‐financial firms n = 263
North American firms n = 151
Foreign firmsn = 287
Very important or Important
45% 40% 50% 58% 39%
Somewhat important or Not Important
55% 60% 50% 42% 61%
Table 23: Commodity and energy risks evaluated and managed
Commodity risks Energy risks
Firms that evaluate 2 or more sources of these risks, n = 119 160
as percentage of firm that evaluate this risk 51% 44%
Of these evaluated risks how
many do firms manage
0 2% 2%
1 6% 2%
2+ 93% 96%
Table 24: Methods used for managing commodity and energy risks
All respondents
n = 193 North American firms
n = 105 Foreign firms
n = 84
Commodity and energy contracts/positions UseRanked
most used* UseRanked
most used Use Ranked
most useda. Forward contracts 39% 61% 33% 63% 46% 59%
b. Futures contracts 34% 54% 33% 51% 33% 57%
c. Fixed pricing contracts 34% 57% 38% 50% 27% 65%
h. Swaps 17% 28% 17% 22% 17% 36%
d. OTC options 13% 31% 11% 25% 15% 38%
f. Option combinations (e.g., caps, collars) 12% 25% 16% 18% 7% 50%
e. Exchange traded option contracts 9% 18% 10% 0% 8% 29%
g. Debt contracts with embedded options 2% 25% 2% 50% 2% 0%
* Ranked most used is a percentage of the number one most commonly used votes relative to all firms that indicate use
Table 25: Mix of over‐the‐counter and exchange‐traded CM and EN derivative instruments
Mix All firms n = 150
North American firms n = 72
Foreign firmsn = 74
Over‐the‐counter only 41% 38% 45%
Mostly OTC 19% 18% 18%
Equal mix 17% 19% 15%
Mostly exchange‐traded 10% 13% 8%
Exchange‐traded only 14% 13% 15%

54
Table 26: Level of discretion in CM and EN risk management approach
CM and EN risk management approach is…
All firms n = 182
North American firms n = 92
Foreign firms n = 84
Discretionary 31% 26% 37%
Variable 25% 22% 30%
Non‐discretionary 37% 46% 27%
Other 7% 7% 6%
Table 27: Forms of credit risk faced
Percentage of firms facing various forms of credit risk
All firms n = 231
Financial firms n = 123
Non‐financial firms n = 108
North American firms n = 99
Foreign firms n = 132
a. Trade credits or accounts receivable from customers 67% 46% 91% 69% 65%
f. Corporate bonds in an investment portfolio 39% 66% 8% 36% 41%
b. Long term contracts with customers 38% 43% 32% 27% 46%
e. Counterparties on financial derivatives 36% 54% 15% 31% 39%
c. Long term contracts with suppliers 23% 13% 35% 27% 20%
g. Loan guarantees (cosigning) 22% 27% 16% 14% 27%
d. Loans to vendors 13% 17% 8% 8% 17%
Table 28: Methods for managing credit risk
Percentage of firms using each method for managing credit risk
All firms n = 212
Financial firms n = 120
Non‐financial firms n = 92
North American firms n = 88
Foreign firms n = 124
a. Minimum credit rating for counterparties 65% 75% 52% 57% 71%
b. Strict caps on exposure to any single party 61% 63% 59% 59% 63%
c. Collateral 56% 78% 27% 52% 59%
h. Loan guarantees (cosigning) 29% 38% 18% 28% 30%
f. Credit default swaps 18% 28% 4% 13% 22%
d. Credit insurance 17% 13% 24% 10% 23%
g. Total return swaps 9% 16% 1% 8% 10%
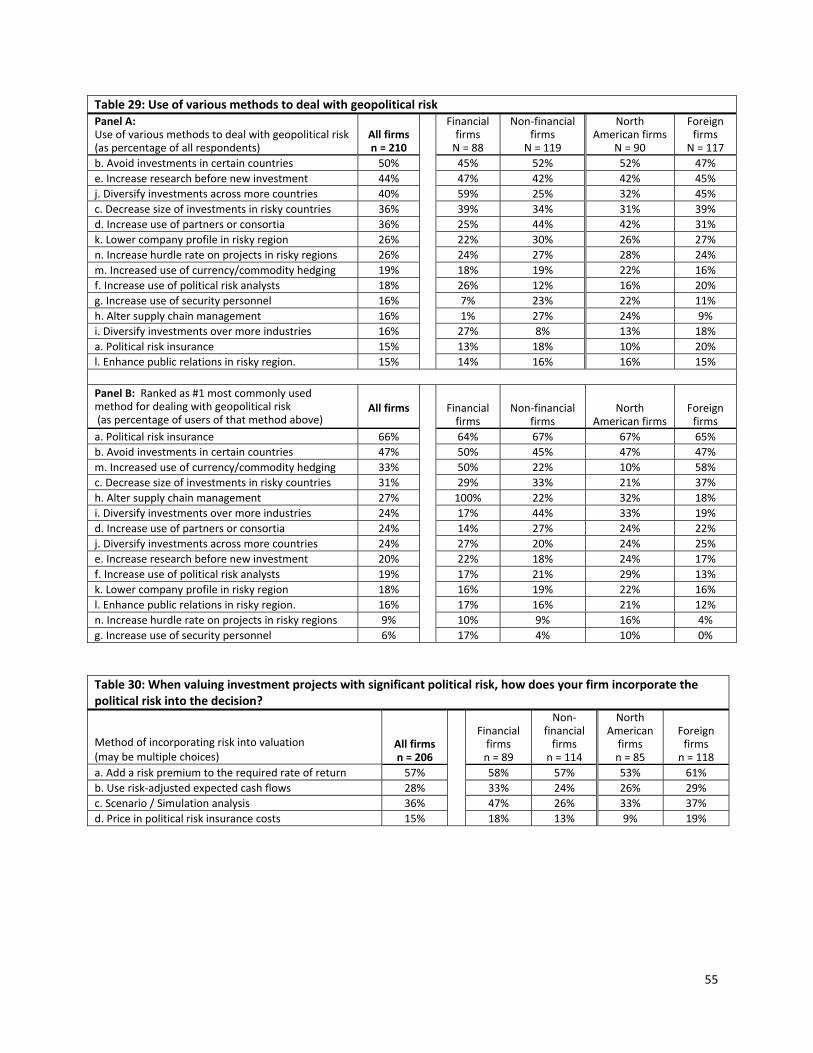
55
Table 29: Use of various methods to deal with geopolitical risk Panel A: Use of various methods to deal with geopolitical risk (as percentage of all respondents)
All firms n = 210
Financial firms N = 88
Non‐financial firms
N = 119
North American firms
N = 90
Foreign firms
N = 117
b. Avoid investments in certain countries 50% 45% 52% 52% 47%
e. Increase research before new investment 44% 47% 42% 42% 45%
j. Diversify investments across more countries 40% 59% 25% 32% 45%
c. Decrease size of investments in risky countries 36% 39% 34% 31% 39%
d. Increase use of partners or consortia 36% 25% 44% 42% 31%
k. Lower company profile in risky region 26% 22% 30% 26% 27%
n. Increase hurdle rate on projects in risky regions 26% 24% 27% 28% 24%
m. Increased use of currency/commodity hedging 19% 18% 19% 22% 16%
f. Increase use of political risk analysts 18% 26% 12% 16% 20%
g. Increase use of security personnel 16% 7% 23% 22% 11%
h. Alter supply chain management 16% 1% 27% 24% 9%
i. Diversify investments over more industries 16% 27% 8% 13% 18%
a. Political risk insurance 15% 13% 18% 10% 20%
l. Enhance public relations in risky region. 15% 14% 16% 16% 15%
Panel B: Ranked as #1 most commonly used method for dealing with geopolitical risk (as percentage of users of that method above)
All firms Financial firms
Non‐financial firms
North American firms
Foreign firms
a. Political risk insurance 66% 64% 67% 67% 65%
b. Avoid investments in certain countries 47% 50% 45% 47% 47%
m. Increased use of currency/commodity hedging 33% 50% 22% 10% 58%
c. Decrease size of investments in risky countries 31% 29% 33% 21% 37%
h. Alter supply chain management 27% 100% 22% 32% 18%
i. Diversify investments over more industries 24% 17% 44% 33% 19%
d. Increase use of partners or consortia 24% 14% 27% 24% 22%
j. Diversify investments across more countries 24% 27% 20% 24% 25%
e. Increase research before new investment 20% 22% 18% 24% 17%
f. Increase use of political risk analysts 19% 17% 21% 29% 13%
k. Lower company profile in risky region 18% 16% 19% 22% 16%
l. Enhance public relations in risky region. 16% 17% 16% 21% 12%
n. Increase hurdle rate on projects in risky regions 9% 10% 9% 16% 4%
g. Increase use of security personnel 6% 17% 4% 10% 0%
Table 30: When valuing investment projects with significant political risk, how does your firm incorporate the political risk into the decision?
Method of incorporating risk into valuation (may be multiple choices)
All firms n = 206
Financial firms n = 89
Non‐financial firms n = 114
North American firms n = 85
Foreign firms n = 118
a. Add a risk premium to the required rate of return 57% 58% 57% 53% 61%
b. Use risk‐adjusted expected cash flows 28% 33% 24% 26% 29%
c. Scenario / Simulation analysis 36% 47% 26% 33% 37%
d. Price in political risk insurance costs 15% 18% 13% 9% 19%