Embed Size (px)
Citation preview
ARENBERG DOCTORAL SCHOOL
FACULTY OF ENGINEERING SCIENCE
Managing Positive and Negative
Complexity
Design and Validation of an
IT Project Complexity Management
Framework
Supervisors:
Prof. dr. ir. Liliane Pintelon
Prof. dr. Rob J. Kusters
Stefanut Morcov
Dissertation presented in partial fulfilment
of the requirements for the degree of
Doctor of Engineering Science (PhD):
Mechanical Engineering
November 2021
Managing Positive and Negative Complexity
Design and Validation of an
IT Project Complexity Management Framework
Stefanut MORCOV
Dissertation presented in partial fulfilment
of the requirements for the degree of
Doctor of Engineering Science (PhD):
Mechanical Engineering
Examination committee:
Prof. dr. ir. Dirk Vandermeulen, chair
Prof. dr. ir. Liliane Pintelon, supervisor
Prof. dr. Rob J. Kusters, supervisor
(Open Universiteit Nederland)
Prof. dr. ir. Joseph Vandewalle
Prof. dr. ir. Traian C. Ionescu
(Politehnica University Bucharest)
Prof. dr. ir. Joep Crompvoets
Prof. dr. Geert Poels (U. Gent)
November 2021

© 2021 Stefanut Morcov, KU Leuven – Faculty of Engineering Science
Uitgegeven in eigen beheer / self-published, Stefan Morcov, Brussels, Belgium
Alle rechten voorbehouden. Niets uit deze uitgave mag worden vermenigvuldigd en/of openbaar
gemaakt worden door middel van druk, fotokopie, microfilm, elektronisch of op welke andere wijze ook
zonder voorafgaandelijke schriftelijke toestemming van de uitgever.
All rights reserved. No part of the publication may be reproduced in any form by print, photoprint,
microfilm, electronic or any other means without written permission from the publisher.
Cover illustration: Creative Commons, (Grandjean, 2014).

To universality and science.
Managing Positive and Negative Complexity
Design and Validation of an IT Project Complexity Management Framework
i
Preface & acknowledgments
This research project is about designing new models, methods and tools for
advancing IT engineering management. It is what managers and IT engineers
do: we create continuously and pragmatically new solutions to new problems.
My initial goal was to learn. Then, the mission of this project, the guiding torch
was: how will this help. I hope that the results – the new model of Positive,
Appropriate, and Negative Complexity, the IT-PCM framework and the
associated tools – will support building better IT engineering products.
It was a difficult and personal journey. Research frequently goes differently
than planned. It has ups and downs, years of groundwork, periods of over-
confidence and of doubt, ages of analysis paralysis, and a few inspirational
jumps. Overall, it was a remarkable and fulfilling experience.
There are no words to express my gratitude to my supervisors, Prof. Liliane
Pintelon and Prof. Rob J. Kusters, for their guidance, wisdom, patience and
persuasiveness to keep this project going; for their commitment to ensuring the
highest scientific standards. Thank you from my heart to my supervisory
committee members, Prof. Joos Vandewalle and Prof. Traian C. Ionescu, for
their continuous support and advice; and to the members of the examination
committee for their most useful comments and suggestions.
My utmost respect for the great learning opportunities and environment
provided by the Katholieke Universiteit Leuven.
Lots of thanks and appreciation for their professional support to my colleagues,
professors, collaborators, partners – most dear friends that I am so lucky to
have by my side. They challenged and criticized my theories and concepts;
contributed their time, experience, invaluable ideas, input, feedback, insights.
Thank you Prof. Radu Jugureanu, Florin Ilia, Doina Binig, Prof. Radu
Gramatovici, Alexandra Craciunoiu, Cristian Taslitchi, Rudolf de Schipper,
Mihaela Seidl, Theodor Stanescu, Florin Anton, Jimmy Char, Prof. Constanta
Bodea, Otto Zelch, Gabriel Nastase, Adrian Nas, Stefan Van Assche, Emil
Dragomirescu, Adeline Simota, Marius Hanganu, Ioana Radulescu, Ioan Cocan,
Dan Dorneanu, Bogdan Nitulescu, Mihai Olteanu, Monica Vidoni, Ioana
Bardan, Andreea Tariuc, Daniel Mihai, Florin Bota, Dan Maxim, Carmen Pana,
Marian Chirnoaga, Cristian Fagarasan, Prof. Claudiu Herteliu.
My warmest feelings to my family, and thanks for your support.
Managing Positive and Negative Complexity
Design and Validation of an IT Project Complexity Management Framework
ii
Abstract The world of IT engineering becomes more complex every day. IT products
are larger and more complicated, projects are more and more challenging,
difficult to manage and control. Complexity correlates with high risk, poor
performance and high failure rates; thus the study of project complexity
becomes more and more relevant for managing IT projects effectively.
At the same time, IT contributes even more to the society and economy.
Complexity is ubiquitous in modern engineering, as well as in project
management. It works. It delivers creativity, innovation, and functionality.
This project was about understanding IT project complexity and contributing
to its theoretical foundations and practice. It proposes a holistic view, and
provides insights into its Positive, Appropriate (requisite), and Negative
effects. It proposes a structured framework for IT Project Complexity
Management (IT-PCM), composed of formal processes: plan, identify,
analyze, plan responses, monitor and control. These are defined and
described in terms of inputs and outputs, and with an inventory of available
tools and techniques. Anchored in this framework, new practical tools are
proposed, for: measuring complexity; analyzing its sources and effects;
planning and monitoring complexity mitigation strategies.
The research is grounded in practice, as well as on a literature review on
project management, risk and vulnerability management, IT/IS and systems
engineering, complexity and systems theory, systems thinking. It was an
exploratory qualitative process, based on design science. Several cycles of
design-and-validation were performed with semi-structured interviews
with experts, based on an analysis of complex IT project cases. A qualitative
longitudinal evaluation consisted of the implementation and repeated
assessment of the set of proposed tools, in multiple live industry projects.
This thesis aims to provide project managers with methods for increasing
project success rates and reducing failure in complex IT project
environments. Complexity management contributes to the success of high-
risk IT projects, helps better project understanding, allows for better
prioritization and planning of resources. Managing negative complexity
reduces project risk. Positive and Appropriate complexity are catalysts for
opportunities.
Managing Positive and Negative Complexity
Design and Validation of an IT Project Complexity Management Framework
iii
Beknopte samenvatting De wereld van IT-engineering wordt met de dag complexer. IT-producten
worden groter en ingewikkelder, projecten worden uitdagender en tevens
moeilijker te beheren en te controleren. Deze complexiteit hangt samen met
een hoog risico, slechte prestaties en hoge mislukkingspercentages; de studie
van projectcomplexiteit wordt dus steeds relevanter voor het effectief
beheren van IT-projecten.
Tegelijkertijd levert IT een steeds grotere bijdrage aan de samenleving en de
economie. Complexiteit is alomtegenwoordig in moderne engineering,
evenals in projectmanagement. Het werkt. Het levert creativiteit, innovatie
en functionaliteit op.
Dit project ging over het begrijpen van de complexiteit van IT-projecten en
het bijdragen tot de theoretische fundering en de praktijk ervan. Dit
onderzoek stelt een holistische kijk voor, en verschaft inzicht in Positieve,
Passende (vereiste), en Negatieve effecten van IT-complexiteit. Er wordt een
gestructureerd kader met betrekking tot “IT Project Complexity
Management (IT-PCM)” voorgesteld. Dit bestaat uit formele processen:
plannen, identificeren, analyseren, plannen van (re)acties, monitoren en
controleren. Deze processen worden gedefinieerd en beschreven in termen
van inputs en outputs, en worden voorzien van een inventaris van
beschikbare instrumenten en technieken. Op basis van dit kader worden
nieuwe praktische instrumenten voorgesteld voor: het meten van
complexiteit; het analyseren van de bronnen en effecten ervan; het plannen
en controleren van strategieën om complexiteit te beperken.
Het onderzoek is gebaseerd op de praktijk en op een uitgebreide
literatuurstudie inzake projectmanagement, risico- en
kwetsbaarheidsmanagement, IT/IS en systems engineering, complexiteit en systeemtheorie, en systeemdenken. De aanpak kan beschreven worden als
een verkennend kwalitatief proces, gebaseerd op ontwerpwetenschap.
Verschillende cycli van ontwerp-en-validatie werden uitgevoerd aan de hand
van semi-gestructureerde interviews met deskundigen en op basis van een
analyse van complexe IT-project cases. Een kwalitatieve longitudinale
evaluatie bestond uit de implementatie en herhaalde beoordeling van de set
van voorgestelde tools, in meerdere live industriële projecten.
Dit doctoraatsonderzoek beoogt projectmanagers te voorzien van methoden
om de slaagkansen van projecten te vergroten en falen in complexe IT-

iv
projectomgevingen te verminderen. Complexiteitsmanagement draagt bij tot
het succes van IT-projecten met een hoog risico, tot een beter begrip van het
project, en maakt een betere prioritering en planning van middelen mogelijk.
Het managen van negatieve complexiteit vermindert het projectrisico.
Positieve en gepaste complexiteit zijn katalysatoren voor kansen.
Managing Positive and Negative Complexity
Design and Validation of an IT Project Complexity Management Framework
v
Table of Contents
PREFACE & ACKNOWLEDGMENTS .................................................................................. I
ABSTRACT .................................................................................................................................. II
BEKNOPTE SAMENVATTING ........................................................................................... III
TABLE OF CONTENTS ........................................................................................................... V
ABBREVIATIONS .................................................................................................................... XI
LIST OF TABLES .................................................................................................................. XIII
LIST OF FIGURES .................................................................................................................. XV
CHAPTER I. INTRODUCTION .............................................................................................. 1
I.1. IT projects and organizational governance ............................................... 3
I.1.1. Project, portfolio, and program management ...................... 3
I.1.2. IT project management in the context of organizational
governance .......................................................................................... 5
I.2. The concept of complexity ................................................................................ 7
I.3. Complexity of IT engineering projects ........................................................ 9
I.3.1. Complexity of AI projects and ethical considerations .... 10
I.3.2. The specific challenges of managing complex IT projects
............................................................................................................... 11
I.4. Research goal, objectives, and questions ................................................ 12
I.5. Methods. Research sub-projects ................................................................. 14
I.6. Structure of the thesis ..................................................................................... 18
CHAPTER II. METHODOLOGY .......................................................................................... 21
II.1. Research methodology .................................................................................... 21
II.2. Systematic literature review – methods .................................................. 26
II.3. Theoretical foundation ................................................................................... 27
II.4. Design of the IT Project Complexity Management (IT-PCM)
framework............................................................................................................ 27
II.5. Tools design and validation methodology .............................................. 28
II.6. Tools evaluation methodology .................................................................... 29
CHAPTER III. BACKGROUND: LITERATURE REVIEW ........................................... 31
III.1. Introduction......................................................................................................... 32
III.2. Literature review - research method ........................................................ 34
Managing Positive and Negative Complexity:
Design and Validation of an IT Project Complexity Management Framework
vi
III.3. Definitions and approaches to project complexity (research
question RQ1) ..................................................................................................... 35
III.3.1. Historical approaches to project complexity ..................... 37
III.3.2. Size vs. complexity ........................................................................ 39
III.3.3. Simple, complicated, complex, and really complex
projects .............................................................................................. 40
III.3.4. Structural complexity .................................................................. 42
III.3.5. Dynamic complexity ..................................................................... 42
III.3.6. Classifications of project complexity ..................................... 44
III.4. Characteristics of project complexity (research question RQ2) .... 45
III.5. Identification and measurement of IT project complexity.
Inventory of measurement tools (research question RQ3) ............. 49
III.6. Limitations and contributions of the literature review..................... 54
III.7. Conclusion ............................................................................................................ 55
CHAPTER IV. THEORETICAL FOUNDATION. PERSPECTIVE ON PROJECT
COMPLEXITY ........................................................................................................................... 57
IV.1. Definition and model of project complexity ........................................... 58
IV.2. A holistic approach: Complexity of Complexities................................. 59
IV.3. The ubiquitousness of complexity. Positive, Appropriate, and
Negative Complexity ........................................................................................ 63
IV.3.1. The ubiquitousness of complexity .......................................... 64
IV.3.2. Positive, Appropriate, and Negative Complexity .............. 65
IV.4. Conclusion ............................................................................................................ 66
CHAPTER V. DESIGN OF THE IT PROJECT COMPLEXITY MANAGEMENT (IT-
PCM) FRAMEWORK ............................................................................................................. 69
V.1. Introduction......................................................................................................... 70
V.2. Definition of Project Complexity Management ..................................... 72
V.3. Management frameworks - background ................................................. 73
V.3.1. Risk management .......................................................................... 73
V.3.2. Vulnerability management ........................................................ 75
V.3.3. Complexity management in systems engineering ........... 76
V.3.4. Software engineering: Systems development life cycle
(SDLC), Waterfall, OOAD, Agile ................................................ 77
V.3.5. ADDIE and SAM models for instructional design ............. 79
Table of Contents
vii
V.3.6. OODA loop: observe, orient, decide, act ............................... 80
V.3.7. PDCA: plan, do, check, act ........................................................... 80
V.4. Proposed IT Project Complexity Management framework
processes .............................................................................................................. 81
V.4.1. Planning: deciding when and how to manage complexity
............................................................................................................... 85
V.4.2. Identification ................................................................................... 86
V.4.3. Analysis: qualitative and quantitative .................................. 87
V.4.4. Planning IT project complexity response strategies ....... 90
V.4.5. Monitor and control complexity .............................................. 91
V.5. Structured IT-PCM framework, with inputs, outputs, tools and
techniques, per process .................................................................................. 93
V.6. Conclusion ............................................................................................................ 99
CHAPTER VI. DESIGN OF SPECIALIZED TOOLS FOR IT PROJECT
COMPLEXITY MANAGEMENT ....................................................................................... 101
VI.1. Methods .............................................................................................................. 103
VI.2. Proposed IT project complexity measurement and analysis tool
(“Morcov tool”) ............................................................................................... 104
VI.2.1. Complexity measurement tool - weights .......................... 108
VI.2.2. Complexity measurement tool - scales .............................. 109
VI.3. The Complexity Effect Scale tool – CES: Positive, Appropriate,
Negative Complexity ..................................................................................... 110
VI.4. The Complexity Source/Effect Segmentation Matrix tool – COSM
................................................................................................................................ 112
VI.5. Mitigation Strategies Matrix – MSM ....................................................... 115
VI.5.1. Background, and similarities with other response plan
strategies ........................................................................................ 115
VI.5.2. Project complexity response strategies ............................ 117
VI.6. CoRe: the Complexity Register form ...................................................... 121
VI.7. Conclusion ......................................................................................................... 122
CHAPTER VII. VALIDATION OF THE TOOLS WITH EXPERTS ......................... 123
VII.1. Methods .............................................................................................................. 124
VII.2. Summary of the results ................................................................................ 126
VII.3. Detailed results: answers to questionnaires ....................................... 127
Managing Positive and Negative Complexity:
Design and Validation of an IT Project Complexity Management Framework
viii
VII.4. Discussion.......................................................................................................... 129
VII.4.1. Relation between sources and effects of complexity ... 129
VII.4.2. The cost of managing and of not-managing complexity
............................................................................................................ 130
VII.4.3. Monitoring dynamic complexity .......................................... 131
VII.4.4. Program management for complex projects ................... 131
VII.5. Limitations, validity, and reliability of the design-and-validation
project ................................................................................................................. 132
VII.6. Conclusion ......................................................................................................... 133
CHAPTER VIII. PRACTICAL EVALUATION OF THE TOOLS IN ACTUAL
PROJECT CASES .................................................................................................................. 135
VIII.1. Introduction...................................................................................................... 136
VIII.2. Evaluated tools ................................................................................................ 137
VIII.3. Methods .............................................................................................................. 138
VIII.3.1. Approach ........................................................................................ 138
VIII.3.2. Methodology ................................................................................. 139
VIII.3.3. Methodology design – details ................................................ 140
VIII.3.4. Case study execution – details .............................................. 143
VIII.3.5. Analysis and interpretation of the research results ..... 145
VIII.4. Results ................................................................................................................. 145
VIII.4.1. Data collection ............................................................................. 145
VIII.4.2. Complexity measurement tools ............................................ 147
VIII.4.3. Identification and analysis of complexity ......................... 150
VIII.4.4. Tools evaluation .......................................................................... 151
VIII.5. Discussion.......................................................................................................... 157
VIII.5.1. Tool selection and timing ........................................................ 157
VIII.5.2. Red-flagging vs. detailed analysis ........................................ 157
VIII.5.3. Discussion on the measurement tools ............................... 158
VIII.5.4. Difference in measurement results between the tools 159
VIII.5.5. Checklists and templates for analysis ................................ 160
VIII.5.6. The relation and overlap between risk and complexity
............................................................................................................ 160
VIII.6. Limitations, validity, and reliability of the evaluation project .... 162
Table of Contents
ix
VIII.7. Conclusion ......................................................................................................... 164
CHAPTER IX. CONCLUSIONS AND RECOMMENDATIONS ................................. 165
IX.1. Positive, Appropriate, and Negative Complexity .............................. 166
IX.2. Designed tools ................................................................................................. 166
IX.3. Research summary ........................................................................................ 168
IX.4. Implications ...................................................................................................... 170
IX.5. Limitations, validity and reliability ......................................................... 171
IX.5.1. Research approach and methods ......................................... 171
IX.5.2. Construct validity ....................................................................... 172
IX.5.3. Internal validity ........................................................................... 173
IX.5.4. External validity .......................................................................... 174
IX.5.5. Reliability ....................................................................................... 176
IX.6. Recommendations and future directions of research ..................... 177
BIBLIOGRAPHY ................................................................................................................... 179
APPENDIX A. HISTORICAL APPROACHES TO PROJECT COMPLEXITY ....... 201
APPENDIX B. PROJECT COMPLEXITY MEASUREMENT FACTORS AND
CRITERIA ............................................................................................................................... 209
APPENDIX C. MITIGATION STRATEGIES MATRIX MSM - WITH EXAMPLES
................................................................................................................................................... 214
APPENDIX D. COMMON PROJECT RISK IDENTIFICATION METHODS ........ 217
APPENDIX E. VALIDATION DETAILS: QUESTIONNAIRE TEMPLATE, AND
ANSWERS TO THE CLOSED QUESTIONS ................................................................. 218
APPENDIX F. EVALUATION OF THE TOOLS – DETAILED RESULTS ............. 221
F.1. Summary of the project case studies ..................................................... 221
F.2. Detailed results: CIFTER complexity scale measurement tool .... 223
F.3. Detailed results: Hass complexity scale measurement tool ......... 224
F.4. Detailed results: Morcov complexity scale measurement tool.... 225
F.4.1. Description and scoring................................................................... 228
APPENDIX G. DETAILED TOOLS ASSESSMENT – RESULTS OF THE
PRACTICAL EVALUATION .............................................................................................. 231
G.1. Traditional tools used/recommended for managing complexity
................................................................................................................................ 231
G.2. Specific complexity measurement and management tools........... 232

Managing Positive and Negative Complexity:
Design and Validation of an IT Project Complexity Management Framework
x
G.2.1. Analysis of the opinion of project managers, based on their
application of the tools to their own projects ................. 232
G.2.2. Analysis of the opinions of top- and portfolio-management
............................................................................................................ 235
G.2.3. Analysis of the opinions of top management only ............... 236
G.2.4. Analysis of the aggregated opinions .......................................... 236
CURRICULUM VITAE STEFAN MORCOV .................................................................. 237
LIST OF PUBLICATIONS .................................................................................................. 241
Abbreviations
xi
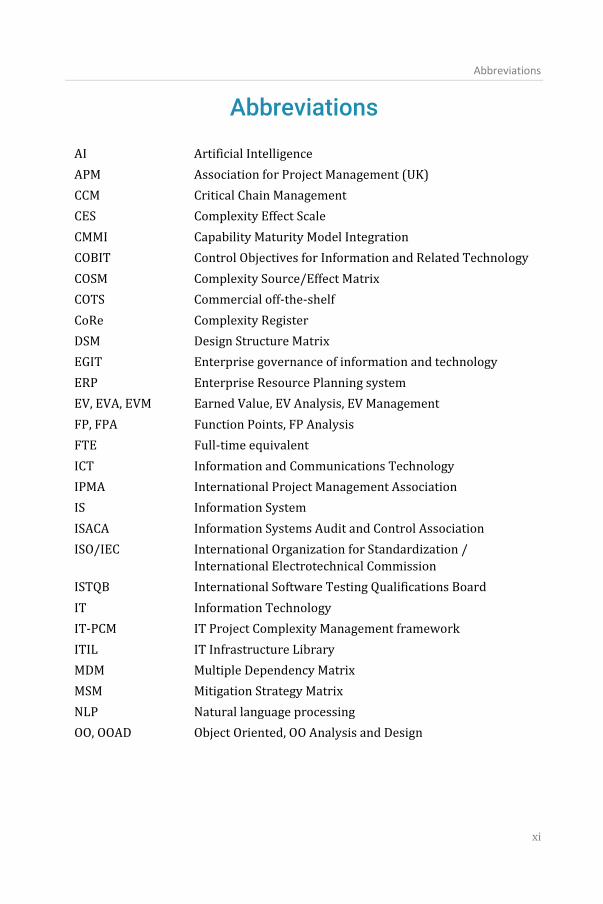
Abbreviations
AI Artificial Intelligence
APM Association for Project Management (UK)
CCM Critical Chain Management
CES Complexity Effect Scale
CMMI Capability Maturity Model Integration
COBIT Control Objectives for Information and Related Technology
COSM Complexity Source/Effect Matrix
COTS Commercial off-the-shelf
CoRe Complexity Register
DSM Design Structure Matrix
EGIT Enterprise governance of information and technology
ERP Enterprise Resource Planning system
EV, EVA, EVM Earned Value, EV Analysis, EV Management
FP, FPA Function Points, FP Analysis
FTE Full-time equivalent
ICT Information and Communications Technology
IPMA International Project Management Association
IS Information System
ISACA Information Systems Audit and Control Association
ISO/IEC International Organization for Standardization /
International Electrotechnical Commission
ISTQB International Software Testing Qualifications Board
IT Information Technology
IT-PCM IT Project Complexity Management framework
ITIL IT Infrastructure Library
MDM Multiple Dependency Matrix
MSM Mitigation Strategy Matrix
NLP Natural language processing
OO, OOAD Object Oriented, OO Analysis and Design
Managing Positive and Negative Complexity:
Design and Validation of an IT Project Complexity Management Framework
xii
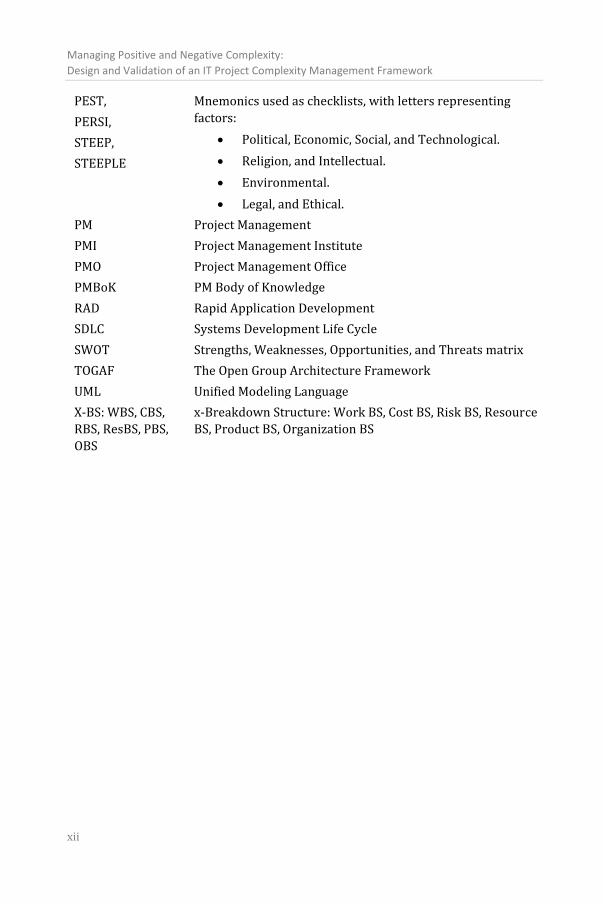
PEST,
PERSI,
STEEP,
STEEPLE
Mnemonics used as checklists, with letters representing
factors:
• Political, Economic, Social, and Technological.
• Religion, and Intellectual.
• Environmental.
• Legal, and Ethical.
PM Project Management
PMI Project Management Institute
PMO Project Management Office
PMBoK PM Body of Knowledge
RAD Rapid Application Development
SDLC Systems Development Life Cycle
SWOT Strengths, Weaknesses, Opportunities, and Threats matrix
TOGAF The Open Group Architecture Framework
UML Unified Modeling Language
X-BS: WBS, CBS,
RBS, ResBS, PBS,
OBS
x-Breakdown Structure: Work BS, Cost BS, Risk BS, Resource
BS, Product BS, Organization BS
List of tables
xiii
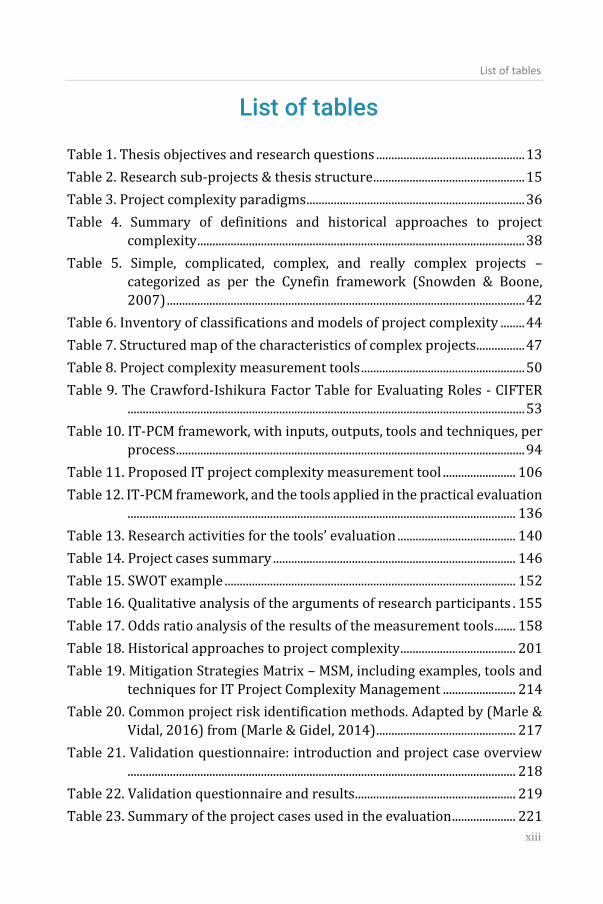
List of tables
Table 1. Thesis objectives and research questions ................................................. 13
Table 2. Research sub-projects & thesis structure .................................................. 15
Table 3. Project complexity paradigms ........................................................................ 36
Table 4. Summary of definitions and historical approaches to project
complexity ............................................................................................................ 38
Table 5. Simple, complicated, complex, and really complex projects –
categorized as per the Cynefin framework (Snowden & Boone,
2007) ...................................................................................................................... 42
Table 6. Inventory of classifications and models of project complexity ........ 44
Table 7. Structured map of the characteristics of complex projects................ 47
Table 8. Project complexity measurement tools ...................................................... 50
Table 9. The Crawford-Ishikura Factor Table for Evaluating Roles - CIFTER
................................................................................................................................... 53
Table 10. IT-PCM framework, with inputs, outputs, tools and techniques, per
process ................................................................................................................... 94
Table 11. Proposed IT project complexity measurement tool ........................ 106
Table 12. IT-PCM framework, and the tools applied in the practical evaluation
................................................................................................................................ 136
Table 13. Research activities for the tools’ evaluation ....................................... 140
Table 14. Project cases summary ................................................................................ 146
Table 15. SWOT example ................................................................................................ 152
Table 16. Qualitative analysis of the arguments of research participants . 155
Table 17. Odds ratio analysis of the results of the measurement tools ....... 158
Table 18. Historical approaches to project complexity ...................................... 201
Table 19. Mitigation Strategies Matrix – MSM, including examples, tools and
techniques for IT Project Complexity Management ........................ 214
Table 20. Common project risk identification methods. Adapted by (Marle &
Vidal, 2016) from (Marle & Gidel, 2014) .............................................. 217
Table 21. Validation questionnaire: introduction and project case overview
................................................................................................................................ 218
Table 22. Validation questionnaire and results ..................................................... 219
Table 23. Summary of the project cases used in the evaluation ..................... 221
Managing Positive and Negative Complexity:
Design and Validation of an IT Project Complexity Management Framework
xiv
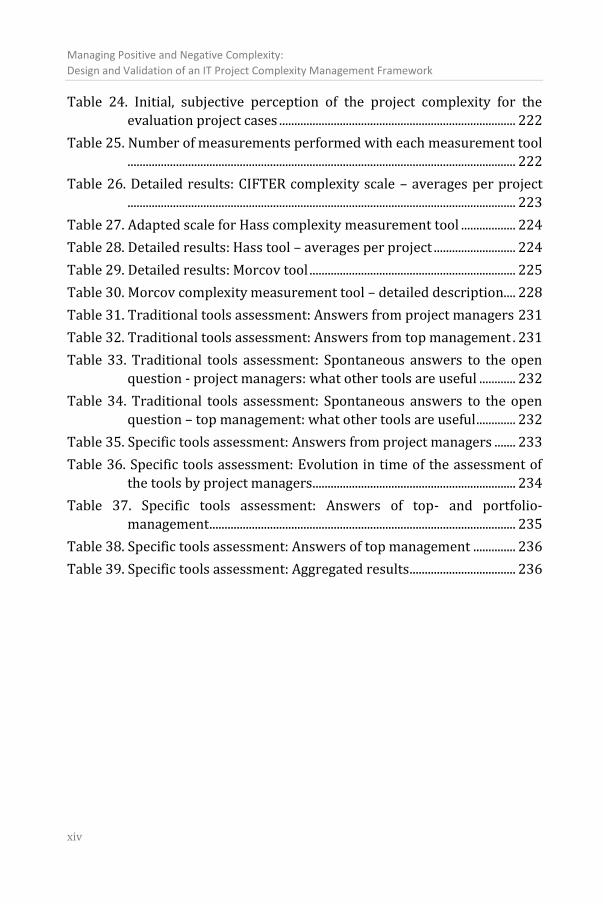
Table 24. Initial, subjective perception of the project complexity for the
evaluation project cases .............................................................................. 222
Table 25. Number of measurements performed with each measurement tool
................................................................................................................................ 222
Table 26. Detailed results: CIFTER complexity scale – averages per project
................................................................................................................................ 223
Table 27. Adapted scale for Hass complexity measurement tool .................. 224
Table 28. Detailed results: Hass tool – averages per project ........................... 224
Table 29. Detailed results: Morcov tool .................................................................... 225
Table 30. Morcov complexity measurement tool – detailed description.... 228
Table 31. Traditional tools assessment: Answers from project managers 231
Table 32. Traditional tools assessment: Answers from top management . 231
Table 33. Traditional tools assessment: Spontaneous answers to the open
question - project managers: what other tools are useful ............ 232
Table 34. Traditional tools assessment: Spontaneous answers to the open
question – top management: what other tools are useful ............. 232
Table 35. Specific tools assessment: Answers from project managers ....... 233
Table 36. Specific tools assessment: Evolution in time of the assessment of
the tools by project managers ................................................................... 234
Table 37. Specific tools assessment: Answers of top- and portfolio-
management ..................................................................................................... 235
Table 38. Specific tools assessment: Answers of top management .............. 236
Table 39. Specific tools assessment: Aggregated results ................................... 236
List of figures
xv
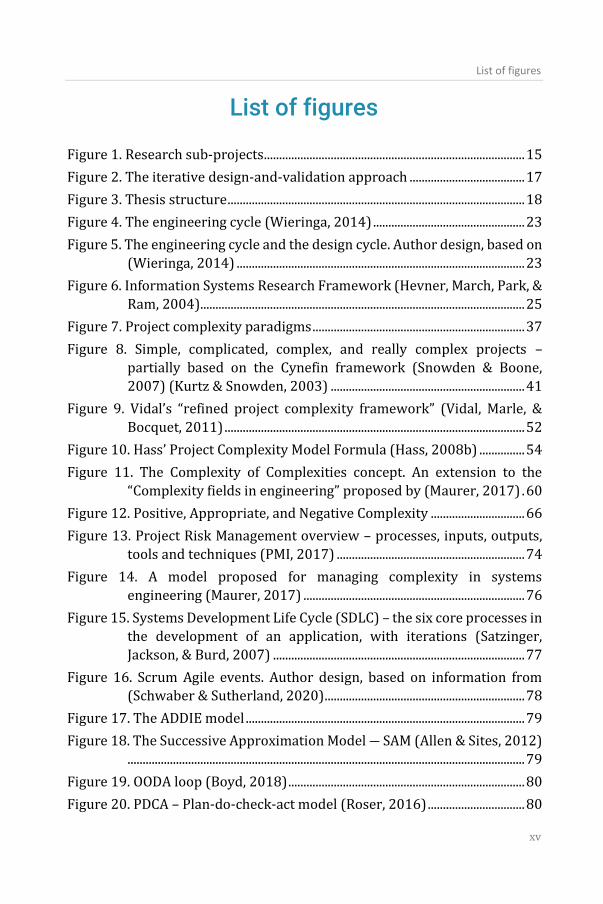
List of figures
Figure 1. Research sub-projects ...................................................................................... 15
Figure 2. The iterative design-and-validation approach ...................................... 17
Figure 3. Thesis structure .................................................................................................. 18
Figure 4. The engineering cycle (Wieringa, 2014) .................................................. 23
Figure 5. The engineering cycle and the design cycle. Author design, based on
(Wieringa, 2014) ............................................................................................... 23
Figure 6. Information Systems Research Framework (Hevner, March, Park, &
Ram, 2004) ........................................................................................................... 25
Figure 7. Project complexity paradigms ...................................................................... 37
Figure 8. Simple, complicated, complex, and really complex projects –
partially based on the Cynefin framework (Snowden & Boone,
2007) (Kurtz & Snowden, 2003) ................................................................ 41
Figure 9. Vidal’s “refined project complexity framework” (Vidal, Marle, &
Bocquet, 2011) ................................................................................................... 52
Figure 10. Hass’ Project Complexity Model Formula (Hass, 2008b) ............... 54
Figure 11. The Complexity of Complexities concept. An extension to the
“Complexity fields in engineering” proposed by (Maurer, 2017) . 60
Figure 12. Positive, Appropriate, and Negative Complexity ............................... 66
Figure 13. Project Risk Management overview – processes, inputs, outputs,
tools and techniques (PMI, 2017) .............................................................. 74
Figure 14. A model proposed for managing complexity in systems
engineering (Maurer, 2017) ......................................................................... 76
Figure 15. Systems Development Life Cycle (SDLC) – the six core processes in
the development of an application, with iterations (Satzinger,
Jackson, & Burd, 2007) ................................................................................... 77
Figure 16. Scrum Agile events. Author design, based on information from (Schwaber & Sutherland, 2020) .................................................................. 78
Figure 17. The ADDIE model ............................................................................................ 79
Figure 18. The Successive Approximation Model ― SAM (Allen & Sites, 2012)
................................................................................................................................... 79
Figure 19. OODA loop (Boyd, 2018) .............................................................................. 80
Figure 20. PDCA – Plan-do-check-act model (Roser, 2016) ................................ 80
Managing Positive and Negative Complexity:
Design and Validation of an IT Project Complexity Management Framework
xvi
Figure 21. IT Project Complexity Management framework processes ........... 82
Figure 22. Overview of the IT-PCM framework........................................................ 83
Figure 23. IT Project Complexity Management processes, inputs, outputs,
tools and techniques ........................................................................................ 84
Figure 24. The process Monitor and Control IT project complexity ................ 91
Figure 25. Research sub-project P4 - iterative design-and-validation cycles
................................................................................................................................ 102
Figure 26. Positive, Appropriate, and Negative Complexity. The Complexity
Effect Scale tool – CES ................................................................................... 111
Figure 27. The Complexity Source/Effect Segmentation Matrix COSM tool,
with the source segmentation S0 ............................................................ 113
Figure 28. Example of a simplified Complexity Source/Effect Segmentation
Matrix COSM tool, using the Sources segmentation S0 and Effects
segmentation Es.............................................................................................. 114
Figure 29 Approaches towards handling complexity (Maurer, 2017) ........ 116
Figure 30. Project complexity response strategies: the Mitigation Strategies
Matrix – MSM ................................................................................................... 117
Figure 31. Complexity Register form – CoRe .......................................................... 122
Figure 32. Participants and outputs of the case-study activities ................... 141
Figure 33. Results of the CIFTER complexity measurement tool – averages
per project and criterion (scale of 1-4) ................................................. 148
Figure 34. Results of the Hass complexity measurement tool – averages per
project and criterion (scale of 1-3) ......................................................... 149
Figure 35. Average complexity per project and per measurement tool...... 150
Figure 36. Assessments of the tools per group of participants (scale of 1-4)
................................................................................................................................ 154
Chapter I.
Introduction
1
Chapter I.
Introduction
Project management, as well as IT and software engineering, are critical
disciplines in today’s world, established and recognized, with clear
standards, methods, tools, certifications, and professional bodies. While
contemporary IT engineering projects, technology, organizations, processes,
and markets are becoming more and more complex, complex projects are
still poorly understood and face significant challenges and risks.
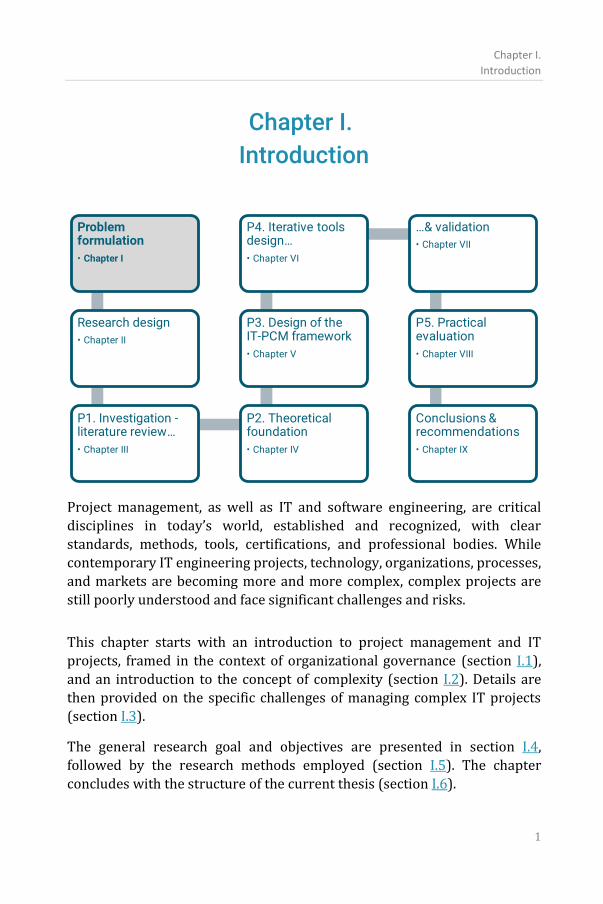
This chapter starts with an introduction to project management and IT
projects, framed in the context of organizational governance (section I.1),
and an introduction to the concept of complexity (section I.2). Details are
then provided on the specific challenges of managing complex IT projects
(section I.3).
The general research goal and objectives are presented in section I.4,
followed by the research methods employed (section I.5). The chapter
concludes with the structure of the current thesis (section I.6).
Managing Positive and Negative Complexity:
Design and Validation of an IT Project Complexity Management Framework
2
This research started from the observation that IT projects become
more and more challenging, while more and more rewarding. Projects
and products are larger, more complicated, more difficult. At the same time,
the benefits of technology to society and the economy are constantly
growing.
An astounding contemporary proof of the benefits and importance of
technology in today’s economy and society was provided by the Covid-
2019/Coronavirus pandemic. The global challenges posed during the last 2
years (2020-2021) were tackled successfully with the help of technology.
The new remote distributed work model offers in fact significant
opportunities to business, economy, to the entire society.
More than this, the current Covid-2019 pandemic offered the opportunity to
validate on a huge scale that, indeed, digital collaboration environments are
not only simulacra of the physical world, but instead they offer different,
enriched experiences. Skeuomorphism has always been a driving principle in
the design of new artifacts, based on old patterns – i.e. we design new
artifacts by mimicking the behavior of ancient artifacts, even if out of context.
In our specific example, digital artifacts tend to mimic their physical
counterpart. Thus, the calendar applications simulate paper calendars; the
memos or notes management apps look like paper-stickers and have paper
lips drawn in the corners; e-books look like paperback; the mouse pointer
looks like a finger, a pen, or a pencil.
At the same time, digital collaboration enhances the available toolset with
different tools – not available in the traditional physical environment; thus
that cannot respect skeuomorphism principles. A simple example is remote
videoconferencing: while it tries to mimic physical meetings, in fact it
provides much more than the meeting room; it also replaces the travel, and
even offers new tools such as (collaborative) whiteboards. Another simple
and already common example is the large-scale co-editing of documents:
using tools such as Microsoft Office or Google Apps, large groups of tens of
people can create a document together – something that is impossible in a
physical setting.
Due to the complexity of today’s IT product engineering, single projects,
single departments or even single organizations can no longer develop
a complete product independently. Thus, the industry moves towards
Chapter I.
Introduction
3
specialized lifecycles that involve concurrent, distributed,
incremental/iterative, agile development (Moll, Jacobs, Kusters, &
Trienekens, 2004) (Moe, Dingsøyr, & Rolland, 2018). IT engineering projects
face significant problems related to the complexity of both the products
being developed as well as to the ambiguity and uncertainty related to the
methods, tools and technologies employed during the development process.
Complexity is a ubiquitous characteristic of contemporary engineering and
project management. While it is traditionally associated with risk and high
failure rates, the traditional approaches of simplification and reductionism
into smaller simpler sub-systems are not always the best option. Specialized
tools can reduce it or manage it better; at the same time, complexity offers
essential benefits. In fact, we notice all around us that complexity works; it
delivers advanced functionality to technical products such as phones,
machines, and space aircraft; it supports innovation, creativity, adaptability
and viability of organizations (Morcov, Pintelon, & Kusters, 2020b) (Maurer,
2017) (Bar-Yam, 2003) (Stacey, 1995).
I.1. IT projects and organizational governance
I.1.1. Project, portfolio, and program management
A project is a temporary organization to which resources are assigned to create
a unique product, service, or result, bringing beneficial change (PMI, 2017)
(Turner, 2006a). This definition encompasses several key characteristics of
projects:
i) temporary, time-boxed, i.e. they have a clearly defined duration.
ii) unique, i.e. not repeatable.
iii) clear objective, creating specific value.
iv) driving change.
Project management started as a practical discipline. Its objective is to enable
organizations to execute projects effectively and efficiently. As the domain became more and more structured, and as research interest grew, more
rigorous theoretical foundations were also established, allowing project
management to be recognized as a proper academic discipline (Turner,
2006a) (Turner, 2006c).
Managing Positive and Negative Complexity:
Design and Validation of an IT Project Complexity Management Framework
4
Its main professional bodies are the Project Management Institute PMI, and
the International Project Management Association IPMA.
The body of knowledge of project management consists of management
frameworks, standards, methodologies, and manuals. It is described as
knowledge areas, processes, tools, and guidelines.
Projects are characterized by the iron triangle: they have a clear scope,
budget, and schedule. These three dimensions are key knowledge areas in
project management. Other important knowledge areas are quality
management, resource management, communication, risk, procurement,
integration, and stakeholder management.
Portfolios and programs are extensions to project management that support
managing groups of projects more effectively.
Portfolios are collections of similar projects. Portfolio management
supports efficiencies of scale, increasing success rates, and reducing project
risks, by applying similar standardized techniques to all projects in the
portfolio, by a group of project management professionals sharing common
tools and knowledge. Organizations often create Project Management Offices
as an organizational structure to support project portfolio management in a
structured way.
Programs are collections of projects that support a common objective and
set of goals. While individual projects have clearly defined and specific scope
and timeline, a program’s objectives and duration are defined with a lower
level of granularity.
The literature also lists additional structures that combine different
characteristics of the above, such as project networks, mega-projects, or
mega-programs. A project network is a temporary project formed of several
different distinct evolving phases, crossing organizational lines (Crompvoets
& Vanschoenwinkel, 2020) (Artto & Kujala, 2008) (Defillippi & Sydow, 2016).
Mega-projects and mega-programs are defined as exceptional in terms of
size, cost, public and political attention, and competencies required (Kardes,
Ozturk, Cavusgil, & Cavusgil, 2013) (Nyarirangwe & Babatunde, 2019)
(Flyvbjerg, 2017) (Sauer & Willcocks, 2007).
The following section positions IT project management in the context of
enterprise IT governance and management.
Chapter I.
Introduction
5
I.1.2. IT project management in the context of organizational governance
Corporate governance is the set of procedures and processes based on
which an organization is directed and controlled. It ensures that specific
individual initiatives and actions, including temporary projects, are aligned
with the global goals and values. Governance includes defining enterprise
objectives, ensuring that these are achieved by evaluating stakeholder needs,
conditions and options; setting direction through prioritization and decision
making; assigning rights and responsibilities; and monitoring performance,
compliance, and progress against agreed-on direction and objectives (ISACA,
2019) (ECB, 2009). Governance has thus 3 components: i) structures and
processes; ii) managing and controlling; iii) stakeholders (Buntinx,
Crompvoets, Ho, Timm, & Wayumba, 2018).
IT governance is the system that ensures that the use of ICT is directed and
controlled at the level of an organization, sustaining and extending the
organization's strategies and objectives (ISO/IEC, 2015). IT governance aims
to clarify the strategic objectives of IT in the organization, to ensure that they
are implemented, and to minimize the associated risks.
Developed by the Information Systems Audit and Control Association ISACA,
COBIT - Control Objectives for Information and Related Technology is one of
the most used enterprise governance of information and technology (EGIT)
frameworks (ISACA, 2019). COBIT supports 3 main outcomes: realizing
benefits, optimizing risks, and optimizing resources. COBIT aims to be a
comprehensive and holistic framework covering enterprises end-to-end,
assisting them in achieving their goals and delivering value through effective
governance and management of enterprise IT. It defines several components:
i) processes; ii) organizational structures; iii) principles and policies, iv)
information; v) culture, ethics, and behavior; vi) people and skills; vii) services and infrastructure.
COBIT specifically differentiates between governance and management.
Management is the group of processes that ensures the execution of the
organizational activities, in alignment with the direction set as part of the
Governance processes.
Managing Positive and Negative Complexity:
Design and Validation of an IT Project Complexity Management Framework
6
Introducing or modifying an IT-related process or tool is an organizational
change, with implications likely to cross boundaries and affect various parts
of the organization. Such a change is typically implemented by organizations
through specific IT projects.
IT projects are unique, time-boxed endeavors, that use technology to
achieve a specific objective, typically a change in the organization, in support
of a larger organizational goal. Upon the initiation and execution of individual
projects, an organization must ensure its alignment with the overall goals.
The mechanisms for ensuring this alignment are part of enterprise
governance of information and technology (EGIT) (De Haes, Van
Grembergen, Joshi, & Huygh, 2020).
The concept of governance is distinct from management. Also, governance is
relevant at all levels, including at the level of projects. Thus, project
governance consists of defining the objectives, the means of obtaining them,
and the means of monitoring the performance of a project (Turner, 2006b).
IT project management is the process of managing, i.e. planning,
organizing, and delineating responsibility, for the completion of a set of
specific information technology (IT) goals of an organization (Cole, 2015).
Since IT is ubiquitous to modern organizations and society, the scope of IT
projects in contemporary organizations can be significantly large and
complex. These projects impact the whole organization; therefore the
boundaries of traditional project management are less strict in IT projects;
they overlap with other projects and organizational processes (Elbanna,
2010). IT projects exhibit thus particular complexity traits, and require
specific coordination and management tools – as argued in the next section.
IT governance and management are areas of particular interest to
contemporary organizations. They cover a wide variety of topics and evolve
continuously. From this wide range of relevant topics, the current research
concentrates on a specific aspect, which is the management of complex IT
projects.
The following section provides an introduction to the concept of complexity,
before looking into the particularities of complex IT project management.
Chapter I.
Introduction
7
I.2. The concept of complexity
The definition of the word complexity alludes to interconnectivity. Its
etymology is Latin and relates to complicatedness – the word being formed
of com meaning together, and plectere meaning weave.
The term complex is thus often used instead of, and interchangeably with,
complicated.
The word is also often used to describe difficult problems (Ehrlenspiel, 1995)
(Maurer, 2007). Also, a large project or system is often described as
“complex” (a discussion on complexity measurement can be found in section
III.5. The relation between size and complexity is discussed in section III.3.2).
Its dictionary definitions are1:
• consisting of many different and connected/ interrelated parts;
• not easy/difficult to analyze or understand, to deal with;
• complicated or intricate;
• compound, composite;
• made or done with great care or with much detail.
Noticeably, “complex” is a fashionable word; having connotations such as
fancy, sophisticated, elaborate, baroque2.
1 Oxford’s English dictionaries, Merriam-Webster, Random House
Unabridged Dictionary etc.:
https://www.google.com/search?q=define+complex,
https://www.merriam-webster.com/thesaurus/complex,
https://www.dictionary.com/browse/complex,
https://www.oxfordlearnersdictionaries.com/definition/english/complex_
1,
https://www.oxfordlearnersdictionaries.com/definition/academic/comple
x1
2 Merriam-Webster: https://www.merriam-
webster.com/thesaurus/complex,
https://www.synonym.com/synonyms/complex
Managing Positive and Negative Complexity:
Design and Validation of an IT Project Complexity Management Framework
8
The concept of complexity, as being more than complicatedness, is ancient;
its roots can be traced to Greek philosophy. Aristotle probably formulated
the first definition of complexity, when arguing that the whole is something
else than the sum of its parts (Aristotle). This definition was later simplified
by Euclid as: the whole is more than the sum of its parts (Euclid). These 2
definitions re-emerged in contemporary approaches to complexity, which
differentiate between simple, complicated, complex and really complex – as
argued in section III.3.3 – “Simple, complicated, complex, and really complex
projects”.
Complexity re-entered mainstream science and research with the theories of
holism and gestalt psychology (Smuts, 1927) (Koffka, 1935). It is now
recognized as vital in a multitude of domains such as mathematics, chaos
theory, information and computing science, engineering, biology, ecology,
sociology, psychology, education, economics, and management.
A complex system is formed of so many interwoven components and factors,
that it does not allow varying only one factor at a time; any change in any one
factor triggering dynamic changes in a great many others (Ashby, 1961).
Mathematics and computer science made attempts at formalizing
complexity, e.g. Kolmogorov complexity (Edmonds, 1999) (Maurer, 2017).
These are not transferable to other domains that cannot be easily formulated
mathematically. In project management, such formal methods were
particularly attempted for limited problems, such as measuring the
complexity of a project plan (Nassar & Hegab, 2006).
Complexity is a topic of interest in a wide area of domains, including
engineering. Out of these, the current thesis concentrates on the specific
domain of complexity of IT projects. Accordingly, the level of applicability of
the results of the current thesis to other domains cannot be easily
formulated; such assessment being a potential topic for further investigation.
The following section discusses the particularities and challenges posed by the
management of complex IT projects.
Chapter I.
Introduction
9
I.3. Complexity of IT engineering projects
Interacting with complexity is crucial almost everywhere in engineering
(Vidal, 2009) (Maurer, 2017). While similarities are documented across
different engineering fields, the level of maturity of understanding and
tackling complexity varies from one discipline to the other, mainly because
these disciplines were founded at very different moments, and thus have
different states of the art and dispose of different tools – with software
engineering being a particularly young domain (Maurer, 2017, p. 5).
IT projects are recognized by both practitioners and researchers to have a
significant risk of failure, and high-cost overruns. IT projects systematically
derail, with industry reports suggesting that only a handful are successful -
between 16% and 31% (Standish Group, 1994) (Nelson, 2007) (Standish
Group, 2014). All IT projects exhibit traits of complexity, being difficult to
manage and control. A practical observation is that a well-managed project
is a project with a well-managed mess, rather than a project without a mess.
Some IT projects are particularly large and complex, and face significantly
difficult challenges. Research shows that a surprisingly large number of IT
projects incur massive cost and schedule challenges. In fact, one in six IT
projects is expected to be “a black swan, with a cost overrun of 200%, on
average, and a schedule overrun of almost 70%” (Flyvbjerg & Budzier, Why
Your IT Project May Be Riskier Than You Think, 2011). A significant number
of IT projects are reporting incredible losses: Levi Strauss’ SAP
implementation was a $5 million project that led to an almost $200 million
loss; the “Toll Collect” project cost Germany $10 billion in lost revenue; the
overall losses incurred by underperforming IT projects in the US are
estimated at $55 billion annually (Flyvbjerg & Budzier, Why Your IT Project
May Be Riskier Than You Think, 2011). When the European Commission
finally launched the Schengen Information System (SIS II) in 2013, the
project was more than 6 years late and 8 times more expensive than the
initial estimate, at a final cost of €500 million (European Court of Auditors,
2014). Berlin Brandenburg Airport in Germany, scheduled to open in 2011
for 2.5 billion Eur, was finally opened in 2020, with a final bill of 7 billion
(Baulinks, 2018) (Euronews, 2020).
Complexity strongly correlates with high-cost, high-risk, and poor project
performance (Williams T. M., 2005) (Patanakul, 2014) (Floricel, Michel, &
Managing Positive and Negative Complexity:
Design and Validation of an IT Project Complexity Management Framework
10
Piperca, 2016) (Bjorvatn & Wald, 2018). This makes IT project complexity
research particularly relevant to today’s IT and software engineering
environments.
I.3.1. Complexity of AI projects and ethical considerations
Ethical considerations impact our research in several aspects. Ethical factors
are environmental factors that generate complexity in IT engineering
projects both directly, as well as from a regulatory and political point of view.
The ethical aspects of engineering projects can form a complexity sub-system
in itself. Also, ethics management frameworks will become in the future more
and more a part of IT engineering.
The low level of explainability, data biases, data security, data privacy, and
ethical problems, as well as the complexity and capability associated with
technologies such as AI, make such projects unique and controversial (Siau
& Wang, 2018) (Siau & Wang, 2020) (Gabriels, 2021).
Ethics is a key characteristic of intelligence, hence it is incorporated into the
contemporary theoretical definitions and models for artificial intelligence
(AI). Thus, ethical intelligent agents have been classified into 4 categories,
starting with ethical impact agents (AMA level 1), and up to full-ethical
agents (AMA 4) (Moor, 2006).
Researchers and engineers acknowledge that true artificial intelligence does
not exist yet. “True AI” is defined as full-ethical agents, i.e. machines endowed
with conscientiousness, awareness, intentionality, free will. Accordingly, the
ethical considerations related to artificial awareness are still a domain of
theoretical research, yet to be incorporated into more practical applications.
The European Commission has dedicated special research funds and specific
actions to this domain (European Innovation Council, 2021).
Ethical aspects are highly relevant in contemporary engineering even at
lower levels than true AI. In fact, ethics and morality are embedded in every
human product. Accordingly, it makes sense to ask ethical questions about
design, right from the outset, in any project (Gabriels, 2021).
Explicit ethical agents (AMA level 3), which represent machines that make
ethical decisions based on predefined sets of rules, are specifically relevant
to this discussion. Such machines are already ubiquitous in today’s society.
We are already surrounded by such agents: cars able to make decisions,
sometimes even overriding the driver – e.g. breaking in emergency
Chapter I.
Introduction
11
situations; digital social networks that decide what kind of content is
appropriate for specific audiences, by using NLP – natural language
processing and context analysis tools. Ethical rule engines are difficult to
define and measure, which makes their behavior in itself a complex problem,
difficult to understand and explain even when given reasonable information
regarding its mechanisms.
These engineering projects have political and social implications. While
ethics is already strongly regulated in other fields such as medicine (World
Medical Association, 2013) (EP-EC, 2014), a stronger regulatory
environment is being announced in engineering as well, especially related to
artificial intelligence (European Commission, 2021).
Artificial Intelligence machines and ethical considerations of machines
constitute an important factor and cause of complexity in today’s IT
engineering.
I.3.2. The specific challenges of managing complex IT projects
Complexity in IT project management is a young area of research, but it
draws from previous theoretical research such as systems, complexity, or
chaos theories, as well as technical research areas such as systems
engineering and IT/software development.
Lack of understanding and recognition of system complexity is a critical
cause of poor performance of large-scale IS/IT projects (Patanakul, 2014).
The approach prevalent in the project management research and community
of practice is that complexity affects negatively both project performance and
project management performance (Floricel, Michel, & Piperca, 2016)
(Bjorvatn & Wald, 2018) (Ivory & Alderman, 2005) (Montequín, Joaquín,
Sonia María, & Francisco, 2018) (Głodziński, 2019).
Large-scale, complex projects are expensive. Complexity impacts negatively
all the components of the iron triangle of project management: the budget,
schedule, scope, as well as quality. The cost of complexity is therefore
expressed not only in financial terms, but also in time, delivered scope, and
quality. The cost of this complexity may compound to huge values at
completion. Complex projects have a higher risk of not accomplishing their
objectives and a higher monetary value associated with these risks, hence
significant costs are incurred when they fail.
Managing Positive and Negative Complexity:
Design and Validation of an IT Project Complexity Management Framework
12
Therefore, the management of complex IT projects is an expensive activity,
requiring special tools, expertise, and skills. Complex IT projects cannot be
managed with traditional deterministic, monolithic, top-down approaches
(Daniel & Daniel, 2018) (He, Luo, Hu, & Chan, 2015) (Zhu & Mostafavi, 2018).
They face significant, unpredictable change, similar to Lorenz's “butterfly
effect” (Lorenz, 1963). Complexity increases the likelihood of occurrence of
Black Swan events and significantly reduces the effectiveness of traditional
tools such as forecasting (Taleb, Goldstein, & Spitznagel, The Six Mistakes
Executives Make in Risk Management, 2009).
The skills and competencies of the project manager, already key to overall
project success, become even more important (Ammeter & Dukerich, 2002).
The identification of complex projects is specifically important to multi-
project engineering environments (Vidal, Marle, & Bocquet, 2011). The
traditional project management frameworks do not differentiate between
the tools and methods that should be used for complex non-deterministic
projects as opposed to simple and deterministic projects. A systematic
approach to complexity management allows for identifying, understanding,
and managing projects more efficiently, by choosing the best framework,
tools, techniques, and methodologies deployed for such projects.
I.4. Research goal, objectives, and questions
The goal of this research project is to contribute to the understanding and
management of complex IT projects.
The overall research objective is the design, validation, and evaluation of a
set of tools for the identification, analysis, and management of IT project
complexity.
To achieve this goal, several intermediate objectives and research questions
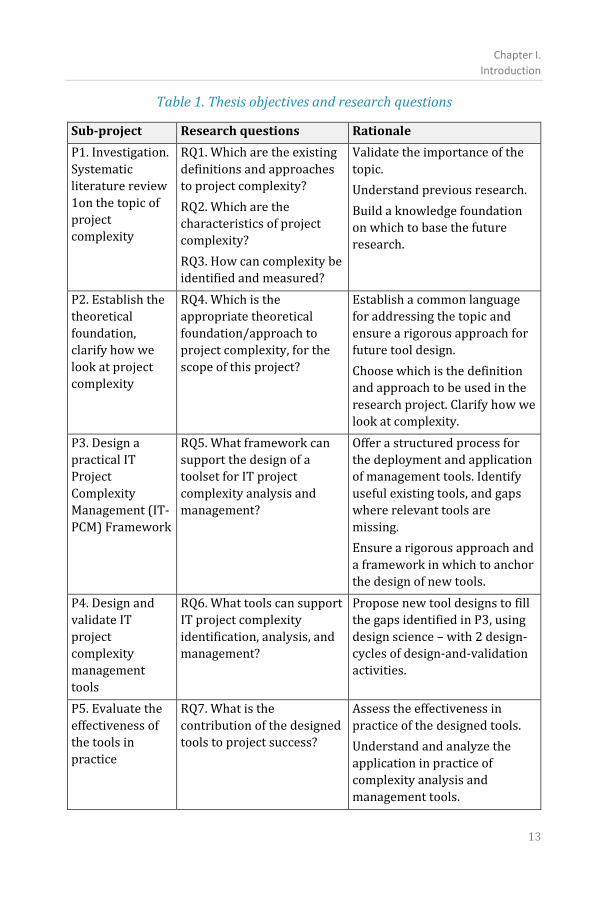
were set, that build towards the overall research objective (Table 1). Each
objective was addressed by a specific research sub-project, as described
below.
Chapter I.
Introduction
13
Table 1. Thesis objectives and research questions
Sub-project Research questions Rationale
P1. Investigation.
Systematic
literature review
1on the topic of
project
complexity
RQ1. Which are the existing
definitions and approaches
to project complexity?
RQ2. Which are the
characteristics of project
complexity?
RQ3. How can complexity be
identified and measured?
Validate the importance of the
topic.
Understand previous research.
Build a knowledge foundation
on which to base the future
research.
P2. Establish the
theoretical
foundation,
clarify how we
look at project
complexity
RQ4. Which is the
appropriate theoretical
foundation/approach to
project complexity, for the
scope of this project?
Establish a common language
for addressing the topic and
ensure a rigorous approach for
future tool design.
Choose which is the definition
and approach to be used in the
research project. Clarify how we
look at complexity.
P3. Design a
practical IT
Project
Complexity
Management (IT-
PCM) Framework
RQ5. What framework can
support the design of a
toolset for IT project
complexity analysis and
management?
Offer a structured process for
the deployment and application
of management tools. Identify
useful existing tools, and gaps
where relevant tools are
missing.
Ensure a rigorous approach and
a framework in which to anchor
the design of new tools.
P4. Design and
validate IT
project
complexity
management
tools
RQ6. What tools can support
IT project complexity
identification, analysis, and
management?
Propose new tool designs to fill
the gaps identified in P3, using
design science – with 2 design-
cycles of design-and-validation
activities.
P5. Evaluate the
effectiveness of
the tools in
practice
RQ7. What is the
contribution of the designed
tools to project success?
Assess the effectiveness in
practice of the designed tools.
Understand and analyze the
application in practice of
complexity analysis and
management tools.
Managing Positive and Negative Complexity:
Design and Validation of an IT Project Complexity Management Framework
14
The intermediate objectives, and the respective sub-projects, build towards
the overall thesis objective:
• P1, P2, P3: problem investigation; ensuring the relevance and rigor
of the design research project (Hevner, March, Park, & Ram, 2004).
• P3, P4: tool design and validation, in iterative design-cycles.
• P5: implementation and evaluation, concluding a full engineering-
cycle (Wieringa, 2014).
I.5. Methods. Research sub-projects
The research approach was qualitative, based on design science. It started
from the literature review and modern perspectives on project management,
project complexity, systems theory, and Systems and IT Engineering.
During our design research process, we embraced the fact that qualitative
research is a personal journey (Gummesson, 2000); where ideas and findings
are reconceptualized with each writing and iteration (Bansal & Corley,
2012). As such, the results of each research sub-project modeled the
activities and results of the next one; the artifacts were built in successive
iterations and increments, and updated according to the successive rounds
of review, feedback, validation, and evaluation.
Both project management and engineering take a pragmatic stance; they
design and test new tools continuously. Our research methodology followed
this pragmatic constructivist approach to solving problems, with an
iterative-incremental approach, with trial-and-error cycles, following the
engineering cycle and the design cycle (Wieringa, 2014).
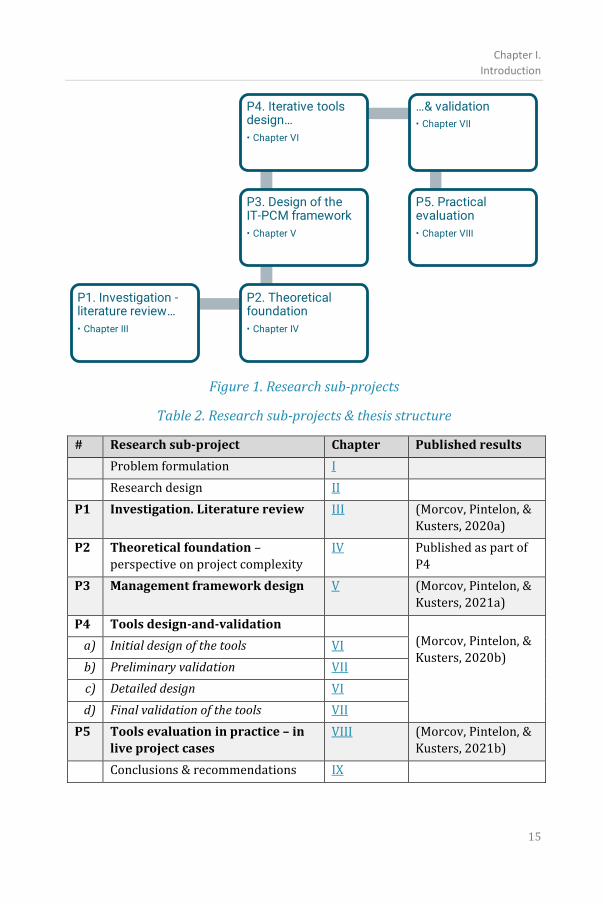
Figure 1 and Table 2 present the research sub-projects and thesis structure.
Chapter I.
Introduction
15
Figure 1. Research sub-projects
Table 2. Research sub-projects & thesis structure
# Research sub-project Chapter Published results
Problem formulation I
Research design II
P1 Investigation. Literature review III (Morcov, Pintelon, &
Kusters, 2020a)
P2 Theoretical foundation –
perspective on project complexity
IV Published as part of
P4
P3 Management framework design V (Morcov, Pintelon, &
Kusters, 2021a)
P4 Tools design-and-validation
(Morcov, Pintelon, &
Kusters, 2020b) a) Initial design of the tools VI
b) Preliminary validation VII
c) Detailed design VI
d) Final validation of the tools VII
P5 Tools evaluation in practice – in
live project cases
VIII (Morcov, Pintelon, &
Kusters, 2021b)
Conclusions & recommendations IX
Managing Positive and Negative Complexity:
Design and Validation of an IT Project Complexity Management Framework
16
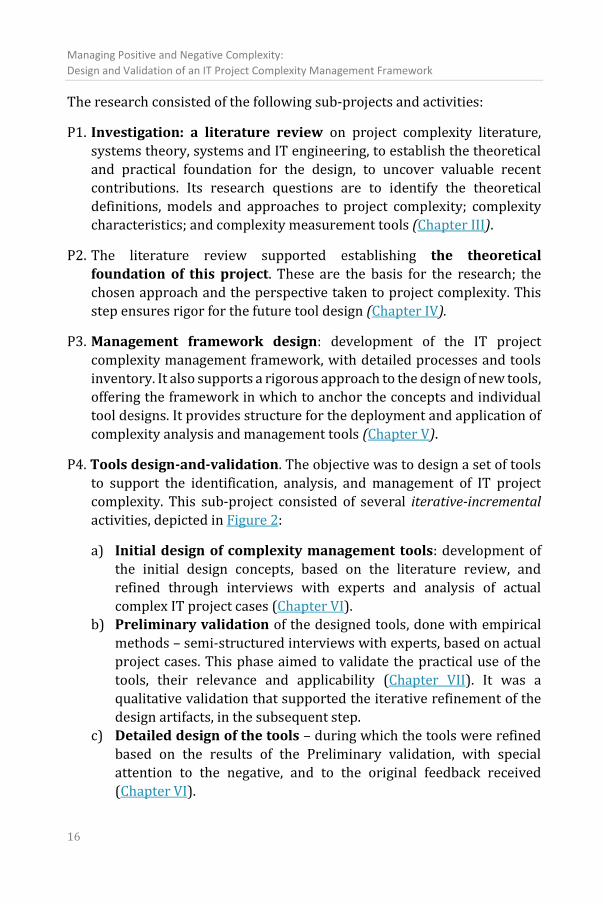
The research consisted of the following sub-projects and activities:
P1. Investigation: a literature review on project complexity literature,
systems theory, systems and IT engineering, to establish the theoretical
and practical foundation for the design, to uncover valuable recent
contributions. Its research questions are to identify the theoretical
definitions, models and approaches to project complexity; complexity
characteristics; and complexity measurement tools (Chapter III).
P2. The literature review supported establishing the theoretical
foundation of this project. These are the basis for the research; the
chosen approach and the perspective taken to project complexity. This
step ensures rigor for the future tool design (Chapter IV).
P3. Management framework design: development of the IT project
complexity management framework, with detailed processes and tools
inventory. It also supports a rigorous approach to the design of new tools,
offering the framework in which to anchor the concepts and individual
tool designs. It provides structure for the deployment and application of
complexity analysis and management tools (Chapter V).
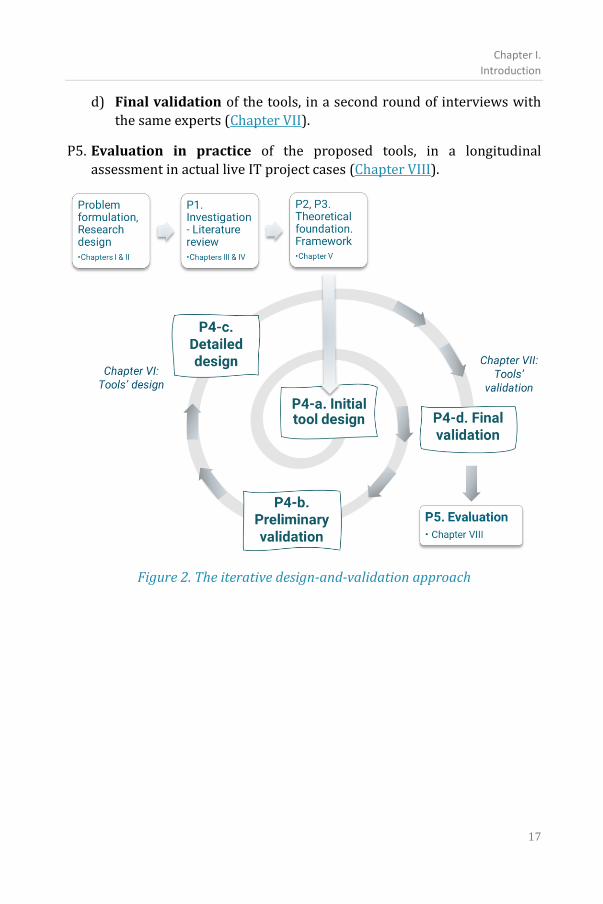
P4. Tools design-and-validation. The objective was to design a set of tools
to support the identification, analysis, and management of IT project
complexity. This sub-project consisted of several iterative-incremental
activities, depicted in Figure 2:
a) Initial design of complexity management tools: development of
the initial design concepts, based on the literature review, and
refined through interviews with experts and analysis of actual
complex IT project cases (Chapter VI).
b) Preliminary validation of the designed tools, done with empirical
methods – semi-structured interviews with experts, based on actual
project cases. This phase aimed to validate the practical use of the
tools, their relevance and applicability (Chapter VII). It was a
qualitative validation that supported the iterative refinement of the
design artifacts, in the subsequent step.
c) Detailed design of the tools – during which the tools were refined
based on the results of the Preliminary validation, with special
attention to the negative, and to the original feedback received
(Chapter VI).
Chapter I.
Introduction
17
d) Final validation of the tools, in a second round of interviews with
the same experts (Chapter VII).
P5. Evaluation in practice of the proposed tools, in a longitudinal
assessment in actual live IT project cases (Chapter VIII).
Figure 2. The iterative design-and-validation approach
Managing Positive and Negative Complexity:
Design and Validation of an IT Project Complexity Management Framework
18
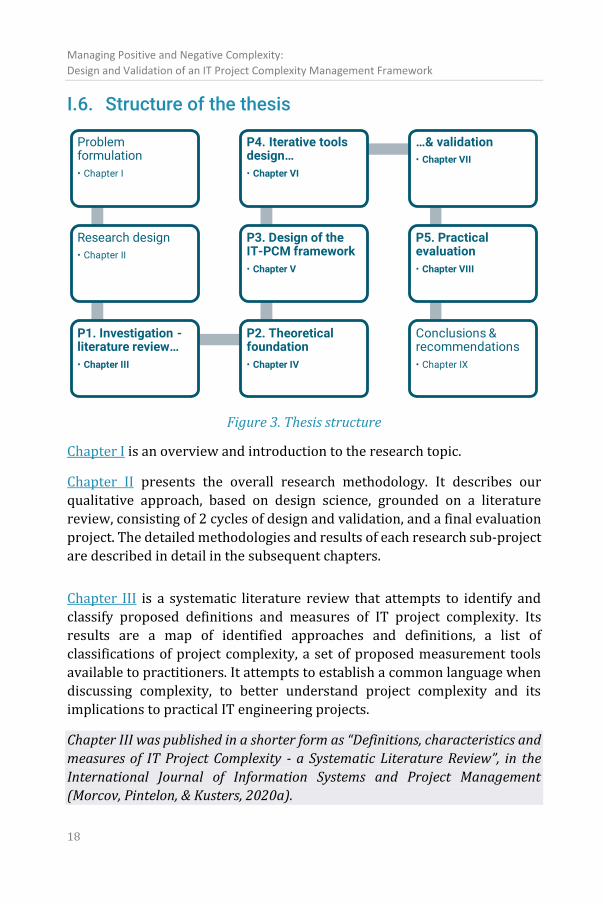
I.6. Structure of the thesis
Figure 3. Thesis structure
Chapter I is an overview and introduction to the research topic.
Chapter II presents the overall research methodology. It describes our
qualitative approach, based on design science, grounded on a literature
review, consisting of 2 cycles of design and validation, and a final evaluation
project. The detailed methodologies and results of each research sub-project
are described in detail in the subsequent chapters.
Chapter III is a systematic literature review that attempts to identify and
classify proposed definitions and measures of IT project complexity. Its
results are a map of identified approaches and definitions, a list of
classifications of project complexity, a set of proposed measurement tools
available to practitioners. It attempts to establish a common language when
discussing complexity, to better understand project complexity and its
implications to practical IT engineering projects.
Chapter III was published in a shorter form as “Definitions, characteristics and
measures of IT Project Complexity - a Systematic Literature Review”, in the
International Journal of Information Systems and Project Management
(Morcov, Pintelon, & Kusters, 2020a).
Chapter I.
Introduction
19
A set of theoretical constructs are presented in Chapter IV: Theoretical
foundation. The chapter identifies the chosen definition and model for
approaching project complexity. It defines IT Project Complexity
Management as a new project management knowledge area. It also explores
a holistic paradigm of complexity of complexities; and proposes a new
approach to complexity analysis, based on its effects: negative, appropriate,
or positive. These form the theoretical foundation for the future tool designs.
Chapter IV is an expanded form of concepts published, as a preamble to
Chapters VI and VII, in (Morcov, Pintelon, & Kusters, 2020b).
Chapter V proposes a practical IT-PCM framework to support IT Project
Complexity Management in a structured, systematic way. It consists of the
following processes: plan, identify, analyze, plan response strategies,
monitor and control. The processes and steps interact with each other and
with other project management processes; they overlap, are incremental and
iterative. These are described in terms of inputs and outputs. A detailed
inventory of available tools and techniques is proposed for each process and
step.
Chapter V was presented and published, in a shorter form, at the IADIS
Information Systems Conference (IS 2021), as: “A Framework for IT Project
Complexity Management” (Morcov, Pintelon, & Kusters, 2021a).
A set of specialized tools were designed based on the theoretical research
and literature review. These were validated and refined iteratively, through
semi-structured interviews with experienced professionals. The tools are
described in Chapter VI.
The results of the validation of these tools are presented in Chapter VII.
Chapters VI and VII were published, in a shorter form, in the Proceedings of the
Romanian Academy - Series A, as “IT Project Complexity Management Based on
Sources and Effects: Positive, Appropriate and Negative” (Morcov, Pintelon, &
Kusters, 2020b).
Managing Positive and Negative Complexity:
Design and Validation of an IT Project Complexity Management Framework
20
Chapter VIII presents the evaluation in practice of the designed tools, in
actual project cases.
Chapter VIII was accepted for publication in the International Journal of
Information Technology Project Management (IJITPM), as: “A Practical
Assessment of Modern IT Project Complexity Management Tools: Taming
Positive, Appropriate and Negative Complexity” (Morcov, Pintelon, & Kusters,
2021b).
Chapter IX, the last, presents the conclusions, implications, limitations, and a
summary of the contributions of our research to the field of IT Project
Complexity Management.
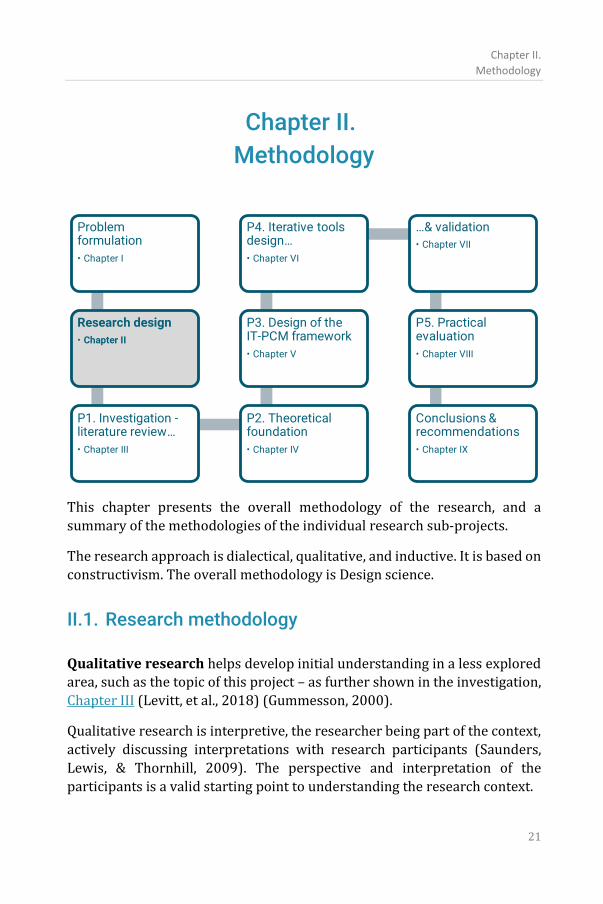
Chapter II.
Methodology
21
Chapter II.
Methodology
This chapter presents the overall methodology of the research, and a
summary of the methodologies of the individual research sub-projects.
The research approach is dialectical, qualitative, and inductive. It is based on
constructivism. The overall methodology is Design science.
II.1. Research methodology
Qualitative research helps develop initial understanding in a less explored area, such as the topic of this project – as further shown in the investigation,
Chapter III (Levitt, et al., 2018) (Gummesson, 2000).
Qualitative research is interpretive, the researcher being part of the context,
actively discussing interpretations with research participants (Saunders,
Lewis, & Thornhill, 2009). The perspective and interpretation of the
participants is a valid starting point to understanding the research context.
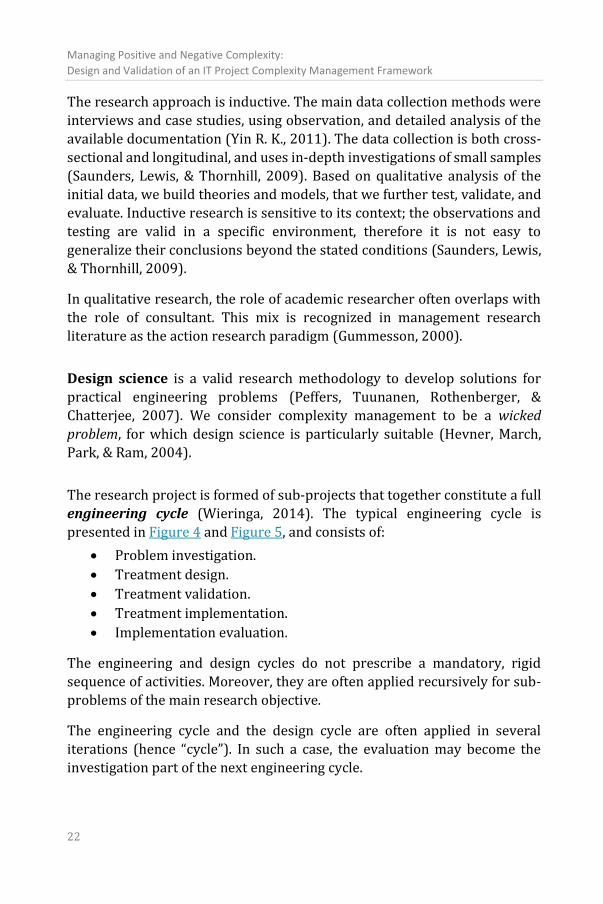
Managing Positive and Negative Complexity:
Design and Validation of an IT Project Complexity Management Framework
22
The research approach is inductive. The main data collection methods were
interviews and case studies, using observation, and detailed analysis of the
available documentation (Yin R. K., 2011). The data collection is both cross-
sectional and longitudinal, and uses in-depth investigations of small samples
(Saunders, Lewis, & Thornhill, 2009). Based on qualitative analysis of the
initial data, we build theories and models, that we further test, validate, and
evaluate. Inductive research is sensitive to its context; the observations and
testing are valid in a specific environment, therefore it is not easy to
generalize their conclusions beyond the stated conditions (Saunders, Lewis,
& Thornhill, 2009).
In qualitative research, the role of academic researcher often overlaps with
the role of consultant. This mix is recognized in management research
literature as the action research paradigm (Gummesson, 2000).
Design science is a valid research methodology to develop solutions for
practical engineering problems (Peffers, Tuunanen, Rothenberger, &
Chatterjee, 2007). We consider complexity management to be a wicked
problem, for which design science is particularly suitable (Hevner, March,
Park, & Ram, 2004).
The research project is formed of sub-projects that together constitute a full
engineering cycle (Wieringa, 2014). The typical engineering cycle is
presented in Figure 4 and Figure 5, and consists of:
• Problem investigation.
• Treatment design.
• Treatment validation.
• Treatment implementation.
• Implementation evaluation.
The engineering and design cycles do not prescribe a mandatory, rigid
sequence of activities. Moreover, they are often applied recursively for sub-
problems of the main research objective.
The engineering cycle and the design cycle are often applied in several
iterations (hence “cycle”). In such a case, the evaluation may become the
investigation part of the next engineering cycle.
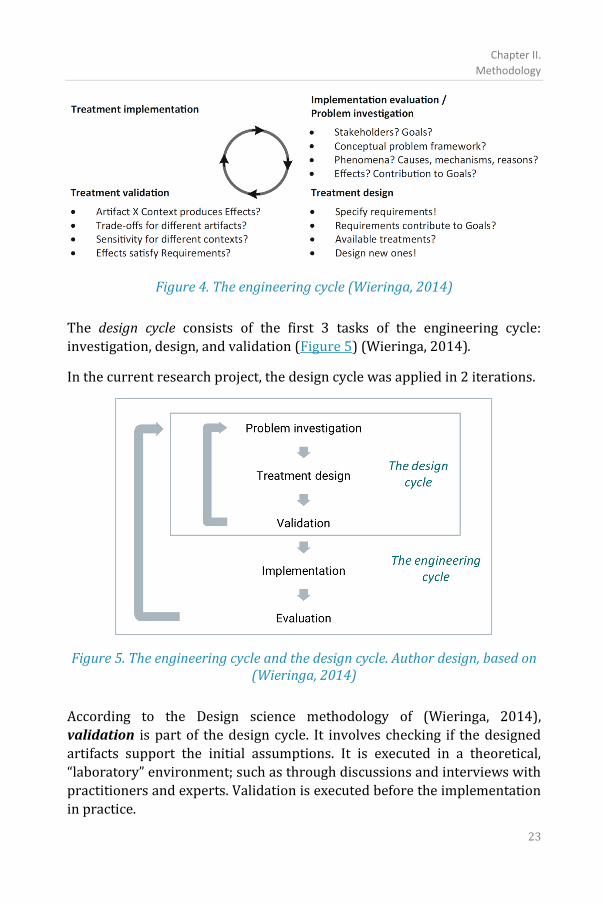
Chapter II.
Methodology
23
Figure 4. The engineering cycle (Wieringa, 2014)
The design cycle consists of the first 3 tasks of the engineering cycle:
investigation, design, and validation (Figure 5) (Wieringa, 2014).
In the current research project, the design cycle was applied in 2 iterations.
Figure 5. The engineering cycle and the design cycle. Author design, based on (Wieringa, 2014)
According to the Design science methodology of (Wieringa, 2014),
validation is part of the design cycle. It involves checking if the designed
artifacts support the initial assumptions. It is executed in a theoretical,
“laboratory” environment; such as through discussions and interviews with
practitioners and experts. Validation is executed before the implementation
in practice.
Managing Positive and Negative Complexity:
Design and Validation of an IT Project Complexity Management Framework
24
On the other hand, evaluation is executed after the implementation in
practice of the designs. It involves analyzing the behavior, effects, and impact
of the designed artifacts in practice, in the field. In our case, this meant
implementation and analysis of the designs in actual, industry IT projects.
To make a parallel with a similar framework, the Technology Readiness Level
(TRL) model, which was proposed by NASA and is currently also widely
applied in European research programs such as Horizon: validation leads to
TRL level 4 - “Technology validated in a laboratory environment”; while
evaluation leads to a TRL level 6 - “Technology demonstrated in a relevant
environment” (Héder, 2017) (European Commission, 2021b).
This research project consisted of a set of 5 sub-projects, listed above in
section I.4. Each of these answers to an intermediate objective, together
contributing to the overall research objective. These research sub-projects
form a full engineering cycle (Figure 5):
• P1 is the investigation phase of the engineering/design cycle.
• P4 is the main design-cycle. It was applied in 2 iterations.
• P5 consists of an implementation-evaluation task. It completes the
engineering-cycle.
The key ingredients to successful Design science are relevance and rigor
(Figure 6) (Hevner, March, Park, & Ram, 2004). Also, for a rigorous approach
to artifact design and investigation, a framework is needed to define
structures in the artifact and its context, so as:
• to define the concepts with which we operate;
• in which to frame observations, questions, problems, and
interpretations; and
• to allow sharing information, i.e. to provide a common language
(Wieringa, 2014).
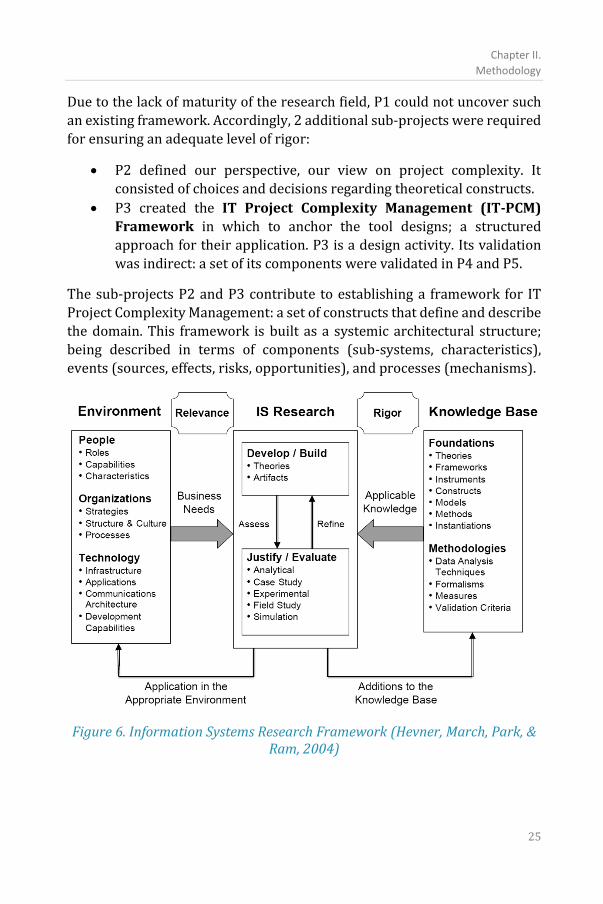
Chapter II.
Methodology
25
Due to the lack of maturity of the research field, P1 could not uncover such
an existing framework. Accordingly, 2 additional sub-projects were required
for ensuring an adequate level of rigor:
• P2 defined our perspective, our view on project complexity. It
consisted of choices and decisions regarding theoretical constructs.
• P3 created the IT Project Complexity Management (IT-PCM)
Framework in which to anchor the tool designs; a structured
approach for their application. P3 is a design activity. Its validation
was indirect: a set of its components were validated in P4 and P5.
The sub-projects P2 and P3 contribute to establishing a framework for IT
Project Complexity Management: a set of constructs that define and describe
the domain. This framework is built as a systemic architectural structure;
being described in terms of components (sub-systems, characteristics),
events (sources, effects, risks, opportunities), and processes (mechanisms).
Figure 6. Information Systems Research Framework (Hevner, March, Park, & Ram, 2004)
Managing Positive and Negative Complexity:
Design and Validation of an IT Project Complexity Management Framework
26
II.2. Systematic literature review – methods
The literature review on project complexity literature (sub-project P1,
presented in Chapter III) aimed to establish the theoretical and practical
foundation for the research project, to uncover valuable recent
contributions. Systematic reviews are relevant methods for defining a
framework of existing research, for uncovering gaps in existing research,
positioning and suggesting future research; for supporting the creation of
new hypotheses (Kitchenham, 2004).
The main research questions were:
• RQ1. Which are the existing definitions and approaches to project
complexity?
• RQ2. Which are the characteristics of project complexity?
• RQ3. How can complexity be identified and measured?
The literature review also confirmed the validity and importance of the
research topic and identified future directions of research.
The main activities performed were:
• Identify relevant literature.
o The literature review project started from the search phrase:
‘(complex OR complexity) AND (“project management”)’,
applied to the title and abstract on a large database of blind
refereed research papers, extended by snowballing and
additional areas such as Systems and IT Engineering.
• Analyze and structure the information in categorized inventories
(lists and maps):
o Chronological approaches and definitions – a long and a
summarized version.
o Classifications (or sources) of project complexity.
o Characteristics of project complexity.
o Existing complexity measurement tools.
o Complexity measurement criteria.
• Extract summaries and conclusions.

Chapter II.
Methodology
27
II.3. Theoretical foundation
The research sub-project P2 (Chapter IV) aimed to establish the theoretical
foundation, to clarify how we look at project complexity. The research
question was RQ4: Which is the appropriate theoretical foundation/approach
to project complexity, for the scope of this project?
The literature review started from the domain of project complexity. The
theory of complex systems, systems theory, and engineering complexity
were also investigated. This supported understanding of how complexity
works in general, not only in the specific area of IT project management; but
also to investigate potential solutions from other areas.
Based on this literature review, a set of theoretical constructs are proposed.
The literature review and these theoretical constructs formed the theoretical
basis in the quest to answer the research question: how can project
complexity be understood, analyzed, and managed; i.e. they are the basis for
the design of specialized tools.
A holistic paradigm of complexity of complexities is proposed, based on
systems theory.
Starting from a positive, empiricist perspective prevalent in engineering, a
new approach to complexity analysis is proposed, based on its effects:
negative, appropriate, or positive.
The choices and constructs were refined, validated, and evaluated, as part of
the research sub-projects P4 and P5.
II.4. Design of the IT Project Complexity Management (IT-PCM) framework
The research sub-project P3 (Chapter V) had the intermediate objective to
design a practical IT Project Complexity Management (IT-PCM) Framework.
The research question was RQ5: What framework can support the design of a
toolset for IT project complexity analysis and management?
The framework aims to ensure a rigorous approach to the design of new
analysis and management tools, and a structured process for their
deployment and application. It will provide a structure in which to anchor
Managing Positive and Negative Complexity:
Design and Validation of an IT Project Complexity Management Framework
28
the tools that will be further designed, validated, and evaluated in the
research sub-projects P4 and P5.
In fact, specialized tools function in a specific context, and need structure for
their application. A framework identified when and how tools should be
deployed, and their specific purpose.
The IT-PCM framework is based on an analysis of various similar
management frameworks. It is aligned with the recognized project
management body of knowledge. Its core structure is similar to the risk
management knowledge area of PMBoK (PMI, 2017). Other frameworks and
tools analyzed were: project management, risk and vulnerability
management, problem-solving, decision-making, software engineering,
systems engineering, and instructional design.
The framework was not validated or evaluated as an independent artifact.
Instead, components of the framework were validated and evaluated as part
of the research sub-projects P4 and P5.
II.5. Tools design and validation methodology
The research sub-project P4 attempted the design and validation of
specialized tools for the identification, analysis, and management of IT
project complexity. The research question was RQ6. What tools can support
IT project complexity identification, analysis, and management?
Design science is a valid research methodology to develop solutions for
practical engineering problems (Peffers, Tuunanen, Rothenberger, &
Chatterjee, 2007).
The design-and-validation methodology was an iterative incremental
process, based on the design cycle of the engineering cycle (Wieringa, 2014).
It consisted of 2 rounds of design and 2 rounds of validation with experts,
using actual IT project cases. A set of new tools were thus iteratively designed
(the results are in Chapter VI) and validated (Chapter VII).
The tools were designed:
• based on the literature review (sub-project P1).
• based on the proposed theoretical foundations (formulated in sub-
project P2).
• anchored in the structured IT-PCM framework (sub-project P3).
Chapter II.
Methodology
29
The data collection methods employed were:
• interviewing.
• collecting project case data (Yin R. K., 2011).
Considering the novelty of the research topic and hence the unclear
terminology, the preferred method of investigation was face-to-face open
interviews, which also supported the qualitative exploratory research.
The design-and-validation methodology is presented in detail in Chapter VI,
together with the final versions of the designed tools, namely:
• A specialized IT project complexity measurement tool;
• The Complexity Effect Scale – CES tool, to support the identification,
visualization and analysis of IT project complexity based on its
effects: Positive, Appropriate, and Negative.
• The Complexity Source/Effect Segmentation Matrix – COSM tool, to
support analysis of complexity based on its sources and effects.
• The complexity Mitigation Strategies Matrix – MSM, to support the
decision process for mitigating complexity, by proposing various
approaches, based on the effects and sources of complexity.
• The Complexity Register – CoRe, for data collection, complexity
analysis and monitoring.
The results and conclusions of the validation with experts are presented in
detail below, in Chapter VII.
II.6. Tools evaluation methodology
In order to evaluate the designed tools in actual live IT project cases,
following the design-and-validation research sub-project, an additional
research sub-project P5 was implemented. Besides assessing the
effectiveness in practice of the designed tools, it aimed to understand and
analyze their application in practice. The research question was RQ7: What
is the contribution of the designed tools to project success?
The research approach employed for the evaluation was also qualitative. It is
a longitudinal study, based on multiple project cases, consisting of the
deployment, application, and repeated evaluation of the set of tools, with a
live assessment of their impact on the respective projects.

Managing Positive and Negative Complexity:
Design and Validation of an IT Project Complexity Management Framework
30
For collecting feedback and assessment of the tools, live interviews with
case-study participants were conducted.
The evaluation methodology and the results are presented in detail below, in
Chapter VIII.
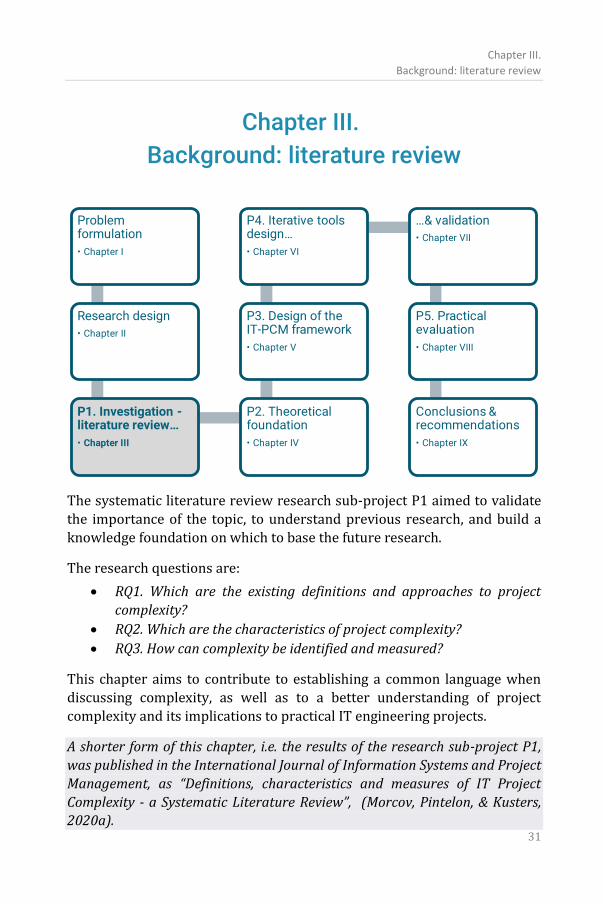
Chapter III.
Background: literature review
31
Chapter III.
Background: literature review
The systematic literature review research sub-project P1 aimed to validate
the importance of the topic, to understand previous research, and build a
knowledge foundation on which to base the future research.
The research questions are:
• RQ1. Which are the existing definitions and approaches to project
complexity?
• RQ2. Which are the characteristics of project complexity?
• RQ3. How can complexity be identified and measured?
This chapter aims to contribute to establishing a common language when
discussing complexity, as well as to a better understanding of project
complexity and its implications to practical IT engineering projects.
A shorter form of this chapter, i.e. the results of the research sub-project P1,
was published in the International Journal of Information Systems and Project
Management, as “Definitions, characteristics and measures of IT Project
Complexity - a Systematic Literature Review”, (Morcov, Pintelon, & Kusters, 2020a).
Managing Positive and Negative Complexity:
Design and Validation of an IT Project Complexity Management Framework
32
III.1. Introduction
Project complexity is not clearly understood nor sufficiently defined. The
identification and analysis of complexity suffer from vague definitions,
ambiguity in the terminology employed; confusion between definition,
sources, causes, characteristics, manifestations, and metrics. The terms are
overloaded and over-used (Edmonds, 1999). These issues affect theoretical
research as well as practice.
While significant contributions have been made to understanding project
complexity, there is still a strong need for practical tools that enable
identification and analysis of project complexity and associated strategies,
and for validation of such proposed tools.
Project complexity management has become during the past 25 years a topic
of major interest (Atkinson, Crawford, & Ward, 2006) (Baccarini, 1996)
(Castejón-Limas, Ordieres-Meré, González-Marcos, & González-Castro, 2010)
(Cicmil, Williams, Thomas, & Hodgson, 2006) (Crawford, Morris, Thomas, &
Winter, 2006) (Williams T. M., 2005) (Geraldi, Maylor, & Williams, 2011)
(Botchkarev & Finnigan, 2015). It is extensively described and defined, in
various models, in terms of characteristics, causes, and effects. Attempts
were made at measuring it.
The main historical approaches for defining project complexity are
subjective/objective, structural, and dynamic. The subjective (perceived)
complexity paradigm assumes that the complexity of a project system is
always improperly understood through the perception of an observer. The
objective (or descriptive) complexity paradigm considers complexity as an
intrinsic property of a project system. Structural complexity is expressed in
terms of quantity, variety, and interdependence of project components
(Baccarini, 1996). Dynamic complexity is related to such characteristics as
uncertainty, ambiguity, chaos, emergence, or propagation (Schlindwein &
Ison, 2004) (Marle & Vidal, 2016).
At the same time, the terminology and concepts used by literature are
ambiguous, often imported from incompletely developed sciences; they
overlap, are synonyms, or express different aspects of the same concept.
There is no widely accepted definition of complexity itself; it can be
understood differently not only in different fields, but also within the same
field; it is not yet defined why it should be measured or how (Calinescu,
Chapter III.
Background: literature review
33
Efstathiou, Schirn, & Bermejo, 1998) (Morel & Ramanujam, 1999) (Padalkar
& Gopinath, 2016).
This chapter builds knowledge in understanding complex IT projects and in
unifying the language of the domain. It maps and compares the various
approaches proposed by research. The main method employed is a
systematic review of the existing literature, followed by a classification of
results. The research also consolidates the results of other literature reviews
(Geraldi, Maylor, & Williams, 2011) (Hertogh & Westerveld, 2010) (Jaafari,
2003) (Kiridena & Sense, 2016) (Bakhshi, Ireland, & Gorod, 2016).
The results of the literature review are presented below. They include:
• In answering to research question RQ1:
o A chronological summary of historical definitions and
approaches to project complexity: presented in summary in
section III.3, Table 4; the extended version in Appendix A.
o A list of classifications of project complexity: section III.3.6,
Table 6.
• Research question RQ2:
o A structured map of the characteristics of complexity: section
III.4, Table 7.
• Research question RQ3:
o A list of identified complexity measurement tools: section
III.5, Table 8.
o A set of measurement factors and criteria: presented in
Appendix B. These were the basis for a proposed IT project
complexity measurement tool, presented in section VI.2,
Table 11.
This chapter presents the research method employed, sources, results,
conclusions, and potential directions for future research.
Managing Positive and Negative Complexity:
Design and Validation of an IT Project Complexity Management Framework
34
III.2. Literature review - research method
The literature review employed a rigorous method of identifying, evaluating,
and interpreting previous research related to complex IT projects.
Systematic reviews are relevant methods to validate theoretical hypotheses,
to support the creation of a new hypothesis, to define a framework of existing
research, to identify gaps in existing research, to position and suggest future
research (Kitchenham, 2004).
The systematic review consisted of two distinct phases: a structured search
and a classification of the results.
The search was done on a large database of blind refereed research papers,
which includes ScienceDirect, Scopus, Web of Science. No time filter was
used. The topic appears in 1993 and is formalized in 1996 (Turner &
Cochrane, 1993) (Baccarini, 1996). The initial search strategy aimed at
narrowing the searched literature to the niche topic of “complex project
management”. Each of the two domains “project management” and
“complexity” is too broad for the scope of the current research, while their
strict intersection is extremely narrow and risks excluding relevant results.
Therefore, the main search phrase used was ‘(complex OR complexity) AND
(“project management”)’, which returns 68,784 peer-reviewed articles for a
full-text search. In order to limit the results to a manageable number, while
not losing relevant articles by excessive filtering, the search phrase was only
applied to the title and abstract of peer-reviewed articles, thus reducing the
list to 691 articles. These results were thereafter extensively extended by
snowballing – analyzing the reference lists of existing papers and backward-
searching on papers that reference existing papers. All papers that matched
the topic were retained, including primary and secondary studies: meta-
analyses of the topic, descriptions of the industry situation, specific case
studies, and structured reviews. Articles that do not match the topic were not
retained. The most common cause of topic-mismatch is due to the word
“complex” itself being overloaded and over-used, often to mean “large” or
“difficult”. The research retained only articles related to project
management, while acknowledging the significant results from related
domains, including the complexity area itself, which provided the classic
definition of a complex system: “made up of a large number of parts that
interact in a non-simple way” (Simon, 1962). A number of 116 papers were
found to match exactly the topic of this review, proposing definitions,
approaches, and/or measures of project complexity.
Chapter III.
Background: literature review
35
The articles were reviewed and summarized in free text form. The amount of
information is very large, highly redundant, has heavy cross-referencing, and
the approaches are at times contradictory. The second major phase of the
research consisted, therefore, in structuring the information.
The first information structuring targeted definitions of project
complexity. A map was created with all definitions, characteristics, sources,
causes, and manifestations of project complexity, as these appear in the
literature. The method used was a formal method of classification. First,
double entries were removed; the characteristics were grouped by lexical
synonymy, each item being analyzed and either added to an existing
category, or a distinct category would be created. Second, these
characteristics were grouped by logical synonymy – using abstraction to
logically group definitions that describe the same concept or characteristic.
Depending on the specific author and approach, aspects of complexity are
sometimes considered as definition, sometimes description, cause, or effect.
Duplicate items were maintained when the authors express different
concepts with the same word. The result is a structured list of 27
characteristics, that maps the definitions and approaches, which allows for
comparison between various authors.
The second information structuring concerned measurement criteria and
tools.
III.3. Definitions and approaches to project complexity (research question RQ1)
The main historical approaches for defining IT project complexity are
subjective/objective, size-related, structural, and dynamic.
• Size-related: the simplest definition of a complex project is often a
large, or sometimes a difficult project. Size can be measured by the
number of project components such as budget, effort, duration, team
members, stakeholders, product components, work packages,
activities.
• The subjective (perceived) complexity paradigm assumes that the
complexity of a project system is always improperly understood
through the perception of an observer.
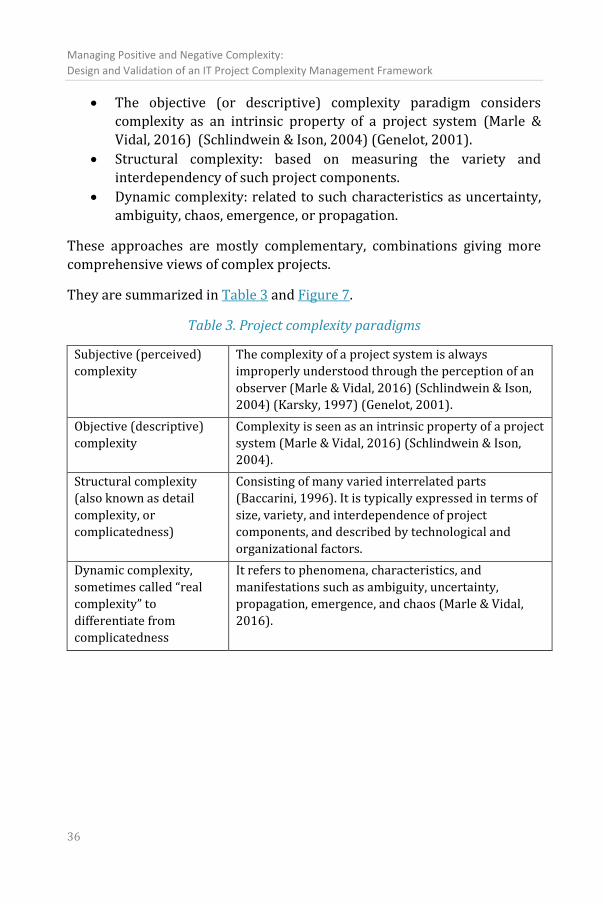
Managing Positive and Negative Complexity:
Design and Validation of an IT Project Complexity Management Framework
36
• The objective (or descriptive) complexity paradigm considers
complexity as an intrinsic property of a project system (Marle &
Vidal, 2016) (Schlindwein & Ison, 2004) (Genelot, 2001).
• Structural complexity: based on measuring the variety and
interdependency of such project components.
• Dynamic complexity: related to such characteristics as uncertainty,
ambiguity, chaos, emergence, or propagation.
These approaches are mostly complementary, combinations giving more
comprehensive views of complex projects.
They are summarized in Table 3 and Figure 7.
Table 3. Project complexity paradigms
Subjective (perceived)
complexity
The complexity of a project system is always
improperly understood through the perception of an
observer (Marle & Vidal, 2016) (Schlindwein & Ison,
2004) (Karsky, 1997) (Genelot, 2001).
Objective (descriptive)
complexity
Complexity is seen as an intrinsic property of a project
system (Marle & Vidal, 2016) (Schlindwein & Ison,
2004).
Structural complexity
(also known as detail
complexity, or
complicatedness)
Consisting of many varied interrelated parts
(Baccarini, 1996). It is typically expressed in terms of
size, variety, and interdependence of project
components, and described by technological and
organizational factors.
Dynamic complexity,
sometimes called “real
complexity” to
differentiate from
complicatedness
It refers to phenomena, characteristics, and
manifestations such as ambiguity, uncertainty,
propagation, emergence, and chaos (Marle & Vidal,
2016).
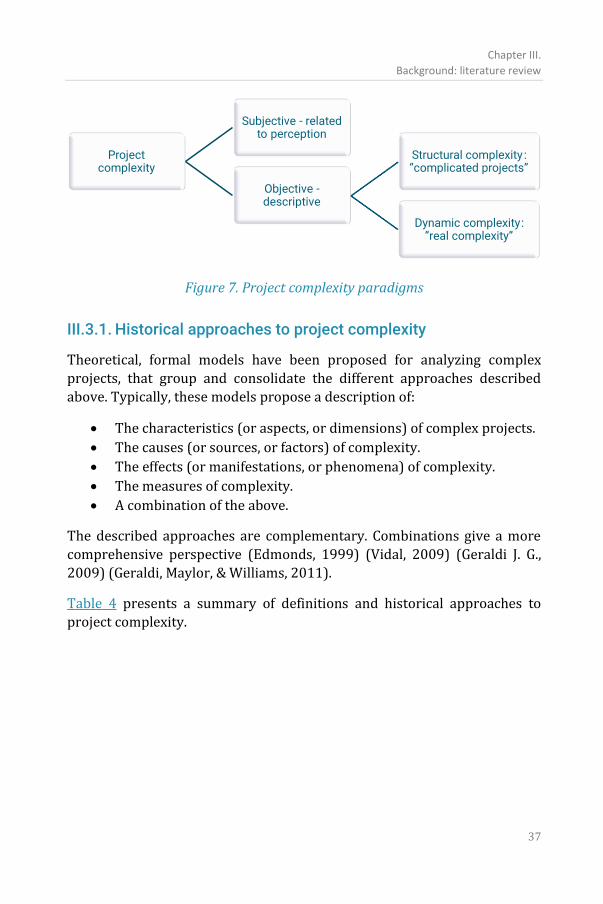
Chapter III.
Background: literature review
37
Figure 7. Project complexity paradigms
III.3.1. Historical approaches to project complexity
Theoretical, formal models have been proposed for analyzing complex
projects, that group and consolidate the different approaches described
above. Typically, these models propose a description of:
• The characteristics (or aspects, or dimensions) of complex projects.
• The causes (or sources, or factors) of complexity.
• The effects (or manifestations, or phenomena) of complexity.
• The measures of complexity.
• A combination of the above.
The described approaches are complementary. Combinations give a more
comprehensive perspective (Edmonds, 1999) (Vidal, 2009) (Geraldi J. G.,
2009) (Geraldi, Maylor, & Williams, 2011).
Table 4 presents a summary of definitions and historical approaches to
project complexity.
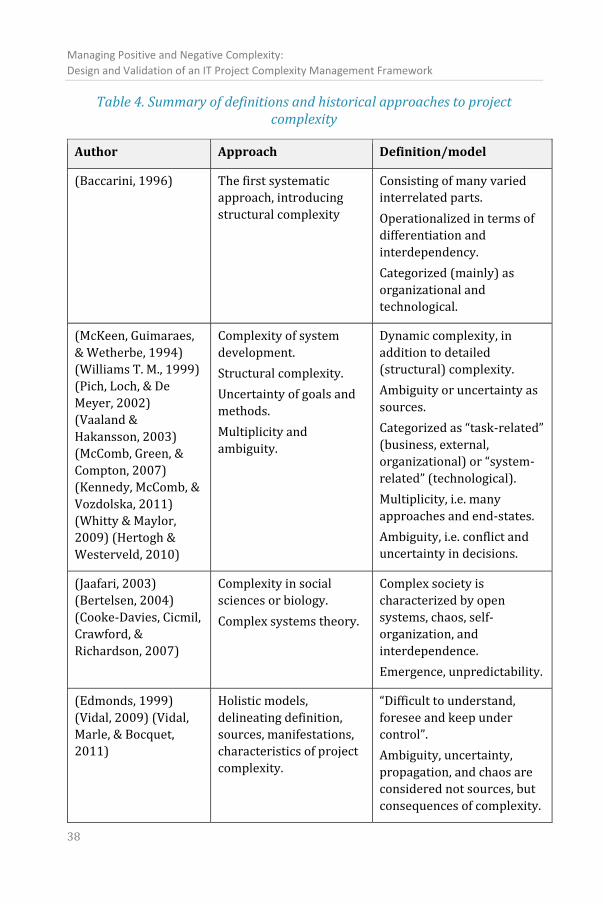
Managing Positive and Negative Complexity:
Design and Validation of an IT Project Complexity Management Framework
38
Table 4. Summary of definitions and historical approaches to project complexity
Author Approach Definition/model
(Baccarini, 1996) The first systematic
approach, introducing
structural complexity
Consisting of many varied
interrelated parts.
Operationalized in terms of
differentiation and
interdependency.
Categorized (mainly) as
organizational and
technological.
(McKeen, Guimaraes,
& Wetherbe, 1994)
(Williams T. M., 1999)
(Pich, Loch, & De
Meyer, 2002)
(Vaaland &
Hakansson, 2003)
(McComb, Green, &
Compton, 2007)
(Kennedy, McComb, &
Vozdolska, 2011)
(Whitty & Maylor,
2009) (Hertogh &
Westerveld, 2010)
Complexity of system
development.
Structural complexity.
Uncertainty of goals and
methods.
Multiplicity and
ambiguity.
Dynamic complexity, in
addition to detailed
(structural) complexity.
Ambiguity or uncertainty as
sources.
Categorized as “task-related”
(business, external,
organizational) or “system-
related” (technological).
Multiplicity, i.e. many
approaches and end-states.
Ambiguity, i.e. conflict and
uncertainty in decisions.
(Jaafari, 2003)
(Bertelsen, 2004)
(Cooke-Davies, Cicmil,
Crawford, &
Richardson, 2007)
Complexity in social
sciences or biology.
Complex systems theory.
Complex society is
characterized by open
systems, chaos, self-
organization, and
interdependence.
Emergence, unpredictability.
(Edmonds, 1999)
(Vidal, 2009) (Vidal,
Marle, & Bocquet,
2011)
Holistic models,
delineating definition,
sources, manifestations,
characteristics of project
complexity.
“Difficult to understand,
foresee and keep under
control”.
Ambiguity, uncertainty,
propagation, and chaos are
considered not sources, but
consequences of complexity.
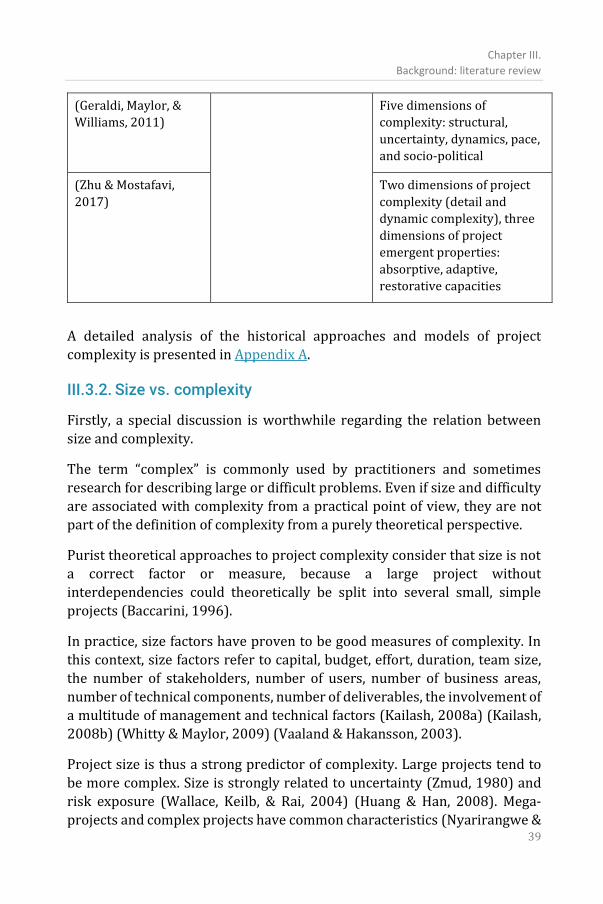
Chapter III.
Background: literature review
39
(Geraldi, Maylor, &
Williams, 2011)
Five dimensions of
complexity: structural,
uncertainty, dynamics, pace,
and socio-political
(Zhu & Mostafavi,
2017)
Two dimensions of project
complexity (detail and
dynamic complexity), three
dimensions of project
emergent properties:
absorptive, adaptive,
restorative capacities
A detailed analysis of the historical approaches and models of project
complexity is presented in Appendix A.
III.3.2. Size vs. complexity
Firstly, a special discussion is worthwhile regarding the relation between
size and complexity.
The term “complex” is commonly used by practitioners and sometimes
research for describing large or difficult problems. Even if size and difficulty
are associated with complexity from a practical point of view, they are not
part of the definition of complexity from a purely theoretical perspective.
Purist theoretical approaches to project complexity consider that size is not
a correct factor or measure, because a large project without
interdependencies could theoretically be split into several small, simple
projects (Baccarini, 1996).
In practice, size factors have proven to be good measures of complexity. In
this context, size factors refer to capital, budget, effort, duration, team size,
the number of stakeholders, number of users, number of business areas,
number of technical components, number of deliverables, the involvement of
a multitude of management and technical factors (Kailash, 2008a) (Kailash,
2008b) (Whitty & Maylor, 2009) (Vaaland & Hakansson, 2003).
Project size is thus a strong predictor of complexity. Large projects tend to
be more complex. Size is strongly related to uncertainty (Zmud, 1980) and
risk exposure (Wallace, Keilb, & Rai, 2004) (Huang & Han, 2008). Mega-
projects and complex projects have common characteristics (Nyarirangwe &
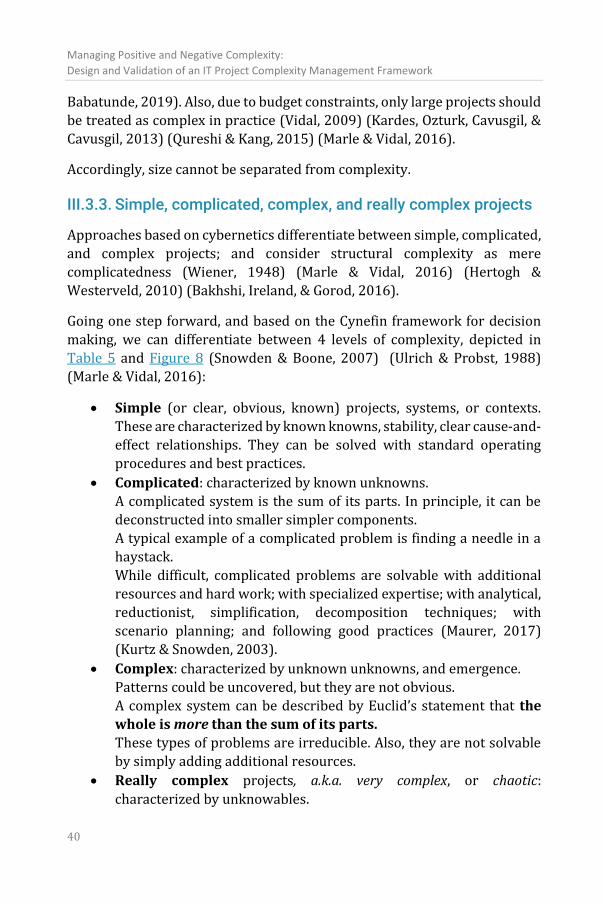
Managing Positive and Negative Complexity:
Design and Validation of an IT Project Complexity Management Framework
40
Babatunde, 2019). Also, due to budget constraints, only large projects should
be treated as complex in practice (Vidal, 2009) (Kardes, Ozturk, Cavusgil, &
Cavusgil, 2013) (Qureshi & Kang, 2015) (Marle & Vidal, 2016).
Accordingly, size cannot be separated from complexity.
III.3.3. Simple, complicated, complex, and really complex projects
Approaches based on cybernetics differentiate between simple, complicated,
and complex projects; and consider structural complexity as mere
complicatedness (Wiener, 1948) (Marle & Vidal, 2016) (Hertogh &
Westerveld, 2010) (Bakhshi, Ireland, & Gorod, 2016).
Going one step forward, and based on the Cynefin framework for decision
making, we can differentiate between 4 levels of complexity, depicted in
Table 5 and Figure 8 (Snowden & Boone, 2007) (Ulrich & Probst, 1988)
(Marle & Vidal, 2016):
• Simple (or clear, obvious, known) projects, systems, or contexts.
These are characterized by known knowns, stability, clear cause-and-
effect relationships. They can be solved with standard operating
procedures and best practices.
• Complicated: characterized by known unknowns.
A complicated system is the sum of its parts. In principle, it can be
deconstructed into smaller simpler components.
A typical example of a complicated problem is finding a needle in a
haystack.
While difficult, complicated problems are solvable with additional
resources and hard work; with specialized expertise; with analytical,
reductionist, simplification, decomposition techniques; with
scenario planning; and following good practices (Maurer, 2017)
(Kurtz & Snowden, 2003).
• Complex: characterized by unknown unknowns, and emergence.
Patterns could be uncovered, but they are not obvious.
A complex system can be described by Euclid’s statement that the
whole is more than the sum of its parts.
These types of problems are irreducible. Also, they are not solvable
by simply adding additional resources.
• Really complex projects, a.k.a. very complex, or chaotic:
characterized by unknowables.
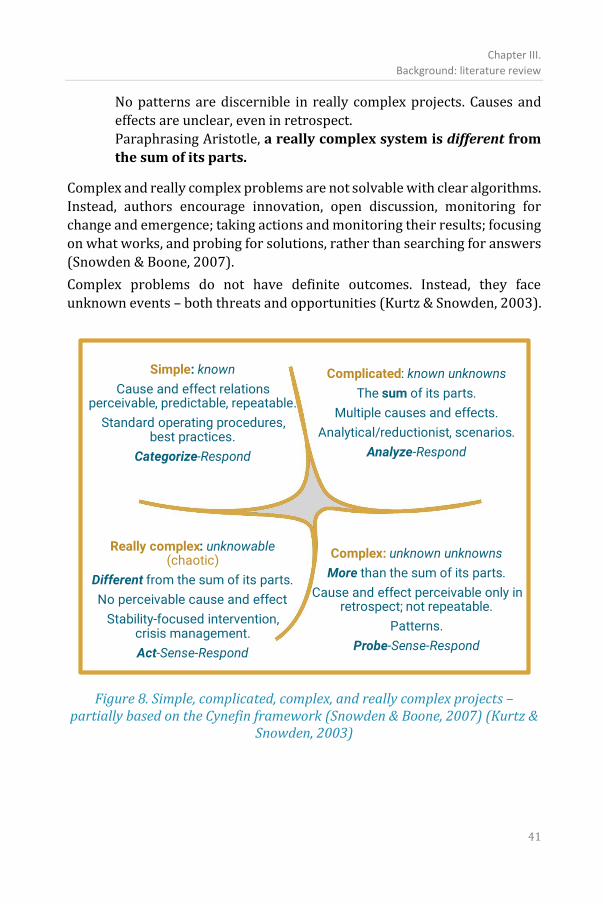
Chapter III.
Background: literature review
41
No patterns are discernible in really complex projects. Causes and
effects are unclear, even in retrospect.
Paraphrasing Aristotle, a really complex system is different from
the sum of its parts.
Complex and really complex problems are not solvable with clear algorithms.
Instead, authors encourage innovation, open discussion, monitoring for
change and emergence; taking actions and monitoring their results; focusing
on what works, and probing for solutions, rather than searching for answers
(Snowden & Boone, 2007).
Complex problems do not have definite outcomes. Instead, they face
unknown events – both threats and opportunities (Kurtz & Snowden, 2003).
Figure 8. Simple, complicated, complex, and really complex projects – partially based on the Cynefin framework (Snowden & Boone, 2007) (Kurtz &
Snowden, 2003)
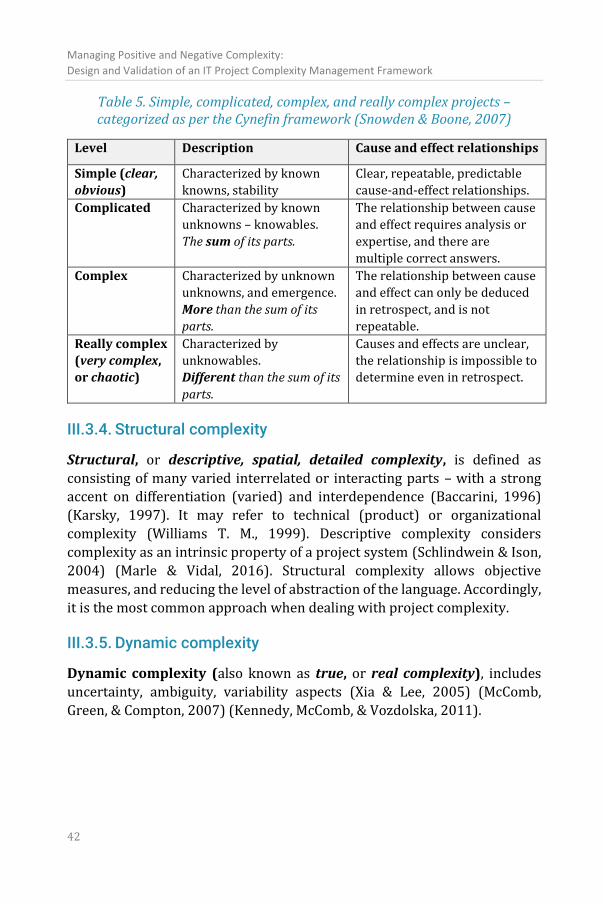
Managing Positive and Negative Complexity:
Design and Validation of an IT Project Complexity Management Framework
42
Table 5. Simple, complicated, complex, and really complex projects – categorized as per the Cynefin framework (Snowden & Boone, 2007)
Level Description Cause and effect relationships
Simple (clear,
obvious)
Characterized by known
knowns, stability
Clear, repeatable, predictable
cause-and-effect relationships.
Complicated Characterized by known
unknowns – knowables.
The sum of its parts.
The relationship between cause
and effect requires analysis or
expertise, and there are
multiple correct answers.
Complex Characterized by unknown
unknowns, and emergence.
More than the sum of its
parts.
The relationship between cause
and effect can only be deduced
in retrospect, and is not
repeatable.
Really complex
(very complex,
or chaotic)
Characterized by
unknowables.
Different than the sum of its
parts.
Causes and effects are unclear,
the relationship is impossible to
determine even in retrospect.
III.3.4. Structural complexity
Structural, or descriptive, spatial, detailed complexity, is defined as
consisting of many varied interrelated or interacting parts – with a strong accent on differentiation (varied) and interdependence (Baccarini, 1996)
(Karsky, 1997). It may refer to technical (product) or organizational
complexity (Williams T. M., 1999). Descriptive complexity considers
complexity as an intrinsic property of a project system (Schlindwein & Ison,
2004) (Marle & Vidal, 2016). Structural complexity allows objective
measures, and reducing the level of abstraction of the language. Accordingly,
it is the most common approach when dealing with project complexity.
III.3.5. Dynamic complexity
Dynamic complexity (also known as true, or real complexity), includes
uncertainty, ambiguity, variability aspects (Xia & Lee, 2005) (McComb,
Green, & Compton, 2007) (Kennedy, McComb, & Vozdolska, 2011).
Chapter III.
Background: literature review
43
Ambiguity refers to lack of clarity: inexactness, having more than one possible
meaning or interpretation, which may cause confusion3.
Uncertainty refers to unknown; to lack of information: not defined, not definite
or decided, likely to change4.
Variability refers to lack of consistency; being subject to change.
Uncertainty in both goals and methods is typical for complex projects
(Turner & Cochrane, 1993) (Castejón-Limas, Ordieres-Meré, González-
Marcos, & González-Castro, 2010) (College of Complex Project Managers And
Defence Materiel Organisation, 2006) (Williams T. M., 1999) (McComb,
Green, & Compton, 2007) (Kennedy, McComb, & Vozdolska, 2011) (Gilchrist,
Burton-Jones, & Green, 2018). Complexity arises from ambiguity or
uncertainty related to the tasks or the system (McKeen, Guimaraes, &
Wetherbe, 1994).
Complex projects have multiple approaches that may be employed and end-
states that must be satisfied to complete the project, i.e. they are
characterized by ambiguity (McComb, Green, & Compton, 2007) (Kennedy,
McComb, & Vozdolska, 2011).
Dynamic complexity is related to open systems, chaos, self-organization and
interdependence, self-modification, upward and downward causation and
unpredictability, adaptiveness (Jaafari, 2003) (Bertelsen, 2004) (Remington
& Pollack, 2007). Complex systems are defined by non-linearity, continuous
interactions with their environment, and complex feedback loops (Cooke-
Davies, Cicmil, Crawford, & Richardson, 2007). They are emergent; therefore,
3 Oxford’s English dictionaries, Cambridge Dictionary, Merriam-Webster:
https://www.oxfordlearnersdictionaries.com/definition/english/ambiguit
y?q=ambiguity,
https://dictionary.cambridge.org/dictionary/english/ambiguity,
https://www.merriam-webster.com/dictionary/ambiguity.
4Oxford’s English dictionaries, Cambridge Dictionary, Merriam-Webster:
https://www.oxfordlearnersdictionaries.com/definition/english/uncertain
?q=uncertain, https://www.merriam-webster.com/dictionary/uncertain,
https://dictionary.cambridge.org/dictionary/english/uncertainty.
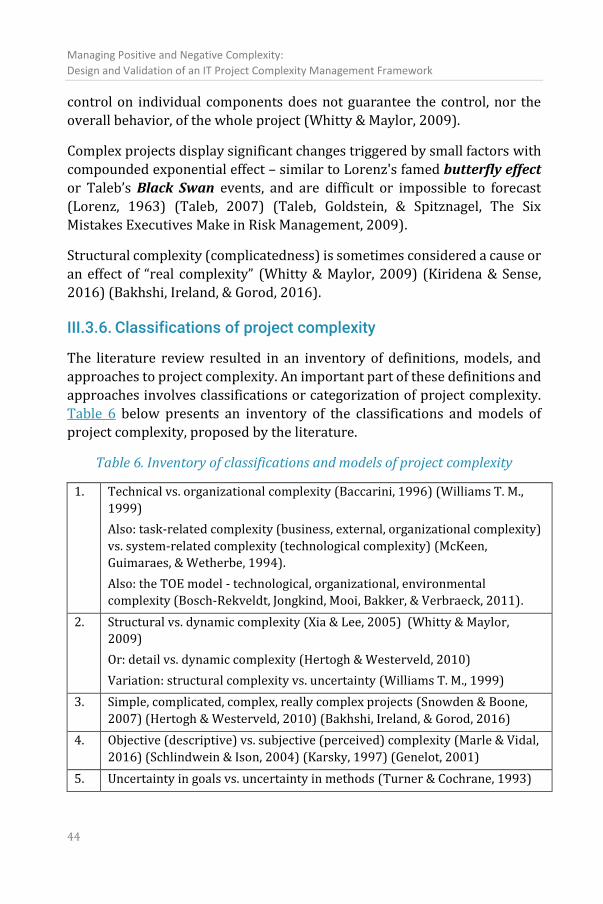
Managing Positive and Negative Complexity:
Design and Validation of an IT Project Complexity Management Framework
44
control on individual components does not guarantee the control, nor the
overall behavior, of the whole project (Whitty & Maylor, 2009).
Complex projects display significant changes triggered by small factors with
compounded exponential effect – similar to Lorenz's famed butterfly effect
or Taleb’s Black Swan events, and are difficult or impossible to forecast
(Lorenz, 1963) (Taleb, 2007) (Taleb, Goldstein, & Spitznagel, The Six
Mistakes Executives Make in Risk Management, 2009).
Structural complexity (complicatedness) is sometimes considered a cause or
an effect of “real complexity” (Whitty & Maylor, 2009) (Kiridena & Sense,
2016) (Bakhshi, Ireland, & Gorod, 2016).
III.3.6. Classifications of project complexity
The literature review resulted in an inventory of definitions, models, and
approaches to project complexity. An important part of these definitions and
approaches involves classifications or categorization of project complexity.
Table 6 below presents an inventory of the classifications and models of
project complexity, proposed by the literature.
Table 6. Inventory of classifications and models of project complexity
1. Technical vs. organizational complexity (Baccarini, 1996) (Williams T. M.,
1999)
Also: task-related complexity (business, external, organizational complexity)
vs. system-related complexity (technological complexity) (McKeen,
Guimaraes, & Wetherbe, 1994).
Also: the TOE model - technological, organizational, environmental
complexity (Bosch-Rekveldt, Jongkind, Mooi, Bakker, & Verbraeck, 2011).
2. Structural vs. dynamic complexity (Xia & Lee, 2005) (Whitty & Maylor,
2009)
Or: detail vs. dynamic complexity (Hertogh & Westerveld, 2010)
Variation: structural complexity vs. uncertainty (Williams T. M., 1999)
3. Simple, complicated, complex, really complex projects (Snowden & Boone,
2007) (Hertogh & Westerveld, 2010) (Bakhshi, Ireland, & Gorod, 2016)
4. Objective (descriptive) vs. subjective (perceived) complexity (Marle & Vidal,
2016) (Schlindwein & Ison, 2004) (Karsky, 1997) (Genelot, 2001)
5. Uncertainty in goals vs. uncertainty in methods (Turner & Cochrane, 1993)
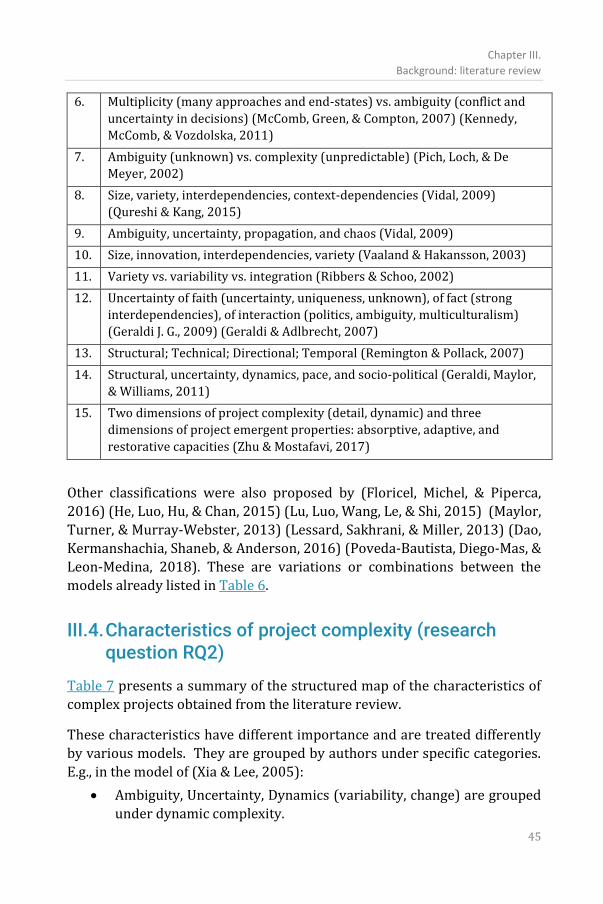
Chapter III.
Background: literature review
45
6. Multiplicity (many approaches and end-states) vs. ambiguity (conflict and
uncertainty in decisions) (McComb, Green, & Compton, 2007) (Kennedy,
McComb, & Vozdolska, 2011)
7. Ambiguity (unknown) vs. complexity (unpredictable) (Pich, Loch, & De
Meyer, 2002)
8. Size, variety, interdependencies, context-dependencies (Vidal, 2009)
(Qureshi & Kang, 2015)
9. Ambiguity, uncertainty, propagation, and chaos (Vidal, 2009)
10. Size, innovation, interdependencies, variety (Vaaland & Hakansson, 2003)
11. Variety vs. variability vs. integration (Ribbers & Schoo, 2002)
12. Uncertainty of faith (uncertainty, uniqueness, unknown), of fact (strong
interdependencies), of interaction (politics, ambiguity, multiculturalism)
(Geraldi J. G., 2009) (Geraldi & Adlbrecht, 2007)
13. Structural; Technical; Directional; Temporal (Remington & Pollack, 2007)
14. Structural, uncertainty, dynamics, pace, and socio-political (Geraldi, Maylor,
& Williams, 2011)
15. Two dimensions of project complexity (detail, dynamic) and three
dimensions of project emergent properties: absorptive, adaptive, and
restorative capacities (Zhu & Mostafavi, 2017)
Other classifications were also proposed by (Floricel, Michel, & Piperca,
2016) (He, Luo, Hu, & Chan, 2015) (Lu, Luo, Wang, Le, & Shi, 2015) (Maylor,
Turner, & Murray-Webster, 2013) (Lessard, Sakhrani, & Miller, 2013) (Dao,
Kermanshachia, Shaneb, & Anderson, 2016) (Poveda-Bautista, Diego-Mas, &
Leon-Medina, 2018). These are variations or combinations between the
models already listed in Table 6.
III.4. Characteristics of project complexity (research question RQ2)
Table 7 presents a summary of the structured map of the characteristics of
complex projects obtained from the literature review.
These characteristics have different importance and are treated differently
by various models. They are grouped by authors under specific categories.
E.g., in the model of (Xia & Lee, 2005):
• Ambiguity, Uncertainty, Dynamics (variability, change) are grouped
under dynamic complexity.
Managing Positive and Negative Complexity:
Design and Validation of an IT Project Complexity Management Framework
46
• Variety, Multiplicity, interaction between parts, and
Interdependence are grouped under structural complexity.
Also, characteristics are categorized by various models as either effects,
sources, measures, or both. As an example, an elaborate complexity model is
proposed by (Vidal, 2009), who defines 3 distinct types of aspects:
• Definitory: Difficult to understand, to foresee, and to control are part
of the definition of complexity.
• Sources: Size, Variety, Interdependence, and Context are drivers, or
factors.
• Effects: Ambiguity, Uncertainty, Propagation, and Chaos are
phenomena, or manifestations.
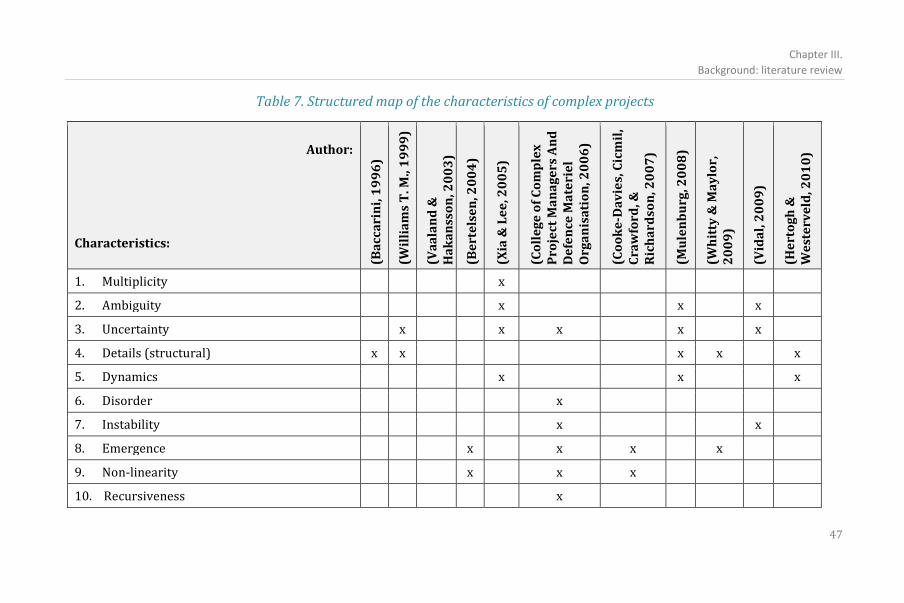
Chapter III.
Background: literature review
47
Table 7. Structured map of the characteristics of complex projects
Author:
Characteristics:
(Ba
cca
rin
i, 1
99
6)
(Wil
lia
ms
T. M
., 1
99
9)
(Va
ala
nd
&
Ha
ka
nss
on
, 20
03
)
(Be
rte
lse
n, 2
00
4)
(Xia
& L
ee
, 20
05
)
(Co
lle
ge
of
Co
mp
lex
P
roje
ct M
an
ag
ers
An
d
De
fen
ce M
ate
rie
l O
rga
nis
ati
on
, 20
06
)
(Co
ok
e-D
av
ies,
Cic
mil
, C
raw
ford
, &
Ric
ha
rdso
n, 2
00
7)
(Mu
len
bu
rg, 2
00
8)
(Wh
itty
& M
ay
lor,
2
00
9)
(Vid
al,
20
09
)
(He
rto
gh
&
We
ste
rve
ld, 2
01
0)
1. Multiplicity x
2. Ambiguity x x x
3. Uncertainty x x x x x
4. Details (structural) x x x x x
5. Dynamics x x x
6. Disorder x
7. Instability x x
8. Emergence x x x x
9. Non-linearity x x x
10. Recursiveness x
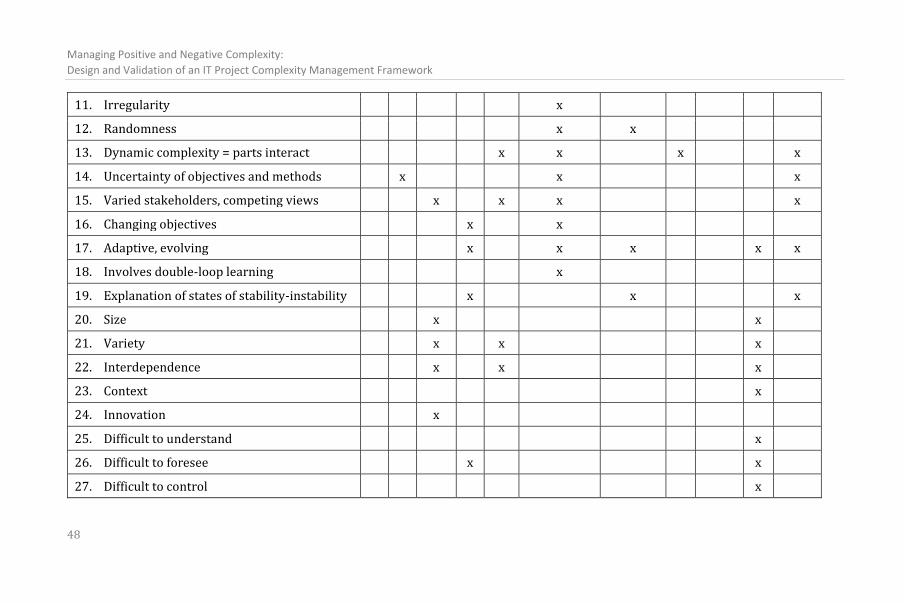
Managing Positive and Negative Complexity:
Design and Validation of an IT Project Complexity Management Framework
48
11. Irregularity x
12. Randomness x x
13. Dynamic complexity = parts interact x x x x
14. Uncertainty of objectives and methods x x x
15. Varied stakeholders, competing views x x x x
16. Changing objectives x x
17. Adaptive, evolving x x x x x
18. Involves double-loop learning x
19. Explanation of states of stability-instability x x x
20. Size x x
21. Variety x x x
22. Interdependence x x x
23. Context x
24. Innovation x
25. Difficult to understand x
26. Difficult to foresee x x
27. Difficult to control x
Chapter III.
Background: literature review
49
The inventory of classifications (Table 6) and map of characteristics (Table
7) provide the basis for the future design of tools for analyzing and managing
project complexity, in the following chapters.
III.5. Identification and measurement of IT project complexity. Inventory of measurement tools (research question RQ3)
This section presents an inventory of complexity identification and
measurement tools, identified as part of the literature review.
The identification and analysis of project complexity are relevant throughout
all project phases, but are particularly important at two specific moments:
during project approval (or Project Initiation), and during Project Planning.
Various models and tools were proposed for measuring the degree of project
complexity, defining approaches scales, measures and criteria (Xia & Lee,
2005) (Calinescu, Efstathiou, Schirn, & Bermejo, 1998) (Nassar & Hegab,
2006) (Ameen & Jacob, 2009) (Hass, 2008a) (Hass, 2008b) (Vidal, Marle, &
Bocquet, 2011) (Janssens, Hoeijenbos, & Kusters, 2011) (Marle & Vidal,
2016) (Shafiei-Monfared & Jenab, 2012) (Bakhshi, Ireland, & Gorod, 2016)
(Qureshi & Kang, 2015) (Chapman, 2016) (Wood & Ashton, 2010) (Bosch-
Rekveldt, Jongkind, Mooi, Bakker, & Verbraeck, 2011).
While most authors underline the importance of comparability and
repeatability, the metrics tend to remain subjective and strongly dependent
on industry, technology, organization, or project type.
The inventory of complexity measurement tools is presented in Table 8
below.
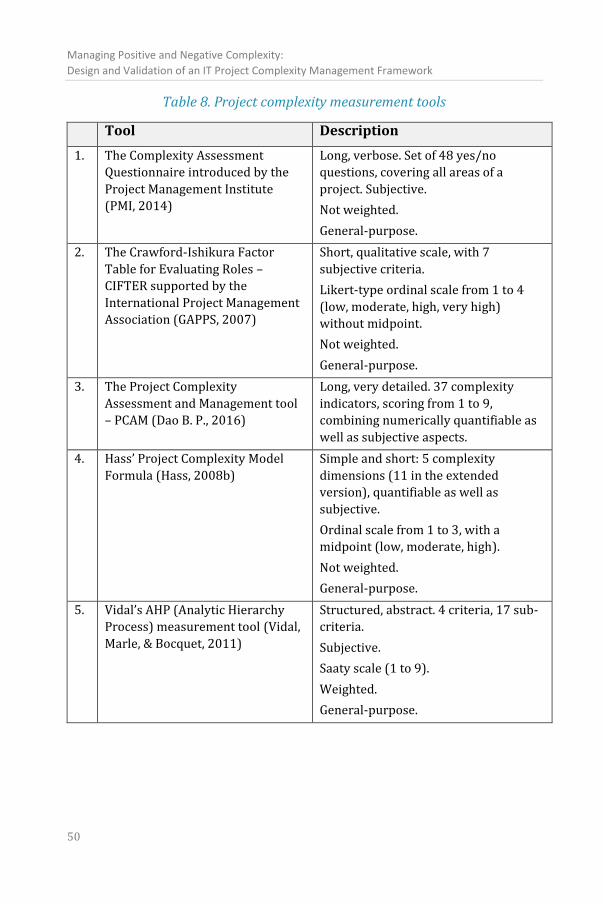
Managing Positive and Negative Complexity:
Design and Validation of an IT Project Complexity Management Framework
50
Table 8. Project complexity measurement tools
Tool Description
1. The Complexity Assessment
Questionnaire introduced by the
Project Management Institute
(PMI, 2014)
Long, verbose. Set of 48 yes/no
questions, covering all areas of a
project. Subjective.
Not weighted.
General-purpose.
2. The Crawford-Ishikura Factor
Table for Evaluating Roles –
CIFTER supported by the
International Project Management
Association (GAPPS, 2007)
Short, qualitative scale, with 7
subjective criteria.
Likert-type ordinal scale from 1 to 4
(low, moderate, high, very high)
without midpoint.
Not weighted.
General-purpose.
3. The Project Complexity
Assessment and Management tool
– PCAM (Dao B. P., 2016)
Long, very detailed. 37 complexity
indicators, scoring from 1 to 9,
combining numerically quantifiable as
well as subjective aspects.
4. Hass’ Project Complexity Model
Formula (Hass, 2008b)
Simple and short: 5 complexity
dimensions (11 in the extended
version), quantifiable as well as
subjective.
Ordinal scale from 1 to 3, with a
midpoint (low, moderate, high).
Not weighted.
General-purpose.
5. Vidal’s AHP (Analytic Hierarchy
Process) measurement tool (Vidal,
Marle, & Bocquet, 2011)
Structured, abstract. 4 criteria, 17 sub-
criteria.
Subjective.
Saaty scale (1 to 9).
Weighted.
General-purpose.
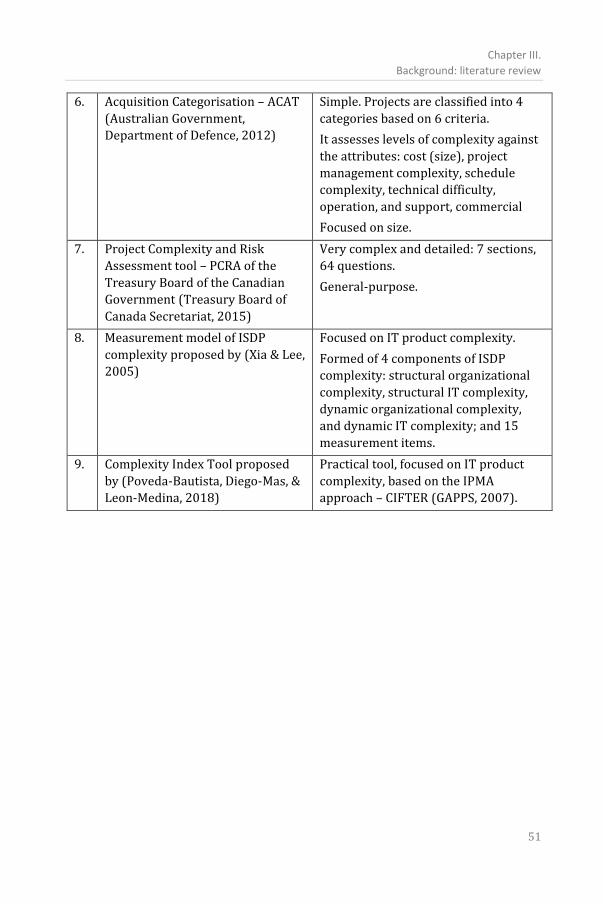
Chapter III.
Background: literature review
51
6. Acquisition Categorisation – ACAT
(Australian Government,
Department of Defence, 2012)
Simple. Projects are classified into 4
categories based on 6 criteria.
It assesses levels of complexity against
the attributes: cost (size), project
management complexity, schedule
complexity, technical difficulty,
operation, and support, commercial
Focused on size.
7. Project Complexity and Risk
Assessment tool – PCRA of the
Treasury Board of the Canadian
Government (Treasury Board of
Canada Secretariat, 2015)
Very complex and detailed: 7 sections,
64 questions.
General-purpose.
8. Measurement model of ISDP
complexity proposed by (Xia & Lee,
2005)
Focused on IT product complexity.
Formed of 4 components of ISDP
complexity: structural organizational
complexity, structural IT complexity,
dynamic organizational complexity,
and dynamic IT complexity; and 15
measurement items.
9. Complexity Index Tool proposed
by (Poveda-Bautista, Diego-Mas, &
Leon-Medina, 2018)
Practical tool, focused on IT product
complexity, based on the IPMA
approach – CIFTER (GAPPS, 2007).
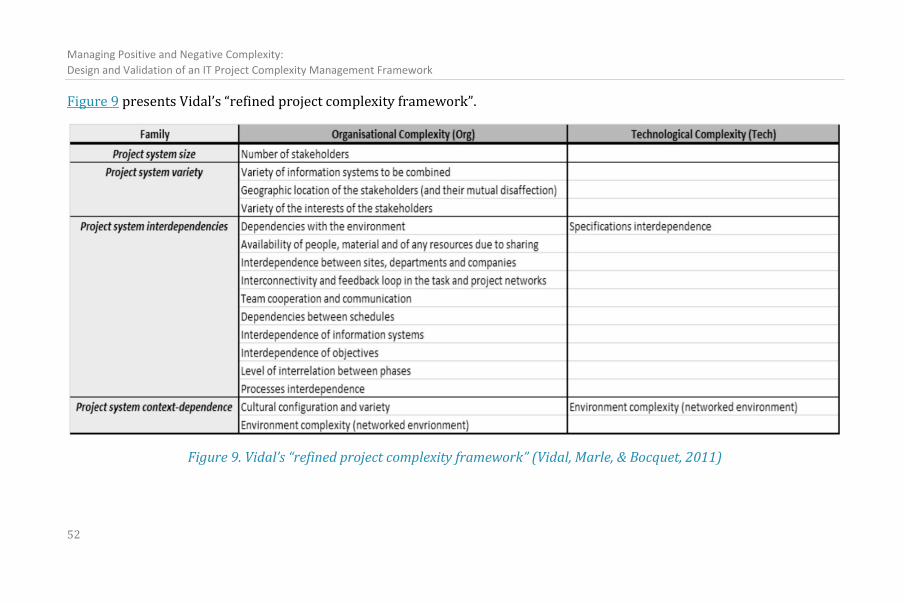
Managing Positive and Negative Complexity:
Design and Validation of an IT Project Complexity Management Framework
52
Figure 9 presents Vidal’s “refined project complexity framework”.
Figure 9. Vidal’s “refined project complexity framework” (Vidal, Marle, & Bocquet, 2011)
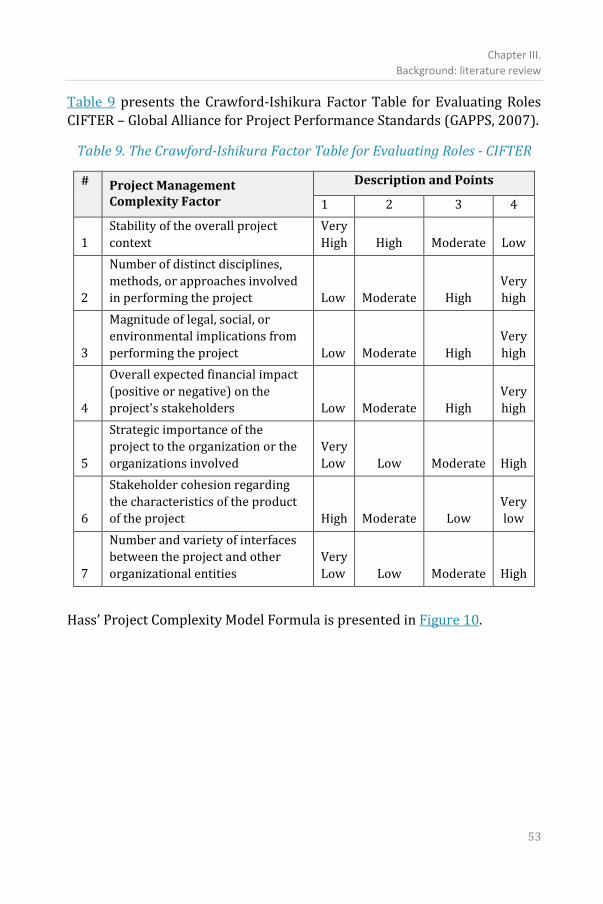
Chapter III.
Background: literature review
53
Table 9 presents the Crawford-Ishikura Factor Table for Evaluating Roles
CIFTER – Global Alliance for Project Performance Standards (GAPPS, 2007).
Table 9. The Crawford-Ishikura Factor Table for Evaluating Roles - CIFTER
#
Project Management Complexity Factor
Description and Points
1 2 3 4
1
Stability of the overall project
context
Very
High High Moderate Low
2
Number of distinct disciplines,
methods, or approaches involved
in performing the project Low Moderate High
Very
high
3
Magnitude of legal, social, or
environmental implications from
performing the project Low Moderate High
Very
high
4
Overall expected financial impact
(positive or negative) on the
project's stakeholders Low Moderate High
Very
high
5
Strategic importance of the
project to the organization or the
organizations involved
Very
Low Low Moderate High
6
Stakeholder cohesion regarding
the characteristics of the product
of the project High Moderate Low
Very
low
7
Number and variety of interfaces
between the project and other
organizational entities
Very
Low Low Moderate High
Hass’ Project Complexity Model Formula is presented in Figure 10.
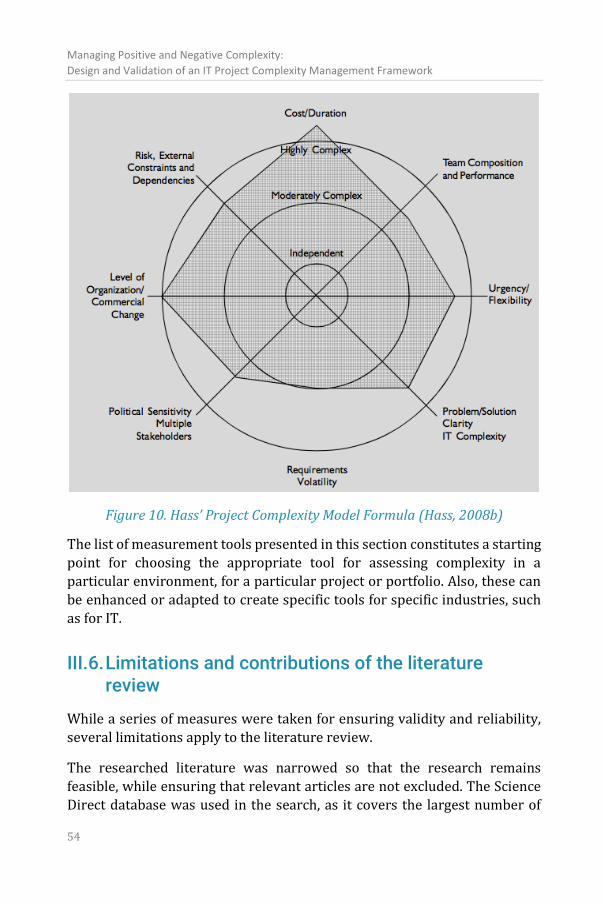
Managing Positive and Negative Complexity:
Design and Validation of an IT Project Complexity Management Framework
54
Figure 10. Hass’ Project Complexity Model Formula (Hass, 2008b)
The list of measurement tools presented in this section constitutes a starting
point for choosing the appropriate tool for assessing complexity in a
particular environment, for a particular project or portfolio. Also, these can
be enhanced or adapted to create specific tools for specific industries, such
as for IT.
III.6. Limitations and contributions of the literature review
While a series of measures were taken for ensuring validity and reliability,
several limitations apply to the literature review.
The researched literature was narrowed so that the research remains
feasible, while ensuring that relevant articles are not excluded. The Science
Direct database was used in the search, as it covers the largest number of
Chapter III.
Background: literature review
55
journals relevant to the topic. The search phrase was applied only to the titles
and the abstract of peer-reviewed articles, so as to limit the number of
articles while retaining relevant research. The search was limited to articles
in English. The summation of the reviewed articles was done manually, but
was documented for each article, which ensured traceability and
repeatability of the process. Also, each reviewed article was categorized and
archived individually.
While the literature review was not limited strictly to an industry, it is
focused on IT. In order to increase specialization hence usability, the domain
of applicability of the complexity measures is especially limited to IT
projects.
III.7. Conclusion
This chapter presented the results of the literature review, sub-project P1. It
constitutes the investigation phase of this research project.
The literature review revealed that industry and research recognize the
importance of project complexity. Significant contributions have been made
to understanding it, with various theoretical definitions and models
proposed. These are presented above in sections III.3 and III.4, as answers to
our research questions RQ1 and RQ2. Also, a set of tools for measuring IT
project complexity have been proposed – as presented in section III.5, in
answer to our research question RQ3.
This investigation revealed a series of needs and directions for further
research. It confirmed the need for practical tools for identifying, measuring,
and managing IT project complexity (Floricel, Michel, & Piperca, 2016)
(Daniel & Daniel, 2018) (Zhu & Mostafavi, 2017) (Locatelli, Mancini, &
Romano, 2014) (Poveda-Bautista, Diego-Mas, & Leon-Medina, 2018). The
industry is still mostly guided by expert judgment (Hass, 2008a). Various
mitigation methods were proposed, in the form of best practices or
guidelines, also known as “simple rules” (Davies, Dodgson, Gann, & Macaulay,
2017). There is no structured framework or methodology for IT project
complexity management.
Based on this investigation, several treatments are further proposed and
tested, as described in the following chapters.

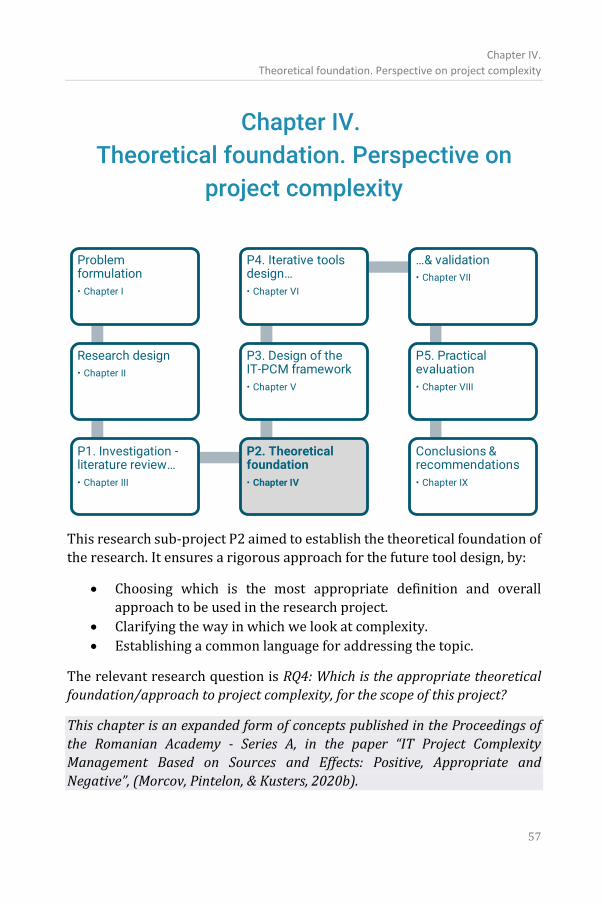
Chapter IV.
Theoretical foundation. Perspective on project complexity
57
Chapter IV.
Theoretical foundation. Perspective on
project complexity
This research sub-project P2 aimed to establish the theoretical foundation of
the research. It ensures a rigorous approach for the future tool design, by:
• Choosing which is the most appropriate definition and overall
approach to be used in the research project.
• Clarifying the way in which we look at complexity.
• Establishing a common language for addressing the topic.
The relevant research question is RQ4: Which is the appropriate theoretical
foundation/approach to project complexity, for the scope of this project?
This chapter is an expanded form of concepts published in the Proceedings of
the Romanian Academy - Series A, in the paper “IT Project Complexity
Management Based on Sources and Effects: Positive, Appropriate and
Negative”, (Morcov, Pintelon, & Kusters, 2020b).
Managing Positive and Negative Complexity:
Design and Validation of an IT Project Complexity Management Framework
58
Section IV.1 presents the definition and model of project complexity which
were chosen for the scope of this research project. It is a direct consequence
of the Literature review – Chapter III.
Sections IV.2 and IV.3 propose new ways in which one can look at IT project
complexity:
• Analyzing how systems theory and a holistic approach can be applied
to project complexity management – section IV.2.
• Analyzing the effects of complexity, and how complexity can
contribute to project success – section IV.3.
Both are also consequences of the Literature review, being derived from
previous approaches proposed by project management, engineering, and
systems theory.
IV.1.Definition and model of project complexity
The underlying theoretical definition and model of project complexity,
adopted and used in this research, is integrative. It is based on previous work
of (Edmonds, 1999) and (Vidal, 2009) – described in the literature review, in
Chapter III.
Project complexity is the property of a project which makes it difficult to
understand, foresee and manage its behavior, even when given reasonably
complete information about the project system.
This model includes ambiguity, uncertainty, propagation, and chaos, as the
most important associated phenomena, or manifestations, of project
complexity.
It covers both structural and dynamic complexity aspects.
Structural complexity is defined as consisting of many varied interrelated
parts (Baccarini, 1996). Other names used in literature are detail complexity
or complicatedness. It can be classified according to various criteria and
sources, e.g.: {technological, organizational}; {size, variety, interdependence,
context}.
Dynamic complexity deals with uncertainty; multiplicity, ambiguity, open
systems, chaos, self-organization, interdependence, emergence, and
unpredictability (Schlindwein & Ison, 2004) (Marle & Vidal, 2016).
Chapter IV.
Theoretical foundation. Perspective on project complexity
59
This definition, model, and terminology are used throughout the research, in
the subsequent chapters. They are also the basis for the new perspectives
proposed for looking at project complexity, presented in the following
sections of this chapter.
IV.2.A holistic approach: Complexity of Complexities
This section presents a holistic model proposed for looking at project
complexity. This perspective arose from the analysis of the literature review.
Systems theory argues for a holistic approach. Complexity in project
management may be tamed by Systems Thinking (Sheffield, Sankaran, &
Haslett, 2012). Systems engineering is a discipline that evolved specifically
for solving complex engineering problems (Locatelli, Mancini, & Romano,
2014). The holistic approach adopted by modern systems engineering,
including the concept of System-of-Systems, could benefit and help advance
the project management body of knowledge (Keating, et al., 2003) (Keating,
Padilla, & Adams, 2008).
Complexity can be analyzed from high-level perspectives, such as
organizational or technological complexity, or from more targeted
perspectives (Williams T. , 2017). Engineering focuses on product
complexity. Marketing research focuses on the external environment.
Management research targets the complexity of organizations and processes.
The complexity and capability of AI make it unique and controversial (Siau &
Wang, Ethical and Moral Issues with AI, 2018) (Siau & Wang, 2020). The
ethical aspects of AI-related projects can form a complexity sub-system in
itself.
All in all, IT engineering develops complex IT products for complex markets
in complex organizations with complex processes through complex projects.
Figure 11 presents a summary of such a model.
IT project complexity can be described therefore as a Complexity of
Complexities. Thus, the IT project is an ecosystem formed of complex sub-
systems, interrelated and influencing each other in ways we cannot predict,
nor control based on what we know about each complex sub-system
individuallyi.
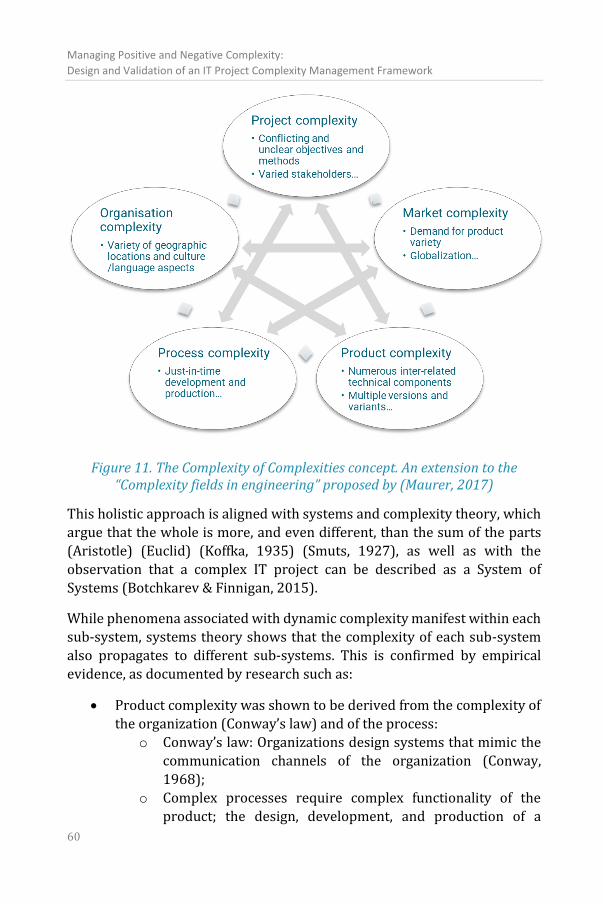
Managing Positive and Negative Complexity:
Design and Validation of an IT Project Complexity Management Framework
60
Figure 11. The Complexity of Complexities concept. An extension to the “Complexity fields in engineering” proposed by (Maurer, 2017)
This holistic approach is aligned with systems and complexity theory, which
argue that the whole is more, and even different, than the sum of the parts
(Aristotle) (Euclid) (Koffka, 1935) (Smuts, 1927), as well as with the
observation that a complex IT project can be described as a System of
Systems (Botchkarev & Finnigan, 2015).
While phenomena associated with dynamic complexity manifest within each
sub-system, systems theory shows that the complexity of each sub-system
also propagates to different sub-systems. This is confirmed by empirical
evidence, as documented by research such as:
• Product complexity was shown to be derived from the complexity of
the organization (Conway’s law) and of the process:
o Conway’s law: Organizations design systems that mimic the
communication channels of the organization (Conway,
1968);
o Complex processes require complex functionality of the
product; the design, development, and production of a
Chapter IV.
Theoretical foundation. Perspective on project complexity
61
complex product require a complex organization - see Airbus
or US space exploration program (Maurer, 2017).
• The business/IS alignment principle, or the law of requisite
complexity (or variety), that argues that a system must match or even
exceed the complexity of its external environment, in order to adapt,
evolve, and survive (Benbya & McKelvey, 2006) (McKelvey & Boisot,
2009) (Boisot & McKelvey, 2011).
• A complex product and/or a complex organization drive project
complexity (Eppinger, 2002) (Maurer, 2017).
As argued below, the anticipated benefits of such a paradigm should be – as
further detailed below:
1. The correct identification of the real sources of complexity and
the correlation between sources and effects.
2. Supporting the selection of the most suitable/efficient mitigation
strategies.
1. Identification of the source of complexity.
Perceived complexity is often generated in a distinct sub-system, not in the
sub-system where it is observed. Because of propagation phenomena
associated with complexity, actions in a sub-system have (un)desired effects
in others. Traditional problem-solving or dependency-modeling techniques
are effective only in the same sub-systems (Maurer, 2017). Systemic-level
solutions are needed for events that cover more than one sub-system, as well
as novel dependency-modeling tools.
2. Selection of the most suitable/efficient mitigation strategies and
tools.
Each of the sub-complexities is different and requires a specific set of tools
and methods – related to project, product, market, organization, process.
Therefore, this holistic approach supports the selection of the best tools to
manage the overall complexity, as well as the individual complexities.
When the source of the complexity is in the same sub-system, then a
systematic approach to problem-solving or to complexity management will
be very effective (Maurer, 2017). At the same time, when the source of the
complexity is in a different sub-system, a different strategy should be
deployed. First, a multi-disciplinary team from all concerned sub-systems
should be formed. Also, among the potential strategies to mitigate the
Managing Positive and Negative Complexity:
Design and Validation of an IT Project Complexity Management Framework
62
problem, specific ones should be considered, such as simplification,
reorganization, or increase in the complexity of a sub-system to match the
complexity of another. Examples are:
• Simplification:
o Simplification of one of the sub-systems must consider the
impact on the other sub-systems.
o Decomposition of the project team or WBS will function
better if the organization or the product can also be
decomposed into a similar OBS; the decomposition could be
done on these sub-systems in synergy.
o Oversimplification of the organization or of the project might
have a negative impact if the product cannot be, in fact,
simplified. Similarly, oversimplification of a product will
make it difficult to support a very complex organization.
• Dependencies:
o If an organization is forced to downsize by external market
pressure: reducing its size also requires simplification; which
also means that its processes, tools, and projects must be
simplified and downsized as well.
o Dependencies between components of sub-systems will be
mirrored across other complex sub-systems. A DSM or
dependency diagram on the organization structure is likely
to match the corresponding DSM on the product
structure/PBS (Product Breakdown Structure), on the
project organization chart/OBS, on the WBS (Work
Breakdown Structure), on the Risk-BS and Cost-BS. Consider
a large engineering project such as Airbus 380; the
dependencies between each engineering component
(engines, electronics, air conditioning, passenger bridges)
will be mirrored by dependencies between project teams and
between processes (Maurer, 2017).
• Correct source identification:
o Consider an unnecessarily heavy and complex organization,
oversized compared to its needs. This is in fact a common
situation for all organizations (not only bureaucracies), as
proven by empirical evidence such as Parkinson’s law, which
shows that organizations tend to increase in time both their
complexity and size, irrespective of any variation in their
responsibilities – because officials create work for each other,
Chapter IV.
Theoretical foundation. Perspective on project complexity
63
and want to create subordinates, not rivals (Parkinson,
1958). Any complexity-related phenomena, such as the
inherent complexity of the products and processes that
support such an organization, will be solved much more
effectively by reducing the overly complex organization,
rather than by oversimplifying the other sub-systems.
o Consider a small organization implementing a very complex
and advanced ERP (Enterprise Resource System). The
complexity of the product will necessarily require a major
redesign of the organization’s processes, as part of a complex
ERP project implementation. The effects of the product
complexity will be reflected in significant complexity and
changes in projects, processes, and in the organization; but
will not lead to changes in the product itself, which is already
a complex COTS tool. The real source of these complexity-
related phenomena is the inadequate product choice; hence
adapting the organization to the product is not the best
solution for this situation. A more efficient solution would be
to switch to a different ERP product, simpler and less
complex, but more adapted to the organization.
This holistic approach is a model that is used in the next research sub-
projects, especially in the design of specialized tools for IT project complexity
management. It is also particularly relevant to the analysis of the sources and
effects of complexity, and the relation between them. In particular, analyzing
the effects of complexity is the topic of the next section.
IV.3.The ubiquitousness of complexity. Positive, Appropriate, and Negative Complexity
All the articles of the literature review on project complexity focus on its
negative effects, and on how to reduce or eliminate complexity. Research
strongly correlates project complexity with project failure and poor project
management performance (Floricel, Michel, & Piperca, 2016) (Bjorvatn &
Wald, 2018). References to potential benefits or positive influences of
complexity are very rare in project management literature, and always
incidental.
At the same time, systems theory and systems engineering provide new
insights and different original approaches to project complexity. Thus, in
Managing Positive and Negative Complexity:
Design and Validation of an IT Project Complexity Management Framework
64
order to be innovative, creative, and adaptable, a system must be taken away
from equilibrium, and should make use of disorder, irregularity and
difference for driving change (Stacey, 1995). Complexity is often associated
with innovation (Floricel, Michel, & Piperca, 2016). In order to remain viable,
systems must acquire complexity (Beer, 1972), e.g. to match the complexity
of the external environment, and even to create excess complexity, thus
becoming “efficaciously adaptive” (McKelvey & Boisot, 2009).
These perspectives are analyzed in the current section.
IV.3.1. The ubiquitousness of complexity
Engineering in general, and in particular IT/software engineering, are highly
effective domains, that develop increasingly complex products; they deliver
valuable results with increasingly more complex processes. Complexity is a
ubiquitous reality, that creates risk as well as opportunity: “Complexity
works! Nature, animals and humans are highly complex systems” (Maurer,
2017).
Technology will necessarily become more and more complex as it evolves.
The next-generation computer, space shuttle, phone, watch or car will be
smarter, and thus more complex. This is needed for providing more
functionality, benefits, value; thus remaining competitive and relevant on the
market. The organization and processes of the research, marketing, sales and
delivery departments’ will be more and more complex, so as to offer new
products to new users in new markets. Artificial Intelligence, Data Science,
and Machine Learning are solving more and more industrial and societal
challenges, with a level of complexity already far beyond our understanding.
Also, complexity has sometimes positive unexpected or unintended effects:
SMS, Facebook, Coca-Cola, and Viagra are famed examples of emergence and innovation in complex R&D projects: they are highly successful products, but
they are different, or used differently, than originally intended or designed.
None of them appeared by accident; instead, they are the result of extensive,
expensive, and lengthy endeavors, and they build on incredible amounts of
previous research. They confirm the holistic paradigm described in the
previous section: while they build on the complexity of their constituent
parts, they are not only more than the sum of these individual parts, but they
are also different than the sum of their components. Thus, the individual
components of Facebook are: collaboration and communication software
applications; computers, servers, mobile phones, Internet/mobile networks;
Chapter IV.
Theoretical foundation. Perspective on project complexity
65
staff of engineers, managers, content curators, sales, marketing; users;
content, etc. But Facebook is different from the sum of all these individual
components; it is a social phenomenon.
We conclude that the fundamental mission of the project manager is not to
eliminate complexity; rather it is the completion of a successful project ii .
Complexity sometimes supports project success, and should not be eliminated.
Complexity can thus be analyzed from the perspective of its effects.
As a note, while IT project complexity may have positive effects, this does not
imply that complexity is in itself an objective.
IV.3.2. Positive, Appropriate, and Negative Complexity
Based on the above observations, and taking a constructive, empiricist
approach prevalent in engineering, we thus embrace and introduce in our
proposed model the concepts of Positive and Appropriate Complexity, in
addition to, and opposed to the traditional view of negative IT project
complexity.
This reconsideration of complexity as not necessarily negative is similar to
the history of risk management, which is yet to fully incorporate the
management of opportunities into practice iii . It is also aligned with the
current evolutions in vulnerability management, where the concept of
antifragility was introduced recently (Taleb, Antifragile: things that gain
from disorder, 2012).
“Positive complexity” is “the complexity that adds value to our project, and
whose contribution to project success outweighs the associated negative
consequences”.
“Appropriate, or requisite, complexity” is “the complexity that is needed
for the project to reach its objectives, or whose contribution to project
success balances the negative effects, or the cost of mitigation outweighs
negative manifestations”.
“Negative complexity” is “the complexity that hinders project success”.
A graphical map of these concepts is presented in Figure 12.
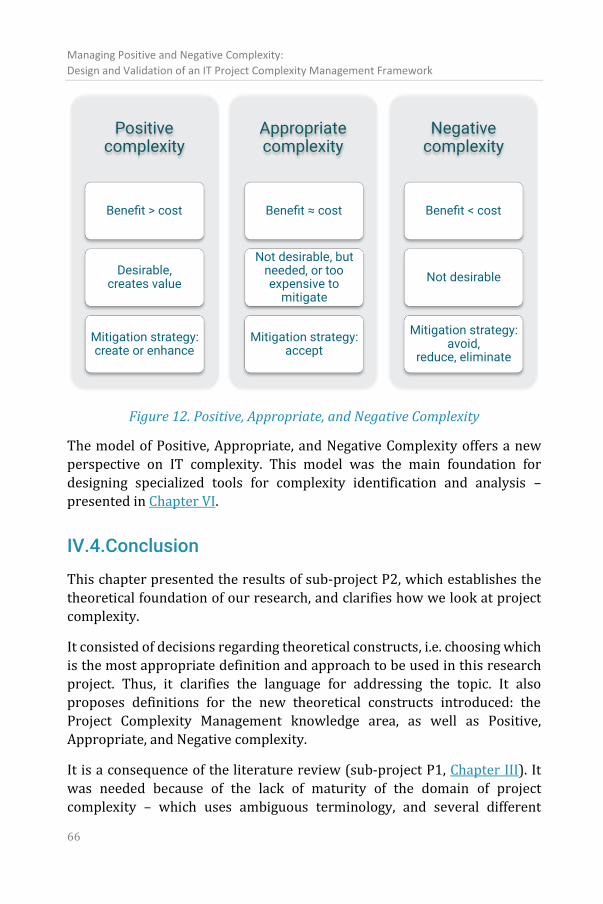
Managing Positive and Negative Complexity:
Design and Validation of an IT Project Complexity Management Framework
66
Figure 12. Positive, Appropriate, and Negative Complexity
The model of Positive, Appropriate, and Negative Complexity offers a new
perspective on IT complexity. This model was the main foundation for
designing specialized tools for complexity identification and analysis –
presented in Chapter VI.
IV.4.Conclusion
This chapter presented the results of sub-project P2, which establishes the
theoretical foundation of our research, and clarifies how we look at project
complexity.
It consisted of decisions regarding theoretical constructs, i.e. choosing which
is the most appropriate definition and approach to be used in this research
project. Thus, it clarifies the language for addressing the topic. It also
proposes definitions for the new theoretical constructs introduced: the
Project Complexity Management knowledge area, as well as Positive,
Appropriate, and Negative complexity.
It is a consequence of the literature review (sub-project P1, Chapter III). It
was needed because of the lack of maturity of the domain of project
complexity – which uses ambiguous terminology, and several different
Chapter IV.
Theoretical foundation. Perspective on project complexity
67
definitions and approaches, some contradictory and some complementary. It
thus ensures rigor for the future tool design, which is presented in the
following chapters.
Notes
i The systems engineering literature has divergent views regarding the
definition and synonymy between “system” and “sub-system”. It even notices the
tautology in the definition of “system of systems”, as any system is
fundamentally already a system of sub-systems (Hitchins, 2007). In the context
of this project, the term “sub-system” is used only when it is considered
important to underline the interaction between the components of a master
system.
ii In defining success, the recognized project management body of knowledge
tends to put the priority on processes, rather than on results. The perspective
of the process, i.e. delivering efficient outputs, is typically called “project
management performance” or “project efficiency”.
On the other hand, the perspective of the result, i.e. delivering beneficial
outcomes, is typically called “project performance” (sometimes just “project
success”) (Daniel & Daniel, 2018) (Pinto & Winch, 2016). System engineering
argues that project success should focus on the resulting system, on the benefits
to the organization and to the stakeholders, rather than on measuring methods
and processes (PMI, 2017) (Locatelli, Mancini, & Romano, 2014).
Managing Positive and Negative Complexity:
Design and Validation of an IT Project Complexity Management Framework
68
iii “Risk management” appears in literature since the 1920s, as shown by a
search in the KUL library, and becomes a formal science in the 1950s (Dionne,
2013), when articles and books with “risk management” in the title also appear
in searches. Opportunities do not appear in the first Project Management Body
of Knowledge (PMI, 1987). Opportunities were included in project management
literature in the mid-1990s (PMI, 1996) and became a significant part of
project risk management in the years 2000s (Goodman, 2005), when articles
titled “opportunity management” also begin to appear in a library search.
At the same time, risk-related research as well as practitioners continue to
focus significantly more on threats than on opportunities, and risks are still
being considered “usually negative” (Ekambaram, Johansen, Jermstad, &
Økland, 2010) (Dionne, 2013).
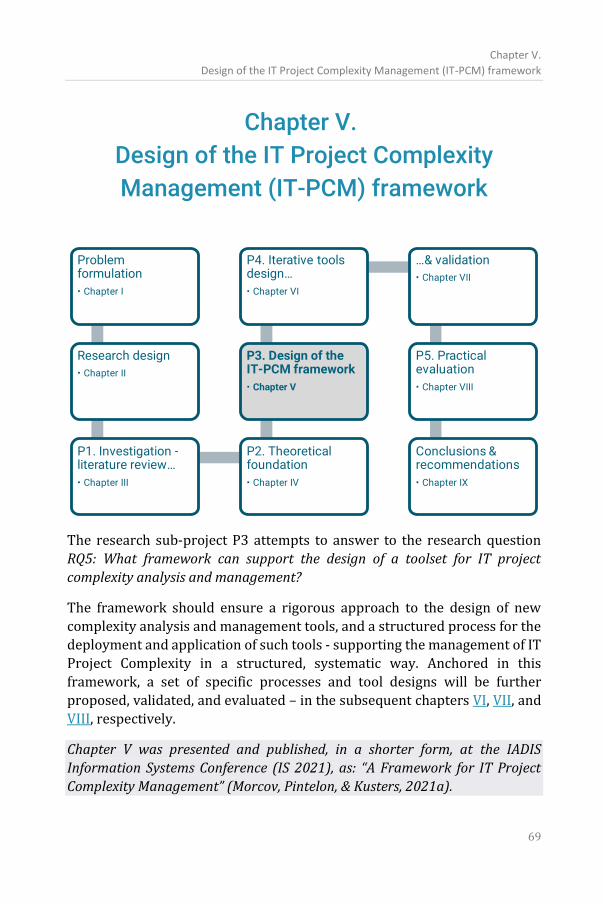
Chapter V.
Design of the IT Project Complexity Management (IT-PCM) framework
69
Chapter V.
Design of the IT Project Complexity
Management (IT-PCM) framework
The research sub-project P3 attempts to answer to the research question
RQ5: What framework can support the design of a toolset for IT project
complexity analysis and management?
The framework should ensure a rigorous approach to the design of new
complexity analysis and management tools, and a structured process for the
deployment and application of such tools - supporting the management of IT
Project Complexity in a structured, systematic way. Anchored in this
framework, a set of specific processes and tool designs will be further
proposed, validated, and evaluated – in the subsequent chapters VI, VII, and
VIII, respectively.
Chapter V was presented and published, in a shorter form, at the IADIS
Information Systems Conference (IS 2021), as: “A Framework for IT Project
Complexity Management” (Morcov, Pintelon, & Kusters, 2021a).
Managing Positive and Negative Complexity:
Design and Validation of an IT Project Complexity Management Framework
70
The proposed IT-PCM framework is composed of:
• A theoretical basis: the proposed definition of Project Complexity
Management, as a new project management Knowledge Area
(section V.2).
• A set of processes, defined and described in terms of inputs and
outputs (section V.4).
• An inventory of tools and techniques that can be used by project
managers, per each process and step of the IT-PCM framework
(section V.5).
In order to identify a minimum set of steps to be included in the framework,
an intermediate analysis of other existent management frameworks was
performed. This is presented in section V.3.
V.1. Introduction
The proposed IT-PCM framework is a high-level process design, that aims to
add structure to the management of IT project complexity, and to
systematize concepts and practical approach.
The framework is aligned with the recognized project management body of
knowledge, particularly with (PMI, 2017).
The design of the processes of the IT-PCM framework was based on the
analysis of a set of recognized management frameworks from different
related areas, including: project management, risk management (PMI, 2017),
vulnerability management (Marle & Vidal, 2016); problem-solving;
communications management; managing complexity in systems engineering
(Maurer, 2017), OODA loop (Boyd, 2018), Systems development life cycle
(SDLC); Waterfall software development methodology, OOAD (Satzinger,
Jackson, & Burd, 2007), Scrum Agile (Schwaber & Sutherland, 2020), ADDIE
and SAM models for instructional design (Allen & Sites, 2012), PDCA (or
OPDCA) management method - the Deming Cycle (Liker & Franz, 2011).
An inventory of tools and techniques is proposed for each process and step
in the IT-PCM framework. The inventory of potential tools and methods is
not and cannot be exhaustive nor definitive; as all inventories of tools, it is a
starting point. There will always be an additional potential tool; new tools
Chapter V.
Design of the IT Project Complexity Management (IT-PCM) framework
71
are developed every day; some tools are duplicated or similar; there exist
different tools with the same name or similar tools with different names.
Various techniques, guidelines, best practices, thumb rules for managing
project complexity are already enumerated by literature (GAPPS, 2007)
(PMI, 2013) (PMI, 2014) (Davies, Dodgson, Gann, & Macaulay, 2017)
(Australian Government, Department of Defence, 2012) (Riis & Pedersen,
2003) (Remington & Pollack, 2007). These are formed of guidelines, best
practices, and examples, such as “simple rules”, easy to formulate and use in
a complex environment (Sull & Eisenhardt, 2012). Various traditional tools
have also been proposed for managing specific aspects of project complexity.
These are already available in the standard arsenal of the IT project manager.
Some are generic, some are highly specialized for a specific area such as IT,
or even for a very particular situation.
• Generic tools have a wide application area. They could be used
across multiple industries and domains, as well as across multiple
disciplines. Examples are general project management frameworks,
risk management, simplification and decomposition techniques;
dependency modeling, Design Structure Matrices (DSM); analysis
tools such as cause-and-effect analysis; scheduling tools such as
Critical chain management (CCM); planning and monitoring tools
such as Earned value management (EVM) (PMI, 2017) (Leach, 1999).
• Very specialized tools are specific for a specific domain or problem.
Examples are Object-Oriented Analysis and Design (OOAD); Scrum
agile software development framework; or AgileEVM are very
specific tools for managing software-related complexity (Booch,
Object-oriented design, 1982) (Pressman, 2001) (Sulaiman & Smits,
2007) (Schwaber & Sutherland, 2020).
These tools are currently applied opportunistically. There is little research
regarding frameworks or tools on how to manage IT complex projects (Botchkarev & Finnigan, 2015). Although the interest in the topic is growing
continuously and the quantity of papers and research is already significant,
there is no framework or structured approach currently available.
The IT-PCM framework attempts to propose a structure in which to anchor
both the application of existing tools, as well as future research.
Managing Positive and Negative Complexity:
Design and Validation of an IT Project Complexity Management Framework
72
The framework also attempts to provide structure to project managers in
managing complexity in practice. As with any tool, each organization and
project manager should decide to what degree to apply a specific framework
or set of tools, to a particular portfolio or project.
V.2. Definition of Project Complexity Management
We define “Project Complexity Management” as the project management
Knowledge Area that includes processes to understand, plan strategy and
responses, and manage project complexity.
Its objective is to support project success, by enhancing Positive Complexity
and reducing Negative Complexity.
Similar to risk analysis, the cost and benefits of complexity refer to the
negative and positive impact on the project’s budget, but also on the project’s
schedule, scope, and quality.
This knowledge area is aligned with the standard project management body
of knowledge (PMI, 2017). Its theoretical and structured design is aligned
with the PMI’s approach, and with the wider need for a theoretical basis to
the project management domain (Turner, 2006a) (Turner, 2006c).
Project Complexity Management is at the intersection of project
management and complexity, and has inputs from practice, systems theory,
systems and IT/software engineering.
Project complexity has different components and sources, including the
product (typically expressed in terms of structural or technological
complexity); as well as the organization, its processes; the surrounding legal,
ethical, and regulatory environment; stakeholder complexity and their (often
conflicting) objectives; market complexity. Thus, when operating in a
complex organization, or when developing a complex product, it is likely that
the project itself will encounter phenomena related to dynamic complexity.
The next section discusses what existing management frameworks can be
used as a basis for the design of a framework for Project Complexity
Management.
Chapter V.
Design of the IT Project Complexity Management (IT-PCM) framework
73
V.3. Management frameworks - background
Management frameworks are widely used in various areas, including project,
risk, and vulnerability management; problem-solving and ~management;
communications management, etc.
A typical management process structure consists of the following main
phases, or processes:
a) Planning.
b) Identification.
c) Analysis.
d) Developing response plans (strategies, actions).
e) Implementation, monitoring, control, and lessons learned.
Some widely recognized and accepted frameworks in project management
and IT/software engineering are presented below.
V.3.1. Risk management
Risk management consists of the following processes - Figure 13 (PMI,
2017):
1. Plan Risk Management - defining how to conduct risk
management activities.
2. Identify Risks - identifying individual project risks as well as
sources.
3. Perform Qualitative Risk Analysis - prioritizing individual
project risks by assessing probability and impact.
4. Perform Quantitative Risk Analysis - numerical analysis of
the effects.
5. Plan Risk Responses - developing options, selecting
strategies and actions.
6. Implement Risk Responses - implementing agreed-upon
risk response plans. In the 4th Ed. of PMBoK, this process was
included as an activity in the Monitor and Control process,
but was later separated as a distinct process in PMBoK 6th Ed.
7. Monitor Risks - monitoring the implementation. This
process was known as Monitor and Control in the previous
PMBoK 4th Ed., when it also included the “Implement Risk
Responses” process.
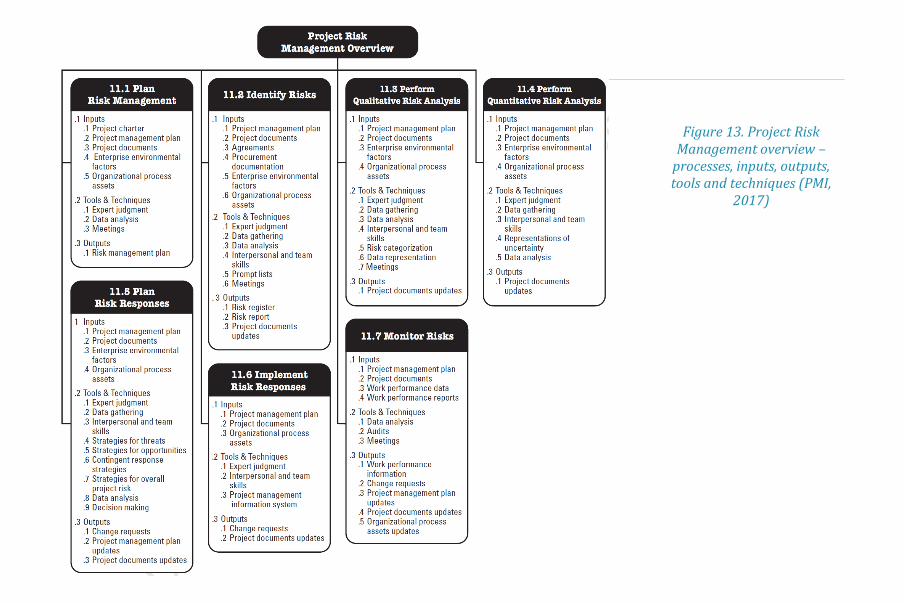
Managing Positive and Negative Complexity:
Design and Validation of an IT Project Complexity Management Framework
74
Figure 13. Project Risk Management overview –
processes, inputs, outputs, tools and techniques (PMI,
2017)
Chapter V.
Design of the IT Project Complexity Management (IT-PCM) framework
75
V.3.2. Vulnerability management
Project vulnerability is the project's susceptibility to being subject to
negative events, the analysis of their impact, and the project's capability to
cope with negative events (Marle & Vidal, 2016). Based on Systems Thinking,
project systemic vulnerability management takes a holistic vision, and
proposes the following process:
1. Project vulnerability identification.
2. Vulnerability analysis.
3. Vulnerability response planning.
4. Vulnerability controlling – which includes implementation,
monitoring, control, and lessons learned.
Coping with negative events is done, in this model, through:
• resistance – the static aspect, referring to the capacity to withstand
instantaneous damage, and
• resilience – the dynamic aspect, referring to the capacity to recover
in time.
Redundancy is a specific method to increase resistance and resilience (Taleb,
Goldstein, & Spitznagel, 2009).
Antifragility is the capacity of systems to not only resist or recover from
adverse events, but also to improve because of them (Taleb, 2012).
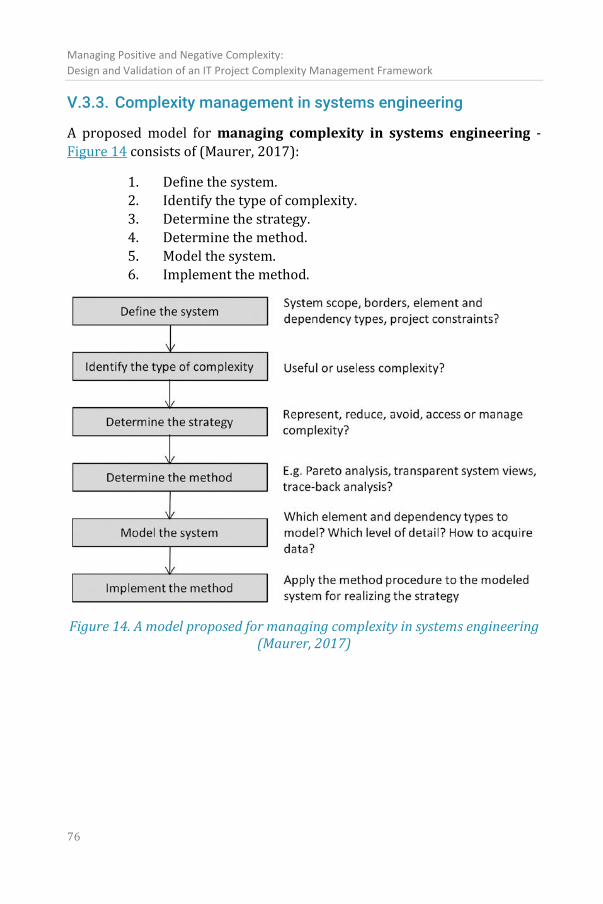
Managing Positive and Negative Complexity:
Design and Validation of an IT Project Complexity Management Framework
76
V.3.3. Complexity management in systems engineering
A proposed model for managing complexity in systems engineering -
Figure 14 consists of (Maurer, 2017):
1. Define the system.
2. Identify the type of complexity.
3. Determine the strategy.
4. Determine the method.
5. Model the system.
6. Implement the method.
Figure 14. A model proposed for managing complexity in systems engineering (Maurer, 2017)
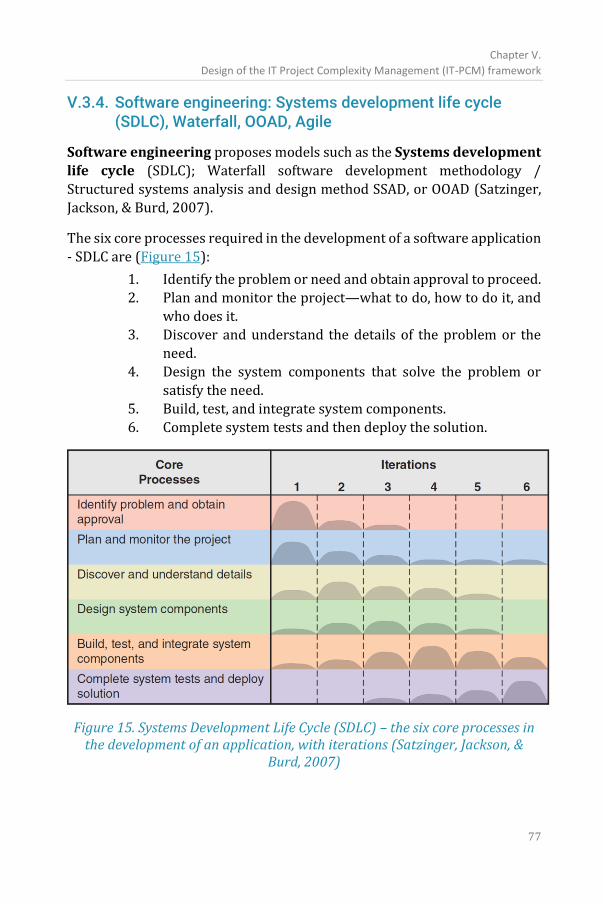
Chapter V.
Design of the IT Project Complexity Management (IT-PCM) framework
77
V.3.4. Software engineering: Systems development life cycle (SDLC), Waterfall, OOAD, Agile
Software engineering proposes models such as the Systems development
life cycle (SDLC); Waterfall software development methodology /
Structured systems analysis and design method SSAD, or OOAD (Satzinger,
Jackson, & Burd, 2007).
The six core processes required in the development of a software application
- SDLC are (Figure 15):
1. Identify the problem or need and obtain approval to proceed.
2. Plan and monitor the project—what to do, how to do it, and
who does it.
3. Discover and understand the details of the problem or the
need.
4. Design the system components that solve the problem or
satisfy the need.
5. Build, test, and integrate system components.
6. Complete system tests and then deploy the solution.
Figure 15. Systems Development Life Cycle (SDLC) – the six core processes in the development of an application, with iterations (Satzinger, Jackson, &
Burd, 2007)
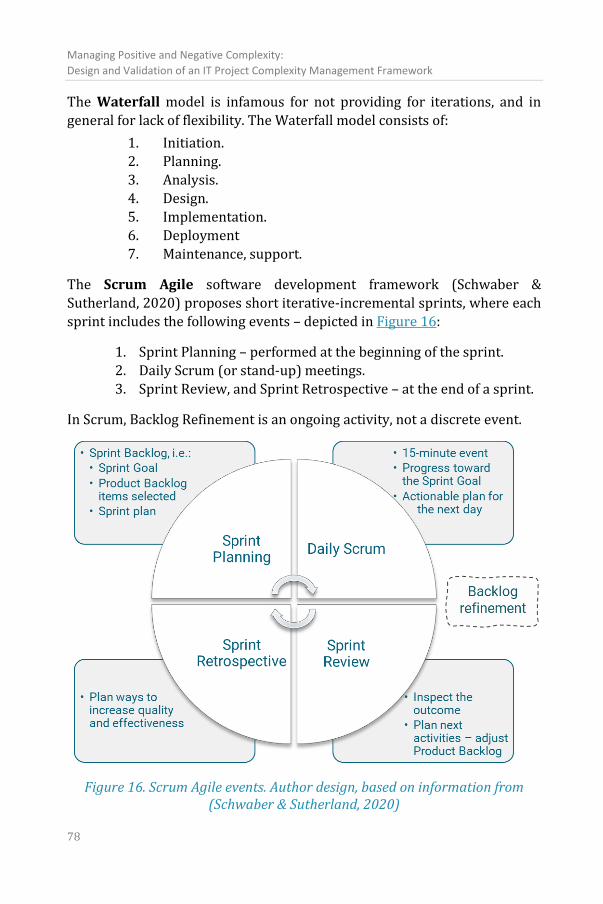
Managing Positive and Negative Complexity:
Design and Validation of an IT Project Complexity Management Framework
78
The Waterfall model is infamous for not providing for iterations, and in
general for lack of flexibility. The Waterfall model consists of:
1. Initiation.
2. Planning.
3. Analysis.
4. Design.
5. Implementation.
6. Deployment
7. Maintenance, support.
The Scrum Agile software development framework (Schwaber &
Sutherland, 2020) proposes short iterative-incremental sprints, where each
sprint includes the following events – depicted in Figure 16:
1. Sprint Planning – performed at the beginning of the sprint.
2. Daily Scrum (or stand-up) meetings.
3. Sprint Review, and Sprint Retrospective – at the end of a sprint.
In Scrum, Backlog Refinement is an ongoing activity, not a discrete event.
Figure 16. Scrum Agile events. Author design, based on information from (Schwaber & Sutherland, 2020)
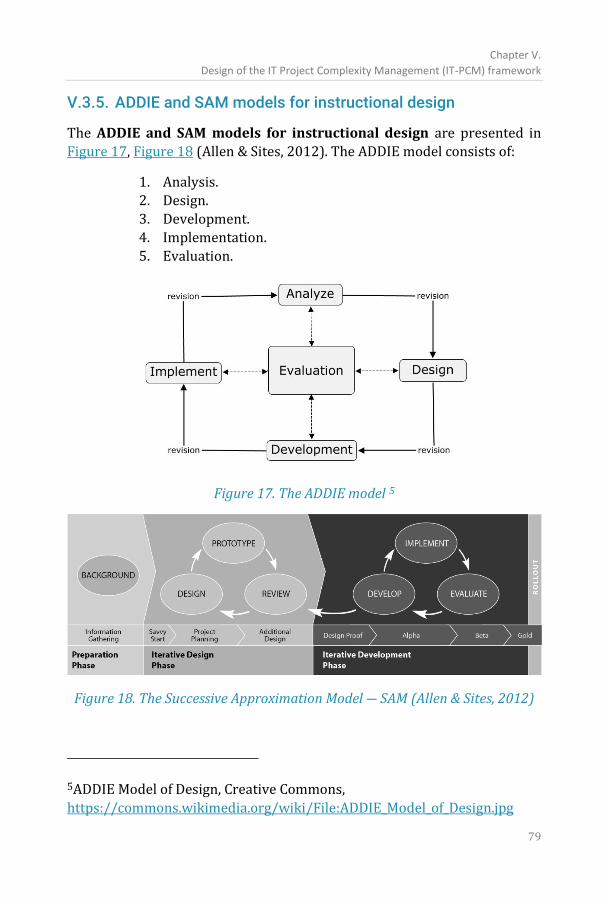
Chapter V.
Design of the IT Project Complexity Management (IT-PCM) framework
79
V.3.5. ADDIE and SAM models for instructional design
The ADDIE and SAM models for instructional design are presented in
Figure 17, Figure 18 (Allen & Sites, 2012). The ADDIE model consists of:
1. Analysis.
2. Design.
3. Development.
4. Implementation.
5. Evaluation.
Figure 17. The ADDIE model 5
Figure 18. The Successive Approximation Model ― SAM (Allen & Sites, 2012)
5ADDIE Model of Design, Creative Commons,
https://commons.wikimedia.org/wiki/File:ADDIE_Model_of_Design.jpg
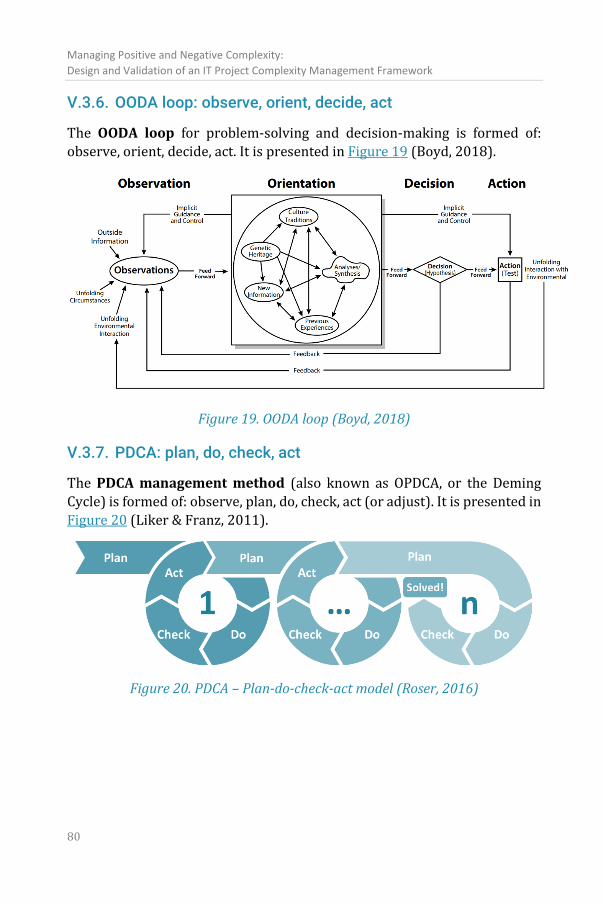
Managing Positive and Negative Complexity:
Design and Validation of an IT Project Complexity Management Framework
80
V.3.6. OODA loop: observe, orient, decide, act
The OODA loop for problem-solving and decision-making is formed of:
observe, orient, decide, act. It is presented in Figure 19 (Boyd, 2018).
Figure 19. OODA loop (Boyd, 2018)
V.3.7. PDCA: plan, do, check, act
The PDCA management method (also known as OPDCA, or the Deming
Cycle) is formed of: observe, plan, do, check, act (or adjust). It is presented in
Figure 20 (Liker & Franz, 2011).
Figure 20. PDCA – Plan-do-check-act model (Roser, 2016)
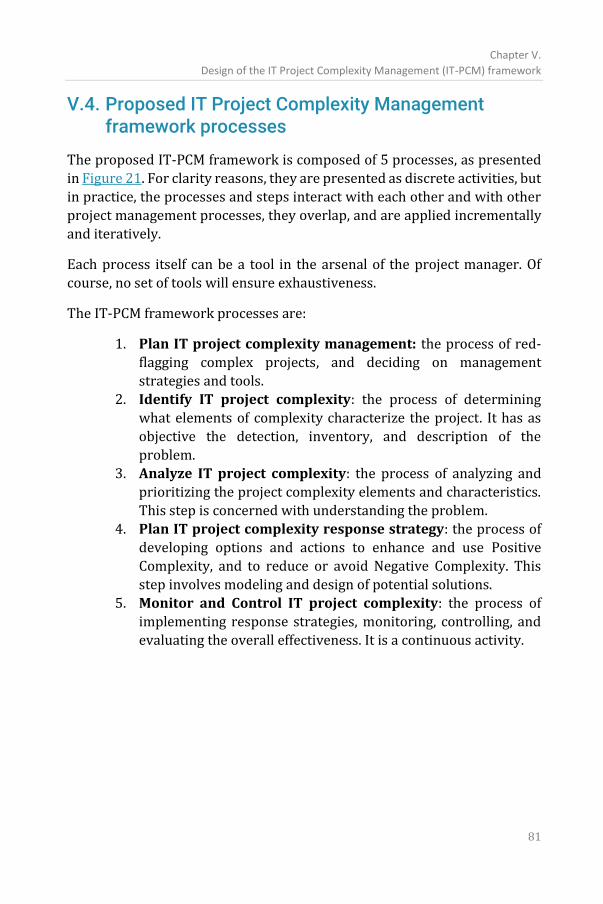
Chapter V.
Design of the IT Project Complexity Management (IT-PCM) framework
81
V.4. Proposed IT Project Complexity Management framework processes
The proposed IT-PCM framework is composed of 5 processes, as presented
in Figure 21. For clarity reasons, they are presented as discrete activities, but
in practice, the processes and steps interact with each other and with other
project management processes, they overlap, and are applied incrementally
and iteratively.
Each process itself can be a tool in the arsenal of the project manager. Of
course, no set of tools will ensure exhaustiveness.
The IT-PCM framework processes are:
1. Plan IT project complexity management: the process of red-
flagging complex projects, and deciding on management
strategies and tools.
2. Identify IT project complexity: the process of determining
what elements of complexity characterize the project. It has as
objective the detection, inventory, and description of the
problem.
3. Analyze IT project complexity: the process of analyzing and
prioritizing the project complexity elements and characteristics.
This step is concerned with understanding the problem.
4. Plan IT project complexity response strategy: the process of
developing options and actions to enhance and use Positive
Complexity, and to reduce or avoid Negative Complexity. This
step involves modeling and design of potential solutions.
5. Monitor and Control IT project complexity: the process of
implementing response strategies, monitoring, controlling, and
evaluating the overall effectiveness. It is a continuous activity.
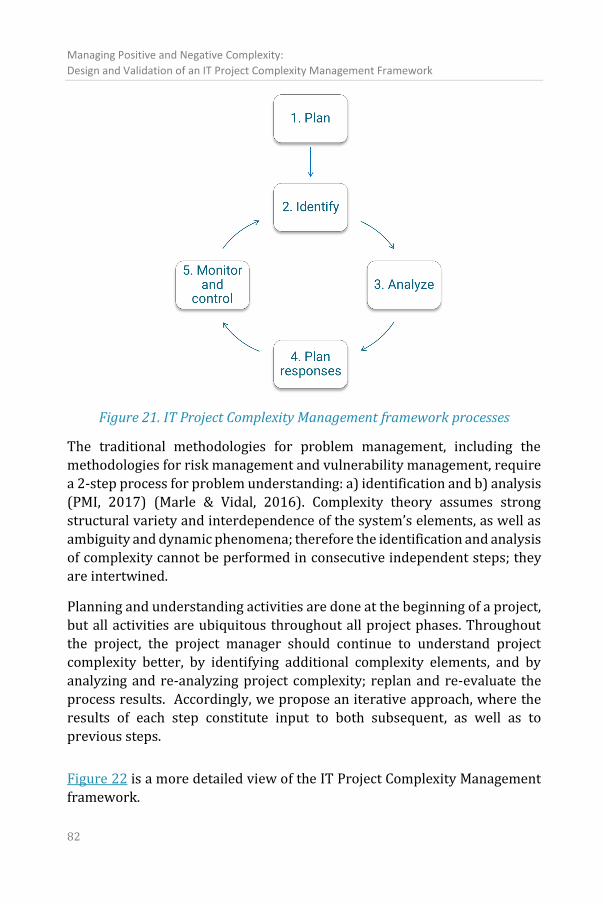
Managing Positive and Negative Complexity:
Design and Validation of an IT Project Complexity Management Framework
82
Figure 21. IT Project Complexity Management framework processes
The traditional methodologies for problem management, including the
methodologies for risk management and vulnerability management, require
a 2-step process for problem understanding: a) identification and b) analysis
(PMI, 2017) (Marle & Vidal, 2016). Complexity theory assumes strong
structural variety and interdependence of the system’s elements, as well as
ambiguity and dynamic phenomena; therefore the identification and analysis
of complexity cannot be performed in consecutive independent steps; they
are intertwined.
Planning and understanding activities are done at the beginning of a project,
but all activities are ubiquitous throughout all project phases. Throughout
the project, the project manager should continue to understand project
complexity better, by identifying additional complexity elements, and by
analyzing and re-analyzing project complexity; replan and re-evaluate the
process results. Accordingly, we propose an iterative approach, where the
results of each step constitute input to both subsequent, as well as to
previous steps.
Figure 22 is a more detailed view of the IT Project Complexity Management
framework.
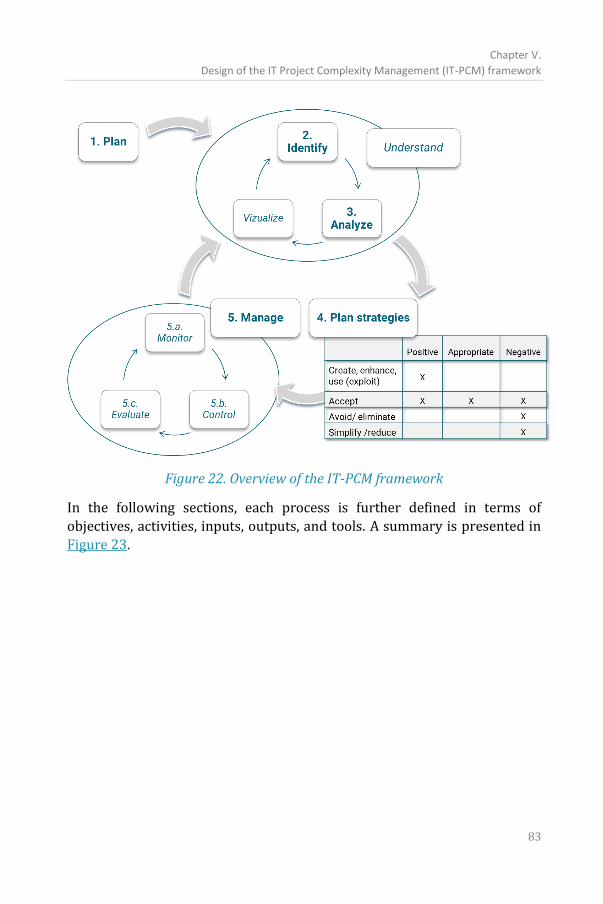
Chapter V.
Design of the IT Project Complexity Management (IT-PCM) framework
83
Figure 22. Overview of the IT-PCM framework
In the following sections, each process is further defined in terms of
objectives, activities, inputs, outputs, and tools. A summary is presented in
Figure 23.
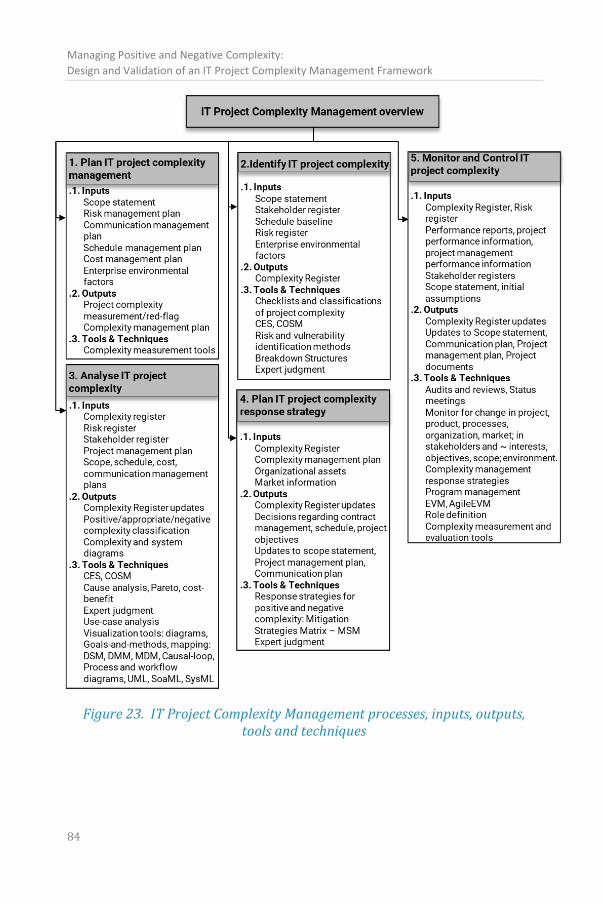
Managing Positive and Negative Complexity:
Design and Validation of an IT Project Complexity Management Framework
84
Figure 23. IT Project Complexity Management processes, inputs, outputs, tools and techniques
Chapter V.
Design of the IT Project Complexity Management (IT-PCM) framework
85
V.4.1. Planning: deciding when and how to manage complexity
Planning is performed at the beginning of the project, typically at the project
approval gates: during a feasibility study, and/or Project Planning phase.
The planning process includes:
1. Preliminary measurement/assessment of the complexity level of the
project, i.e. red-flagging if the project is complex – using a simple
measurement tool or expert judgment.
2. Decisions if project complexity should be specifically managed, and
how; i.e. planning what specific tools will be deployed, if any. This is
typically done by choosing from the list of the available tools which
are at the disposal of the project manager.
The deployment of each management tool incurs additional
overhead costs; therefore, the decision of the tools and methods to
be applied should be based on a cost-benefit analysis (Boadway,
2006).
Complexity can be measured, or red-flagged, with tools such as CIFTER,
Vidal, Hass (Morcov, Pintelon, & Kusters, 2020a). A detailed list of potential
measurement tools is presented in section III.5.
It should be noted that red-flagging, which is part of the Planning phase,
partially overlaps with the Identification phase. Indeed, red-flagging involves
executing a preliminary analysis, thus identification, of complexity. At the
same time, this red-flagging does not constitute a detailed analysis of
complexity, with its specific tools and associated costs, which might not be
appropriate to each specific project.
There are two specific moments when complexity assessment is particularly
important: the initial go/no-go decision to start a project, and during the Project Planning phase.
1. The first moment is the initial go/no-go decision to start a project.
The terminology is different for various types of projects - it can be a
bid/no-bid decision or gate, during a procurement process or sales
cycle; for a due diligence process; an approval board; a risk
assessment. For a services company, the most important moment is
the bid/no-bid decision during proposal preparation. For a product-
oriented company, the typical moment is the approval of a new
investment.
Managing Positive and Negative Complexity:
Design and Validation of an IT Project Complexity Management Framework
86
Currently, the topic of complexity is managed as part of the risk
management process. A bid or investment decision is typically taken
based on a P&L, accompanied by a risk assessment matrix, and
sometimes a cost-benefit analysis or similar decision-making tool.
The go/no-go decision is already a complexity response decision. A
new project typically increases the complexity of the organization
and its processes. Ending a project or discontinuing a product and
simplifying a product portfolio are typical examples of decreasing
complexity. Creating a new product, product version or variant
increases complexity. Creating a new business unit or merging
business units increases organizational complexity.
2. The second moment when it is important to apply a structured
approach including assessment of complexity management is during
the Project Planning phase, when the strategy, tools, and methods to
be used for the particular project are chosen.
V.4.2. Identification
Identification is the process of determining what elements of complexity
characterize the project. Its main deliverable is an inventory and detailed
description of the problem.
A preliminary analysis was most likely performed during the Planning
process, in order to red-flag a project as complex or not. On the other hand,
the Identification process involves creating a rigorous register, a detailed
complexity map.
When faced with the challenge of understanding and analyzing a new topic
or project, practitioners refer to guidelines, templates, examples, precedents,
tutorials, methodologies. For identification and initial analysis, checklists are the key tools.
Perceived complexity approaches acknowledge that there is much more to
complexity than structural descriptive complexity; than the mere
enumeration or description of characteristics of complexity. Complexity is
more than structural; it also includes subjective and dynamic aspects.
At the same time, research tends to focus on objective, structural complexity,
because structural complexity is less abstract, thus more discussable,
Chapter V.
Design of the IT Project Complexity Management (IT-PCM) framework
87
analyzable, measurable, and manageable. Accordingly, for practical reasons,
this framework, including the identification process, refers significantly to
descriptive complexity.
Examples of checklists and tools proposed by the relevant literature are:
• Checklists of groups of elements (Maurer, 2017).
• Identification based on sources and aspects of complexity, such as:
technical vs. organizational complexity; related to ambiguity,
uncertainty, propagation, or chaos; related to size, variety,
interdependence, or context.
• Classification based on the complexity sub-system: market,
organization, process, product (Lindemann, Maurer, & Braun, 2009)
(Maurer, 2017).
• Other possible classifications of complexity such as based on
location: internal vs. external.
• Checklists derived from the complexity measurement tools.
• Marketing analysis, risk identification and management tools and
checklists: SWOT, PEST – analysis of Political, Economic, Social, and
Technological factors, STEEP - same plus Environmental, STEEPLE –
same plus Legal and Ethical, PERSI – Political, Economic, Religion,
Social, Intellectual, WWWWHW – who, what, when, where, how, why
(PMI, 2017) (Marle & Vidal, 2016).
• Balanced Scorecard.
• External audits.
• Reference-class forecasting (Lovallo & Kahneman, 2003).
V.4.3. Analysis: qualitative and quantitative
The analysis for identifying the type of complexity and selecting the
management strategy can be:
• Qualitative analysis
o Input checklists.
o Root-cause analysis, fault-tree.
o Cause-and-effect diagrams, Ishikawa, problem-tree.
o Toyota 5-Why’s (Liker & Franz, 2011).
o X-BS: Work Breakdown Structure, Risk Breakdown
Structure, Resource BS, Product BS, Organization BS (Levine,
1993).
Managing Positive and Negative Complexity:
Design and Validation of an IT Project Complexity Management Framework
88
o Use-case analysis.
• Quantitative analysis
o It can help prioritize and thus select the most useful subset of
complexity items and tools to be applied in a project.
o It includes quantifying the elements of complexity in numeric
values, such as financial impact; similarly to the quantitative
analysis of risks.
o Based on the quantitative results, numeric tools can be
applied, such as:
▪ Cost-benefit analysis (Boadway, 2006).
▪ Pareto.
Expert judgment, Delphi, focus groups, affinity diagrams, stakeholder
analysis, and brainstorming are general tools applicable for both qualitative
and quantitative complexity analysis.
Complexity analysis should include categorizing complexity as positive,
appropriate, or negative, i.e. useful or damaging – based on its effects.
Specific tools with this purpose will be further developed and proposed in
Chapter VI. While the analysis of effects should be done primarily against the
initial project objectives, these will be adapted if new opportunities are
uncovered (PMI, 2017).
V.4.3.1 Complexity visualization
Visualizing IT project complexity is a general tool for analysis, especially
suitable for engineering projects.
System views help visualize both structural complexity and dynamic
complexity. Visualization tools include:
• Visualizing the effects of complexity – positive, appropriate, or
negative (a tool doesn’t exist yet, to be developed – see Chapter VI).
• Dependency modeling - which can be used for all aspects of a project,
including for:
o modeling products, objectives, stakeholders, teams,
organizations, processes, risks, etc.
o model the dependencies between elements of the same sub-
system, e.g., between product parts; as well as dependencies
between different sub-systems.
o DSM (Browning, 2001).
Chapter V.
Design of the IT Project Complexity Management (IT-PCM) framework
89
o DMM (Eppinger & Browning, 2012) (Maurer, 2017).
o MDM (Marle & Vidal, 2016).
• Goals-and-methods matrix (Turner & Cochrane, 1993).
• Complexity mapping diagram based on four dimensions of
complexities – structural, technical, temporal, directional
(Remington & Pollack, 2007).
• Causal-loop diagrams, as defined by Systems Thinking (Kim, 1999).
• Graphs, process and workflow diagrams.
• Breakdown Structures, organization charts.
• Mind-maps.
• UML (Booch, Rumbaugh, & Jacobson, 2005).
• SoaML, SysML (Delligatti, 2013).
V.4.3.2 The required level of detail for decomposition, analysis, and
planning
Many tools rely on decomposition, in listing and analyzing individual
components of the analyzed system. Decomposition, analysis, and planning
can be too granular and details – which would be inefficient; or too general
and superficial – which would be not clear nor useful. A key question is
therefore: which is the right level of detail when analyzing and decomposing
a (complex) system. In individual cases, hard numeric rules can be imposed,
such as: “Each task in a project plan or WBS must require less than 4 or 8
man-hours of effort to complete” (these are actual examples from the
industry).
A possible answer can be derived from utilitarianist principles. A rule-of-
thumb for deciding if an analysis is sufficiently detailed is thus: Detail until
you know what is to be done. When a team member receives a task that
they do not know how to implement, then the task is not sufficiently analyzed
and detailed, and it requires further decomposition and analysis. This is
congruent with Toyota 5-Why’s methodology (Liker & Franz, 2011): ask
“why” until you understand the problem and its source. In IT Project
Complexity Management, we could therefore propose that:
Complexity should be detailed and analyzed until the work to be done is
clear.
More than this, the level of detail is different based on the moment and
purpose of the analysis. The level of detail will naturally be less granular for
go/no-go decisions, more granular when planning the execution of a project,
Managing Positive and Negative Complexity:
Design and Validation of an IT Project Complexity Management Framework
90
and even more granular during execution. Therefore, also the tools or
checklists used for identification of complexity items will not necessarily be
the same.
V.4.4. Planning IT project complexity response strategies
Traditionally, both research and practice focus on the negative effects of
complexity, on the relationship between complexity, risk, and failure. Still, as
argued in section IV.3, the complexity of IT projects and products is
sometimes appropriate (or requisite); and even positive. Complexity is
needed to ensure system viability; it enhances creativity and innovation; it
offers functionality (Beer, 1972) (McKelvey & Boisot, 2009) (Floricel, Michel,
& Piperca, 2016) (Maurer, 2017).
Accordingly, the potential response strategies should consider that
complexity can be negative, but it is sometimes necessary (appropriate, or
requisite), and sometimes even positive.
Appropriate Complexity is needed for the project to reach its objectives. Its
contribution to project success balances the negative effects, or the cost of
mitigation outweighs negative manifestations.
Positive Complexity adds value to a project; its contribution to project success
outweighs the associated negative consequences. Since it creates opportunity,
this should be exploited rather than eliminated.
Appropriate and Positive Complexity are concepts similar to the opportunities
of risk management, to requisite complexity, and antifragility (PMI, 2017)
(Boisot & McKelvey, 2011) (Taleb, Antifragile: things that gain from disorder,
2012).
For complexity management planning, an important consideration is that
negative complexity-related phenomena in one sub-system could lead to positive effects in another sub-system, or vice-versa, because of propagation
phenomena (Marle & Vidal, 2016). As the simplest example, a very complex
organization is difficult to manage and might be inefficient, but might be
required or even beneficial for the development of highly advanced and
innovative products (Maurer, 2017). Alternatively, a highly advanced IT
product, i.e. exhibiting positive intrinsic complexity, could have a major
negative impact if implemented in a well-functioning organization with well-
established and efficient processes already in place.
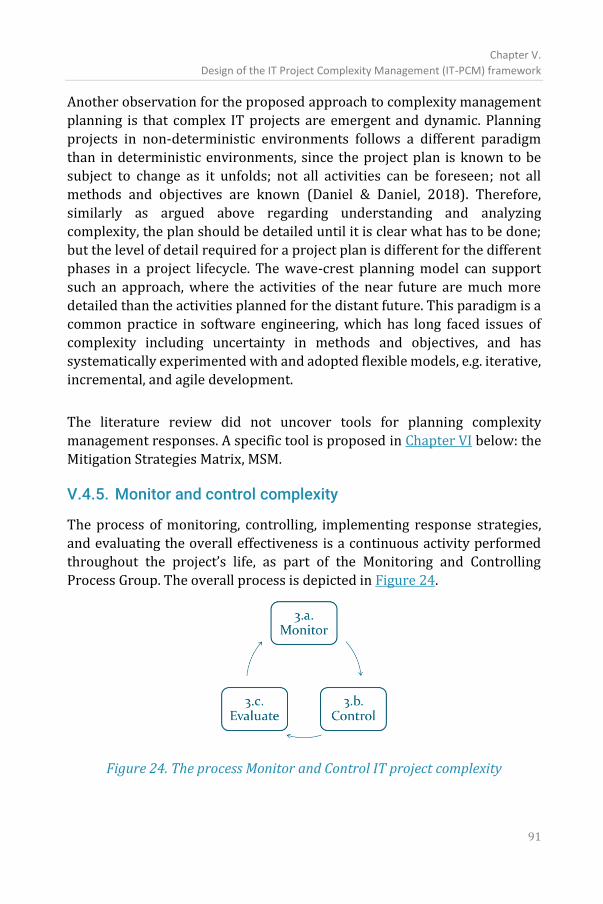
Chapter V.
Design of the IT Project Complexity Management (IT-PCM) framework
91
Another observation for the proposed approach to complexity management
planning is that complex IT projects are emergent and dynamic. Planning
projects in non-deterministic environments follows a different paradigm
than in deterministic environments, since the project plan is known to be
subject to change as it unfolds; not all activities can be foreseen; not all
methods and objectives are known (Daniel & Daniel, 2018). Therefore,
similarly as argued above regarding understanding and analyzing
complexity, the plan should be detailed until it is clear what has to be done;
but the level of detail required for a project plan is different for the different
phases in a project lifecycle. The wave-crest planning model can support
such an approach, where the activities of the near future are much more
detailed than the activities planned for the distant future. This paradigm is a
common practice in software engineering, which has long faced issues of
complexity including uncertainty in methods and objectives, and has
systematically experimented with and adopted flexible models, e.g. iterative,
incremental, and agile development.
The literature review did not uncover tools for planning complexity
management responses. A specific tool is proposed in Chapter VI below: the
Mitigation Strategies Matrix, MSM.
V.4.5. Monitor and control complexity
The process of monitoring, controlling, implementing response strategies,
and evaluating the overall effectiveness is a continuous activity performed
throughout the project’s life, as part of the Monitoring and Controlling
Process Group. The overall process is depicted in Figure 24.
Figure 24. The process Monitor and Control IT project complexity
Managing Positive and Negative Complexity:
Design and Validation of an IT Project Complexity Management Framework
92
Possible complexity management methods are:
a. Apply a structured approach to governance, project
management, quality management, complexity management.
b. Monitor and control according to quality assurance
frameworks – ISO 9001, CMM (ISO/IEC, 2015).
c. Apply security management frameworks such as CIS Controls
V8, ISO/IEC 27001, ISO/IEC 27002 (CIS, 2021) (ISO/IEC,
2018) (ISO/IEC, 2013).
d. Change management, configuration management; asset
management (Whyte, Stasis, & Lindkvist, 2016).
e. Release management; risk management, communication
management.
f. Monitoring the evolution of the analysis and design artifacts
– as the system is likely to change.
i. Artifacts that do not change, such as input checklists
ii. Elements that should not change
iii. Elements that are likely to change or that are
supposed to change.
g. Implement the project as a program – a system of projects
(Remington & Pollack, 2007).
h. Earned Value Performance Measurement (PMI, 2017),
including adaptations of EVM for Agile development
(Sulaiman & Smits, 2007), as well as integrating uncertainty
into EVM (Pajares & López-Paredes, 2011).
i. Role definition (Remington & Pollack, 2007).
Besides structural complicatedness, complexity also refers to subjective and
dynamic aspects. At the same time, the inventory of tools and techniques
focuses on objective, structural complexity, because structural complexity is
less abstract. Dynamic complexity aspects are related to “unknown
unknowns”; difficult to identify or plan. They behave like Black Swans and
follow “Butterfly Effect” patterns (Lorenz, 1963) (Taleb, Goldstein, &
Spitznagel, The Six Mistakes Executives Make in Risk Management, 2009).
Still, dynamic complexity aspects must be monitored, recognized, and
identified as they occur, and the project should be prepared to deal with
them.
The main method, in this case, is monitoring for change, especially in
stakeholders, objectives, and in the environment, as well as in the project
Chapter V.
Design of the IT Project Complexity Management (IT-PCM) framework
93
context – due to emergence (Snowden & Boone, 2007). “Monitoring” is
already listed in the traditional project management body of knowledge.
The literature review did not uncover a specific tool for monitoring the
implementation and impact of complexity management plans. Accordingly,
such a tool is further proposed in Chapter VI below: the Complexity Register
CoRe.
V.5. Structured IT-PCM framework, with inputs, outputs, tools and techniques, per process
Table 10 offers an overview of the proposed IT Project Complexity
Management framework, with inputs, outputs, tools and techniques, per each
process.
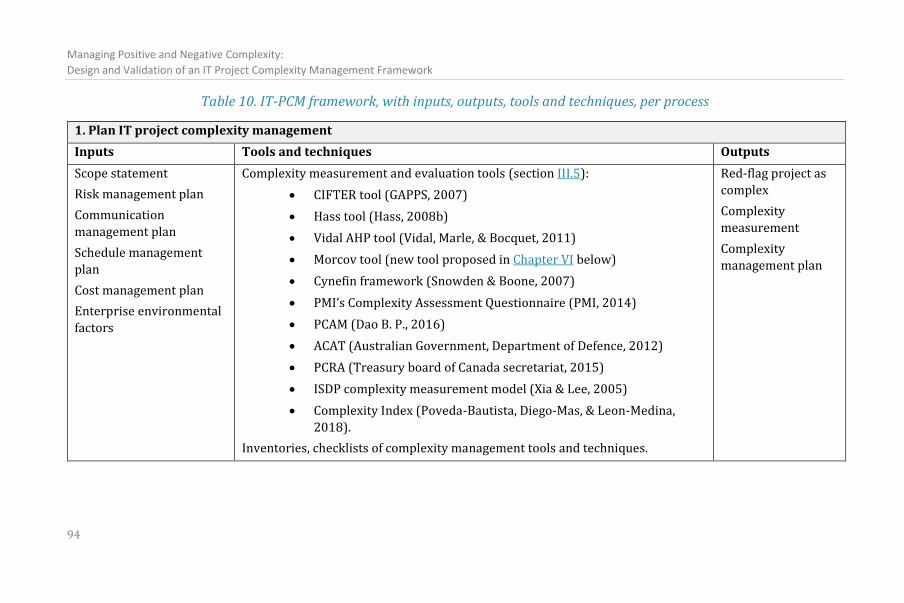
Managing Positive and Negative Complexity:
Design and Validation of an IT Project Complexity Management Framework
94
Table 10. IT-PCM framework, with inputs, outputs, tools and techniques, per process
1. Plan IT project complexity management
Inputs Tools and techniques Outputs
Scope statement
Risk management plan
Communication
management plan
Schedule management
plan
Cost management plan
Enterprise environmental
factors
Complexity measurement and evaluation tools (section III.5):
• CIFTER tool (GAPPS, 2007)
• Hass tool (Hass, 2008b)
• Vidal AHP tool (Vidal, Marle, & Bocquet, 2011)
• Morcov tool (new tool proposed in Chapter VI below)
• Cynefin framework (Snowden & Boone, 2007)
• PMI’s Complexity Assessment Questionnaire (PMI, 2014)
• PCAM (Dao B. P., 2016)
• ACAT (Australian Government, Department of Defence, 2012)
• PCRA (Treasury board of Canada secretariat, 2015)
• ISDP complexity measurement model (Xia & Lee, 2005)
• Complexity Index (Poveda-Bautista, Diego-Mas, & Leon-Medina,
2018).
Inventories, checklists of complexity management tools and techniques.
Red-flag project as
complex
Complexity
measurement
Complexity
management plan
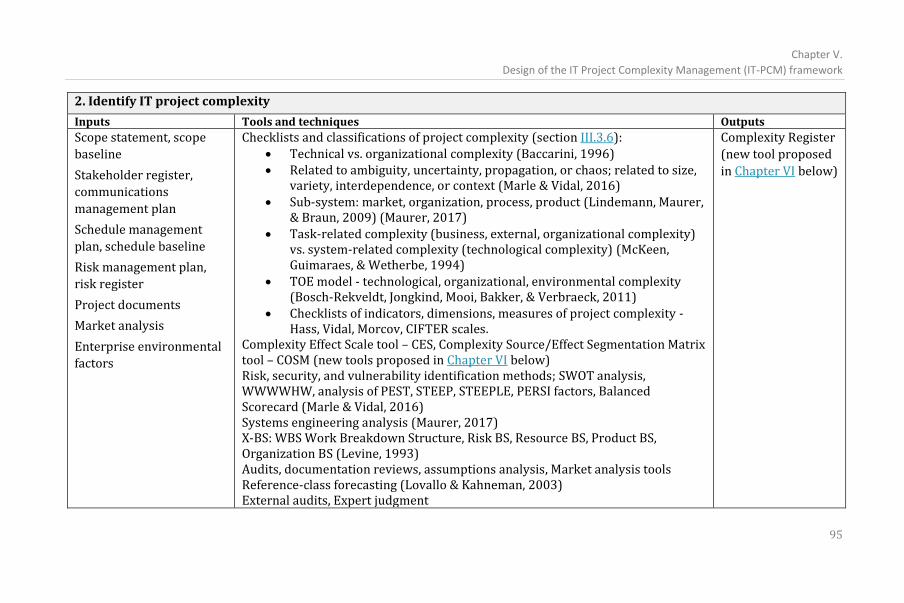
Chapter V.
Design of the IT Project Complexity Management (IT-PCM) framework
95
2. Identify IT project complexity
Inputs Tools and techniques Outputs
Scope statement, scope
baseline
Stakeholder register,
communications
management plan
Schedule management
plan, schedule baseline
Risk management plan,
risk register
Project documents
Market analysis
Enterprise environmental
factors
Checklists and classifications of project complexity (section III.3.6): • Technical vs. organizational complexity (Baccarini, 1996) • Related to ambiguity, uncertainty, propagation, or chaos; related to size,
variety, interdependence, or context (Marle & Vidal, 2016) • Sub-system: market, organization, process, product (Lindemann, Maurer,
& Braun, 2009) (Maurer, 2017) • Task-related complexity (business, external, organizational complexity)
vs. system-related complexity (technological complexity) (McKeen, Guimaraes, & Wetherbe, 1994)
• TOE model - technological, organizational, environmental complexity (Bosch-Rekveldt, Jongkind, Mooi, Bakker, & Verbraeck, 2011)
• Checklists of indicators, dimensions, measures of project complexity - Hass, Vidal, Morcov, CIFTER scales.
Complexity Effect Scale tool – CES, Complexity Source/Effect Segmentation Matrix tool – COSM (new tools proposed in Chapter VI below) Risk, security, and vulnerability identification methods; SWOT analysis, WWWWHW, analysis of PEST, STEEP, STEEPLE, PERSI factors, Balanced Scorecard (Marle & Vidal, 2016) Systems engineering analysis (Maurer, 2017) X-BS: WBS Work Breakdown Structure, Risk BS, Resource BS, Product BS, Organization BS (Levine, 1993) Audits, documentation reviews, assumptions analysis, Market analysis tools Reference-class forecasting (Lovallo & Kahneman, 2003) External audits, Expert judgment
Complexity Register
(new tool proposed
in Chapter VI below)
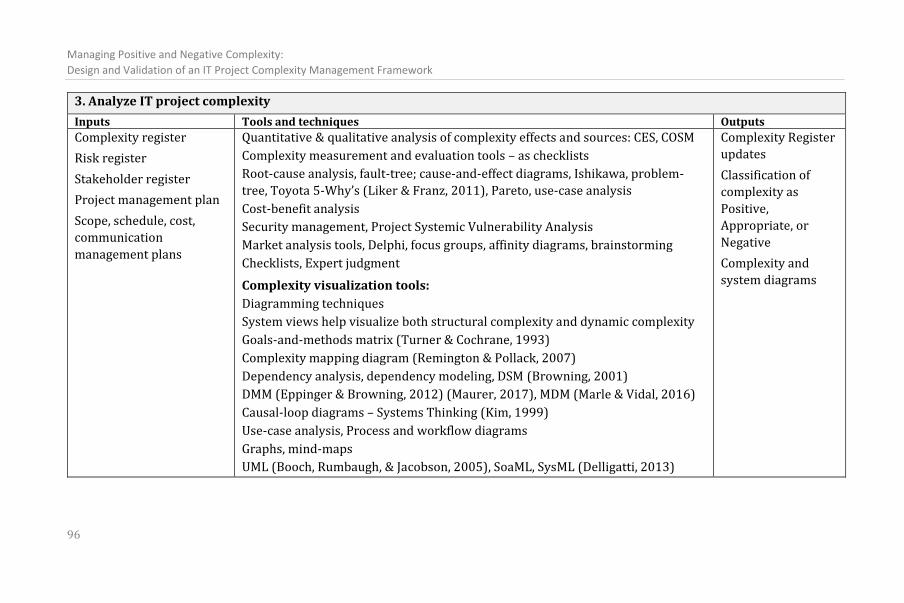
Managing Positive and Negative Complexity:
Design and Validation of an IT Project Complexity Management Framework
96
3. Analyze IT project complexity
Inputs Tools and techniques Outputs
Complexity register
Risk register
Stakeholder register
Project management plan
Scope, schedule, cost,
communication
management plans
Quantitative & qualitative analysis of complexity effects and sources: CES, COSM
Complexity measurement and evaluation tools – as checklists
Root-cause analysis, fault-tree; cause-and-effect diagrams, Ishikawa, problem-
tree, Toyota 5-Why’s (Liker & Franz, 2011), Pareto, use-case analysis
Cost-benefit analysis
Security management, Project Systemic Vulnerability Analysis
Market analysis tools, Delphi, focus groups, affinity diagrams, brainstorming
Checklists, Expert judgment
Complexity visualization tools:
Diagramming techniques
System views help visualize both structural complexity and dynamic complexity
Goals-and-methods matrix (Turner & Cochrane, 1993)
Complexity mapping diagram (Remington & Pollack, 2007)
Dependency analysis, dependency modeling, DSM (Browning, 2001)
DMM (Eppinger & Browning, 2012) (Maurer, 2017), MDM (Marle & Vidal, 2016)
Causal-loop diagrams – Systems Thinking (Kim, 1999)
Use-case analysis, Process and workflow diagrams
Graphs, mind-maps
UML (Booch, Rumbaugh, & Jacobson, 2005), SoaML, SysML (Delligatti, 2013)
Complexity Register
updates
Classification of
complexity as
Positive,
Appropriate, or
Negative
Complexity and
system diagrams
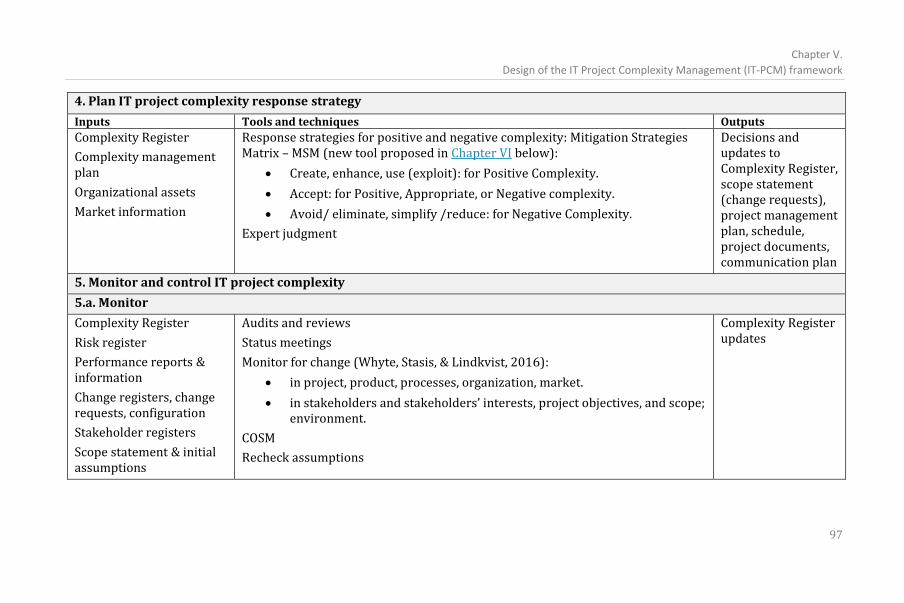
Chapter V.
Design of the IT Project Complexity Management (IT-PCM) framework
97
4. Plan IT project complexity response strategy
Inputs Tools and techniques Outputs
Complexity Register
Complexity management plan
Organizational assets
Market information
Response strategies for positive and negative complexity: Mitigation Strategies Matrix – MSM (new tool proposed in Chapter VI below):
• Create, enhance, use (exploit): for Positive Complexity.
• Accept: for Positive, Appropriate, or Negative complexity.
• Avoid/ eliminate, simplify /reduce: for Negative Complexity.
Expert judgment
Decisions and updates to Complexity Register, scope statement (change requests), project management plan, schedule, project documents, communication plan
5. Monitor and control IT project complexity
5.a. Monitor
Complexity Register
Risk register
Performance reports & information
Change registers, change requests, configuration
Stakeholder registers
Scope statement & initial assumptions
Audits and reviews
Status meetings
Monitor for change (Whyte, Stasis, & Lindkvist, 2016):
• in project, product, processes, organization, market.
• in stakeholders and stakeholders’ interests, project objectives, and scope; environment.
COSM
Recheck assumptions
Complexity Register updates
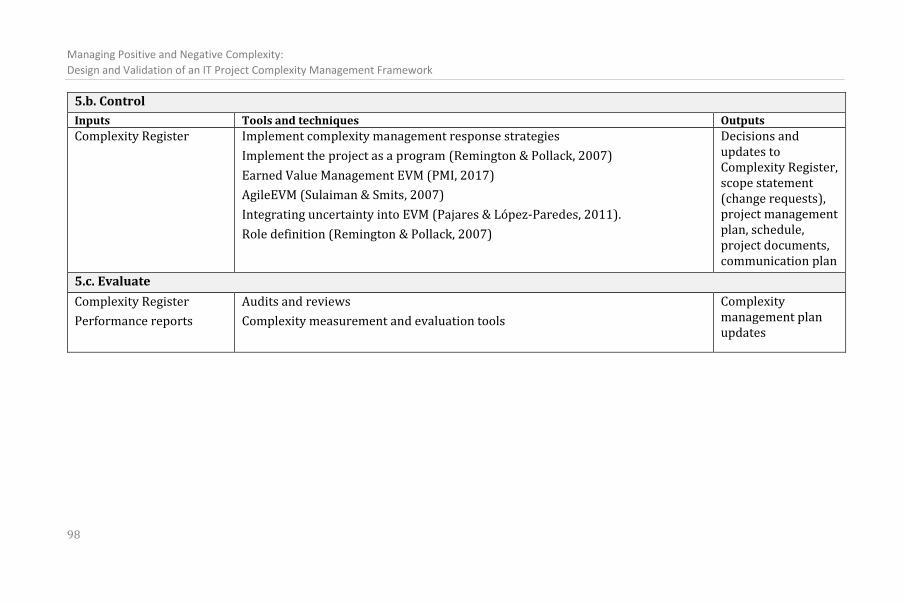
Managing Positive and Negative Complexity:
Design and Validation of an IT Project Complexity Management Framework
98
5.b. Control
Inputs Tools and techniques Outputs
Complexity Register Implement complexity management response strategies
Implement the project as a program (Remington & Pollack, 2007)
Earned Value Management EVM (PMI, 2017)
AgileEVM (Sulaiman & Smits, 2007)
Integrating uncertainty into EVM (Pajares & López-Paredes, 2011).
Role definition (Remington & Pollack, 2007)
Decisions and updates to Complexity Register, scope statement (change requests), project management plan, schedule, project documents, communication plan
5.c. Evaluate
Complexity Register
Performance reports
Audits and reviews
Complexity measurement and evaluation tools
Complexity management plan updates
Chapter V.
Design of the IT Project Complexity Management (IT-PCM) framework
99
V.6. Conclusion
This chapter proposes a practical IT-PCM framework to support IT Project
Complexity Management in a structured, systematic way. It is formed of
processes, described in terms of inputs and outputs.
These interact with each other and with other project management
processes. While presented as discrete activities, in practice they overlap,
and are applied incrementally and iteratively.
For each process and step in the IT-PCM framework, an inventory of tools
and techniques is provided.
Several gaps were uncovered in this inventory of tools. An attempt to fill
some of these gaps with proposed new tools is presented in the following
Chapter VI – research sub-project P4.
These gaps, and the new tools proposed in the subsequent chapter, relate to:
• Red-flagging and measuring complexity: while several measurement
tools were identified as part of the literature review, they are not
particularly adapted to an IT environment.
• Identification and analysis of the effects of complexity; particularly to
understand if the effects are appropriate or have positive effects (CES
and COSM tools).
• Planning complexity response strategies (MSM tool).
• Monitoring the application and impact of complexity response
strategies and actions (Complexity Register CoRe tool).

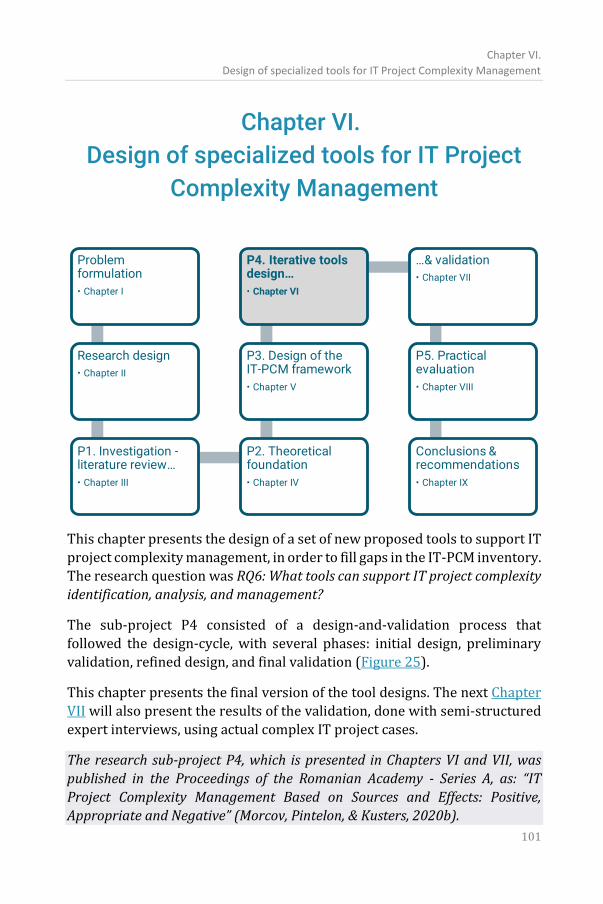
Chapter VI.
Design of specialized tools for IT Project Complexity Management
101
Chapter VI.
Design of specialized tools for IT Project
Complexity Management
This chapter presents the design of a set of new proposed tools to support IT
project complexity management, in order to fill gaps in the IT-PCM inventory.
The research question was RQ6: What tools can support IT project complexity
identification, analysis, and management?
The sub-project P4 consisted of a design-and-validation process that
followed the design-cycle, with several phases: initial design, preliminary
validation, refined design, and final validation (Figure 25).
This chapter presents the final version of the tool designs. The next Chapter
VII will also present the results of the validation, done with semi-structured
expert interviews, using actual complex IT project cases.
The research sub-project P4, which is presented in Chapters VI and VII, was
published in the Proceedings of the Romanian Academy - Series A, as: “IT
Project Complexity Management Based on Sources and Effects: Positive,
Appropriate and Negative” (Morcov, Pintelon, & Kusters, 2020b).
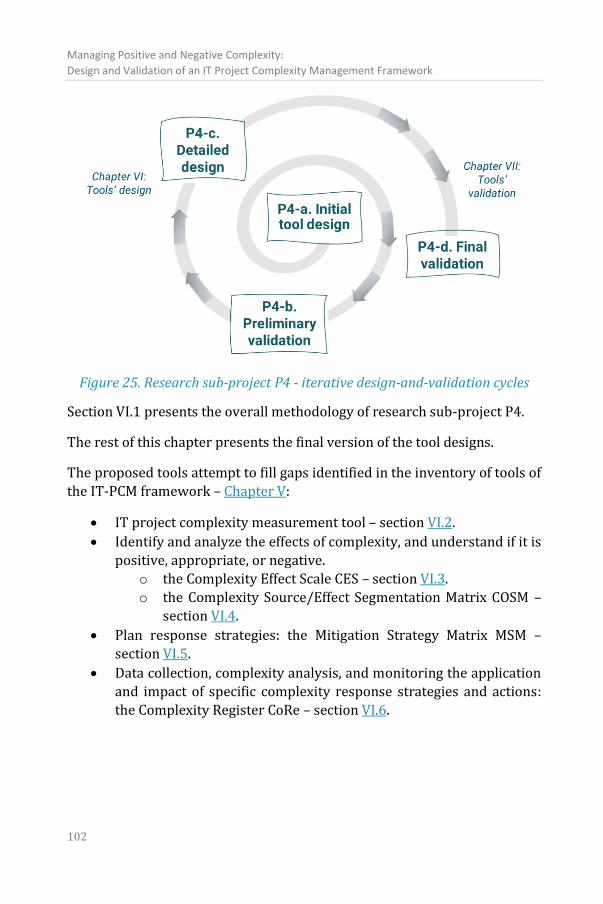
Managing Positive and Negative Complexity:
Design and Validation of an IT Project Complexity Management Framework
102
Figure 25. Research sub-project P4 - iterative design-and-validation cycles
Section VI.1 presents the overall methodology of research sub-project P4.
The rest of this chapter presents the final version of the tool designs.
The proposed tools attempt to fill gaps identified in the inventory of tools of
the IT-PCM framework – Chapter V:
• IT project complexity measurement tool – section VI.2.
• Identify and analyze the effects of complexity, and understand if it is
positive, appropriate, or negative.
o the Complexity Effect Scale CES – section VI.3.
o the Complexity Source/Effect Segmentation Matrix COSM –
section VI.4.
• Plan response strategies: the Mitigation Strategy Matrix MSM –
section VI.5.
• Data collection, complexity analysis, and monitoring the application
and impact of specific complexity response strategies and actions:
the Complexity Register CoRe – section VI.6.
Chapter VI.
Design of specialized tools for IT Project Complexity Management
103
VI.1.Methods
Based on the literature review (Chapter III), and armed with the new
paradigms formulated in the theoretical foundation (Chapter IV), we
designed and validated new tools to support IT project complexity
management, in a qualitative exploratory approach.
Design science is a valid research methodology to develop solutions for
practical engineering problems (Peffers, Tuunanen, Rothenberger, &
Chatterjee, 2007). Qualitative research helps develop initial understanding
in a less explored area (Levitt, et al., 2018) (Gummesson, 2000).
Our research methodology followed a pragmatic constructivist approach to
solving problems, with an iterative-incremental 2-rounds design, with trial-
and-error cycles, based on the design cycle of the engineering cycle (Wieringa,
2014). The main activities were:
• Problem formulation: we started with a general research question,
on how to manage IT Project Complexity, operationalized as the
design of new tools to support identification and analysis.
• Investigation: literature review on project complexity literature
(Chapter III, sub-project P1), as well as study of systems theory,
systems and IT engineering, to establish the theoretical and practical
foundation for the design (Chapter IV, sub-project P2).
• Initial design of the new tools: development of the initial design
concepts, based on the literature review, and refined through
interviews with experts and analysis of actual complex IT project
cases.
• Preliminary validation – with semi-structured interviews, based on
actual project cases.
• Detailed design of the new tools, based on the results of the
validation.
• Final validation of the tools, in a second round of interviews with the
same experts.
The validation was done in 2 iterations: preliminary validation (followed by
detailed design) and final validation (followed by design adjustments). The
results of the validation are presented in Chapter VII.
Managing Positive and Negative Complexity:
Design and Validation of an IT Project Complexity Management Framework
104
The validation was done through semi-structured interviews with
practitioners, using actual project cases (Yin R. K., 2011). Face-to-face, open
interviews support qualitative exploratory research and obtaining new
insights and increase innovation and creativity; they are appropriate
considering the novelty of the research questions, the niche topic, the
overloaded non-standardized terminology. In qualitative research, stronger
importance must be placed on negative than on positive feedback, thus
uncovering new insights, challenging preconceptions, and avoiding self-
confirmation bias (Wieringa, 2014).
Triangulation has been shown to both prove convergence, as well as to
explore divergent but possibly new relevant insights. Multiple project cases
were therefore used to support the interviews, as they are suitable for
building new theories and their external validation (Gibbert & Ruigrok,
2010).
During our research and design process, we embraced the fact that
qualitative research is a personal journey (Gummesson, 2000); that ideas
and findings get reconceptualized with each writing (Bansal & Corley, 2012).
As such, the designs were updated according to each round of feedback
received during each validation/re-validation cycle. Noticeably, the
Complexity Register CoRe tool emerged during the sub-project P5 –
Evaluation, as a data collection and aggregation tool.
VI.2.Proposed IT project complexity measurement and analysis tool (“Morcov tool”)
This section presents the design of a complexity measurement tool for IT
projects. The tool consists of a list of complexity factors, each with an
associated measurement scale and metric.
The list of complexity factors was obtained through the refinement of the
inventory of complexity characteristics built as part of the literature review
(Chapter III).
Chapter VI.
Design of specialized tools for IT Project Complexity Management
105
The literature review had among its results 2 artifacts to support the
identification of project complexity:
• A list of existing tools for measuring project complexity (section III.5,
Table 8).
• An inventory enumerating all the measures, criteria, characteristics,
factors, and indicators proposed for measuring, identifying, or
categorizing complex projects (Appendix B).
Significant empirical proofs show that there are major differences between
complexity measures across different industry sectors; therefore, the scope
and applicability of this tool was limited to IT (Bosch-Rekveldt, Bakker, &
Hertogh, 2018). Based on this consideration, some successful IT/software
estimation tools were also analyzed, such as Function Points Analysis and
COCOMO. These include IT/software complexity aspects in their model6. At
the same time, in line with our holistic approach to IT project complexity,
described in section IV.2, the complexity factors were not limited to the IT
product, or to technology. Instead, they also cover aspects related to the other
project sub-systems, such as organization, process, market, and project.
The initial large inventory of factors of complexity has 116 items. It does not
discriminate against factors specifically excluded from other models, such as
size. Many items in this inventory are redundant, and items have variable
degrees of relevance. At the same time, the compilation of a large inclusive
inventory, containing the maximum possible list of items, ensured reliability
and repeatability of the process, as well as construct validity and internal
validity, and supported avoiding anecdotic evidence and subjective criteria
(Gibbert & Ruigrok, 2010b).
This initial inventory of complexity measures was reduced to 28 items using
card-sorting (Paul, 2008) (Spencer & Warfel, 2004). The card-sorting
process was executed from the single perspective of the author. During this
process, certain choices had to be done which may be considered subjective.
6 Function Points Analysis uses a Value Adjustment Factor, computed based
on 14 General System Characteristics (Albrecht, 1979) (Longstreet, 2012).
COCOMO also uses 15 Cost Driver Attributes in its model (Boehm, 1981)
(Pressman, 2001).
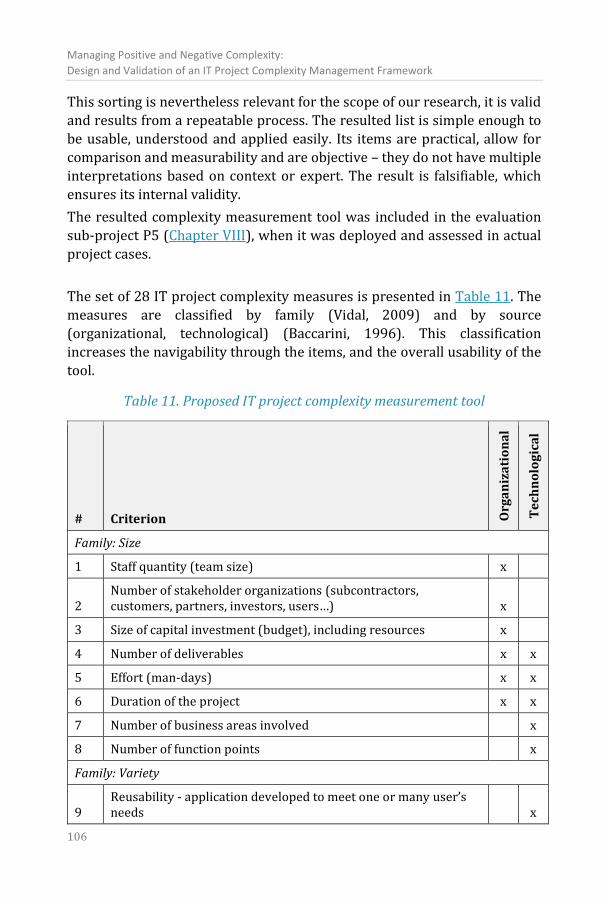
Managing Positive and Negative Complexity:
Design and Validation of an IT Project Complexity Management Framework
106
This sorting is nevertheless relevant for the scope of our research, it is valid
and results from a repeatable process. The resulted list is simple enough to
be usable, understood and applied easily. Its items are practical, allow for
comparison and measurability and are objective – they do not have multiple
interpretations based on context or expert. The result is falsifiable, which
ensures its internal validity.
The resulted complexity measurement tool was included in the evaluation
sub-project P5 (Chapter VIII), when it was deployed and assessed in actual
project cases.
The set of 28 IT project complexity measures is presented in Table 11. The
measures are classified by family (Vidal, 2009) and by source
(organizational, technological) (Baccarini, 1996). This classification
increases the navigability through the items, and the overall usability of the
tool.
Table 11. Proposed IT project complexity measurement tool
# Criterion Org
an
iza
tio
na
l
Te
chn
olo
gic
al
Family: Size
1 Staff quantity (team size) x
2 Number of stakeholder organizations (subcontractors, customers, partners, investors, users…) x
3 Size of capital investment (budget), including resources x
4 Number of deliverables x x
5 Effort (man-days) x x
6 Duration of the project x x
7 Number of business areas involved x
8 Number of function points x
Family: Variety
9 Reusability - application developed to meet one or many user’s needs x
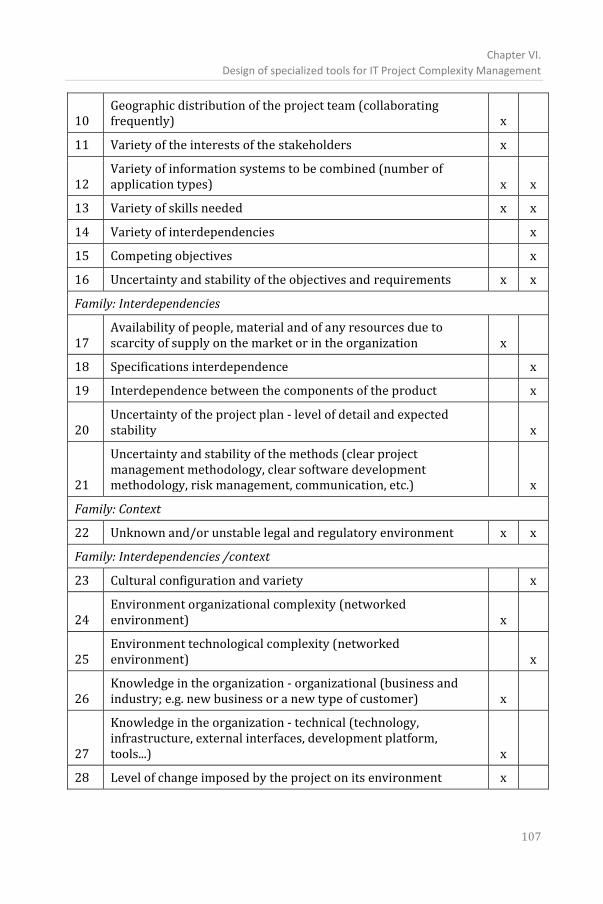
Chapter VI.
Design of specialized tools for IT Project Complexity Management
107
10 Geographic distribution of the project team (collaborating frequently) x
11 Variety of the interests of the stakeholders x
12 Variety of information systems to be combined (number of application types) x x
13 Variety of skills needed x x
14 Variety of interdependencies x
15 Competing objectives x
16 Uncertainty and stability of the objectives and requirements x x
Family: Interdependencies
17 Availability of people, material and of any resources due to scarcity of supply on the market or in the organization x
18 Specifications interdependence x
19 Interdependence between the components of the product x
20 Uncertainty of the project plan - level of detail and expected stability x
21
Uncertainty and stability of the methods (clear project management methodology, clear software development methodology, risk management, communication, etc.) x
Family: Context
22 Unknown and/or unstable legal and regulatory environment x x
Family: Interdependencies /context
23 Cultural configuration and variety x
24 Environment organizational complexity (networked environment) x
25 Environment technological complexity (networked environment) x
26 Knowledge in the organization - organizational (business and industry; e.g. new business or a new type of customer) x
27
Knowledge in the organization - technical (technology, infrastructure, external interfaces, development platform, tools...) x
28 Level of change imposed by the project on its environment x
Managing Positive and Negative Complexity:
Design and Validation of an IT Project Complexity Management Framework
108
Practical examples and the results of the application of this measurement
tool in practice as part of the evaluation sub-project P5 are presented in
Chapter VIII: Practical evaluation, and in Appendix F.4.
VI.2.1. Complexity measurement tool - weights
For an assessment tool to be usable, its results must be comparable and
repeatable.
The literature review showed that criteria and numeric weights are different
across domains, and even between authors, experts, or studies within the
same field (Thamhain, 2013). Research suggests that the importance of
criteria and thus the values of possible weights vary across different types of
projects, across types of organizations, technologies, or industries.
This suggests that the projects which are measured and compared should be
reasonably similar, in terms of:
• Products, incl. technology.
• Organization, incl. stakeholders, size, culture.
• Processes, incl. methodologies, standards, tools.
• Market: environment, industry.
• Project, incl. tools, stakeholders, users, size.
Accordingly, this study did not attempt to assign individual weights to each
complexity item, or to propose a general complexity formula. No weighting
was applied in the practical evaluation sub-project P5 either (Chapter VIII).
Of course, for different practical implementations, specific sets of weights
could be developed, appropriate to the specific respective organization and
project environment.
This conclusion regarding the difficulty to assign weights to individual
complexity items is aligned with the analysis of the effectiveness of formal
methods for estimating software projects, such as COCOMO, FPA – Function
Point Analysis, IFPUG - International Function Point Users Group. Software
estimation methods require heavy calibration using historical data related to
the exact specific industry, organization, tools and technology employed for
the particular projects measured. Because IT projects are particularly varied
and complex (Moe, Dingsøyr, & Rolland, 2018), such estimation techniques
have systematically proven to be unreliable (Cao, Gu, & Thompson, 2012).
Thus, software estimation errors of 10% are considered acceptable, and
organizations only worry when error levels exceed 100% (McConnell, 2006).
Chapter VI.
Design of specialized tools for IT Project Complexity Management
109
Therefore, organizations mostly revert to expert judgment for estimation
(Jørgensen, 2007). Accordingly, the calculation and assignation of weights to
the proposed complexity measures at this time would not meet reasonable
reliability and repeatability criteria, and also would not fulfill sufficient
external validity conditions for the scope of this research.
VI.2.2. Complexity measurement tool - scales
The scale applied in the practical evaluation is a design choice.
For qualitative criteria, an interval scale with 5 points was used – the most
common type of Likert scale. The minimum and maximum values were
defined as relative to the organization, i.e. to the project portfolio.
The measurement tool includes quantitative criteria, which are mostly
aspects related to size, e.g. effort or duration. For these questions, a Likert
scale does not discriminate well between very different projects: there is no
universally valid maximum value. In fact, no matter how large we would set a
“reasonable” maximum value for a Likert scale for a quantitative question, a
bigger project will eventually appear, for which the scale would not
discriminate correctly. At the same time, if an excessively high maximum value
is proposed, then the high values of the Likert scale might never be used.
Therefore, in order to ensure correct discrimination between projects, a ratio
scale is proposed for the numeric quantitative questions. The possible
answers are in such cases the absolute values, e.g. Team size can be
quantified in full-time equivalents, Effort in man-days, and Duration in
calendar days.
In the IT-PCM framework, the IT project complexity measurement tool is
useful mostly during the identification and analysis processes of the
framework.
The tools proposed in the following sections focus on complexity analysis.
Managing Positive and Negative Complexity:
Design and Validation of an IT Project Complexity Management Framework
110
VI.3.The Complexity Effect Scale tool – CES: Positive, Appropriate, Negative Complexity
As argued in Chapter IV: Theoretical foundation, our approach considers that
complexity can sometimes have positive or appropriate effects on overall
project success. The analysis of the effects of complexity is important for
industry IT projects, in order to better understand it, and to make
appropriate decisions and mitigation plans.
The Complexity Effect Scale – CES tool provides a structured method to
analyze project complexity based on its effects.
CES attempts to fill a gap in the IT-PCM framework (Chapter V). It is most
useful during the complexity analysis process – section V.4.3.
The results of the application of the CES tool are a critical input to the process
of Planning response strategies – section V.4.4.
Negative complexity is the complexity that hinders project management
performance and project success.
Traditionally, both research and practice focus on the negative effects of
complexity, on the relationship between complexity, risk, and failure. Still, as
argued in section IV.3, the complexity of IT projects and products is
sometimes Appropriate; and even Positive. Complexity is needed to ensure
system viability; it enhances creativity and innovation; offers functionality
(Beer, 1972) (McKelvey & Boisot, 2009) (Floricel, Michel, & Piperca, 2016)
(Maurer, 2017).
Appropriate, or requisite, complexity is the complexity needed for the
project to reach its objectives, or whose contribution to project success
balances the negative effects, or the cost of mitigation outweighs negative
manifestations.
Positive complexity is the complexity that adds value to a project, and whose
contribution to project success outweighs the associated negative
consequences. Since it creates opportunity, it should be exploited rather than
eliminated.
The concepts of Appropriate (requisite) and Positive Complexity are similar
to opportunities in risk management, and to antifragility in vulnerability
management (PMI, 2017) (Taleb, Antifragile: things that gain from disorder,
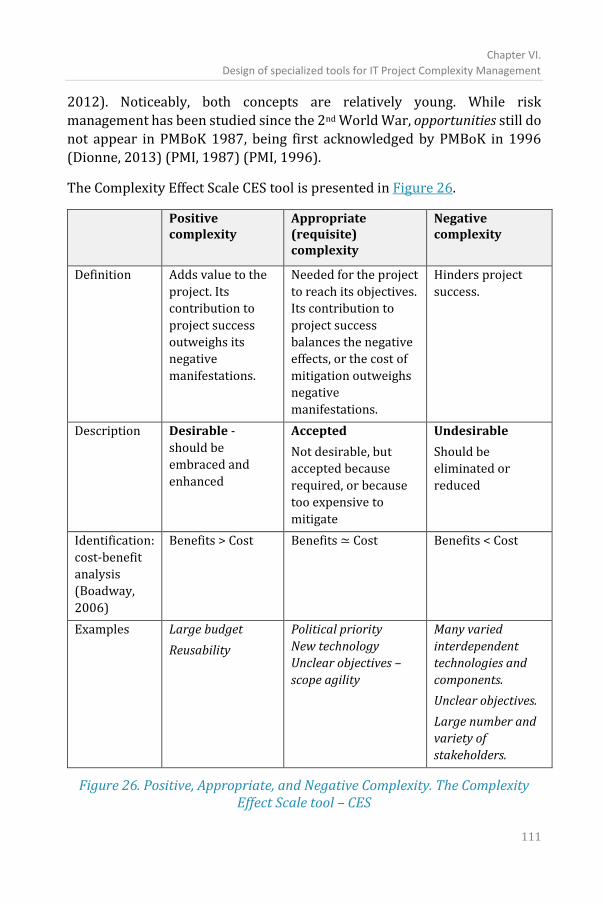
Chapter VI.
Design of specialized tools for IT Project Complexity Management
111
2012). Noticeably, both concepts are relatively young. While risk
management has been studied since the 2nd World War, opportunities still do
not appear in PMBoK 1987, being first acknowledged by PMBoK in 1996
(Dionne, 2013) (PMI, 1987) (PMI, 1996).
The Complexity Effect Scale CES tool is presented in Figure 26.
Positive complexity
Appropriate (requisite) complexity
Negative complexity
Definition Adds value to the
project. Its
contribution to
project success
outweighs its
negative
manifestations.
Needed for the project
to reach its objectives.
Its contribution to
project success
balances the negative
effects, or the cost of
mitigation outweighs
negative
manifestations.
Hinders project
success.
Description Desirable -
should be
embraced and
enhanced
Accepted
Not desirable, but
accepted because
required, or because
too expensive to
mitigate
Undesirable
Should be
eliminated or
reduced
Identification:
cost-benefit
analysis
(Boadway,
2006)
Benefits > Cost Benefits ≃ Cost Benefits < Cost
Examples Large budget
Reusability
Political priority
New technology
Unclear objectives –
scope agility
Many varied
interdependent
technologies and
components.
Unclear objectives.
Large number and
variety of
stakeholders.
Figure 26. Positive, Appropriate, and Negative Complexity. The Complexity Effect Scale tool – CES
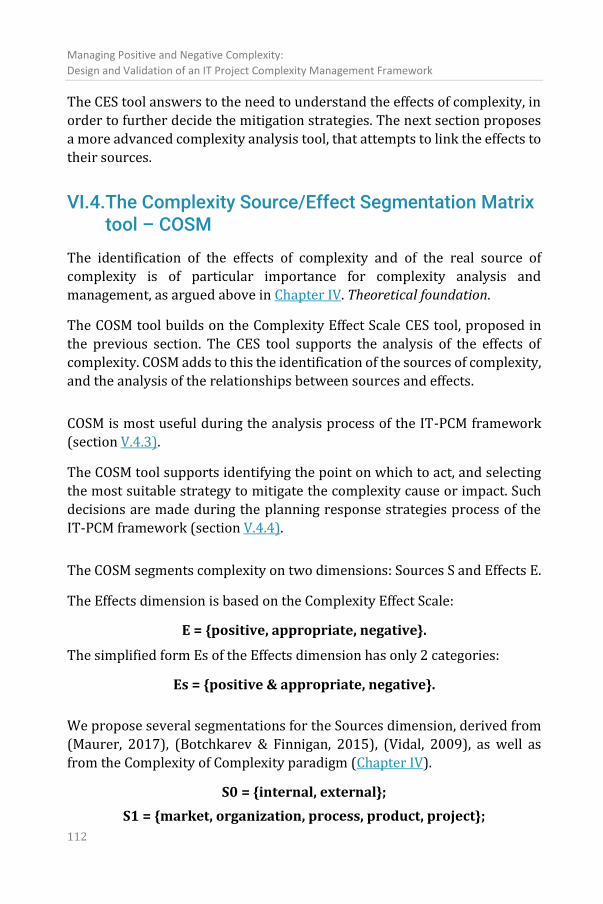
Managing Positive and Negative Complexity:
Design and Validation of an IT Project Complexity Management Framework
112
The CES tool answers to the need to understand the effects of complexity, in
order to further decide the mitigation strategies. The next section proposes
a more advanced complexity analysis tool, that attempts to link the effects to
their sources.
VI.4.The Complexity Source/Effect Segmentation Matrix tool – COSM
The identification of the effects of complexity and of the real source of
complexity is of particular importance for complexity analysis and
management, as argued above in Chapter IV. Theoretical foundation.
The COSM tool builds on the Complexity Effect Scale CES tool, proposed in
the previous section. The CES tool supports the analysis of the effects of
complexity. COSM adds to this the identification of the sources of complexity,
and the analysis of the relationships between sources and effects.
COSM is most useful during the analysis process of the IT-PCM framework
(section V.4.3).
The COSM tool supports identifying the point on which to act, and selecting
the most suitable strategy to mitigate the complexity cause or impact. Such
decisions are made during the planning response strategies process of the
IT-PCM framework (section V.4.4).
The COSM segments complexity on two dimensions: Sources S and Effects E.
The Effects dimension is based on the Complexity Effect Scale:
E = {positive, appropriate, negative}.
The simplified form Es of the Effects dimension has only 2 categories:
Es = {positive & appropriate, negative}.
We propose several segmentations for the Sources dimension, derived from
(Maurer, 2017), (Botchkarev & Finnigan, 2015), (Vidal, 2009), as well as
from the Complexity of Complexity paradigm (Chapter IV).
S0 = {internal, external};
S1 = {market, organization, process, product, project};
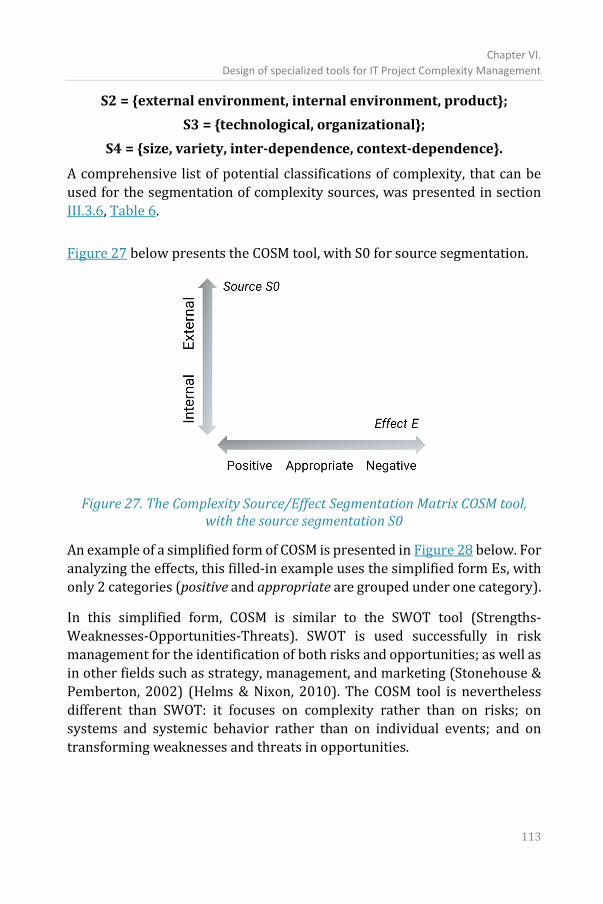
Chapter VI.
Design of specialized tools for IT Project Complexity Management
113
S2 = {external environment, internal environment, product};
S3 = {technological, organizational};
S4 = {size, variety, inter-dependence, context-dependence}.
A comprehensive list of potential classifications of complexity, that can be
used for the segmentation of complexity sources, was presented in section
III.3.6, Table 6.
Figure 27 below presents the COSM tool, with S0 for source segmentation.
Figure 27. The Complexity Source/Effect Segmentation Matrix COSM tool, with the source segmentation S0
An example of a simplified form of COSM is presented in Figure 28 below. For
analyzing the effects, this filled-in example uses the simplified form Es, with
only 2 categories (positive and appropriate are grouped under one category).
In this simplified form, COSM is similar to the SWOT tool (Strengths-
Weaknesses-Opportunities-Threats). SWOT is used successfully in risk
management for the identification of both risks and opportunities; as well as
in other fields such as strategy, management, and marketing (Stonehouse &
Pemberton, 2002) (Helms & Nixon, 2010). The COSM tool is nevertheless
different than SWOT: it focuses on complexity rather than on risks; on
systems and systemic behavior rather than on individual events; and on
transforming weaknesses and threats in opportunities.
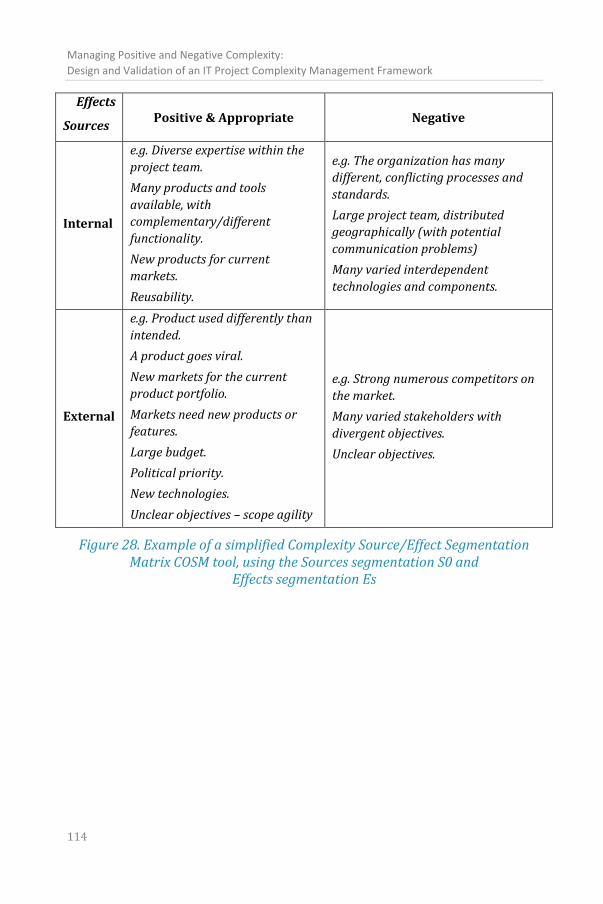
Managing Positive and Negative Complexity:
Design and Validation of an IT Project Complexity Management Framework
114
Effects
Sources Positive & Appropriate Negative
Internal
e.g. Diverse expertise within the
project team.
Many products and tools
available, with
complementary/different
functionality.
New products for current
markets.
Reusability.
e.g. The organization has many
different, conflicting processes and
standards.
Large project team, distributed
geographically (with potential
communication problems)
Many varied interdependent
technologies and components.
External
e.g. Product used differently than
intended.
A product goes viral.
New markets for the current
product portfolio.
Markets need new products or
features.
Large budget.
Political priority.
New technologies.
Unclear objectives – scope agility
e.g. Strong numerous competitors on
the market.
Many varied stakeholders with
divergent objectives.
Unclear objectives.
Figure 28. Example of a simplified Complexity Source/Effect Segmentation Matrix COSM tool, using the Sources segmentation S0 and
Effects segmentation Es
Chapter VI.
Design of specialized tools for IT Project Complexity Management
115
VI.5.Mitigation Strategies Matrix – MSM
The Mitigation Strategy Matrix (MSM) is a tool for planning complexity
response strategies. It is similar to risk or to vulnerability management.
Using the Complexity Effect Scale defined above, and drawing from risk,
vulnerability, and engineering management, we identified five strategies for
planning responses to IT project complexity:
• Positive Complexity:
o Create, enhance.
o Use, exploit.
• Positive, Appropriate, or Negative Complexity:
o Accept, ignore.
• Negative Complexity:
o Simplify, reduce.
o Avoid, eliminate.
While analyzing potential response strategies for Positive Complexity, a
strong similarity was observed between Positive Complexity and the
opportunities defined in risk management. Modern risk management
recognizes the importance of opportunities, and proposes specific response
strategies for optimizing their effects (PMI, 2017). Only made after the design
of the Complexity Effect Scale, this observation supported the internal
validity of the design.
VI.5.1. Background, and similarities with other response plan strategies
Several methodologies were analyzed as a possible foundation for
developing the MSM tool.
Risk management theory proposes response strategies for both threats and
opportunities:
- Strategies for threats: avoid, transfer, reduce, accept.
- Strategies for opportunities: exploit, share, enhance, accept.
Systems engineering proposes three main strategy groups for handling
complexity: reduction, management, and avoidance – Figure 29.
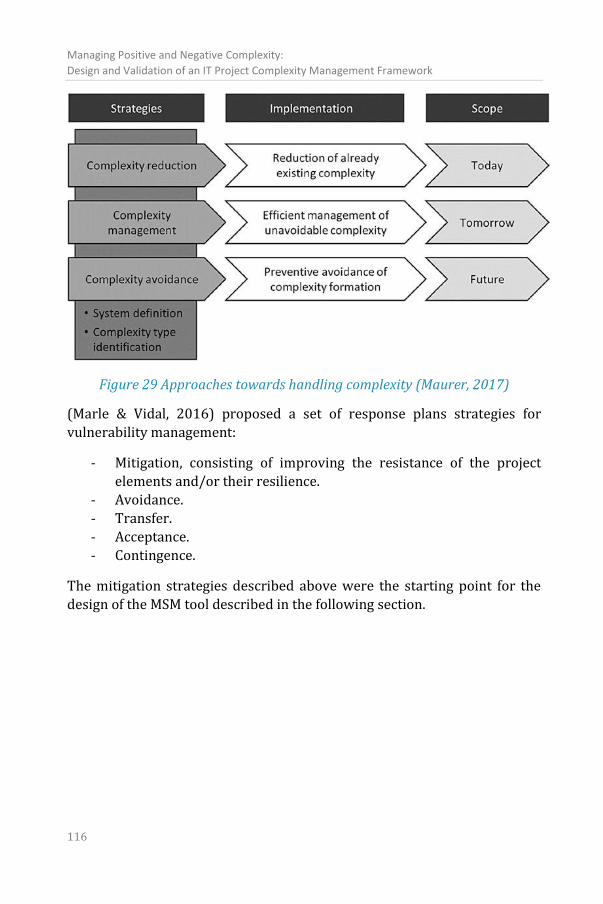
Managing Positive and Negative Complexity:
Design and Validation of an IT Project Complexity Management Framework
116
Figure 29 Approaches towards handling complexity (Maurer, 2017)
(Marle & Vidal, 2016) proposed a set of response plans strategies for
vulnerability management:
- Mitigation, consisting of improving the resistance of the project
elements and/or their resilience.
- Avoidance.
- Transfer.
- Acceptance.
- Contingence.
The mitigation strategies described above were the starting point for the
design of the MSM tool described in the following section.
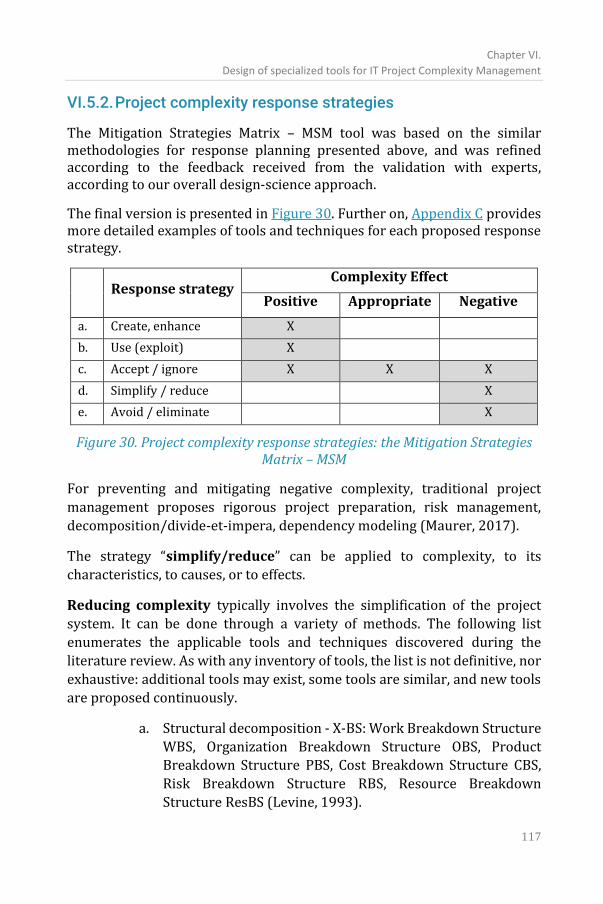
Chapter VI.
Design of specialized tools for IT Project Complexity Management
117
VI.5.2. Project complexity response strategies
The Mitigation Strategies Matrix – MSM tool was based on the similar methodologies for response planning presented above, and was refined according to the feedback received from the validation with experts, according to our overall design-science approach.
The final version is presented in Figure 30. Further on, Appendix C provides more detailed examples of tools and techniques for each proposed response strategy.
Response strategy
Complexity Effect
Positive Appropriate Negative
a. Create, enhance X
b. Use (exploit) X
c. Accept / ignore X X X
d. Simplify / reduce X
e. Avoid / eliminate X
Figure 30. Project complexity response strategies: the Mitigation Strategies Matrix – MSM
For preventing and mitigating negative complexity, traditional project
management proposes rigorous project preparation, risk management,
decomposition/divide-et-impera, dependency modeling (Maurer, 2017).
The strategy “simplify/reduce” can be applied to complexity, to its
characteristics, to causes, or to effects.
Reducing complexity typically involves the simplification of the project
system. It can be done through a variety of methods. The following list
enumerates the applicable tools and techniques discovered during the
literature review. As with any inventory of tools, the list is not definitive, nor
exhaustive: additional tools may exist, some tools are similar, and new tools
are proposed continuously.
a. Structural decomposition - X-BS: Work Breakdown Structure
WBS, Organization Breakdown Structure OBS, Product Breakdown Structure PBS, Cost Breakdown Structure CBS,
Risk Breakdown Structure RBS, Resource Breakdown
Structure ResBS (Levine, 1993).
Managing Positive and Negative Complexity:
Design and Validation of an IT Project Complexity Management Framework
118
b. Modular or OO design, that encourages modularization and
reuse.
c. Using COTS - Commercial off-the-shelf components in system
design.
d. Transferring parts of the project to third parties, e.g.
subcontractors with full delivery responsibility.
e. Standardization (Maurer, 2017).
f. Deploying rapid or simple software development
methodologies such as prototyping, or RAD (Rapid
Application Development).
g. Split an organization into separate business units.
h. Simplify communication and/or reporting channels, e.g. by
creating single points of contact (SPOCs) or eliminating
stakeholders from the communication plans.
Complicated projects can theoretically be decomposed in their components
(i.e., projects characterized only by structural complexity, or
complicatedness, as described in section III.3.3: Simple, complicated, complex,
and really complex projects).
(Really) complex projects are difficult, sometimes impossible to decompose
into smaller parts, due to the numerous varied interdependencies between
their components, and unclear relationships between causes and effects.
Reducing the effects of complexity limits the negative effects. It is suitable
especially when the project cannot be simplified. The following list, not
definitive nor exhaustive, enumerates the applicable tools and techniques
discovered during the literature review:
a. Risk management.
b. Vulnerability management (Vidal, Marle, & Bocquet, 2011)
(Marle & Vidal, 2016).
c. Critical Chain Management CCM or other scheduling methods
appropriate for complex IT projects.
d. Agile development methodologies, agile and lean management
(Sohi, Hertogh, Bosch-Rekveldt, & Blom, 2016).
e. Model-driven design and development (in software engineering).
f. PERT (in project management).
g. Adding complexity or overhead to a project sub-system, thus
supporting the management of unavoidable complexity in
another sub-system. The typical example is the increase of the
Chapter VI.
Design of specialized tools for IT Project Complexity Management
119
complexity of an organization and its processes, in order to
address a more complex market with a more complex product.
We need product complexity to offer functionality; we need
project complexity and complex organizations to create and
support complex products; we need complex products and
complex processes to manage complex organizations. While this
is an increase in complexity, we can also list it as a method to
manage complexity.
h. Planning strategies to deal with uncertainty and project
complexity: separate organization, integrate organization,
existing knowledge exploitation, new knowledge production
(Floricel, Michel, & Piperca, 2016).
The “transfer” strategy is listed in risk management as a distinct mitigation
strategy. While parts of complexity can be indeed transferred to third parties,
this results in a reduction in the overall complexity, and sometimes in
increasing organizational complexity, by adding additional stakeholders.
Accordingly, “transfer” is listed in the proposed MSM tool as a method to
reduce complexity, and not as a distinct mitigation strategy.
Similarly, “sharing with third parties” is a recommended strategy for dealing
with opportunities in risk management. In managing complexity, it is similar
to “transfer”, and it also results in the reduction of the complexity of the
system. Examples of transferring or sharing complexity are: including COTS
components in system design; externalizing certain components or activities,
in full or in part; licensing components to and from third parties;
externalizing marketing or exploitation rights – which also results in new
partnerships.
Avoiding complexity eliminates its cause. It should be performed when the
complexity aspect has significant disadvantages while offering little benefit.
Examples of tools and techniques for avoiding complexity are:
a. Scope management:
i. Cut functionality from a product, thus eliminating
project and product components.
ii. Discontinuing products, product lines, product
versions, or variants, thus simplifying and reducing
the overall product portfolio.
Managing Positive and Negative Complexity:
Design and Validation of an IT Project Complexity Management Framework
120
b. Using Commercial off-the-shelf components (COTS) in system
design – i.e. taking a buy-vs.-build decision.
c. Risk management techniques.
d. Close the operations completely on specific geographic markets.
e. Close-down organizational or business units.
f. Split an organization into separate independent entities, without
links or other interdependencies.
g. Eliminate internal processes.
Accepting complexity maintains both probability and impact. No specific
action is taken. It is mostly suitable for Appropriate Complexity, i.e. when its
benefits are relatively equal to its cost, or the cost of mitigating complexity
would be higher than the benefit.
In this context, cost refers to the negative impact on one or several of the
project’s components: budget, scope, time, or quality.
Enhancing, creating, using complexity refers to increasing its probability
and/or impact. These can be applied when the benefits are significantly
higher than the cost, i.e. for Positive Complexity. Examples are:
• Expand the product portfolio to address new customers and new
markets (Maurer, 2017). As yet another illustration that there is no
single silver bullet in (IT project) management and marketing, both
increasing the project and product portfolio, as well as maintaining a
focus on a niche portfolio, can both be successful strategies. While
some businesses benefit from diversification and a large portfolio of
products (such as Samsung, Nokia, Amazon, Nestle, Unilever, General
Electric), others do not dilute their product brand and expertise, and
as such do not diversify (e.g. Apple, Michelin).
• Add product functionality;
• Encourage creativity in organizations by mixing heterogeneous
cross-disciplinary teams;
• Increase the know-how and collaboration, by adding new
communication lines in the organization.
• Merge different companies or business units into a larger
organization, to obtain economies of scale and create synergies.
• Accept, acknowledge, and formalize new products,
functions/features, processes, organizational units, or markets, even
if they emerged independently, unplanned. Famous examples of such
emerging products are Viagra, SMS, or Coca-Cola.
Chapter VI.
Design of specialized tools for IT Project Complexity Management
121
• Create partnerships, in order to better exploit existing assets, such as
know-how, expertise, products, processes, markets.
The MSM tool proposes different response strategies, based on the specific
effects of complexity on the project system, and targeted at specific sources
of complexity. The tool aims to propose a structured approach for planning
responses in complexity management.
The implementation of MSM starts from the identified list of project
complexity aspects, and the results of the analysis of complexity, obtained
from the application of tools such as CES and COSM. By analyzing their
effects, specific actions can be planned, then executed, and monitored.
For managing the complexity identification, analysis, response planning, and
monitoring of results, a specific register is further proposed in the next
chapter: the Complexity Register.
VI.6.CoRe: the Complexity Register form
The Complexity Register tool aims to support the collection, organization,
and analysis of the data resulting from the application of tools such as CES,
COSM, and MSM. It is a centralization of the results and data from the
application of these tools, for a specific project.
The tool was designed during the sub-project P5 evaluation – Chapter VIII,
as a practical method for collecting and organizing project case data.
The CoRe tool is a register that lists all the complexity items identified during
the analysis process of the IT-PCM framework.
Each entry has a name and a description. For each entry, there are fields for
recording the type of effect, according to the CES tool (section VI.3). The type
of source can be classified using one, or several source segmentation
methods simultaneously. The possible segmentations are proposed by the
COSM tool (section VI.4). CoRe also documents the proposed response
strategy, according to MSM.
The entries (columns) of the Complexity Register are presented and
described in Figure 31 below.
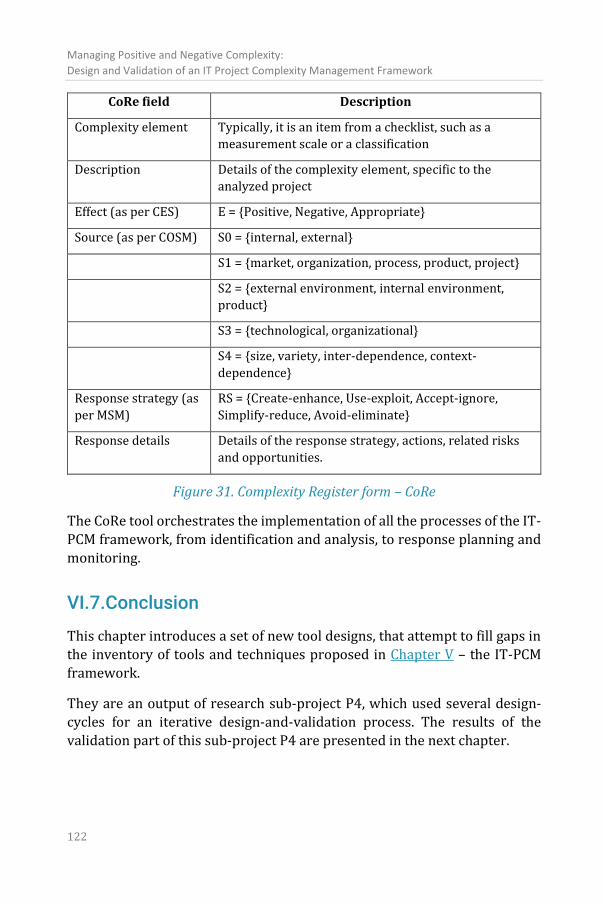
Managing Positive and Negative Complexity:
Design and Validation of an IT Project Complexity Management Framework
122
CoRe field Description
Complexity element Typically, it is an item from a checklist, such as a
measurement scale or a classification
Description Details of the complexity element, specific to the
analyzed project
Effect (as per CES) E = {Positive, Negative, Appropriate}
Source (as per COSM) S0 = {internal, external}
S1 = {market, organization, process, product, project}
S2 = {external environment, internal environment,
product}
S3 = {technological, organizational}
S4 = {size, variety, inter-dependence, context-
dependence}
Response strategy (as
per MSM)
RS = {Create-enhance, Use-exploit, Accept-ignore,
Simplify-reduce, Avoid-eliminate}
Response details Details of the response strategy, actions, related risks
and opportunities.
Figure 31. Complexity Register form – CoRe
The CoRe tool orchestrates the implementation of all the processes of the IT-
PCM framework, from identification and analysis, to response planning and
monitoring.
VI.7.Conclusion
This chapter introduces a set of new tool designs, that attempt to fill gaps in
the inventory of tools and techniques proposed in Chapter V – the IT-PCM
framework.
They are an output of research sub-project P4, which used several design-
cycles for an iterative design-and-validation process. The results of the
validation part of this sub-project P4 are presented in the next chapter.
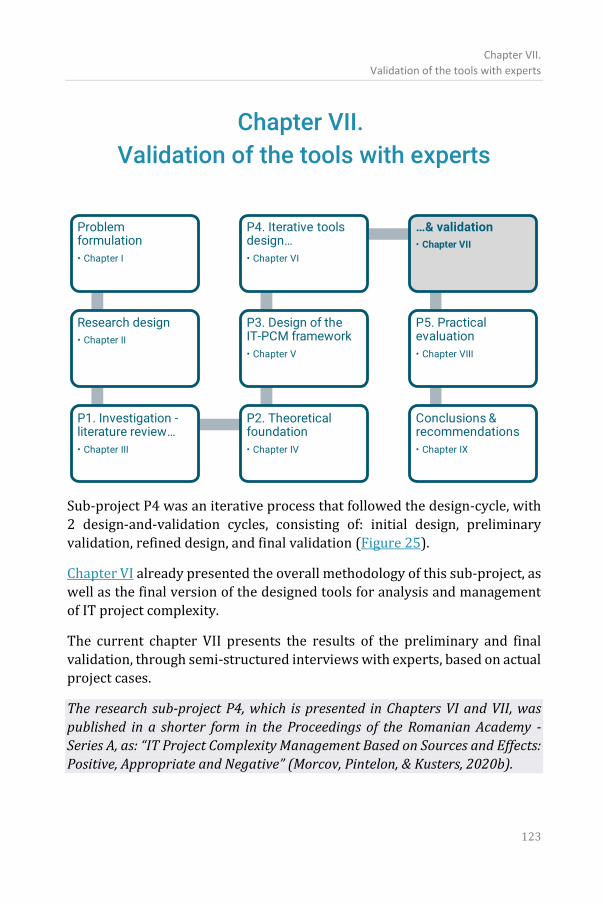
Chapter VII.
Validation of the tools with experts
123
Chapter VII.
Validation of the tools with experts
Sub-project P4 was an iterative process that followed the design-cycle, with
2 design-and-validation cycles, consisting of: initial design, preliminary
validation, refined design, and final validation (Figure 25).
Chapter VI already presented the overall methodology of this sub-project, as
well as the final version of the designed tools for analysis and management
of IT project complexity.
The current chapter VII presents the results of the preliminary and final
validation, through semi-structured interviews with experts, based on actual
project cases.
The research sub-project P4, which is presented in Chapters VI and VII, was
published in a shorter form in the Proceedings of the Romanian Academy -
Series A, as: “IT Project Complexity Management Based on Sources and Effects:
Positive, Appropriate and Negative” (Morcov, Pintelon, & Kusters, 2020b).
Managing Positive and Negative Complexity:
Design and Validation of an IT Project Complexity Management Framework
124
The following sections present:
• the specific methods used for the validation – section VII.1.
• a summary of the results – section VII.2.
• the detailed results – section VII.3.
• a discussion of the results of the sub-project P4 – section VII.4.
• specific limitations of the research sub-project P4 – section VII.5.
VII.1. Methods
The overall methodology of the research sub-project P4 is presented in the
previous chapter, section VI.1.
The preliminary and final validation of the tools, presented in this chapter,
were performed with semi-structured interviews with seven experts selected based on their experience and expertise in the domain, and
supported by an analysis of actual project cases.
Expert opinion is a validation technique suitable for our exploratory
research. It requires that the experts should have a thorough understanding
of the topic. Accordingly, the selection criteria for the experts was the
practical experience of more than 20 years in software project management
and strategic operational IT management, in personally managing or
supervising complex IT projects, defined as: the size of the managed team –
more than 100 people; number and variety of project stakeholders; execution
and delivery in international/multicultural environments; significant impact
on the project environment.
The project cases were chosen by the experts themselves. They were projects
that they managed or supervised personally. These projects provided a
practical reference and anchoring for the interviews. The criteria for
choosing the projects were size and complexity.
The interviews were structured in a standardized questionnaire, with open
questions to drive exploratory qualitative research, but also with fixed-
Chapter VII.
Validation of the tools with experts
125
choice Likert and yes/no questions to increase reliability. The questionnaire
had the following sections (the full questionnaire is in Appendix E):
• Introduction: to establish a common language and understanding. It
included a presentation with printed slides of the concepts,
theoretical foundations, measurement tools, proposed tools.
• Project case description. Due to the limited time available, the case
documentation was done before when possible, and finalized after
the live interview.
• Analysis of how complexity was managed in practice in the actual
project case.
• Hypothetical “what-if” section regarding the potential value of the
proposed tools, as if they would have been deployed in the actual
project.
• Validation of the final versions of the tool designs.
Detailed extensive notes were taken during each interview. The answers and
notes were shared with the interviewees for approval. Due to confidentiality
reasons, the discussions were not audio recorded. Each interviewee asked
for a different degree of confidentiality: some project information and expert
names cannot be disclosed, while for some the information is fully available.
Due to their professional background and positions, participants have a
personal interest in the topic, but limited time. Each face-to-face interview
lasted between 40 and 120 minutes, with an overall average of 82 minutes.
The live interviews were supplemented by a preliminary desk investigation
before the interview, when possible, and by a written offline follow-up
questionnaire.
The cases analyzed during the interviews were actual complex IT projects,
that the interviewees managed personally or supervised directly, which
included varied activities: software development, integration and
implementation of large heterogeneous solutions; large-scale,
geographically distributed; with varied external and internal dependencies,
many varied deliverables (up to tens of thousands different types of
deliverables), with huge numbers of varied stakeholders (thousands) and
users (hundreds of thousands or millions). The duration of each project case
was 8-10 years. Most projects have been in production for years, being
Managing Positive and Negative Complexity:
Design and Validation of an IT Project Complexity Management Framework
126
currently in maintenance and upgrade; one project is being currently rolled
out after the completion of a large-scale pilot. The project cases included:
• Three very large trans-European projects, critical to the functioning
of the European Union, with hundreds of millions of beneficiaries in
all EU member states. Budget: hundreds mil. Eur each.
• A large trans-European project, with tens of thousands of users in all
European countries and varied activities and stakeholders. Budget:
10-20 mil. Eur.
• Two projects implemented at the national level, in 2 European
countries, in 700 / 15,000 sites respectively, with hundreds of
thousands/millions of users, respectively. Budgets: 2.4 mil. and 300
mil. Eur, respectively.
The next sections present the summary and detailed results of the
preliminary and final validation.
VII.2. Summary of the results
The summary of the results of the preliminary and final validation is
presented below:
R1. The importance of the topic of IT project complexity was
confirmed. “IT has an inherent complexity; any software is complex”,
was one of the comments received. The concept of complexity is not
standardized; the terminology is overloaded.
R2. All experts recognize the need to measure and classify project
complexity.
R3. Experts partially agree that the complexity of complexities
paradigm would be useful in practice. They recommend offering
practitioners several possible segmentations for the COSM tool.
R4. Practitioners already use tools to manage IT project
complexity, such as project management frameworks or formalizing
communication plans. Complexity relates to risk management:
“Complexity is always a risk”.
R5. Practitioners confirm the usefulness of Positive Complexity, and associate it with opportunities. “Complexity is always a compromise”. Appropriate Complexity brings clarity to the theoretical model, but
Chapter VII.
Validation of the tools with experts
127
in practice it is difficult to distinguish from Positive. “Appropriate Complexity requires a level of precision in measurement that makes me feel uncomfortable”, was an observation.
VII.3. Detailed results: answers to questionnaires
The summarized answers to the closed questions are presented in Appendix
E. All questions were designed to mostly open qualitative exploratory
discussions. The main qualitative findings of the interviews are presented
below.
R1. The importance of the topic of IT project complexity was confirmed
by all experts. The concept is recognized and used in the industry, but not
standardized; the terminology is overloaded with different meanings.
Experts consider complexity mostly structural. Dynamic complexity is not
specifically managed, but dynamic complexity aspects were recognized
during discussions.
R2. All experts recognize the need to measure and classify project
complexity. Some already deployed tools to red-flag “complex” or “high-
risk” projects. Experts doubt that a universal, effective, repeatable and
comparable measurement tool can be developed, because each evaluator
would have a subjective scale according to his/her personal experience, and
also each aspect of complexity has different importance depending on the
type of organization, type of project or the particular technology. In this
respect, complexity is similar to software estimation and measurement, such
as Function Point Analysis (FPA) or COCOMO (the Constructive Cost Model
for cost estimation) (Albrecht, 1979) (Longstreet, 2012) (Boehm, 1981)
(Pressman, 2001) (Jørgensen, 2007). A suggestion was received to develop
standard tables of complexity adjustment factors, similar to the tables used
in Function Point Analysis.
The effort needed by an expert to evaluate the complexity of a project will
vary significantly depending on the project and the experience of the
evaluator. Small projects should not enter a special complexity measurement
or management process, due to cost. Complexity should be measured and
identified in parallel with risk, at the same gates. It was noted that even risk
management is far from being generalized in the IT industry, which might
Managing Positive and Negative Complexity:
Design and Validation of an IT Project Complexity Management Framework
128
indicate that complexity measurement and management should be very
simple or will face even bigger adoption problems than risk management.
The design followed therefore the design principles of minimalism and
simplicity (Occam’s Razor).
R3. The experts gave partial and divergent opinions regarding the usefulness
in practice of the complexity of complexities paradigm. The systemic
perspective is useful. The segmentation of complexity offers a structured
approach to help identify the real source of complexity. A set of sub-systems
derived from systems theory, S1={market, organization, process, product,
project}, was proposed but not confirmed by experts, which expressed
reserves regarding the choice and advantages of a particular set or another.
As a result of this negative feedback received during the validation phase, the
CES tool was redesigned. We introduced additional possible segmentations:
S2; a general form Sx; and a simplified more practical segmentation S0, as
described above in section VI.4.
R4. Practitioners observed that they already use tools to manage IT project
complexity, such as: project management methodologies; risk or
communication management; problem-solving techniques. The need to
deploy specific tools for managing complexity in IT projects is strongly
supported by practitioners. In order to facilitate their adaptation,
customization, and adoption, these tools should be simple and flexible.
R5. Practitioners fully agree that the concept of “Positive Complexity” is
useful, that Positive Complexity should be specifically identified and
managed. The concept was associated with the opportunities proposed by
risk management. On the other hand, an expert underlined that “Complexity
is never an objective; it is a compromise that appears because we want to add
value”.
Based on the feedback, we added “Appropriate Complexity” as a distinct
category to bring clarity to the theoretical model. In practice, it proved
difficult to differentiate it from Positive Complexity. Accordingly, it was
grouped with Positive Complexity, in the simplified form of the COSM tool.
Interestingly (and coincidentally), similar difficulties were met by the
concept of requisite complexity (or variety), which generally uses the term
“match” in its definition, but accepts that matching assumes exceeding
(McKelvey & Boisot, 2009).
Chapter VII.
Validation of the tools with experts
129
Experts underline the importance of cost-benefit analysis when classifying
complexity and deciding mitigation strategies. In this regard, an expert
observed that the cost of complexity is distinct from the cost to eliminate
complexity. Also, another expert underlined its compound effect: “Complexity
generates complexity. The complexity that we accept at the beginning of the
project is compounded in time; therefore, the benefits should be weighed
against future costs”.
VII.4. Discussion
Several particular aspects emerged from the research sub-project P4, and are
discussed in the following sections:
• relation between the sources and effects of complexity.
• the cost of managing and of not-managing complexity;
• the practicality of complexity management tools.
• the benefits of program management for managing complex projects.
VII.4.1. Relation between sources and effects of complexity
The sources of complexity are linked to their effects through two types of
processes:
a. Processes, tools, and methods under the control of the IT project
manager;
b. Complexity-related phenomena, typically difficult to understand,
predict, or control.
These two types of processes overlap: some dynamic complexity-related
phenomena, external environment variables, or impact can be controlled;
and also actions undertaken by the project manager (i.e. from the project
sub-system), are likely to propagate to other sub-systems of the Complexity
of Complexities model.
The relation between sources and effects is particularly important for
choosing the appropriate response plans, including where to act and what
mitigation strategy to apply.
Managing Positive and Negative Complexity:
Design and Validation of an IT Project Complexity Management Framework
130
VII.4.2. The cost of managing and of not-managing complexity
The discussions with participants revealed that the tools and strategies to
deal with complexity always relate to cost, i.e. the impact on budget,
schedule, scope, and quality.
The effects propagate exponentially with a high compound rate; therefore,
decisions should be based on the analysis of “cost-benefit at completion”.
The cost taken into consideration in such a cost-benefit analysis includes:
a. The cost of not managing complexity. This can be calculated as
the monetary value of the risks and opportunities caused by
complexity if not managed. An example is the cost for solving
technical errors in an IT product, which had been caused by an
exceptional variety of technologies, of stakeholders, or by
unknown or conflicting project objectives.
b. The cost of mitigating complexity. This is overhead. It is the
cost needed for the additional processes and tools introduced in
the project to manage its complexity: either to reduce the
probability and impact of risks; or to increase the probability and
impact of opportunities. Examples are the cost of reducing the
diversity of technology in an IT system; the cost of introducing
and maintaining dependency matrices between technologies,
system components, project objectives, and/or stakeholder
requirements; the cost of creating and maintaining detailed
stakeholder registers and communication plans.
The effects and associated costs of complexity propagate exponentially, and
they have a high compound rate. Therefore, the most relevant cost is the cost
forecast for the whole duration of the project, i.e. “cost-benefit at
completion”. The practical difficulty in calculating such a variable is that, for complex systems, impact forecasts do not correlate well with results (Taleb,
Goldstein, & Spitznagel, The Six Mistakes Executives Make in Risk
Management, 2009).
Implementing new tools increases the project complexity, overhead, and
cost; therefore, specialized complexity management tools are effective and
applicable only for very large projects. Misuse or overuse of project
management tools can also be a source of project failure (Browning, 2019).
Chapter VII.
Validation of the tools with experts
131
In this regard, it is relevant that, while early theoretical models of complexity
specifically excluded size as a factor (Baccarini, 1996), size has since been
linked, and recognized to be a strong predictor of complex projects (Vidal,
2009) (Kardes, Ozturk, Cavusgil, & Cavusgil, 2013) (Qureshi & Kang, 2015).
VII.4.3. Monitoring dynamic complexity
Complexity-related processes refer to structural (complicatedness), but also
to subjective and dynamic aspects. Research and experts acknowledge that
complexity is more than structural complicatedness; that complexity
includes subjective and dynamic aspects.
At the same time, research tends to focus on objective, structural complexity,
because structural complexity is less abstract, thus more discussable,
measurable, thus manageable. Dynamic complexity aspects, on the other
hand, are usually “unknown unknowns”; difficult to identify or plan; mostly
related to changes in stakeholders and environment. They behave like Black
Swans and follow “Butterfly Effect” patterns (Lorenz, 1963) (Taleb,
Goldstein, & Spitznagel, The Six Mistakes Executives Make in Risk
Management, 2009).
Dynamic complexity aspects still must be monitored, recognized and
identified as they occur, and projects should be prepared to deal with them.
The main tool for dealing with dynamic complexity is thus monitoring for
change, especially in stakeholders, objectives, and the environment. This is
part of the monitoring process.
VII.4.4. Program management for complex projects
Implementing complex projects as a program was shown useful both by
theory and practice. It brings significant advantages, such as: strategic
importance and focus, access to power sponsors, agility (Ribbers & Schoo,
2002) (Remington & Pollack, 2007). Individual projects, which are part of
larger programs, are smaller and shorter, hence more agile, with clearer results, easier to measure and control, by offering more transparency.
Organizing projects in larger programs supports the coordination across
different projects (Moe, Dingsøyr, & Rolland, 2018).
In fact, all project cases analyzed during the validation were implemented as
a program. This approach also aligns with the principle of deploying agility
in response to complexity.
Managing Positive and Negative Complexity:
Design and Validation of an IT Project Complexity Management Framework
132
VII.5. Limitations, validity, and reliability of the design-and-validation project
While a series of measures were taken for ensuring construct, internal and
external validity of the design-and-validation sub-project P4, presented in
Chapters VI and VII, as well as reliability, several limitations may impact the
results, related to the design and validation phases.
In order to increase specialization hence usability, the domain of
applicability was restricted to IT. The number of cases was limited due to the
qualitative research method; thus, the results may not be generalized easily
beyond the stated conditions. All project cases were implemented in Europe,
but across many different countries. A sufficient number of interviews were
conducted, to ensure sufficient data points, the required level of variation of
the results and responses, to allow for analytical generalization and ensure
external validity, to minimize subjectivity, and to validate convergence.
The approach for the validation was cross-sectional – the project cases were
analyzed at a specific moment, i.e. at completion (with one exception near
completion). The cases were analyzed from a single perspective, so the level
of objectivity of the interviewee about the projects cannot be established
(with one exception analyzed from several perspectives).
Due to their interactive nature, face-to-face interviews limit replication,
hence reliability, and are susceptible to self-confirmation bias. Of course, not
all invited experts participated in the research. The participants had limited
time available - between 40-120 minutes for each live interview, for an
overall average of 82 minutes for the validation; one hour for the evaluation.
The iterative approach of the design process helped ensure internal validity
and the avoidance of “anecdotalism”. Each iteration was documented to
ensure construct validity, using configuration management. After each
iteration, a configuration baseline was established. The intermediate
versions were documented for traceability and for ensuring construct
validity.
All projects included in the evaluation were IT/software development
projects that use similar project management and software development
methodologies and have reasonably similar cultural and geographical
backgrounds; but they cover a very wide range of technologies and business
Chapter VII.
Validation of the tools with experts
133
areas. All customers are Western European, but they are large multinational
and multicultural organizations.
Any quantitative analysis must be interpreted with caution, considering the
number of data points and the use of ordinal and interval scales. Accordingly,
the research focused on the qualitative analysis of the answers received, and
of the type of arguments used; with a strong focus on the negative feedback.
VII.6. Conclusion
Chapters VI and VII presented the results of research sub-project P4, an
iterative process of design-and-validation of complexity management tools,
consisting of 2 design-cycles. The following chapter presents a practical
evaluation of the proposed set of tools.

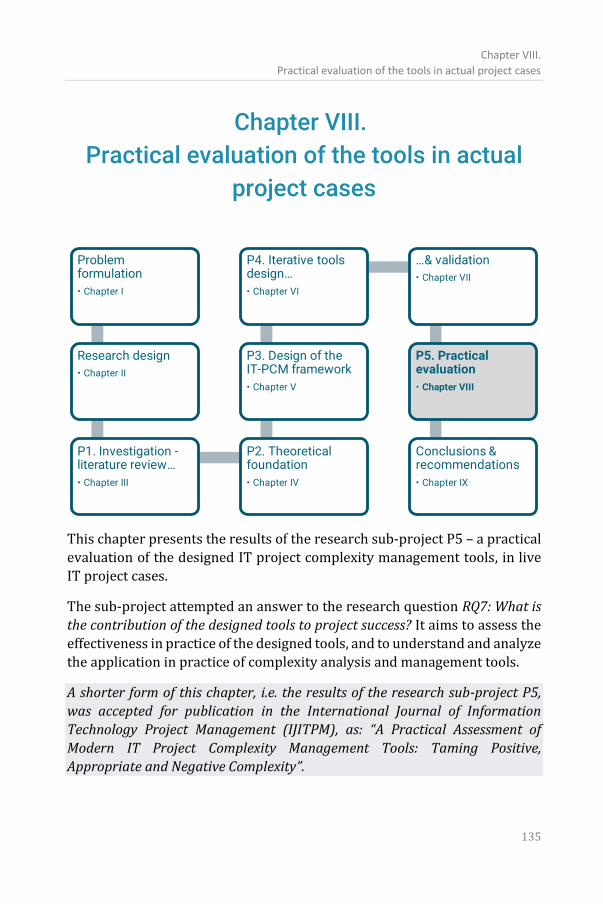
Chapter VIII.
Practical evaluation of the tools in actual project cases
135
Chapter VIII.
Practical evaluation of the tools in actual
project cases
This chapter presents the results of the research sub-project P5 – a practical
evaluation of the designed IT project complexity management tools, in live
IT project cases.
The sub-project attempted an answer to the research question RQ7: What is
the contribution of the designed tools to project success? It aims to assess the
effectiveness in practice of the designed tools, and to understand and analyze
the application in practice of complexity analysis and management tools.
A shorter form of this chapter, i.e. the results of the research sub-project P5,
was accepted for publication in the International Journal of Information
Technology Project Management (IJITPM), as: “A Practical Assessment of
Modern IT Project Complexity Management Tools: Taming Positive,
Appropriate and Negative Complexity”.
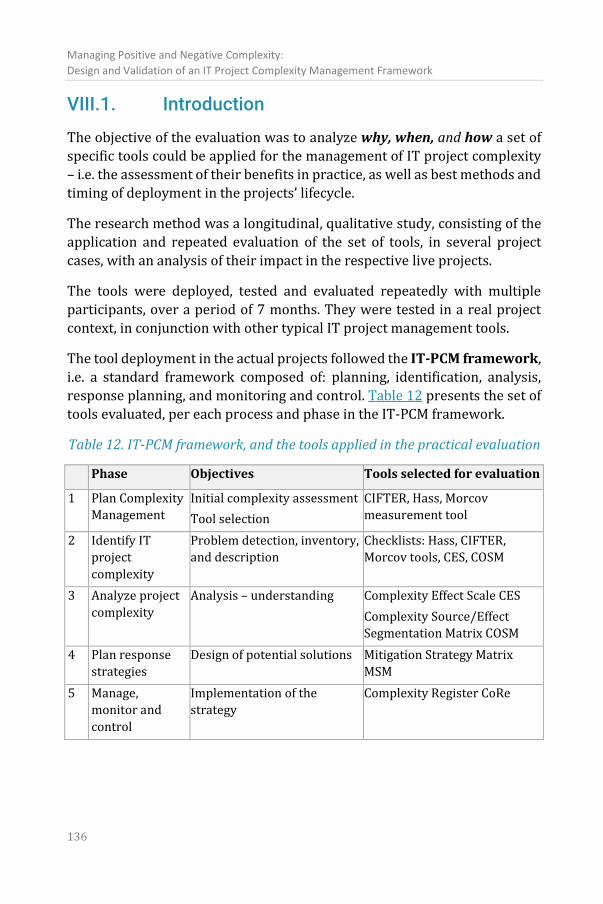
Managing Positive and Negative Complexity:
Design and Validation of an IT Project Complexity Management Framework
136
VIII.1. Introduction
The objective of the evaluation was to analyze why, when, and how a set of
specific tools could be applied for the management of IT project complexity
– i.e. the assessment of their benefits in practice, as well as best methods and
timing of deployment in the projects’ lifecycle.
The research method was a longitudinal, qualitative study, consisting of the
application and repeated evaluation of the set of tools, in several project
cases, with an analysis of their impact in the respective live projects.
The tools were deployed, tested and evaluated repeatedly with multiple
participants, over a period of 7 months. They were tested in a real project
context, in conjunction with other typical IT project management tools.
The tool deployment in the actual projects followed the IT-PCM framework,
i.e. a standard framework composed of: planning, identification, analysis,
response planning, and monitoring and control. Table 12 presents the set of
tools evaluated, per each process and phase in the IT-PCM framework.
Table 12. IT-PCM framework, and the tools applied in the practical evaluation
Phase Objectives Tools selected for evaluation
1 Plan Complexity
Management
Initial complexity assessment
Tool selection
CIFTER, Hass, Morcov
measurement tool
2 Identify IT
project
complexity
Problem detection, inventory,
and description
Checklists: Hass, CIFTER,
Morcov tools, CES, COSM
3 Analyze project
complexity
Analysis – understanding Complexity Effect Scale CES
Complexity Source/Effect
Segmentation Matrix COSM
4 Plan response
strategies
Design of potential solutions Mitigation Strategy Matrix
MSM
5 Manage,
monitor and
control
Implementation of the
strategy
Complexity Register CoRe
Chapter VIII.
Practical evaluation of the tools in actual project cases
137
VIII.2. Evaluated tools
Identifying (recognizing) IT project complexity is the first and critical step in
complexity management – i.e. red-flagging, categorizing, and measuring. The
identification of complex projects is important for the selection of the
appropriate management tools. It is particularly important for strategic and
project portfolio management (Vidal, Marle, & Bocquet, 2011).
Several complexity measurement tools have been proposed by research – as
presented in the literature review, section III.5, Table 8. From this inventory
of existing measurement tools, the 2 simplest and most practical
measurement tools were included in this evaluation, in order to assess how
useful they would be considered, and how they would be accepted by the
participants. Thus, in addition to the Morcov complexity measurement tool
developed during this research and adapted for IT (section VI.2), CIFTER and
Hass tools were also evaluated. The evaluated measurement tools are
hereafter referred to as CIFTER, Hass, and Morcov tools, respectively.
In addition to these complexity measurement tools, the evaluation also
included the new tool designs resulted from sub-project P4 (Chapter VI).
The evaluated tools are:
1. The Crawford-Ishikura Factor Table for Evaluating Roles –
CIFTER, supported by the International Project Management
Association (GAPPS, 2007). It has 7 subjective criteria, uses a Likert-
type ordinal scale from 1 to 4 (low, moderate, high, very high)
without a midpoint. It is not weighted; and has a general purpose.
2. Hass’ Project Complexity Model Formula (Hass, 2008b). It is
simple and short, with 5 complexity dimensions (11 in the extended
version). It uses an ordinal scale from 1 to 3, with a midpoint (low,
moderate, high). It is not weighted; and has a general purpose.
3. “Morcov” IT project complexity measurement tool – introduced
in section VI.2. It has a medium level of detail – 28 questions. It uses
an interval scale for qualitative questions and a ratio scale for
numerically quantifiable questions. It is specialized to IT.
4. The Complexity Effect Scale CES tool (section VI.3) provides a
structured method to analyze complexity based on its effects.
Managing Positive and Negative Complexity:
Design and Validation of an IT Project Complexity Management Framework
138
5. The Complexity Source/Effect Segmentation Matrix COSM tool
(section VI.4) supports the identification and analysis based on both
sources and effects.
6. The Mitigation Strategy Matrix MSM tool (section VI.5) supports
planning complexity response strategies, based on its specific effects.
7. The Complexity Register CoRe form (section VI.6) supports the
data collection and management process, including the application of
all the above-mentioned tools for the identification, analysis, and
management of complexity.
The evaluated complexity analysis and management tools are grounded on
the theoretical foundation established in Chapter IV, and particularly on the
principle that complexity can have not only negative, but also appropriate or
positive effects. This characteristic had a direct impact on the results of this
research, being specifically targeted in the deployment and evaluation of the
tools.
VIII.3. Methods
VIII.3.1. Approach
Due to the novelty of the topic, a qualitative exploratory approach for the
evaluation was chosen, based on the deployment of the tools in actual
projects (Levitt, et al., 2018) (Gummesson, 2000).
The main objective was the evaluation of the specific complexity
management tools presented in section VIII.2 above. Besides this goal, we
also inquired what other tools are used by practitioners for complexity
management. This survey of traditional tools provided a common ground in
the discussions with the case study participants; it offered a palpable
analogy, a basis for comparison between already well-known tools and the
newly proposed specialized IT complexity management tools.
The evaluated tools were tested in actual complex IT projects, and the deployment and their effects were monitored over a period of several
months. The research was thus more than a simple assessment of the opinion
of participants. This constitutes the main difference between this sub-project
P5 of evaluation in practice, vs. the validation sub-project P4 presented in the
previous Chapter VII: while the validation in P4 was based on experts’
Chapter VIII.
Practical evaluation of the tools in actual project cases
139
opinions and on hypothetical “what-if” questions, this evaluation P5 is based
on measuring benefits and results of their deployment in actual projects.
The data collected for evaluation is the informed opinion of the participants
to the project cases, based on the concrete, actual situation in their projects,
after the deployment of the evaluated tools in the respective projects.
Indeed, the data collected consists of perceptions of the interviewed
stakeholders, as this was the only practical method for gathering information
regarding the impact of the tools in a reasonable time frame. A measurement
of the end-results of the projects, i.e. final project success indicators, would
have required an unrealistic duration, i.e. many years of monitoring the
results of the projects. On the other hand, perceived satisfaction is a valid
method for measuring project success, alongside numeric indicators such as
meeting project scope, quality, time and budget objectives. Moreover, the
opinions of participants are critical in isolating and understanding the impact
of these individual tools in the success of a project, considering that the
projects analyzed are unique complex projects whose overall success is
impacted by a combination of a myriad of different intertwined factors
applied together.
To compensate for this potential weakness that we measured the perceived
benefits and impact, several data-points were collected for each project,
through interviews with several stakeholders, from different levels and
different organizations, including the customer side.
VIII.3.2. Methodology
The analysis of the case studies (Yin R. K., 2011) included collecting data and
testing the tools in the actual projects, by application mostly during live
interviews. Face-to-face, open interviews are suitable because of the novelty of the research problem, and the overloaded non-standardized terminology
of the domain. They support qualitative exploratory research. Open
questions allowed exploring additional feedback.
All discussions and interviews were video-recorded, for further in-depth text
analysis, and to ensure construct validity.
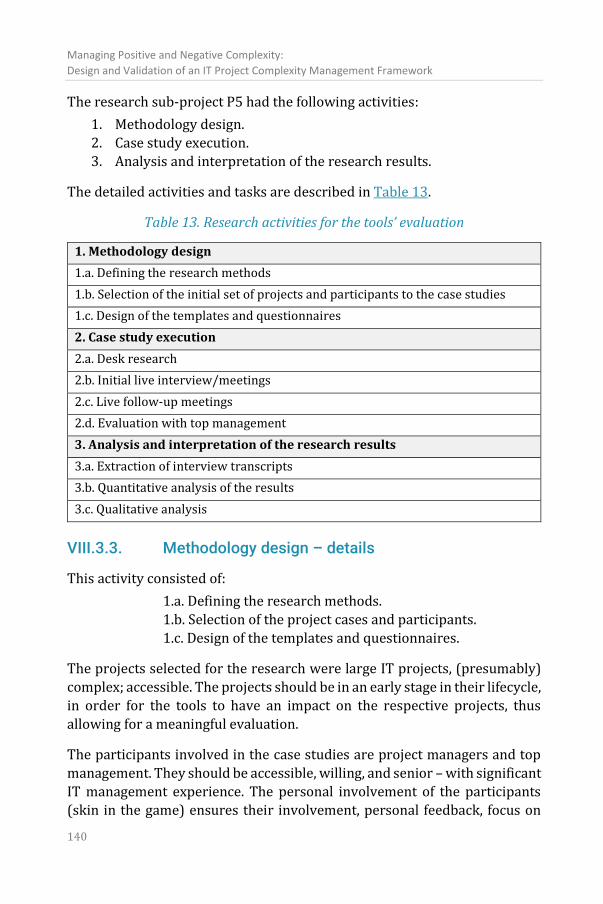
Managing Positive and Negative Complexity:
Design and Validation of an IT Project Complexity Management Framework
140
The research sub-project P5 had the following activities:
1. Methodology design.
2. Case study execution.
3. Analysis and interpretation of the research results.
The detailed activities and tasks are described in Table 13.
Table 13. Research activities for the tools’ evaluation
1. Methodology design
1.a. Defining the research methods
1.b. Selection of the initial set of projects and participants to the case studies
1.c. Design of the templates and questionnaires
2. Case study execution
2.a. Desk research
2.b. Initial live interview/meetings
2.c. Live follow-up meetings
2.d. Evaluation with top management
3. Analysis and interpretation of the research results
3.a. Extraction of interview transcripts
3.b. Quantitative analysis of the results
3.c. Qualitative analysis
VIII.3.3. Methodology design – details
This activity consisted of:
1.a. Defining the research methods.
1.b. Selection of the project cases and participants.
1.c. Design of the templates and questionnaires.
The projects selected for the research were large IT projects, (presumably)
complex; accessible. The projects should be in an early stage in their lifecycle,
in order for the tools to have an impact on the respective projects, thus
allowing for a meaningful evaluation.
The participants involved in the case studies are project managers and top
management. They should be accessible, willing, and senior – with significant
IT management experience. The personal involvement of the participants
(skin in the game) ensures their involvement, personal feedback, focus on
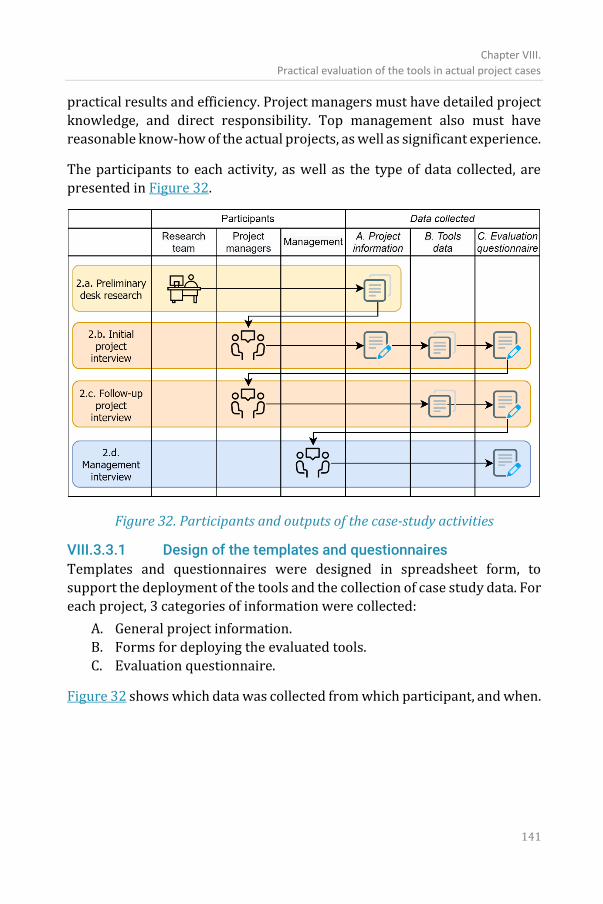
Chapter VIII.
Practical evaluation of the tools in actual project cases
141
practical results and efficiency. Project managers must have detailed project
knowledge, and direct responsibility. Top management also must have
reasonable know-how of the actual projects, as well as significant experience.
The participants to each activity, as well as the type of data collected, are
presented in Figure 32.
Figure 32. Participants and outputs of the case-study activities
VIII.3.3.1 Design of the templates and questionnaires
Templates and questionnaires were designed in spreadsheet form, to
support the deployment of the tools and the collection of case study data. For
each project, 3 categories of information were collected:
A. General project information.
B. Forms for deploying the evaluated tools.
C. Evaluation questionnaire.
Figure 32 shows which data was collected from which participant, and when.
Managing Positive and Negative Complexity:
Design and Validation of an IT Project Complexity Management Framework
142
The detailed sections of the master questionnaire were:
• General project information.
• Initial subjective assessment of each project’s complexity – once per
each participant and project, answered independently by each,
together with an assessment of management tools, which includes:
o A question if each of a list of 5 classic tools should be used,
with an individual Yes/No answer.
o Open question: any other tools deployed in the project.
• Complexity measurement forms, consisting of the list of criteria
defined by each tool, and the scoring mechanism. These are filled in
independently by each participant.
• Forms for applying each tool: SWOT, CES, COSM, Complexity
Register (Figure 26, Figure 27, Figure 30, Figure 31).
The Complexity Register was created to support the application of
the evaluated tools, helping to collect, organize, and analyze the data
resulting from the application of CES and COSM; and to supports the
application of MSM – by planning and monitoring the mitigation
strategy for each identified analyzed complexity item.
A single form is filled in per each project, aggregating the information
from all participants; refined and updated iteratively during each
interview.
• Evaluation questionnaire, filled in during the live interviews. It
consisted of 2 questions for each evaluated tool:
o Closed quantitative question: How useful is this tool - i.e. benefits outweigh the effort? Answers are recorded on a Likert-type interval scale, from 1 (not useful, i.e. zero) to 4 (very useful); forced-choice, i.e. without a midpoint so as to avoid neutral/indecision answers; allowing a separate out-of-scale point for non-answer; with no definition for in-between values (i.e. 2, 3) so as to allow limited numeric analysis (Chyung, Roberts, Swanson, & Hankinson, 2017).
o Open qualitative exploratory question: How did this tool help? Why, why not, when?
Chapter VIII.
Practical evaluation of the tools in actual project cases
143
VIII.3.4. Case study execution – details
This activity consisted of:
2.a. Preliminary desk research.
2.b. Initial live interview/meetings.
2.c. Follow-up interviews.
2.d. Evaluation with top management, in live interviews.
Figure 32 shows the participants to each activity and the type of data
collected.
2.a. The desk research consisted of gathering project information:
objectives, stakeholders, environment, duration, size, technology, team,
context, methodologies, and tools.
2.b. The initial live interview/meeting with each case study participant
consisted of:
• Presentation of the tools, terminology, definitions.
• Complexity measurement of each project
Filling in these forms was, in practice, an operation of collecting
detailed, relevant project information.
In order to avoid external influences and groupthink, and thus to
increase objectivity, the measurement was done independently for
each project, and for each participant – hiding the answers of the
other participants.
Multiple perspectives (data points) were collected per each case
study, with up to 4 participants per project, to ensure triangulation.
Thus, the forms were filled in by each participant independently,
with minimum external influence. This allowed participants to have
a personal first-hand experience with the measurement tools. It also
helped avoid external influence, groupthink, or peer-pressure bias.
The individual results are thereafter aggregated into average project
scores.
• Interactive application of the Complexity Analysis and
Management tools - CES, COSM
A single Complexity Register form was filled per project, aggregating
all project information and all perspectives, from all participants, and visible to all of them. The form is initially filled in during the first
Managing Positive and Negative Complexity:
Design and Validation of an IT Project Complexity Management Framework
144
interview for a particular project. It is thereafter updated and refined
continuously, iteratively, with new information, during each
subsequent meeting with another participant relevant to the
respective project.
The application of management tools, especially novel, cannot be a
neutral data collection activity. In practice, it is a mix of research and
consulting, where it is sometimes difficult to establish a clear
boundary between the role of academic researcher, and that of
management consultant. Known as the action research paradigm,
this mix of roles is more and more recognized in management
research as valuable for these situations (Gummesson, 2000). In fact,
the application of qualitative tools followed a scenario typical for
management meetings; where participants analyze a situation
interactively, openly, increasing the overall creativity, favoring the
exploration of new ideas, generating potential solutions and
scenarios; establishing action plans; and in general, making decisions
as a group.
• The tools evaluation questionnaire was applied individually, 1-to-
1, during each live meeting. It was recorded as neutrally as possible
from each participant, with answers from other participants hidden,
thus minimizing external influences, and increasing objectivity.
2.c. The live follow-up meetings with participants, for conclusions and
repeated evaluation, had the following objectives:
• to obtain longitudinal feedback.
• to measure any change in perception after the practical application
of the tools in the actual projects.
In order to allow time for participants to analyze the tools, to use them
independently, and to observe their impact during the actual project’s
execution, the follow-up meetings were done after at least 3 months from the
initial interview.
During the follow-up meeting, the tools and data are reviewed; the forms and
Complexity Register were updated. The evaluation questionnaire was
applied again, but focusing this time on how useful the tool was in the actual
project. Besides quantitative questions, the interview also explored: when,
how, why, and why not each tool is useful. Qualitative exploration also
included discussions if the participant will use, and/or recommend the tool
to be applied in other projects.
Chapter VIII.
Practical evaluation of the tools in actual project cases
145
2.d. Top management interviews were performed in order to obtain a
higher-level view and feedback on the case study results.
The evaluation questionnaire was applied during these interviews with a
focus on the overall results, benefits and costs of the application of the tools;
on the usefulness of the tools from the perspective of a portfolio manager.
This assessment is done only once, at the end of the case studies. A
longitudinal analysis was not relevant in their case, since they did not use the
tools, but only assessed the end results.
VIII.3.5. Analysis and interpretation of the research results
This activity consisted of:
a. extraction of text transcripts from each video recording.
b. quantitative analysis.
c. qualitative analysis of the evaluation questionnaires and
interview transcripts.
The quantitative analysis included mostly descriptive statistics, as the
number of data points does not allow detailed statistical analysis.
The qualitative analysis used card-sorting (Paul, 2008) (Spencer & Warfel,
2004):
• A list of arguments was extracted from each transcript, with particular attention to contextual information, e.g. when and why a particular tool was or was not useful.
• These were organized and classified per question and across interviews; each appearance was documented so as to ensure traceability. The classification process followed the criteria for categorization of data of (Merriam, 2009).
VIII.4. Results
VIII.4.1. Data collection
The research consisted of the longitudinal, repeated evaluation of a set of
tools, in 5 ongoing live projects. The research spanned over seven months,
between May-Dec. 2020. It included 23 interviews. The summary of the cases
is presented in Table 14; the detailed results in Appendix F.
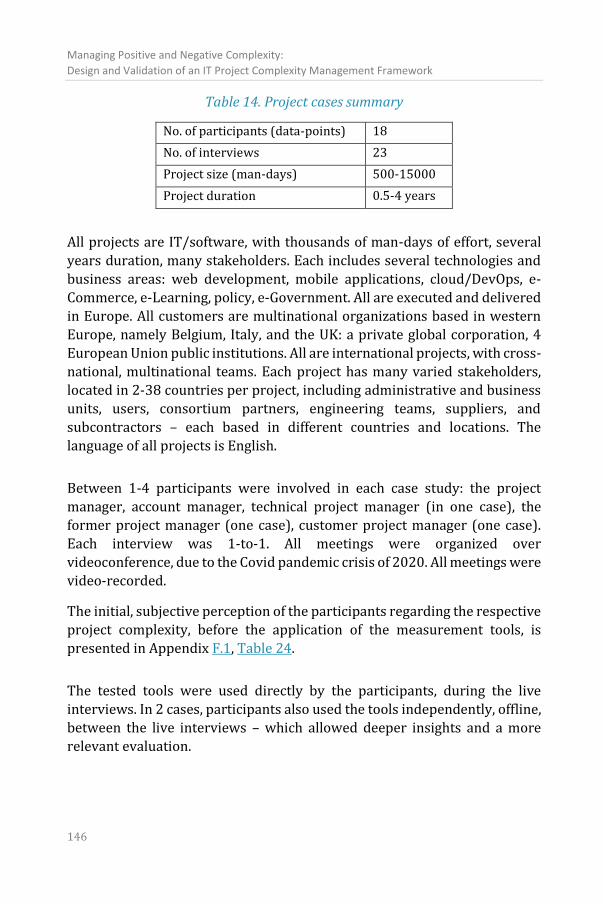
Managing Positive and Negative Complexity:
Design and Validation of an IT Project Complexity Management Framework
146
Table 14. Project cases summary
No. of participants (data-points) 18
No. of interviews 23
Project size (man-days) 500-15000
Project duration 0.5-4 years
All projects are IT/software, with thousands of man-days of effort, several
years duration, many stakeholders. Each includes several technologies and
business areas: web development, mobile applications, cloud/DevOps, e-
Commerce, e-Learning, policy, e-Government. All are executed and delivered
in Europe. All customers are multinational organizations based in western
Europe, namely Belgium, Italy, and the UK: a private global corporation, 4
European Union public institutions. All are international projects, with cross-
national, multinational teams. Each project has many varied stakeholders,
located in 2-38 countries per project, including administrative and business
units, users, consortium partners, engineering teams, suppliers, and
subcontractors – each based in different countries and locations. The
language of all projects is English.
Between 1-4 participants were involved in each case study: the project
manager, account manager, technical project manager (in one case), the
former project manager (one case), customer project manager (one case).
Each interview was 1-to-1. All meetings were organized over
videoconference, due to the Covid pandemic crisis of 2020. All meetings were
video-recorded.
The initial, subjective perception of the participants regarding the respective
project complexity, before the application of the measurement tools, is
presented in Appendix F.1, Table 24.
The tested tools were used directly by the participants, during the live
interviews. In 2 cases, participants also used the tools independently, offline,
between the live interviews – which allowed deeper insights and a more
relevant evaluation.
Chapter VIII.
Practical evaluation of the tools in actual project cases
147
VIII.4.2. Complexity measurement tools
The complexity measurement tools were applied independently, during the
first interview with each participant; they were not repeated in the second
interview with the same person, since measurement is an initial assessment,
part of the Project Planning phase. Each measurement was done
independently, with participants not being influenced by the results of their
colleagues. For each project, between 1 and 3 distinct measurements were
made with each tool. The number of measurements is presented in Appendix
F.1, Table 25. Filling in the measurement forms resulted, in practice, in
collecting detailed, relevant project information.
Figure 33 and Figure 34 present the results of CIFTER and Hass per project
and per criterion.
The measurement results support a good degree of agreement across tools,
as well as across participants. Project Prj2 is not confirmed to be complex,
with its normalized results of 19%, 32%, 27% per each measurement tool,
respectively. This makes it an outlier for several other evaluation criteria as
well. Project Prj1 was confirmed as complex, with results of 18, 58, and 65%
respectively. Projects Prj3, Prj4, and Prj5 were confirmed to be very complex,
with results between 58% and 81% per each tool.
A discussion on these correlations and on the comparative advantages and
disadvantages of each tool is presented in section VIII.5.3 - Discussion on the
measurement tools, below. Also, section VIII.5.4 includes a discussion on the
differences observed in the measurement results of the 3 tools.
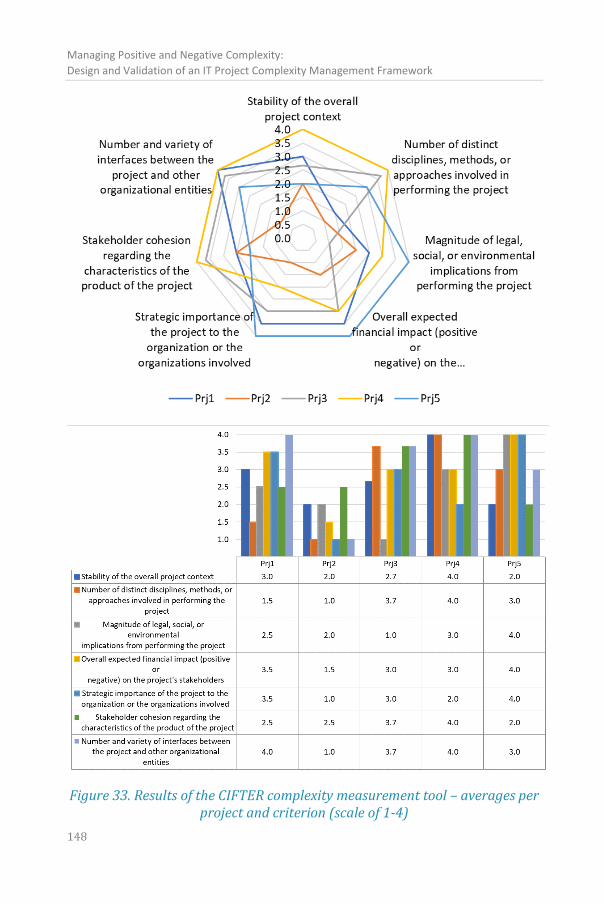
Managing Positive and Negative Complexity:
Design and Validation of an IT Project Complexity Management Framework
148
Figure 33. Results of the CIFTER complexity measurement tool – averages per project and criterion (scale of 1-4)
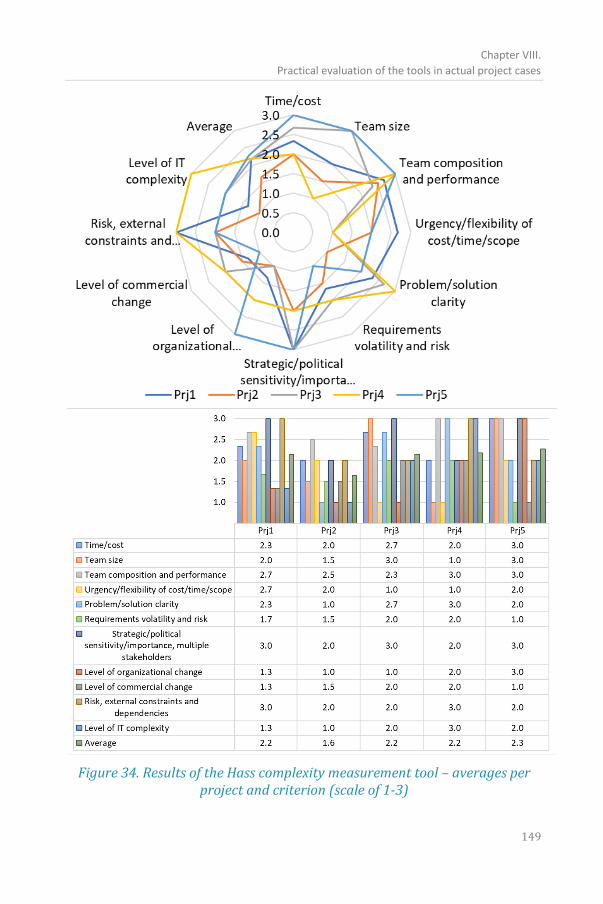
Chapter VIII.
Practical evaluation of the tools in actual project cases
149
Figure 34. Results of the Hass complexity measurement tool – averages per project and criterion (scale of 1-3)
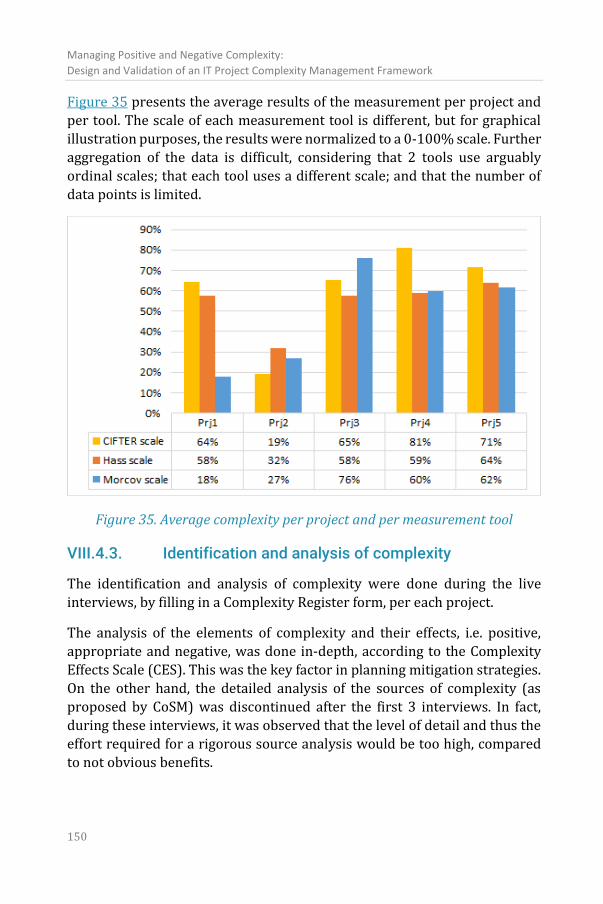
Managing Positive and Negative Complexity:
Design and Validation of an IT Project Complexity Management Framework
150
Figure 35 presents the average results of the measurement per project and
per tool. The scale of each measurement tool is different, but for graphical
illustration purposes, the results were normalized to a 0-100% scale. Further
aggregation of the data is difficult, considering that 2 tools use arguably
ordinal scales; that each tool uses a different scale; and that the number of
data points is limited.
Figure 35. Average complexity per project and per measurement tool
VIII.4.3. Identification and analysis of complexity
The identification and analysis of complexity were done during the live
interviews, by filling in a Complexity Register form, per each project.
The analysis of the elements of complexity and their effects, i.e. positive,
appropriate and negative, was done in-depth, according to the Complexity
Effects Scale (CES). This was the key factor in planning mitigation strategies.
On the other hand, the detailed analysis of the sources of complexity (as
proposed by CoSM) was discontinued after the first 3 interviews. In fact,
during these interviews, it was observed that the level of detail and thus the
effort required for a rigorous source analysis would be too high, compared
to not obvious benefits.
Chapter VIII.
Practical evaluation of the tools in actual project cases
151
VIII.4.4. Tools evaluation
During each interview, an independent assessment questionnaire was
applied, to evaluate the perceived usefulness of each tool, as well as the
context and modality in which they were /should be used. The answers to
closed assessment questions were analyzed using descriptive statistics. The
averages should be interpreted with caution, because of the limited number
of data points.
The quantitative assessments of the tools are presented in Figure 36, by
project, by group of participants, as well as aggregated. The scale used was
Likert 1-4.
The quantitative assessment was supplemented by a qualitative analysis:
each assessment being detailed with in-depth research, looking for
arguments such as: How did this tool help, why, why not, when. The list of
qualitative arguments was extracted from the interview transcripts and
organized using card-sorting (Paul, 2008) (Spencer & Warfel, 2004).
During the case-study execution, project Prj2 was not confirmed to be
complex. It has therefore divergent results and behaves like an outlier.
The evaluation questionnaire was not applied for Prj4 because of insufficient
participants. The lack of sufficient data-points would not ensure an
acceptable level of objectivity of the results. Thus, Prj4 is only relevant for
the complexity measurement tools, but not for the evaluation of the
complexity analysis and management tools.
A) Measuring project complexity is considered useful by all participants,
with an average score of 3.1 (on the scale of 1 to 4), and with positive results
for each group: 2.8 for project managers, 3.5 for top- and portfolio-
management, 3.7 for top-management. The measurement tools considered most useful are Morcov and Hass. The evaluation results show a good degree
of agreement across participants and types of participants, with low
variation coefficients. The variation coefficients are low for each group,
which shows a good convergence of the individual assessments of
participants of each group. A true statistical analysis cannot be performed,
because of the limited number of data points and because the assessment
scale is interval, arguably ratio (Chyung, Roberts, Swanson, & Hankinson,
2017).
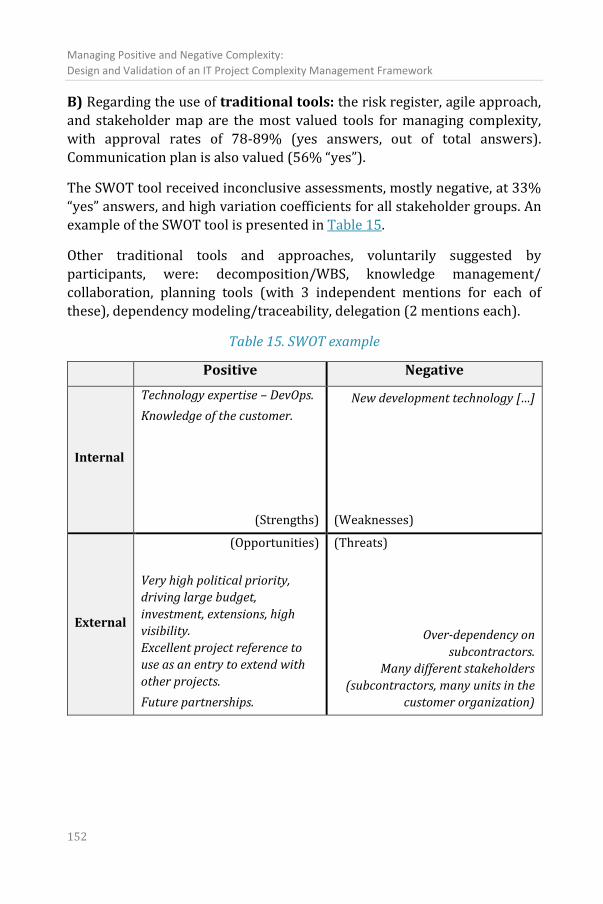
Managing Positive and Negative Complexity:
Design and Validation of an IT Project Complexity Management Framework
152
B) Regarding the use of traditional tools: the risk register, agile approach,
and stakeholder map are the most valued tools for managing complexity,
with approval rates of 78-89% (yes answers, out of total answers).
Communication plan is also valued (56% “yes”).
The SWOT tool received inconclusive assessments, mostly negative, at 33%
“yes” answers, and high variation coefficients for all stakeholder groups. An
example of the SWOT tool is presented in Table 15.
Other traditional tools and approaches, voluntarily suggested by
participants, were: decomposition/WBS, knowledge management/
collaboration, planning tools (with 3 independent mentions for each of
these), dependency modeling/traceability, delegation (2 mentions each).
Table 15. SWOT example
Positive Negative
Internal
Technology expertise – DevOps.
Knowledge of the customer.
(Strengths)
New development technology […]
(Weaknesses)
External
(Opportunities)
Very high political priority,
driving large budget,
investment, extensions, high
visibility.
Excellent project reference to
use as an entry to extend with
other projects.
Future partnerships.
(Threats)
Over-dependency on
subcontractors.
Many different stakeholders
(subcontractors, many units in the
customer organization)
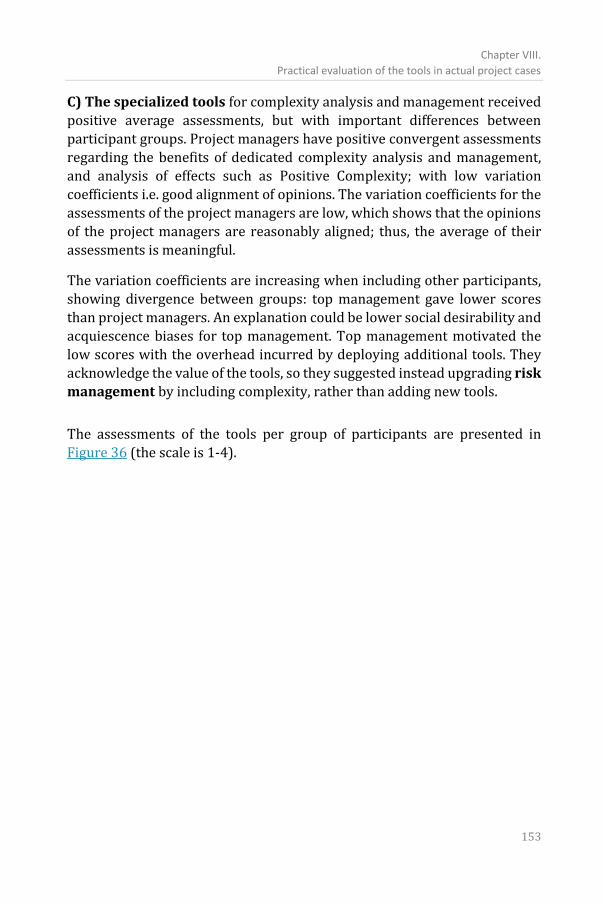
Chapter VIII.
Practical evaluation of the tools in actual project cases
153
C) The specialized tools for complexity analysis and management received
positive average assessments, but with important differences between
participant groups. Project managers have positive convergent assessments
regarding the benefits of dedicated complexity analysis and management,
and analysis of effects such as Positive Complexity; with low variation
coefficients i.e. good alignment of opinions. The variation coefficients for the
assessments of the project managers are low, which shows that the opinions
of the project managers are reasonably aligned; thus, the average of their
assessments is meaningful.
The variation coefficients are increasing when including other participants,
showing divergence between groups: top management gave lower scores
than project managers. An explanation could be lower social desirability and
acquiescence biases for top management. Top management motivated the
low scores with the overhead incurred by deploying additional tools. They
acknowledge the value of the tools, so they suggested instead upgrading risk
management by including complexity, rather than adding new tools.
The assessments of the tools per group of participants are presented in
Figure 36 (the scale is 1-4).
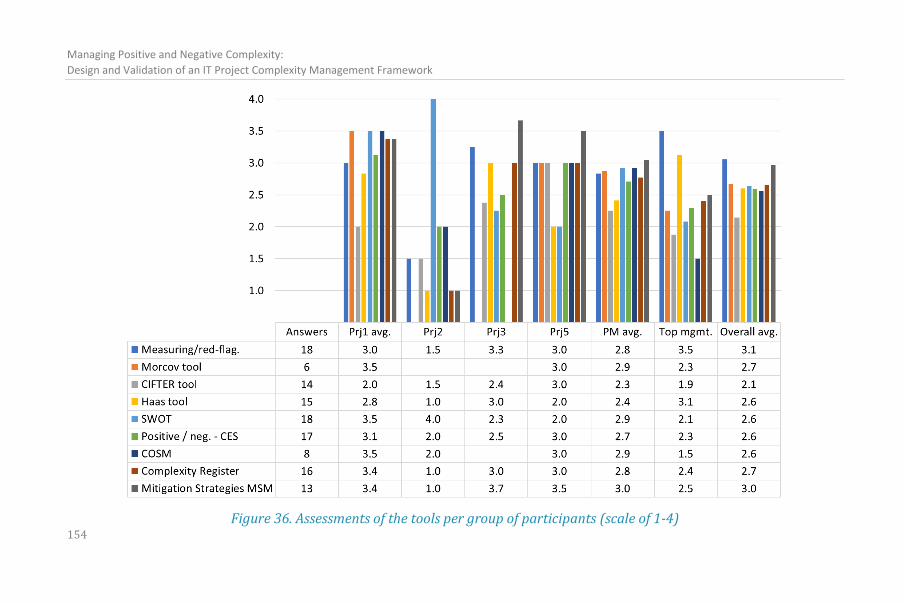
Managing Positive and Negative Complexity:
Design and Validation of an IT Project Complexity Management Framework
154
Figure 36. Assessments of the tools per group of participants (scale of 1-4)
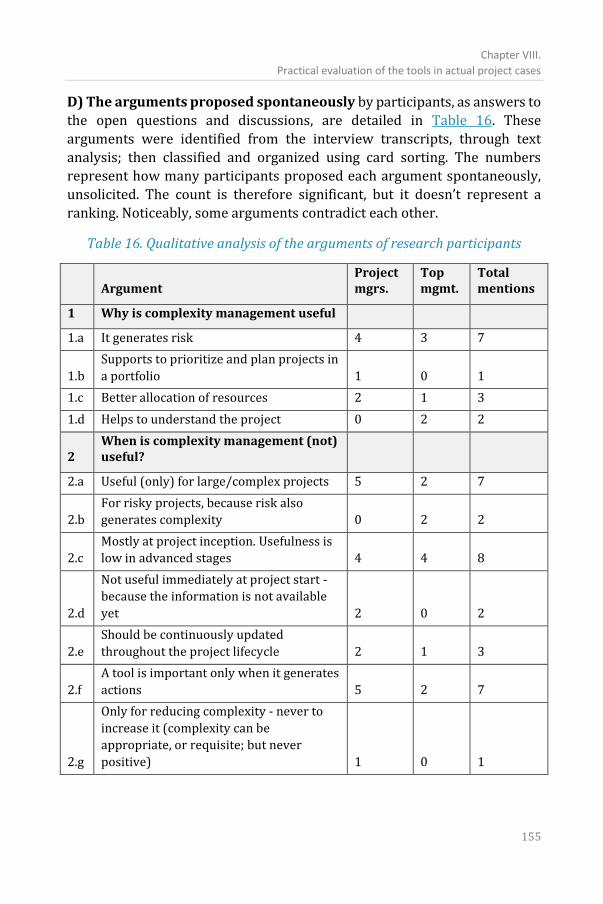
Chapter VIII.
Practical evaluation of the tools in actual project cases
155
D) The arguments proposed spontaneously by participants, as answers to
the open questions and discussions, are detailed in Table 16. These
arguments were identified from the interview transcripts, through text
analysis; then classified and organized using card sorting. The numbers
represent how many participants proposed each argument spontaneously,
unsolicited. The count is therefore significant, but it doesn’t represent a
ranking. Noticeably, some arguments contradict each other.
Table 16. Qualitative analysis of the arguments of research participants
Argument Project mgrs.
Top mgmt.
Total mentions
1 Why is complexity management useful
1.a It generates risk 4 3 7
1.b
Supports to prioritize and plan projects in
a portfolio 1 0 1
1.c Better allocation of resources 2 1 3
1.d Helps to understand the project 0 2 2
2 When is complexity management (not) useful?
2.a Useful (only) for large/complex projects 5 2 7
2.b
For risky projects, because risk also
generates complexity 0 2 2
2.c
Mostly at project inception. Usefulness is
low in advanced stages 4 4 8
2.d
Not useful immediately at project start -
because the information is not available
yet 2 0 2
2.e
Should be continuously updated
throughout the project lifecycle 2 1 3
2.f
A tool is important only when it generates
actions 5 2 7
2.g
Only for reducing complexity - never to
increase it (complexity can be
appropriate, or requisite; but never
positive) 1 0 1
Managing Positive and Negative Complexity:
Design and Validation of an IT Project Complexity Management Framework
156
3 Why is complexity management NOT useful
3.a Overlaps too much with risk management 3 2 5
4 Differences between complexity and risk management
4.a
Complexity management focuses on
positive complexity, on opportunities 3 2 5
4.b
Complexity management supports 1)
systemic thinking; and 2) awareness
regarding opportunities - even if a
specific complexity management tool is
not applied systematically 2 0 2
5 How to apply complexity management tools
5.a
Should be applied in 2 steps: red-flagging
first, then detailed analysis and
management - only for very complex
projects. 3 4 7
5.b
Project managers should receive detailed
guidelines on how to apply the tools (e.g.
templates, checklists, tutorial,
methodology) 2 1 3
5.c
A detailed tool (such as Morcov
measurement tool) is essential as a
checklist, identification and analysis tool
for large complex projects 2 2 4
5.d
In order to be effective, tools should be
adapted to the project environment 2 0 2
5.e
Project managers should share the results
with the team and stakeholders; including
business analysts, management, customer 1 0 1
5.f
The risk register should be upgraded to
include complexity analysis and
management 2 1 3
5.g
A tool must be deployed uniformly
(standardized) across an organization 1 1 2
5.h Project manager’s experience is essential 1 0 1
5.i
Deploying too many tools is overhead, so
tools should be prioritized 1 2 3
Chapter VIII.
Practical evaluation of the tools in actual project cases
157
VIII.5. Discussion
VIII.5.1. Tool selection and timing
Most participants support that analysis and management tools should be
deployed as early as possible in a project lifecycle; 8 participants gave this
argument, but there were also 2 contrary positions. Participants concur that
tools should be continuously updated throughout the project. The majority
underlined that a tool is useful only if it generates actions. A participant
suggested that the effectiveness depends on the dissemination and sharing
of results and actions with the project team and stakeholders.
Participants support the standardization of a clear set of tools and templates
at the level of the organization, adapted to the organizational and project
context, and easily reusable across projects.
The arguments given especially by top management participants suggest
that deploying too many tools is counter-efficient; thus, the implementation
of various tools should be prioritized depending on the project.
VIII.5.2. Red-flagging vs. detailed analysis
When deciding on the deployment of additional management tools, an
important discussion concerned their cost compared to their benefits. Seven
participants gave spontaneous arguments that the cost overhead is not
acceptable for simple or small projects. Only projects “red-flagged” as
potentially complex high-risk should enter in a detailed complexity
assessment or measurement, and be considered for the application of
specific complexity management tools. Dedicated complexity management
tools were received with more enthusiasm by project managers than by top
management – the main reserves being related to the additional effort,
prioritization of the tools deployed, and overlap with risk management.
An initial, automated, low-effort red-flagging of projects was therefore
suggested, before considering the application of more specialized tools. This
red-flagging could use numeric size-related information, already available,
but which strongly correlate with complexity, such as project size: budget,
number of stakeholders, subcontractors. Participants also argued that “high-
risk” should also be an independent flag.
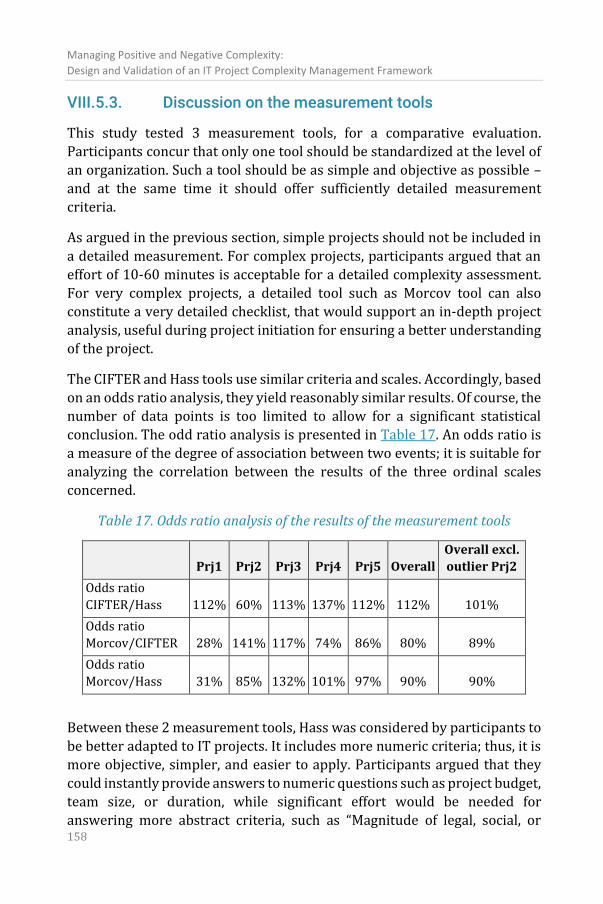
Managing Positive and Negative Complexity:
Design and Validation of an IT Project Complexity Management Framework
158
VIII.5.3. Discussion on the measurement tools
This study tested 3 measurement tools, for a comparative evaluation.
Participants concur that only one tool should be standardized at the level of
an organization. Such a tool should be as simple and objective as possible –
and at the same time it should offer sufficiently detailed measurement
criteria.
As argued in the previous section, simple projects should not be included in
a detailed measurement. For complex projects, participants argued that an
effort of 10-60 minutes is acceptable for a detailed complexity assessment.
For very complex projects, a detailed tool such as Morcov tool can also
constitute a very detailed checklist, that would support an in-depth project
analysis, useful during project initiation for ensuring a better understanding
of the project.
The CIFTER and Hass tools use similar criteria and scales. Accordingly, based
on an odds ratio analysis, they yield reasonably similar results. Of course, the
number of data points is too limited to allow for a significant statistical
conclusion. The odd ratio analysis is presented in Table 17. An odds ratio is
a measure of the degree of association between two events; it is suitable for
analyzing the correlation between the results of the three ordinal scales
concerned.
Table 17. Odds ratio analysis of the results of the measurement tools
Prj1 Prj2 Prj3 Prj4 Prj5 Overall
Overall excl.
outlier Prj2
Odds ratio
CIFTER/Hass 112% 60% 113% 137% 112% 112% 101%
Odds ratio
Morcov/CIFTER 28% 141% 117% 74% 86% 80% 89%
Odds ratio
Morcov/Hass 31% 85% 132% 101% 97% 90% 90%
Between these 2 measurement tools, Hass was considered by participants to
be better adapted to IT projects. It includes more numeric criteria; thus, it is
more objective, simpler, and easier to apply. Participants argued that they
could instantly provide answers to numeric questions such as project budget,
team size, or duration, while significant effort would be needed for
answering more abstract criteria, such as “Magnitude of legal, social, or
Chapter VIII.
Practical evaluation of the tools in actual project cases
159
environmental implications from performing the project” or “Level of
organizational change”. On the other hand, numeric criteria alone are not
sufficient to describe and measure complexity, as they do not cover the non-
quantifiable aspects typically associated with dynamic complexity.
In order to increase the accuracy of the measurements, the tools, their
weighting system, and the scales should be adapted to the organization and
environment. In fact, the same project may be considered small or large,
simple or complex, in different contexts.
Similar to numerous other tools used in social sciences and even engineering,
complexity measurement tools will always incorporate a certain degree of
subjectivity. At the same time, the standardization of tools within a specific
context ensures higher comparability between results.
VIII.5.4. Difference in measurement results between the tools
During the application of the measurement tools, it was observed that
CIFTER and Hass tools do not discriminate well between projects of very
different sizes. The reason is that these tools use: a) ordinal Likert scales, and
b) a built-in maximum arbitrary threshold for criteria related to size. Thus,
the tools give the same complexity score for all projects above the maximum
threshold. E.g. for a maximum built-in threshold of 100k, then a project of
100k Eur has the same complexity score as a project of 1 bil. Eur.
On the other hand, as shown in section III.3.2, project size correlates very
well with project complexity.
The Morcov tool attempts to improve this shortcoming by proposing a ratio
scale for numerical questions. Thus, the answers are expressed in absolute
values: Team size is expressed in full-time equivalents, Effort in man-days,
Duration in calendar days. Morcov tool thus discriminates better between
projects of very different sizes.
Because of this difference in the scales used, the project complexity
measurement results obtained with CIFTER and Hass were similar, but the
results obtained from the Morcov tool were divergent from these – as
illustrated by the odds ratio analysis, Table 17.
Managing Positive and Negative Complexity:
Design and Validation of an IT Project Complexity Management Framework
160
VIII.5.5. Checklists and templates for analysis
The first application of a new tool, by a new user, in a new organization, is a
difficult step, as there is no previous experience, no starting point, few clues
and indications on where to begin. Templates are then gradually developed;
previously developed artifacts are reused from other projects or examples.
The current project cases faced a similar challenge. Faced with the challenge
to apply new tools, project managers asked for detailed guidelines on how to
apply them; for templates, checklists, tutorials, a detailed methodology.
While deploying the tools, the research participants looked for checklists;
and developed templates when needed. The Complexity Register itself
emerged as a checklist and template; it allows following a set of consecutive
steps in the application of the evaluated tools.
The most useful tool for the identification and analysis of complexity was the
measurement tool itself. The Morcov measurement tool was more useful
from this point of view, being more detailed and precise, as well as more
adapted to the IT industry. The mere application of such a detailed
measurement tool generates, as a direct result, a list of complexity elements.
Going through each criterion of a measurement tool, and answering the
questions regarding the project, has thus important benefits, other than
scoring project complexity. It is already a detailed project analysis activity
that is done in practice for any project, as part of project initiation. It helps
identify complexity elements as well as risks. As one participant suggested:
“Any tool that supports to identify and mitigate risks is super useful”; or
another participant: “the items in the Morcov tool are the same elements that
are typically included in the project charter, analysis which is done during the
initiation stage of any large project. […] The finality – the operational results – is the identification of complexity elements and risks.”. At the same time,
checklists should not block creative thinking, nor limit the analysis to
predefined patterns only.
VIII.5.6. The relation and overlap between risk and complexity
The research sub-project confirmed a strong relationship and even overlap
between risk and complexity.
Participants concur that complexity generates risk. At the same time, two
spontaneous arguments were made that risk also generates complexity;
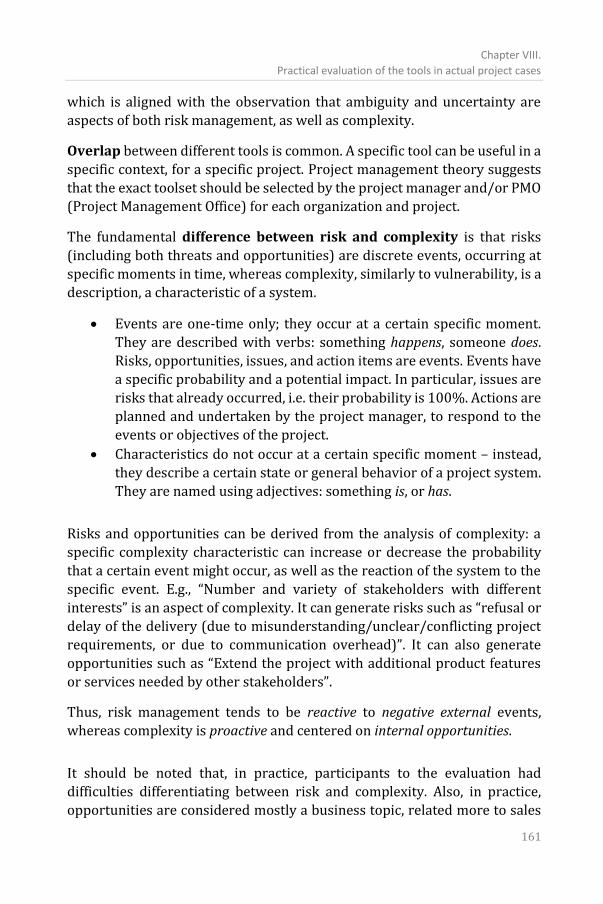
Chapter VIII.
Practical evaluation of the tools in actual project cases
161
which is aligned with the observation that ambiguity and uncertainty are
aspects of both risk management, as well as complexity.
Overlap between different tools is common. A specific tool can be useful in a
specific context, for a specific project. Project management theory suggests
that the exact toolset should be selected by the project manager and/or PMO
(Project Management Office) for each organization and project.
The fundamental difference between risk and complexity is that risks
(including both threats and opportunities) are discrete events, occurring at
specific moments in time, whereas complexity, similarly to vulnerability, is a
description, a characteristic of a system.
• Events are one-time only; they occur at a certain specific moment.
They are described with verbs: something happens, someone does.
Risks, opportunities, issues, and action items are events. Events have
a specific probability and a potential impact. In particular, issues are
risks that already occurred, i.e. their probability is 100%. Actions are
planned and undertaken by the project manager, to respond to the
events or objectives of the project.
• Characteristics do not occur at a certain specific moment – instead,
they describe a certain state or general behavior of a project system.
They are named using adjectives: something is, or has.
Risks and opportunities can be derived from the analysis of complexity: a
specific complexity characteristic can increase or decrease the probability
that a certain event might occur, as well as the reaction of the system to the
specific event. E.g., “Number and variety of stakeholders with different
interests” is an aspect of complexity. It can generate risks such as “refusal or
delay of the delivery (due to misunderstanding/unclear/conflicting project
requirements, or due to communication overhead)”. It can also generate
opportunities such as “Extend the project with additional product features
or services needed by other stakeholders”.
Thus, risk management tends to be reactive to negative external events,
whereas complexity is proactive and centered on internal opportunities.
It should be noted that, in practice, participants to the evaluation had
difficulties differentiating between risk and complexity. Also, in practice,
opportunities are considered mostly a business topic, related more to sales

Managing Positive and Negative Complexity:
Design and Validation of an IT Project Complexity Management Framework
162
and marketing, and disregarded by participants in the context of project
management. In fact, risk registers rarely list any opportunity. This made
Positive Complexity a valuable tool in practice: “I like the complexity register
because it forces me to look at opportunities instead of only at risks”, was an
argument received. Thus, the concept of Positive Complexity can function as
a catalyst for uncovering project opportunities.
Simple awareness of potential project complexity proved to be already
beneficial, supporting systemic thinking and openness towards Positive
Complexity and opportunities, in the actual project cases. It allowed for a
better understanding of the project; and, in one case, even helped uncover a
specific project opportunity.
A potential solution to the overlap between risk and complexity, suggested
independently by 3 participants, is to extend risk tools with complexity
management – this argument being suggested independently by three
participants. As one suggested: “Complexity should not be duplicated with risk.
Deploying two separate registers will lead to rejection from project managers.
As the concept is useful, the key question is how to combine complexity and risk
management. A detailed complexity measurement tool could be used as a tool
to fill in a risk register, rather than a finality in itself”.
VIII.6. Limitations, validity, and reliability of the evaluation project
The external validity of the research is affected by limitations regarding the
project and organizational context. All projects included in the research were
IT/software development projects that use similar project management and
software development methodologies; but they cover a very wide range of
technologies and business areas. The customers belong to several industry
verticals, are both public and private organizations. All customers are
Western European, but they are large multinational and multicultural
organizations.
Construct validity and reliability were strengthened through:
• the use of multiple sources of evidence (triangulation), i.e. analyzing
several projects and several stakeholders for each project;
• establishing and documenting the chain of evidence, through video
recording, text transcripts, and rigorous configuration management;
Chapter VIII.
Practical evaluation of the tools in actual project cases
163
• ensuring that stakeholders have open access for reviewing the
collected information, including access to video recordings and data.
Triangulation supports proving convergence and exploring divergent,
possibly new relevant insights. Multiple case studies are suitable for building
new theories and their external validation (Gibbert & Ruigrok, 2010).
Face-to-face interviews are suitable for the niche topic, to obtain new
insights and increase innovation and creativity. The interviews were
structured in a standardized questionnaire, with open questions to drive
exploratory qualitative research, but also with fixed-choice Likert-type and
yes/no questions to increase reliability, allow for comparison and data
analysis. As the topic is unfamiliar, respondents might misuse the midpoint
e.g. as a non-answer or neutral answer, thus decreasing the reliability of the
measurement; therefore, the evaluation scale did not have a midpoint
(Chyung, Roberts, Swanson, & Hankinson, 2017). During the open questions,
stronger importance was placed on negative rather than on positive
feedback; on discovering arguments, causality, and context (Wieringa, 2014).
Any quantitative analysis must be interpreted with caution, considering the
number of data points and the use of multiple ordinal and interval Likert-
type scales in the same research. Different tools use different scales, as they
had been proposed by different authors. The research focused therefore on
the qualitative analysis of the answers received, and of the type of arguments
used by each participant, while taking into consideration the characteristics
of the specific experts, organizations and projects involved.
The measurement tools were evaluated in comparison with each other.
The complexity analysis and management tools were deployed and
evaluated as a set, making it difficult to differentiate with accuracy between
the results and impact of each tool, independently of the others. In fact, the
results of the data collection from all the analysis and planning tools were
integrated into a single Complexity Register.
The participants in the case studies have a personal stake in the projects
(with one exception), i.e. skin in the game (Taleb, 2018). They are personally
interested in the success and results of the specific project cases. Their time
is limited; nevertheless, they volunteered for this research. They have direct
responsibility for achieving the project’s objectives, including cost, quality,
deadlines, and scope – hence personal interest to limit the cost and overhead,
Managing Positive and Negative Complexity:
Design and Validation of an IT Project Complexity Management Framework
164
but willing to adopt new methods and tools if useful. They have a genuine
interest in advancing project management knowledge, in improving practice,
processes, and tools.
VIII.7. Conclusion
This chapter presented the results of research sub-project P5:
implementation and repeated evaluation of a set of tools for complexity
measurement, analysis, and management, in 5 actual industry IT project
cases, over a period of 7 months. The tools evaluated were the specialized IT
project complexity measurement, analysis, and management tools, proposed
in Chapter VI. Two additional complexity measurement tools were evaluated.
The study also investigated the use of traditional tools for managing project
complexity.
The previous research sub-project P4 consisted of an iterative design-and-
validation process formed of 2 design-cycles (Chapters VI and VII). Together,
the sub-projects P4 and P5 form a full engineering-cycle.
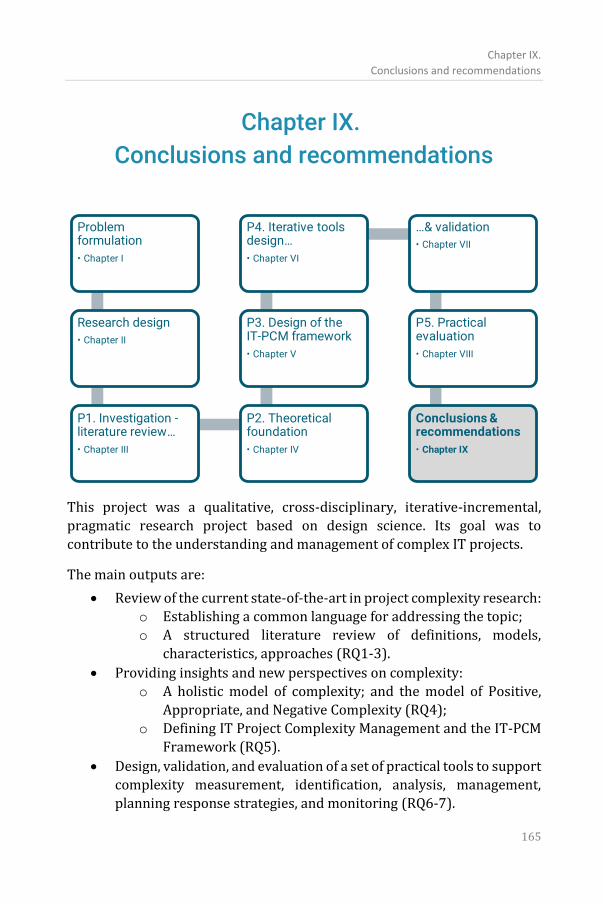
Chapter IX.
Conclusions and recommendations
165
Chapter IX.
Conclusions and recommendations
This project was a qualitative, cross-disciplinary, iterative-incremental,
pragmatic research project based on design science. Its goal was to
contribute to the understanding and management of complex IT projects.
The main outputs are:
• Review of the current state-of-the-art in project complexity research:
o Establishing a common language for addressing the topic;
o A structured literature review of definitions, models,
characteristics, approaches (RQ1-3).
• Providing insights and new perspectives on complexity:
o A holistic model of complexity; and the model of Positive,
Appropriate, and Negative Complexity (RQ4);
o Defining IT Project Complexity Management and the IT-PCM
Framework (RQ5).
• Design, validation, and evaluation of a set of practical tools to support
complexity measurement, identification, analysis, management,
planning response strategies, and monitoring (RQ6-7).
Managing Positive and Negative Complexity:
Design and Validation of an IT Project Complexity Management Framework
166
Complexity is a ubiquitous reality in modern IT engineering & management.
It generates risk, but it also creates opportunities.
Modern IT engineering uses complexity to deliver value. Positive and
appropriate complexity can act as catalysts for opportunities.
The results of this project, the new model of Positive, Appropriate, and
Negative Complexity, the IT-PCM framework, and the proposed IT project
complexity management tools aim to constitute a step towards the goal to
support building better IT engineering and products.
IX.1. Positive, Appropriate, and Negative Complexity
The model of Positive, Appropriate, and Negative Complexity is a new
paradigm that emerged from this project.
Complexity is a challenge in all IT engineering projects and products. While
it often correlates with risks and higher costs, it can also bring functionality,
advanced technology, and better products. Complexity is everywhere; we are
surrounded by complex engineering products that work.
Aligned with similar concepts from related domains, such as opportunities,
antifragility, or requisite variety, this paradigm of positive and appropriate
complexity has practical implications and applications. It allows for better
understanding and management of complexity; recognizing its benefits,
exploiting relevant opportunities; and designing better, more advanced, and
useful technology.
IX.2. Designed tools
This project resulted in the design, validation, and evaluation of a set of tools
for the identification, analysis, and management of complex IT projects,
grounded on an innovative approach and project complexity perspective,
with both theoretical and practical implications:
• The IT Project Complexity Management – IT-PCM framework: a
structural framework in which specific tools and techniques can be
anchored; a high-level process that adds rigor to the design of
specialized tools and to the management of complex IT projects,
Chapter IX.
Conclusions and recommendations
167
systematizing the concepts and artifacts, supporting the practical
implementation.
• The Complexity Effect Scale – CES: supports the identification,
visualization and analysis of IT project complexity based on its
effects: Positive, Appropriate, and Negative.
• The Complexity Source/Effect Segmentation Matrix – COSM:
supports complexity analysis based on its sources and effects.
• The complexity Mitigation Strategies Matrix – MSM: supports the
decision process for mitigating complexity. The proposed response
strategies, depending on effects, are:
a) create/enhance;
b) use/exploit;
c) accept;
d) simplify/reduce;
e) avoid/eliminate.
• The Complexity Register – CoRe: supports the collection,
organization, aggregation, management, monitoring, and update of
the relevant information.
The designed tools aim to support practitioners to:
• recognize, understand, analyze, and manage complexity more
effectively;
• deal with IT project complexity in a structured way;
• prioritize projects and resource planning;
• reduce associated risks and exploit opportunities;
• increase project success rates.
While this IT-PCM framework proposes detailed guidelines, best practices
and tools, in practice there is no silver bullet and no unique universal answer
to the question of which is the best tool or strategy to deal with complexity.
As in all areas of project management and engineering, the appropriate
solution is always contextual.
The appropriateness, selection, and implementation of a specific set of
management frameworks and tools are specific for each particular
organization and project. Each project and portfolio manager will, in practice,
choose an appropriate toolset, decide when and to what degree to apply each
tool to a particular situation, and adapt them to the project environment.
Managing Positive and Negative Complexity:
Design and Validation of an IT Project Complexity Management Framework
168
IX.3. Research summary
Project complexity is a challenging domain. Its study builds knowledge and
brings value to IT engineering and project management practice.
This project consisted of a full engineering-cycle, and included:
• An investigation phase:
o Research sub-project P1. Investigation.
o P2. Theoretical foundation.
• Several design-cycles, i.e. design-and-validation loops, supported by
semi-structured interviews with multiple experts:
o P3. IT-PCM Framework design.
o P4. Tools design-and-validation.
• A longitudinal evaluation of the designed tools and concepts in actual
live IT project cases:
o Sub-project P5. Practical evaluation.
The research started with a systematic literature review on project
complexity and complex project management – research sub-project P1,
Chapter III. Other areas investigated were IT/software and systems
engineering. The literature review sub-project resulted in:
• A chronological list of approaches and definitions – summary and
detailed versions – answering to research question RQ1.
• Classifications (or sources) of project complexity – RQ1.
• Characteristics of project complexity – RQ2.
• Complexity measurement tools and criteria – RQ3.
A theoretical foundation, appropriate for this project, was chosen in the
research sub-project P2 – Chapter IV (research question RQ4). It consisted of
choices regarding the definitions, approach, and language used throughout
this research. It proposed a new paradigm of project complexity: a holistic
perspective, with an approach based on the effects of complexity, and with
theoretical definitions for Positive, Appropriate (requisite), and Negative
Complexity.
Chapter IX.
Conclusions and recommendations
169
The IT-PCM framework is the main result of sub-project P3 – Chapter V
(research question RQ5). It aims to support IT Project Complexity
Management in a structured way. Project Complexity Management is
formally defined as a knowledge area that includes specific processes to
understand, plan strategy and responses, monitor and control project
complexity. The IT-PCM framework organizes the complexity management
processes and activities, and their specific inputs and outputs. Additionally,
an inventory of relevant tools and methods is proposed for each process and
step in the framework, obtained from the literature review, drawing from all
the related domains: project management, systems engineering, and
IT/software engineering. This inventory revealed several gaps, that sub-
project P4 attempted to fill with new tool designs.
Sub-project P4 (Chapters VI and VII) attempts the design-and-validation of
new methods and practical tools for IT project complexity management
(research question RQ6). It is based on the literature review (P1) and on the
proposed theoretical constructs (P2). The new tool designs attempt to fill
gaps in the inventory of tools of the IT-PCM framework (P3).
The evaluation in practice of the proposed tools was done in sub-project
P5 – Chapter VIII (research question RQ7).
The tools design, validation, and evaluation, in sub-projects P4 and P5, were
anchored in the IT-PCM framework. Due to its scale and detailed inventory
of tools and techniques, complete empirical validation of the full IT-PCM
framework is difficult to perform. Instead, the effectiveness and the
application in practice of components of the framework were validated and
evaluated during the research sub-projects P4 and P5. These provide implicit
evidence on how the integrated framework can be deployed to support
actual projects.
Managing Positive and Negative Complexity:
Design and Validation of an IT Project Complexity Management Framework
170
IX.4. Implications
The research has both theoretical and practical implications for IT,
engineering, and project management.
This project argues for a modern positive approach to complexity. It
recognizes its ubiquitousness in contemporary engineering and
management and acknowledges that “it works”. This is congruent with the
theories and concepts of opportunities, requisite complexity, viable systems,
and antifragility, and is aligned with systems engineering. Complexity is thus
more than just a threat; it also becomes a basis and catalyst for creating and
exploiting opportunities and supporting overall project success.
As shown by the literature review, project complexity is difficult to
understand and manage; its terminology is overloaded and over-used.
Despite a growing importance and priority in research, there is still a strong
need for solutions to its challenges and opportunities.
This thesis attempts to formally define the Project Complexity Management
knowledge area and establish its standard common language. The
introduction of new theoretical constructs supports the development of the
domain, with proposed definitions for Positive, Appropriate, and Negative
Complexity.
The thesis proposes the IT-PCM management framework for dealing with
IT project complexity in a structured way, and specialized tools to support
practitioners to better identify, understand, analyze, and manage complexity.
These proposed approaches and tools align project management theory and
practice with systems and IT engineering, which recognize the importance of
complexity and the need to manage and even exploit it, rather than only to
avoid or reduce it.
The analysis of IT project complexity effects, and especially benefits, is a
novel approach that changes how we look at it from both a theoretical and
practical point of view. Complexity is a ubiquitous reality. Besides the
difficulties and risks it generates, it also creates opportunities. In fact, we
notice all around us that complexity works; it delivers value, functionality,
creativity and innovation.
Chapter IX.
Conclusions and recommendations
171
Accordingly, the traditional approaches that focus on simplifying and
reducing complexity may not always be the best mitigation strategy. This
research makes an argument for new tools to manage complexity and even
use it for improving project success rates, for obtaining better project results
and benefits.
IX.5. Limitations, validity and reliability
While a series of measures were taken for enhancing construct, internal and
external validity, and reliability of the individual sub-projects as well as of
the integrated research project, several limitations may impact the results.
These refer to both the research methodology as well as to the execution.
A set of limitations are also specific to each research sub-project. These are
presented in sections III.6, VII.5, and VIII.6, respectively.
IX.5.1. Research approach and methods
The overall reliability of the research is supported by the use of a structured
research methodology, i.e. design science, and structured data collection
methods, i.e. case-study research and interviews with predefined
questionnaires for data collection. This methodology is aligned with our
overall qualitative inductive approach.
Case study research is suitable for building new theories (Gibbert & Ruigrok,
2010). Face-to-face interviews with open questions are suitable for the niche
topic, supporting uncovering new insights and increasing innovation and
creativity during research.
Design science is widely used in engineering and IT as an incremental
iterative process to build new models and tools, to develop solutions for
practical engineering problems, and for solving wicked problems (Peffers,
Tuunanen, Rothenberger, & Chatterjee, 2007) (Hevner, March, Park, & Ram,
2004).
Each research sub-project is a step in the engineering cycle, building on the
previous sub-projects (Wieringa, 2014).
Managing Positive and Negative Complexity:
Design and Validation of an IT Project Complexity Management Framework
172
A series of choices were made regarding the methods of each research sub-
project, which might impose limitations on their validity and reliability.
Thus, in research sub-project P4 - design-and-validation (Chapter VII):
• The project cases were selected by the participants to the research
themselves.
• The project cases were analyzed from a single perspective.
• A cross-sectional data collection method is used.
On the other hand, in research sub-project P5 – evaluation (Chapter VIII):
• The project cases were selected first; the project stakeholders were
selected and invited to participate only after the selection of the
projects.
• Multiple data points are collected: the project cases are analyzed
from the perspective of multiple stakeholders.
• For each project case, the data collection was longitudinal, with
several data points being collected during a period of several months.
Overall, the validity of the integrated set of sub-projects is thus higher than
the validity of individual sub-projects. Nevertheless, some limitations
remain, as will be discussed below.
IX.5.2. Construct validity
Construct validity is affected by some choices regarding the design of the
research, as well as by aspects related to its execution.
A rigorous configuration management process was enforced throughout the
entire research project. It included detailed version and variant control,
covering all data, research items, and design artifacts. This process
established and documents the entire chain of evidence, for the data, the
activities, and for the intermediate and final results. Each iteration in the
engineering-cycle was documented in order to enhance construct validity.
After each sub-project and each iteration, configuration baselines were
established. The intermediate versions of each artifact were documented for
traceability and construct validity.
In sub-project P1 – Systematic literature review, the research query design
limited the number of articles retrieved, in order to have a manageable
research scope. This might have excluded relevant articles from the results.
Chapter IX.
Conclusions and recommendations
173
This limitation was partially compensated by snowballing and backward-
searching, i.e. we included articles that are referred by, or that refer to
relevant literature. We also included in the research the results of relevant
literature reviews which were published after our literature review.
A limitation on construct validity concerns the main method for data
collection used in research sub-projects P4 (design-and-validation) and P5
(evaluation), namely face-to-face interviews. Thus, the main data collected
for validation (P4) is formed of the subjective opinions of the participants to
the research, based on hypothetical questions. While overall multiple data
points were collected, each represents the single perspective of each
respondent.
Also, during evaluation (P5), the main collected data is the perceived benefits
from the deployment of the evaluated tools in their actual projects. As
discussed in section VIII.3.1, this was the only practical method of gathering
information in a reasonable timeframe regarding the impact of the tools in
practice. A series of measures were taken to mitigate this potential weakness,
such as triangulation – collecting multiple data points, from multiple
perspectives, for each project case.
A potential limitation that can impact the quality of data collection for sub-
project P4 is that the interviews were not recorded, therefore no detailed
transcripts are available. The analysis of the data was based on the answers
to the questionnaires and on the minutes of meetings kept by the author.
During sub-project P5, all interviews were video recorded, and the full
transcripts of the interviews are available. This increases the construct
validity of sub-project P5.
IX.5.3. Internal validity
Internal validity is enhanced by documenting the causality, the reasoning
behind design choices, and by providing transparency to reviewers and to
research participants.
The overall research approach, design science, can impose a potential
limitation impacting this type of research, as it includes a series of choices
during the design, re-design, validation, and evaluation loops. On the other
hand, the iterative approach of design science, with its cycles of validation
Managing Positive and Negative Complexity:
Design and Validation of an IT Project Complexity Management Framework
174
and evaluation, enhances internal validity. Overall, the entire process was
transparent and documented.
The adoption of a qualitative research approach can also have implications
and might impose limitations regarding the collection and analysis of the
data. These can be affected by researcher bias. In order to reduce this
limitation, data was collected and discussed transparently both with
participants to the research, as well as during the reviews of the results and
peer-reviews of the publications.
During the evaluation sub-project P5, the measurement tools were evaluated
in comparison with each other, and all the tools were deployed and evaluated
as a set, making it difficult to differentiate with accuracy between the results
and impact of each tool, independently of the others. This can pose a
limitation to the quality of the data collected, making it difficult to evaluate
the perceived impact and benefits of each tool independently of the others.
The comparison of the results of different complexity measurement tools has
to take into consideration that each of them uses different scales – as they
had been proposed by different authors. This might affect the quantitative
analysis regarding the possible correlation of the results of the 3 tools, during
the evaluation sub-project P5. These issues might impose limitations to the
interpretation of the results regarding the comparison between
measurement tools, as well as regarding the conclusions on the benefits and
impact of each tool.
IX.5.4. External validity
An important limitation to the external validity of the research is that
inductive research is sensitive to its context.
This context limitation is typically managed by specifying the domain of applicability of the results as precisely as possible. We assumed therefore
from the onset a limitation of applicability to the domain of IT project
management. This limitation also supported specialization, thus increasing
the usability of the results. Accordingly, all research sub-projects, starting
from the literature review P1 and including all case-studies of sub-projects
P4 and P5, were limited to the IT domain.
Chapter IX.
Conclusions and recommendations
175
Two aspects are relevant to the external validity of this research:
1. The level of generalization of the results beyond the scope of the analyzed
case studies, but still within the domain of IT projects.
2. The degree to which the overall results can be generalized beyond the IT
domain.
A dedicated discussion is presented below for each of these 2 aspects.
1. Several case studies and interviews were conducted, enhancing the degree
of variation of the results. Thus, the data collected supported extracting
common characteristics, which allows analytical generalization and
enhances external validity. At the same time, a limitation could be imposed
by the fact that the number of cases analyzed was limited by the qualitative
research approach.
The project cases have a significant degree of similarity, but they also provide
a level of variation within the domain of IT projects. In fact, all projects have
similar cultural and geographical backgrounds, which poses a limitation to
their generalizability. All project cases were implemented in Europe, albeit
across many different countries. All final customers are Western European,
even if the projects have stakeholders around Europe. The projects are for
large multinational and multicultural organizations. The customers belong
to several industry verticals, and are from both the public and the private
sector.
Within the IT domain, the projects cover a wide range of IT technologies and
business areas. Also, the projects analyzed during the cycles of validation
were different from the projects analyzed during the evaluation, which
enhances the level of variation of the project cases within the IT domain.
These measures enhance the level of confidence in the external validity of the
results, within the domain of IT project management, while taking into
consideration the limitations expressed above.
2. On the other hand, the level of generalization of the results beyond the IT
domain cannot be easily established.
In fact, all project cases analyzed were IT/software development projects,
with a series of similarities between them. They use standard, thus similar
Managing Positive and Negative Complexity:
Design and Validation of an IT Project Complexity Management Framework
176
project management and software development methodologies. They all use
English as the main language.
Accordingly, while the results could be relevant to other domains, further
research could be needed before asserting a possible generalization beyond
the stated IT domain.
IX.5.5. Reliability
Reliability can be affected by the choice of a qualitative inductive research
approach. This limits the repeatability of the findings, due to the involvement
of the researcher, both as an actor in the collection of data from interviews,
as well as to the mix of the role of researcher and consultant, i.e. the action
research paradigm (Gummesson, 2000).
Due to their interactive nature, face-to-face interviews limit replication,
hence reliability, and are susceptible to self-confirmation bias. Not all invited
experts participated in the research, and some participants had limited time
available. The participants were volunteers with a personal and professional
interest in the topic. The participants in the case-studies were not neutral;
rather, they had a personal stake – skin in the game, direct responsibility for
achieving the project’s objectives.
Reliability is enhanced by using predefined questionnaires and standardized
data-collection tools, and by providing transparency to the data collection
and analysis process.
The interviews were structured in a standardized questionnaire, with open
questions to drive exploratory qualitative research, but also with fixed-
choice Likert-type and yes/no questions to increase reliability, to allow for
comparison and limited quantitative data analysis. As the topics are new and
potentially unfamiliar, the evaluation scales did not have a midpoint, in order to avoid any potential misuse of such midpoint e.g. as a safe point, for non-
answers or neutral answers (Chyung, Roberts, Swanson, & Hankinson,
2017). During the open questions, stronger importance was placed on the
negative rather than on the positive feedback.
Participants had open access for reviewing the collected information,
including access to video recordings and data.
Chapter IX.
Conclusions and recommendations
177
This section presented a discussion on the reliability and validity of this
research, and provided transparence regarding possible limitations that
might affect the results of the research.
While we acknowledge that a series of limitations apply, a corresponding set
of measures were taken for enhancing reliability, construct, internal, and
external validity. These were discussed in specific sub-sections above. These
measures refer both to the individual sub-projects, as well as to the overall
methodology and the integrated research project.
We trust that these measures provide an acceptable degree of confidence in
the validity and reliability of the research, and in the generalizability of the
results within the IT project management domain.
IX.6. Recommendations and future directions of research
The thesis aims to constitute a building block in the study and management
of complex IT engineering projects, and to contribute to future directions of
research in this area.
This section presents research questions that have already been proposed by
the literature review, as well as research questions derived from the current
research project (Hall N. G., 2014).
The results of this project support the conclusion that complexity can be
managed more effectively by deploying traditional project management
tools such as risk management, stakeholder and communication
management, agile development, program management. Additional research
could focus on:
• Developing further methods and tools for the management of
complex IT projects, targeted on areas such as communication,
stakeholder management, managing project objectives, scope, and
requirements.
• Identification of other IT project management practice areas most
impacted by complexity, through surveys, case-study analysis, and
interviews.
Managing Positive and Negative Complexity:
Design and Validation of an IT Project Complexity Management Framework
178
The results suggest that specialized complexity management tools such as
those proposed by the current project can contribute to taming complex
high-risk IT projects; also, that such tools are not appropriate in the case of
small and/or simple projects. Further research could be conducted for a
definitive conclusion on the benefits of such specialized tools, and their role in
supporting risk identification and management, and better prioritization and
planning of projects and resources in complex IT project environments. Also,
further research could investigate:
• the relation between complexity, risk, and vulnerability, and the
potential practical use of these 3 knowledge areas combined.
• the relationship between project complexity sub-systems, such as
product, process, market, and organization.
By adopting a systematic and rigorous approach to complexity management,
project managers can better understand and manage IT projects, mitigate the
negative effects of complexity, reduce project risk, and support overall
project success. Further research could investigate the balance between
personal skills, training and experience, vs. the application of a structured
process, in managing complex projects successfully.
This thesis proposed a structured IT Project Complexity Management (IT-
PCM) framework, with processes, inputs, outputs, and an inventory of tools
and techniques. As this inventory cannot be exhaustive nor definitive, further
research could support updating and enriching the inventory of methods and
tools proposed in the framework, both with project management tools, as well
as specific IT management tools.
Bibliography
179
Bibliography
Albrecht, A. J. (1979). Measuring application development productivity.
Proceedings of the Joint SHARE, GUIDE, and IBM Application
Development Symposium (pp. 83–92). Monterey, California: IBM
Corporation.
Allen, M., & Sites, R. (2012). Leaving ADDIE for SAM: An agile model for
developing the best learning experiences. American Society for
Training & Development.
Ameen, M., & Jacob, M. (2009). Complexity in projects. A study of practitioners’
understanding of complexity in relation to existing theoretical models.
Umea School of Business, Sweden.
Ammeter, A. P., & Dukerich, J. M. (2002). Leadership, team building, and team
member characteristics in high performance project teams. Engineering Management Journal, 14(4), 3-10.
Aristotle. (n.d.). Metaphysics.
Artto, K., & Kujala, J. (2008). Project business as a research field. International
Journal of Managing Projects in Business, 1(4), 469-497. doi:
10.1108/17538370810906219
Ashby, R. (1961). An Introduction to Cybernetics. London: Chapman & Hall.
Atkinson, R. (1999). Project management: cost, time and quality, two best
guesses and a phenomenon, its time to accept other success criteria.
International Journal of Project Management, 17(6), 337-342.
doi:10.1016/S0263-7863(98)00069-6
Atkinson, R., Crawford, L., & Ward, S. (2006). Fundamental uncertainties in
projects and the scope of project management. International Journal
of Project Management, 24(8), 687–698.
Australian Government, Department of Defence. (2012). Defence capability
plan - public version. (C. D. (DMO), Ed.) Retrieved May 19, 2019, from
Australian Government Department of Defence:
http://www.defence.gov.au/publications/docs/CapabilityPlan2012
Baccarini, D. (1996). The concept of project complexity, a review.
International Journal of Project Management, 14(4), 201-204.
doi:10.1016/0263-7863(95)00093-3
Managing Positive and Negative Complexity:
Design and Validation of an IT Project Complexity Management Framework
180
Bakhshi, J., Ireland, V., & Gorod, A. (2016). Clarifying the project complexity
construct: Past, present and future. International Journal of Project
Management, 34, 1199–1213. doi:10.1016/j.ijproman.2016.06.002
Bansal, P., & Corley, K. (2012). Publishing in AMJ-Part 7: What's Different
about Qualitative Research? Academy of Management Journal, 55(3),
509-513. doi:10.5465/amj.2012.4003
Bar-Yam, Y. (2003). When Systems Engineering Fails --- Toward Complex
Systems Engineering. SMC'03 Conference Proceedings. 2003 IEEE
International Conference on Systems, Man and Cybernetics. Conference
Theme - System Security and Assurance.
Baulinks. (2018, Feb 5). The non-opening of the BER costs about 10 million
euros per month retrieved. Retrieved Oct 8, 2018, from Baulinks:
https://www.baulinks.de/btw/2018/0001.php4
Beer, S. (1972). Brain of the Firm. London: The Penguin Press.
Benbya, H., & McKelvey, B. (2006). Using coevolutionary and complexity
theories to improve IS alignment: a multi-level approach. Journal of
Information Technology, 21, 284-298.
Bertelsen, S. (2004). Construction management in a complexity perspective.
The 1st International SCRI Symposium. University of Salford, UK.
Bjorvatn, T., & Wald, A. (2018). Project complexity and team-level absorptive
capacity as drivers of project management performance.
International Journal of Project Management, 36(6), 876–888.
doi:10.1016/j.ijproman.2018.05.003
Boadway, R. (2006). Principles of Cost-Benefit Analysis. Public Policy Review,
2(1), 1-44. Retrieved from
https://warp.ndl.go.jp/info:ndljp/pid/9908001/www.mof.go.jp/en
glish/pri/publication/pp_review/ppr002/ppr002a.pdf
Boehm, B. (1981). Software Engineering Economics. Englewood Cliffs, NJ:
Prentice-Hall.
Boisot, M., & McKelvey, B. (2011). Complexity and organization-environment
relations: revisiting Ashby's law of requisite variety. In P. Allen, The
Sage Handbook of Complexity and Management (pp. 279-298). Sage
Publications.
Booch, G. (1982). Object-oriented design. Newsletter ACM SIGAda Ada Letters,
1(3), 64 - 76.
Booch, G., Rumbaugh, J., & Jacobson, I. (2005). The Unified Modeling Language
User Guide (2nd ed.). Addison-Wesley.
Bibliography
181
Bosch-Rekveldt, M., Bakker, H., & Hertogh, M. (2018). Comparing project
complexity across different industry sectors. Complexity.
doi:10.1155/2018/3246508
Bosch-Rekveldt, M., Jongkind, Y., Mooi, H., Bakker, H., & Verbraeck, A. (2011).
Grasping project complexity in large engineering projects: the TOE
(Technical, Organizational and Environmental) framework.
International Journal of Project Management, 29, 728–739.
Botchkarev, A., & Finnigan, P. (2015). Complexity in the Context of
Information Systems Project Management. Organisational Project
Management, 2(1), 15-34.
Boyd, J. (2018). A Discourse on Winning and Losing. Maxwell AFB, Alabama:
Air University Press.
Browning, T. R. (2001). Applying the Design Structure Matrix to System
Decomposition and Integration Problems: A Review and New
Directions. IEEE Transactions on Engineering Management, 48(3),
292–306.
Browning, T. R. (2019). Planning, Tracking, and Reducing a Complex Project’s
Value at Risk. Project Management Journal, 50(1), 71–85.
Buntinx, I., Crompvoets, J., Ho, S., Timm, C., & Wayumba, G. (2018). EU H2020
its4land project reportEU H2020 its4land project report. D7.1
Governance and capacity development. Retrieved Oct. 11, 2021, from
https://lirias.kuleuven.be/retrieve/527519
Calinescu, A., Efstathiou, J., Schirn, J., & Bermejo, J. (1998). Applying and
assessing two methods for measuring complexity in manufacturing.
Journal of the Operational Research Society(49), 723–733.
Cao, Q., Gu, V., & Thompson, M. (2012). Using complexity measures to
evaluate software development projects: A nonparametric approach.
The Engineering Economist, 57(4).
doi:10.1080/0013791X.2012.729878
Castejón-Limas, M., Ordieres-Meré, J., González-Marcos, A., & González-
Castro, V. (2010). Effort estimates through project complexity. Annals
of Operations Research, 186, 395–406. doi:10.1007/s10479-010-
0776-0
Chapman, R. J. (2016). A framework for examining the dimensions and
characteristics of complexity inherent within rail megaprojects.
International Journal of Project Management, 34, 937–956.
Managing Positive and Negative Complexity:
Design and Validation of an IT Project Complexity Management Framework
182
Chyung, S. Y., Roberts, K., Swanson, I., & Hankinson, A. (2017). Evidence‐
Based Survey Design: The Use of a Midpoint on the Likert Scale.
Performance Improvement, 56(10), 15-23. doi:10.1002/pfi.21727
Cicmil, S., Williams, T., Thomas, J., & Hodgson, D. (2006). Rethinking Project
Management: Researching the actuality of projects. International
Journal of Project Management, 24(8), 675–686.
CIS. (2021). CIS Controls Version 8. Center for Internet Security. Retrieved
from https://www.cisecurity.org/controls/v8/
Cole, B. (2015, April). IT project management. Retrieved Oct 2, 2021, from
TechTarget: https://searchcio.techtarget.com/definition/IT-
project-management
College of Complex Project Managers And Defence Materiel Organisation.
(2006). Competency Standard for Complex Project Managers (Version
2.0 ed.).
Conway, M. (1968). How Do Committees Invent? Datamation, 14, 28–31.
Cooke-Davies, T., Cicmil, S., Crawford, L., & Richardson, K. (2007). We’re not
in Kansas anymore, Toto: Mapping the strange landscape of
complexity theory, and its relationship to project management.
Project Management Journal, 38(2), 50-61.
Crawford, L., Morris, P., Thomas, J., & Winter, M. (2006). Practitioner
development: From trained technicians to reflective practitioners.
International Journal of Project Management, 24, 722–733.
Crompvoets, J., & Vanschoenwinkel, J. (2020). Strong Governance Structure.
Terra Mosana. Retrieved Oct. 10, 2021, from
https://lirias.kuleuven.be/retrieve/600897
Daniel, P. A., & Daniel, C. (2018). Complexity, uncertainty and mental models:
From a paradigm of regulation to a paradigm of emergence in project
management. International Journal of Project Management, 36(1),
184–197. doi:10.1016/j.ijproman.2017.07.004
Dao, B. P. (2016). Exploring and measuring project complexity. Texas A&M
University.
Dao, B., Kermanshachia, S., Shaneb, J., & Anderson, S. (2016). Project
complexity assessment and management tool. International
Conference on Sustainable Design, Engineering and Construction. 145,
pp. 491 – 496. Procedia Engineering.
Bibliography
183
Davies, A., Dodgson, M., Gann, D., & Macaulay, S. (2017). Five Rules for
Managing Large, Complex Projects. MIT Sloan Management Review,
59(1), 73-78.
De Haes, S., Van Grembergen, W., Joshi, A., & Huygh, T. (2020). Enterprise
Governance of Information Technology: Achieving Alignment and
Value in Digital Organizations. Cham, Switzerland: Springer Nature
Switzerland AG.
Defillippi, R., & Sydow, J. (2016). Project Networks: Governance Choices and
Paradoxical Tensions. Project Management Journal, 47(5), 1-12.
doi:10.1177/875697281604700502
Delligatti, L. (2013). SysML Distilled: A Brief Guide to the Systems Modeling
Language. Boston, MA: Addison-Wesley Professional.
Dionne, G. (2013). Risk Management: History, Definition, and Critique. Risk
Management and Insurance Review, 16(2), 147-166.
doi:10.1111/rmir.12016
ECB. (2009). Annual Report. Frankfurt: European Central Bank. Retrieved
Oct. 11, 2021, from
https://www.ecb.europa.eu/pub/pdf/annrep/ar2009en.pdf
Edmonds, B. (1999). Syntactic measures of complexity - Thesis of the
University of Manchester for the degree of doctor of philosophy in the
faculty of arts. Academic Press.
Ehrlenspiel, K. (1995). Integrierte Produktentwicklung: Methoden fur
Prozessorganisation, Produkterstellung und Konstruktion. Munchen:
Carl Hanser Verlag.
Ekambaram, A., Johansen, A., Jermstad, O., & Økland, A. (2010). Opportunities
in Projects and Innovative Thinking. Proceedings of the 5th European
Conference on Innovation and Entrepreneurship. Reading: Academic
Conferences International Limited.
Elbanna, A. (2010). Rethinking IS project boundaries in practice: A multiple-
projects perspective. The Journal of Strategic Information Systems,
19(1), 39-51. doi:10.1016/j.jsis.2010.02.005
EP-EC. (2014). REGULATION (EU) No 536/2014 OF THE EUROPEAN
PARLIAMENT AND OF THE COUNCIL. European Parliament, European
Council. Retrieved Oct 15, 2021, from
https://ec.europa.eu/health/sites/default/files/files/eudralex/vol-
1/reg_2014_536/reg_2014_536_en.pdf
Eppinger, S. D. (2002). Patterns of Product Development Interactions.
Managing Positive and Negative Complexity:
Design and Validation of an IT Project Complexity Management Framework
184
Eppinger, S. D., & Browning, T. R. (2012). Design Structure Matrix Methods
and Applications. Cambridge, MA: MIT Press .
Eriksson, M., Lillieskoeld, J., Jonsson, N., & Novosel, D. (2002). How to manage
complex, multinational R&D projects successfully. Engineering
Management Journal, 14(2), 53-60.
Euclid. (n.d.). Elements.
Euronews. (2020, Nov. 2).
https://www.euronews.com/2020/10/31/berlin-airport-opens-
10-years-late-and-three-times-over-budget. Euronews. Retrieved
Jan. 24, 2021, from
https://www.euronews.com/2020/10/31/berlin-airport-opens-
10-years-late-and-three-times-over-budget
European Commission. (2018). PM2 Project Management Methodology Guide
3.0. Brussels, Luxembourg: Publications Office of the European
Union. doi:10.2799/755246
European Commission. (2021). Proposal for a REGULATION OF THE
EUROPEAN PARLIAMENT AND OF THE COUNCIL LAYING DOWN
HARMONISED RULES ON ARTIFICIAL INTELLIGENCE (ARTIFICIAL
INTELLIGENCE ACT) AND AMENDING CERTAIN UNION LEGISLATIVE
ACTS COM/2021/206. European Commission. Retrieved Oct 15, 2021,
from https://eur-lex.europa.eu/legal-
content/EN/TXT/?uri=CELEX%3A52021PC0206
European Commission. (2021b). Horizon Europe - Work Programme 2021-
2022. 13. General Annexes (European Commission Decision
C(2021)1940 of 31 March 2021). European Commission. Retrieved Sep. 26, 2021, from https://ec.europa.eu/info/funding-
tenders/opportunities/docs/2021-2027/horizon/wp-call/2021-
2022/wp-13-general-annexes_horizon-2021-2022_en.pdf
European Court of Auditors. (2014). Lessons from the European Commission’s
development of the second generation Schengen Information System
(SIS II). European Union. Luxembourg: European Court of Auditors.
doi:10.2865/8113
European Innovation Council. (2021). Pathfinder challenge: Awareness inside
- Challenger guide. European Innovation Council - European
Commission. Retrieved Aug 15, 2021, from
https://eic.ec.europa.eu/eic-funding-opportunities/calls-
proposals/eic-pathfinder-challenge-awareness-inside_en
Bibliography
185
Floricel, S., Michel, J. L., & Piperca, S. (2016, Oct). Complexity, uncertainty-
reduction strategies, and project performance. International Journal
of Project Management, 34(7), 1360-1383.
doi:10.1016/j.ijproman.2015.11.007
Flyvbjerg, B. (2017). The Oxford Handbook of Megaproject Management.
Oxford University Press. Retrieved Oct. 10, 2021, from
https://www.oxfordhandbooks.com/view/10.1093/oxfordhb/978
0198732242.001.0001/oxfordhb-9780198732242
Flyvbjerg, B., & Budzier, A. (2011, Sep). Why Your IT Project May Be Riskier
Than You Think. Harvard Business Review.
doi:10.2139/ssrn.2229735
Gabriels, K. (2021). Conscientious AI. Machines Learning Morals. Brussels:
VUBpress.
GAPPS. (2007). A Framework for Performance Based Competency Standards
for Global Level 1 and 2 Project Managers. Sydney: Global Alliance for
Project Performance Standards. Retrieved 2020, from
https://globalpmstandards.org/wp-
content/uploads/2014/12/GAPPS_Project_Manager_v1.1150411_A
4.pdf
Genelot, D. (2001). Manager dans la complexité. Réflexions à l’usage des
dirigeants. Paris: Insep Consulting.
Geraldi, J. G. (2009). What complexity assessments can tell us about projects:
dialogue between conception and perception. Technology Analysis &
Strategic Management, 665-678.
Geraldi, J., & Adlbrecht, G. (2007). On faith, fact and interaction in projects. Project Management Journal, 38(1), 32-43.
Geraldi, J., Maylor, H., & Williams, T. (2011). Now, let's make it really complex
(complicated): A systematic review of the complexities of projects.
International Journal of Operations & Production Management, 31(9),
966-990. doi:10.1108/01443571111165848
Gibbert, M., & Ruigrok, W. (2010). The "What" and "How" of Case Study Rigor:
Three Strategies Based on Published Work. Organizational Research
Methods, 13(4), 710–737. doi:10.1177/1094428109351319
Gibbert, M., & Ruigrok, W. (2010b, March 4). Organizational research
methods. doi:10.1177/1094428109351319
Managing Positive and Negative Complexity:
Design and Validation of an IT Project Complexity Management Framework
186
Gilchrist, A., Burton-Jones, A., & Green, P. (2018). The process of social
alignment and misalignment within a complex IT project.
International Journal of Project Management,, 36(6), 845-860.
Giles, S. (2018). The New Science of Radical Innovation: The Six Competencies
Leaders Need to Win in a Complex World. Dallas, TX: BenBella Books.
Głodziński, E. (2019). Performance measurement of complex project:
framework. International Journal of Information Systems and Project
Management, 7(2), 21-34.
Godfrey, S. (2004). What is CMMI? NASA. Retrieved Oct. 3, 2021, from
https://ses.gsfc.nasa.gov/ses_data_2004/040601_Godfrey.ppt
Goodman, R. (2005). The ascent of risk: risk and the Guide to the project
management body of knowledge (PMBOK guide), 1987-1996-2000-
2004. PMI Global Congress 2005 - Asia Pacific Proceedings. Singapore:
Project Management Institute.
Grandjean, M. (2014). Source of the cover illustration: Social Network
Analysis Visualization. Creative Commons.
https://commons.wikimedia.org/wiki/File:Social_Network_Analysi
s_Visualization.png, in ”La connaissance est un réseau”. Les Cahiers
du Numérique, 10(3), 37-54. doi:10.3166/LCN.10.3.37-54
Guba, E. G., & Lincoln, Y. S. (1994). Competing Paradigms in Qualitative
Research. In N. K. Denzin, & Y. S. Lincoln, Handbook of Qualitative
Research (pp. 105–118). Thousand Oaks: Sage Publications.
Gummesson, E. (2000). Qualitative Methods in Management Research.
London: Sage.
Hall, N. (2012, June). Project management: Recent developments and
research opportunities. Journal of Systems Science and Systems
Engineering, 21(2), 129-143. doi:10.1007/s11518-012-5190-5
Hall, N. G. (2014). An agenda for project management and scheduling
research. 14th International Conference on Project Management and
Scheduling. Munich, Germany.
Hass, K. B. (2008a). Introducing the New Project Complexity Model. Retrieved
Oct 22, 2011, from Project Management Times:
http://www.projecttimes.com/articles/introducing-the-new-
project-complexity-model.-part-i.html
Hass, K. B. (2008b). Managing Complex Projects: A New Model. Vienna, VA,
USA: Management Concepts, Inc.
Bibliography
187
He, Q., Luo, L., Hu, Y., & Chan, A. P. (2015). Measuring the complexity of mega
construction projects in China - A fuzzy analytic network process
analysis. International Journal of Project Management, 33, 549–563.
Héder, M. (2017). From NASA to EU: the evolution of the TRL scale in Public
Sector Innovation. The Innovation Journal: The Public Sector
Innovation Journal, 22(2). Retrieved Sep. 26, 2021, from
https://www.innovation.cc/discussion-
papers/2017_22_2_3_heder_nasa-to-eu-trl-scale.pdf
Helms, M. M., & Nixon, J. (2010). Exploring SWOT analysis - where are we
now? A review of academic research from the last decade. Journal of
strategy and management, 3(3), 215-251.
doi:10.1108/17554251011064837
Hertogh, M., & Westerveld, E. (2010). Ph.D. thesis: Playing with Complexity -
Management and organisation of large infrastructure projects.
Hevner, A. R., March, S. T., Park, J., & Ram, S. (2004). Design Science in
Information Systems Research. MIS Quarterly, 28(1), 75-105.
doi:10.2307/25148625
Hitchins, D. K. (2007). Advanced Systems Thinking, Engineering, and
Management. John Wiley & Sons.
Huang, S.-J., & Han, W.-M. (2008). Exploring the relationship between
software project duration and risk exposure: A cluster analysis.
Information & Management, 45(3), 175-182.
ISACA. (2019). COBIT 2019 Framework: Introduction and Methodology.
ISACA.
ISO/IEC. (2013). ISO/IEC 27002:2013 Information technology — Security
techniques — Code of practice for information security controls.
International Organization for Standardization, International
Electrotechnical Commission. Retrieved from
https://www.iso.org/standard/54533.html
ISO/IEC. (2015). ISO 9000:2015 Quality management systems —
Fundamentals and vocabulary (4 ed.). International Organization for
Standardization, International Electrotechnical Commission.
Retrieved from https://www.iso.org/standard/45481.html
ISO/IEC. (2015). ISO/IEC 38500:2015 Information technology - Governance of
IT for the organization. International Organization for
Standardization/International Electrotechnical Commission.
Retrieved from https://www.iso.org/standard/62816.html
Managing Positive and Negative Complexity:
Design and Validation of an IT Project Complexity Management Framework
188
ISO/IEC. (2018). ISO/IEC 27000:2018 Information technology — Security
techniques — Information security management systems — Overview
and vocabulary (5 ed.). International Organization for
Standardization, International Electrotechnical Commission.
Retrieved from https://www.iso.org/standard/73906.html
ISO/IEC. (2018b). ISO/IEC 20000-1:2018 Information technology — Service
management — Part 1: Service management system requirements (3
ed.). International Organization for Standardization, International
Electrotechnical Commission. Retrieved from
https://www.iso.org/standard/70636.html
ISO/IEC/IEEE. (2013). ISO/IEC/IEEE 29119-1:2013 Software and systems
engineering — Software testing — Part 1: General concepts (1 ed.).
International Organization for Standardization/International
Electrotechnical Commission/Institute of Electrical and Electronics
Engineers. Retrieved Oct. 10, 2021, from
https://www.iso.org/standard/45142.html
ISTQB. (2012). ISTQB in a Nutshell. ISTQB Marketing Working Group.
Retrieved Oct 3, 2021, from
https://www.istqb.org/documents/ISTQB_201202_v10.pdf
Ivory, C., & Alderman, N. (2005). Can project management learn anything
from studies of failure in complex systems? Worst practices in project
management within the television production industry. Project
Management Journal, 36(3), 5–16.
Jaafari, A. (2003, Dec). Project management in the age of complexity and
change. Project Management Journal, 34(4), 47-57.
Janssens, G., Hoeijenbos, M., & Kusters, R. J. (2011). Complexity impact factors
on the integration process of ERP and non ERP systems: a basis for
an evaluation instrument. ICSOFT - 6th International Conference on
Software and Data Technologies, (pp. 17-22). Seville.
Jørgensen, M. (2007). Forecasting of software development work effort:
evidence on expert judgment and formal models. International
Journal of Forecasting, 23(3), 449.
Kailash, A. (2008a). Project complexity redux. Retrieved from
http://eight2late.wordpress.com/2008/07/02/project-complexity-
redux/
Bibliography
189
Kailash, A. (2008b). Rumours of a new project management paradigm.
Retrieved from
http://eight2late.wordpress.com/2007/11/03/rumours-of-a-new-
project-management-paradigm/#project_paradigm_complex_defns
Kardes, I., Ozturk, A., Cavusgil, S. T., & Cavusgil, E. (2013). Managing global
megaprojects: Complexity and risk management. International
Business Review, 22, 905–917.
Karsky, M. (1997). La dynamique des systèmes complexes ou la systémique de
l’ingénieur. Ecole Centrale Paris.
Keating, C., Padilla, J., & Adams, K. (2008). System of systems engineering
requirements: challenges and guidelines. Engineering Management
Journal, 20(4), 24-31.
Keating, C., Rogers, R., Unal, R., Dryer, D., Sousa-Poza, A., Safford, R., & Rabadi,
G. (2003). System of systems engineering. Engineering Management
Journal, 15(3), 36-45.
Kennedy, D. M., McComb, S. A., & Vozdolska, R. R. (2011). An investigation of
project complexity’s influence on team communication using Monte
Carlo simulation. Journal of Engineering and Technology
Management, 28(3), 109-127.
doi:10.1016/j.jengtecman.2011.03.001
Kim, D. H. (1999). Introduction to Systems Thinking. Retrieved 10 26, 2018,
from Pegasus Communications Inc.:
https://thesystemsthinker.com/wp-
content/uploads/2016/03/Introduction-to-Systems-Thinking-
IMS013Epk.pdf
Kiridena, S., & Sense, A. (2016). Profiling project complexity: insights from
complexity science and project management literature. Project
Management Journal, 47(6), 56 – 74.
Kitchenham, B. (2004). Procedures for Performing Systematic Reviews. Keele
University, Software Engineering Group, Department of Computer
Science. Keele, Staffs: Keele University.
Koffka, K. (1935). Principles of Gestalt Psychology.
Kurtz, C., & Snowden, D. J. (2003, February). The new dynamics of strategy:
Sense-making in a complex and complicated world. IBM Systems
Journal, 42(3), 462-483. doi:10.1147/sj.423.0462
Managing Positive and Negative Complexity:
Design and Validation of an IT Project Complexity Management Framework
190
Leach, L. P. (1999). Critical chain project management improves project
performance. Project Management Journal. Project Management
Journal, 30(2), 39–51.
Lessard, D., Sakhrani, V., & Miller, R. (2013). House of project complexity:
Understanding complexity in large infrastructure projects.
Engineering Project Organization Journal, 4(4), 170–192.
Levine, H. A. (1993). Doing the weebis and the obis: new dances for project
managers? PM Network, 7(4), 35–38. Retrieved from
https://www.pmi.org/learning/library/concepts-work-risk-
organizational-breakdown-structures-3694
Levitt, H. M., Bamberg, M., Creswell, J. W., Frost, D. M., Josselson, R., & Suárez-
Orozco, C. (2018). Journal Article Reporting Standards for Qualitative
Primary, Qualitative Meta-Analytic, and Mixed Methods Research in
Psychology: The APA Publications and Communications Board Task
Force Report. The American Psychologist, 73(1), 26-46.
doi:10.1037/amp0000151
Liker, J., & Franz, J. (2011). The Toyota Way to Continuous Improvement:
Linking Strategy and Operational Excellence to Achieve Superior
Performance. McGraw-Hill Education.
Lindemann, U., Maurer, M., & Braun, T. (2009). Structural Complexity
Management: An Approach for the Field of Product Design. Berlin,
Heidelberg: Springer Berlin Heidelberg.
Locatelli, G., Mancini, M., & Romano, E. (2014). Systems Engineering to
improve the governance in complex project environments.
International Journal of Project Management, 32, 1395–1410.
Longstreet, D. H. (2012, Feb). Function Points Analysis training course.
Retrieved Mar 13, 2012, from Software Metrics:
http://www.softwaremetrics.com/Function%20Point%20Training
%20Booklet%20New.pdf
Lorenz, E. N. (1963, March). Deterministic Nonperiodic Flow. Journal of the
Atmospheric Sciences, 20(2), 130–141.
Lovallo, D., & Kahneman, D. (2003). Delusions of Success: How Optimism
Undermines Executives' Decisions. Harvard Business Review, 81(7),
56-117.
Bibliography
191
Lu, Y., Luo, L., Wang, H., Le, Y., & Shi, Q. (2015). Measurement model of project
complexity for large-scale projects from task and organization
perspective. International Journal of Project Management, 33, 610–
622.
Marle, F., & Gidel, T. (2014). Assisting project risk management method
selection. International Journal of Project Organisation and
Management, 6(3), 254-282. doi:10.1504/IJPOM.2014.065255
Marle, F., & Vidal, L.-A. (2016). Managing Complex, High Risk Projects - A Guide
to Basic and Advanced Project Management. London: Springer-Verlag.
Maurer, M. (2007). Structural Awareness in Complex Product Design.
Lehrstuhl Fur Produktentwicklung. München: Dr. Hut.
Maurer, M. (2017). Complexity Management in Engineering Design – a Primer.
Berlin, Heidelberg: Springer Berlin Heidelberg. doi:doi:10.1007/978-
3-662-53448-9
Maylor, H., Turner, N., & Murray-Webster, R. (2013). How hard can it be?:
Actively managing complexity in technology projects. Research-
Technology Management, 56(4), 45-51.
McComb, S., Green, S., & Compton, W. (2007). Team flexibility’s relationship
to staffing and performance in complex projects: an empirical
analysis. Journal of Engineering Technology Management(24), 293–
313.
McConnell, S. (2006). Software estimation: demystifying the black art
(developer best practices). Redmond, Washington: Microsoft Press.
McKeen, J. D., Guimaraes, T., & Wetherbe, J. C. (1994, Dec). The relationship
between user participation and user satisfaction: an investigation of
four contingency factors. MIS Quarterly, 18(4), 427-451.
McKelvey, B., & Boisot, M. (2009). Redefining strategic foresight: ‘Fast’ and
‘far’ sight via complexity science. In L. Costanzo, & R. MacKay,
Handbook of Research on Strategy and Foresight (pp. 15–47).
Cheltenham, UK: Elgar.
Merriam, S. B. (2009). Qualitative research: A guide to design and
implementation. San Francisco, CA: Wiley.
Moe, N. B., Dingsøyr, T., & Rolland, K. (2018). To schedule or not to schedule?
An investigation of meetings as an inter-team coordination
mechanism in large-scale agile software development. International
Journal of Information Systems and Project Management, 6(3), 45-59.
doi:10.12821/ijispm060303
Managing Positive and Negative Complexity:
Design and Validation of an IT Project Complexity Management Framework
192
Mohindra, T., & Srivastava, M. (2019). Comparative Analysis of Project
Management Frameworks and Proposition for Project Driven
Organizations. PM World Journal, VIII(VIII). Retrieved from
https://pmworldlibrary.net/wp-
content/uploads/2019/09/pmwj85-Sep2019-Mohindra-
Srivastava-comparative-analysis-of-project-management-
frameworks.pdf
Moll, J. v., Jacobs, J., Kusters, R. J., & Trienekens, J. J. (2004). Defect detection
oriented lifecycle modeling in complex product development.
Information & Software Technology, 46(10), 665-675.
Montequín, V. R., Joaquín, V. B., Sonia María, C. F., & Francisco, O. F. (2018).
Exploring project complexity through project failure factors:
Analysis of cluster patterns using self-organizing maps. Complexity,
17.
Moor, J. H. (2006). The nature, importance, and difficulty of machine ethics.
IEEE Intelligent Systems, 21(4), 18–21. doi:10.1109/MIS.2006.80
Morcov, S., Pintelon, L., & Kusters, R. J. (2020a). Definitions, characteristics
and measures of IT Project Complexity - a Systematic Literature
Review. International Journal of Information Systems and Project
Management, 8(2), 5-21. doi:10.12821/ijispm080201
Morcov, S., Pintelon, L., & Kusters, R. J. (2020b). IT Project Complexity
Management Based on Sources and Effects: Positive, Appropriate and
Negative. Proceedings of the Romanian Academy - Series A, 21(4), 329-
336. Retrieved from
https://acad.ro/sectii2002/proceedings/doc2020-4/05-Morcov.pdf
Morcov, S., Pintelon, L., & Kusters, R. J. (2021a). A Framework for IT Project
Complexity Management. IADIS IS 2021 : 14th IADIS International
Conference Information Systems (pp. 61-68). Virtual: IADIS Press.
Retrieved from https://www.is-conf.org/wp-
content/uploads/2021/03/01_202103L008.pdf
Morcov, S., Pintelon, L., & Kusters, R. J. (2021b). A Practical Assessment of
Modern IT Project Complexity Management Tools: Taming Positive,
Appropriate and Negative Complexity. International Journal of
Information Technology Project Management, 12(3), 90-108.
doi:10.4018/IJITPM.2021070106
Bibliography
193
Morel, B., & Ramanujam, R. (1999). Through the looking glass of complexity:
the dynamics of organizations as adaptive and evolving systems.
Organization, 10(3), 278-293.
Mulenburg, J. (2008). What Does Complexity Have to Do With It? Complexity
and the Management of Projects. NASA Project Management
Challenge Conference. Daytona Beach, Florida. Retrieved Nov 2012,
from http://www.slideshare.net/NASAPMC/geraldmulenburg
Nassar, K., & Hegab, M. (2006). Developing a complexity measure for
schedules. Journal of Construction Engineering and Management,
132(6), 554–561. doi:https://doi.org/10.1061/(ASCE)0733-
9364(2006)132:6(554)
Nelson, R. R. (2007). IT project management: Infamous failure, classic
mistakes, and best practices. MIS Quarterly Executive, 6(2), 67–78.
Nyarirangwe, M., & Babatunde, O. K. (2019). Megaproject complexity
attributes and competences:. International Journal of Information
Systems and Project Management, 7(4), 77-99.
Ohlinger, M., Sharkey, K., & Cai, S. (2017, Aug 6). High Availability and the
Microsoft Operations Framework. Retrieved Oct 3, 2021, from
Microsoft Docs: https://docs.microsoft.com/en-
us/biztalk/core/high-availability-and-the-microsoft-operations-
framework
Padalkar, M., & Gopinath, S. (2016). Are complexity and uncertainty distinct
concepts in project management? A taxonomical examination from
literature. International Journal of Project Management, 34, 688–700.
Pajares, J., & López-Paredes, A. (2011). An extension of the EVM analysis for project monitoring: The cost control index and the schedule control
index. International Journal of Project Management, 29(5), 615–621.
Parkinson, C. N. (1958). Parkinson's law: or, The pursuit of progress. London:
John Murray.
Patanakul, P. (2014). Managing large-scale IS/IT projects in the public sector:
Problems and causes leading to poor performance. The Journal of
High Technology Management Research, 25(1), 21–35.
doi:10.1016/j.hitech.2013.12.004
Paul, C. L. (2008). A Modified Delphi Approach to a New Card Sorting
Methodology. Journal of Usability Studies, 4(1), 7-30.
Managing Positive and Negative Complexity:
Design and Validation of an IT Project Complexity Management Framework
194
Peffers, K., Tuunanen, T., Rothenberger, M., & Chatterjee, S. (2007). A design
science research methodology for information systems research.
Journal of Management Information Systems, 45-77.
Pich, M., Loch, C., & De Meyer, A. (2002, Aug.). On Uncertainty, Ambiguity, and
Complexity in Project Management. Management Science, 48(8),
1008-1023.
Pinto, J. K., & Winch, G. (2016). The unsettling of “settled science:” The past
and future of the management of projects. International Journal of
Project Management, 34, 237–245.
PMI. (1987). Project Management Body of Knowledge (PMBOK). Drexel Hill,
PA: Project Management Institute - PMI Standards Committee.
PMI. (1996). A Guide to the Project Management Body of Knowledge. Project
Management Institute, PMI Standards Committee.
PMI. (2013). Pulse of the Profession In-Depth Report: Navigating Complexity.
Retrieved from https://www.pmi.org/-
/media/pmi/documents/public/pdf/learning/thought-
leadership/pulse/navigating-complexity.pdf
PMI. (2014). Navigating Complexity: A Practice Guide. Newtown Square, PA:
Project Management Institute.
PMI. (2017). A Guide to the Project Management Body of Knowledge (PMBOK
Guide), 6th Ed. Pennsylvania: Project Management Institute.
Poveda-Bautista, R., Diego-Mas, J., & Leon-Medina, D. (2018). Measuring the
project management complexity: the case of information technology
projects. Complexity, 19.
Pressman, R. S. (2001). Software Engineering - A Practitioner's Approach. New
York: McGraw-Hill.
Qureshi, S. M., & Kang, C. (2015). Analysing the organizational factors of
project complexity using structural equation modelling.
International Journal of Project Management, 33, 165–176.
Remington, K., & Pollack, J. (2007). Tools for complex projects. London: Gower
Publishing Ltd.
Remington, K., Zolin, R., & Turner, R. (2009). A Model of Project Complexity:
Distinguishing dimensions of complexity from severity. The 9th
International Research Network of Project Management, (pp. 11–13).
Berlin.
Ribbers, P., & Schoo, K. (2002). Program Management and Complexity of ERP
Implementations. Engineering Management Journal, 14(2), 45-52.
Bibliography
195
Riis, J. O., & Pedersen, F. L. (2003). Managing organizational development
projects by paradoxes. Production Planning & Control, 14(4), 349–
360.
Roser, C. (2016, Apr 19). The Key to Lean – Plan, Do, Check, Act! Retrieved Dec
27, 2020, from allaboutlean.com:
https://www.allaboutlean.com/pdca/
Satzinger, J. W., Jackson, R. B., & Burd, S. (2007). Systems Analysis & Design In
A Changing World. Boston: Thomson Course Technology.
Sauer, C., & Willcocks, L. (2007). Unreasonable expectations - NHS IT, Greek
choruses and the games institutions play around mega-programmes.
Journal of Information Technology, 22(3), 195-201.
doi:10.1057/palgrave.jit.2000108
Saunders, M., Lewis, P., & Thornhill, A. (2009). Research Methods for Business
Students (Fifth Edition ed.). Pearson Education.
Schlindwein, S. L., & Ison, R. (2004). Human knowing and perceived
complexity: Implications for systems practice. Emergence:
Complexity & Organisation.
Schwaber, K., & Sutherland, J. (2020, Nov). The 2020 Scrum Guide. Retrieved
Dec 27, 2020, from ScrumGuides.org:
https://www.scrumguides.org/scrum-guide.html
Senescu, R., Aranda-Mena, G., & Haymaker, J. (2012). Relationships between
project complexity and communication. Journal of Management in
Engineering, 29(2), 183-197. doi:10.1061/(ASCE)ME.1943-
5479.0000121
Shafiei-Monfared, S., & Jenab, K. (2012). A novel approach for complexity
measure analysis in design projects. Journal of Engineering Design,
23(3), 185-194.
Sheffield, J., Sankaran, S., & Haslett, T. (2012). Systems thinking: Taming
complexity in project management. On the Horizon, 20(2), 126-136.
Shiff, L. (2021, Jun 14). Popular IT Service Management (ITSM) Frameworks.
Retrieved Oct 3, 2021, from BMC Blogs:
https://www.bmc.com/blogs/itsm-frameworks-popular/
Siau, K., & Wang, W. (2018). Ethical and Moral Issues with AI. Americas
Conference on Information Systems (AMCIS 2018). New Orleans, LA.
Siau, K., & Wang, W. (2020). Artificial Intelligence (AI) Ethics: Ethics of AI and
Ethical AI. Journal of Database Management, 31(2), 74-87.
doi:10.4018/JDM.2020040105
Managing Positive and Negative Complexity:
Design and Validation of an IT Project Complexity Management Framework
196
Simon, H. (1962). The Architecture of Complexity. Proceedings of the
American Philosophical Society, 106, pp. 467–482. Retrieved from
http://nicoz.net/images/ArchitectureOfComplexity.HSimon1962.p
df
Smuts, J. C. (1927). Holism and Evolution 2nd Edition. Macmillian and Co.
Snowden, D. J., & Boone, M. E. (2007, Nov.). A Leader’s Framework for
Decision Making. Harvard Business Review, 85(11), 68-76. Retrieved
Jan. 9, 2021, from https://hbr.org/2007/11/a-leaders-framework-
for-decision-making
Sohi, A. J., Hertogh, M., Bosch-Rekveldt, M., & Blom, R. (2016). Does Lean &
Agile Project Management Help Coping with Project Complexity?
Procedia - Social and Behavioral Sciences, 226, 252-259.
doi:10.1016/j.sbspro.2016.06.186
Spencer, D., & Warfel, T. (2004, Apr 7). Card Sorting: A Definitive Guide.
Retrieved Oct 25, 2020, from Boxes and Arrows.
Stacey, R. D. (1995). The science of complexity: An alternative perspective for
strategic change processes. Strategic Management Journal, 16(6),
477–495. doi:10.1002/smj.4250160606
Standish Group. (1994). The CHAOS Report.
Standish Group. (2014). The CHAOS Report.
Stonehouse, G., & Pemberton, J. (2002). Strategic planning in SMEs - some
empirical findings. Management Decision, 40(9), 853-861.
doi:10.1108/00251740210441072
Sulaiman, T., & Smits, H. (2007). Measuring Integrated Progress on Agile
Software Development Projects. Methods & Tools, 15(3), 2-9.
Retrieved from Methods & Tools:
http://www.methodsandtools.com/archive/archive.php?id=61
Sull, D., & Eisenhardt, K. M. (2012, Sep.). Simple Rules for a Complex World.
Harvard Business Review, 90(9). Retrieved from
https://hbr.org/2012/09/simple-rules-for-a-complex-world
Taleb, N. N. (2007). The Black Swan: The Impact of the Highly Improbable.
Random House.
Taleb, N. N. (2012). Antifragile: things that gain from disorder. New York:
Random House.
Taleb, N. N. (2018). Skin in the game : hidden asymmetries of daily life. London:
Penguin Books.
Bibliography
197
Taleb, N. N., Goldstein, D. G., & Spitznagel, M. W. (2009). The Six Mistakes
Executives Make in Risk Management. Harvard Business Review.
Tatikonda, M., & Rosenthal, S. (2000, Feb). Technology novelty, project
complexity, and product development project execution success: a
deeper look at task uncertainty in product innovation. IEEE
Transactions on Engineering Management, 47(1), 74-87.
Thamhain, H. (2013). Contemporary methods for evaluating complex project
proposals. Journal of Industrial Engineering International, 9:34.
doi:https://doi.org/10.1186/2251-712X-9-34
The Open Group. (2018). The TOGAF® Standard, Version 9.2 (9.2 ed.). The
Open Group.
Treasury Board of Canada Secretariat. (2015, Aug 24). Project Complexity and
Risk Assessment Tool. Retrieved May 19, 2019, from Government of
Canada: https://www.canada.ca/en/treasury-board-
secretariat/services/information-technology-project-
management/project-management/project-complexity-risk-
assessment-tool.html
Turner, J. R. (2006a). Towards a theory of project management: The nature
of the project. International Journal of Project Management, 24(4),
277-279. doi:10.1016/j.ijproman.2006.03.002
Turner, J. R. (2006b). Towards a theory of project management: The nature
of the project governance and project management. International
Journal of Project Management, 24, 93–95.
doi:10.1016/j.ijproman.2005.11.008
Turner, J. R. (2006c). Towards a theory of Project Management: The functions of Project Management. International Journal of Project
Management, 24(3), 187-189. doi:10.1016/j.ijproman.2006.03.001
Turner, J. R., & Cochrane, R. A. (1993). Goals-and-methods matrix: coping
with projects with ill defined goals and/or methods of achieving
them. International Journal of Project Management, 11(2), 93-102.
doi:10.1016/0263-7863(93)90017-H
Ugarte, E. (2015). Conquering Complexity. Helmsman Institute.
Ulrich, H., & Probst, G. J. (1988). Anleitung zum ganzheitlichen Denken und
Handeln, ein Brevier fur Führungskräfte. Bern, Haupt.
Vaaland, T., & Hakansson, H. (2003). Exploring interorganizational conflict in
complex projects. Industrial Marketing Management, 32, 127-138.
Managing Positive and Negative Complexity:
Design and Validation of an IT Project Complexity Management Framework
198
Vidal, L.-A. (2009). Thinking project management in the age of complexity.
Particular implications on project risk management (Ph.D. Thesis).
Paris: École centrale des arts et manufactures (École centrale Paris).
Vidal, L.-A., Marle, F., & Bocquet, J.-C. (2011). Measuring project complexity
using the Analytic Hierarchy Process. International Journal of Project
Management, 29(6), 718–727. doi:10.1016/j.ijproman.2010.07.005
Wallace, L., Keilb, M., & Rai, A. (2004, Dec). Understanding software project
risk: a cluster analysis. Information & Management, 42(1), 115–125.
Whitty, S. J., & Maylor, H. (2009). And then came Complex Project
Management (revised). International Journal of Project Management,
27(3), 304–310. doi:10.1016/j.ijproman.2008.03.004
Whyte, J., Stasis, A., & Lindkvist, C. (2016). Managing change in the delivery
of complex projects: Configuration management, asset information
and ‘big data’. International Journal of Project Management, 34(2),
339–351.
Wiener, N. (1948). Cybernetics: or Control and Communication in the Animal
and the Machine. New York: Technology Press.
Wieringa, R. J. (2014). Design Science Methodology for Information Systems
and Software Engineering. Berlin, Heidelberg: Springer Berlin
Heidelberg. doi:10.1007/978-3-662-43839-8
Williams, T. (2017). The Nature of Risk in Complex Projects. Project
Management Journal, 48(4), 55–66.
Williams, T. M. (1999). The need for new paradigms for complex projects.
International Journal of Project Management, 17(5), 269-273.
Williams, T. M. (2005, Nov). Assessing and moving on from the dominant
project management discourse in the light of Project Overruns. IEEE
Transactions on Engineering Management, 52(4), 497-508.
doi:10.1109/TEM.2005.856572
Wood, H., & Ashton, P. (2010). The factors of project complexity. TG62-
Special Track 18th CIB World Building Congress. Salford, United
Kingdom.
World Medical Association. (2013). Declaration of Helsinki: Ethical Principles
for Medical Research Involving Human Subjects.
doi:10.1001/jama.2013.281053
Xia, W., & Lee, G. (2005). Complexity of information systems development
projects: conceptualization and measurement development. Journal
of Management Information Systems, 22(1), 45-83.
Bibliography
199
Yin, R. (2008). Case Study Research: Design and Methods (Fourth Edition ed.,
Vol. Applied Social Research Methods Series Volume 5). Sage
Publications.
Yin, R. K. (2011). Qualitative research from start to finish. New York: The
Guilford Press.
Zhu, J., & Mostafavi, A. (2017). Discovering complexity and emergent
properties in project systems: A new approach to understanding
project performance. International Journal of Project Management,
35, 1-12.
Zhu, J., & Mostafavi, A. (2018). Performance Assessment in Complex
Engineering Projects Using a System-of-Systems Framework. IEEE
Systems Journal, 12(1), 262-273.
Zmud, R. W. (1980, Jun). Management of large software development efforts.
MIS Quarterly, 4(2), 45-55.

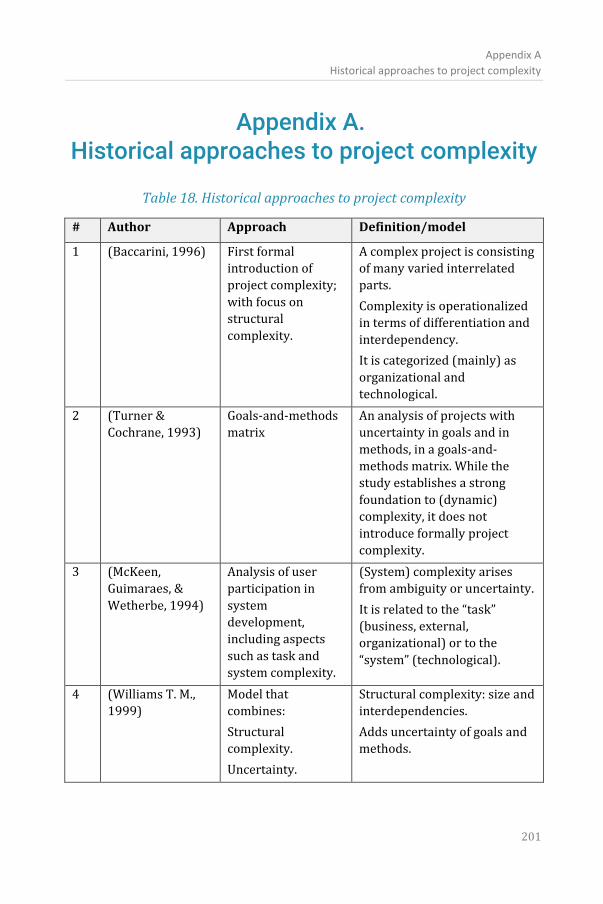
Appendix A
Historical approaches to project complexity
201
Appendix A. Historical approaches to project complexity
Table 18. Historical approaches to project complexity
# Author Approach Definition/model
1 (Baccarini, 1996) First formal
introduction of
project complexity;
with focus on
structural
complexity.
A complex project is consisting
of many varied interrelated
parts.
Complexity is operationalized
in terms of differentiation and
interdependency.
It is categorized (mainly) as
organizational and
technological.
2 (Turner &
Cochrane, 1993)
Goals-and-methods
matrix
An analysis of projects with
uncertainty in goals and in
methods, in a goals-and-
methods matrix. While the
study establishes a strong
foundation to (dynamic)
complexity, it does not
introduce formally project
complexity.
3 (McKeen,
Guimaraes, &
Wetherbe, 1994)
Analysis of user
participation in
system
development,
including aspects
such as task and
system complexity.
(System) complexity arises
from ambiguity or uncertainty.
It is related to the “task”
(business, external,
organizational) or to the
“system” (technological).
4 (Williams T. M.,
1999)
Model that
combines:
Structural
complexity.
Uncertainty.
Structural complexity: size and
interdependencies.
Adds uncertainty of goals and
methods.
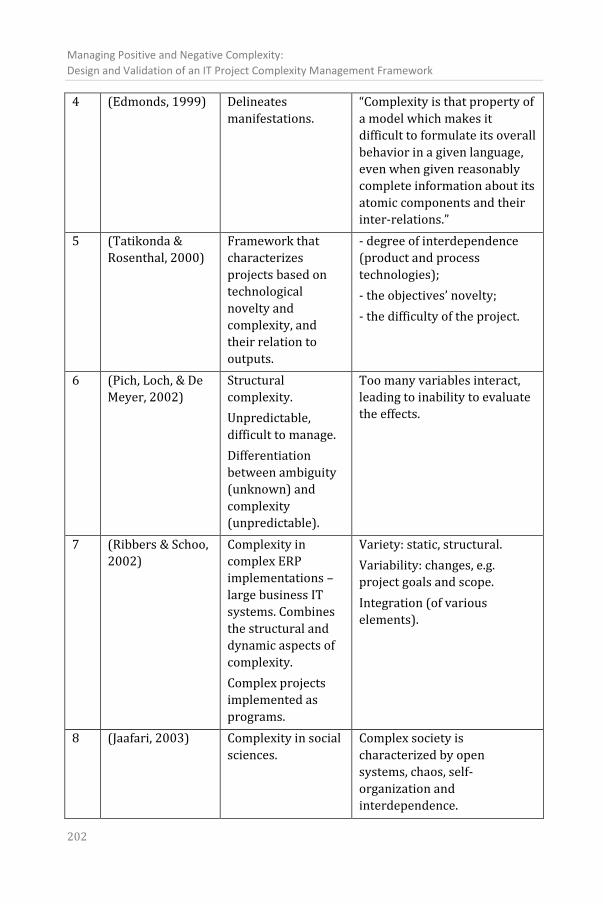
Managing Positive and Negative Complexity:
Design and Validation of an IT Project Complexity Management Framework
202
4 (Edmonds, 1999)
Delineates
manifestations.
“Complexity is that property of
a model which makes it
difficult to formulate its overall
behavior in a given language,
even when given reasonably
complete information about its
atomic components and their
inter-relations.”
5 (Tatikonda &
Rosenthal, 2000)
Framework that
characterizes
projects based on
technological
novelty and
complexity, and
their relation to
outputs.
- degree of interdependence
(product and process
technologies);
- the objectives’ novelty;
- the difficulty of the project.
6 (Pich, Loch, & De
Meyer, 2002)
Structural
complexity.
Unpredictable,
difficult to manage.
Differentiation
between ambiguity
(unknown) and
complexity
(unpredictable).
Too many variables interact,
leading to inability to evaluate
the effects.
7 (Ribbers & Schoo,
2002)
Complexity in
complex ERP
implementations –
large business IT
systems. Combines
the structural and
dynamic aspects of
complexity.
Complex projects
implemented as
programs.
Variety: static, structural.
Variability: changes, e.g.
project goals and scope.
Integration (of various
elements).
8 (Jaafari, 2003) Complexity in social
sciences.
Complex society is
characterized by open
systems, chaos, self-
organization and
interdependence.
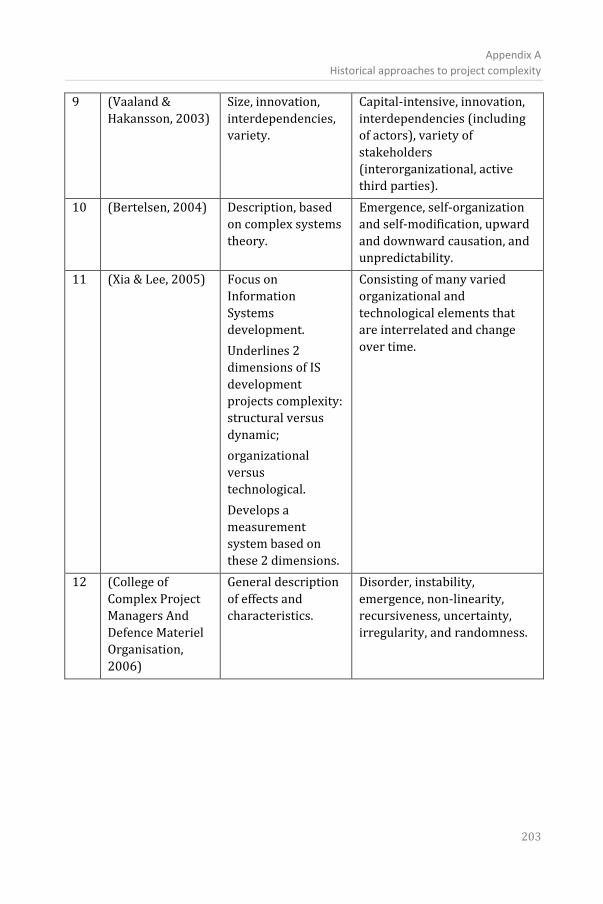
Appendix A
Historical approaches to project complexity
203
9 (Vaaland &
Hakansson, 2003)
Size, innovation,
interdependencies,
variety.
Capital-intensive, innovation,
interdependencies (including
of actors), variety of
stakeholders
(interorganizational, active
third parties).
10 (Bertelsen, 2004) Description, based
on complex systems
theory.
Emergence, self-organization
and self-modification, upward
and downward causation, and
unpredictability.
11 (Xia & Lee, 2005) Focus on
Information
Systems
development.
Underlines 2
dimensions of IS
development
projects complexity:
structural versus
dynamic;
organizational
versus
technological.
Develops a
measurement
system based on
these 2 dimensions.
Consisting of many varied
organizational and
technological elements that
are interrelated and change
over time.
12 (College of
Complex Project
Managers And
Defence Materiel
Organisation,
2006)
General description
of effects and
characteristics.
Disorder, instability,
emergence, non-linearity,
recursiveness, uncertainty,
irregularity, and randomness.
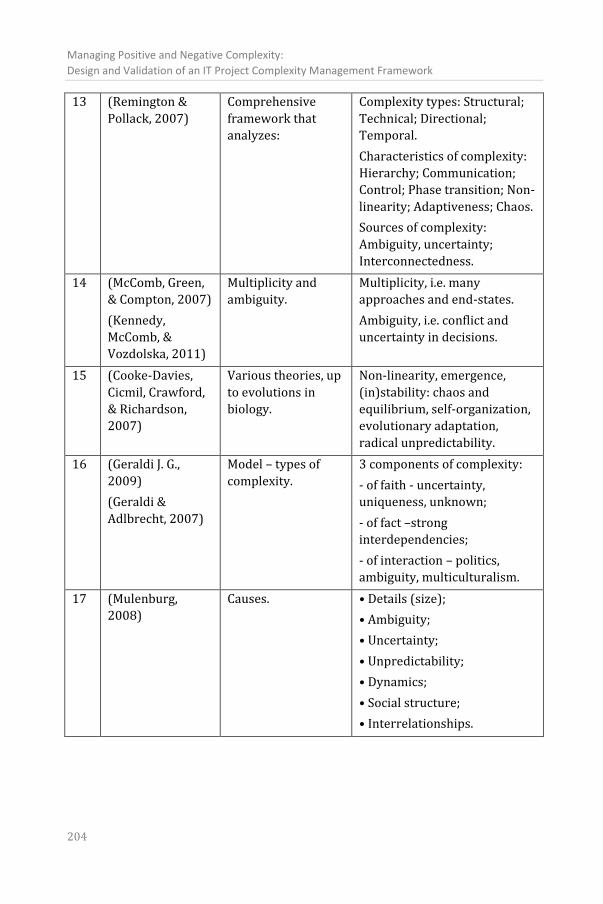
Managing Positive and Negative Complexity:
Design and Validation of an IT Project Complexity Management Framework
204
13 (Remington &
Pollack, 2007)
Comprehensive
framework that
analyzes:
Complexity types: Structural;
Technical; Directional;
Temporal.
Characteristics of complexity:
Hierarchy; Communication;
Control; Phase transition; Non-
linearity; Adaptiveness; Chaos.
Sources of complexity:
Ambiguity, uncertainty;
Interconnectedness.
14 (McComb, Green,
& Compton, 2007)
(Kennedy,
McComb, &
Vozdolska, 2011)
Multiplicity and
ambiguity.
Multiplicity, i.e. many
approaches and end-states.
Ambiguity, i.e. conflict and
uncertainty in decisions.
15 (Cooke-Davies,
Cicmil, Crawford,
& Richardson,
2007)
Various theories, up
to evolutions in
biology.
Non-linearity, emergence,
(in)stability: chaos and
equilibrium, self-organization,
evolutionary adaptation,
radical unpredictability.
16 (Geraldi J. G.,
2009)
(Geraldi &
Adlbrecht, 2007)
Model – types of
complexity.
3 components of complexity:
- of faith - uncertainty,
uniqueness, unknown;
- of fact –strong
interdependencies;
- of interaction – politics,
ambiguity, multiculturalism.
17 (Mulenburg,
2008)
Causes. • Details (size);
• Ambiguity;
• Uncertainty;
• Unpredictability;
• Dynamics;
• Social structure;
• Interrelationships.
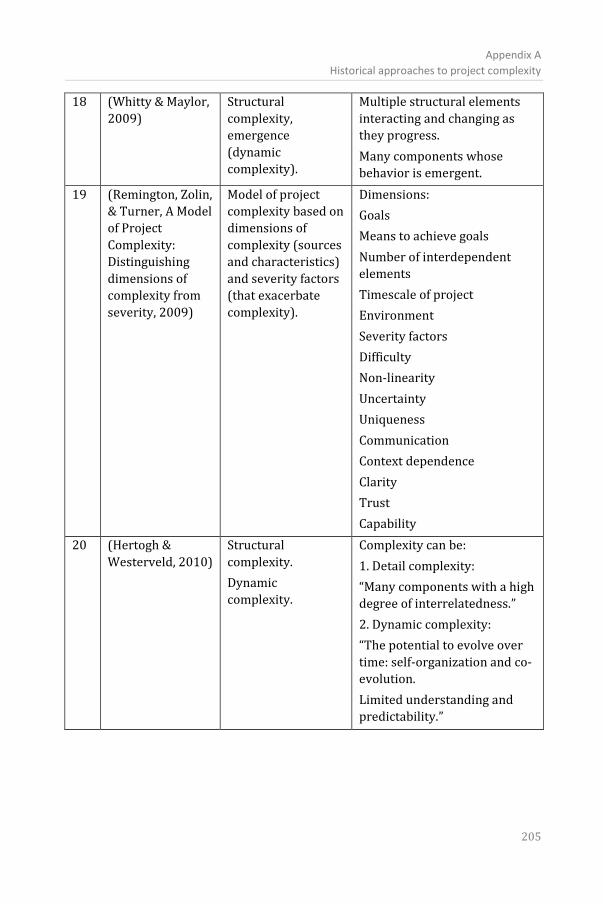
Appendix A
Historical approaches to project complexity
205
18 (Whitty & Maylor,
2009)
Structural
complexity,
emergence
(dynamic
complexity).
Multiple structural elements
interacting and changing as
they progress.
Many components whose
behavior is emergent.
19 (Remington, Zolin,
& Turner, A Model
of Project
Complexity:
Distinguishing
dimensions of
complexity from
severity, 2009)
Model of project
complexity based on
dimensions of
complexity (sources
and characteristics)
and severity factors
(that exacerbate
complexity).
Dimensions:
Goals
Means to achieve goals
Number of interdependent
elements
Timescale of project
Environment
Severity factors
Difficulty
Non-linearity
Uncertainty
Uniqueness
Communication
Context dependence
Clarity
Trust
Capability
20 (Hertogh &
Westerveld, 2010)
Structural
complexity.
Dynamic
complexity.
Complexity can be:
1. Detail complexity:
“Many components with a high
degree of interrelatedness.”
2. Dynamic complexity:
“The potential to evolve over
time: self-organization and co-
evolution.
Limited understanding and
predictability.”
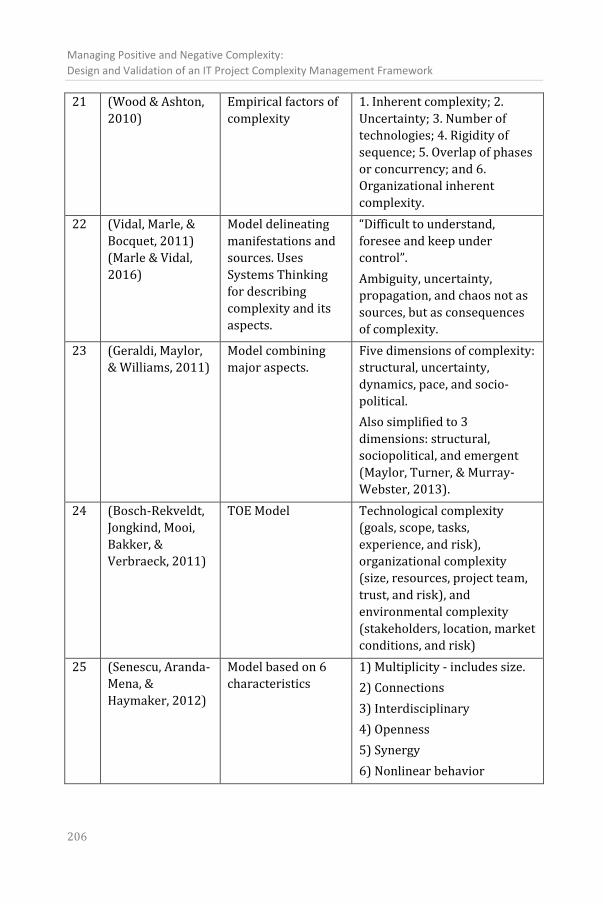
Managing Positive and Negative Complexity:
Design and Validation of an IT Project Complexity Management Framework
206
21 (Wood & Ashton,
2010)
Empirical factors of
complexity
1. Inherent complexity; 2.
Uncertainty; 3. Number of
technologies; 4. Rigidity of
sequence; 5. Overlap of phases
or concurrency; and 6.
Organizational inherent
complexity.
22 (Vidal, Marle, &
Bocquet, 2011)
(Marle & Vidal,
2016)
Model delineating
manifestations and
sources. Uses
Systems Thinking
for describing
complexity and its
aspects.
“Difficult to understand,
foresee and keep under
control”.
Ambiguity, uncertainty,
propagation, and chaos not as
sources, but as consequences
of complexity.
23 (Geraldi, Maylor,
& Williams, 2011)
Model combining
major aspects.
Five dimensions of complexity:
structural, uncertainty,
dynamics, pace, and socio-
political.
Also simplified to 3
dimensions: structural,
sociopolitical, and emergent
(Maylor, Turner, & Murray-
Webster, 2013).
24 (Bosch-Rekveldt,
Jongkind, Mooi,
Bakker, &
Verbraeck, 2011)
TOE Model Technological complexity
(goals, scope, tasks,
experience, and risk),
organizational complexity
(size, resources, project team,
trust, and risk), and
environmental complexity
(stakeholders, location, market
conditions, and risk)
25 (Senescu, Aranda-
Mena, &
Haymaker, 2012)
Model based on 6
characteristics
1) Multiplicity - includes size.
2) Connections
3) Interdisciplinary
4) Openness
5) Synergy
6) Nonlinear behavior
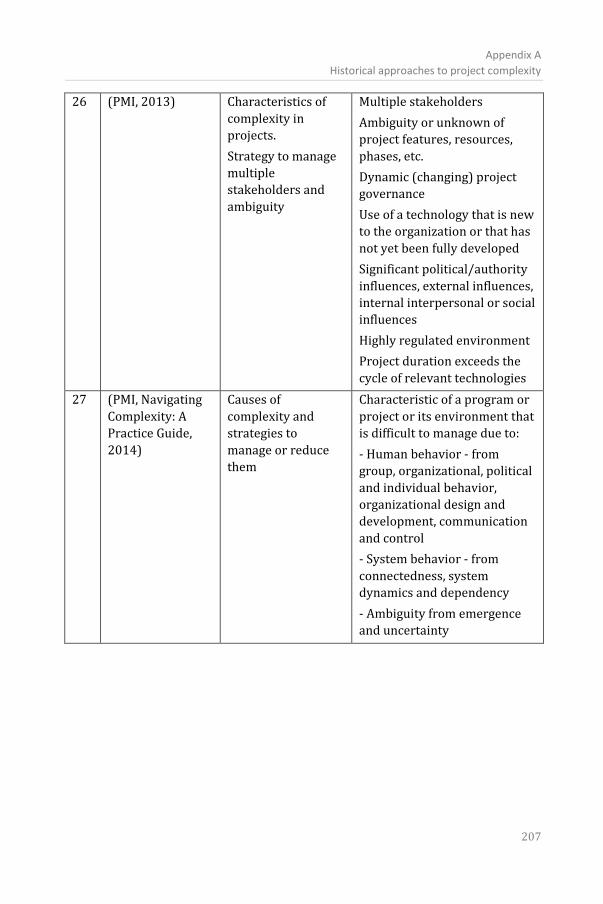
Appendix A
Historical approaches to project complexity
207
26 (PMI, 2013) Characteristics of
complexity in
projects.
Strategy to manage
multiple
stakeholders and
ambiguity
Multiple stakeholders
Ambiguity or unknown of
project features, resources,
phases, etc.
Dynamic (changing) project
governance
Use of a technology that is new
to the organization or that has
not yet been fully developed
Significant political/authority
influences, external influences,
internal interpersonal or social
influences
Highly regulated environment
Project duration exceeds the
cycle of relevant technologies
27 (PMI, Navigating
Complexity: A
Practice Guide,
2014)
Causes of
complexity and
strategies to
manage or reduce
them
Characteristic of a program or
project or its environment that
is difficult to manage due to:
- Human behavior - from
group, organizational, political
and individual behavior,
organizational design and
development, communication
and control
- System behavior - from
connectedness, system
dynamics and dependency
- Ambiguity from emergence
and uncertainty
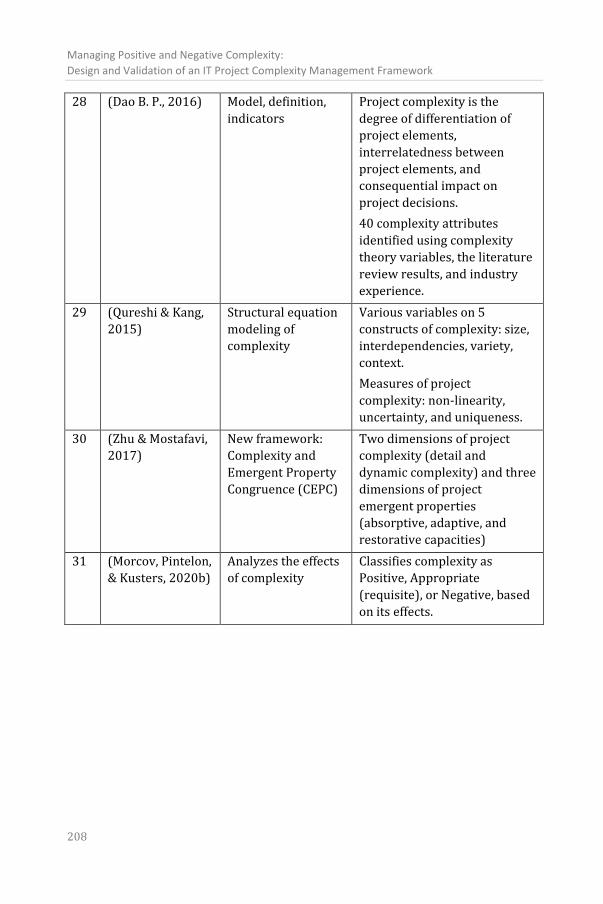
Managing Positive and Negative Complexity:
Design and Validation of an IT Project Complexity Management Framework
208
28 (Dao B. P., 2016) Model, definition,
indicators
Project complexity is the
degree of differentiation of
project elements,
interrelatedness between
project elements, and
consequential impact on
project decisions.
40 complexity attributes
identified using complexity
theory variables, the literature
review results, and industry
experience.
29 (Qureshi & Kang,
2015)
Structural equation
modeling of
complexity
Various variables on 5
constructs of complexity: size,
interdependencies, variety,
context.
Measures of project
complexity: non-linearity,
uncertainty, and uniqueness.
30 (Zhu & Mostafavi,
2017)
New framework:
Complexity and
Emergent Property
Congruence (CEPC)
Two dimensions of project
complexity (detail and
dynamic complexity) and three
dimensions of project
emergent properties
(absorptive, adaptive, and
restorative capacities)
31 (Morcov, Pintelon,
& Kusters, 2020b)
Analyzes the effects
of complexity
Classifies complexity as
Positive, Appropriate
(requisite), or Negative, based
on its effects.
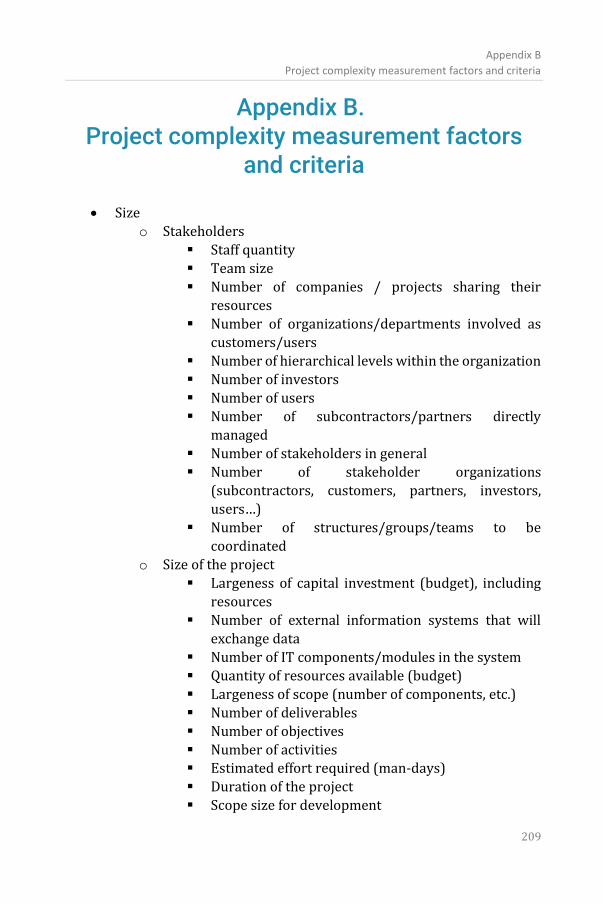
Appendix B
Project complexity measurement factors and criteria
209
Appendix B. Project complexity measurement factors
and criteria
• Size
o Stakeholders
▪ Staff quantity
▪ Team size
▪ Number of companies / projects sharing their
resources
▪ Number of organizations/departments involved as
customers/users
▪ Number of hierarchical levels within the organization
▪ Number of investors
▪ Number of users
▪ Number of subcontractors/partners directly
managed
▪ Number of stakeholders in general
▪ Number of stakeholder organizations
(subcontractors, customers, partners, investors,
users…)
▪ Number of structures/groups/teams to be
coordinated
o Size of the project
▪ Largeness of capital investment (budget), including
resources
▪ Number of external information systems that will
exchange data
▪ Number of IT components/modules in the system
▪ Quantity of resources available (budget)
▪ Largeness of scope (number of components, etc.)
▪ Number of deliverables
▪ Number of objectives
▪ Number of activities ▪ Estimated effort required (man-days)
▪ Duration of the project
▪ Scope size for development
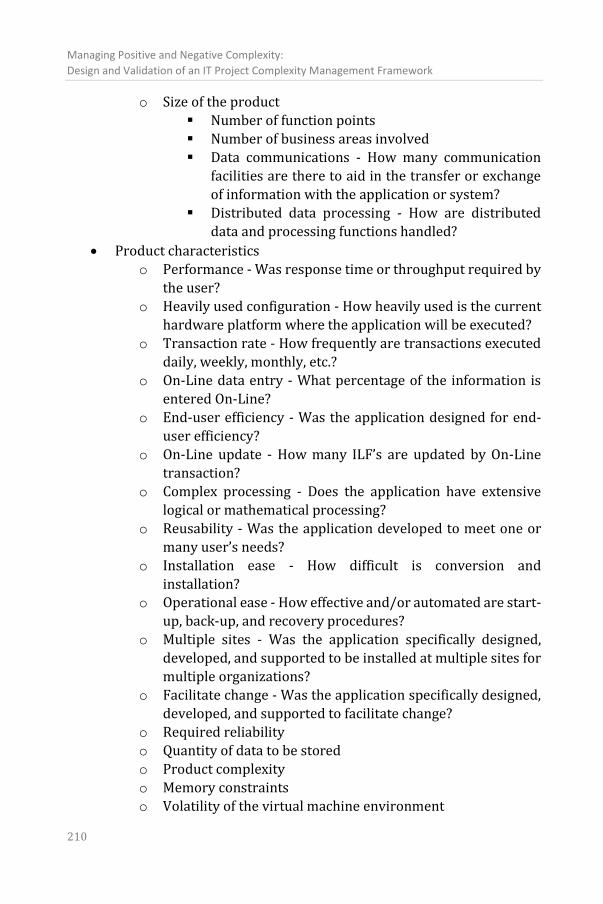
Managing Positive and Negative Complexity:
Design and Validation of an IT Project Complexity Management Framework
210
o Size of the product
▪ Number of function points
▪ Number of business areas involved
▪ Data communications - How many communication
facilities are there to aid in the transfer or exchange
of information with the application or system?
▪ Distributed data processing - How are distributed
data and processing functions handled?
• Product characteristics
o Performance - Was response time or throughput required by
the user?
o Heavily used configuration - How heavily used is the current
hardware platform where the application will be executed?
o Transaction rate - How frequently are transactions executed
daily, weekly, monthly, etc.?
o On-Line data entry - What percentage of the information is
entered On-Line?
o End-user efficiency - Was the application designed for end-
user efficiency?
o On-Line update - How many ILF’s are updated by On-Line
transaction?
o Complex processing - Does the application have extensive
logical or mathematical processing?
o Reusability - Was the application developed to meet one or
many user’s needs?
o Installation ease - How difficult is conversion and
installation?
o Operational ease - How effective and/or automated are start-
up, back-up, and recovery procedures?
o Multiple sites - Was the application specifically designed,
developed, and supported to be installed at multiple sites for
multiple organizations?
o Facilitate change - Was the application specifically designed,
developed, and supported to facilitate change?
o Required reliability
o Quantity of data to be stored
o Product complexity
o Memory constraints
o Volatility of the virtual machine environment
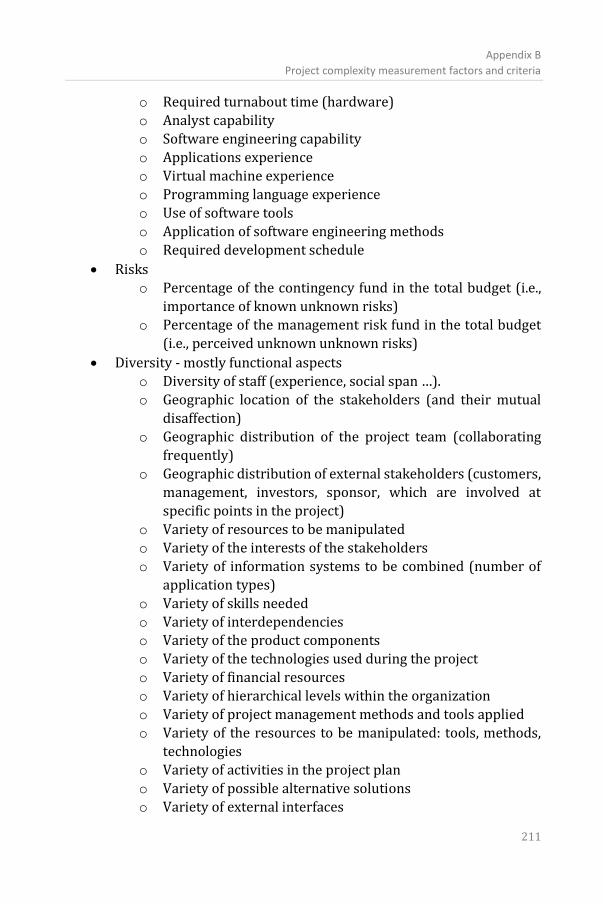
Appendix B
Project complexity measurement factors and criteria
211
o Required turnabout time (hardware)
o Analyst capability
o Software engineering capability
o Applications experience
o Virtual machine experience
o Programming language experience
o Use of software tools
o Application of software engineering methods
o Required development schedule
• Risks
o Percentage of the contingency fund in the total budget (i.e.,
importance of known unknown risks)
o Percentage of the management risk fund in the total budget
(i.e., perceived unknown unknown risks)
• Diversity - mostly functional aspects
o Diversity of staff (experience, social span …).
o Geographic location of the stakeholders (and their mutual
disaffection)
o Geographic distribution of the project team (collaborating
frequently)
o Geographic distribution of external stakeholders (customers,
management, investors, sponsor, which are involved at
specific points in the project)
o Variety of resources to be manipulated
o Variety of the interests of the stakeholders
o Variety of information systems to be combined (number of
application types)
o Variety of skills needed
o Variety of interdependencies
o Variety of the product components
o Variety of the technologies used during the project
o Variety of financial resources
o Variety of hierarchical levels within the organization
o Variety of project management methods and tools applied
o Variety of the resources to be manipulated: tools, methods,
technologies
o Variety of activities in the project plan
o Variety of possible alternative solutions
o Variety of external interfaces
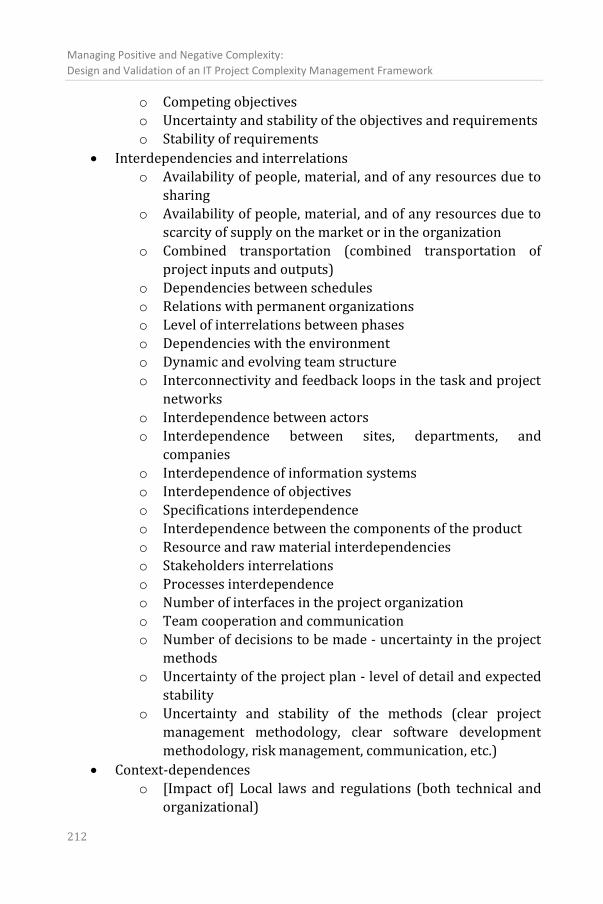
Managing Positive and Negative Complexity:
Design and Validation of an IT Project Complexity Management Framework
212
o Competing objectives
o Uncertainty and stability of the objectives and requirements
o Stability of requirements
• Interdependencies and interrelations
o Availability of people, material, and of any resources due to
sharing
o Availability of people, material, and of any resources due to
scarcity of supply on the market or in the organization
o Combined transportation (combined transportation of
project inputs and outputs)
o Dependencies between schedules
o Relations with permanent organizations
o Level of interrelations between phases
o Dependencies with the environment
o Dynamic and evolving team structure
o Interconnectivity and feedback loops in the task and project
networks
o Interdependence between actors
o Interdependence between sites, departments, and
companies
o Interdependence of information systems
o Interdependence of objectives
o Specifications interdependence
o Interdependence between the components of the product
o Resource and raw material interdependencies
o Stakeholders interrelations
o Processes interdependence
o Number of interfaces in the project organization
o Team cooperation and communication
o Number of decisions to be made - uncertainty in the project
methods
o Uncertainty of the project plan - level of detail and expected
stability
o Uncertainty and stability of the methods (clear project
management methodology, clear software development
methodology, risk management, communication, etc.)
• Context-dependences
o [Impact of] Local laws and regulations (both technical and
organizational)
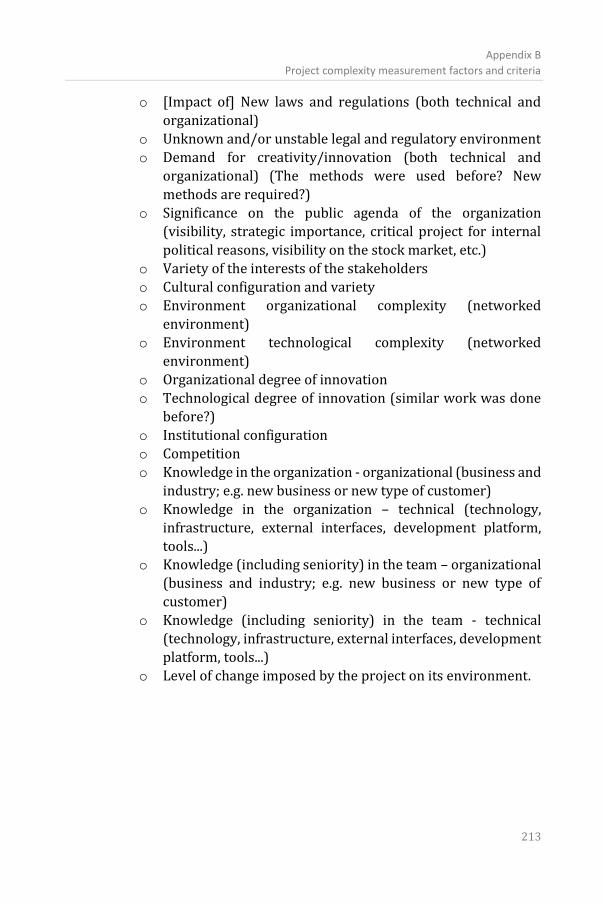
Appendix B
Project complexity measurement factors and criteria
213
o [Impact of] New laws and regulations (both technical and
organizational)
o Unknown and/or unstable legal and regulatory environment
o Demand for creativity/innovation (both technical and
organizational) (The methods were used before? New
methods are required?)
o Significance on the public agenda of the organization
(visibility, strategic importance, critical project for internal
political reasons, visibility on the stock market, etc.)
o Variety of the interests of the stakeholders
o Cultural configuration and variety
o Environment organizational complexity (networked
environment)
o Environment technological complexity (networked
environment)
o Organizational degree of innovation
o Technological degree of innovation (similar work was done
before?)
o Institutional configuration
o Competition
o Knowledge in the organization - organizational (business and
industry; e.g. new business or new type of customer)
o Knowledge in the organization – technical (technology,
infrastructure, external interfaces, development platform,
tools...) o Knowledge (including seniority) in the team – organizational
(business and industry; e.g. new business or new type of
customer)
o Knowledge (including seniority) in the team - technical
(technology, infrastructure, external interfaces, development
platform, tools...)
o Level of change imposed by the project on its environment.
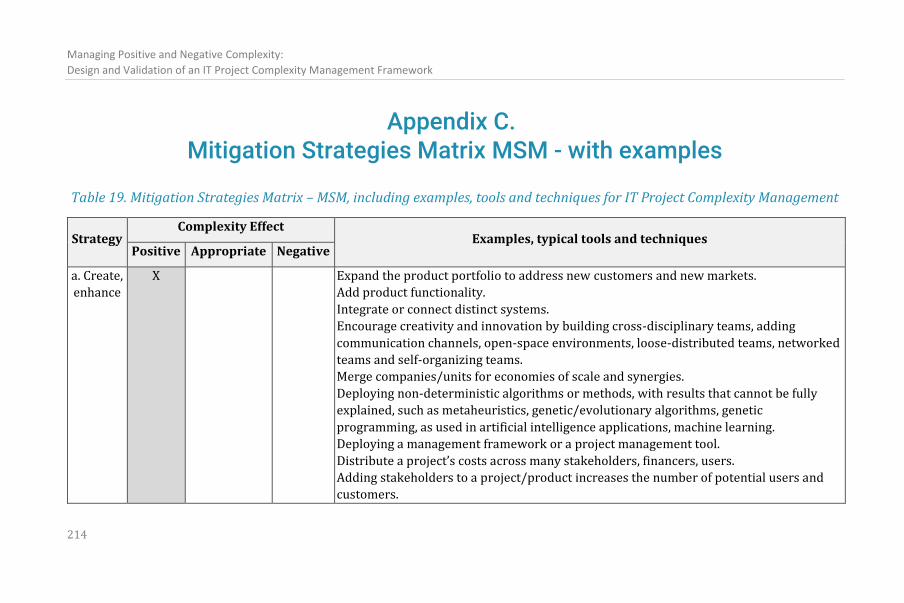
Managing Positive and Negative Complexity:
Design and Validation of an IT Project Complexity Management Framework
214
Appendix C. Mitigation Strategies Matrix MSM - with examples
Table 19. Mitigation Strategies Matrix – MSM, including examples, tools and techniques for IT Project Complexity Management
Strategy Complexity Effect
Examples, typical tools and techniques Positive Appropriate Negative
a. Create,
enhance
X Expand the product portfolio to address new customers and new markets.
Add product functionality.
Integrate or connect distinct systems.
Encourage creativity and innovation by building cross-disciplinary teams, adding
communication channels, open-space environments, loose-distributed teams, networked
teams and self-organizing teams.
Merge companies/units for economies of scale and synergies.
Deploying non-deterministic algorithms or methods, with results that cannot be fully
explained, such as metaheuristics, genetic/evolutionary algorithms, genetic
programming, as used in artificial intelligence applications, machine learning.
Deploying a management framework or a project management tool.
Distribute a project’s costs across many stakeholders, financers, users.
Adding stakeholders to a project/product increases the number of potential users and
customers.
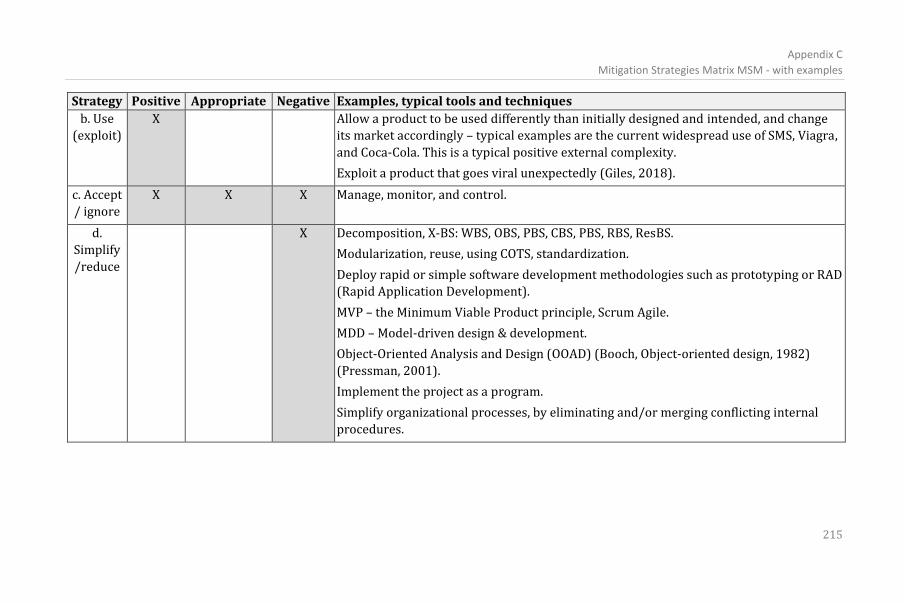
Appendix C
Mitigation Strategies Matrix MSM - with examples
215
Strategy Positive Appropriate Negative Examples, typical tools and techniques
b. Use
(exploit)
X Allow a product to be used differently than initially designed and intended, and change
its market accordingly – typical examples are the current widespread use of SMS, Viagra,
and Coca-Cola. This is a typical positive external complexity.
Exploit a product that goes viral unexpectedly (Giles, 2018).
c. Accept
/ ignore
X X X Manage, monitor, and control.
d.
Simplify
/reduce
X Decomposition, X-BS: WBS, OBS, PBS, CBS, PBS, RBS, ResBS.
Modularization, reuse, using COTS, standardization.
Deploy rapid or simple software development methodologies such as prototyping or RAD
(Rapid Application Development).
MVP – the Minimum Viable Product principle, Scrum Agile.
MDD – Model-driven design & development.
Object-Oriented Analysis and Design (OOAD) (Booch, Object-oriented design, 1982)
(Pressman, 2001).
Implement the project as a program.
Simplify organizational processes, by eliminating and/or merging conflicting internal
procedures.
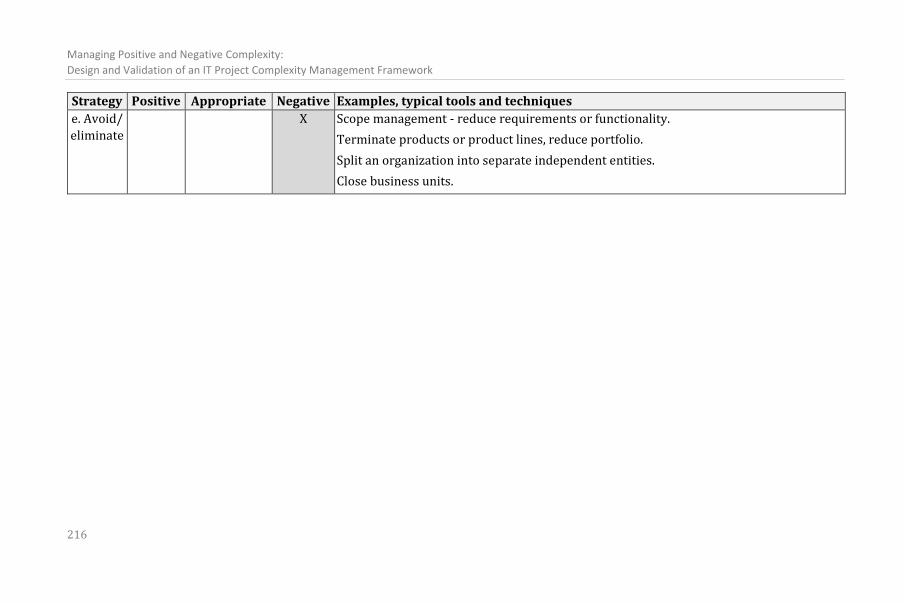
Managing Positive and Negative Complexity:
Design and Validation of an IT Project Complexity Management Framework
216
Strategy Positive Appropriate Negative Examples, typical tools and techniques
e. Avoid/
eliminate
X Scope management - reduce requirements or functionality.
Terminate products or product lines, reduce portfolio.
Split an organization into separate independent entities.
Close business units.
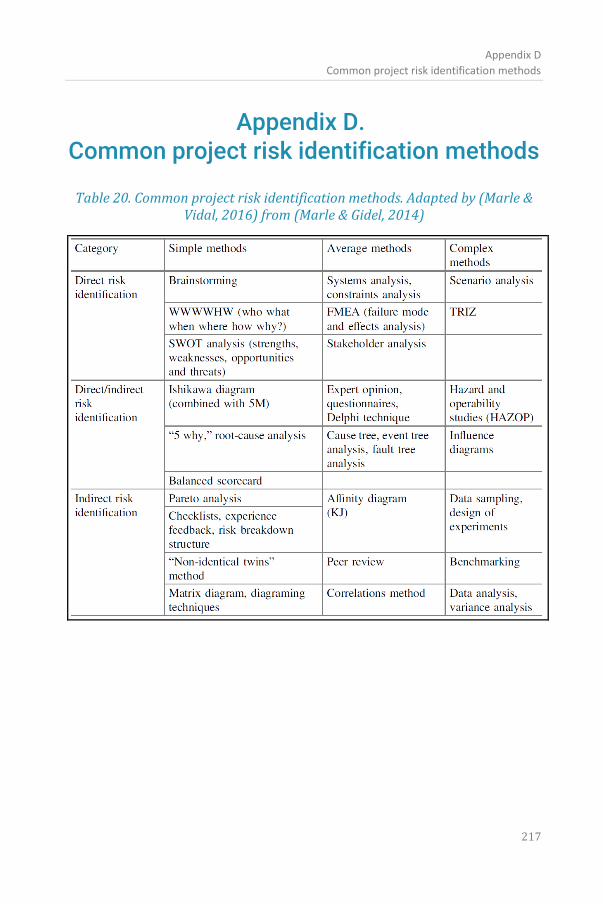
Appendix D
Common project risk identification methods
217
Appendix D. Common project risk identification methods
Table 20. Common project risk identification methods. Adapted by (Marle & Vidal, 2016) from (Marle & Gidel, 2014)
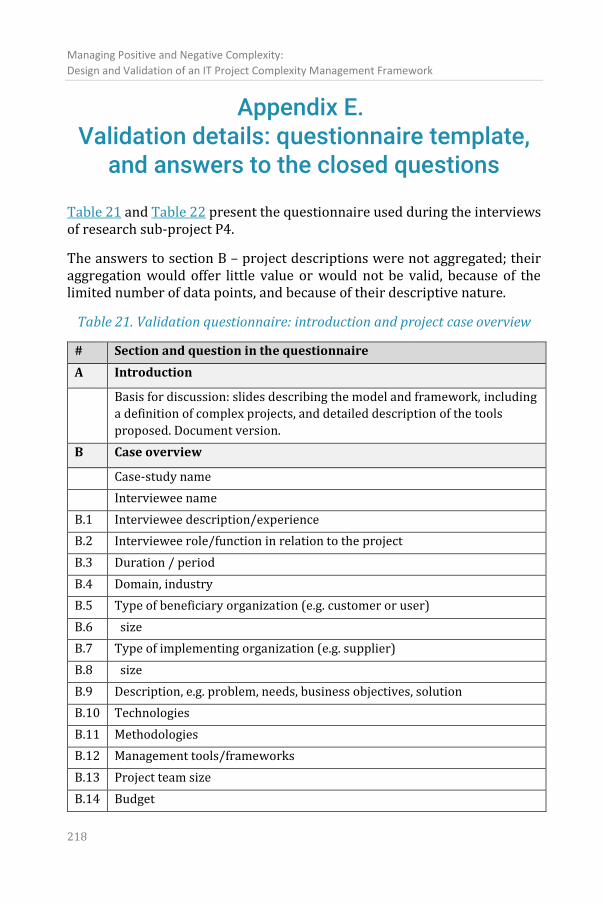
Managing Positive and Negative Complexity:
Design and Validation of an IT Project Complexity Management Framework
218
Appendix E. Validation details: questionnaire template,
and answers to the closed questions
Table 21 and Table 22 present the questionnaire used during the interviews of research sub-project P4.
The answers to section B – project descriptions were not aggregated; their aggregation would offer little value or would not be valid, because of the limited number of data points, and because of their descriptive nature.
Table 21. Validation questionnaire: introduction and project case overview
# Section and question in the questionnaire
A Introduction
Basis for discussion: slides describing the model and framework, including
a definition of complex projects, and detailed description of the tools
proposed. Document version.
B Case overview
Case-study name
Interviewee name
B.1 Interviewee description/experience
B.2 Interviewee role/function in relation to the project
B.3 Duration / period
B.4 Domain, industry
B.5 Type of beneficiary organization (e.g. customer or user)
B.6 size
B.7 Type of implementing organization (e.g. supplier)
B.8 size
B.9 Description, e.g. problem, needs, business objectives, solution
B.10 Technologies
B.11 Methodologies
B.12 Management tools/frameworks
B.13 Project team size
B.14 Budget
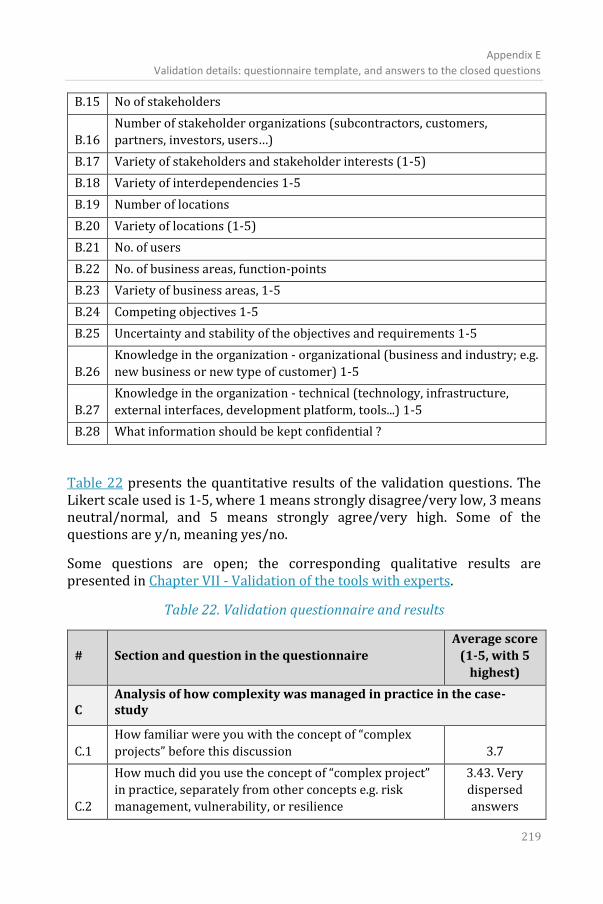
Appendix E
Validation details: questionnaire template, and answers to the closed questions
219
B.15 No of stakeholders
B.16
Number of stakeholder organizations (subcontractors, customers,
partners, investors, users…)
B.17 Variety of stakeholders and stakeholder interests (1-5)
B.18 Variety of interdependencies 1-5
B.19 Number of locations
B.20 Variety of locations (1-5)
B.21 No. of users
B.22 No. of business areas, function-points
B.23 Variety of business areas, 1-5
B.24 Competing objectives 1-5
B.25 Uncertainty and stability of the objectives and requirements 1-5
B.26
Knowledge in the organization - organizational (business and industry; e.g.
new business or new type of customer) 1-5
B.27
Knowledge in the organization - technical (technology, infrastructure,
external interfaces, development platform, tools...) 1-5
B.28 What information should be kept confidential ?
Table 22 presents the quantitative results of the validation questions. The Likert scale used is 1-5, where 1 means strongly disagree/very low, 3 means neutral/normal, and 5 means strongly agree/very high. Some of the questions are y/n, meaning yes/no.
Some questions are open; the corresponding qualitative results are presented in Chapter VII - Validation of the tools with experts.
Table 22. Validation questionnaire and results
# Section and question in the questionnaire
Average score
(1-5, with 5
highest)
C Analysis of how complexity was managed in practice in the case-study
C.1
How familiar were you with the concept of “complex
projects” before this discussion 3.7
C.2
How much did you use the concept of “complex project”
in practice, separately from other concepts e.g. risk
management, vulnerability, or resilience
3.43. Very
dispersed
answers
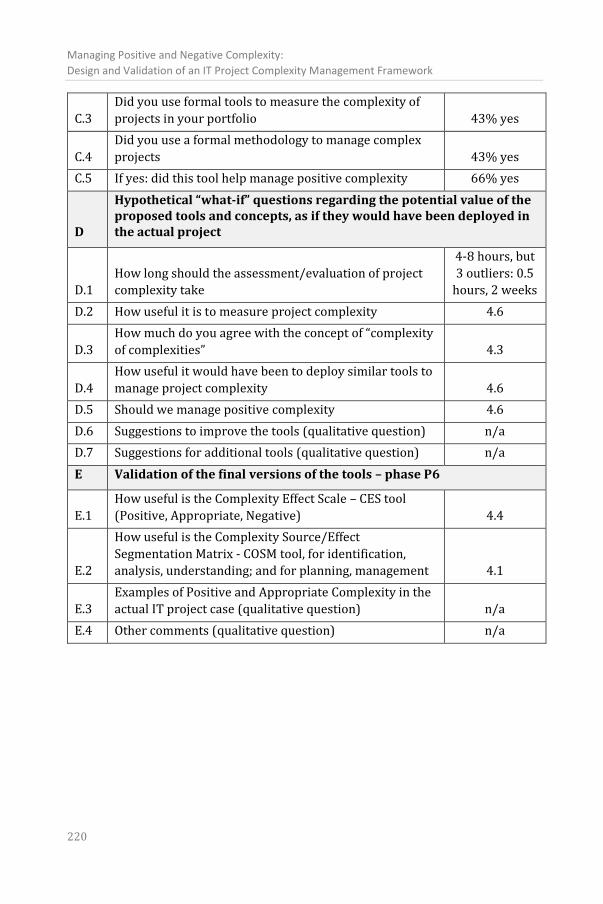
Managing Positive and Negative Complexity:
Design and Validation of an IT Project Complexity Management Framework
220
C.3
Did you use formal tools to measure the complexity of
projects in your portfolio 43% yes
C.4
Did you use a formal methodology to manage complex
projects 43% yes
C.5 If yes: did this tool help manage positive complexity 66% yes
D
Hypothetical “what-if” questions regarding the potential value of the proposed tools and concepts, as if they would have been deployed in the actual project
D.1
How long should the assessment/evaluation of project
complexity take
4-8 hours, but
3 outliers: 0.5
hours, 2 weeks
D.2 How useful it is to measure project complexity 4.6
D.3
How much do you agree with the concept of “complexity
of complexities” 4.3
D.4
How useful it would have been to deploy similar tools to
manage project complexity 4.6
D.5 Should we manage positive complexity 4.6
D.6 Suggestions to improve the tools (qualitative question) n/a
D.7 Suggestions for additional tools (qualitative question) n/a
E Validation of the final versions of the tools – phase P6
E.1
How useful is the Complexity Effect Scale – CES tool
(Positive, Appropriate, Negative) 4.4
E.2
How useful is the Complexity Source/Effect
Segmentation Matrix - COSM tool, for identification,
analysis, understanding; and for planning, management 4.1
E.3
Examples of Positive and Appropriate Complexity in the
actual IT project case (qualitative question) n/a
E.4 Other comments (qualitative question) n/a
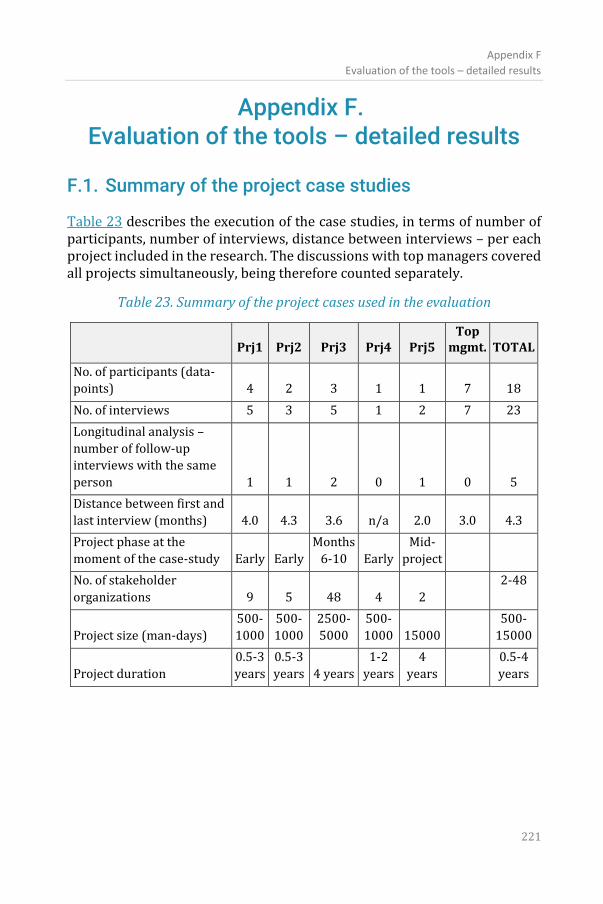
Appendix F
Evaluation of the tools – detailed results
221
Appendix F. Evaluation of the tools – detailed results
F.1. Summary of the project case studies
Table 23 describes the execution of the case studies, in terms of number of participants, number of interviews, distance between interviews – per each project included in the research. The discussions with top managers covered all projects simultaneously, being therefore counted separately.
Table 23. Summary of the project cases used in the evaluation
Prj1 Prj2 Prj3 Prj4 Prj5
Top mgmt. TOTAL
No. of participants (data-
points) 4 2 3 1 1 7 18
No. of interviews 5 3 5 1 2 7 23
Longitudinal analysis –
number of follow-up
interviews with the same
person 1 1 2 0 1 0 5
Distance between first and
last interview (months) 4.0 4.3 3.6 n/a 2.0 3.0 4.3
Project phase at the
moment of the case-study Early Early
Months
6-10 Early
Mid-
project
No. of stakeholder
organizations 9 5 48 4 2
2-48
Project size (man-days)
500-
1000
500-
1000
2500-
5000
500-
1000 15000
500-
15000
Project duration
0.5-3
years
0.5-3
years 4 years
1-2
years
4
years
0.5-4
years
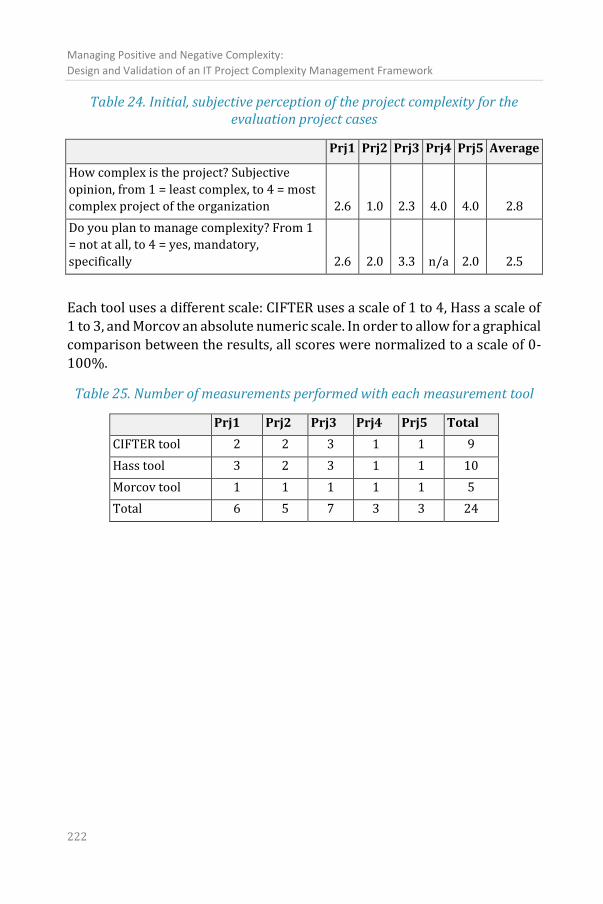
Managing Positive and Negative Complexity:
Design and Validation of an IT Project Complexity Management Framework
222
Table 24. Initial, subjective perception of the project complexity for the evaluation project cases
Prj1 Prj2 Prj3 Prj4 Prj5 Average
How complex is the project? Subjective
opinion, from 1 = least complex, to 4 = most
complex project of the organization 2.6 1.0 2.3 4.0 4.0 2.8
Do you plan to manage complexity? From 1
= not at all, to 4 = yes, mandatory,
specifically 2.6 2.0 3.3 n/a 2.0 2.5
Each tool uses a different scale: CIFTER uses a scale of 1 to 4, Hass a scale of
1 to 3, and Morcov an absolute numeric scale. In order to allow for a graphical
comparison between the results, all scores were normalized to a scale of 0-
100%.
Table 25. Number of measurements performed with each measurement tool
Prj1 Prj2 Prj3 Prj4 Prj5 Total
CIFTER tool 2 2 3 1 1 9
Hass tool 3 2 3 1 1 10
Morcov tool 1 1 1 1 1 5
Total 6 5 7 3 3 24
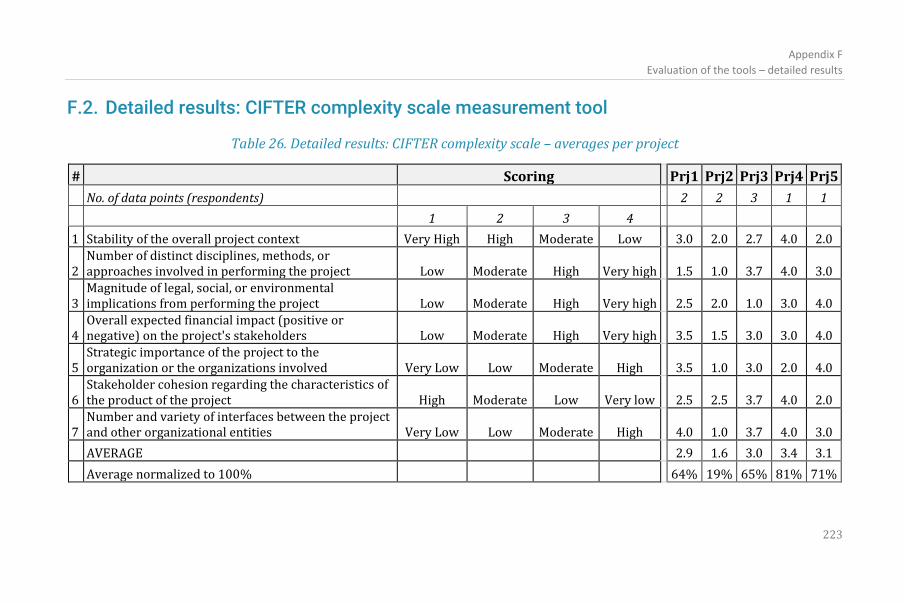
Appendix F
Evaluation of the tools – detailed results
223
F.2. Detailed results: CIFTER complexity scale measurement tool
Table 26. Detailed results: CIFTER complexity scale – averages per project
# Scoring Prj1 Prj2 Prj3 Prj4 Prj5
No. of data points (respondents) 2 2 3 1 1
1 2 3 4
1 Stability of the overall project context Very High High Moderate Low 3.0 2.0 2.7 4.0 2.0
2 Number of distinct disciplines, methods, or approaches involved in performing the project Low Moderate High Very high 1.5 1.0 3.7 4.0 3.0
3 Magnitude of legal, social, or environmental implications from performing the project Low Moderate High Very high 2.5 2.0 1.0 3.0 4.0
4 Overall expected financial impact (positive or negative) on the project's stakeholders Low Moderate High Very high 3.5 1.5 3.0 3.0 4.0
5 Strategic importance of the project to the organization or the organizations involved Very Low Low Moderate High 3.5 1.0 3.0 2.0 4.0
6 Stakeholder cohesion regarding the characteristics of the product of the project High Moderate Low Very low 2.5 2.5 3.7 4.0 2.0
7 Number and variety of interfaces between the project and other organizational entities Very Low Low Moderate High 4.0 1.0 3.7 4.0 3.0
AVERAGE 2.9 1.6 3.0 3.4 3.1
Average normalized to 100% 64% 19% 65% 81% 71%
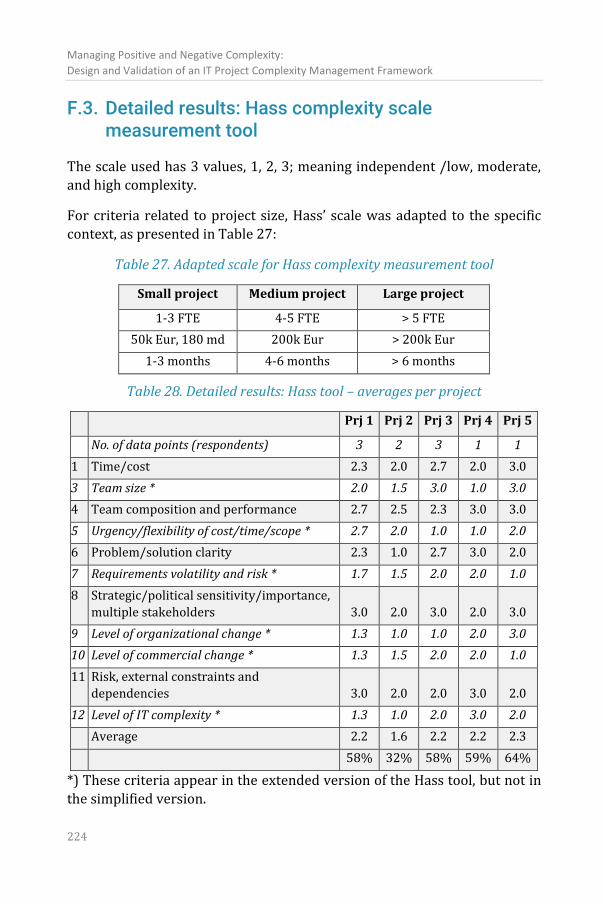
Managing Positive and Negative Complexity:
Design and Validation of an IT Project Complexity Management Framework
224
F.3. Detailed results: Hass complexity scale measurement tool
The scale used has 3 values, 1, 2, 3; meaning independent /low, moderate,
and high complexity.
For criteria related to project size, Hass’ scale was adapted to the specific
context, as presented in Table 27:
Table 27. Adapted scale for Hass complexity measurement tool
Small project Medium project Large project
1-3 FTE 4-5 FTE > 5 FTE
50k Eur, 180 md 200k Eur > 200k Eur
1-3 months 4-6 months > 6 months
Table 28. Detailed results: Hass tool – averages per project
Prj 1 Prj 2 Prj 3 Prj 4 Prj 5
No. of data points (respondents) 3 2 3 1 1
1 Time/cost 2.3 2.0 2.7 2.0 3.0
3 Team size * 2.0 1.5 3.0 1.0 3.0
4 Team composition and performance 2.7 2.5 2.3 3.0 3.0
5 Urgency/flexibility of cost/time/scope * 2.7 2.0 1.0 1.0 2.0
6 Problem/solution clarity 2.3 1.0 2.7 3.0 2.0
7 Requirements volatility and risk * 1.7 1.5 2.0 2.0 1.0
8 Strategic/political sensitivity/importance,
multiple stakeholders 3.0 2.0 3.0 2.0 3.0
9 Level of organizational change * 1.3 1.0 1.0 2.0 3.0
10 Level of commercial change * 1.3 1.5 2.0 2.0 1.0
11 Risk, external constraints and
dependencies 3.0 2.0 2.0 3.0 2.0
12 Level of IT complexity * 1.3 1.0 2.0 3.0 2.0
Average 2.2 1.6 2.2 2.2 2.3
58% 32% 58% 59% 64%
*) These criteria appear in the extended version of the Hass tool, but not in
the simplified version.
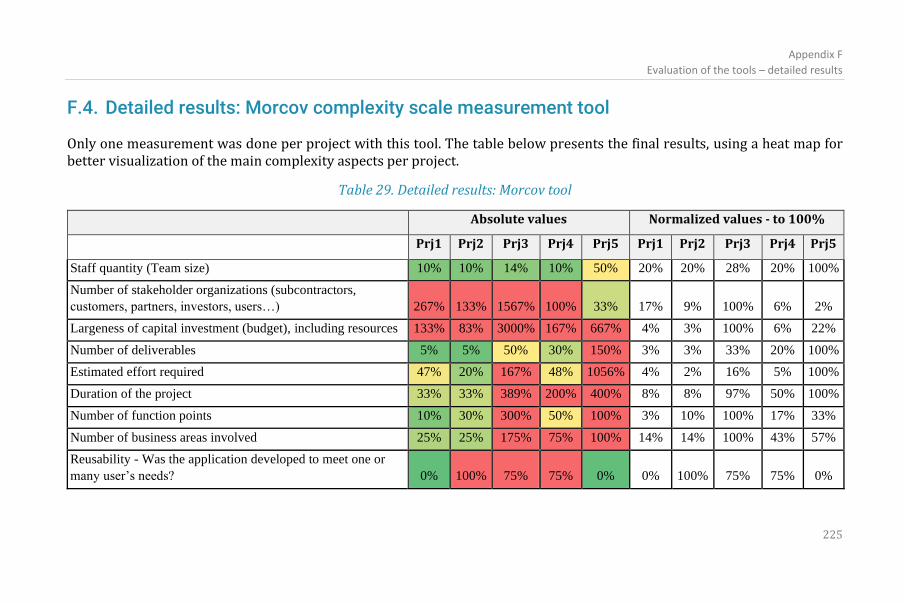
Appendix F
Evaluation of the tools – detailed results
225
F.4. Detailed results: Morcov complexity scale measurement tool
Only one measurement was done per project with this tool. The table below presents the final results, using a heat map for better visualization of the main complexity aspects per project.
Table 29. Detailed results: Morcov tool
Absolute values Normalized values - to 100%
Prj1 Prj2 Prj3 Prj4 Prj5 Prj1 Prj2 Prj3 Prj4 Prj5
Staff quantity (Team size) 10% 10% 14% 10% 50% 20% 20% 28% 20% 100%
Number of stakeholder organizations (subcontractors,
customers, partners, investors, users…) 267% 133% 1567% 100% 33% 17% 9% 100% 6% 2%
Largeness of capital investment (budget), including resources 133% 83% 3000% 167% 667% 4% 3% 100% 6% 22%
Number of deliverables 5% 5% 50% 30% 150% 3% 3% 33% 20% 100%
Estimated effort required 47% 20% 167% 48% 1056% 4% 2% 16% 5% 100%
Duration of the project 33% 33% 389% 200% 400% 8% 8% 97% 50% 100%
Number of function points 10% 30% 300% 50% 100% 3% 10% 100% 17% 33%
Number of business areas involved 25% 25% 175% 75% 100% 14% 14% 100% 43% 57%
Reusability - Was the application developed to meet one or
many user’s needs? 0% 100% 75% 75% 0% 0% 100% 75% 75% 0%
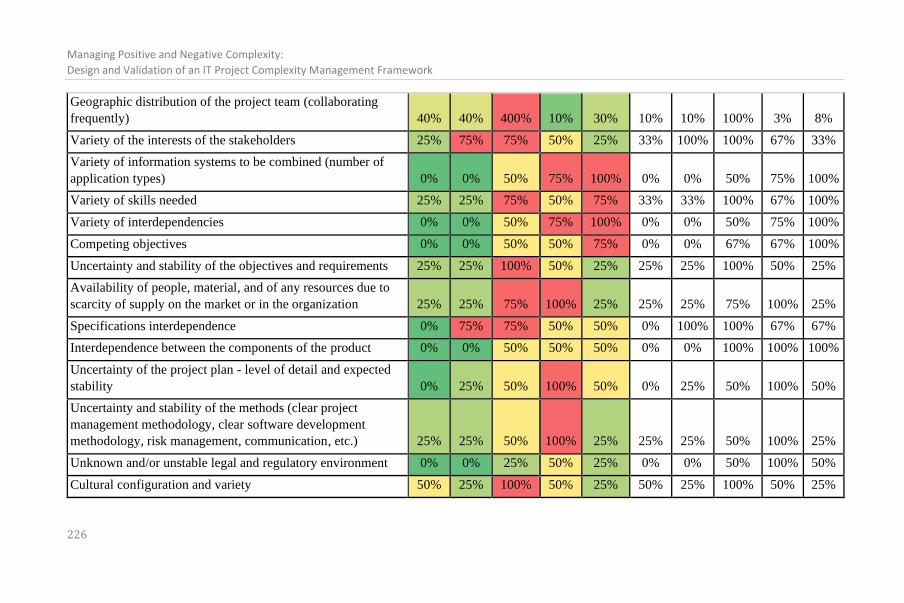
Managing Positive and Negative Complexity:
Design and Validation of an IT Project Complexity Management Framework
226
Geographic distribution of the project team (collaborating
frequently) 40% 40% 400% 10% 30% 10% 10% 100% 3% 8%
Variety of the interests of the stakeholders 25% 75% 75% 50% 25% 33% 100% 100% 67% 33%
Variety of information systems to be combined (number of
application types) 0% 0% 50% 75% 100% 0% 0% 50% 75% 100%
Variety of skills needed 25% 25% 75% 50% 75% 33% 33% 100% 67% 100%
Variety of interdependencies 0% 0% 50% 75% 100% 0% 0% 50% 75% 100%
Competing objectives 0% 0% 50% 50% 75% 0% 0% 67% 67% 100%
Uncertainty and stability of the objectives and requirements 25% 25% 100% 50% 25% 25% 25% 100% 50% 25%
Availability of people, material, and of any resources due to
scarcity of supply on the market or in the organization 25% 25% 75% 100% 25% 25% 25% 75% 100% 25%
Specifications interdependence 0% 75% 75% 50% 50% 0% 100% 100% 67% 67%
Interdependence between the components of the product 0% 0% 50% 50% 50% 0% 0% 100% 100% 100%
Uncertainty of the project plan - level of detail and expected
stability 0% 25% 50% 100% 50% 0% 25% 50% 100% 50%
Uncertainty and stability of the methods (clear project
management methodology, clear software development
methodology, risk management, communication, etc.) 25% 25% 50% 100% 25% 25% 25% 50% 100% 25%
Unknown and/or unstable legal and regulatory environment 0% 0% 25% 50% 25% 0% 0% 50% 100% 50%
Cultural configuration and variety 50% 25% 100% 50% 25% 50% 25% 100% 50% 25%
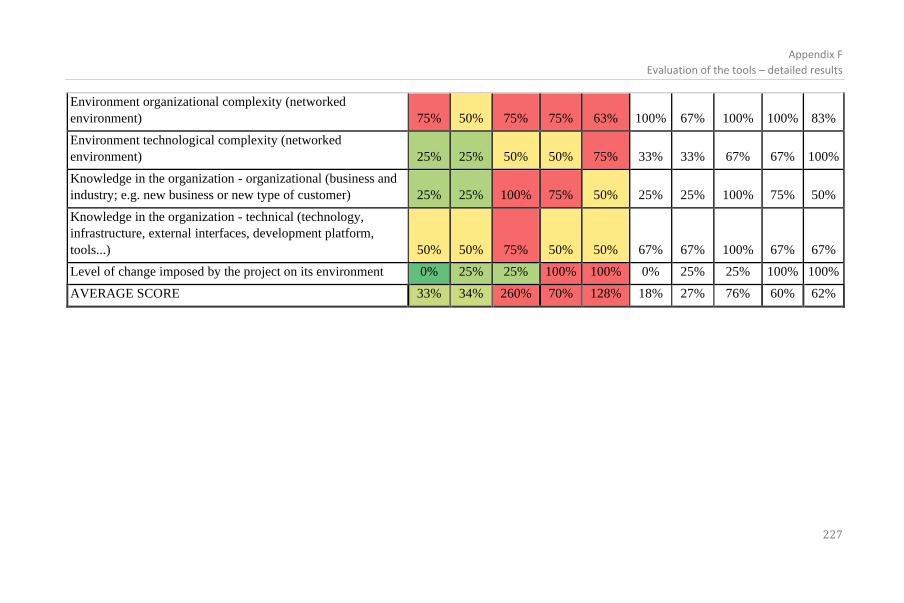
Appendix F
Evaluation of the tools – detailed results
227
Environment organizational complexity (networked
environment) 75% 50% 75% 75% 63% 100% 67% 100% 100% 83%
Environment technological complexity (networked
environment) 25% 25% 50% 50% 75% 33% 33% 67% 67% 100%
Knowledge in the organization - organizational (business and
industry; e.g. new business or new type of customer) 25% 25% 100% 75% 50% 25% 25% 100% 75% 50%
Knowledge in the organization - technical (technology,
infrastructure, external interfaces, development platform,
tools...) 50% 50% 75% 50% 50% 67% 67% 100% 67% 67%
Level of change imposed by the project on its environment 0% 25% 25% 100% 100% 0% 25% 25% 100% 100%
AVERAGE SCORE 33% 34% 260% 70% 128% 18% 27% 76% 60% 62%
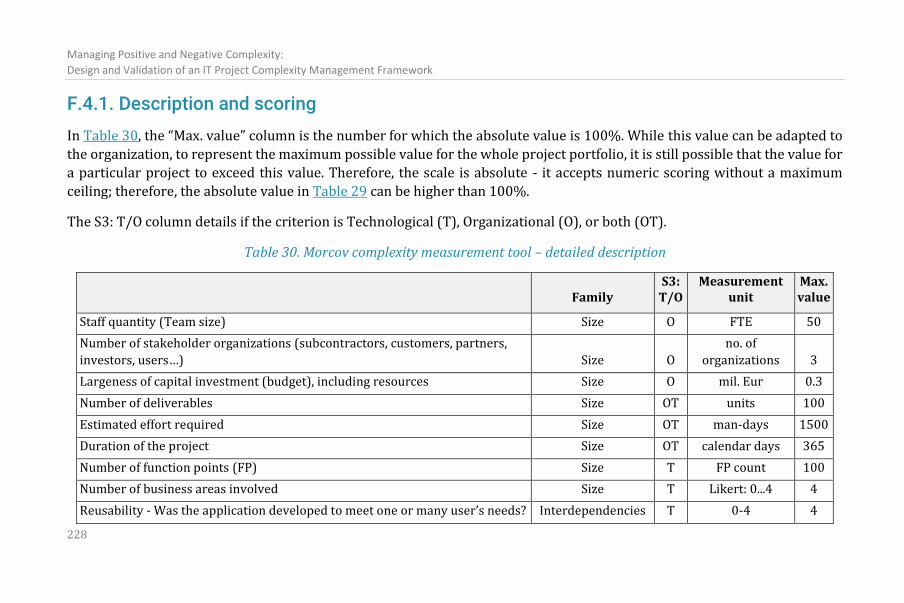
Managing Positive and Negative Complexity:
Design and Validation of an IT Project Complexity Management Framework
228
F.4.1. Description and scoring
In Table 30, the “Max. value” column is the number for which the absolute value is 100%. While this value can be adapted to
the organization, to represent the maximum possible value for the whole project portfolio, it is still possible that the value for
a particular project to exceed this value. Therefore, the scale is absolute - it accepts numeric scoring without a maximum
ceiling; therefore, the absolute value in Table 29 can be higher than 100%.
The S3: T/O column details if the criterion is Technological (T), Organizational (O), or both (OT).
Table 30. Morcov complexity measurement tool – detailed description
Family
S3: T/O
Measurement unit
Max. value
Staff quantity (Team size) Size O FTE 50
Number of stakeholder organizations (subcontractors, customers, partners,
investors, users…) Size O
no. of
organizations 3
Largeness of capital investment (budget), including resources Size O mil. Eur 0.3
Number of deliverables Size OT units 100
Estimated effort required Size OT man-days 1500
Duration of the project Size OT calendar days 365
Number of function points (FP) Size T FP count 100
Number of business areas involved Size T Likert: 0...4 4
Reusability - Was the application developed to meet one or many user’s needs? Interdependencies T 0-4 4
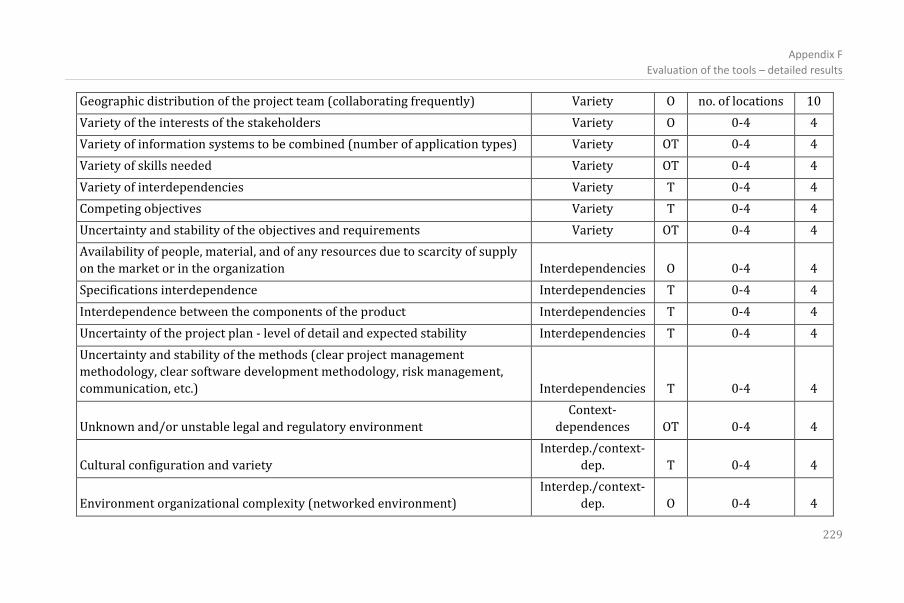
Appendix F
Evaluation of the tools – detailed results
229
Geographic distribution of the project team (collaborating frequently) Variety O no. of locations 10
Variety of the interests of the stakeholders Variety O 0-4 4
Variety of information systems to be combined (number of application types) Variety OT 0-4 4
Variety of skills needed Variety OT 0-4 4
Variety of interdependencies Variety T 0-4 4
Competing objectives Variety T 0-4 4
Uncertainty and stability of the objectives and requirements Variety OT 0-4 4
Availability of people, material, and of any resources due to scarcity of supply
on the market or in the organization Interdependencies O 0-4 4
Specifications interdependence Interdependencies T 0-4 4
Interdependence between the components of the product Interdependencies T 0-4 4
Uncertainty of the project plan - level of detail and expected stability Interdependencies T 0-4 4
Uncertainty and stability of the methods (clear project management
methodology, clear software development methodology, risk management,
communication, etc.) Interdependencies T 0-4 4
Unknown and/or unstable legal and regulatory environment
Context-
dependences OT 0-4 4
Cultural configuration and variety
Interdep./context-
dep. T 0-4 4
Environment organizational complexity (networked environment)
Interdep./context-
dep. O 0-4 4
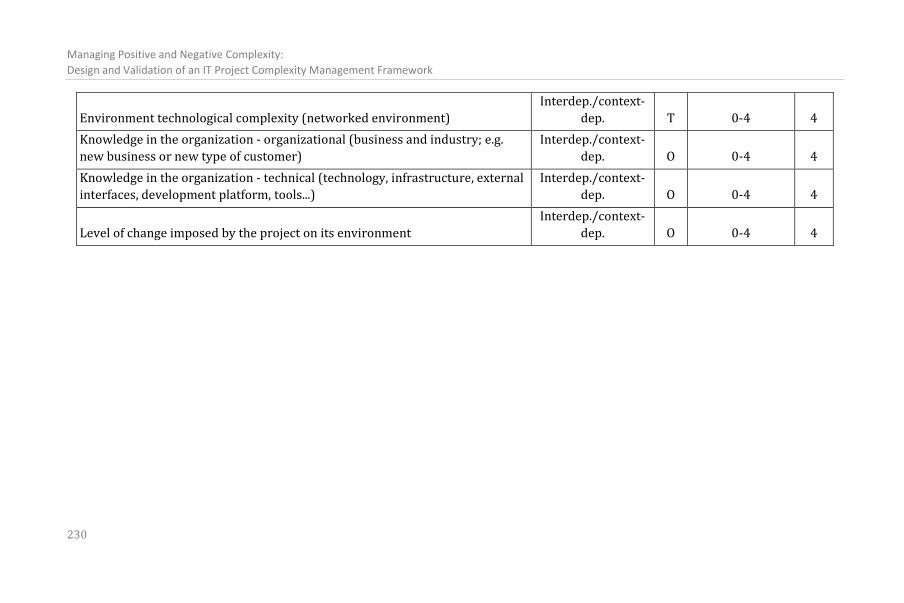
Managing Positive and Negative Complexity:
Design and Validation of an IT Project Complexity Management Framework
230
Environment technological complexity (networked environment)
Interdep./context-
dep. T 0-4 4
Knowledge in the organization - organizational (business and industry; e.g.
new business or new type of customer)
Interdep./context-
dep. O 0-4 4
Knowledge in the organization - technical (technology, infrastructure, external
interfaces, development platform, tools...)
Interdep./context-
dep. O 0-4 4
Level of change imposed by the project on its environment
Interdep./context-
dep. O 0-4 4
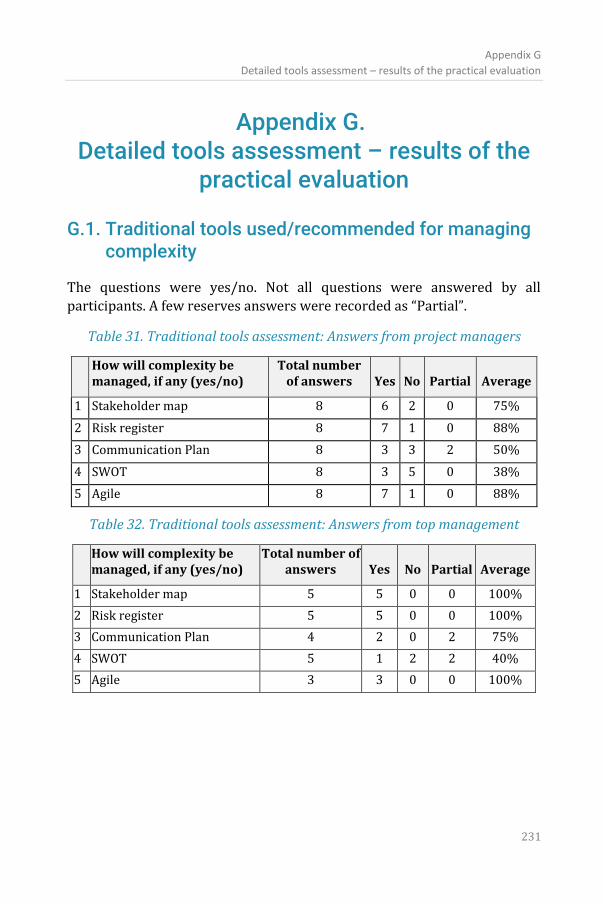
Appendix G
Detailed tools assessment – results of the practical evaluation
231
Appendix G. Detailed tools assessment – results of the
practical evaluation
G.1. Traditional tools used/recommended for managing complexity
The questions were yes/no. Not all questions were answered by all
participants. A few reserves answers were recorded as “Partial”.
Table 31. Traditional tools assessment: Answers from project managers
How will complexity be managed, if any (yes/no)
Total number of answers Yes No Partial Average
1 Stakeholder map 8 6 2 0 75%
2 Risk register 8 7 1 0 88%
3 Communication Plan 8 3 3 2 50%
4 SWOT 8 3 5 0 38%
5 Agile 8 7 1 0 88%
Table 32. Traditional tools assessment: Answers from top management
How will complexity be managed, if any (yes/no)
Total number of answers Yes No Partial Average
1 Stakeholder map 5 5 0 0 100%
2 Risk register 5 5 0 0 100%
3 Communication Plan 4 2 0 2 75%
4 SWOT 5 1 2 2 40%
5 Agile 3 3 0 0 100%
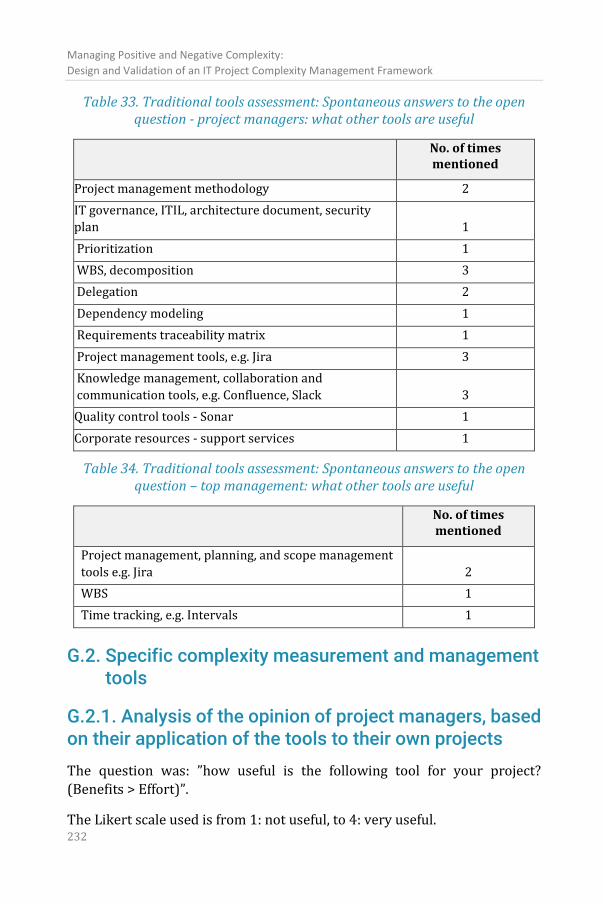
Managing Positive and Negative Complexity:
Design and Validation of an IT Project Complexity Management Framework
232
Table 33. Traditional tools assessment: Spontaneous answers to the open question - project managers: what other tools are useful
No. of times mentioned
Project management methodology 2
IT governance, ITIL, architecture document, security
plan 1
Prioritization 1
WBS, decomposition 3
Delegation 2
Dependency modeling 1
Requirements traceability matrix 1
Project management tools, e.g. Jira 3
Knowledge management, collaboration and
communication tools, e.g. Confluence, Slack 3
Quality control tools - Sonar 1
Corporate resources - support services 1
Table 34. Traditional tools assessment: Spontaneous answers to the open question – top management: what other tools are useful
No. of times mentioned
Project management, planning, and scope management
tools e.g. Jira 2
WBS 1
Time tracking, e.g. Intervals 1
G.2. Specific complexity measurement and management tools
G.2.1. Analysis of the opinion of project managers, based on their application of the tools to their own projects
The question was: ”how useful is the following tool for your project?
(Benefits > Effort)”.
The Likert scale used is from 1: not useful, to 4: very useful.
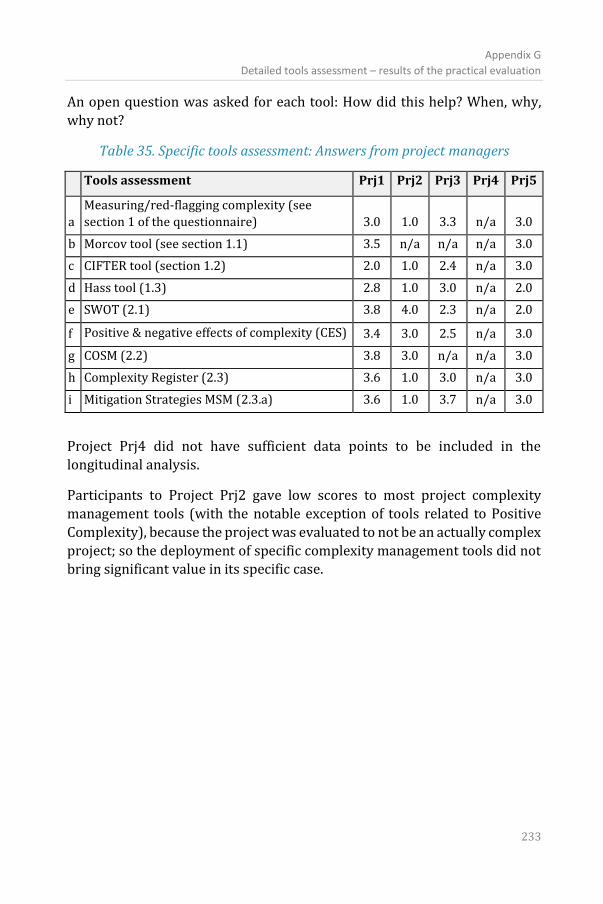
Appendix G
Detailed tools assessment – results of the practical evaluation
233
An open question was asked for each tool: How did this help? When, why,
why not?
Table 35. Specific tools assessment: Answers from project managers
Tools assessment Prj1 Prj2 Prj3 Prj4 Prj5
a
Measuring/red-flagging complexity (see
section 1 of the questionnaire) 3.0 1.0 3.3 n/a 3.0
b Morcov tool (see section 1.1) 3.5 n/a n/a n/a 3.0
c CIFTER tool (section 1.2) 2.0 1.0 2.4 n/a 3.0
d Hass tool (1.3) 2.8 1.0 3.0 n/a 2.0
e SWOT (2.1) 3.8 4.0 2.3 n/a 2.0
f Positive & negative effects of complexity (CES) 3.4 3.0 2.5 n/a 3.0
g COSM (2.2) 3.8 3.0 n/a n/a 3.0
h Complexity Register (2.3) 3.6 1.0 3.0 n/a 3.0
i Mitigation Strategies MSM (2.3.a) 3.6 1.0 3.7 n/a 3.0
Project Prj4 did not have sufficient data points to be included in the
longitudinal analysis.
Participants to Project Prj2 gave low scores to most project complexity
management tools (with the notable exception of tools related to Positive
Complexity), because the project was evaluated to not be an actually complex
project; so the deployment of specific complexity management tools did not bring significant value in its specific case.
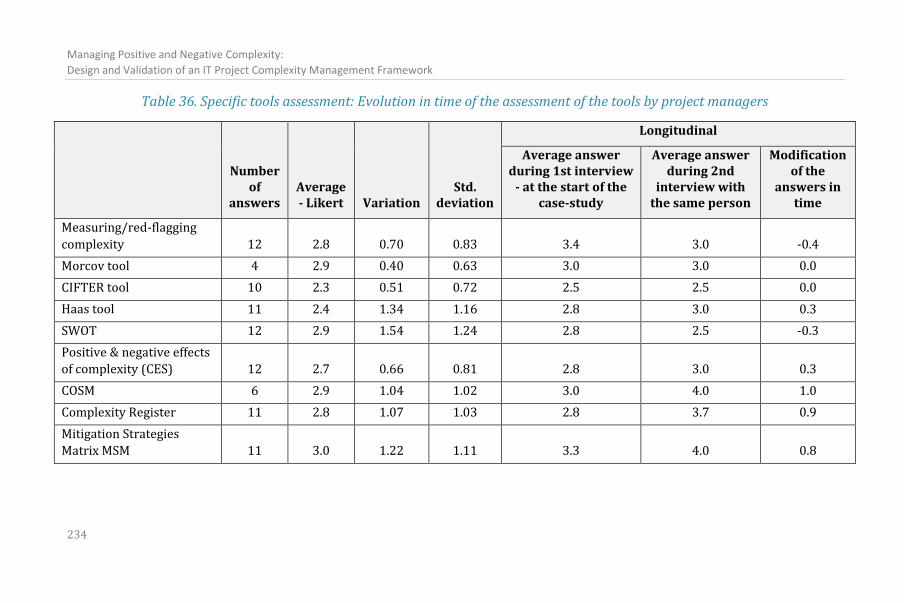
Managing Positive and Negative Complexity:
Design and Validation of an IT Project Complexity Management Framework
234
Table 36. Specific tools assessment: Evolution in time of the assessment of the tools by project managers
Number of
answers Average - Likert Variation
Std. deviation
Longitudinal
Average answer during 1st interview
- at the start of the case-study
Average answer during 2nd
interview with the same person
Modification of the
answers in time
Measuring/red-flagging
complexity 12 2.8 0.70 0.83 3.4 3.0 -0.4
Morcov tool 4 2.9 0.40 0.63 3.0 3.0 0.0
CIFTER tool 10 2.3 0.51 0.72 2.5 2.5 0.0
Haas tool 11 2.4 1.34 1.16 2.8 3.0 0.3
SWOT 12 2.9 1.54 1.24 2.8 2.5 -0.3
Positive & negative effects
of complexity (CES) 12 2.7 0.66 0.81 2.8 3.0 0.3
COSM 6 2.9 1.04 1.02 3.0 4.0 1.0
Complexity Register 11 2.8 1.07 1.03 2.8 3.7 0.9
Mitigation Strategies
Matrix MSM 11 3.0 1.22 1.11 3.3 4.0 0.8
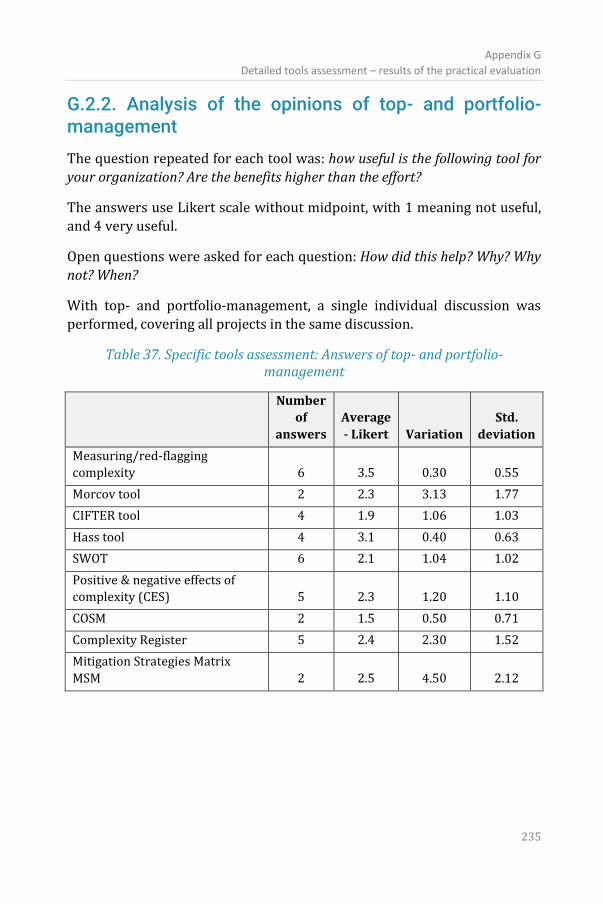
Appendix G
Detailed tools assessment – results of the practical evaluation
235
G.2.2. Analysis of the opinions of top- and portfolio-management
The question repeated for each tool was: how useful is the following tool for
your organization? Are the benefits higher than the effort?
The answers use Likert scale without midpoint, with 1 meaning not useful,
and 4 very useful.
Open questions were asked for each question: How did this help? Why? Why
not? When?
With top- and portfolio-management, a single individual discussion was
performed, covering all projects in the same discussion.
Table 37. Specific tools assessment: Answers of top- and portfolio-management
Number
of
answers
Average
- Likert Variation
Std.
deviation
Measuring/red-flagging
complexity 6 3.5 0.30 0.55
Morcov tool 2 2.3 3.13 1.77
CIFTER tool 4 1.9 1.06 1.03
Hass tool 4 3.1 0.40 0.63
SWOT 6 2.1 1.04 1.02
Positive & negative effects of
complexity (CES) 5 2.3 1.20 1.10
COSM 2 1.5 0.50 0.71
Complexity Register 5 2.4 2.30 1.52
Mitigation Strategies Matrix
MSM 2 2.5 4.50 2.12
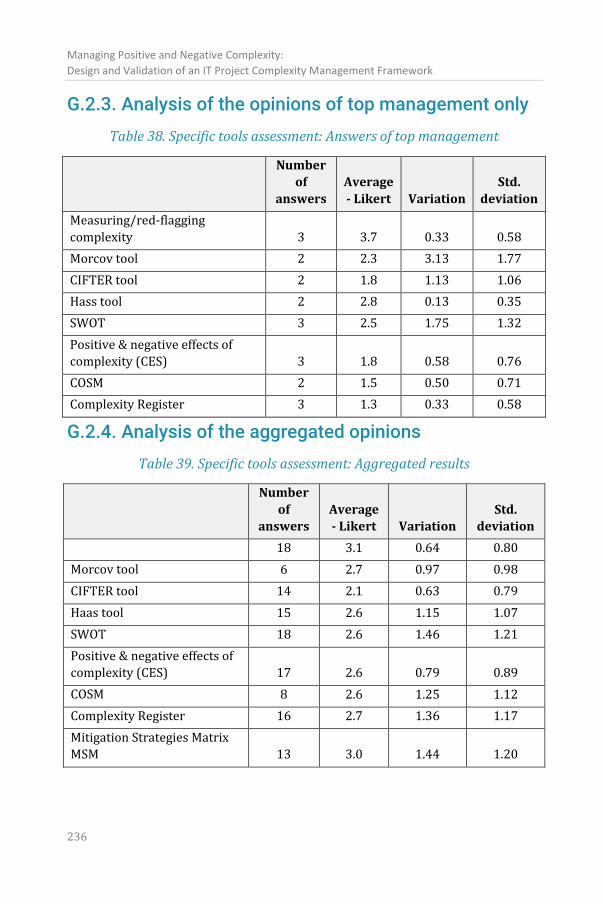
Managing Positive and Negative Complexity:
Design and Validation of an IT Project Complexity Management Framework
236
G.2.3. Analysis of the opinions of top management only
Table 38. Specific tools assessment: Answers of top management
Number
of
answers
Average
- Likert Variation
Std.
deviation
Measuring/red-flagging
complexity 3 3.7 0.33 0.58
Morcov tool 2 2.3 3.13 1.77
CIFTER tool 2 1.8 1.13 1.06
Hass tool 2 2.8 0.13 0.35
SWOT 3 2.5 1.75 1.32
Positive & negative effects of
complexity (CES) 3 1.8 0.58 0.76
COSM 2 1.5 0.50 0.71
Complexity Register 3 1.3 0.33 0.58
G.2.4. Analysis of the aggregated opinions
Table 39. Specific tools assessment: Aggregated results
Number
of
answers
Average
- Likert Variation
Std.
deviation
18 3.1 0.64 0.80
Morcov tool 6 2.7 0.97 0.98
CIFTER tool 14 2.1 0.63 0.79
Haas tool 15 2.6 1.15 1.07
SWOT 18 2.6 1.46 1.21
Positive & negative effects of
complexity (CES) 17 2.6 0.79 0.89
COSM 8 2.6 1.25 1.12
Complexity Register 16 2.7 1.36 1.17
Mitigation Strategies Matrix
MSM 13 3.0 1.44 1.20
Curriculum vitae
Stefan Morcov
237
Curriculum vitae Stefan Morcov
IT expert & architect
Project and product manager
Business development & entrepreneur
http://stefanmorcov.com
▪ Computer Science Engineer, MBA, PMP.
▪ 20 years’ experience in IT, management, strategy, business development,
marketing, sales, presales, project management.
▪ Setup and management of complex projects and several new operations on
3 continents, management of hundreds of IT projects in education, e-
learning, R&D, capacity building, e-government, consumer, financial, web
portals, online communities & collaboration, mobile apps, AI, document &
workflow management, GIS, semantics, cloud, DevOps.
▪ Passionate about technology, AI, complexity, transformation, innovation.
Experience
Managing Director @ Tremend Benelux SA (2018-...)
• Setup, sales, management of a new operation on a new market.
• Projects with EU institutions and the private sector in Belgium,
Denmark, Italy, Luxembourg, Spain.
Managing Director @ SIVECO Belgium Sprl (2015-2018)
• Setup, staffing and management of a new company on a new market.
• Signing and managing a portfolio of 28 Framework Contracts, worth
34 mil. Eur.
• SIVECO Belgium Sprl became a major supplier of the European
Commission and other EU institutions in Brussels, Luxembourg and
Strasbourg.
EU Business Director @ SIVECO Romania SA (2008-2018)
• International business development, contract and project
management.
• Established new IT operations and managed large projects in Cyprus,
Benelux, Morocco, Middle East etc.
Managing Positive and Negative Complexity:
Design and Validation of an IT Project Complexity Management Framework
238
Line of Business Senior Director @ SIVECO Romania (2007-2008)
• Managing 4 business units: eLearning, document management,
custom software development, EU projects; with a team of 140
permanent and 200 short-term consultants.
Line of Business Manager – eLearning division @ SIVECO Romania
(2004-2006)
• Managed a new business unit, 52-strong.
• Product management, marketing, business development, setup new
teams, processes and tools for software development, support,
configuration, issue tracking, QAC, HR, training, career development,
marketing, PR, sales.
• Supervising more than 100 projects. Acting as Senior Project
Manager for large complex IT projects in education, in Romania,
Moldova, Cyprus, UAE, Lebanon, Azerbaijan.
Project manager, Technical Leader, Senior Architect, Software Engineer,
QA Lead @ SIVECO Romania (2000-2004)
• Software development, architecture, design, deployment; on various
tools and technologies; of IT systems for recruitment, job search, HR,
skill management, video-on-demand, web, eLearning.
• Project Director SEI – the national eLearning/education project, 300
mil. Eur in 6 phases (2001-2009), with development and rollout for
190,000 computers in 15,000 schools; training of 150,000 teachers;
millions of end-users.
IT consultant (1997-2000)
• Software development, support, system administration: the National
Institute of Statistics; Soros Foundation for an Open Society; K.H.
Dietrich International Spedition; ARDOR Foundation for Oratory and
Debate; School Sports Club 6.
Education
• PhD in IT project complexity management – KU Leuven (2021).
• Executive MBA – Tiffin University Ohio, US (2005-2007).
• Software Engineering – Open University UK (May-Oct 2002).
• Project Management – CODECS & Open University (May-Nov 2001).
• Computer Science Engineer – Politehnica University Bucharest
(1995-2000).
Curriculum vitae
Stefan Morcov
239
Training, certifications, events
• Trainings and certifications in project management (HP Global
Method, PMI), EU funds, product management, Solution Selling,
requirements engineering, programming in .net, R; statistics, six-
sigma, negotiation, communication.
• PMP certification.
• Participant and speaker at: UN World Summit for the Information
Society Geneva and Tunis; IST-Africa Johannesburg, Online Educa
Berlin, MS Innovation Day - Brussels, World Education Market -
Lisbon, Oracle OpenWorld - San Francisco, Microsoft Education
Partner Conference – Redmond, Intel Partner events in UAE, Oracle
Technology Day, Romanian Academy symposium, the International
Conference on Virtual Learning, etc.
• Lectures, conferences and seminars on project management,
software engineering, analysis and decision tools, eLearning, project
complexity, public-sector infrastructure projects; innovation.
Awards
• Gold Winner at the EU eLearning Awards 2010 for the SEI project.
• European IT Excellence Award for the SEI project (London 2008).
• Finalist for the IPMA International Project Excellence Awards
(Warsaw 2007).
• National Project Management Excellence Award from IPMA and PM
Romania (2006).
• ICT Prize nomination for AeL eContent (2006, European
Commission).
• World Summit Award for AeL eContent (WSIS, Tunis 2005, UN) – and
the nomination of “best eContent in the world”.
• IST Prize nomination for AeL eLearning platform (2005, European
Commission).
• Nomination and Honorable Mention for eEurope Awards for e-
Government for the AeL eLearning platform (Manchester 2005,
European Commission).
• “Best Practice” label for the ADLIC project (Brussels 2001, European
Commission).
Managing Positive and Negative Complexity:
Design and Validation of an IT Project Complexity Management Framework
240
Main areas of expertise
• Management, strategy, operations, finance, HR, quality, legal.
• Business development, sales, presales, bid, marketing, PR, product.
• Contract, customer, program and project management.
• International and multicultural experience, in 36 countries in
Europe, Asia, America, Africa – with a strong focus on EU affairs.
• All aspects of software engineering, from analysis, design and
development, to architecture, deployment, and support of large-scale
distributed systems.
• Hands-on technical experience with a wide range of IT architectures,
platforms, tools and methodologies: PC, PowerPC, RISC, gcloud,
Azure; on MS Windows, MacOS, Linux, AIX; in Java/J2EE, C++, ASM,
Pascal, SQL, DHTML, js, VBA/VBS, php, Python, R; on Oracle DB, MS
Access, FoxPro, mySql, PostgreSql; with various app/web servers:
Oracle, Websphere, Apache, Orion, IIS; with OOAD, RAD, FDD,
Waterfall, RUP, Agile.
Languages
• Romanian, English, French, Italian, German.
Other interests
• History, SF, etymology, philosophy, psychology, motorcycles, sailing,
guitar.
List of publications
241
List of publications
Peer-reviewed
Morcov, S., Pintelon, L., & Kusters, R. J. (2021b). A Practical Assessment of
Modern IT Project Complexity Management Tools: Taming Positive,
Appropriate and Negative Complexity. International Journal of
Information Technology Project Management, 12(3), 90-108.
doi:10.4018/IJITPM.2021070106
Morcov, S., Pintelon, L., & Kusters, R. J. (2021a). A Framework for IT Project
Complexity Management. IADIS IS 2021: 14th IADIS International
Conference Information Systems (pp. 61-68)
Morcov, S., Pintelon, L., & Kusters, R. J. (2020b). IT Project Complexity
Management Based on Sources and Effects: Positive, Appropriate and
Negative. Proceedings of the Romanian Academy - Series A, 21(4),
329-336
Morcov, S., Pintelon, L., & Kusters, R. J. (2020a). Definitions, characteristics
and measures of IT Project Complexity - a Systematic Literature
Review. International Journal of Information Systems and Project
Management, 8(2), 5-21. doi:10.12821/ijispm080201
Morcov, S. (2020). Modern Agile Learning Environment. INTED2020 Proceedings (14th International Technology, Education and
Development Conference), ISBN: 978-84-09-17939-8, 9336-9345.
doi:10.21125/inted.2020.2582
Morcov, S., Pintelon, L., & Kusters, R. J. (2012). Challenges of implementing a
large-scale eLearning and collaboration platform - the DIAS project,
Cyprus. Leveraging Technology for Learning - Proceedings of the 8th
International Scientific Conference "eLearning and Software for
Education" ELSE, 223-228. DOI: 10.5682/2066-026X-12-127
Morcov, S. (2012). Complex IT Projects in Education: The Challenge,
International Journal of Computer Science Research and Application,
Vol. 02, Issue 01 (Special Issue), pp. 115-125, ISSN 2012-9564
Morcov, S. (2011). Complex IT Projects in Education: The Challenge,
Published in The 6th International Conference on Virtual Learning -
2011 proceedings, pp. 78-88, ISSN 1844-8933
Managing Positive and Negative Complexity:
Design and Validation of an IT Project Complexity Management Framework
242
Morcov, S., & Dragomirescu, E. (2006). eGovernment portal in education.
eGovernment Best Practices Conference - European Commission,
Brussels
Morcov, S., & Cosbuc, A. (2006) Technology Enhanced Learning and ICT
Skills. IST-Africa 2006 Conference Proceedings, Paul Cunningham
and Miriam Cunningham (Eds). IIMC International Information
Management Corporation, ISBN: 1-905824-01-7
Josceanu, A.M., Isopescu, R., Plesu, V., & Morcov, S. (2005). Integrated e-
learning platform for chemical engineering education. Studia Chemia
– ed. 2
Plesu, V., Isopescu, R., Onofrei, R., Josceanu, A.M., Dima, R. & Morcov, S. (2004)
- Development of an e-Learning System for Chemical Engineering
Education. iCEER Conference - Olomouc, Bouzov Castle
Morcov, S. (2004). How to set-up activities in SeLFT. eLearning in
Engineering Education workshop, Politehnica University Bucharest -
the 4th SIG Workshop, organized by the Faculty of Industrial
Chemistry and Center for Technology Transfer in the Process
Industries (UPB-CTTIP)
Morcov, S., & Ilia, F. (2003). Nationwide Implementation of the Educational
IT-Based System in Romania – a Success Story. Building the
Knowledge Economy: Issues, Applications, Case Studies - Paul
Cunningham, Miriam Cunningham, & Peter Fatelnig (Eds), IOS Press
Amsterdam, ISBN: 1-58603-379-4
Non peer-reviewed
Morcov, S. (2020). Complexity & innovation in engineering management.
Lecture, KU Leuven
Morcov, S. (2020). Complexity & innovation in public sector IT projects - The
supplier perspective. Lecture, Erasmus Mundus Master of Science in
Public Sector Innovation and eGovernance, and Public Management,
KU Leuven
Morcov, S. (2020). The New Manhattan business district is online: Cultural
and anthropological implications of technology-based lifestyle
changes in the Covid-19 society
Morcov, S. (2020). AI Ethics, Machine Law and Robophobia
Morcov, S. (2019). Collaborative knowledge building
List of publications
243
Morcov, S. (2019). Welcome to TALE: Tremend’s Agile Learning
Environment
Morcov S. (2018, 2019). Complex IT projects in public administration.
Lectures in Katholieke Universiteit Leuven
Morcov, S. (2009). Comunicarea în contextul pieţei unice europene. In Dan
Luca – “Dilemele comunicării Uniunii Europene”. ISBN 978-606-
92176-6-5
Morcov, S. (2006). Education and Training for the Future in IT. SEE Regional
Market Opportunity Forum, Regional Competitiveness Annual
Forum “Profit from Knowledge and Networks” - USAID
Morcov, S. (2005). Elements of Project Management. SIVECO Romania
Summer School - Drobeta Turnu-Severin
Morcov, S. (2004). Formal methods of analysis and decision. SIVECO
Romania Summer School - Poiana Pinului, Buzau
Morcov, S. (2004). Don’t be a software coder. SIVECO Romania Summer
School - Turnu-Severin
Morcov, S. (2002). IT system for national admission in high-schools (Adlic).
Government e-Public Services conference, World Education Market -
Lisbon
Morcov, S. (2002). IT system for national admission in high-schools (Adlic).
Symposium organized by the Sciences and IT Technology Section of
the Romanian Academy
Morcov, S. (2002). Case study on Java/J2EE software development. Oracle
Technology Day

244
FACULTY OF ENGINEERING SCIENCE
Department of Mechanical Engineering
Industrial Management/Traffic and Infrastructure (CIB), Leuven (Arenberg) Unit
Celestijnenlaan 300 - box 2422
B-3001 Leuven, Belgium
tel. +32 16 3 22567
https://www.mech.kuleuven.be/en/cib