Embed Size (px)
Citation preview

IRRIGATION AND DRAINAGE
Irrig. and Drain. 58: 157–170 (2009)
Published online 17 July 2008 in Wiley InterScience (www.interscience.wiley.com) DOI: 10.1002/ird.405
MANAGING IRRIGATION DEMAND TO IMPROVE SEASONALITY OFRIVER FLOWSy
SHAHBAZ KHAN1,2*, AFTAB AHMAD1,2 AND HECTOR M. MALANO2,3
1International Centre of Water for Food Security, Charles Sturt University, Wagga Wagga, Australia2Cooperative Research Centre for Irrigation Futures, Wagga Wagga, Australia
3University of Melbourne, Melbourne, Australia
ABSTRACT
Human interventions often lead to unsustainable river systems. There is always a trade-off between level of
socio-economic gains from consumptive use in the river system and the need to maintain the natural seasonality of
river flows supporting the ecosystem function. In the case of the Murrumbidgee River, Australia, irrigation demand
is concentrated in the summer season while natural inflows to the river occur during the winter season. The
summer-dominated irrigation water demand has created environmental and supply problems by altering the natural
flow regime. This paper presents a hydrologic assessment of a range of irrigation demand management options for
improving the natural seasonality of the river flow. Among the possible alternatives, change of cropping pattern by
achieving a better mix of summer and winter crops is recommended as the most feasible alternative, which can also
save up to 211 million m3 of water yearly. This water can then be released during the winter time to augment the
environmental flows of the river. Other irrigation demand management options explored in this paper include
aquifer storage and recovery, on-farm and off-farm water savings and construction of intermediate surface water
storages. Copyright # 2008 John Wiley & Sons, Ltd.
key words: seasonality of river flows; hydrologic assessment; irrigation demand management; environmental flows; Murrumbidgee River;Australia
Received 6 May 2007; Revised 18 January 2008; Accepted 18 January 2008
RESUME
Les interventions humaines menent souvent a des regimes de riviere non durables. Il y a toujours un arbitrage entre
le niveau des gains socio-economiques pour les usages consommateurs dans la riviere et le besoin de maintenir la
repartition saisonniere des debits qui favorise les fonctions de l’ecosysteme. Dans le cas de la riviereMurrumbidgee
en Australie, la demande d’irrigation est concentree dans la saison d’ete tandis que les apports normaux a la riviere
se produisent pendant la saison d’hiver. La demande estivale pour l’irrigation a cree des problemes environne-
mentaux et d’approvisionnement en eau en changeant le regime normal d’ecoulement. Cet article presente
l’evaluation hydrologique d’une gamme d’options de gestion de la demande d’irrigation pour ameliorer la
saisonnalite normale des debits de la riviere. Parmi les alternatives possibles, le changement de l’assolement en
proposant une meilleure repartition des cultures d’ete et d’hiver est recommande comme l‘alternative la plus
faisable, ce qui peut egalement economiser chaque annee jusqu’a 211 million m3. Cette eau peut alors etre liberee
pendant l’hiver pour augmenter les ecoulements environnementaux du fleuve. D’autres options de gestion de la
demande d’irrigation explorees dans cet article sont le stockage en aquifere, les economies sur et en dehors de
*Correspondence to: Shahbaz Khan, Professor of Hydrology, International Centre ofWater for Food Security, Charles Sturt University; ProgramLeader, Cooperative Research Centre for Irrigation Futures; and Senior Principal Scientist, CSIRO Land and Water, Locked Bag 588, WaggaWagga, NSW 2678, Australia. E-mail: [email protected] la demande d’irrigation pour ameliorer la saisonnalite des debits de riviere.
Copyright # 2008 John Wiley & Sons, Ltd.

158 S. KHAN ET AL.
l’exploitation et la construction de stockage intermediaires pour les eaux de surface. Copyright# 2008 JohnWiley
& Sons, Ltd.
mots cles: saisonnalite des debits de riviere; evaluation hydrologique; gestion de demande d’irrigation; debits environnementaux; riviereMurrumbidgee; Australie
INTRODUCTION
Rational decisions on quantity and timing of water to be held by in-stream reservoirs and how much water is to be
taken off-stream for consumptive and non-consumptive seasonal uses are a challenge for water resource managers
and river flow regulators in a river catchment. Physical constraints of the system and the environmental impacts
must be considered along with the economic benefits of river flow regulation. Flows in major rivers of the
Murray-Darling Basin (MDB) are highly regulated. The MDB is located in the south-east of Australia and covers
1 061 469 km2, equivalent to 14% of the country’s total area. The basin is defined by the catchment areas of the
Murray and Darling Rivers and their many tributaries (Figure 1). Most of the basin is composed of extensive plains
and low undulating areas, mostly below 200m above sea level. Of greatest extent are the vast plains, the Darling
Plain in the north, drained by the Darling and its tributaries, and the Riverine Plain in the south, drained by the
Rivers Murray and Murrumbidgee and their tributaries. The MDB is spread over five states and territories of
Australia with areas in: New South Wales (57%), Victoria (12%), Queensland (25%), South Australia (6%) and the
Australian Capital Territory (less than 1% of the basin). The MDB contains more than 20 major rivers as well as
important groundwater systems. It is also an important source of fresh water for domestic consumption, agricultural
production and industry. Although the MDB receives only 6% of Australia’s annual rainfall, around 40% of the
value of the nation’s agricultural production is generated here, and 70% of the value of Australian irrigation occurs
in the region, which has 2 million residents.
Increasing water scarcity and high demands on existing supplies have brought the river systems under great
pressure (Lovett et al., 2002). Due to soaring water demand, the physical characteristics of the river systems within
the basin have been extensively and significantly modified through a range of interventions; the most significant of
these are associated with flow regulation (King and Brown, 2003). Such is the case with the Murrumbidgee River. It
is the major river in the state of New South Wales and the Australian Capital Territory originating from the Snowy
Figure 1. Map of major rivers and their tributaries of the Murray Darling Basin (Source: adopted from Khan et al., 2007a)
Copyright # 2008 John Wiley & Sons, Ltd. Irrig. and Drain. 58: 157–170 (2009)
DOI: 10.1002/ird

IRRIGATION DEMAND MANAGEMENT 159
Mountains, part of the Australian Alps near Mount Kosciusko. The main stream of the river is 1600 km long and is
the major tributary of the Murray River in MDB. The geographic boundaries of the Murrumbidgee catchment
include the Great Dividing Range in the east, the Lachlan River Valley to the north and the Murray River Valley to
the south. The total annual turnover of economic activity in the Murrumbidgee Valley is A$ 8 billion, contributing
A$3.8 billion to the gross domestic product (Pratt Water, 2004). (1 A$¼ 0.74 US$ in 2004.)
The Murrumbidgee River is a highly regulated stream incorporating eight weirs (Ebsary, 1992), over 10 000 km
of irrigation canals and draining 84 000 km2 of catchment area from its source to its confluence with the Murray
River (Khan et al., 2004). The weirs were constructed for domestic water supply, stock water supply, irrigation,
diversion to irrigation areas and diversion to effluent streams. The total catchment area above Burrinjuck Dam is
13 000 km2. The storage capacity of Burrinjuck Dam is 1026 million m3. Below Burrinjuck Dam, the river flows
initially through a narrow reach and then a widening valley near Gundagai. The Tumut River joins the
Murrumbidgee River upstream of Gundagai. The total catchment area of the Tumut River is 4000 km2. Blowering
Dam is the major storage on the Tumut River; it stores both natural river flows and water that has been released from
the Snowy Mountains Hydroelectric Scheme. The overall capacity of Blowering Dam is 1632 million m3. The two
storages release water based on seasonal allocations, with flows mostly released between September and March
when all weir operations are based on irrigation demand. The main flow constraints in the Murrumbidgee system
include the limited conveyance capacity of the Tumut River (<9 million m3 day�1) and the Gundagai Choke
(<32 million m3 day�1) (Khan et al., 2004).
The catchment is divided into three climatological zones – upper, middle and lower Murrumbidgee. Average
annual rainfall (1950–2000) in the upper part of the Tumut catchment is 768mm. In the middle reach at Gundagai it
is around 584mm and in the lower reach between Darlington Point and Balranald the average annual rainfall is
428mm. Rainfall in the Murrumbidgee catchment decreases from east to west. The potential evapotranspiration
varies from 1000mm in the east to over 1600mm per annum in the west. In the lower zone, January is the hottest
month with average daily maximum and minimum temperatures of 32 and 168C. In the upper zone, the average
daily maximum and minimum temperatures are 21 and 68C. July has average maximum and minimum
temperatures of 14 and 48C for the lower zone and 4 and�48C for most parts of the upper zone (Khan et al., 2004).
The major hydrological issues in this catchment include altered flow regimes and their impacts on river and
wetland ecosystems, water quality and high salinity in dryland and irrigation areas. Many irrigators are fearful of
losing valuable entitlements and access to water supplies. There is also concern about groundwater depletion and
the risk of groundwater contamination (Khan, 2004). Moreover, the impacts of these altered flow regimes on
wetlands along the watercourses are significant, and vary markedly depending on the nature and extent of the
alteration to the flow regime (Ritchie and James, 2000). Since irrigation is the main user of water in the catchment,
the aim of this paper is to investigate a range of hydrologic and management solutions for irrigation demand that
can ultimately improve or augment the restoration process of the seasonality of natural flows in the Murrumbidgee
River. This paper provides the details of a hydrologic framework to assess water demand management options
which is a new way of visualising river flow augmentation options for the restoration of the seasonality of natural
flows in the Murrumbidgee River.
STUDY AREAS
This study focused on two main irrigation areas (Figure 2) which are major users of water in the Murrumbidgee
catchment: the Murrumbidgee Irrigation Area (MIA) and the Coleambally Irrigation Area (CIA) and which can
bring about significant change in the system. The water year in this area starts on 1 July and ends on 30 June each
year. Water for these two irrigation areas is stored in the Burrinjuck and Blowering reservoirs. The key
characteristics of these irrigation areas are given below:
Murrumbidgee Irrigation Area (MIA)
TheMIA is located in middle to the lower reach of theMurrumbidgee River covering approximately 3624 km2. It
consists of the Yanco, Mirrool, Benerembah, Wah Wah and Tabbita irrigation districts. The topography is a
Copyright # 2008 John Wiley & Sons, Ltd. Irrig. and Drain. 58: 157–170 (2009)
DOI: 10.1002/ird

Figure 2. Map of the Murrumbidgee River catchment
160 S. KHAN ET AL.
relatively flat open plain at an elevation of 100–135 m above sea level. Metered water is delivered onto farms and
farmers pay for the volume of water supplied which is used for crops such as grapes, citrus, rice, wheat, barley, oats,
canola, soybeans, maize, sunflowers, lucernes and pastures for sheep and cattle. Drainage water from irrigation
farms flows through the Mirrool Creek to Barren Box Swamp and then flows into the irrigation districts of
Benerembah, Tabbita and Wah Wah.
Coleambally Irrigation Area (CIA)
The CIA is located to the south of the Murrumbidgee River. The irrigation area was developed during the 1960s
to make use of water diverted westward as a result of the Snowy Mountains Hydroelectric Scheme. Water is
diverted to the area from the Murrumbidgee River at the Gogeldrie Weir. Drainage water flows via Yanco and
Billabong creeks before entering the Murray River. Irrigation water is used for crops such as rice, wheat, barley,
oats, canola, soybeans, maize, sunflowers, lucernes, grapes, prunes and pastures for sheep and cattle. Irrigation has
turned what used to be less productive land into highly productive land, which produces a diverse range of food that
ends up on the dinner tables of many Australians. Export of produce is also important for the regional economy as
over 80% of rice is destined for overseas markets.
DATA ANALYSIS
Currently water users in theMurrumbidgee Valley (Table I) have a combined entitlement (upper limit of the volume
of water which can be allocated during a given year depending on the availability of water) of 2754 million m3,
which is close to 65% of the average annual flow volumes of 4300 million m3, of the Murrumbidgee River past the
regional city of Wagga Wagga (Pratt Water, 2004). Clearly, irrigation is the main user of surface water (63% of
Copyright # 2008 John Wiley & Sons, Ltd. Irrig. and Drain. 58: 157–170 (2009)
DOI: 10.1002/ird
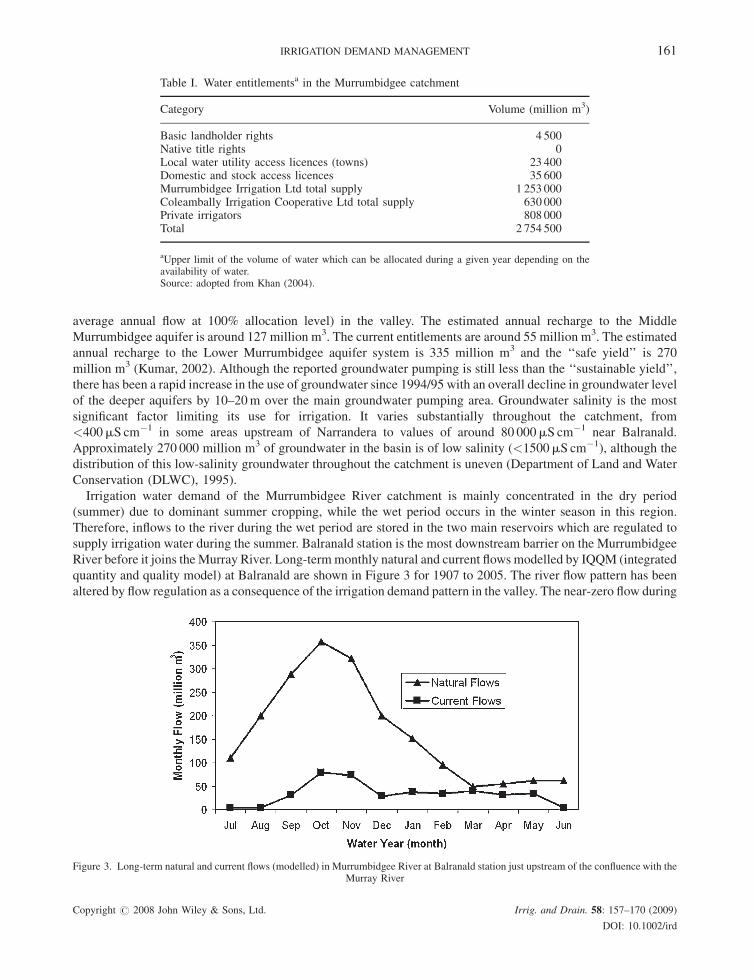
Table I. Water entitlementsa in the Murrumbidgee catchment
Category Volume (million m3)
Basic landholder rights 4 500Native title rights 0Local water utility access licences (towns) 23 400Domestic and stock access licences 35 600Murrumbidgee Irrigation Ltd total supply 1 253 000Coleambally Irrigation Cooperative Ltd total supply 630 000Private irrigators 808 000Total 2 754 500
aUpper limit of the volume of water which can be allocated during a given year depending on theavailability of water.Source: adopted from Khan (2004).
IRRIGATION DEMAND MANAGEMENT 161
average annual flow at 100% allocation level) in the valley. The estimated annual recharge to the Middle
Murrumbidgee aquifer is around 127 million m3. The current entitlements are around 55 million m3. The estimated
annual recharge to the Lower Murrumbidgee aquifer system is 335 million m3 and the ‘‘safe yield’’ is 270
million m3 (Kumar, 2002). Although the reported groundwater pumping is still less than the ‘‘sustainable yield’’,
there has been a rapid increase in the use of groundwater since 1994/95 with an overall decline in groundwater level
of the deeper aquifers by 10–20m over the main groundwater pumping area. Groundwater salinity is the most
significant factor limiting its use for irrigation. It varies substantially throughout the catchment, from
<400mS cm�1 in some areas upstream of Narrandera to values of around 80 000mS cm�1 near Balranald.
Approximately 270 000 million m3 of groundwater in the basin is of low salinity (<1500mS cm�1), although the
distribution of this low-salinity groundwater throughout the catchment is uneven (Department of Land and Water
Conservation (DLWC), 1995).
Irrigation water demand of the Murrumbidgee River catchment is mainly concentrated in the dry period
(summer) due to dominant summer cropping, while the wet period occurs in the winter season in this region.
Therefore, inflows to the river during the wet period are stored in the two main reservoirs which are regulated to
supply irrigation water during the summer. Balranald station is the most downstream barrier on the Murrumbidgee
River before it joins theMurray River. Long-termmonthly natural and current flows modelled by IQQM (integrated
quantity and quality model) at Balranald are shown in Figure 3 for 1907 to 2005. The river flow pattern has been
altered by flow regulation as a consequence of the irrigation demand pattern in the valley. The near-zero flow during
Figure 3. Long-term natural and current flows (modelled) in Murrumbidgee River at Balranald station just upstream of the confluence with theMurray River
Copyright # 2008 John Wiley & Sons, Ltd. Irrig. and Drain. 58: 157–170 (2009)
DOI: 10.1002/ird

Table II. Crop coefficients for selected crops in NSW (Meyer, 1996)
Crops Sowing Jul Aug Sep Oct Nov Dec Jan Feb Mar Apr May Jun Maturity
Rice 15 Oct 0.20 0.30 0.40 1.00 1.10 1.10 1.10 1.10 1.00 0.40 0.20 0.20 15 MarWheat 15 May 0.90 1.05 1.05 0.80 0.50 0.20 0.20 0.20 0.20 0.30 0.40 0.60 13 NovOats 20 Apr 1.00 1.05 1.05 0.70 0.30 0.20 0.20 0.20 0.20 0.30 0.50 0.80 20 NovBarley 31 May 0.80 1.00 1.00 0.90 0.50 0.20 0.20 0.20 0.20 0.30 0.35 0.50 15 NovMaize 1 Nov 0.40 0.40 0.30 0.35 0.50 0.70 0.85 0.85 0.60 0.30 0.30 0.40 10 MarCanola 30 Apr 0.70 0.75 0.75 0.70 0.40 0.20 0.20 0.20 0.20 0.30 0.40 0.60 30 OctSoybean 30 Nov 0.40 0.40 0.30 0.30 0.30 0.45 0.75 1.05 1.00 0.50 0.30 0.40 15 AprSummer pasture 1 Sep 0.80 0.80 0.80 0.85 0.85 0.85 0.85 0.85 0.85 0.85 0.80 0.80 PerennialWinter pasture 25 Mar 0.80 0.80 0.80 0.60 0.40 0.20 0.20 0.20 0.20 0.40 0.60 0.70 PerennialLucerne 1 Oct 0.65 0.65 0.90 1.20 1.30 1.30 1.30 1.30 1.20 1.20 1.00 0.65 PerennialVines 1 Sep 0.40 0.40 0.45 0.50 0.50 0.50 0.60 0.50 0.50 0.40 0.30 0.30 PerennialCitrus 1 Jul 0.70 0.70 0.70 0.60 0.60 0.60 0.60 0.60 0.70 0.70 0.70 0.70 PerennialStone fruit 1 Sep 0.40 0.40 0.50 0.65 0.75 0.80 0.80 0.80 0.80 0.80 0.70 0.40 PerennialSummer vegetables 30 Aug 0.40 0.40 0.50 0.60 0.65 0.65 0.65 0.60 0.40 0.30 0.30 0.40 PerennialWinter vegetables 1 Apr 0.55 0.50 0.50 0.30 0.30 0.20 0.20 0.20 0.20 0.40 0.50 0.55 Perennial
162 S. KHAN ET AL.
winter months (May to July); whereas the natural flows would be increasing during this period, has created severe
environmental issues including impacts on the ecosystem and biodiversity of the riparian zones. The high daily
flows during the summer period cause flooding along the low conveyance capacity reaches of the upper part of the
catchment near Tumut and Gundagai. For example, the Tumut Land Holders Group is concerned about river
channel erosion and flooding of adjacent land caused by flows greater than 6millionm3 day�1. During the irrigation
season, flows can be as high as 9.3 million m3 day�1. These high flows have been attributed to the widening of the
river up to 20 m on each side. The lower-lying properties are flooded in times of high flows, therefore restricting
their ability to farm. High irrigation demand concentrated in summer and almost no irrigation demand in winter has
effectively altered the role of the river to an irrigation supply channel.
The effects of characteristics that distinguish field crops from the reference grass crop in terms of water
requirement are integrated into the crop coefficient Kc. Kc data based on Meyer (1996) at Griffith Laboratory of
CSIRO for selected crops grown in NSWare given in Table II. The crop coefficients are used later in the analysis to
determine irrigation demand using a reference evapotranspiration on a monthly basis.
METHODOLOGY
The overall framework of the approach used in this study is shown in Figure 4.
For each management option, the overall impact on irrigation demand, reduction of peak water demand and shift
of demand from summer to winter are assessed. In this analysis alternative irrigation demand is computed based on
the assumed spatial and temporal distribution of crops, better use of groundwater and adoption of water-saving
technologies.
In the following sections key components of analysing irrigation demand are assessed.
Reference evapotranspiration (ETo)
The reference crop evapotranspiration is the evapotranspiration rate from a reference surface with no shortage of
water. The reference surface is a hypothetical grass reference crop with specific characteristics. The only factors
affecting ETo are climatic parameters. The FAO Penman-Monteith model (Allen et al., 1998) was selected for ETocalculation as it closely approximates grass ETo and explicitly incorporates both physiological and aerodynamic
parameters.
Copyright # 2008 John Wiley & Sons, Ltd. Irrig. and Drain. 58: 157–170 (2009)
DOI: 10.1002/ird
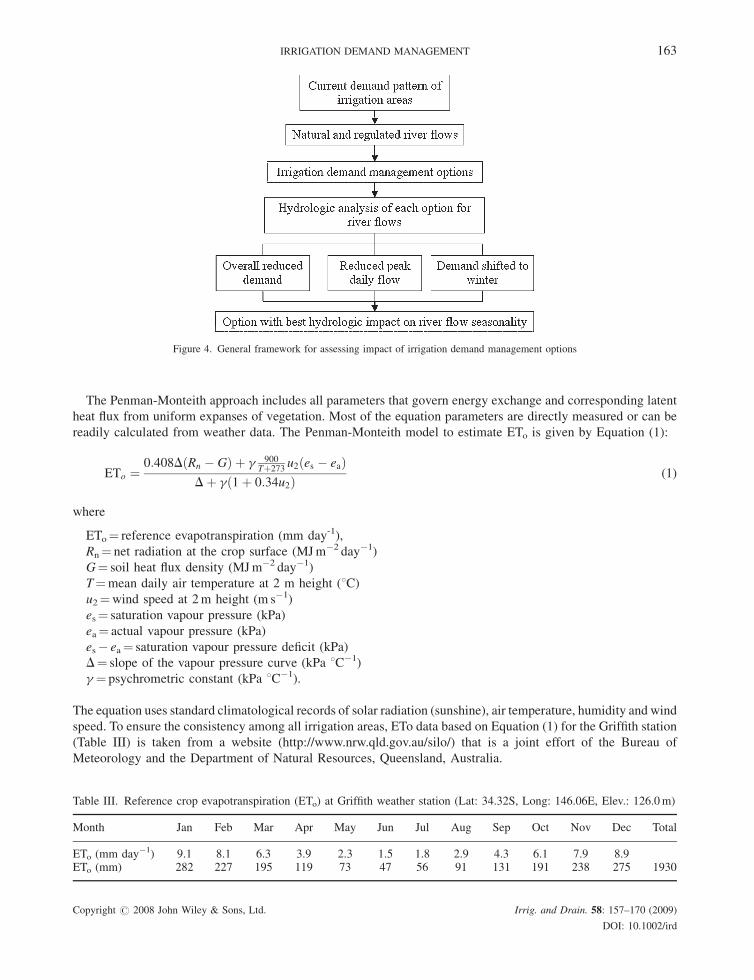
Figure 4. General framework for assessing impact of irrigation demand management options
IRRIGATION DEMAND MANAGEMENT 163
The Penman-Monteith approach includes all parameters that govern energy exchange and corresponding latent
heat flux from uniform expanses of vegetation. Most of the equation parameters are directly measured or can be
readily calculated from weather data. The Penman-Monteith model to estimate ETo is given by Equation (1):
Table
Month
ETo (mETo (m
Copyri
ETo ¼0:408D Rn � Gð Þ þ g 900
Tþ273u2 es � eað Þ
Dþ g 1þ 0:34u2ð Þ (1)
where
ETo¼ reference evapotranspiration (mm day-1),
Rn¼ net radiation at the crop surface (MJm�2 day�1)
G¼ soil heat flux density (MJm�2 day�1)
T¼mean daily air temperature at 2 m height (8C)u2¼wind speed at 2m height (m s�1)
es¼ saturation vapour pressure (kPa)
ea¼ actual vapour pressure (kPa)
es� ea¼ saturation vapour pressure deficit (kPa)
D¼ slope of the vapour pressure curve (kPa 8C�1)
g ¼ psychrometric constant (kPa 8C�1).
The equation uses standard climatological records of solar radiation (sunshine), air temperature, humidity and wind
speed. To ensure the consistency among all irrigation areas, ETo data based on Equation (1) for the Griffith station
(Table III) is taken from a website (http://www.nrw.qld.gov.au/silo/) that is a joint effort of the Bureau of
Meteorology and the Department of Natural Resources, Queensland, Australia.
III. Reference crop evapotranspiration (ETo) at Griffith weather station (Lat: 34.32S, Long: 146.06E, Elev.: 126.0m)
Jan Feb Mar Apr May Jun Jul Aug Sep Oct Nov Dec Total
m day�1) 9.1 8.1 6.3 3.9 2.3 1.5 1.8 2.9 4.3 6.1 7.9 8.9m) 282 227 195 119 73 47 56 91 131 191 238 275 1930
ght # 2008 John Wiley & Sons, Ltd. Irrig. and Drain. 58: 157–170 (2009)
DOI: 10.1002/ird

164 S. KHAN ET AL.
Total crop water requirement
Crop water requirement (CWR) or crop evapotranspiration of a given crop is obtained by multiplying reference
crop evapotranspiration with suitable crop coefficients as given by Equation (2):
Copyri
ETc ¼ ETo � Kc (2)
where ETc¼ crop evapotranspiration (mmday�1) and Kc¼ crop coefficient (dimensionless).
The total crop water requirement over the growth cycle (annual basis) of a crop can be given by Equation (3):
ETcð Þper crop¼Xn
i¼1
ETcð Þi�di (3)
where di¼ number of crop days in a given month i and n¼ last month of crop life.
Net crop water requirement
Subtraction of the amount of effective rain (if any) that falls direct on to a crop field from the total crop water
requirement gives the net (potential) crop water requirement as given by Equation (4). The effective rainfall is
computed by the USDA method (Kassam and Smith, 2001).
CWRnet ¼ ETcð Þper crop�Reff (4)
where CWRnet¼ net crop water requirement (mm) and Reff¼ total effective rain (mm).
The net crop water requirement calculated in this paper does not include the leaching fraction which is almost 5%
in the study area. The actual irrigation requirement of a given crop is calculated by incorporating leaching fraction,
irrigation efficiency and irrigation scheduling criteria.
A wide range of engineering and management options were explored to investigate their direct or indirect
hydrological impact on river flows in terms of increased peak flows, increase in total flow or shift in flow pattern.
The option with most positive and ultimate impact on the river environment was recommended as a possible way
forward for the irrigation community.
RESULTS AND DISCUSSION
Using data given in Tables II and III and Equation (4), monthly net potential water requirement calculated for
selected crops in MIA and CIA for average climatic conditions in 2000/01 is given in Tables IVand V, respectively.
The typical net crop water requirement pattern of the two major irrigation areas, the MIA and CIA, for dry
(1994), wet (1991) and average (1995) climatic conditions shown in Figure 5 indicate that irrigation water demand
of the Murrumbidgee River catchment is mainly concentrated in the dry season (November–February) due to
dominant summer cropping peaking up to 310 million m3 while the wet season occurs in the winter (May–August)
when the irrigation demand is as low as zero in this region.
The hydrological impacts of different irrigation demand management options are discussed below.
Groundwater substitution
Some fraction of surface water can be substituted by groundwater during the months of peak daily irrigation
demand to release pressure on the surface water supply and avoid flooding in certain reaches of the river. Figure 6
shows the amount of monthly groundwater pumped to keep the demand so it does not exceed 200 million m3
month�1. In this case, the total amount of groundwater pumped is 200 million m3 over a period of four months,
resulting in a saving of the same amount of surface water that can be contributed to the environmental flow of the
river. This 200 million m3 of water can be contributed from the existing groundwater entitlements in the Lower
ght # 2008 John Wiley & Sons, Ltd. Irrig. and Drain. 58: 157–170 (2009)
DOI: 10.1002/ird

Table
IV.Net
potential
water
requirem
ents
(millionm
3)forcropsin
theMIA
fortheyear2000/2001under
averageclim
ateconditions
Crop
Area(ha)
Jul
Aug
Sep
Oct
Nov
Dec
Jan
Feb
Mar
Apr
May
Jun
Total
Rice
46120
00
062262
97590
117975
131073
97662
00
00
506562
Wheat
39215
1882
12353
31980
39450
23581
00
00
00
2588
111835
Oats
2896
290
912
2362
2415
824
00
00
64
188
458
7512
Barley
3034
0850
2306
3574
1824
00
00
00
61
8615
Maize
2924
00
00
1598
4462
6322
4842
1588
00
018813
Canola
2685
0282
1296
2239
649
00
00
00
177
4643
Soybean
2881
00
00
1118
2538
5445
6327
2955
00
018383
Summer
pasture
3929
0550
2114
4290
6192
7516
8494
6506
5145
2680
1045
621
45154
Winterpasture
24184
03386
13011
16010
7790
00
00
4305
3192
2709
50403
Lucerne(uncut)
2468
086
1602
4181
6288
7587
8357
6486
4847
2651
987
220
43291
Vines
13635
00
2038
6681
11181
13771
20207
12272
8931
2427
00
77508
Citrus
8700
0609
3715
5759
9013
11032
12893
9709
8952
4472
1731
974
68859
Stonefruit
934
00
191
699
1270
1666
1892
1446
1136
585
186
09071
Wintervegetables
1500
00
308
219
233
00
00
098
65
923
Summer
vegetables
1500
00
0993
1716
2096
2427
1674
00
00
8906
Lucerne(cut)
00
00
00
00
00
00
00
Total
156605
2172
19028
60922
148773
170869
168643
197111
146924
33555
17182
7428
7872
980477
Table
V.Net
potential
water
requirem
ents
(millionm
3)forcropsin
theCIA
fortheyear2000/2001under
averageclim
ateconditions
Crop
Area(ha)
Jul
Aug
Sep
Oct
Nov
Dec
Jan
Feb
Mar
Apr
May
Jun
Total
Rice
26820
00
036207
56751
68606
76222
56793
00
00
294579
Wheat
12388
595
3902
10102
12462
7449
00
00
00
818
35329
Oats
1290
129
406
1052
1076
367
00
00
28
84
204
3346
Barley
2689
0753
2044
3168
1617
00
00
00
54
7635
Maize
2888
00
00
1579
4407
6244
4783
1569
00
018581
Canola
1951
0205
941
1627
471
00
00
00
129
3373
Soybean
4551
00
00
1766
4009
8601
9994
4668
00
029039
Summer
pasture
00
00
00
00
00
00
0Winterpasture
9880
01383
5315
6541
3183
00
00
1759
1304
1107
20591
Lucerne(uncut)
00
00
00
00
00
00
0Vines
00
00
00
00
00
00
0Citrus
00
00
00
00
00
00
0Stonefruit
112
00
23
84
152
200
227
173
136
70
22
01088
Wintervegetables
00
00
00
00
00
00
0Summer
vegetables
00
00
00
00
00
00
0Lucerne(cut)
200
077
178
378
518
619
653
518
411
246
121
51
3771
Total
62769
724
6727
19655
61543
73854
77841
91947
72262
6785
2104
1531
2361
417333
Copyright # 2008 John Wiley & Sons, Ltd.
IRRIGATION DEMAND MANAGEMENT 165
Irrig. and Drain. 58: 157–170 (2009)
DOI: 10.1002/ird

Figure 5. Combined net crop water requirement of the MIA and CIA for the year 2000/01
166 S. KHAN ET AL.
Murrumbidgee Valley. A possible management intervention may be to promote groundwater use during the
summer months while the surface water use is made available during the winter months.
Summer–winter crop mix
As the cropping patterns of the MIA and CIA are dominated by the summer crops requiring more irrigation
water, an appropriate alternative mix of crops grown in summer and winter can effectively reduce the high water
demand during hot months. An alternative mix of summer and winter crops obtained from optimisation in a system
dynamics environment (Khan et al., 2007b) using the Vensim software package (Ventana Systems, 2004) is given in
Table VI for an average year. The objective of the optimisation was to reduce total water requirement while change
in any crop area must not exceed 15% while maintaining the same economic returns. The new alternative crop mix
spares 211 million m3 of summer water demand and reduces the total water demand from 1390 to 1179 million m3.
Figure 7 shows the comparison of current cropping pattern water demand and that of alternative crop mix for the
average climatic conditions. To further explore this option, sensitivity analysis (Figures 8 and 9) was undertaken
using the Vensim software package. Sensitivity of total monthly CWR to the area under rice and vine crops
indicates that CWR is understandably more sensitive to rice than vines (Figures 8 and 9). For example, within 95%
Figure 6. Groundwater substitution to keep surface water demand of the MIA and CIA below 200 million m3 month�1
Copyright # 2008 John Wiley & Sons, Ltd. Irrig. and Drain. 58: 157–170 (2009)
DOI: 10.1002/ird

Table VI. Current and alternative mix of summer and winter crops in the MIA and CIA fora season with average climatic conditions
Crop Current crop areaa (%) Alternative crop areaa (%)
Maize 2.65 6.00Wheat 23.52 25.00Barely 2.61 2.61Canola 2.11 2.00Oat 1.91 4.00Soybean 3.39 3.39Summer vegetables 0.68 0.68Winter vegetables 0.68 2.00Rice 33.25 18.25Summer pasture 1.79 1.79Winter pasture 15.53 15.53Citrus 3.97 8.00Lucerne (cut) 0.09 0.09Lucerne (uncut) 1.13 0.00Stone fruit 0.48 0.48Vines 6.22 10.00
aPer cent of the total irrigated area in the MIA and CIA.
IRRIGATION DEMAND MANAGEMENT 167
confidence limits, change in the rice area by�15 (current per cent area � 15) affects a change in peak (in January)
of CWR between 205 and 335 million m3 as compared to the peak CWR of around 285 million m3 under the current
cropping pattern. Hence it can be envisaged that reduction in the rice area by 15% will reduce the peak summer
water demand for the month of January by 28% and an overall demand reduction by 15%.
A similar sensitivity analysis carried out for vines shows that the total monthly CWR is less sensitive to the
reduction in area under vines (Figure 9).
Aquifer storage and recovery
Aquifer storage and recovery (ASR) sometimes referred to as ‘‘water banking’’ stores water (when available) in
existing natural aquifers and when needed, recovers water from the same aquifer, potentially offering timely
Figure 7. Comparison of current crop water demand and that of new proposed alternative crop mix for the average climatic conditions
Copyright # 2008 John Wiley & Sons, Ltd. Irrig. and Drain. 58: 157–170 (2009)
DOI: 10.1002/ird

Figure 8. Sensitivity of monthly CWR of the MIA and CIA to percentage change in area of rice within 50, 75, 95 and 100% confidence bounds
168 S. KHAN ET AL.
seasonal water supply and more effectively managing peak supply and demand for productive use, reducing the
need to construct surface reservoirs and reducing evaporation losses.
From preliminary feasibility work by Pratt Water (2004), the introduction of ASR in the Murrumbidgee Valley,
specifically the Lower Murrumbidgee Groundwater Area, creates the opportunity for significant water saving. This
may include up to 47 million m3 of avoided evaporative losses and some 181 million m3 of stored water.
Improving end-use efficiency
By improving the on-farm water use efficiency, less water will be required by farmers to maintain the same level
of production. Use of two on-farm water-saving irrigation technologies, a drip irrigation system (DIS) and a
sprinkle irrigation system (SIS), was investigated for on-farm water use efficiency. DIS was selected for
horticultural crops, vines and citrus, and SIS for the other crops. Analysis for a typical 220 ha farm in the catchment
indicated that with the adoption of these water-saving irrigation technologies, the farm will save 0.416 million m3
Figure 9. Sensitivity of monthly CWR of theMIA and CIA to percentage change in area of vines within 50, 75, 95 and 100% confidence bounds
Copyright # 2008 John Wiley & Sons, Ltd. Irrig. and Drain. 58: 157–170 (2009)
DOI: 10.1002/ird

IRRIGATION DEMAND MANAGEMENT 169
of water which is 35% of the total water use of the farm. Adoption of such technology at wider scale in the
catchment will reduce the total irrigation demand and help augment flows in the river.
Improving delivery efficiency
Canal and channel lining is another option to improve conveyance efficiency. Currently, the delivery efficiency in
the MIA and CIA is about 80% and there are about 2050–2566 km of unlined canals in the MIA and 516 km in the
CIA (Australian National Committee on Irrigation and Drainage (ANCID), 2004). There is potential for saving 168
million m3 of water (115 million m3 in the MIA and 53 million m3 in the CIA) through increased investment in
conveyance systems (Pratt Water, 2004).
En route storages
Differences in the timing of irrigation and environmental demands raise the requirement for infrastructure that
can increase the reliability of irrigation supplies by reducing the likelihood that peak season delivery constraints
will become binding and reregulation of spills, for either consumptive or environmental purposes. One option is the
construction of en route storages at suitable locations along the river. After accounting for seepage and evaporation
losses, it was estimated that three above-ground storage reservoirs of 50 million m3 each would help reduce the
peak demand by 119 million m3; whereas a single 250 million m3 en route storage will minimise the peak demand
by 203 million m3. However, this option may require significant infrastructure investment which needs to be further
explored using economic analysis.
CONCLUSIONS
The irrigation industry is the major user of water in the Murrumbidgee River catchment. Increased summer
irrigation demand and flow regulation by major storages have changed the natural flow regime of the river both in
terms of timing and volume of flows. This has resulted in environmental degradation and flow conveyance problems
in some parts of the catchment.
Spreading water demand through a better summer–winter crop mix seems to be the most attractive and feasible
irrigation demand management option for improving the seasonality of flow with a water-saving potential of up to
211 million m3 yr�1. However, it may take time to win acceptance of the farmers to adopt the new alternative
cropping pattern. Groundwater substitution during the summer high demand with the allocated surface water (from
the summer period to the winter period) is another possible option to make additional surface water available for the
environment during the peak irrigation demandmonths. However, there is a need to further investigate groundwater
quality and sustainability issues.
Other demand management options such as construction of intermediate surface water storage and investment in
irrigation efficiency at the farm and the catchment levels require substantial investments and need further
investigations in terms of their economic feasibility.
ACKNOWLEDGEMENT
The authors wish to acknowledge the funding support from the Cooperative Research Centre for Irrigation Futures,
Australia.
REFERENCES
Allen RG, Pereira LS, Raes D, Smith M. 1998. Crop Evapotranspiration: Guidelines for Computing Crop Water Requirements. FAO Irrigation
and Drainage Paper 56, Rome.
Copyright # 2008 John Wiley & Sons, Ltd. Irrig. and Drain. 58: 157–170 (2009)
DOI: 10.1002/ird

170 S. KHAN ET AL.
Australian National Committee on Irrigation and Drainage (ANCID). 2004. Key Irrigation Industry Statistics and Performance Indicators.
Benchmarking Data Report for 2002/2003. Available online: http://www.ancid.org.au/pdf/290604/ANCIDbechmarkdatarep.pdf
Ebsary R. 1992. Regulation of theMurrumbidgee River. In The Murrumbidgee Past and Present, Roberts J, Oliver R. (eds). A. forum on past and
present research on the lower Murrumbidgee River held at CSIRO Division of Water Resources, Griffith, New South Wales. CSIRO Division
of Water Resources, Griffith Laboratory. ISBN 0643056602; 49–59.
Kumar PB. 2002. Review of the Groundwater Use and Groundwater Level Behaviour in the Lower Murrumbidgee Valley. Groundwater Status
Report No. 6. Department of Land and Water Conservation, Murrumbidgee Region: Leeton, Australia.
Department of Land and Water Conservation (DLWC). 1995. State of the Rivers and Estuaries Report – the Murrumbidgee Catchment. NSW
Department of Land and Water Conservation: Sydney, Australia.
Kassam A, Smith M. 2001. FAO Methodologies on Crop Water Use and Crop Water Productivity. FAO (Food and Agriculture Organization)
Paper No. CWP-M07. Expert meeting on crop water productivity, Rome, 3–5 December 2001. Available online: http://www.fao.org/AG/AGL/
aglw/cropwater/docs/method.pdf
Khan S. 2004. Integrating hydrology with environment, livelihood and policy issues: the Murrumbidgee model. Water Resources Development
20(3): 415–429.
Khan S, AhmadA,Wang B. 2007a. Quantifying rainfall and flooding impacts on ground-water levels in irrigation areas: a GIS approach. Journal
of Irrigation and Drainage, ASCE. 133(4): 359–367. doi:10.1061/(ASCE)0733-9437(2007)133:4(359).
Khan S, Yufeng L, Ahmad A. 2007b. Analysing complex behaviour of hydrological systems through a system dynamics approach. Journal of
Environmental Modelling and Software, special issue (EMS). doi:10.1016/j.envsoft.2007.06.006
Khan S, Rana T, Beddek R, Blackwell J, Paydar Z, Carroll J. 2004. Whole of Catchment Water and Salt Balance to Identify Potential Water
Saving Options in the Murrumbidgee Catchment. CSIRO Land and Water, Griffith Laboratory, Australia. Consultancy Report to Pratt Water
Pty Ltd, Australia.
King JM, Brown C. 2003. Environmental flows: Case studies. In Water Resources and Environment: Technical Note C.2, Davis R, Hirji R (eds).
World Bank: Washington, DC.
Lovett S, Edgar B, Price P. 2002. Rivers Arena Strategic Plan 2001–2006. Land & Water Australia: Canberra. ISBN 0 642 760 772.
Meyer WS. 1996. Crop coefficients for selected crop based on lysimeter studies. CSIRO Land and Water, Griffith Laboratory (unpublished).
Pratt Water 2004. The Business of Saving Water – Report of the Murrumbidgee Valley Water Efficiency Project. Pratt Water Pty Ltd, Australia.
ISBN 0 975 725 610
Ritchie KA, James RF. 2000. Optimising the use of wetland benefits in river basin management: a case study from the Murray-Darling Basin,
Australia. In Handbook 4 Guidelines for Integrating Wetland Conservation and Wise Use into River Basin Management. Resolution VII.18 of
the 7thMeeting of the Conference of the Contracting Parties to the Convention onWetlands (Ramsar, Iran, 1971), San Jose, Costa Rica, 10–18
May 1999.
Ventana Systems Inc. 2004. Vensim 5 User’s Guide. Ventana Systems: Harvard, Mass., USA.
Copyright # 2008 John Wiley & Sons, Ltd. Irrig. and Drain. 58: 157–170 (2009)
DOI: 10.1002/ird