Embed Size (px)
Citation preview
Managing HCFC Production and Consumption
Presented by Viraj Vithoontien
The World Bank GroupThe 12th Annual Financial Agent Workshop
15 April 2008Washington, D.C.
Outline
• HCFC Phase-out Schedules for Developed and Developing Countries;
• Current Regulations in Developed Countries;• Major HCFCs in Use Globally;• Global Trend of HCFC Production and
Consumption;• HCFC-22 Emissive and Feedstock Use; and• Interlink between HCFC-22 and HFC-23.
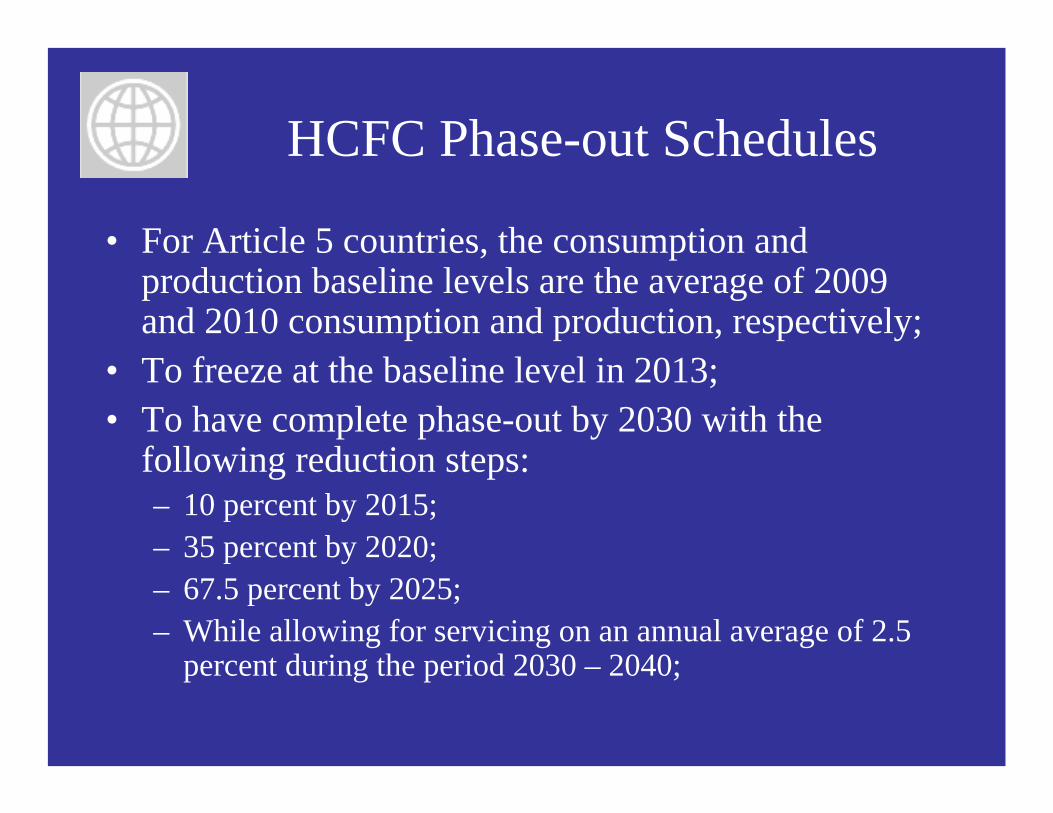
HCFC Phase-out Schedules
• For Article 5 countries, the consumption and production baseline levels are the average of 2009 and 2010 consumption and production, respectively;
• To freeze at the baseline level in 2013;• To have complete phase-out by 2030 with the
following reduction steps:– 10 percent by 2015;– 35 percent by 2020;– 67.5 percent by 2025;– While allowing for servicing on an annual average of 2.5
percent during the period 2030 – 2040;
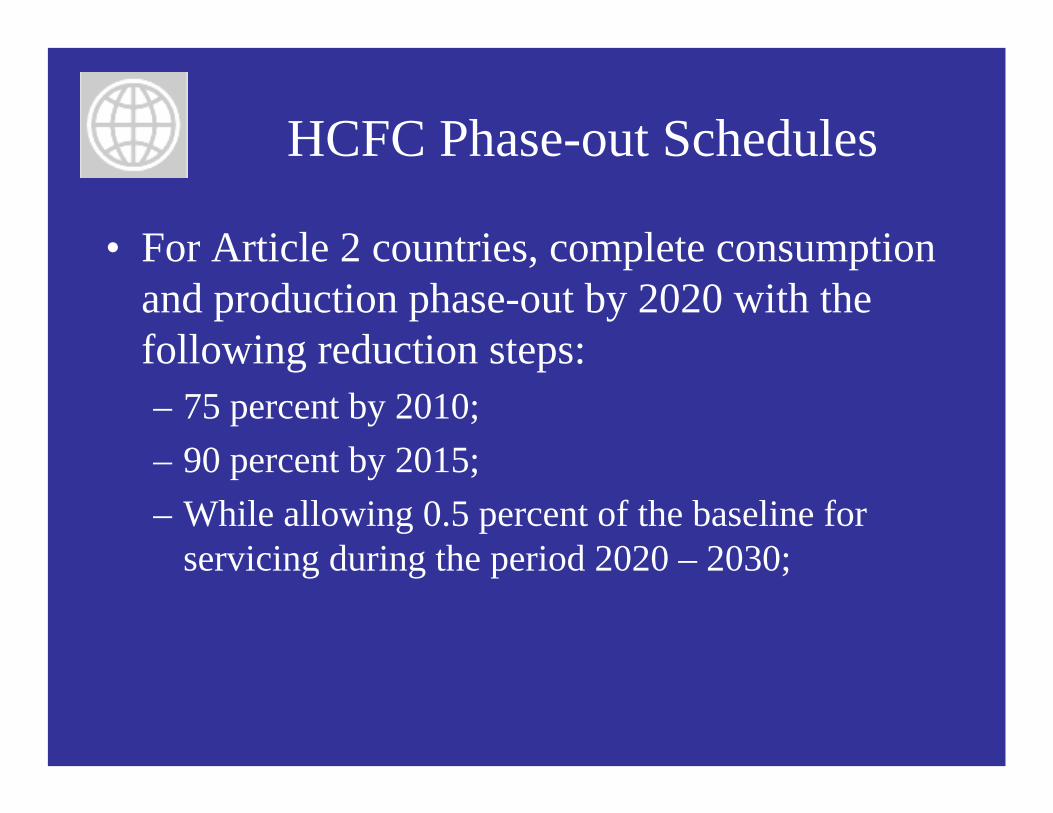
HCFC Phase-out Schedules
• For Article 2 countries, complete consumption and production phase-out by 2020 with the following reduction steps:– 75 percent by 2010;– 90 percent by 2015;– While allowing 0.5 percent of the baseline for
servicing during the period 2020 – 2030;

Current Regulations in Developed Countries
• EU: Initial Regulation 3093/1994 modified the basis of cap calculation and right to place on the market from 2.8% of CFC manufactured in 1989 to 2.6% and with a cut to 65% reduction occurring in 2008 (not 2010) and to 80% reduction in 2014;
• In 2000, Regulation 2037/2000 modified the whole future basis of HCFC phase-out. As of January 2001, the cap was reduced to 2% of 1989 production. The basis for future year phase-out is the 85% of the allowed level in 2001;
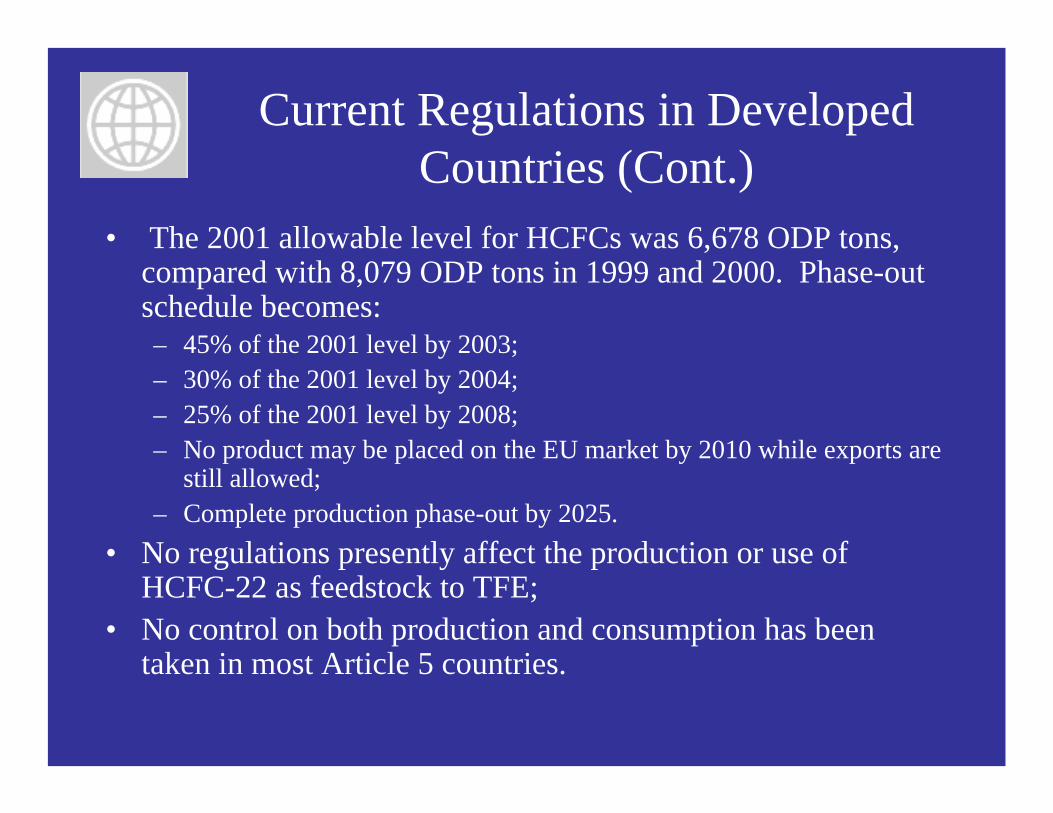
Current Regulations in Developed Countries (Cont.)
• The 2001 allowable level for HCFCs was 6,678 ODP tons, compared with 8,079 ODP tons in 1999 and 2000. Phase-out schedule becomes:– 45% of the 2001 level by 2003;– 30% of the 2001 level by 2004;– 25% of the 2001 level by 2008;– No product may be placed on the EU market by 2010 while exports are
still allowed;– Complete production phase-out by 2025.
• No regulations presently affect the production or use of HCFC-22 as feedstock to TFE;
• No control on both production and consumption has been taken in most Article 5 countries.

• HCFC-22: Closed cell foams, refrigeration, and air-conditioning systems. Virtually, all global HCFC-22 (more than 98%) emissions originate from refrigeration and air-conditioning system;
• HCFC-123: Air-conditioning systems;• HCFC-141b: Insulation foams, solvent, aerosol
propellant;• HCFC-142b: Insulation foams (mostly in developed
countries)*, blended refrigerants (e.g. R-409A and R-409B).
Major HCFCs in Use Globally
*Increasing use in China for production of extruded polystyrene foam
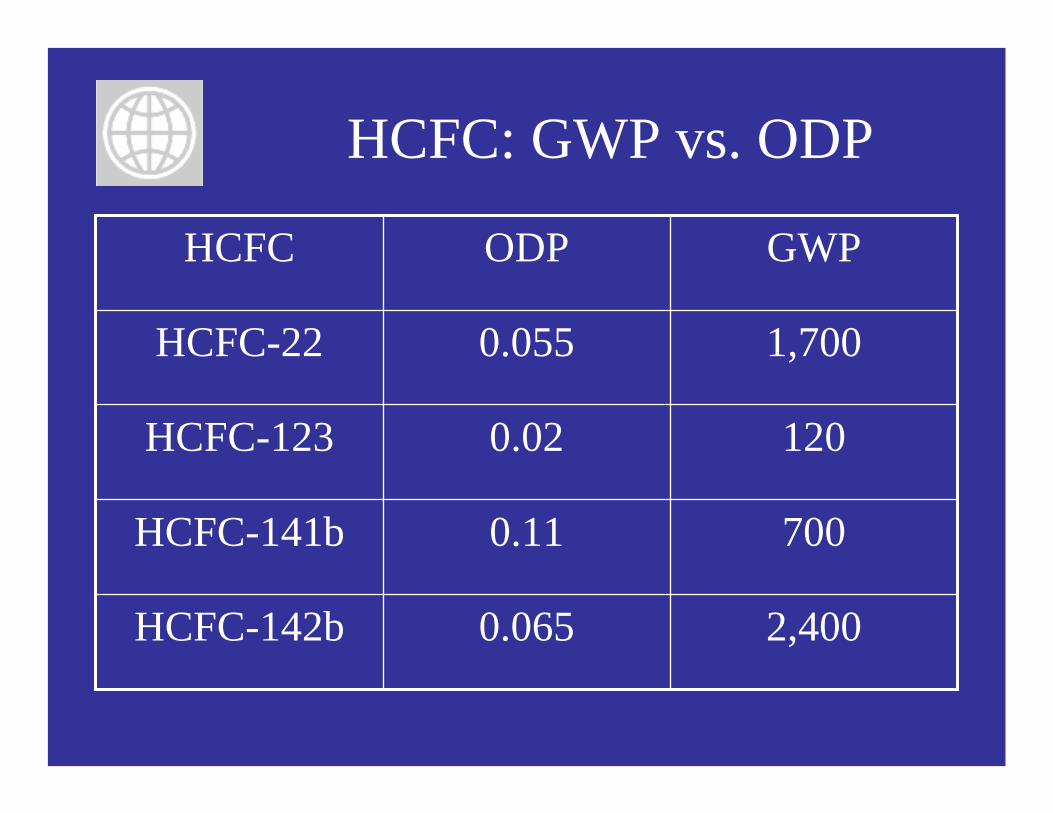
HCFC: GWP vs. ODP
2,4000.065HCFC-142b
7000.11HCFC-141b
1200.02HCFC-123
1,7000.055HCFC-22
GWPODPHCFC
Article 5 Consumption
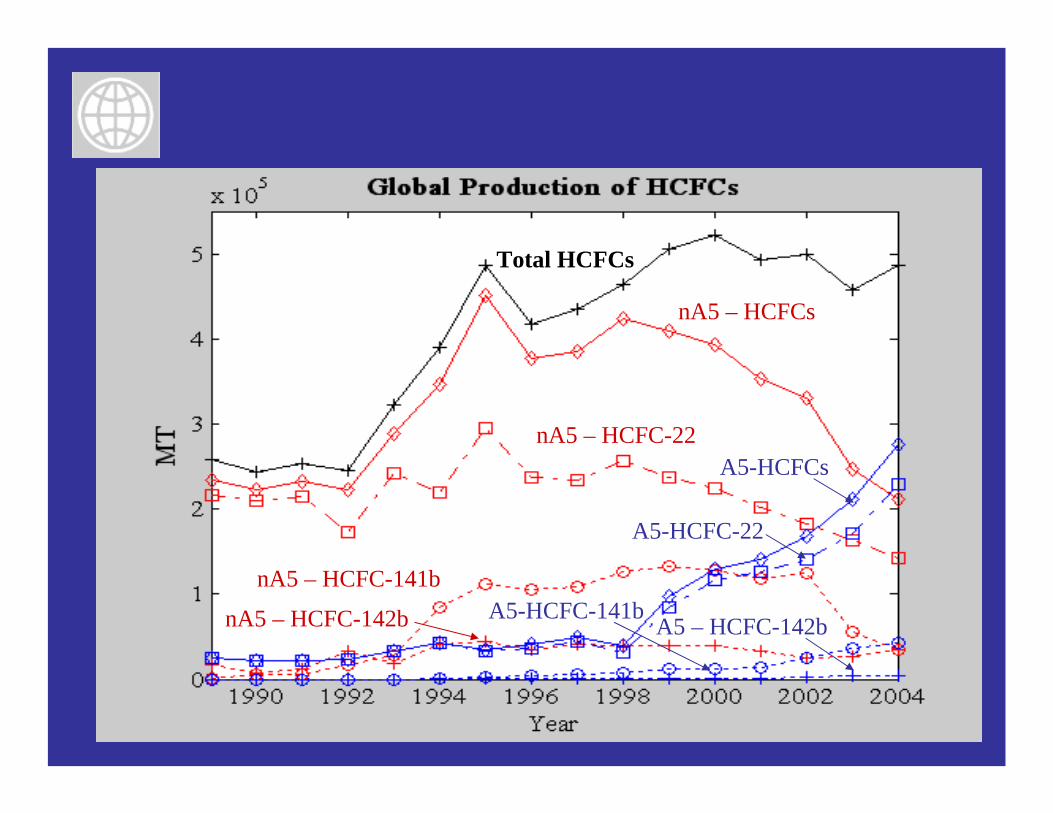
Total HCFCs
nA5 – HCFCs
nA5 – HCFC-22
nA5 – HCFC-141b
nA5 – HCFC-142b
A5-HCFCs
A5-HCFC-22
A5-HCFC-141bA5 – HCFC-142b
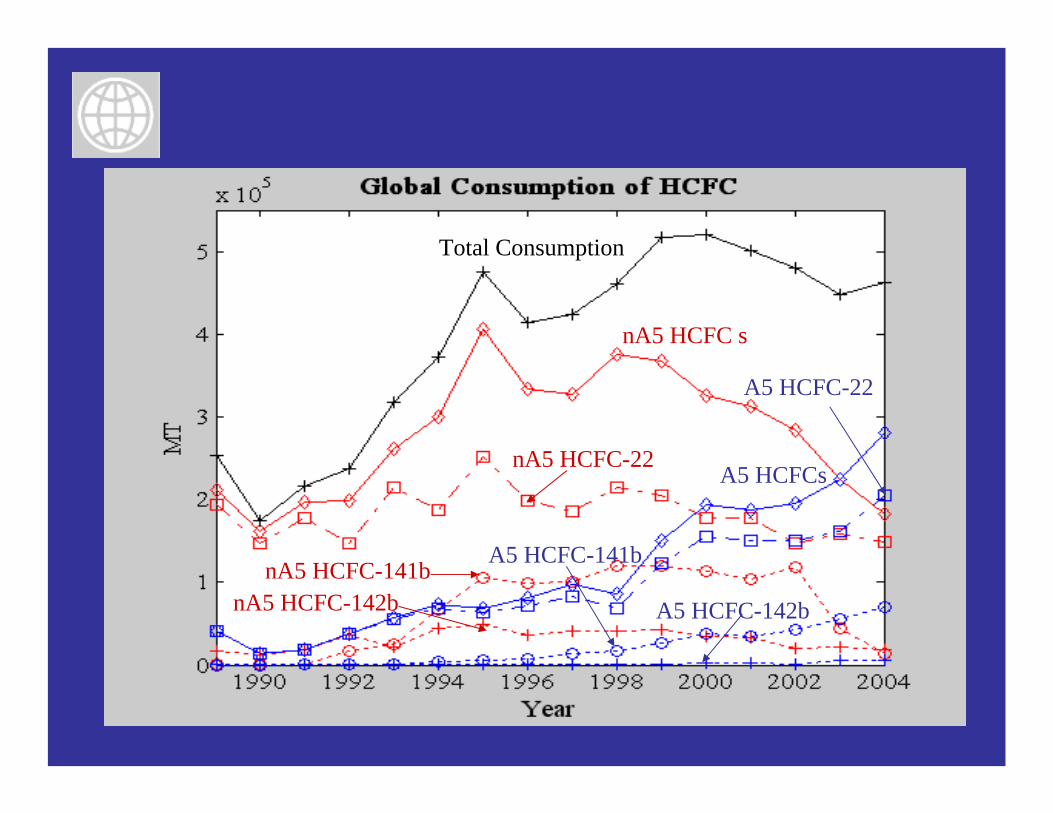
Total Consumption
nA5 HCFC s
nA5 HCFC-142bnA5 HCFC-141b
nA5 HCFC-22A5 HCFCs
A5 HCFC-141b
A5 HCFC-142b
A5 HCFC-22
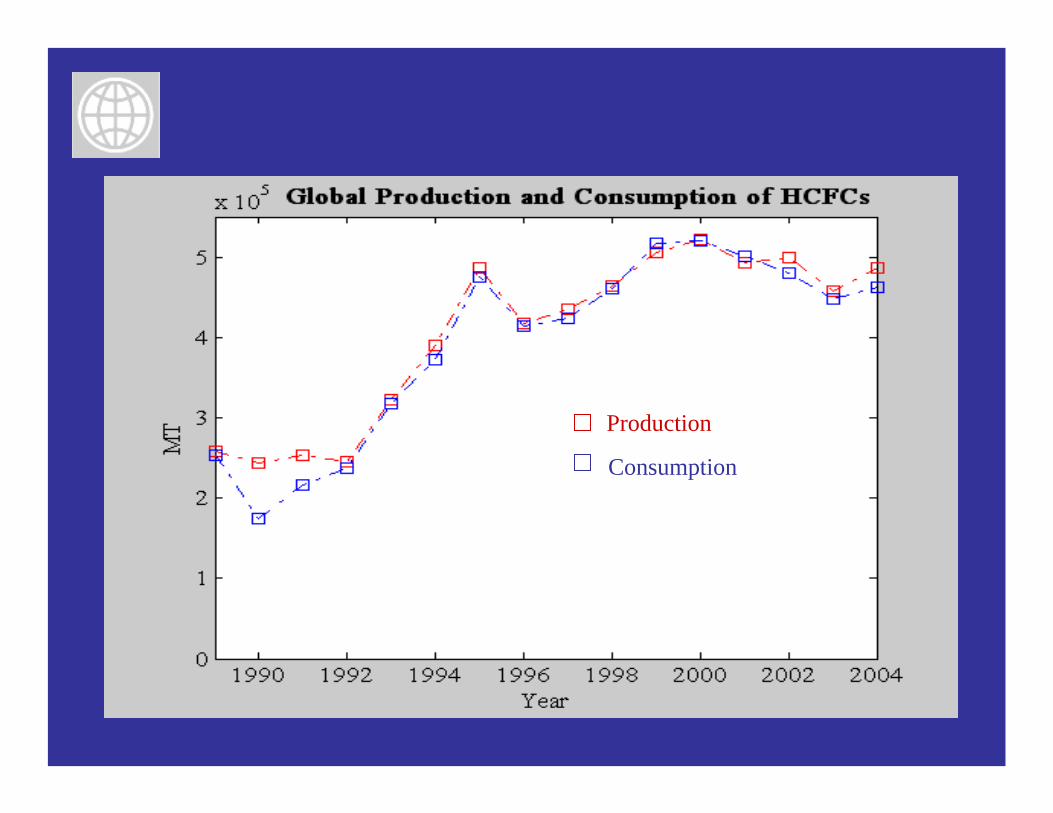
Production
Consumption
HCFC Production and Consumption
• HCFC production and consumption in Article 5 countries have surpassed non-Article 5 countries in 2004;
• HCFC production data on the basis of Article 7 data reporting. Therefore, any HCFC production for feedstock applications (HCFC-22 for polytetrafluoroethylene – PTFE) is not included;
• According to industrial estimate, about 40% of the total HCFC-22 production is for feedstock use in the manufacture of PTFE;
HCFC Production and Consumption (Cont.)
• Production of HCFC-141b is continuously increasing during 2001 – 2004 at the rate of ~40% in Article 5 countries. Production of HCFC-141b in non-A5 countries experienced a decline of ~25% pa. during the same period;
• Consumption of HCFC-141b in A5 countries increasing 8% pa. and decline of 32% pa. in non-A5 countries;
• Consumption of HCFC-142b in A5 countries is still limited. This could change drastically in the coming year depending on the introduction of HCFC-142b in extruded polystyrene foam in China.
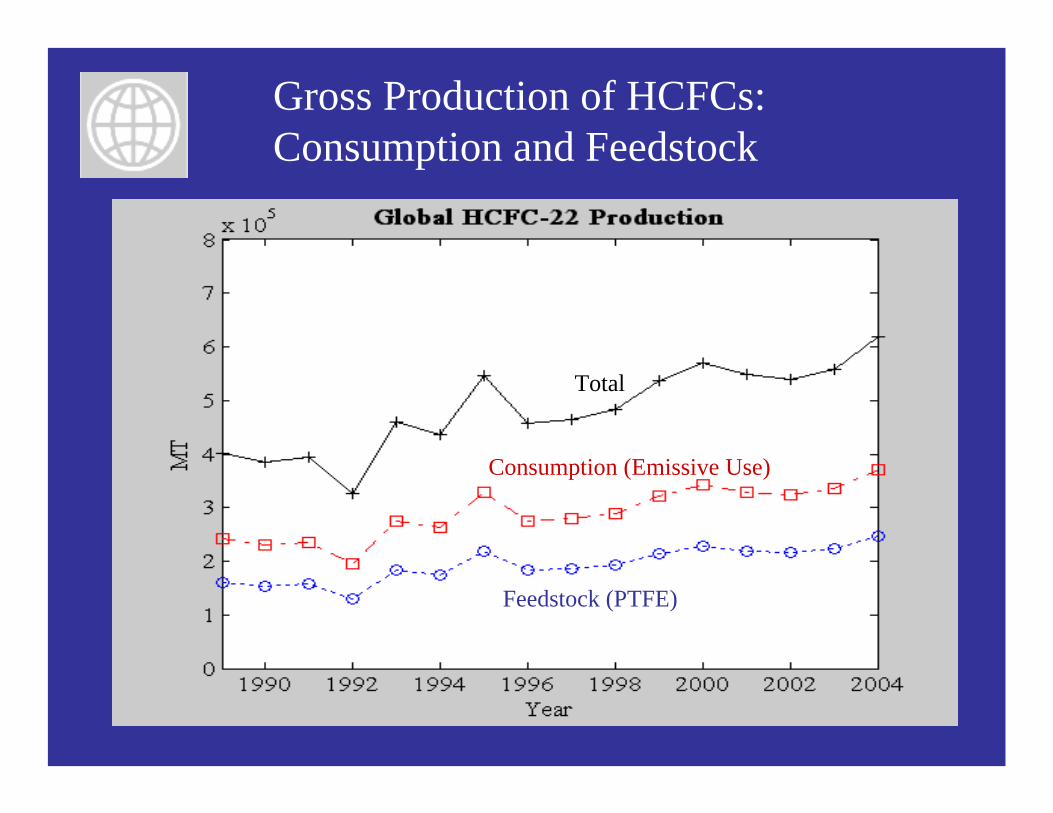
Gross Production of HCFCs:Consumption and Feedstock
Total
Consumption (Emissive Use)
Feedstock (PTFE)
Gross Production of HCFC-22
• Gross production of HCFC-22 in 2004 was 620,000 MT (based on an estimated demand of 40% of gross production for manufacturing of PTFE);
• Global production capacity of HCFC-22 in 2004 was 803,500 MT;
• Increasing demand for HCFC-22 for refrigeration sector in A5 countries and increasing demand for PTFE or Teflon products worldwide, more capacity is being added particularly in China and India.
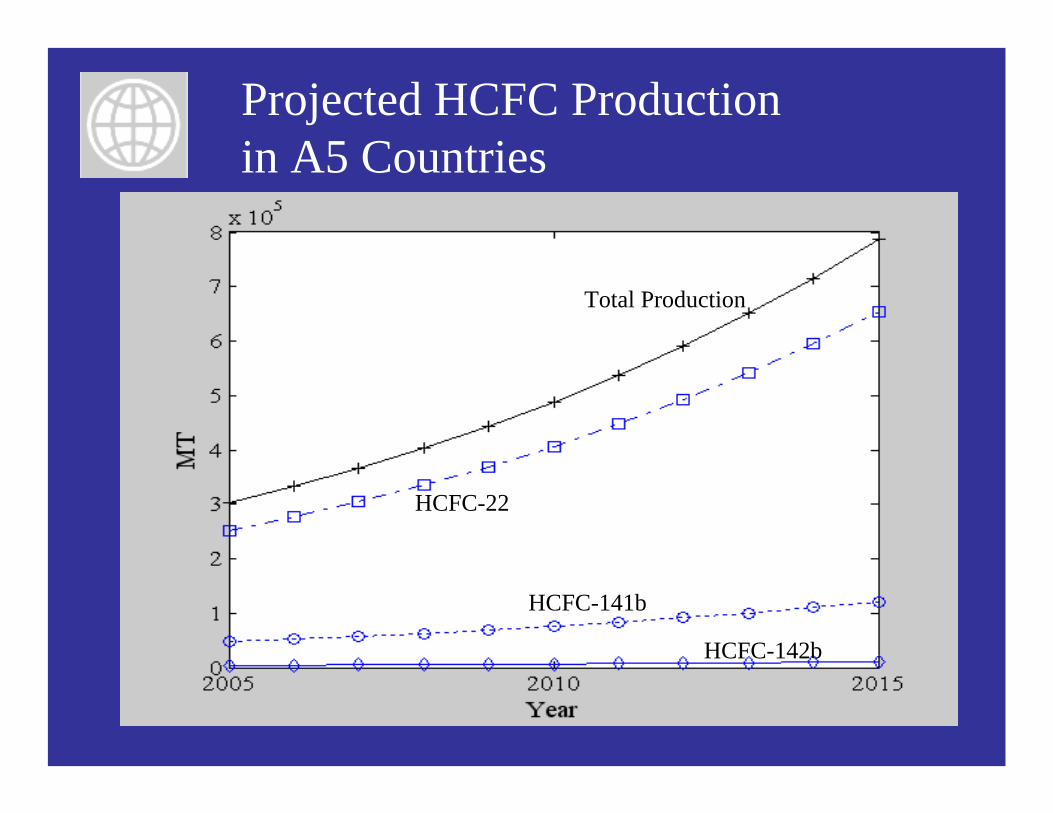
Projected HCFC Production in A5 Countries
Total Production
HCFC-22
HCFC-141b
HCFC-142b
Projected Impact to the Ozone Layer
• Based on a projected growth rate of 10% (less than half of the growth rate experienced in 2001 – 2004), the total production of HCFCsfor emissive use (only) in A5 countries will reach 786,000 MT in 2015;
• The total ODP loading in 2015 from the above production level is 50,000 ODP tons (36,000 ODP tons from HCFC-22, and balance from HCFC-141a and HCFC-142b).
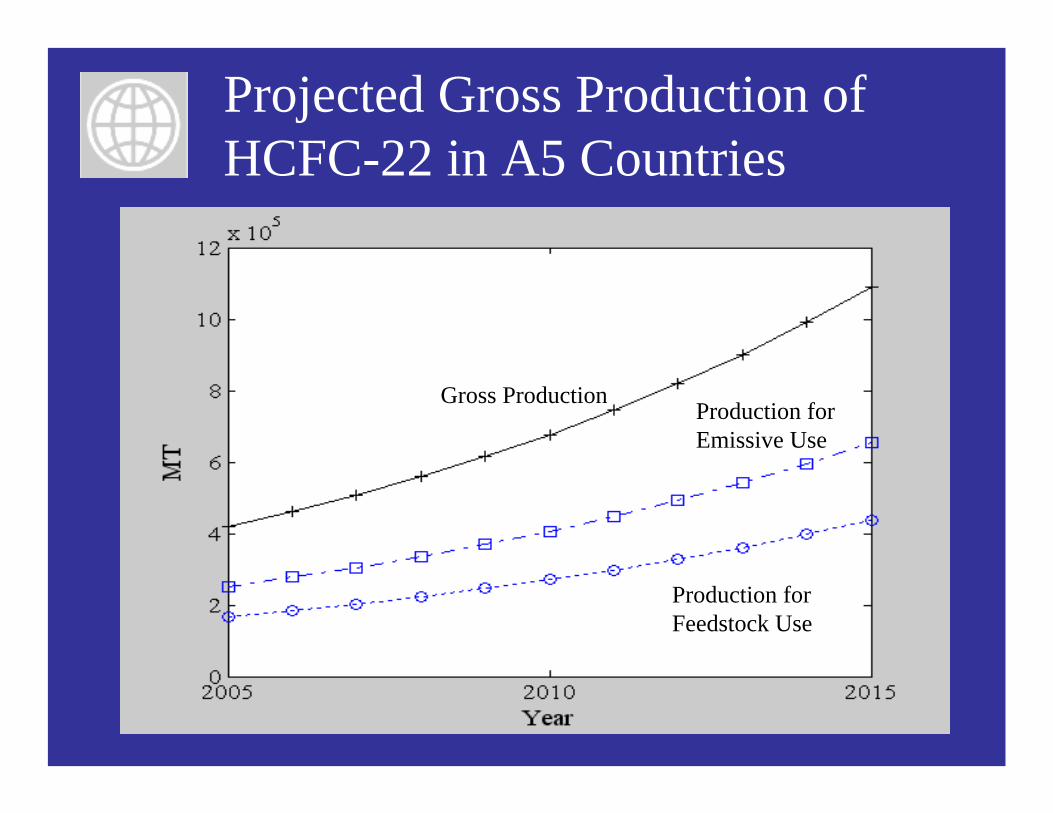
Projected Gross Production ofHCFC-22 in A5 Countries
Gross ProductionProduction for Emissive Use
Production forFeedstock Use
Projected Gross Production ofHCFC-22 in A5 Countries
• Assumptions:– Demand of HCFC-22 for PTFE is 40% of total
HCFC-22 production;– Demand of PTFE grows at the same rate as the
demand of HCFC-22 for emissive use (~10%);– Demand of PTFE could grow faster if production
of oil based paint with PTFE based paint;• Projected gross production of HCFC-22 in A5
countries in 2015 would exceed 1 million MT.
Linkage between CFC and CTC Production Phase-out
• CTC is used as a raw material (feedstock) for the production of CFC;
• CFC phase-out will result in an unwanted quantity of CTC if there is no other feedstock use for this chemical;
• Additional unwanted CTC is produced due to increasing production of HCFC-22. CDM compensation for incineration of HFC-23 provides incentives for increasing HCFC-22 production.
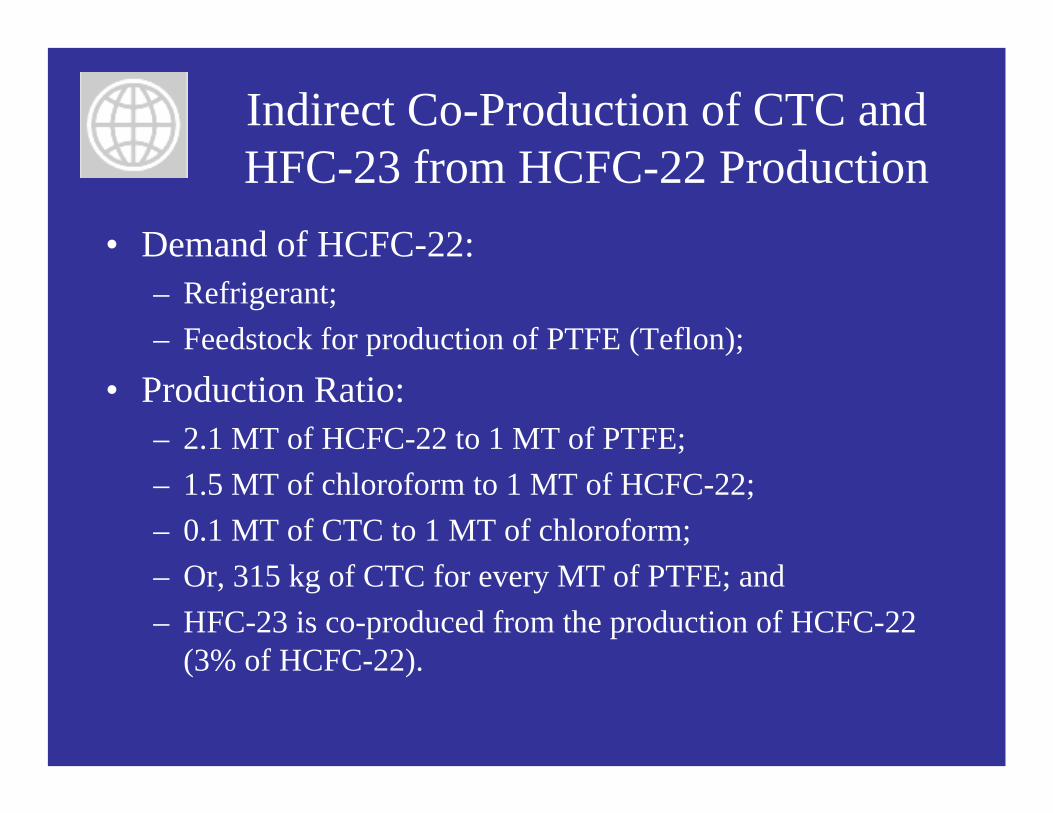
Indirect Co-Production of CTC and HFC-23 from HCFC-22 Production
• Demand of HCFC-22:– Refrigerant;– Feedstock for production of PTFE (Teflon);
• Production Ratio:– 2.1 MT of HCFC-22 to 1 MT of PTFE;– 1.5 MT of chloroform to 1 MT of HCFC-22;– 0.1 MT of CTC to 1 MT of chloroform;– Or, 315 kg of CTC for every MT of PTFE; and– HFC-23 is co-produced from the production of HCFC-22
(3% of HCFC-22).
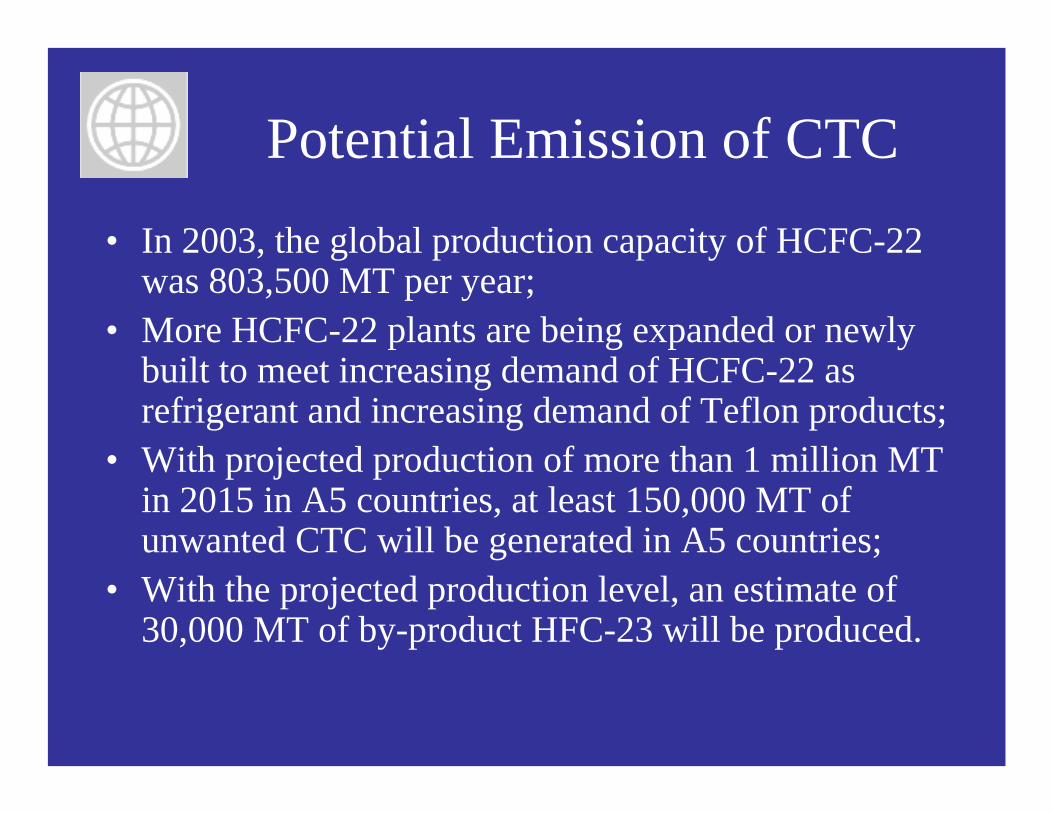
Potential Emission of CTC• In 2003, the global production capacity of HCFC-22
was 803,500 MT per year;• More HCFC-22 plants are being expanded or newly
built to meet increasing demand of HCFC-22 as refrigerant and increasing demand of Teflon products;
• With projected production of more than 1 million MT in 2015 in A5 countries, at least 150,000 MT of unwanted CTC will be generated in A5 countries;
• With the projected production level, an estimate of 30,000 MT of by-product HFC-23 will be produced.
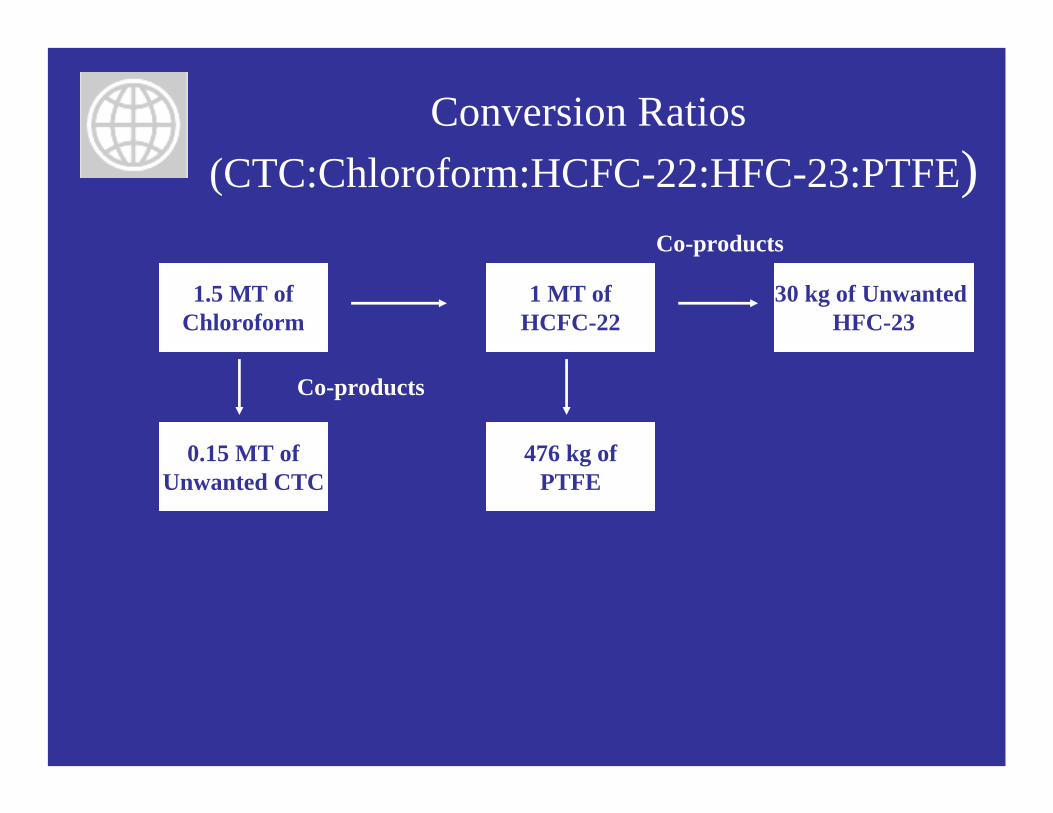
Conversion Ratios (CTC:Chloroform:HCFC-22:HFC-23:PTFE)
0.15 MT ofUnwanted CTC
30 kg of Unwanted HFC-23
476 kg ofPTFE
1.5 MT ofChloroform
1 MT ofHCFC-22
Co-products
Co-products
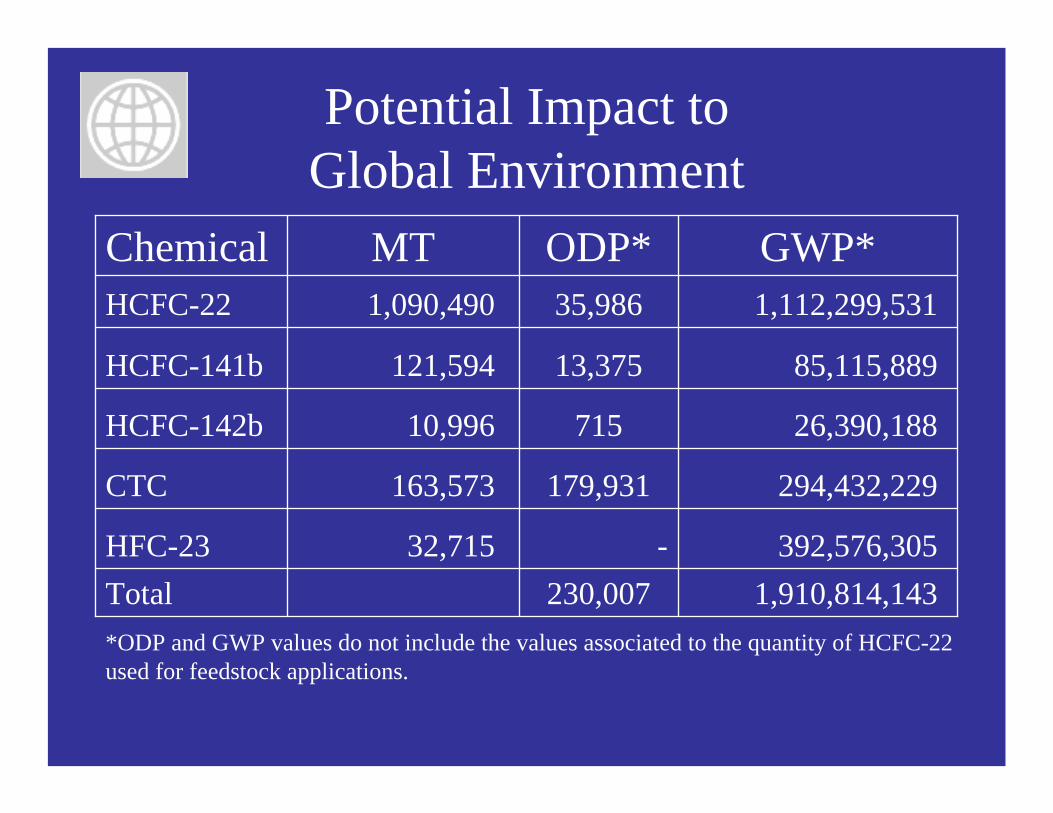
Potential Impact to Global Environment
1,910,814,143 230,007 Total392,576,305 -32,715 HFC-23
294,432,229 179,931 163,573 CTC
26,390,188 715 10,996 HCFC-142b
85,115,889 13,375121,594 HCFC-141b
1,112,299,531 35,986 1,090,490 HCFC-22
GWP*ODP*MTChemical
*ODP and GWP values do not include the values associated to the quantity of HCFC-22used for feedstock applications.

Future Directions
Any Advice ?