Embed Size (px)
Citation preview

Managing Dimension Hierarchies for Reporting
White Paper
Every business has to aggregate numbers along hierarchies, like geography or department. Hyperion Essbase is very popular with financial controllers for facilitating this task. However, dimension design typically works on a per cube basis, which causes conside-rable maintenance overhead when the same dimension is used in multiple cubes or with other reporting tools.
We describe a method where dimension maintenance is done in one cube — the metadata cube — and then exported to a relati-onal table. From there, the dimension flows into any number of reporting cubes that want to use it.
The dimension is automatically augmented to include all members occurring in the facts, even if they were forgotten during the dimension design process. We automatically create bridge tables to make the dimension acessible in relational queries and with any reporting tool.
Abstract

We will use an asset management firm scenario for demons-tration purposes. Let‘s assume the company has relationship managers or reps, whose job it is to attract net new money ( NNM ) from customers. Each customer belongs to exactly one rep. A rep‘s bonus depends on the NNM he or she at-tracts in any given year. This gives us two basic measures ( KPIs ), namely NNM and Bonus.
However, we want two separate reporting cubes: One show-ing Bonus and NNM for each rep, and another one showing only NNM, the reason being that bonus size is sensitive infor-mation that not everybody should have access to. Both cubes share the dimension containing the representatives. Let us call that dimension dim_org , because it also shows how the reps are organized by country.
The following table shows how representatives belong to countries:
USA Bob, Harry
Fr Jean, Francois
Ger Kai, Malte
CH Urs, Adrian
We also would like to be able to sum up Fr, Ger, and CH into Europe, and then USA and Europe to give a total.
One possible report would show bonus by country and year:
USA 150 170 200
Fr 70 150 150
Ger 10 30 50
CH 30 50 70
The example is simplified for clarity. In reality, there are typi-cally about 10 dimensions, and at least a handful of these will be tree structured like our dim_org, and they will frequently be shared across several cubes. From the above example we can see that dimensions are often hierarchically organized. They are represented as dimension trees. For our sales reps in dim_org the tree looks like this:
Figure 1: A dimension tree
The essence of this article is how to edit, maintain and distri-bute tree-structured dimensions like the one above, with the intent of using them for the aggregation of numbers in reports. Essbase comes with a tool called Enterprise Admi-nistration Console or EAS . We use EAS to create the tree and store it as a dimension of the special cube OMETA :
Figure 2: The dimension tree edited in Essbase EAS
Having a powerful tree editor allows a savy business user to visualize and manipulate the data aggregation without having to rely on an IT department. In this article, we use Essbase cubes and Essbase EAS for this purpose. However, the ove-rall principle should generalize to other tools as well. After designing dim_org in cube OMETA, the next steps are:
• The dimension members have to be checked against the facts. When we talk about facts we usually mean a file or table containing NNM and/or bonus numbers per rep and year. There might be sales reps in the facts that we forgot when designing dim_org, or there might be typos. Actually, experience shows that this will inevitably happen every single time you load data.
White Paper Managing Dimension Hierarchies
• The dimension has to be re-edited to inlude the missing members or fix the typos.
• The facts and dim_org have to be deployed to the re-porting cubes.
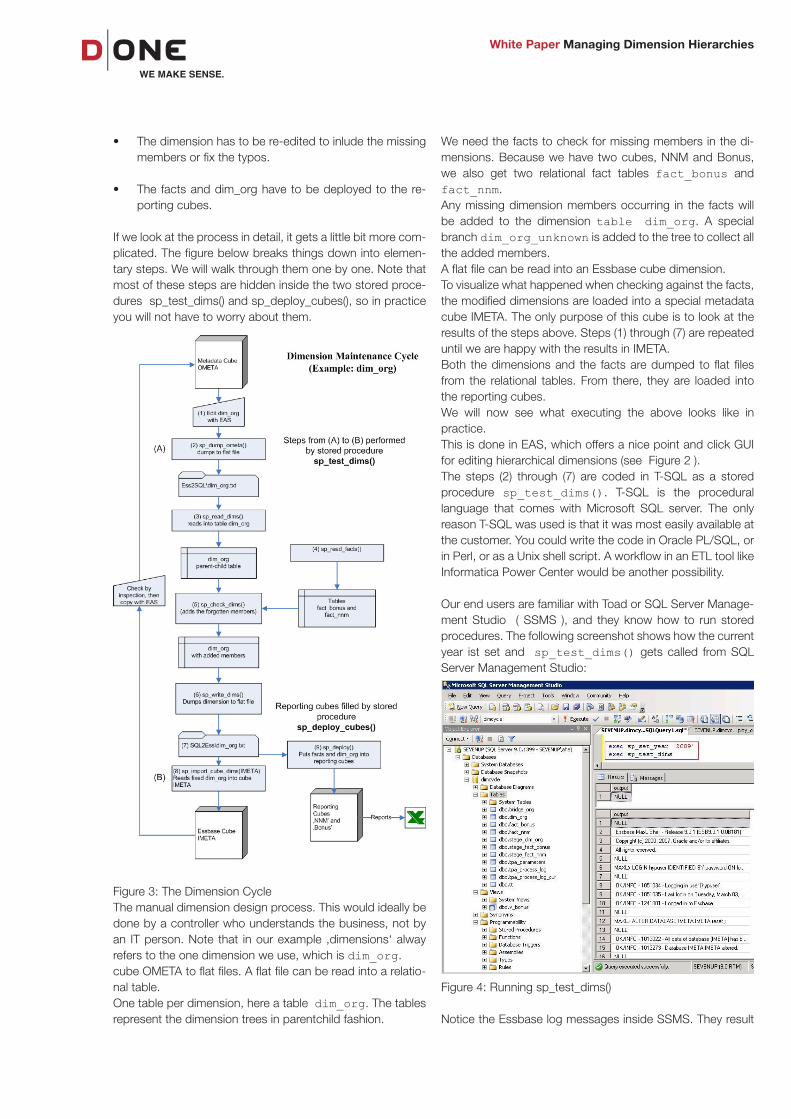
If we look at the process in detail, it gets a little bit more com-plicated. The figure below breaks things down into elemen-tary steps. We will walk through them one by one. Note that most of these steps are hidden inside the two stored proce-dures sp_test_dims() and sp_deploy_cubes(), so in practice you will not have to worry about them.
Figure 3: The Dimension CycleThe manual dimension design process. This would ideally be done by a controller who understands the business, not by an IT person. Note that in our example ‚dimensions‘ alway refers to the one dimension we use, which is dim_org.cube OMETA to flat files. A flat file can be read into a relatio-nal table. One table per dimension, here a table dim_org. The tables represent the dimension trees in parentchild fashion.
We need the facts to check for missing members in the di-mensions. Because we have two cubes, NNM and Bonus, we also get two relational fact tables fact_bonus and fact_nnm. Any missing dimension members occurring in the facts will be added to the dimension table dim_org. A special branch dim_org_unknown is added to the tree to collect all the added members. A flat file can be read into an Essbase cube dimension. To visualize what happened when checking against the facts, the modified dimensions are loaded into a special metadata cube IMETA. The only purpose of this cube is to look at the results of the steps above. Steps (1) through (7) are repeated until we are happy with the results in IMETA. Both the dimensions and the facts are dumped to flat files from the relational tables. From there, they are loaded into the reporting cubes.We will now see what executing the above looks like in practice. This is done in EAS, which offers a nice point and click GUI for editing hierarchical dimensions (see Figure 2 ). The steps (2) through (7) are coded in T-SQL as a stored procedure sp_test_dims(). T-SQL is the procedural language that comes with Microsoft SQL server. The only reason T-SQL was used is that it was most easily available at the customer. You could write the code in Oracle PL/SQL, or in Perl, or as a Unix shell script. A workflow in an ETL tool like Informatica Power Center would be another possibility.
Our end users are familiar with Toad or SQL Server Manage-ment Studio ( SSMS ), and they know how to run stored procedures. The following screenshot shows how the current year ist set and sp_test_dims() gets called from SQL Server Management Studio:
Figure 4: Running sp_test_dims()
Notice the Essbase log messages inside SSMS. They result
White Paper Managing Dimension Hierarchies

from Essbase shell scripts that are executed from within the SQL Server stored procedure. The steps (2) to (7) of the dimension cycle are now finished, and we can check the out-line of cube IMETA to see if there were any issues when trying to load the facts:
Figure 5: IMETA with forgotten dimension member
The special branch dim_org_unknown now has a child Florian. This means that one of the fact input files was reporting NNM and/or Bonus for Florian, which probably means that a new rep named Florian was hired, but we forgot to make him a member of dim_org.
We go back to cube OMETA, create a new child Florian under CH, and run sp_test_dims() again. Looking at IMETA, we see that dim_org_unknown is now empty, and the new rep Florian correctly appears under CH:
Figure 6: IMETA after adding the missing member
Note again that this process will in practice involve several dimensions, not just one.
Building a web interface to hide the details of calling stored procedures from the end user would not be a big effort. How-ever, if you expect business users to be skilled enough to maintain reporting dimensions themselves, and to build their own cubes, they should not have a hard time calling a very limited number of stored procedures. In our projects, this has
not been a problem at all. Saddling yourself with another application just to hide such simple mechanics is probably overkill.
At this point the dimension cycle is finished and we can deploy the facts and the dimension to the reporting cubes. The stored procedure sp_deploy_cubes() does the job. As before, we would like to emphasize that almost any scripting language could be used to do the job.
Figure 7: Running sp_deploy_cubes()The cubes are now directly accessible through the Excel Add-In. A few clicks are enough to generate a report showing NNM and bonus over time, both per rep and aggregated to higher levels:
Figure 8: An OLAP report in Excel
The data are, of course, totally fictitious and have no resem-blance with the real business. Reporting on a cube through Excel is very popular with busi-ness users. However, for static reports, other tools are some-times preferrable.
Examples are Business Objects Web Intelligence, Hyperion Interactive Reporting, Crystal Reports, or any other Business Intelligence reporting front end. These tools are typically much better suited for accessing relational data than for reporting on OLAP (see [2],[3]) cubes.
White Paper Managing Dimension Hierarchies

The diagram above generates an SQL statement, which in turn can be encapsulated in a view:
Figure 10: View to aggregate dim_org in the relational DBIf all is well, a query on the view should give us the same numbers as the cube report. Let‘s try:
Figure 11: A query on the relational data
While the row order is less than perfect, the numbers match exactly with the OLAP report in Figure 8.
You could take this approach to an extreme and use Essbase merely as a dimension tree editor, while all reports are gene-rated from the relational DB via bridge tables. However, you would lose the nice Excel integration, and the license cost would be excessive, unless you have Essbase anyway.
Alternatively, an inexpensive tree editor like dhtmlxTree (available at http://dhtmlx.com/docs/products/dhtmlxTree/) could be used. By using the design functionality provided by an OLAP tool in combination with a relational DB as a dimension metadata store, the approach described above provides the following advantages: • A dimension can be reused accross several reporting
cubes. All maintenance and design work happens in one place only, in the Metadata Cube.
Another advantage of being able to access the data through a relational DB is error checking. If the same source data get loaded into an OLAP tool and into a conventional DB, you can check whether you get the same numbers in both envi-ronments. If the numbers don‘t match, you almost certainly have a problem with your load mechanism or with the format of the input data. Silent errors that give you no warnings but result in wrong numbers are among the hardest to catch. Looking at the same data in different systems will conside-rably increase your chances of detecting them.
The problem with relational databases is that they are not very good at rolling up numbers along trees, to say the least. We remedy this issue with automatically generating bridge tables when sp_test_dims() is run. A section on bridge tables can be found in [1].
A bridge table sits between each dimension table and the fact table and enables the use of straightforward SQL state-ments for consolidating along hierarchies. The details of bridge table generation and use would fill another article, so we will leave it at that and just present the join diagram and a view for our special case. The bridge table for dim_org is called bridge_org.
Figure 9: Joining with the bridge table
White Paper Managing Dimension Hierarchies

• The dimension is automatically augmented with all members found in the facts. This guarantees successful data loads, while at the same time alerting the user to inconsistencies between dimension design and data reality.
• Automatically generated bridge tables allow the use of the dimension with virtually any reporting tool. This allows for consistent dimensions across the whole enterprise.
• Comparing the numbers from an OLAP system with those from the relational DB exposes load and aggrega-tion errors. User trust in data and report correctness is greatly enhanced.
AuthorAndreas received his PhD in computer science from University of Hamburg in 1996. Research work was focused on automatic speech reco-gnition. Areas of expertise are data analysis, statistics, data architecture, high performance database systems, and data mining. Projects in financial services, telecom, and utilities.
Your contact for further informationSimon Hefti, [email protected], P +41 44 435 10 10
References [1] Kimball, Ralph, and Ross, Margy: The Data Warehouse Toolkit. Second Edition, John Wiley & Sons, 2002
[2] Thomsen, Eric: OLAP Solutions. Second Edition, Wiley & Sons, 2002
[3] George Spofford et al: MDX Solutions. With Microsoft SQL Server 2005 Analysis Services and Hyperion Essbase. Second Edition, Wiley Publishing Inc., 2006
© D1 Solutions AGZypressenstrasse 71, Postfach, 8040 Zürich, Switzerlandwww.d1-solutions.com, [email protected] T +41 44 435 10 10, F +41 44 435 10 15
White Paper Managing Dimension Hierarchies
Literatur [1] Hasso Plattner: A common database approach for OLTP and OLAP using an in-memory column database. Procee-dings of the 35th SIGMOD international conference on Ma-nagement of data (2009)
[2] TPC-H benchmark results http://www.tpc.org/tpch/results/tpch_perf_results.asp
[3] P. A. Boncz, M. L. Kersten, S. Manegold: Breaking the Memory Wall in MonetDB.
Communications of the ACM, Vol. 51, No. 12 (Dezember 2008), S. 77-85
[4] Ralph Kimball and Margy Ross: The Data Warehouse Toolkit.
Second Edition, John Wiley & Sons, 2002
AutorDr. Andreas Hauenstein promovierte 1996 an der Universität Hamburg in Informatik. In seinen Forschungsarbeiten beschäftigte er sich mit automatischer Spracherken-nung. Seine Themenschwerpunkte sind Daten-Analyse & Statistik, Daten Architektur, hochperformante DB Systeme und Data Mi-ning. Er begleitet Projekte in den Branchen Finanzindustrie, Telecom und Energiewirt-schaft.
Kontakt /AnsprechpartnerSimon Hefti, [email protected], T +41 44 435 10 10
White Paper Neue Datenbanken für BI
white-paper-neue-datenbanken-fuer-bi-hauenstein-andreas-20120907.indd 9 9/6/12 11:37 AM