Embed Size (px)
Citation preview
Managing
Dairy
Effluent
Ponds
Profitably
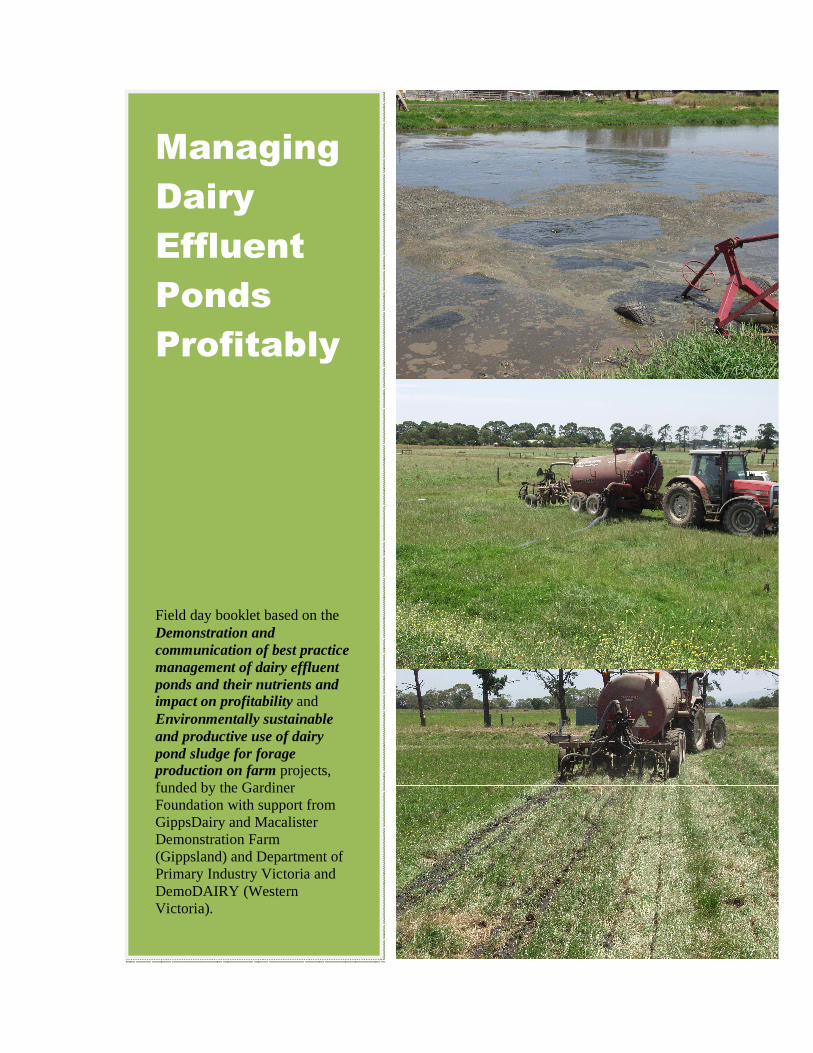
Field day booklet based on the Demonstration and communication of best practice management of dairy effluent ponds and their nutrients and impact on profitability and Environmentally sustainable and productive use of dairy pond sludge for forage production on farm projects, funded by the Gardiner Foundation with support from GippsDairy and Macalister Demonstration Farm (Gippsland) and Department of Primary Industry Victoria and DemoDAIRY (Western Victoria).
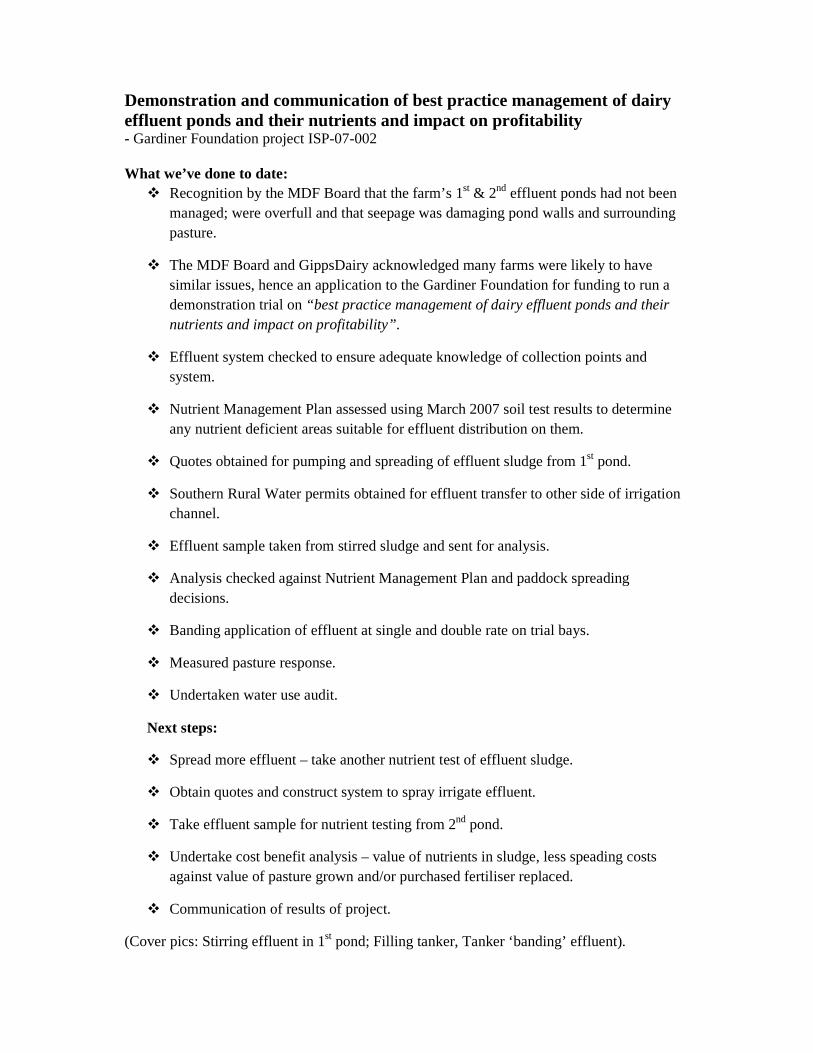
Demonstration and communication of best practice management of dairy effluent ponds and their nutrients and impact on profitability - Gardiner Foundation project ISP-07-002 What we’ve done to date:
� Recognition by the MDF Board that the farm’s 1st & 2nd effluent ponds had not been managed; were overfull and that seepage was damaging pond walls and surrounding pasture.
� The MDF Board and GippsDairy acknowledged many farms were likely to have similar issues, hence an application to the Gardiner Foundation for funding to run a demonstration trial on “best practice management of dairy effluent ponds and their nutrients and impact on profitability”.
� Effluent system checked to ensure adequate knowledge of collection points and system.
� Nutrient Management Plan assessed using March 2007 soil test results to determine any nutrient deficient areas suitable for effluent distribution on them.
� Quotes obtained for pumping and spreading of effluent sludge from 1st pond.
� Southern Rural Water permits obtained for effluent transfer to other side of irrigation channel.
� Effluent sample taken from stirred sludge and sent for analysis.
� Analysis checked against Nutrient Management Plan and paddock spreading decisions.
� Banding application of effluent at single and double rate on trial bays.
� Measured pasture response.
� Undertaken water use audit.
Next steps:
� Spread more effluent – take another nutrient test of effluent sludge.
� Obtain quotes and construct system to spray irrigate effluent.
� Take effluent sample for nutrient testing from 2nd pond.
� Undertake cost benefit analysis – value of nutrients in sludge, less speading costs against value of pasture grown and/or purchased fertiliser replaced.
� Communication of results of project.
(Cover pics: Stirring effluent in 1st pond; Filling tanker, Tanker ‘banding’ effluent).
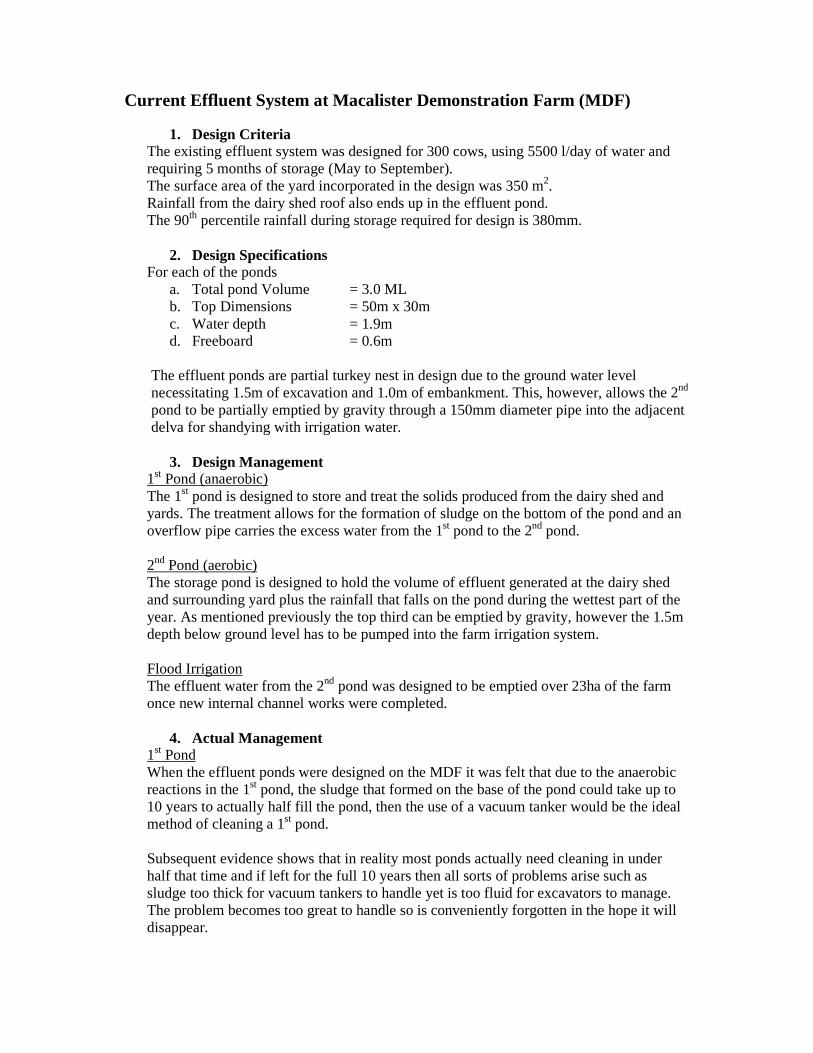
Current Effluent System at Macalister Demonstration Farm (MDF)
1. Design Criteria The existing effluent system was designed for 300 cows, using 5500 l/day of water and requiring 5 months of storage (May to September). The surface area of the yard incorporated in the design was 350 m2. Rainfall from the dairy shed roof also ends up in the effluent pond. The 90th percentile rainfall during storage required for design is 380mm.
2. Design Specifications For each of the ponds
a. Total pond Volume = 3.0 ML b. Top Dimensions = 50m x 30m c. Water depth = 1.9m d. Freeboard = 0.6m
The effluent ponds are partial turkey nest in design due to the ground water level necessitating 1.5m of excavation and 1.0m of embankment. This, however, allows the 2nd pond to be partially emptied by gravity through a 150mm diameter pipe into the adjacent delva for shandying with irrigation water.
3. Design Management
1st Pond (anaerobic) The 1st pond is designed to store and treat the solids produced from the dairy shed and yards. The treatment allows for the formation of sludge on the bottom of the pond and an overflow pipe carries the excess water from the 1st pond to the 2nd pond. 2nd Pond (aerobic) The storage pond is designed to hold the volume of effluent generated at the dairy shed and surrounding yard plus the rainfall that falls on the pond during the wettest part of the year. As mentioned previously the top third can be emptied by gravity, however the 1.5m depth below ground level has to be pumped into the farm irrigation system. Flood Irrigation The effluent water from the 2nd pond was designed to be emptied over 23ha of the farm once new internal channel works were completed.
4. Actual Management 1st Pond When the effluent ponds were designed on the MDF it was felt that due to the anaerobic reactions in the 1st pond, the sludge that formed on the base of the pond could take up to 10 years to actually half fill the pond, then the use of a vacuum tanker would be the ideal method of cleaning a 1st pond. Subsequent evidence shows that in reality most ponds actually need cleaning in under half that time and if left for the full 10 years then all sorts of problems arise such as sludge too thick for vacuum tankers to handle yet is too fluid for excavators to manage. The problem becomes too great to handle so is conveniently forgotten in the hope it will disappear.
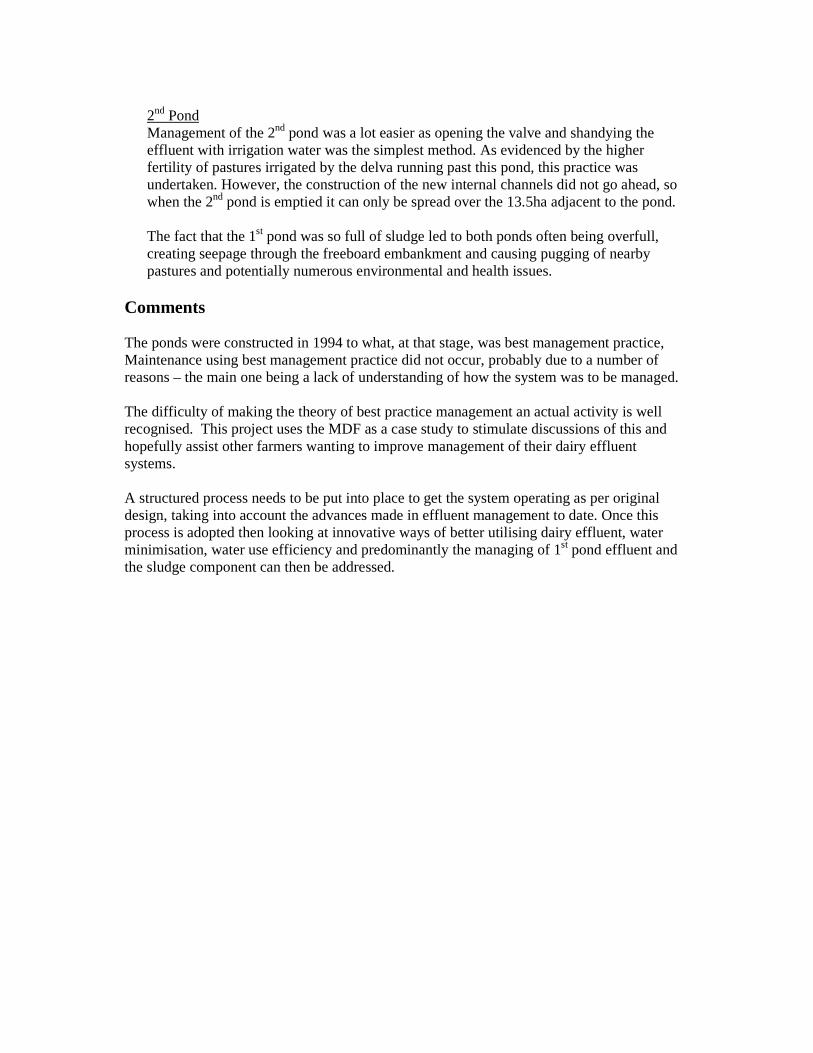
2nd Pond Management of the 2nd pond was a lot easier as opening the valve and shandying the effluent with irrigation water was the simplest method. As evidenced by the higher fertility of pastures irrigated by the delva running past this pond, this practice was undertaken. However, the construction of the new internal channels did not go ahead, so when the 2nd pond is emptied it can only be spread over the 13.5ha adjacent to the pond. The fact that the 1st pond was so full of sludge led to both ponds often being overfull, creating seepage through the freeboard embankment and causing pugging of nearby pastures and potentially numerous environmental and health issues.
Comments The ponds were constructed in 1994 to what, at that stage, was best management practice, Maintenance using best management practice did not occur, probably due to a number of reasons – the main one being a lack of understanding of how the system was to be managed. The difficulty of making the theory of best practice management an actual activity is well recognised. This project uses the MDF as a case study to stimulate discussions of this and hopefully assist other farmers wanting to improve management of their dairy effluent systems. A structured process needs to be put into place to get the system operating as per original design, taking into account the advances made in effluent management to date. Once this process is adopted then looking at innovative ways of better utilising dairy effluent, water minimisation, water use efficiency and predominantly the managing of 1st pond effluent and the sludge component can then be addressed.
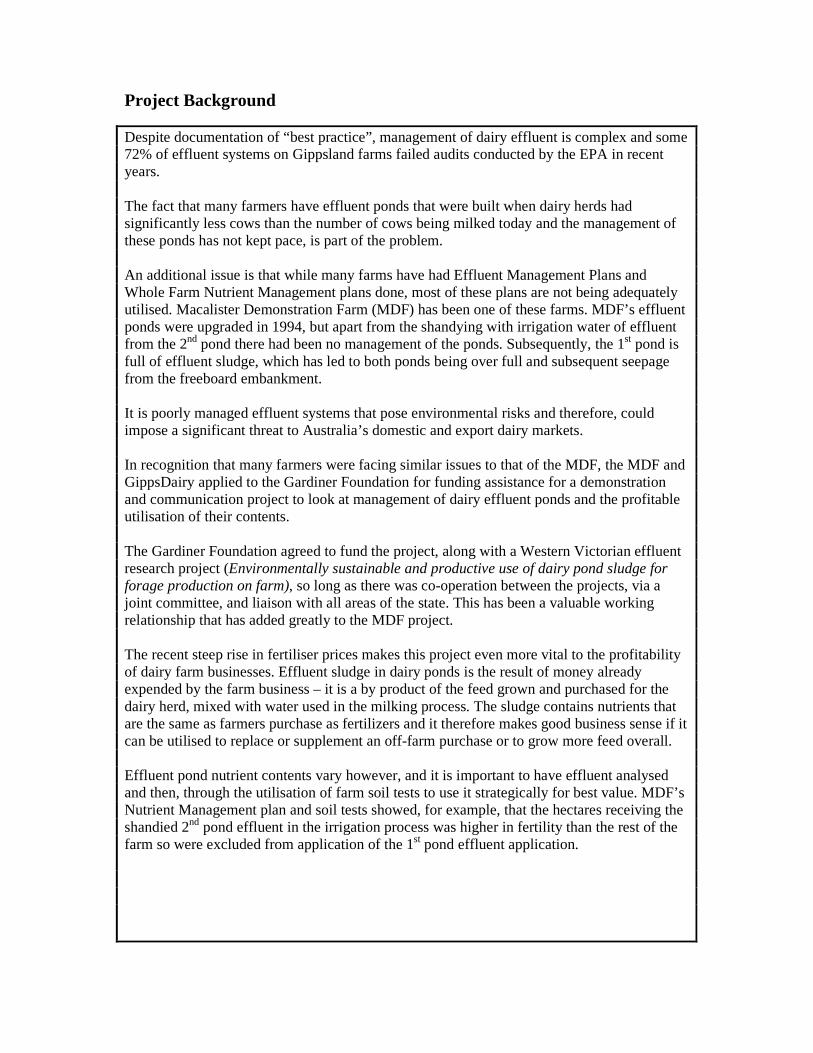
Project Background
Despite documentation of “best practice”, management of dairy effluent is complex and some 72% of effluent systems on Gippsland farms failed audits conducted by the EPA in recent years. The fact that many farmers have effluent ponds that were built when dairy herds had significantly less cows than the number of cows being milked today and the management of these ponds has not kept pace, is part of the problem. An additional issue is that while many farms have had Effluent Management Plans and Whole Farm Nutrient Management plans done, most of these plans are not being adequately utilised. Macalister Demonstration Farm (MDF) has been one of these farms. MDF’s effluent ponds were upgraded in 1994, but apart from the shandying with irrigation water of effluent from the 2nd pond there had been no management of the ponds. Subsequently, the 1st pond is full of effluent sludge, which has led to both ponds being over full and subsequent seepage from the freeboard embankment. It is poorly managed effluent systems that pose environmental risks and therefore, could impose a significant threat to Australia’s domestic and export dairy markets. In recognition that many farmers were facing similar issues to that of the MDF, the MDF and GippsDairy applied to the Gardiner Foundation for funding assistance for a demonstration and communication project to look at management of dairy effluent ponds and the profitable utilisation of their contents. The Gardiner Foundation agreed to fund the project, along with a Western Victorian effluent research project (Environmentally sustainable and productive use of dairy pond sludge for forage production on farm), so long as there was co-operation between the projects, via a joint committee, and liaison with all areas of the state. This has been a valuable working relationship that has added greatly to the MDF project. The recent steep rise in fertiliser prices makes this project even more vital to the profitability of dairy farm businesses. Effluent sludge in dairy ponds is the result of money already expended by the farm business – it is a by product of the feed grown and purchased for the dairy herd, mixed with water used in the milking process. The sludge contains nutrients that are the same as farmers purchase as fertilizers and it therefore makes good business sense if it can be utilised to replace or supplement an off-farm purchase or to grow more feed overall. Effluent pond nutrient contents vary however, and it is important to have effluent analysed and then, through the utilisation of farm soil tests to use it strategically for best value. MDF’s Nutrient Management plan and soil tests showed, for example, that the hectares receiving the shandied 2nd pond effluent in the irrigation process was higher in fertility than the rest of the farm so were excluded from application of the 1st pond effluent application.
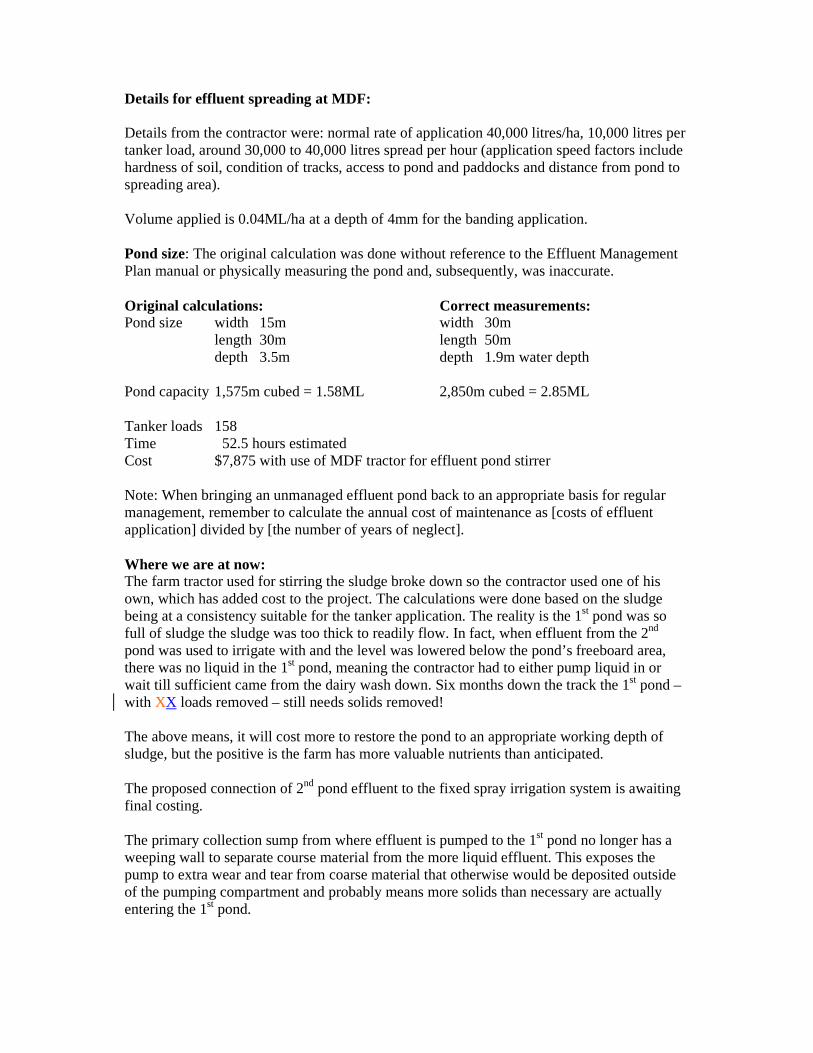
Details for effluent spreading at MDF: Details from the contractor were: normal rate of application 40,000 litres/ha, 10,000 litres per tanker load, around 30,000 to 40,000 litres spread per hour (application speed factors include hardness of soil, condition of tracks, access to pond and paddocks and distance from pond to spreading area). Volume applied is 0.04ML/ha at a depth of 4mm for the banding application. Pond size: The original calculation was done without reference to the Effluent Management Plan manual or physically measuring the pond and, subsequently, was inaccurate. Original calculations: Correct measurements: Pond size width 15m width 30m length 30m length 50m depth 3.5m depth 1.9m water depth Pond capacity 1,575m cubed = 1.58ML 2,850m cubed = 2.85ML Tanker loads 158 Time 52.5 hours estimated Cost $7,875 with use of MDF tractor for effluent pond stirrer Note: When bringing an unmanaged effluent pond back to an appropriate basis for regular management, remember to calculate the annual cost of maintenance as [costs of effluent application] divided by [the number of years of neglect]. Where we are at now: The farm tractor used for stirring the sludge broke down so the contractor used one of his own, which has added cost to the project. The calculations were done based on the sludge being at a consistency suitable for the tanker application. The reality is the 1st pond was so full of sludge the sludge was too thick to readily flow. In fact, when effluent from the 2nd pond was used to irrigate with and the level was lowered below the pond’s freeboard area, there was no liquid in the 1st pond, meaning the contractor had to either pump liquid in or wait till sufficient came from the dairy wash down. Six months down the track the 1st pond – with XX loads removed – still needs solids removed! The above means, it will cost more to restore the pond to an appropriate working depth of sludge, but the positive is the farm has more valuable nutrients than anticipated. The proposed connection of 2nd pond effluent to the fixed spray irrigation system is awaiting final costing. The primary collection sump from where effluent is pumped to the 1st pond no longer has a weeping wall to separate course material from the more liquid effluent. This exposes the pump to extra wear and tear from coarse material that otherwise would be deposited outside of the pumping compartment and probably means more solids than necessary are actually entering the 1st pond.
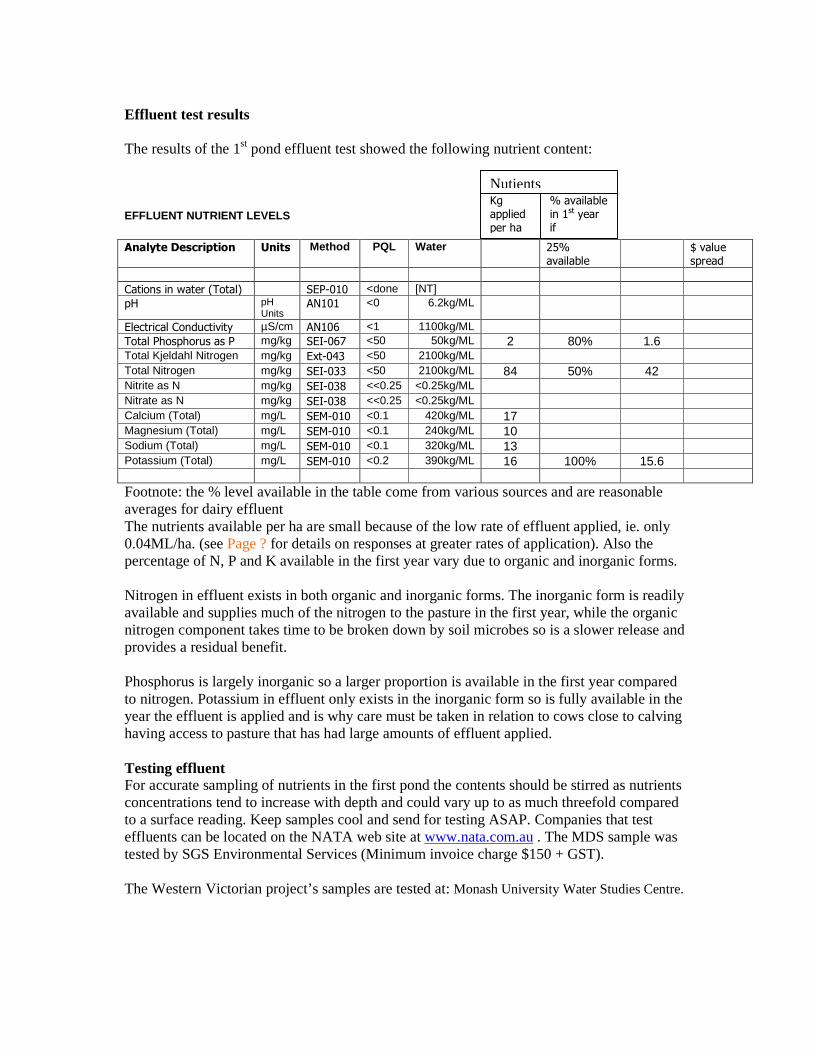
Effluent test results The results of the 1st pond effluent test showed the following nutrient content: EFFLUENT NUTRIENT LEVELS Analyte Description Units Method PQL Water 25%
available $ value
spread
Cations in water (Total) SEP-010 <done [NT]
pH pH Units
AN101 <0 6.2kg/ML
Electrical Conductivity µS/cm AN106 <1 1100kg/ML
Total Phosphorus as P mg/kg SEI-067 <50 50kg/ML 2 80% 1.6
Total Kjeldahl Nitrogen mg/kg Ext-043 <50 2100kg/ML
Total Nitrogen mg/kg SEI-033 <50 2100kg/ML 84 50% 42
Nitrite as N mg/kg SEI-038 <<0.25 <0.25kg/ML
Nitrate as N mg/kg SEI-038 <<0.25 <0.25kg/ML
Calcium (Total) mg/L SEM-010 <0.1 420kg/ML 17 Magnesium (Total) mg/L SEM-010 <0.1 240kg/ML 10
Sodium (Total) mg/L SEM-010 <0.1 320kg/ML 13
Potassium (Total) mg/L SEM-010 <0.2 390kg/ML 16 100% 15.6
Footnote: the % level available in the table come from various sources and are reasonable averages for dairy effluent The nutrients available per ha are small because of the low rate of effluent applied, ie. only 0.04ML/ha. (see Page ? for details on responses at greater rates of application). Also the percentage of N, P and K available in the first year vary due to organic and inorganic forms. Nitrogen in effluent exists in both organic and inorganic forms. The inorganic form is readily available and supplies much of the nitrogen to the pasture in the first year, while the organic nitrogen component takes time to be broken down by soil microbes so is a slower release and provides a residual benefit. Phosphorus is largely inorganic so a larger proportion is available in the first year compared to nitrogen. Potassium in effluent only exists in the inorganic form so is fully available in the year the effluent is applied and is why care must be taken in relation to cows close to calving having access to pasture that has had large amounts of effluent applied. Testing effluent For accurate sampling of nutrients in the first pond the contents should be stirred as nutrients concentrations tend to increase with depth and could vary up to as much threefold compared to a surface reading. Keep samples cool and send for testing ASAP. Companies that test effluents can be located on the NATA web site at www.nata.com.au . The MDS sample was tested by SGS Environmental Services (Minimum invoice charge $150 + GST). The Western Victorian project’s samples are tested at: Monash University Water Studies Centre.
Kg appliedper ha
% available in 1st year if
Nutients
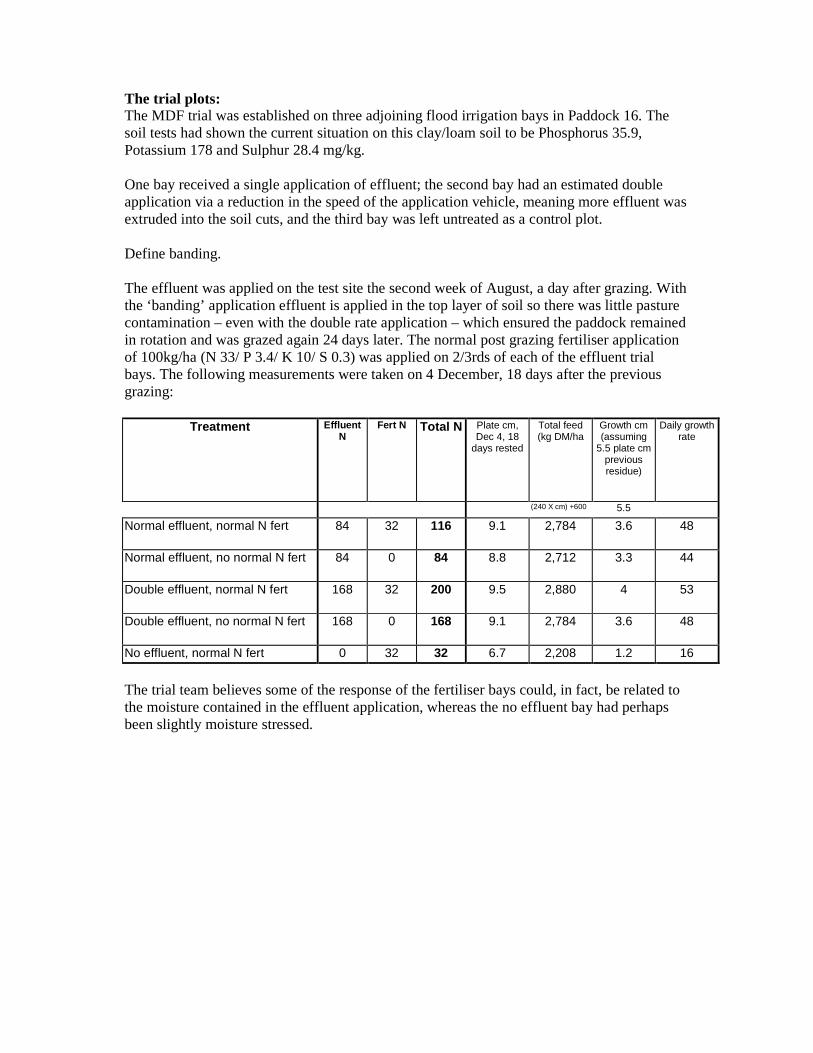
The trial plots: The MDF trial was established on three adjoining flood irrigation bays in Paddock 16. The soil tests had shown the current situation on this clay/loam soil to be Phosphorus 35.9, Potassium 178 and Sulphur 28.4 mg/kg. One bay received a single application of effluent; the second bay had an estimated double application via a reduction in the speed of the application vehicle, meaning more effluent was extruded into the soil cuts, and the third bay was left untreated as a control plot. Define banding. The effluent was applied on the test site the second week of August, a day after grazing. With the ‘banding’ application effluent is applied in the top layer of soil so there was little pasture contamination – even with the double rate application – which ensured the paddock remained in rotation and was grazed again 24 days later. The normal post grazing fertiliser application of 100kg/ha (N 33/ P 3.4/ K 10/ S 0.3) was applied on 2/3rds of each of the effluent trial bays. The following measurements were taken on 4 December, 18 days after the previous grazing:
Treatment Effluent N
Fert N Total N Plate cm, Dec 4, 18
days rested
Total feed (kg DM/ha
Growth cm (assuming
5.5 plate cm previous residue)
Daily growth rate
(240 X cm) +600 5.5 Normal effluent, normal N fert 84 32 116 9.1 2,784 3.6 48
Normal effluent, no normal N fert 84 0 84 8.8 2,712 3.3 44
Double effluent, normal N fert 168 32 200 9.5 2,880 4 53
Double effluent, no normal N fert 168 0 168 9.1 2,784 3.6 48
No effluent, normal N fert 0 32 32 6.7 2,208 1.2 16
The trial team believes some of the response of the fertiliser bays could, in fact, be related to the moisture contained in the effluent application, whereas the no effluent bay had perhaps been slightly moisture stressed.
Dairy wastes – What’s in them?
Graeme Ward, Department of Primary Industries, Warrnambool. Dairy pond systems collect, partially treat and store wastes from the dairy and yards prior to it hopefully being utilised on-farm. Moderate, but never-the-less increasingly valuable amounts of nutrients from dung and urine are deposited in the dairy. For a 300 cow herd being milked in a dairy without a feedpad, an average of around 750 kg of nitrogen (N), 150 kg of phosphorus (P) and 810 kg of potassium (K) will be added to the ponds per lactation. In our trials in Western Victoria we have been investigating how we can best utilise the treated wastes from the common two pond systems – the sludge that forms on the bottom of first pond and the effluent from the second pond. These two materials are quite different in chemical composition and their characteristics when used as a fertiliser for forage production. First pond sludge The first pond in a two pond system is basically a large, uncovered septic tank. In this deep, anaerobic pond bacteria break down or digest the solids and organic matter. In doing this the gasses carbon dioxide, methane and ammonia are given off and solids settle to the bottom to form sludge. The pond will stop functioning if excessive amounts of sludge are allowed to build up. The chemical composition of a typical dairy sludge as extracted from the DemoDAIRY, Terang first pond in 2006 is listed in Table 1. Table 1. The chemical composition of an 8% dry matter (DM) dairy sludge as extracted from the first pond of the DemoDAIRY system in November 2006 pH 7.5 Sodium (Na) 750 kg/ML Electrical Conductivity 7,600 uS/cm Total Nitrogen (N) 1000 kg/ML Potassium (K) 625 kg/ML Ammonia N 55 kg/ML Calcium (Ca) 2,174 kg/ML Total Phosphorus (P) 192 kg/ML Magnesium (Mg) 872 kg/ML Phosphate P 31 kg/ML Although high in both total nitrogen (N) and phosphorus (P), most of these and the other nutrients are in organic forms. Less than 5% of both the P and N are in a readily plant available form. To become plant available, these other organic forms need to be broken down (“mineralised”) in the soil by micro-organisms. As a result, sludge acts as a “slow-release” nutrient source when applied to crops or pastures. As the solids or dry matter content of the first pond increases with depth (the sludge settles to the bottom), it can be difficult to work out the actual application of nutrients when applying sludge to land. The amounts of nutrients applied will depend upon the solids content of the sludge after the pond is agitated and the material extracted. Second Pond Effluent After partial treatment in the first pond, the liquid fraction of the effluent passes into the second pond for further treatment. In a properly functioning second pond, the effluent undergoes further treatment by bacteria and algae to further break down the organic matter. This pond will remove odour and kill most pathogenic micro-organisms. The result is a brown coloured liquid with a very low solids content that can be pumped with conventional
pumping equipment. Except for a thin layer of sludge that forms on the bottom, the effluent in the second pond has a fairly uniform chemical composition at all depths. The chemical composition of a typical second pond effluent is illustrated by a sample from the DemoDAIRY, Terang second pond in January 2005 (Table 2). Table 2. The chemical composition of dairy effluent from the second pond of the DemoDAIRY, Terang dairy in January 2005 pH 7.8 Sodium (Na) 582 kg/ML Electrical Conductivity 7,533 uS/cm Total Nitrogen (N) 157 kg/ML Potassium (K) 480 kg/ML Ammonia N 98 kg/ML Calcium (Ca) 142 kg/ML Total Phosphorus (P) 34 kg/ML Magnesium (Mg) 225 kg/ML Sulphur 21 kg/ML In contrast to the first pond sludge, a high proportion of the nutrients in the second pond effluent are in a readily plant-available form. This particularly applies to the N content, resulting in the effluent giving quick, but short term growth responses to crops or pasture. The actual concentration of nutrients can vary considerably from pond to pond because of factors such as how much water is used in the dairy, if any of the effluent is reused in a flood wash, how long since the pond was last pumped out and so on. Where possible, it is desirable to get the effluent tested for nutrient content to allow calculation of optimum application rates.
Forage Crop and Pasture Responses to Second-Pond Effluent Applications
Graeme Ward and Joe Jacobs, Department of Primary Industries, Warrnambool.
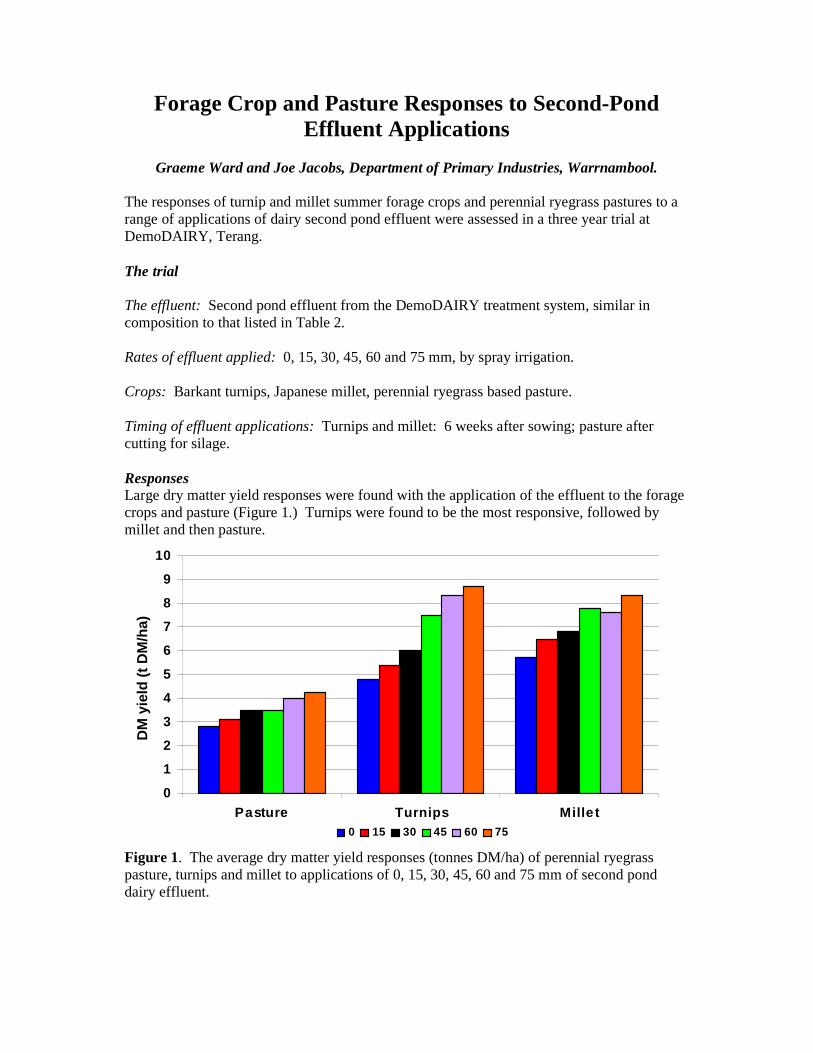
The responses of turnip and millet summer forage crops and perennial ryegrass pastures to a range of applications of dairy second pond effluent were assessed in a three year trial at DemoDAIRY, Terang. The trial The effluent: Second pond effluent from the DemoDAIRY treatment system, similar in composition to that listed in Table 2. Rates of effluent applied: 0, 15, 30, 45, 60 and 75 mm, by spray irrigation. Crops: Barkant turnips, Japanese millet, perennial ryegrass based pasture. Timing of effluent applications: Turnips and millet: 6 weeks after sowing; pasture after cutting for silage. Responses Large dry matter yield responses were found with the application of the effluent to the forage crops and pasture (Figure 1.) Turnips were found to be the most responsive, followed by millet and then pasture. Figure 1. The average dry matter yield responses (tonnes DM/ha) of perennial ryegrass pasture, turnips and millet to applications of 0, 15, 30, 45, 60 and 75 mm of second pond dairy effluent.
0
1
2
3
4
5
6
7
8
9
10
Pasture Turnips Mille t
DM
yie
ld (
t DM
/ha)
0 15 30 45 60 75
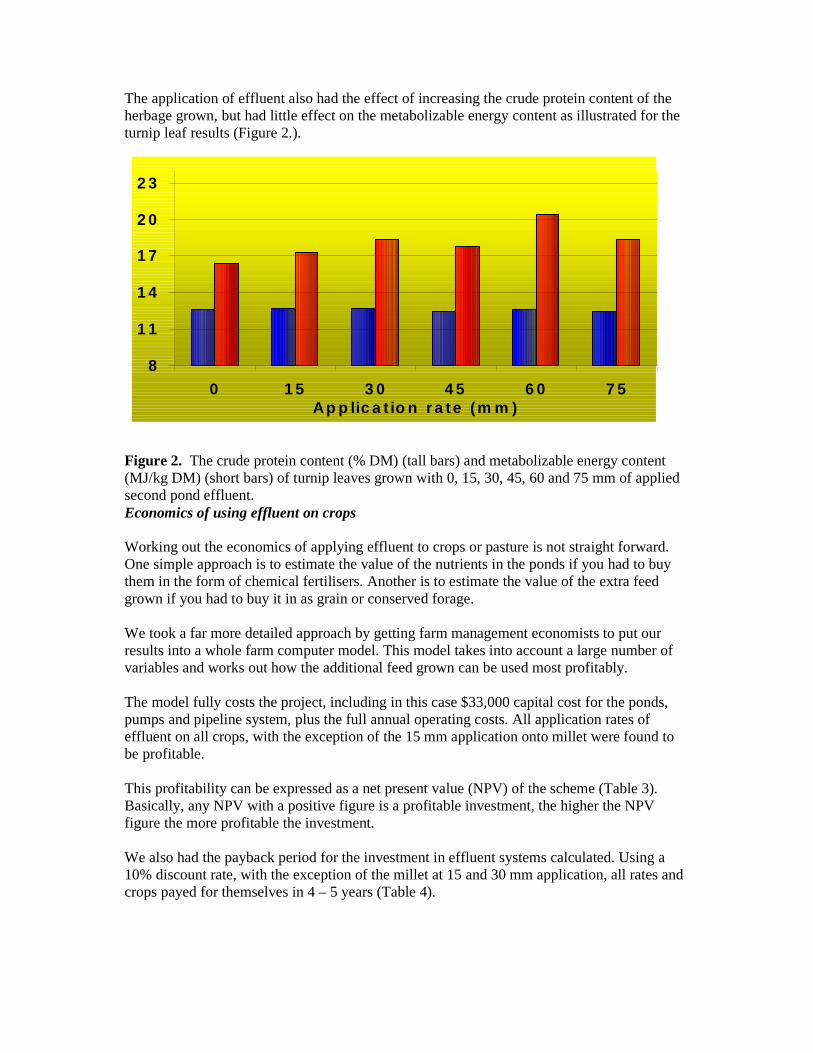
The application of effluent also had the effect of increasing the crude protein content of the herbage grown, but had little effect on the metabolizable energy content as illustrated for the turnip leaf results (Figure 2.). Figure 2. The crude protein content (% DM) (tall bars) and metabolizable energy content (MJ/kg DM) (short bars) of turnip leaves grown with 0, 15, 30, 45, 60 and 75 mm of applied second pond effluent. Economics of using effluent on crops Working out the economics of applying effluent to crops or pasture is not straight forward. One simple approach is to estimate the value of the nutrients in the ponds if you had to buy them in the form of chemical fertilisers. Another is to estimate the value of the extra feed grown if you had to buy it in as grain or conserved forage. We took a far more detailed approach by getting farm management economists to put our results into a whole farm computer model. This model takes into account a large number of variables and works out how the additional feed grown can be used most profitably. The model fully costs the project, including in this case $33,000 capital cost for the ponds, pumps and pipeline system, plus the full annual operating costs. All application rates of effluent on all crops, with the exception of the 15 mm application onto millet were found to be profitable. This profitability can be expressed as a net present value (NPV) of the scheme (Table 3). Basically, any NPV with a positive figure is a profitable investment, the higher the NPV figure the more profitable the investment. We also had the payback period for the investment in effluent systems calculated. Using a 10% discount rate, with the exception of the millet at 15 and 30 mm application, all rates and crops payed for themselves in 4 – 5 years (Table 4).
8
1 1
1 4
1 7
2 0
2 3
0 1 5 3 0 4 5 6 0 7 5Ap p lic a t io n r a te (m m )
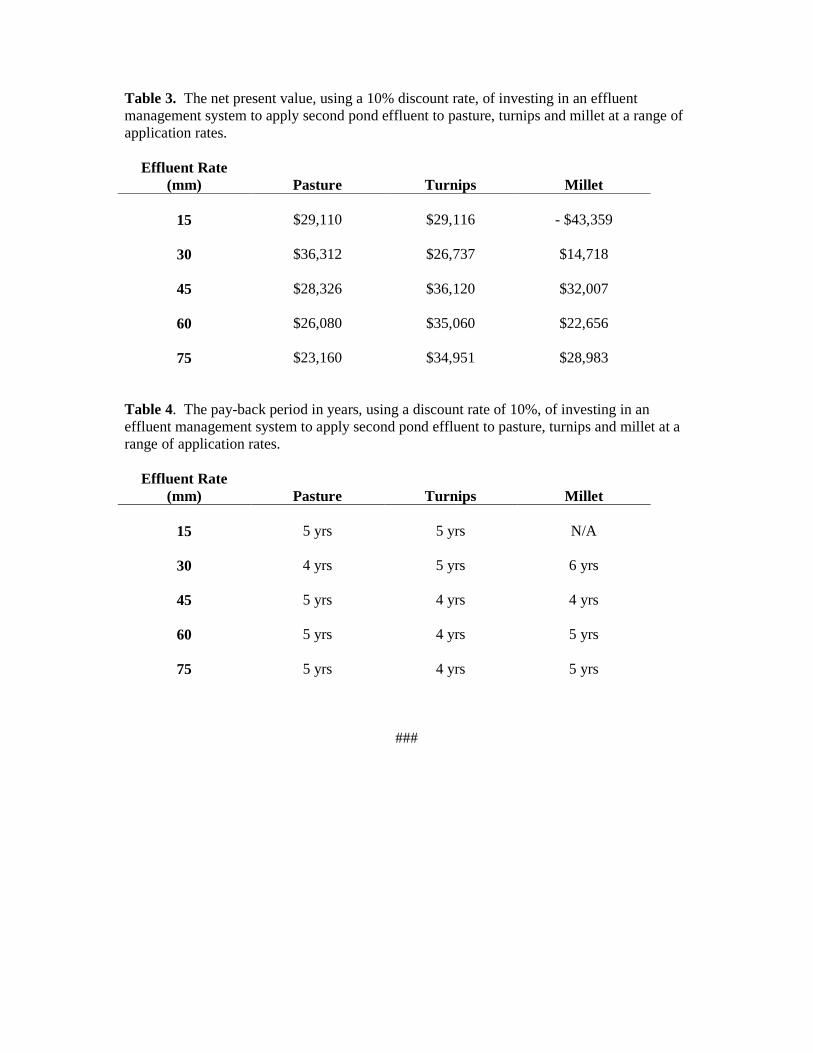
Table 3. The net present value, using a 10% discount rate, of investing in an effluent management system to apply second pond effluent to pasture, turnips and millet at a range of application rates.
Effluent Rate (mm)
Pasture
Turnips
Millet
15
$29,110
$29,116
- $43,359
30
$36,312
$26,737
$14,718
45
$28,326
$36,120
$32,007
60
$26,080
$35,060
$22,656
75
$23,160
$34,951
$28,983
Table 4. The pay-back period in years, using a discount rate of 10%, of investing in an effluent management system to apply second pond effluent to pasture, turnips and millet at a range of application rates.
Effluent Rate (mm)
Pasture
Turnips
Millet
15
5 yrs
5 yrs
N/A
30
4 yrs
5 yrs
6 yrs
45
5 yrs
4 yrs
4 yrs
60
5 yrs
4 yrs
5 yrs
75
5 yrs
4 yrs
5 yrs
###
Forage Crop and Pasture Responses to First Pond Sludge Applications
Graeme Ward and Joe Jacobs, Department of Primary Industries, Warrnambool.
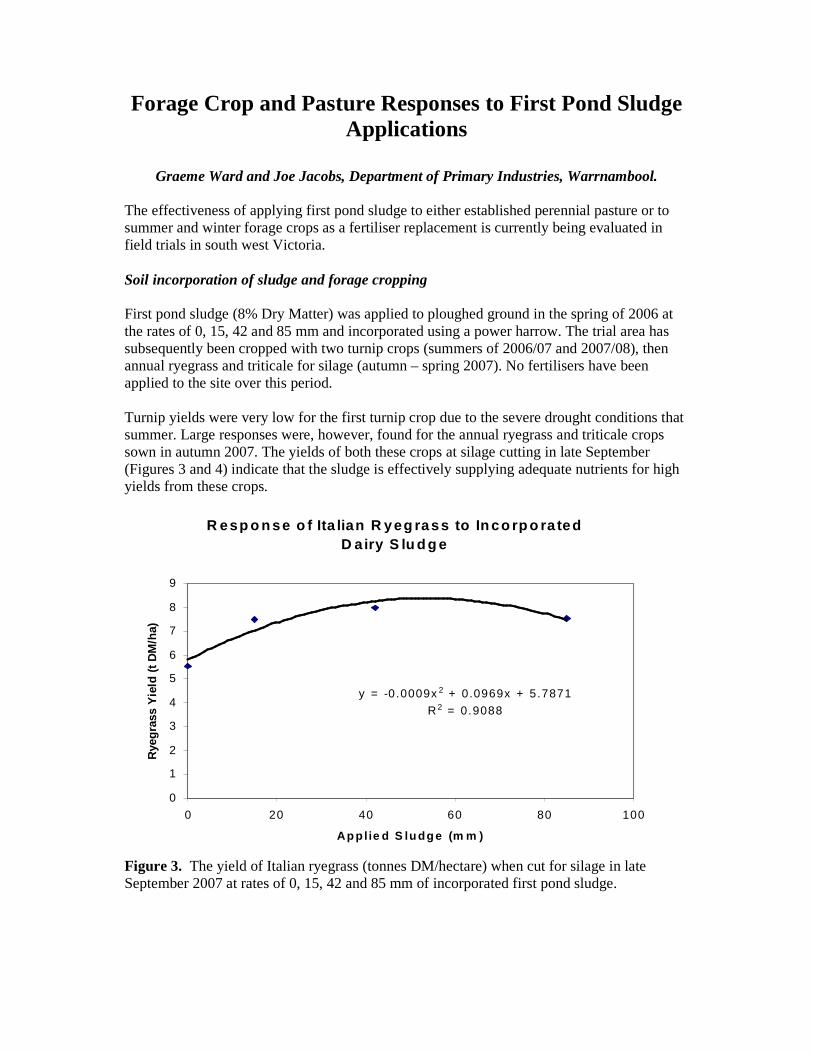
The effectiveness of applying first pond sludge to either established perennial pasture or to summer and winter forage crops as a fertiliser replacement is currently being evaluated in field trials in south west Victoria. Soil incorporation of sludge and forage cropping First pond sludge (8% Dry Matter) was applied to ploughed ground in the spring of 2006 at the rates of 0, 15, 42 and 85 mm and incorporated using a power harrow. The trial area has subsequently been cropped with two turnip crops (summers of 2006/07 and 2007/08), then annual ryegrass and triticale for silage (autumn – spring 2007). No fertilisers have been applied to the site over this period. Turnip yields were very low for the first turnip crop due to the severe drought conditions that summer. Large responses were, however, found for the annual ryegrass and triticale crops sown in autumn 2007. The yields of both these crops at silage cutting in late September (Figures 3 and 4) indicate that the sludge is effectively supplying adequate nutrients for high yields from these crops. Figure 3. The yield of Italian ryegrass (tonnes DM/hectare) when cut for silage in late September 2007 at rates of 0, 15, 42 and 85 mm of incorporated first pond sludge.
R esp o n se o f Ita lian R yeg rass to In co rp o ra ted D a iry S lu d g e
y = -0.0009x 2 + 0.0969x + 5.7871
R 2 = 0.9088
0
1
2
3
4
5
6
7
8
9
0 20 40 60 80 100
Ap p l ie d S lu dg e (m m )
Rye
gras
s Y
ield
(t D
M/h
a)
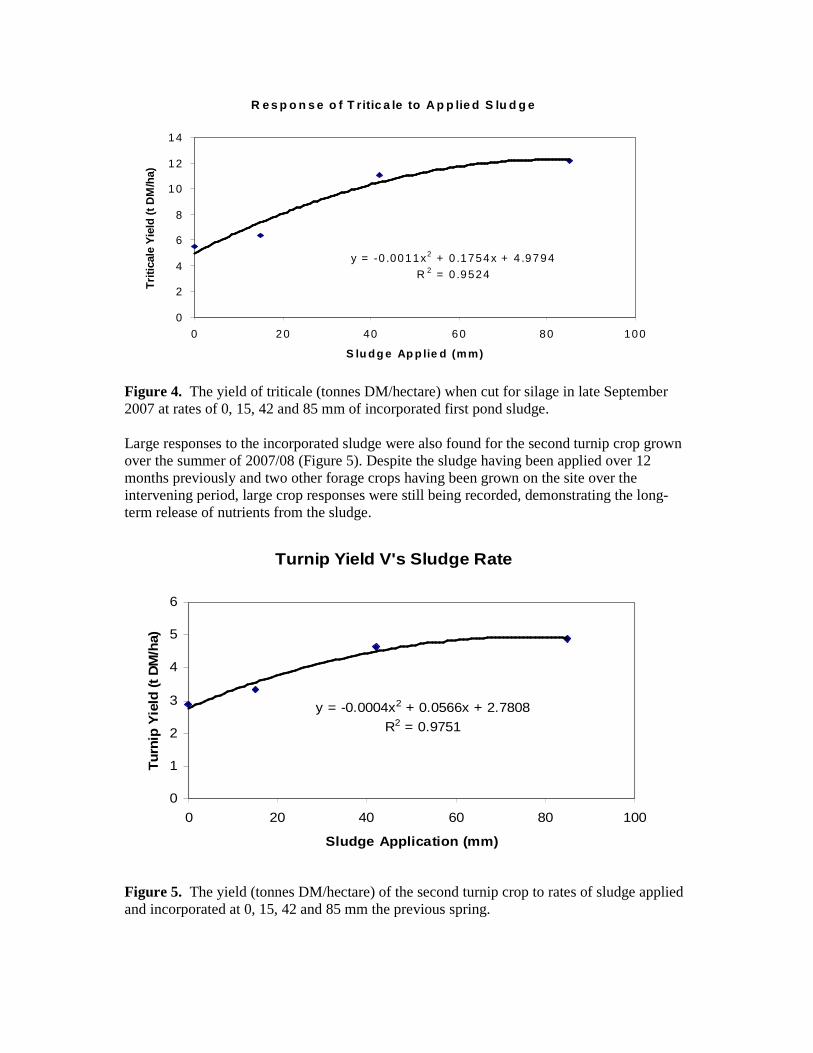
Figure 4. The yield of triticale (tonnes DM/hectare) when cut for silage in late September 2007 at rates of 0, 15, 42 and 85 mm of incorporated first pond sludge. Large responses to the incorporated sludge were also found for the second turnip crop grown over the summer of 2007/08 (Figure 5). Despite the sludge having been applied over 12 months previously and two other forage crops having been grown on the site over the intervening period, large crop responses were still being recorded, demonstrating the long-term release of nutrients from the sludge. Figure 5. The yield (tonnes DM/hectare) of the second turnip crop to rates of sludge applied and incorporated at 0, 15, 42 and 85 mm the previous spring.
R e s p o n s e o f T r itic a le to A p p lie d S lu d g e
y = -0 .0011x2 + 0 .1754x + 4 .9794
R 2 = 0 .9524
0
2
4
6
8
10
12
14
0 20 40 60 80 100
S lu d g e Ap p lie d (m m)
Trit
ical
e Y
ield
(t D
M/h
a)
Turnip Yield V's Sludge Rate
y = -0.0004x2 + 0.0566x + 2.7808
R2 = 0.9751
0
1
2
3
4
5
6
0 20 40 60 80 100
Sludge Application (mm)
Tur
nip
Yie
ld (
t DM
/ha)
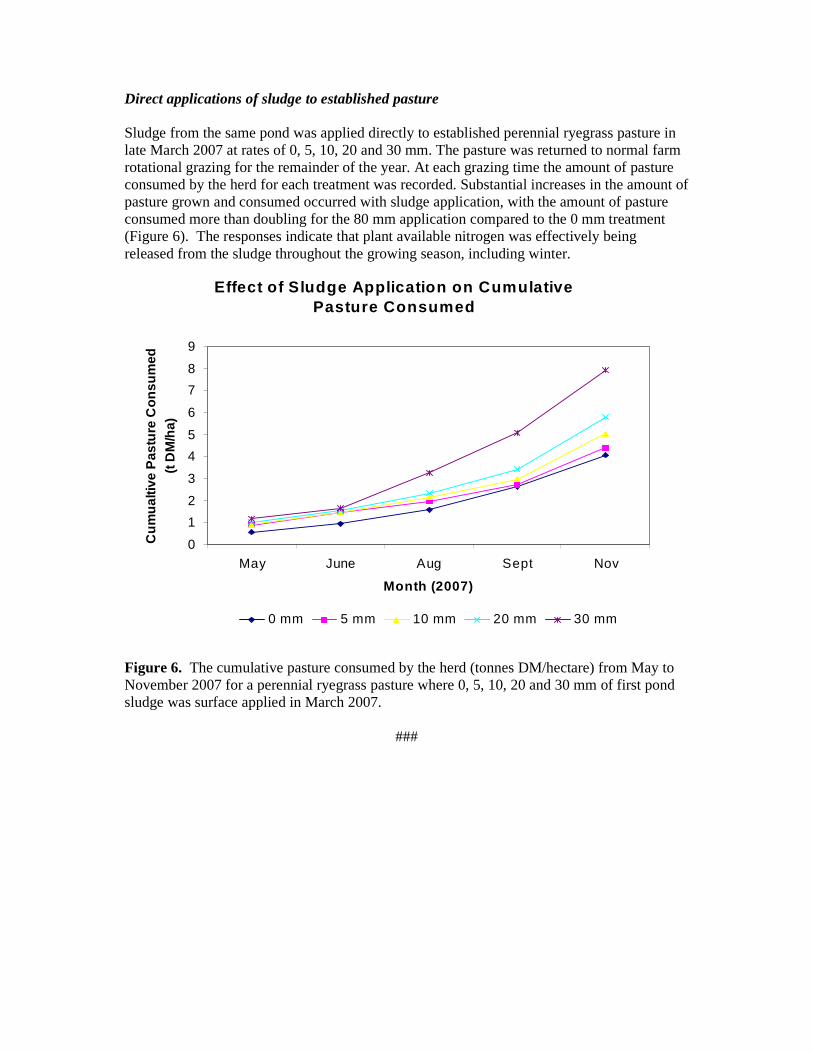
Direct applications of sludge to established pasture Sludge from the same pond was applied directly to established perennial ryegrass pasture in late March 2007 at rates of 0, 5, 10, 20 and 30 mm. The pasture was returned to normal farm rotational grazing for the remainder of the year. At each grazing time the amount of pasture consumed by the herd for each treatment was recorded. Substantial increases in the amount of pasture grown and consumed occurred with sludge application, with the amount of pasture consumed more than doubling for the 80 mm application compared to the 0 mm treatment (Figure 6). The responses indicate that plant available nitrogen was effectively being released from the sludge throughout the growing season, including winter. Figure 6. The cumulative pasture consumed by the herd (tonnes DM/hectare) from May to November 2007 for a perennial ryegrass pasture where 0, 5, 10, 20 and 30 mm of first pond sludge was surface applied in March 2007.
###
Effect of Sludge Application on Cumulative Pasture Consumed
0
1
2
3
4
5
6
7
8
9
May June Aug Sept Nov
Month (2007)
Cum
ualti
ve P
astu
re C
onsu
med
(t
DM
/ha)
0 mm 5 mm 10 mm 20 mm 30 mm