Embed Size (px)
Citation preview

Managing Business Process Flows: Ch 7
Supply Chain Management Managing the Supply Chain Economies of Scale (Chapter 6) Managing Flow Variability: Safety Inventory (Chapter 7)
– Characteristics of Forecasts– Continuous Review System (Reorder Point Policy)– Inventory Pooling– Accurate Response (Newsvendor model)– Postponement / Delayed Differentiation
1Copyright © 2013 Pearson Education Inc. publishing as Prentice Hall

Demand-Supply Mismatch
Apples’s iPhone broke sales record when it sold 1.7 million units on release day. Yet people were lining up to buy the gadget a week later. It is estimated that Apple could have sold upto 2-2.5 million if could produce more units.
• Financial Times, January 2011 During 2007, Ninentdo’s game system Wii was hard to get due to supply shortages.
Analysts estimate that the company was leaving close to $1.3 billion on the table in unmet demand.
• techspot.com, December 17, 2007 Mumbai’s real estate is said to be hot property. However, in the last quarter, sales
have dipped so low that builders are getting worried ... At the current pace of consumption, it will take two years and four months to exhaust this stock. This is alarming because, a healthy market is supposed to have only an eight month inventory pile-up.
• MumbaiMirror.com, February 8, 2011
2Copyright © 2013 Pearson Education Inc. publishing as Prentice Hall
Demand-Supply Mismatch
An inventory write-off widened fourth quarter losses at Bluefly, despite a substantial increase in revenues at the online fashion retailer. Fourth quarter revenues were up 10% to US$29.7m, but the inventory write-off knocked back gross profit by 7%, while the company's net loss for the quarter widened to $5.6m from $3.5m last year.
• Just-Style.com, March 27, 2008
In a December report released by the Canadian Pharmacists Association, nearly 90 per cent of pharmacists across the country said shortages have greatly increased in the past year. Antibiotics, anti-nausea and heart drugs are among the top medications that pharmacists say are in shortest supply... people who can’t get access to their primary drug of choice, may be forced to go without or take alternatives, which could lead to serious side effects ... left unabated, the situation could cause someone with depression to commit suicide or lead other patients to experience serious health problems because they couldn’t get the drugs they needed.
• The Globe and Mail, January 31, 2011
3Copyright © 2013 Pearson Education Inc. publishing as Prentice Hall
Is it all in the forecast?
4Copyright © 2013 Pearson Education Inc. publishing as Prentice Hall

Demand uncertainty and forecasting
Year Demand Forecast Error 1986 270 1987 309 1988 274 1989 268 1990 268 1991 316
5Copyright © 2013 Pearson Education Inc. publishing as Prentice Hall

Demand uncertainty and forecasting
Forecasts depend on– historical data– “market intelligence”
Forecasts are usually (always?) wrong.
A good forecast has at least 2 numbers (includes a measure of forecast error, e.g., standard deviation).
Aggregate forecasts tend to be more accurate.
The longer the forecast horizon, the less accurate the forecast.
6Copyright © 2013 Pearson Education Inc. publishing as Prentice Hall
Palü Gear:Service levels & inventory management
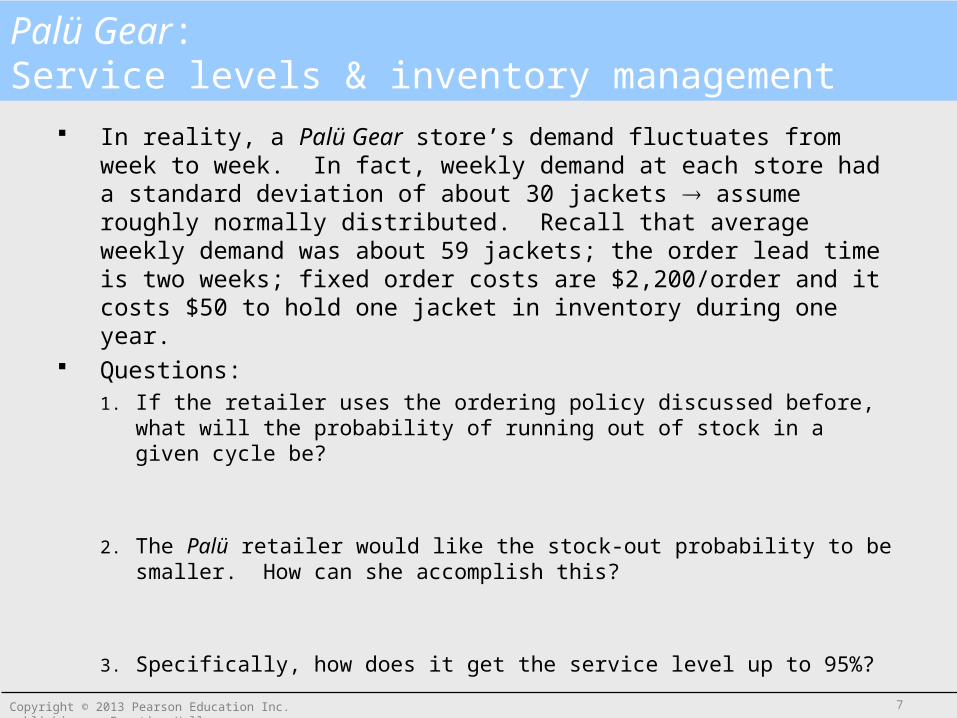
In reality, a Palü Gear store’s demand fluctuates from week to week. In fact, weekly demand at each store had a standard deviation of about 30 jackets assume roughly normally distributed. Recall that average weekly demand was about 59 jackets; the order lead time is two weeks; fixed order costs are $2,200/order and it costs $50 to hold one jacket in inventory during one year.
Questions: 1. If the retailer uses the ordering policy discussed before, what will the
probability of running out of stock in a given cycle be?
2. The Palü retailer would like the stock-out probability to be smaller. How can she accomplish this?
3. Specifically, how does it get the service level up to 95%?
7Copyright © 2013 Pearson Education Inc. publishing as Prentice Hall
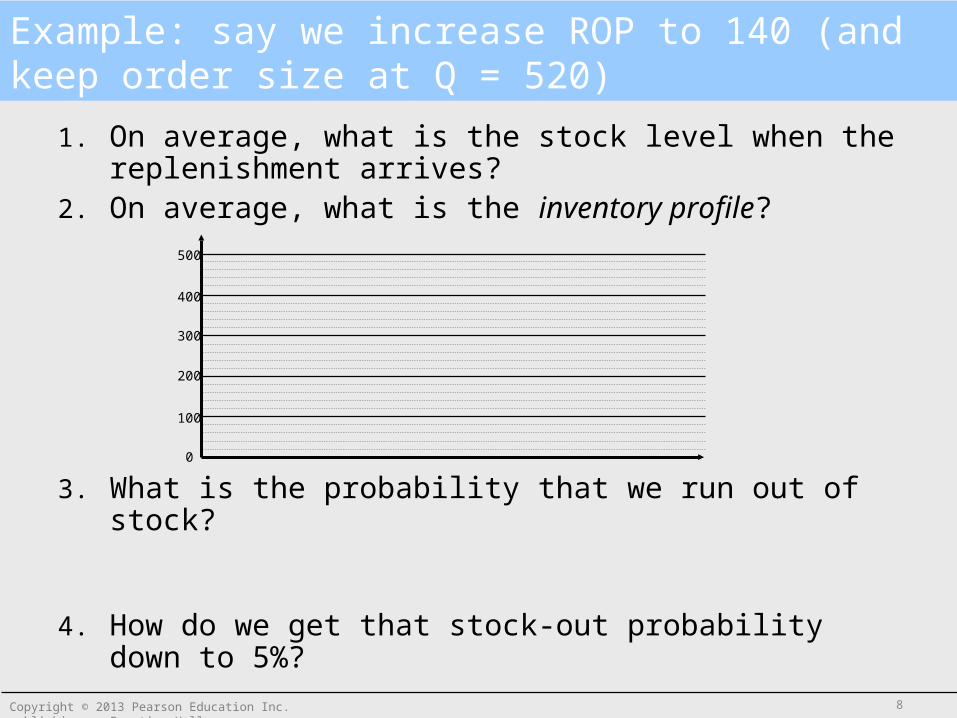
Example: say we increase ROP to 140 (and keep order size at Q = 520)
1. On average, what is the stock level when the replenishment arrives?
2. On average, what is the inventory profile?
3. What is the probability that we run out of stock?
4. How do we get that stock-out probability down to 5%?
0
100
200
300
400
500
8Copyright © 2013 Pearson Education Inc. publishing as Prentice Hall
Safety Stocks & Service Levels: The relationship
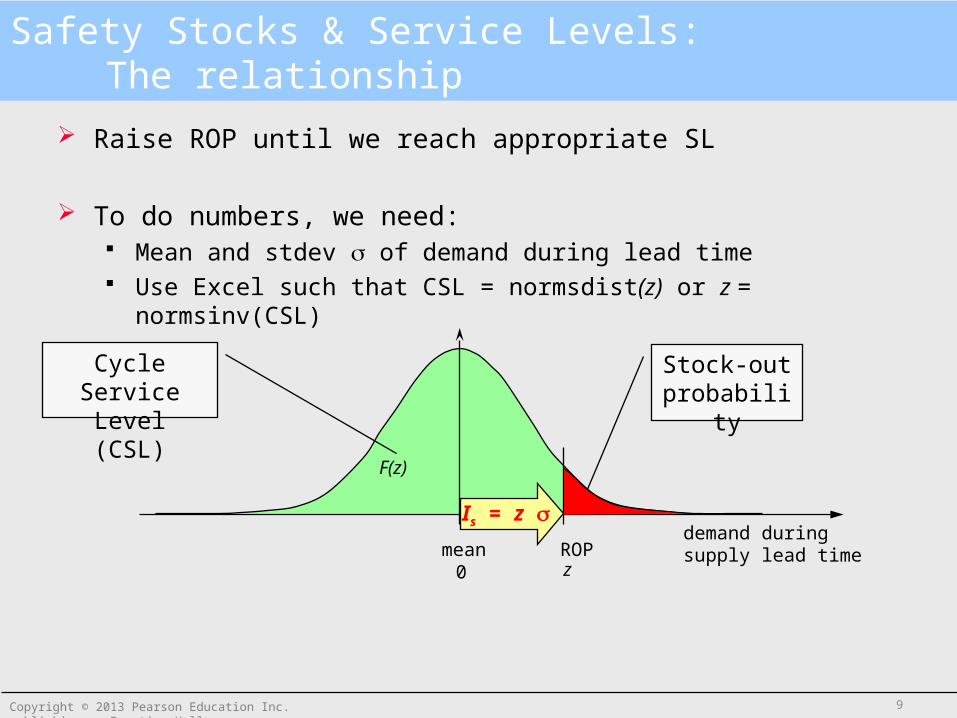
Raise ROP until we reach appropriate SL
To do numbers, we need: Mean and stdev of demand during lead time Use Excel such that CSL = normsdist(z) or z = normsinv(CSL)
mean ROP
F(z)
demand during supply lead time
Stock-out probability
Cycle Service Level (CSL)
Is = z
0 z
9Copyright © 2013 Pearson Education Inc. publishing as Prentice Hall

Applications: – Demand over the leadtime L has standard deviation = RL – Pooled demand over N regions or products has standard deviation = RN
R R R…
Sum of N independent random variables, each with identical standard deviation Rhas
standard deviation =
Safety stock: How find of lead time demand?A Fundamental Statistics Result: The Portfolio Effect
10Copyright © 2013 Pearson Education Inc. publishing as Prentice Hall

Palü Gear: Determining the required Safety Stock for 95% service
DATA:
R = 59 jackets/ week R = 30 jackets/ week
H = $50 / jacket, year
S = $ 2,200 / order L = 2 weeks
QUESTION: What should safety stock be to insure a desired cycle service level of 95%?
ANSWER:
1. Required # of standard deviations z* for SL of 95% = 1.65
2. Determine lead time demand = RL = 30 2 = 42
3. Answer: Safety stock Is = z* lead time demand = 1.65 42 = 70
11Copyright © 2013 Pearson Education Inc. publishing as Prentice Hall

Comprehensive Financial Evaluation:Inventory Costs of Palü Gear
1. Cycle Stock (Economies of Scale)
1.1 Optimal order quantity = 520
1.2 # of orders/year = 5.9
1.3 Annual ordering cost per store = $13,009
1.4 Annual cycle stock holding cost. = $13,009
2. Safety Stock (Uncertainty hedge)
2.1 Safety stock per store = 70
2.2 Annual safety stock holding cost = $3,500.
3. Total Costs for 5 stores = 5 (13,009 + 13,009 + 3,500)
= 5 x $29,500 = $147.5K.
12Copyright © 2013 Pearson Education Inc. publishing as Prentice Hall

Learning Objectives safety stocks
Safety stock is a hedge against uncertainty
Which factors drive safety stock ? – level of service z
Impact of increased service level on required safety stock– demand variability or forecast error R,– delivery lead time L for the same level of service,– delivery lead time variability for the same level of service.
Applications:– How measure safety stock in practice?– What is the value of a better information system?
LzI Rs *
13Copyright © 2013 Pearson Education Inc. publishing as Prentice Hall
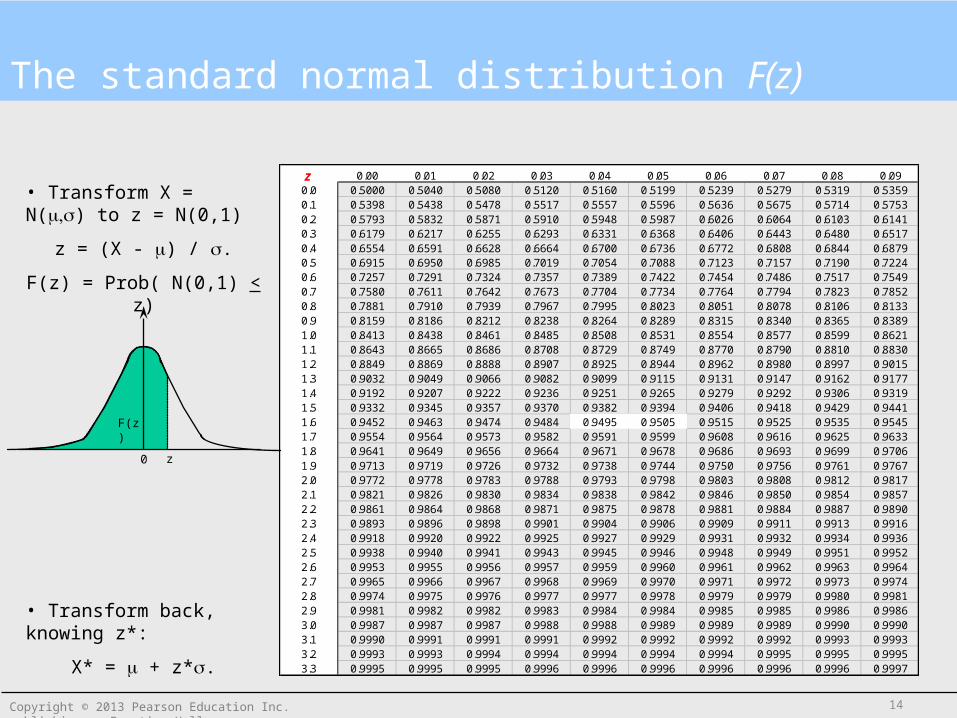
The standard normal distribution F(z)
z 0.00 0.01 0.02 0.03 0.04 0.05 0.06 0.07 0.08 0.090.0 0.5000 0.5040 0.5080 0.5120 0.5160 0.5199 0.5239 0.5279 0.5319 0.53590.1 0.5398 0.5438 0.5478 0.5517 0.5557 0.5596 0.5636 0.5675 0.5714 0.57530.2 0.5793 0.5832 0.5871 0.5910 0.5948 0.5987 0.6026 0.6064 0.6103 0.61410.3 0.6179 0.6217 0.6255 0.6293 0.6331 0.6368 0.6406 0.6443 0.6480 0.65170.4 0.6554 0.6591 0.6628 0.6664 0.6700 0.6736 0.6772 0.6808 0.6844 0.68790.5 0.6915 0.6950 0.6985 0.7019 0.7054 0.7088 0.7123 0.7157 0.7190 0.72240.6 0.7257 0.7291 0.7324 0.7357 0.7389 0.7422 0.7454 0.7486 0.7517 0.75490.7 0.7580 0.7611 0.7642 0.7673 0.7704 0.7734 0.7764 0.7794 0.7823 0.78520.8 0.7881 0.7910 0.7939 0.7967 0.7995 0.8023 0.8051 0.8078 0.8106 0.81330.9 0.8159 0.8186 0.8212 0.8238 0.8264 0.8289 0.8315 0.8340 0.8365 0.83891.0 0.8413 0.8438 0.8461 0.8485 0.8508 0.8531 0.8554 0.8577 0.8599 0.86211.1 0.8643 0.8665 0.8686 0.8708 0.8729 0.8749 0.8770 0.8790 0.8810 0.88301.2 0.8849 0.8869 0.8888 0.8907 0.8925 0.8944 0.8962 0.8980 0.8997 0.90151.3 0.9032 0.9049 0.9066 0.9082 0.9099 0.9115 0.9131 0.9147 0.9162 0.91771.4 0.9192 0.9207 0.9222 0.9236 0.9251 0.9265 0.9279 0.9292 0.9306 0.93191.5 0.9332 0.9345 0.9357 0.9370 0.9382 0.9394 0.9406 0.9418 0.9429 0.94411.6 0.9452 0.9463 0.9474 0.9484 0.9495 0.9505 0.9515 0.9525 0.9535 0.95451.7 0.9554 0.9564 0.9573 0.9582 0.9591 0.9599 0.9608 0.9616 0.9625 0.96331.8 0.9641 0.9649 0.9656 0.9664 0.9671 0.9678 0.9686 0.9693 0.9699 0.97061.9 0.9713 0.9719 0.9726 0.9732 0.9738 0.9744 0.9750 0.9756 0.9761 0.97672.0 0.9772 0.9778 0.9783 0.9788 0.9793 0.9798 0.9803 0.9808 0.9812 0.98172.1 0.9821 0.9826 0.9830 0.9834 0.9838 0.9842 0.9846 0.9850 0.9854 0.98572.2 0.9861 0.9864 0.9868 0.9871 0.9875 0.9878 0.9881 0.9884 0.9887 0.98902.3 0.9893 0.9896 0.9898 0.9901 0.9904 0.9906 0.9909 0.9911 0.9913 0.99162.4 0.9918 0.9920 0.9922 0.9925 0.9927 0.9929 0.9931 0.9932 0.9934 0.99362.5 0.9938 0.9940 0.9941 0.9943 0.9945 0.9946 0.9948 0.9949 0.9951 0.99522.6 0.9953 0.9955 0.9956 0.9957 0.9959 0.9960 0.9961 0.9962 0.9963 0.99642.7 0.9965 0.9966 0.9967 0.9968 0.9969 0.9970 0.9971 0.9972 0.9973 0.99742.8 0.9974 0.9975 0.9976 0.9977 0.9977 0.9978 0.9979 0.9979 0.9980 0.99812.9 0.9981 0.9982 0.9982 0.9983 0.9984 0.9984 0.9985 0.9985 0.9986 0.99863.0 0.9987 0.9987 0.9987 0.9988 0.9988 0.9989 0.9989 0.9989 0.9990 0.99903.1 0.9990 0.9991 0.9991 0.9991 0.9992 0.9992 0.9992 0.9992 0.9993 0.99933.2 0.9993 0.9993 0.9994 0.9994 0.9994 0.9994 0.9994 0.9995 0.9995 0.99953.3 0.9995 0.9995 0.9995 0.9996 0.9996 0.9996 0.9996 0.9996 0.9996 0.9997
F(z)
z0
• Transform X = N() to z = N(0,1)
z = (X - ) / .
F(z) = Prob( N(0,1) < z)
• Transform back, knowing z*:
X* = + z*.
14Copyright © 2013 Pearson Education Inc. publishing as Prentice Hall

Improving Supply Chain Performance:1. The Effect of Pooling/Centralization
System A (Decentralized) System B (Centralized)
Which of the two systems provides a higher level of service for a given levelof safety stock?
15Copyright © 2013 Pearson Education Inc. publishing as Prentice Hall
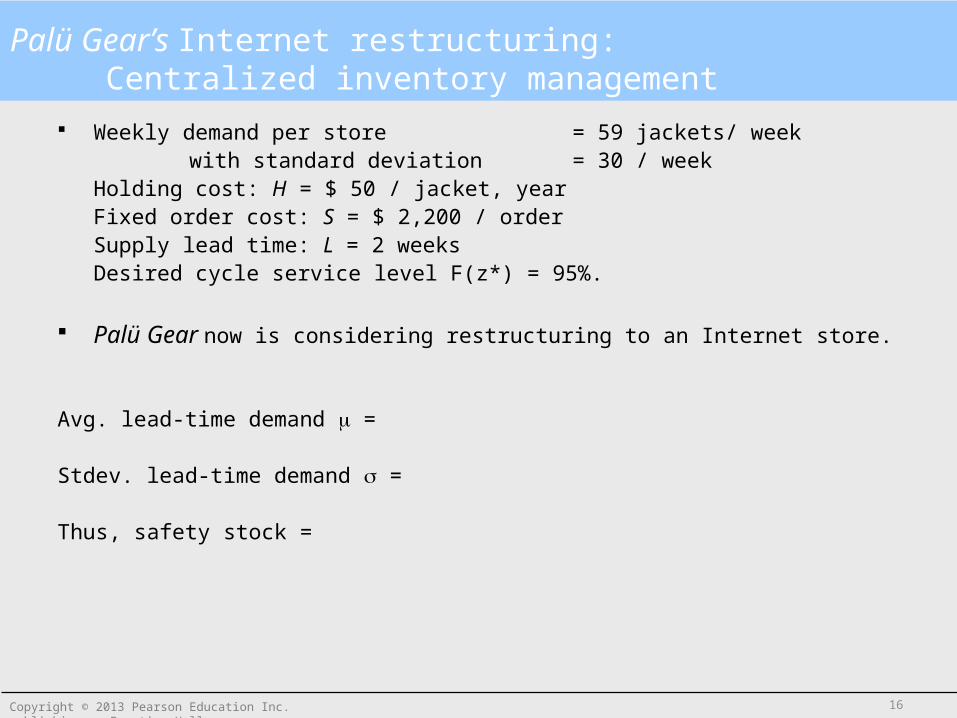
Palü Gear’s Internet restructuring:Centralized inventory management
Weekly demand per store = 59 jackets/ week with standard deviation = 30 / week
Holding cost: H = $ 50 / jacket, yearFixed order cost: S = $ 2,200 / orderSupply lead time: L = 2 weeksDesired cycle service level F(z*) = 95%.
Palü Gear now is considering restructuring to an Internet store.
Avg. lead-time demand =
Stdev. lead-time demand =
Thus, safety stock =
16Copyright © 2013 Pearson Education Inc. publishing as Prentice Hall
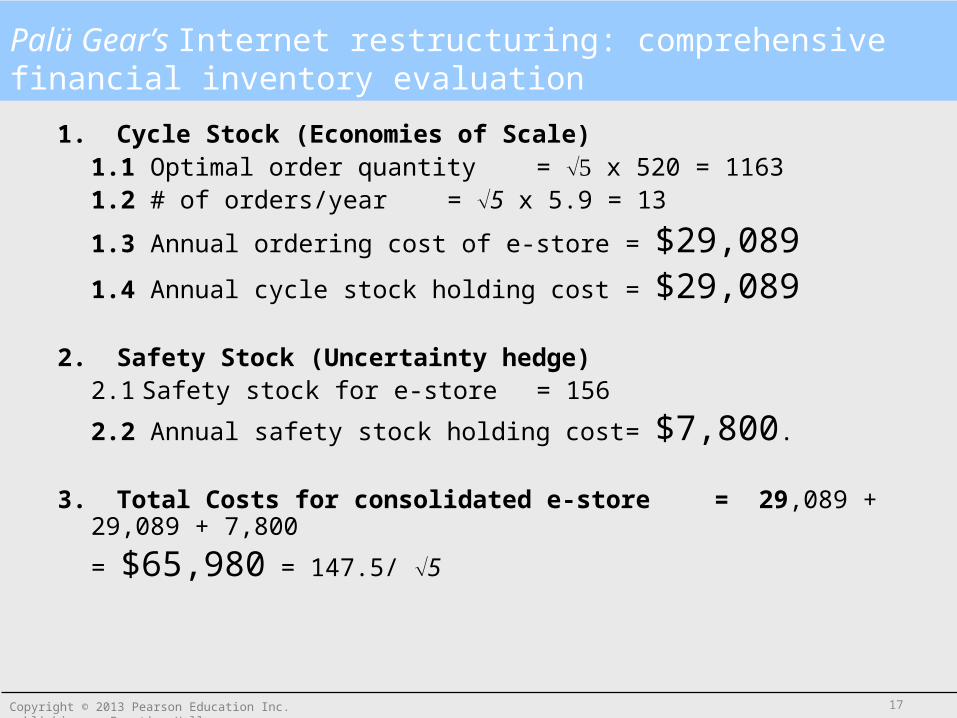
Palü Gear’s Internet restructuring: comprehensive financial inventory evaluation
1. Cycle Stock (Economies of Scale)1.1 Optimal order quantity = x 520 = 11631.2 # of orders/year = 5 x 5.9 = 13
1.3 Annual ordering cost of e-store = $29,0891.4 Annual cycle stock holding cost= $29,089
2. Safety Stock (Uncertainty hedge)2.1 Safety stock for e-store = 156
2.2 Annual safety stock holding cost = $7,800.
3. Total Costs for consolidated e-store = 29,089 + 29,089 + 7,800
= $65,980 = 147.5/ 5
17Copyright © 2013 Pearson Education Inc. publishing as Prentice Hall
Concept of Centralization
Physical Centralization Information Centralization Specialization Commonality Postponement
18Copyright © 2013 Pearson Education Inc. publishing as Prentice Hall
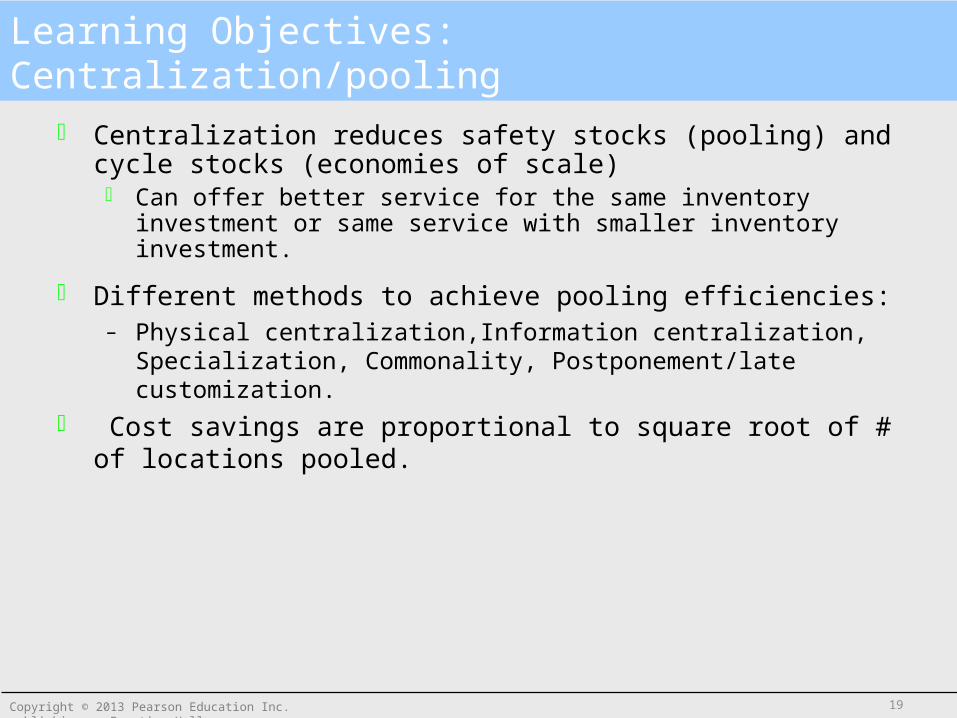
Learning Objectives:Centralization/pooling
Centralization reduces safety stocks (pooling) and cycle stocks (economies of scale) Can offer better service for the same inventory investment or same service with
smaller inventory investment.
Different methods to achieve pooling efficiencies:– Physical centralization,Information centralization, Specialization,
Commonality, Postponement/late customization. Cost savings are proportional to square root of # of locations pooled.
19Copyright © 2013 Pearson Education Inc. publishing as Prentice Hall

Periodic Review Policy
20Copyright © 2013 Pearson Education Inc. publishing as Prentice Hall

Review inventory periodically– Why?
Place orders to bring inventory position up to a target level, called Order Upto Level (OUL).
Contrast with Continuous Review Policy, where– Review inventory continuously– Order fixed quantity (Q) whenever inventory position drops to a certain level
(ROP)
Periodic Review Policy Structure
21Copyright © 2013 Pearson Education Inc. publishing as Prentice Hall

Periodic Review Policy: Safety Inventory (zero leadtime)
6 111
Order Qty. = 130
Order Upto Level = 200 (say)
Inv. On hand = 70
Review Period T= 5 (say)Lead time L = 0 (say)
205 unitsRecd.
Review Period T=5 Review Period T=5
Review Inv.;Place Order
Order Qty = 150 units
Inv. On Hand = 50
8
Q: What is my exposure toStock-out?
22Copyright © 2013 Pearson Education Inc. publishing as Prentice Hall

Periodic Review Policy: safety inventory (positive leadtime)
6 111
Order Qty. = 205
Order Upto Level = 305
Inv. On hand = 100
Review Period T= 5 (say)Lead time L = 2 (say)
3
205 unitsRecd.
Lead Time L=2
Review Period T=5
Review Inv;Place Order
Review Inv.;Place Order
OrderRecd.
Lead Time L=2
Review Period T=5
Review Inv.;Place Order
OrderRecd.
Order Qty = 185 units
Inv. On Hand = 120
8
Q: What is my exposure toStock-out?
23Copyright © 2013 Pearson Education Inc. publishing as Prentice Hall

Periodic Review Policy
Safety stock is now a function of the review period (Tr) and replenishment leadtime (L)
Demand during review period plus lead time– Mean
– SD:
Then, safety stock =
OUL =
RLTD r RT L
( )rT L R
RLTDz
( )rR T L SS
24Copyright © 2013 Pearson Education Inc. publishing as Prentice Hall
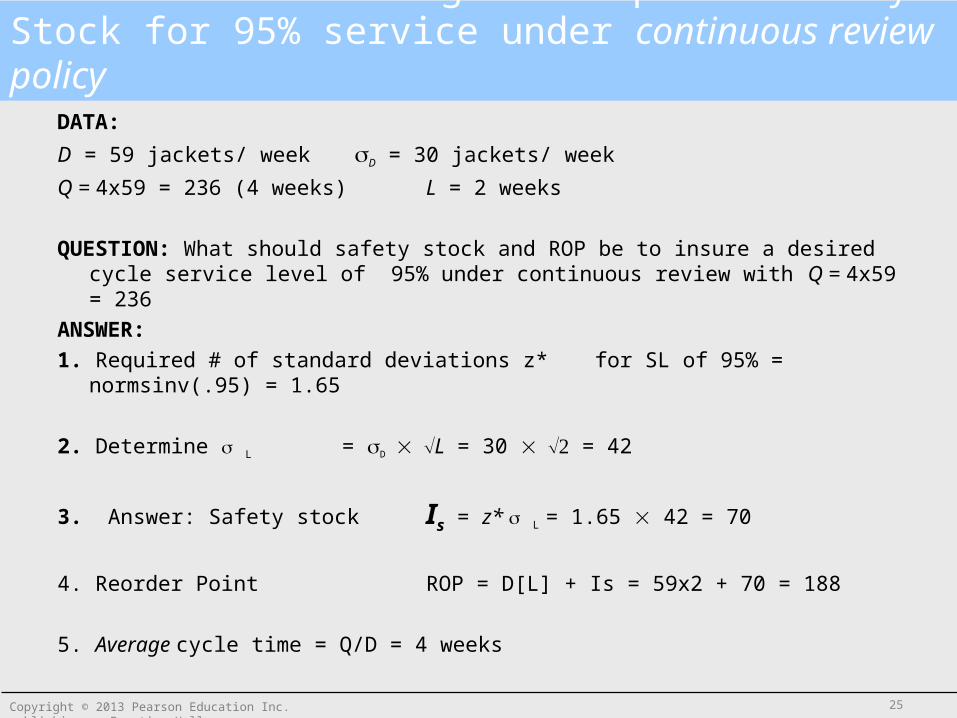
Palü Gear: Determining the required Safety Stock for 95% service under continuous review policy
DATA:
D = 59 jackets/ week D = 30 jackets/ week
Q = 4x59 = 236 (4 weeks) L = 2 weeks
QUESTION: What should safety stock and ROP be to insure a desired cycle service level of 95% under continuous review with Q = 4x59 = 236
ANSWER:
1. Required # of standard deviations z* for SL of 95% = normsinv(.95) = 1.65
2. Determine L = DL = 30 = 42
3. Answer: Safety stock Is = z* L = 1.65 42 = 70
4. Reorder Point ROP = D[L] + Is = 59x2 + 70 = 188
5. Average cycle time = Q/D = 4 weeks
25Copyright © 2013 Pearson Education Inc. publishing as Prentice Hall

Palü Gear: Determining the required Safety Stock for 95% service under periodic review policy
DATA:
D = 59 jackets/ week D = 30 jackets/ week
T = 4 weeks L = 2 weeks
QUESTION: What should safety stock and order-up-to level be to insure a desired cycle service level of 95%? What is corresponding cycle stock?
ANSWER:
1. Required # of standard deviations z* for SL of 95% = normsinv(.95) = 1.65
2. Determine L+T = DL+T) = 30 6 = 73.5
3. Answer: Safety stock Is = z* L+T = 1.65 73.5 = 121
4. Order-up-to Level OUL = D[L+T] + Is = 59x6 + 121 = 476
5. Average order Q = DT = 59x4 = 236 Ic = Q/2 = 118
Notice the significant increase in safety stock due to periodicreview; increase from 70 to 121 units
26Copyright © 2013 Pearson Education Inc. publishing as Prentice Hall

Key learning
Periodic review increases inventory Key lever: try and decrease the review period length
27Copyright © 2013 Pearson Education Inc. publishing as Prentice Hall

Optimal Service Level:The newsvendor problem
28Copyright © 2013 Pearson Education Inc. publishing as Prentice Hall

Palü Gear’s is planning to offer a special line of winter jackets, especially designed as gifts for the Christmas season. Each Christmas-jacket costs the company $250 and sells for $450. Any stock left over after Christmas would be disposed of at a deep discount of $195. Marketing had forecasted a demand of 2000 Christmas-jackets with a forecast error (standard deviation) of 500
How many jackets should Palü Gear’s order?
Optimal Service Level and Accurate Response to Demand Uncertainty when you can order only once: Palü Gear
0.5%0.9%
2.2%
4.5%
7.8%
11.6%
14.6%
15.9%
14.6%
11.6%
7.8%
4.5%
2.2%
0.9%0.5%
0%
2%
4%
6%
8%
10%
12%
14%
16%
18%
600 800 1000 1200 1400 1600 1800 2000 2200 2400 2600 2800 3000 3200 3400
Demand forecast for Christmas jackets
29Copyright © 2013 Pearson Education Inc. publishing as Prentice Hall
What would you do if there was no demand uncertainty?That is, you know that D = 2000 for sure
30Copyright © 2013 Pearson Education Inc. publishing as Prentice Hall

What happens if I order one more unit (on top of Q = 2000)?
Sell the extra unit withprobability …
= …..
Do not sell the extra unit with probability …
= …..
Expected profit from additional unit E() = So? ... Order more?
Towards the newsvendor model Suppose you placed an order of 2000 units but you are not sure if you should order more.
31Copyright © 2013 Pearson Education Inc. publishing as Prentice Hall

0 CapacityLevel
Demand
Demand matchesSupply
ShortageSurplus
Accurate Response to Risk: balancing surplus and shortage risks
32Copyright © 2013 Pearson Education Inc. publishing as Prentice Hall

• In general: raise service level (i.e., order an additional unit) if and only if
E() = (1-SL)MB – SLMC > 0 Sell Do not sell
Thus, optimal service level SL* (= Newsvendor formula)
• Example: use formula for Palu-Gear Christmas order
1. SL* = 2. So how much should Palu order then?
How does this compare to forecasted demand of 2000?
The Value-maximizing Service Level The newsvendor formula
Demand Prob. Cum. Prob.800 1% 1%
1,000 1% 2%1,200 3% 5%1,400 6% 12%1,600 10% 21%1,800 13% 34%2,000 16% 50%2,200 16% 66%2,400 13% 79%2,600 10% 88%2,800 6% 95%3,000 3% 98%3,200 1% 99%
21
1
pp
cp
MCMB
MB
33Copyright © 2013 Pearson Education Inc. publishing as Prentice Hall
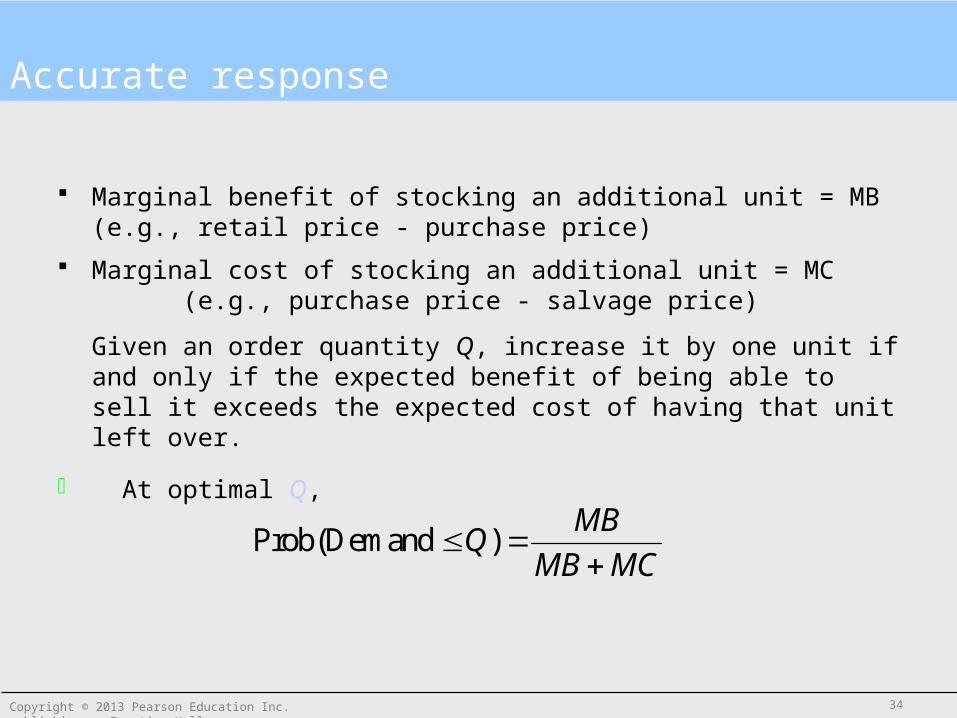
Accurate response
Marginal benefit of stocking an additional unit = MB (e.g., retail price - purchase price)
Marginal cost of stocking an additional unit = MC (e.g., purchase price - salvage price)
Given an order quantity Q, increase it by one unit if and only if the expected benefit of being able to sell it exceeds the expected cost of having that unit left over.
At optimal Q,
Prob(Demand )MB
QMB MC
34Copyright © 2013 Pearson Education Inc. publishing as Prentice Hall

Learning Objectives
Service level is an economic tradeoff between cost of under and over stocking
Good model for Accurate Response for “fashion” goods
35Copyright © 2013 Pearson Education Inc. publishing as Prentice Hall

All rights reserved. No part of this publication may be reproduced, stored in a retrieval system, or transmitted, in any form or by any means, electronic, mechanical, photocopying,
recording, or otherwise, without the prior written permission of the publisher. Printed in the United States of America.
Copyright © 2013 Pearson Education Inc. publishing as Prentice Hall