Embed Size (px)
Citation preview
Managerial Decision-Making 1
MANAGERIAL DECISION-MAKING IN NON-MARKET ENVIRONMENTS:
A SURVEY EXPERIMENT
John M. de Figueiredo
Massachusetts Institute of Technology
Harvard Law School
and
Rui J. de Figueiredo, Jr.
University of California, Berkeley
Managerial Decision-Making 2
ABSTRACT
In this paper we consider a number of experiments to
determine whether aspiring managers can solve non-market
strategy problems. Conducting a survey of nearly 300 MBA
students, we show that with simple, single-stage problems,
managers are very competent in reaching the optimal choice
given their non-market environment. As problems become
more complex, however, they have much greater difficulty in
arriving at the optimal result. In this regard, analysts must use
some caution when evaluating empirical results and applying
theoretical results.
Managerial Decision-Making 3
INTRODUCTION
Over the past decade, scholars and business executives alike have
recognized that, in many businesses, effective non-market strategy is critical to
sustaining profits and growth (Baron 1996, 1997, 1999; Krehbiel 1999; de
Figueiredo and Spiller 2000; de Figueiredo and Tiller 2001, Henisz and Zelner
2001).1 But while scholars have made substantial progress in generating both
positive and normative analyses of the components of effective non-market
strategy, it is still an open question as to what degree practitioners are capable of
incorporating institutional and strategic analysis into their thinking. Indeed, as
has been commented on before, managers are only marginally trained to cope
with such problems (Weingast 1987). As an important precursor to this research,
therefore, it is necessary to understand the extent to which managers can solve
non-market strategy problems, and the extent to which such solutions can be
incorporated in mainstream strategic planning.
In practice, natural experiments to answer this type of question are
difficult to identify in the real-world. As has long been recognized, the difficulty
of controlling for a variety of complex and often times idiosyncratic strategic
situations makes it hard to localize the extent to which the non-market component
has either been effectively pursued or resulted in favorable competitive
1 To cite some examples, Baron (1997) shows how in one case, the trade dispute between Kodak and Fujifilm, the rents earned by proper execution of non-market strategy are potentially substantial. de Figueiredo and Spiller (2000) similarly argue that the enormous rents on the table for telecommunications firms were distributed differentially in the United States and Europe among interexchange carriers and local exchange carriers depending on the regulatory environment in the United States and Europe. de Figueiredo and Kim (2001) estimate that even the recent administrative regulatory dispute over payphone calling card pricing for long distance calls could cost the players $400 million over ten years. Finally, de Figueiredo and Silverman
Managerial Decision-Making 4
advantage. This problem suggests that an alternate approach, experimentation,
might help us identify how managers can cope with non-market strategy
problems. Since experimentation allows for independent controls over the
strategic setting and institutions, it has the advantage of decomposing the
“compositeness” of field data (Smith 1989).
Experimentation as a way of identifying managerial behavior has a
significant tradition in both economics and psychology (see Camerer 1999). In
general, there have been two uses of experiments: 1) to evaluate the predictions
of particular theories, and 2) to identify appropriate behavioral assumptions for
further development of theory. In economics, one example of the rich use of
experimentation has been in testing theories of markets and the institutional rules
that undergird them. Experiments have allowed economists to evaluate both the
speed and efficiency of market institutions (Smith 1989). At the same time, they
have allowed analysts to refine behavioral assumptions about agents’ choices
(Camerer and Lovallo 1998; Chacon and Camerer 1996; Cox, Smith and Walker
1988; Smith 1989).2 As Roth (1991: 107) comments, experiments can help
“game theory bridge the gap between the study of ideally rational behavior and
the study of actual behavior.” In psychology, experimentalists have also
undertaken a large research program to identify the degree to which individuals
can act as the homo economicus of economic theory. Thaler (1980) for example,
(2002) determine there are hundreds of millions of dollars at stake every year in the university approproriations process, which can be attributed to university lobbying. 2 A primary example of this type of approach has been the identification that agents tend to bid on “the risk-averse side of Vickrey’s linear bid function” in first-price sealed bid auctions (Smith 1989: 158). This finding led to further experimentation and subsequent theory modification to include heterogeneity in risk-aversion in auctions (Kagel and Levin 1986).
Managerial Decision-Making 5
relates the “endowment effect” to an aversion for losses (see also Kahneman,
Knestch and Thaler 1990). Similarly, Kahneman and Tversky (1979) provide
experimental results which identify the ability, and inability, of individuals to
conduct Bayesian inference in the way rational agents are posited to behave (see
also Bazerman 1985). In both of these fields, experimentation has allowed
analysts to modify the axiomatic assumptions of behavior to develop richer
theories of social interaction (see, e.g., O'Donoghue and Rabin 1999; Hermalin
and Isen 2000). Although there has been an enormous amount of work completed
on repeated “market” games and games with uncertainty (see Kagel and Roth
1995; Camerer 2001, for a nice summary), there has been little applied to non-
market strategy. Given the significance of non-market strategy in today’s markets,
it is useful to undertake a similar exercise to determine the extent to which
executives in firms can solve strategic non-market problems. In order to evaluate
whether managers are so able, we present the results of a survey experiment that
sheds light on this question. The survey was given to almost three hundred
masters degree students at two leading business schools in the United States.3
Each respondent was given a series of non-market situations pertaining to activity
in administrative regulatory institutions (government agencies and the courts). In
addition, various versions of the questions—with more or less information—were
given to explore the effects such information has on non-market decision-making.
The survey was designed to answer two questions. First, in general, can managers
solve simple non-market problems? Second, to what extent does greater
uncertainty or less clarity affect these decisions? Although our survey cannot
3 As we discuss below, MBA students were engaged as a proxy for managers.
Managerial Decision-Making 6
differentiate whether the performance in the questions is attributable to issues of
bounded rationality and an inability of solve expected value calculations, or to the
precise nature of non-market settings, it does show that expected value
calculations in non-market environments are not trouble-free for managers.
To summarize our results, we find that when the problem is fairly
simple—requiring only a single non-market forum to assess—the students
(managers) perform well: almost ninety percent propose the optimal strategy.
When the problem is more complex, however, performance drops considerably:
when students must allocate resources across a range of non-market outcomes,
only two-thirds propose the payoff maximizing strategy. Finally, when non-
market strategy requires thinking not just about the suppliers of policy but also
competitors, the managers (students) performed even worse, only half achieving
the optimal strategy.
A second set of results has to do with the degree to which managers can
cope with less precision in non-market problems. To that end, we modify the
survey for certain respondents as a way of understanding how managers deal with
such uncertainty. First, we examine the extent to which managers can learn over
time about non-market problems. In this case, the managers were given a series of
questions of the same form to determine if the answers converged to the “right” or
optimal one, over the series. In fact, our results here are heartening for the
economic analysis of non-market strategy; they show that as students are given
problems of a similar form, over time they reduce the losses from suboptimal
answers. We also provided some students with less information—for example,
Managerial Decision-Making 7
with only “fuzzy” probabilities that map actions into outcomes. Here we found
that, in general, managers who are faced with only imprecise information about
outcomes perform similarly to those with more precise information. However,
one result stands out: when faced with low probability events, the managers
perform more poorly with less information. Finally, in the same vein, we also
assessed the degree to which managers would be willing to seek outside advice on
non-market problems. It is easy to theorize that the relationship between advice-
seeking and competence could be either positive—as more competent managers
are also better at recognizing the need for outside advice—or negative—as less
competent managers garner more value from outside advice. Here, two results
stand out. First, managers who are worse at solving these problems are more
likely to hire advisors to solve the problems for them. Second, managers faced
with greater uncertainty are more likely to seek outside advice than those in which
the environment is more precisely understood.
The paper therefore provides some behavioral regularities which are
important to incorporate in developing the literature on non-market strategy. In
particular, as managers face more and more complex non-market environments,
they are more likely to act in a boundedly rational way. Thus, hyper-rational,
non-repeated, complex theoretical models of non-market strategy may be beyond
the capabilities of managers to play optimally in real life. On the other hand,
when faced with single or repeated, complex situations, the traditional homo
economicus might become a reasonable approximation of behavior.
Managerial Decision-Making 8
The paper proceeds as follows. In the following section we describe the
survey instrument used and the sample of students. In Section III, we present the
analysis of increasingly complex strategy situations and how respondents
performed. In addition, we also examine the nature of biases, if any, in responses.
In Section IV, we turn to extensions of the basic instrument to determine how
uncertainty, fuzziness and learning affect the basic results. In Section V we offer
concluding remarks.
II.THE SAMPLE AND INSTRUMENT
In order to explore whether managers can solve simple games involving
non-market strategy, we conducted a survey of 289 MBA students at two leading
business schools. We purposefully chose MBA students (as opposed to political
science students) because, first, in general, most of these students have been
managers prior to entering business school; and second, these are students who
will confront non-market problems as they progress through their careers. Thus,
to a first approximation, they are more likely to reflect the managerial ranks than
are other types of students.
In Business School #1, we randomly sampled one-half of the first year
class (179 students). All students were enrolled in a “core” sequence that
included economics, statistics, strategic management, organizational behavior,
communications, and accounting. In the economics course, all students were
introduced to simple, one-stage Nash equilibrium games and simple repeated
games concepts.
Managerial Decision-Making 9
In Business School #2, we sampled 60% of the second year class (110
students).4 All students had completed their core sequence and had completed
over 75% of their electives. These students had also taken many of the same core
courses as those students had in Business School #1, and were introduced to the
same game theoretic concepts. In addition, the students in Business School #2
who took the survey were also concurrently enrolled in a required second year
course on business-government relations.
TABLE 1 ABOUT HERE
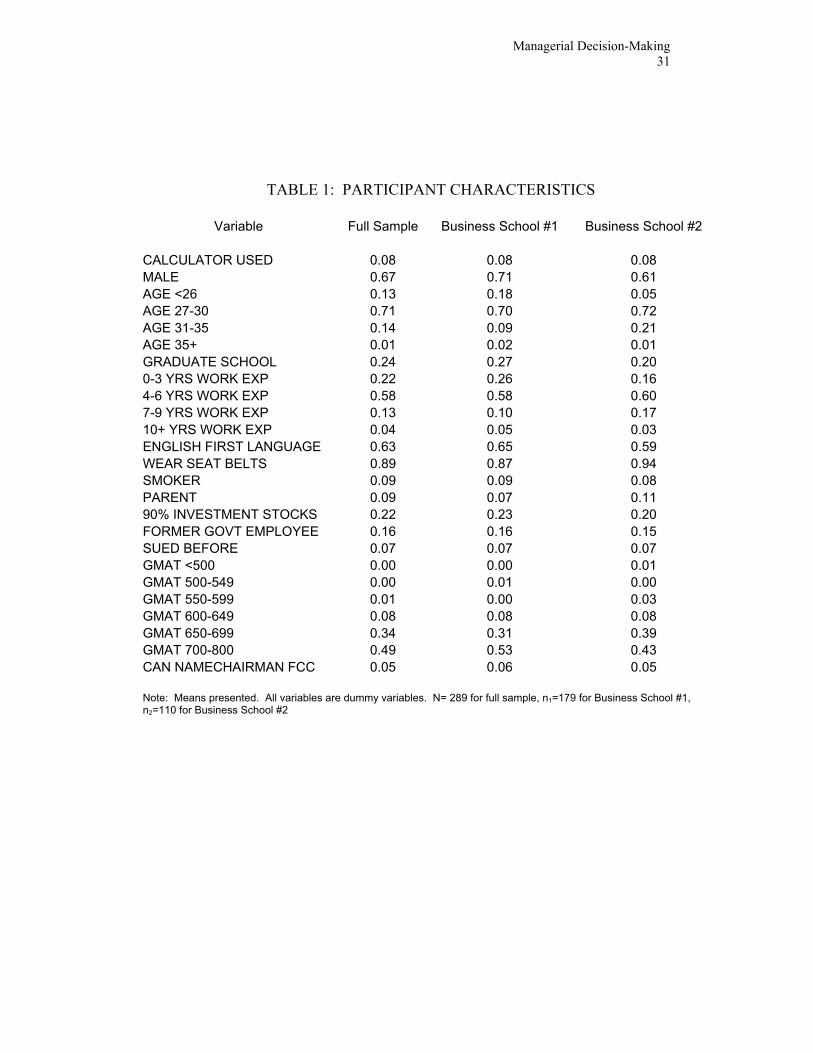
In Table 1 we present the descriptive statistics for the sample. The full
sample is presented in the first column, followed by the Business School #1 and
Business School #2 subsamples. We believe this group is fairly representative of
middle management at most domestic companies. The average age of the sample
is 27-30 years, with 4-6 years work experience. Two thirds are male, and roughly
two thirds are native English speakers. Nearly a quarter have another graduate
degree (besides the MBA they are earning), and nearly 85% have GMAT scores
higher than 700. The risk tendencies of members of the group are presented in a
number of other questions. While it is hard to measure risk tendency, we ask a
number of questions to attempt to capture the differing dimensions of risk. With
respect to risk for body injury, 90% of students wear seat belts, and less than 10%
smoke regularly. With respect to financial risk tendencies, over 20% of survey
4 The sample for Business School #2 may not be random. In Business School #1, 179 of 180 students took the survey, representing nearly three full sections of the MBA class. To the extent that students are somewhat randomly assigned to sections, then the Business School #1 sample is random. In Business School #2, 40% of students did not attend the class. To the extent that the missing students were nonrandom, then the sample can be considered nonrandom. Nevertheless, the results from the two schools are remarkably similar.
Managerial Decision-Making 10
participants have over 90% of their savings in stocks, which, for this age group,
would be considered an “aggressive” financial strategy. Only 10% of respondents
have children, which might lower their tendency to take many types of physical
and financial risks. We do not expect students to have special knowledge of the
scenario used in the survey, as only 5% could name the Federal Communications
Commission (FCC) Chairman, and only 7% had sued or have been sued.
Although the two business schools are relatively homogeneous by most
measures, there are some small differences. The average age and the number of
years work experience at Business School #2 is higher than at Business School
#1. However, Business School #1 has a higher proportion of individuals with
graduate degrees, and has higher mean GMAT scores.
The survey instrument was given to each student in class, and they had 20
minutes to complete the exercise. Students were told the survey was optional;
names and other identifying information was not requested. To motivate the
students to do well, we positioned the survey as a way for diagnosing their
understanding of non-market issues, and as a competition between Business
School #1 and Business School #2, to see which students performed better.5 No
questions were permitted after the instrument was handed out.
A copy of most of the questions in the survey instrument is found in
Appendix 1. The survey instrument was piloted on ten students and modified
before being issued to the 289 MBA students. We have included five questions on
the survey instrument displayed, although the actual survey instrument had only
three questions for each student (hence the varying sample sizes). The actual
Managerial Decision-Making 11
three questions and the ordering of the questions differed across students, so that
we could conduct statistical tests of question independence. Every student
received a question about Lobbying Alone (Question 1). Every student received a
question about Lobbying and Litigation—some received a question with fixed
probabilities, while others received a question with fuzzy probabilities (Question
2). Finally, every student received a question about competitive lobbying. Some
received a question without learning, while others received a question with
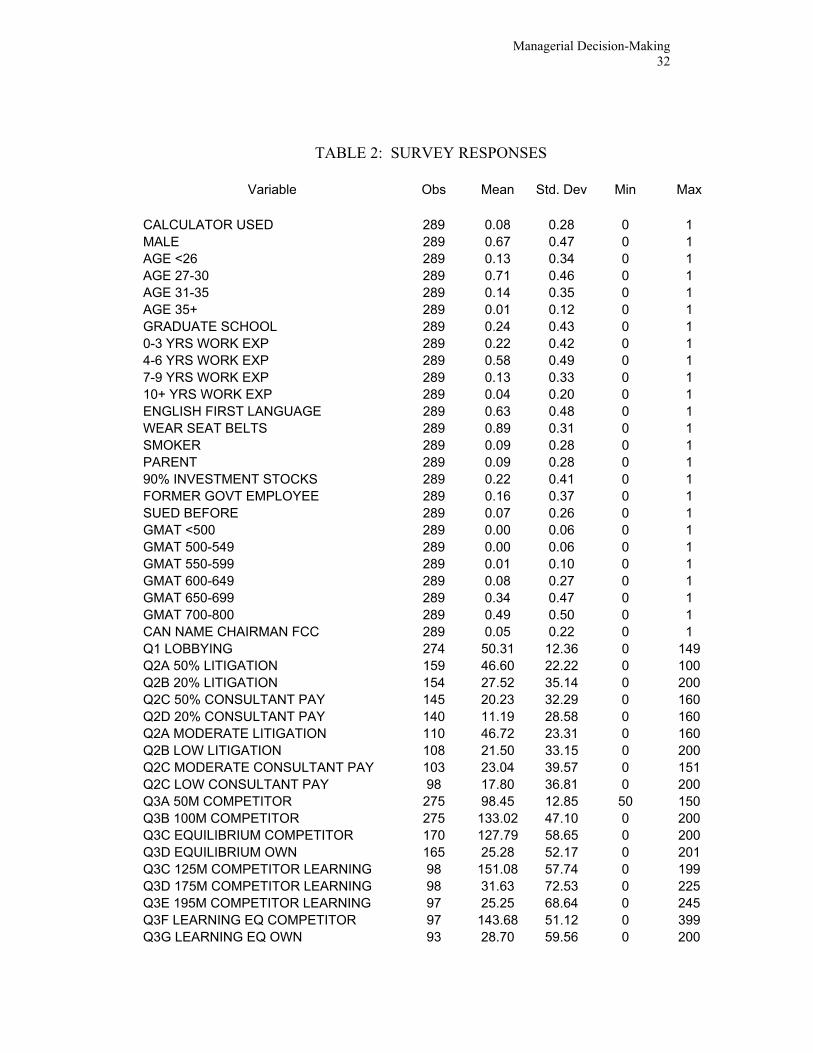
learning (Question 3). We include the descriptive statistics for the questions
answered in Table 2.
TABLE 2 ABOUT HERE
III.SURVEY QUESTIONS AND RESULTS
Lobbying Alone
In this section of the paper, we review the main questions that help us to
understand the ability of students to solve non-market games. We are trying to
determine if students can solve economic games that are couched as non-market
strategy games, and whether there are systematic mistakes that are made by
managers.
The first question that is asked of every student is a question about
lobbying alone. Students are asked to choose a non-market investment level that
is optimal given the structure of the payoff function. This question is designed to
reflect the managerial decision-making about how much to lobby, thinking of
lobbying as an investment.
5 For MBA students, this actually serves as a good motivator.
Managerial Decision-Making 12
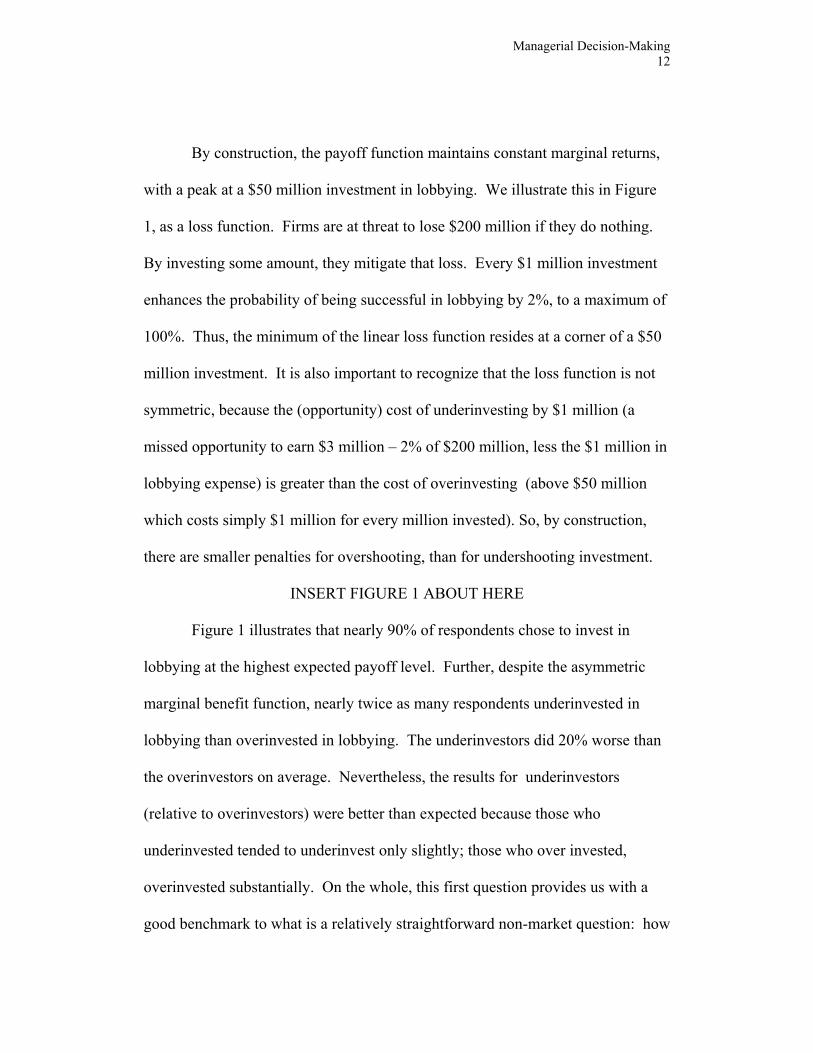
By construction, the payoff function maintains constant marginal returns,
with a peak at a $50 million investment in lobbying. We illustrate this in Figure
1, as a loss function. Firms are at threat to lose $200 million if they do nothing.
By investing some amount, they mitigate that loss. Every $1 million investment
enhances the probability of being successful in lobbying by 2%, to a maximum of
100%. Thus, the minimum of the linear loss function resides at a corner of a $50
million investment. It is also important to recognize that the loss function is not
symmetric, because the (opportunity) cost of underinvesting by $1 million (a
missed opportunity to earn $3 million – 2% of $200 million, less the $1 million in
lobbying expense) is greater than the cost of overinvesting (above $50 million
which costs simply $1 million for every million invested). So, by construction,
there are smaller penalties for overshooting, than for undershooting investment.
INSERT FIGURE 1 ABOUT HERE
Figure 1 illustrates that nearly 90% of respondents chose to invest in
lobbying at the highest expected payoff level. Further, despite the asymmetric
marginal benefit function, nearly twice as many respondents underinvested in
lobbying than overinvested in lobbying. The underinvestors did 20% worse than
the overinvestors on average. Nevertheless, the results for underinvestors
(relative to overinvestors) were better than expected because those who
underinvested tended to underinvest only slightly; those who over invested,
overinvested substantially. On the whole, this first question provides us with a
good benchmark to what is a relatively straightforward non-market question: how
Managerial Decision-Making 13
much should I invest in lobbying if I consider the lobbying game in isolation?
Nine out of ten MBA students are able to lobby optimally.
Lobbying and Litigation with Certainty
The second question explores the relationship between lobbying and
litigation. In reality, firms can lobby regulators for a favorable rule in an
administrative agency. However, if the rule is unfavorable, parties are usually
free to litigate in court over the outcomes. This question is designed to see if
managers can solve this simple two-stage game when all information is
deterministic.
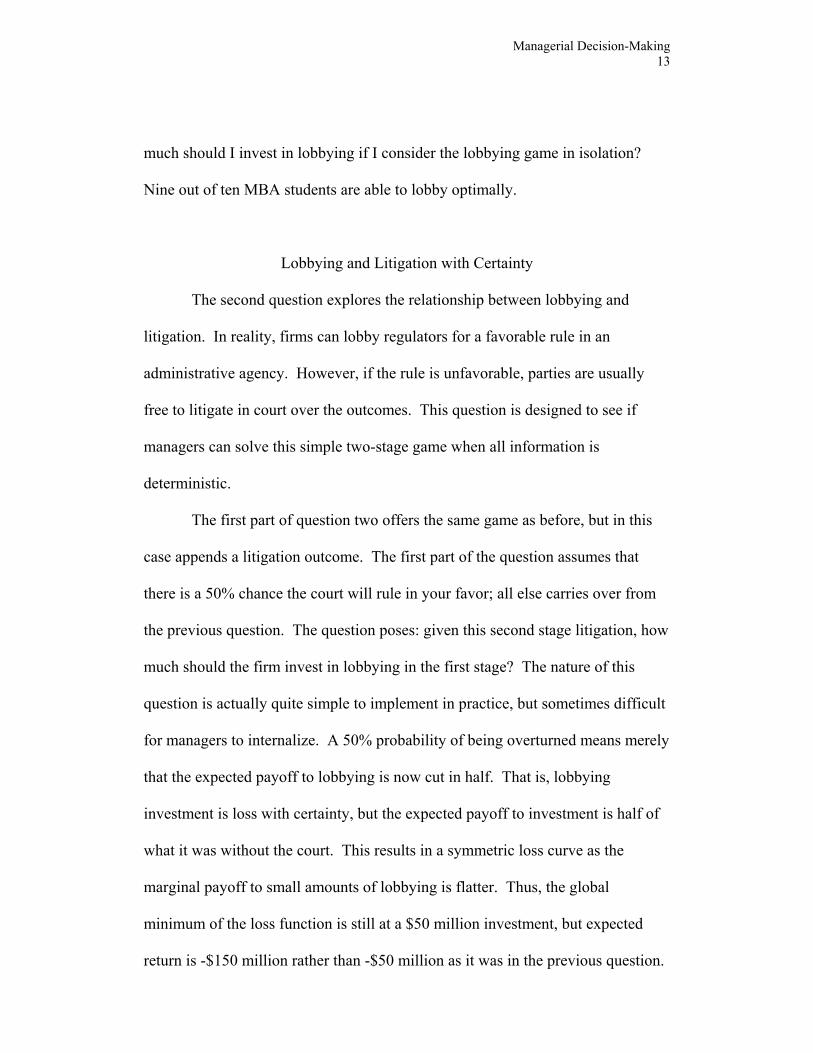
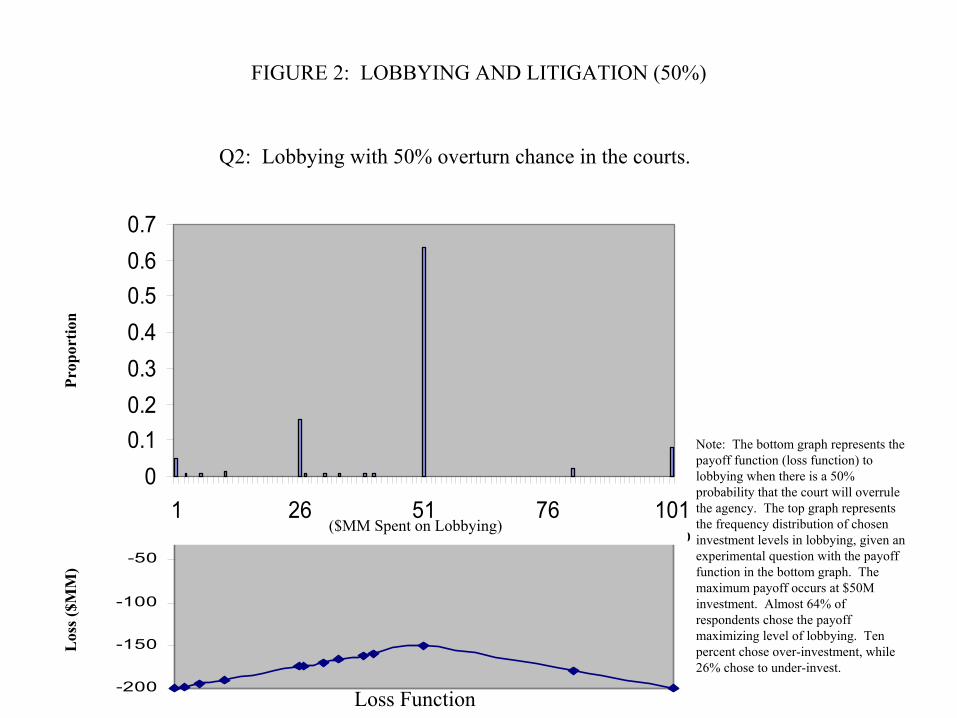
The first part of question two offers the same game as before, but in this
case appends a litigation outcome. The first part of the question assumes that
there is a 50% chance the court will rule in your favor; all else carries over from
the previous question. The question poses: given this second stage litigation, how
much should the firm invest in lobbying in the first stage? The nature of this
question is actually quite simple to implement in practice, but sometimes difficult
for managers to internalize. A 50% probability of being overturned means merely
that the expected payoff to lobbying is now cut in half. That is, lobbying
investment is loss with certainty, but the expected payoff to investment is half of
what it was without the court. This results in a symmetric loss curve as the
marginal payoff to small amounts of lobbying is flatter. Thus, the global
minimum of the loss function is still at a $50 million investment, but expected
return is -$150 million rather than -$50 million as it was in the previous question.
Managerial Decision-Making 14
Overshooting and undershooting are equally costly because of the symmetry of
the loss curve. We illustrate the results in Figure 2.
INSERT FIGURE 2 ABOUT HERE
In this part of the question, 64% of respondents chose the payoff-
maximizing level of investment in lobbying, conditional on a 50/50 chance of
winning in litigation ex post. Nearly 10% of respondents chose to overinvest
(investing up to $100M) while over one-quarter of respondents chose to
underinvest.
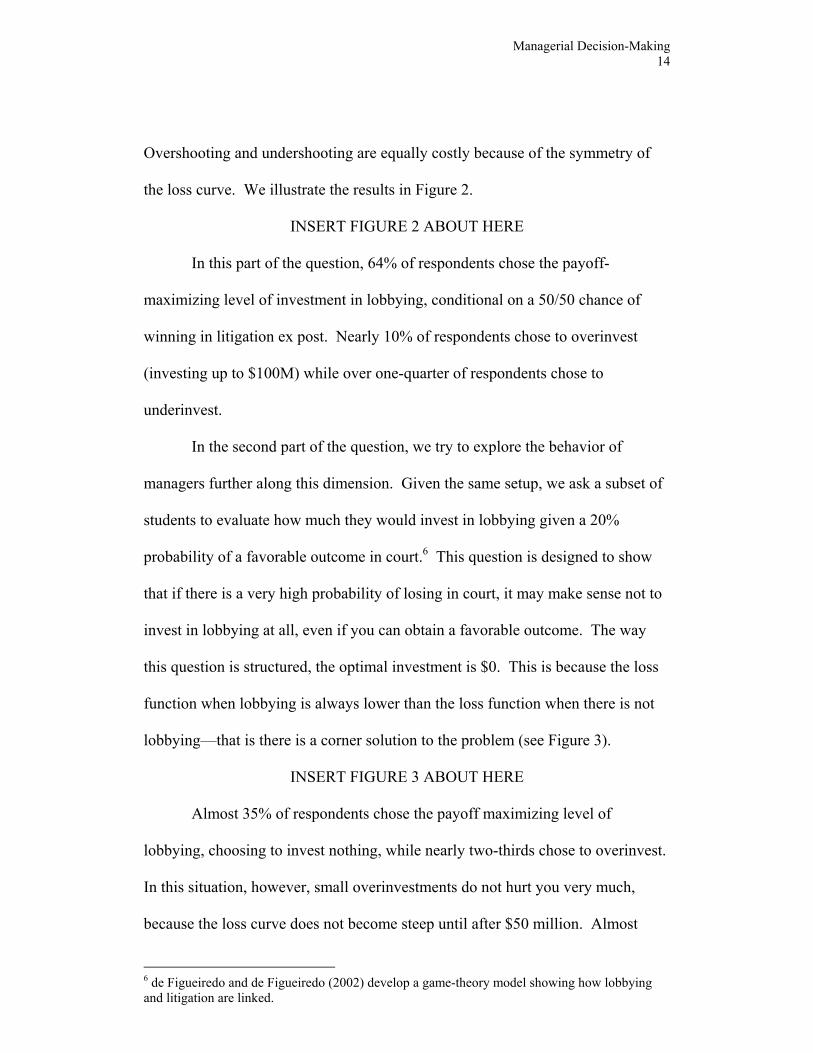
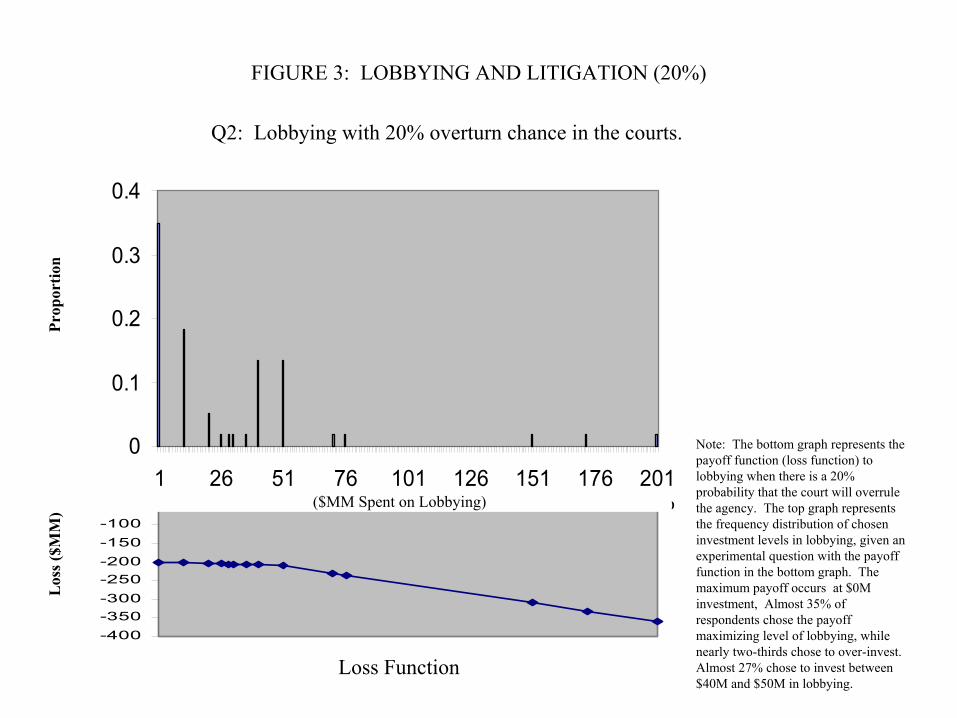
In the second part of the question, we try to explore the behavior of
managers further along this dimension. Given the same setup, we ask a subset of
students to evaluate how much they would invest in lobbying given a 20%
probability of a favorable outcome in court.6 This question is designed to show
that if there is a very high probability of losing in court, it may make sense not to
invest in lobbying at all, even if you can obtain a favorable outcome. The way
this question is structured, the optimal investment is $0. This is because the loss
function when lobbying is always lower than the loss function when there is not
lobbying—that is there is a corner solution to the problem (see Figure 3).
INSERT FIGURE 3 ABOUT HERE
Almost 35% of respondents chose the payoff maximizing level of
lobbying, choosing to invest nothing, while nearly two-thirds chose to overinvest.
In this situation, however, small overinvestments do not hurt you very much,
because the loss curve does not become steep until after $50 million. Almost
6 de Figueiredo and de Figueiredo (2002) develop a game-theory model showing how lobbying and litigation are linked.
Managerial Decision-Making 15
27% chose to invest between $40M and $50M in lobbying, which was the policy
payoff maximum level in the 50% probability question. Ten percent opted to
spend more than $50 million.
Competitive Lobbying
The third question we pose to MBA students focuses on competitive
lobbying. The recent literature on competitive lobbying (e.g. Austen-Smith and
Wright 1996, Groseclose and Snyder 1996) suggests that lobbying does not occur
in a vacuum, but in competition with opposing interest groups. Thus, while the
first two questions focused on noncompetitive lobbying, the competition between
interest groups is explicitly addressed in this question.
Here, we assume that there are two groups competitively lobbying for
rents. They move sequentially, so that the MBA student’s firm moves first, and is
then followed by the competitive firm. (This insures a unique equilibrium.)
While the marginal value to lobbying is the same as it was before, the value is
determined by the net difference in lobbying expenditures between the student
and the competitor. Whereas before, in Question 1, $50 million was the global
maximum ($50M times 2%= 100% probability of not losing $200 million), in this
case, the returns to lobbying would be (Your Expenditure – Competitor Expected
Expenditure) times 2%. This problem calls to mind the model of Groseclose and
Snyder (1996) of buying supermajorities, where we have sequential moves and
the optimal strategy of the first-mover often limits the second-mover’s ability to
“cherry pick” cheap individuals from thin majorities.
Managerial Decision-Making 16
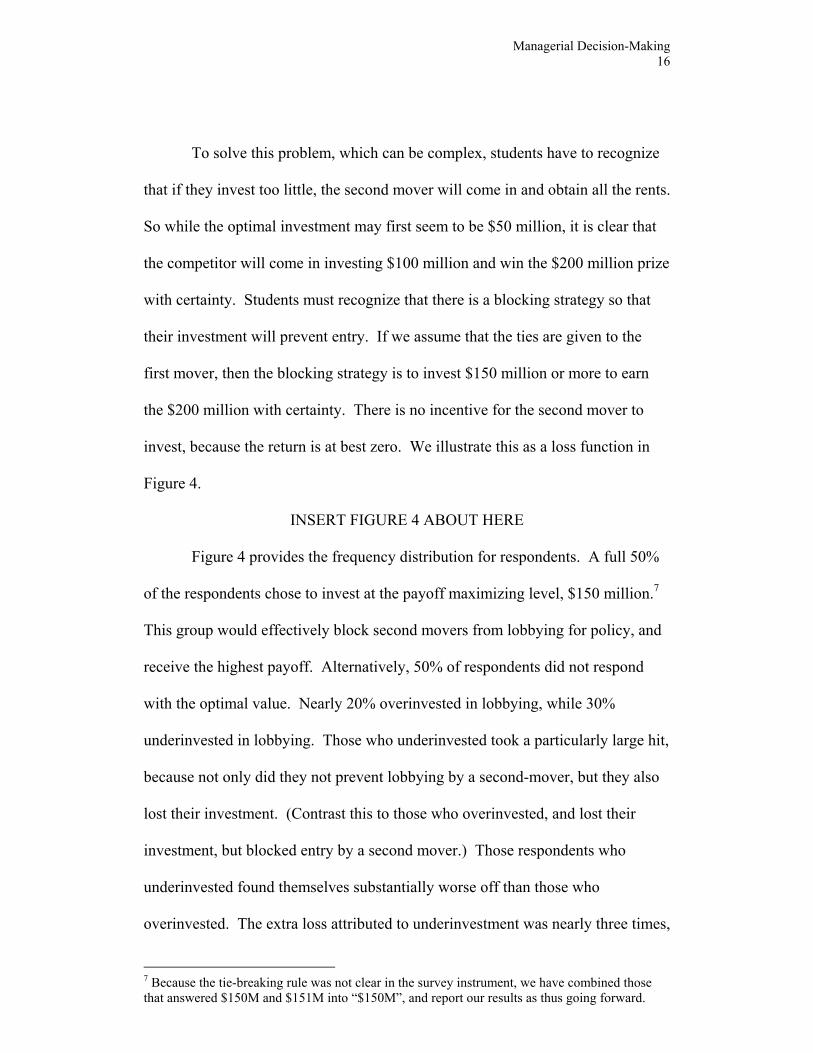
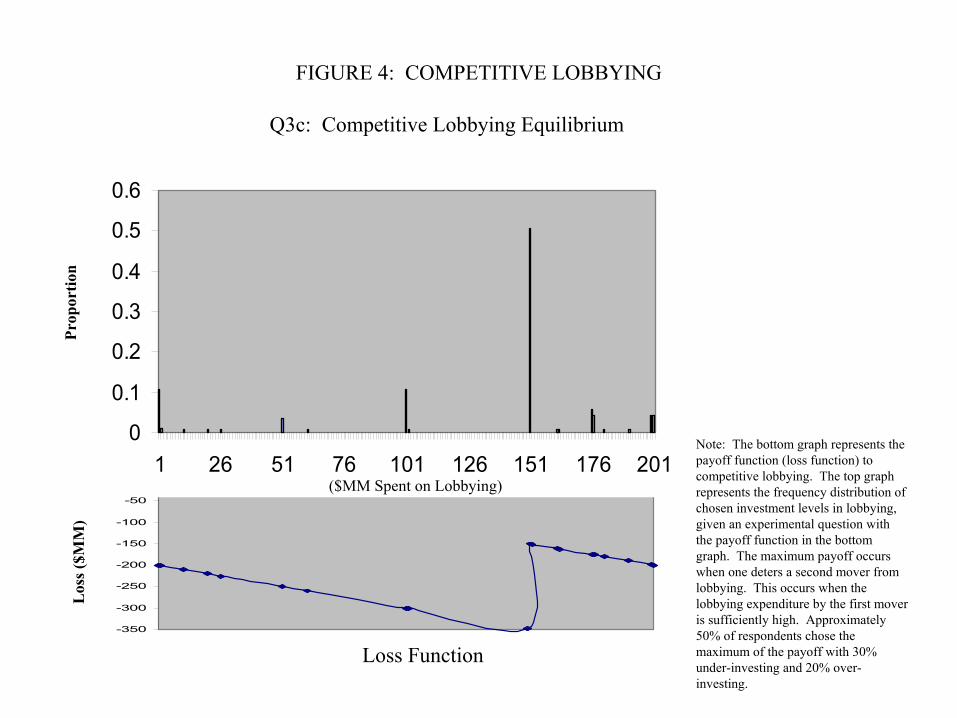
To solve this problem, which can be complex, students have to recognize
that if they invest too little, the second mover will come in and obtain all the rents.
So while the optimal investment may first seem to be $50 million, it is clear that
the competitor will come in investing $100 million and win the $200 million prize
with certainty. Students must recognize that there is a blocking strategy so that
their investment will prevent entry. If we assume that the ties are given to the
first mover, then the blocking strategy is to invest $150 million or more to earn
the $200 million with certainty. There is no incentive for the second mover to
invest, because the return is at best zero. We illustrate this as a loss function in
Figure 4.
INSERT FIGURE 4 ABOUT HERE
Figure 4 provides the frequency distribution for respondents. A full 50%
of the respondents chose to invest at the payoff maximizing level, $150 million.7
This group would effectively block second movers from lobbying for policy, and
receive the highest payoff. Alternatively, 50% of respondents did not respond
with the optimal value. Nearly 20% overinvested in lobbying, while 30%
underinvested in lobbying. Those who underinvested took a particularly large hit,
because not only did they not prevent lobbying by a second-mover, but they also
lost their investment. (Contrast this to those who overinvested, and lost their
investment, but blocked entry by a second mover.) Those respondents who
underinvested found themselves substantially worse off than those who
overinvested. The extra loss attributed to underinvestment was nearly three times,
7 Because the tie-breaking rule was not clear in the survey instrument, we have combined those that answered $150M and $151M into “$150M”, and report our results as thus going forward.
Managerial Decision-Making 17
on average, the loss from overinvestment. Taken together, it would suggest that
managers might have some difficulty thinking about competitive lobbying and
lobbying coupled with litigation, which does not afflict managerial decision-
making in noncompetitive lobbying.
EXTENSIONS
In this section, we introduce three extensions to the analysis.8 The first is
an analysis of learning. Although managers may be asked to make decisions
regarding non-market strategy, it is equivocal whether managers are “thrown”
into this situation or gradually “ramp-up” to learning about the situation over
time.9 While learning over many years is difficult to replicate in a survey, we
have introduced one question with learning. On the competitive lobbying
question, we included, on some surveys, a question where students were “guided”
to the correct answer with leading questions. Rather than just asking them for the
answer on the question, we asked a series of questions so that they could
triangulate on the equilibrium. In doing this, we hoped that they would
understand in what range the equilibrium existed, and they would figure out how
to solve this problem. Thus, as an addendum to question 3, we asked how much
the student would spend in lobbying if the competitor had spent $50, $100, $125,
8 We conducted an econometric analysis of the data to see if we could determine what are the characteristics of managers who perform well in these types of non-market strategy questions. The results were, on the whole, not statistically significant. We did find in one regression on competitive lobbying without learning, that students with GMAT scores above 700 did save up to $45M in excessive losses at a 95% level of statistical significance. There were also small performance differences in performance across business schools. 9 In interviews with executives, the former seems to be a better characterization. These interviews have suggested that managers move along in their careers managing their market strategies. When
Managerial Decision-Making 18
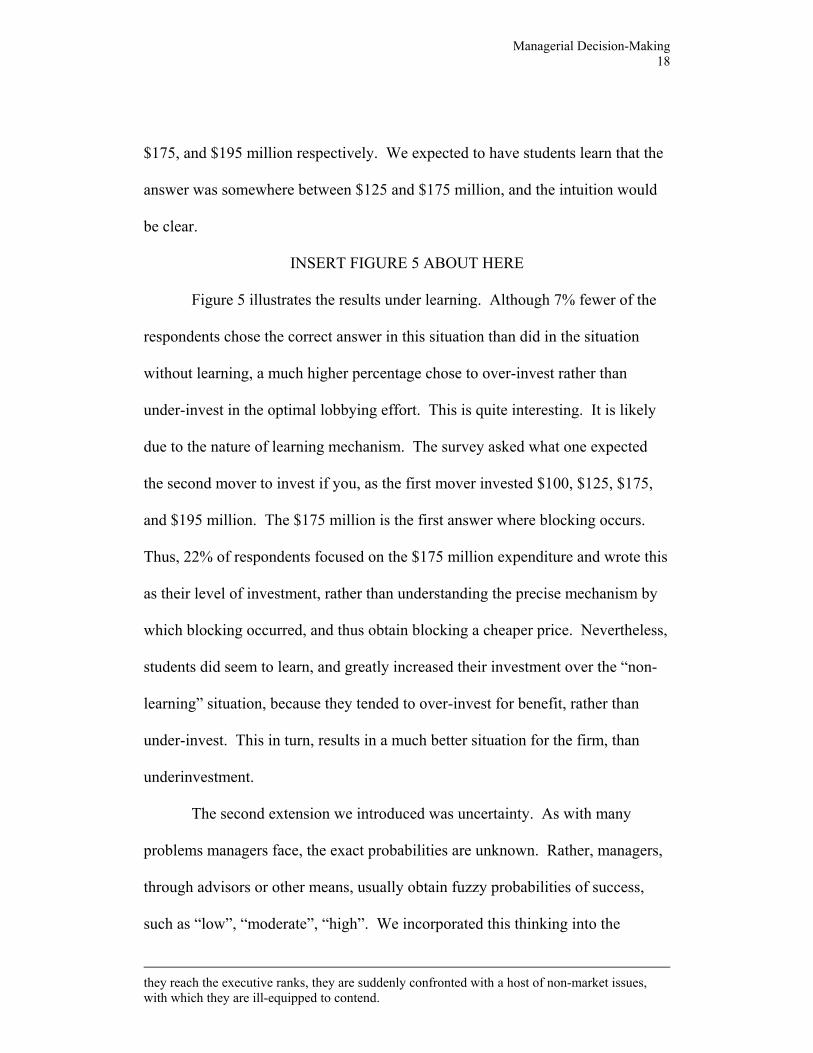
$175, and $195 million respectively. We expected to have students learn that the
answer was somewhere between $125 and $175 million, and the intuition would
be clear.
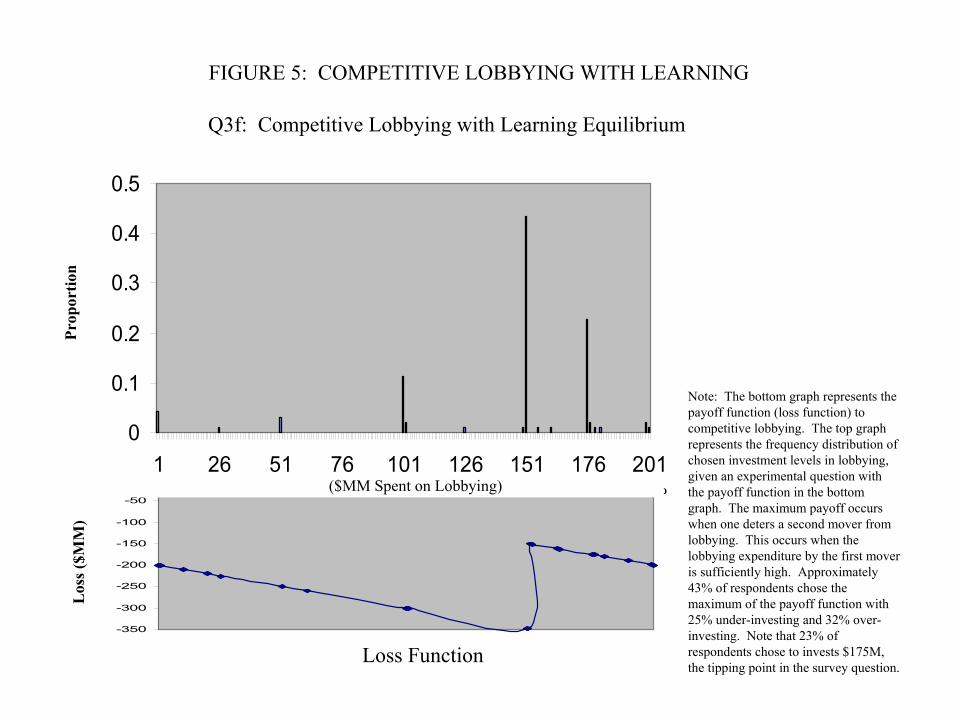
INSERT FIGURE 5 ABOUT HERE
Figure 5 illustrates the results under learning. Although 7% fewer of the
respondents chose the correct answer in this situation than did in the situation
without learning, a much higher percentage chose to over-invest rather than
under-invest in the optimal lobbying effort. This is quite interesting. It is likely
due to the nature of learning mechanism. The survey asked what one expected
the second mover to invest if you, as the first mover invested $100, $125, $175,
and $195 million. The $175 million is the first answer where blocking occurs.
Thus, 22% of respondents focused on the $175 million expenditure and wrote this
as their level of investment, rather than understanding the precise mechanism by
which blocking occurred, and thus obtain blocking a cheaper price. Nevertheless,
students did seem to learn, and greatly increased their investment over the “non-
learning” situation, because they tended to over-invest for benefit, rather than
under-invest. This in turn, results in a much better situation for the firm, than
underinvestment.
The second extension we introduced was uncertainty. As with many
problems managers face, the exact probabilities are unknown. Rather, managers,
through advisors or other means, usually obtain fuzzy probabilities of success,
such as “low”, “moderate”, “high”. We incorporated this thinking into the
they reach the executive ranks, they are suddenly confronted with a host of non-market issues, with which they are ill-equipped to contend.
Managerial Decision-Making 19
analysis of litigation. We replicated question 2 on litigation. However, instead of
giving the participants concrete probabilities of winning in litigation, we asked
them how much they would invest in lobbying (the lobbying production function
is known with certainty) when the probability of winning in litigation was
“moderate” and “low”.
The mean value of investment under moderate probabilities of winning
was $46.7M, compared to $46.6M investment for a 50% chance of winning for a
non-overlapping set of questionnaires. The optimal lobbying investment in this
situation is $50M. This would suggest that students impute a 50% chance of
winning in litigation when they are told they have a “moderate” chance. When
told they have a “low” chance of winning, the mean investment in lobbying is
$21.5M, compared to $27.5M when told they have a 20% chance of winning in
litigation. This result suggests two things. First, the respondents likely impute a
probably lower than 20% when they are told they have a “low” probability of
winning. Second, it may be better to have fuzzy low probabilities, because then
the managers choose closer to the optimal investment, $0M.10 Notably, this result
is consistent with the literature on low and negative probabilities and human
behavior. That is, managers have difficulty in dealing with low probability events
10 There is another way of looking at this. That is, assume that managers choose the optimal investment with fuzzy probabilities. What is the probability they impute? Unfortunately we cannot answer this question, because with constant marginal benefit, managers should only choose $0M or $50M. To the extent that there is a bimodal distribution, reflecting indifference between the two corners, and we see $21.5M as the outcome, this would suggest that 40% of managers believed that “low” meant less than 25% probability of winning, while 60% of managers believed that “low” meant 25% or greater probability of winning. Note, however, that this strictly economic interpretation must be taken carefully, as the results of question two are at odds with this outcome.
Managerial Decision-Making 20
and making what are profit-maximizing decisions in this realm (Kahneman and
Tversky 1979, Viscusi 1999).
A final extension we introduced into the survey was on the reliance on
consultants. A common critique made of the non-market strategy field is that
managers do not have to know non-market management tools, because they have
people who can advise them.11 We tackle this critique in this survey instrument.
These experienced advisors and consultants can offer managers the “right”
answer. We append to question two additional questions related to how much a
manager would be willing to pay an advisor under conditions of certainty and
under conditions of uncertainty. This allows us to identify how confident
managers are in their calculations. It also allows us to see if managers are willing
to pay advisors more under uncertainty (where supposedly their value is higher)
than under conditions of certainty. The relationship between advice-seeking and
competence could be either positive—as more competent managers are also better
at recognizing the need for outside advice—or negative—as less competent
managers garner more value from outside advice. We ask these questions for
both the high and low probability of winning in litigation, where the consultant
offers advice on optimal lobbying investments.
The first interesting result is that managers are willing to pay consultants
more the higher the likelihood of winning in court. With a 50% chance of
winning in litigation, a consultant is paid on average $20M by the firm, but with a
It is also interesting to note how frustrated many respondents were with the idea of having to make decisions with fuzzy probabilities. Many students, after the questionnaire was completed, wanted to know how they were supposed to make decisions without knowing the actual numbers.
Managerial Decision-Making 21
20% chance of winning in litigation, a consultant is paid $11M by the firm. This
is interesting because the consultant may be of more value when the probability is
low, and the firm should not waste its time investing. To examine whether there
were systematic differences between those respondents who chose the payoff-
maximizing investment and those who did not, we constructed a dummy variable
that is equal to one if the optimal investment is chosen and zero otherwise. With
a 50% chance of winning, the consultant makes no more nor less money from
those people who chose the correct answer than those who chose the incorrect
answer (correlation -.02). However, at the 20% chance of winning in litigation,
the manager is likely to pay the consultant more if the manager is unable to
calculate the correct answer herself. This correlation of -.25 is statistically
significant and suggests that managers who cannot solve these problems do hire
consultants, especially when probabilities are in the tails.
We then compared these results to the results with fuzzy probability. The
mean consulting fee for a firm that faces a moderate probability of winning in
litigation is $23.0M, and $17.8M for low probability of winning in litigation.
First, recognize that both of these numbers are higher than the fees they earn
under certainty (paragraph above). So managers pay advisors more the greater
the uncertainty. Second, managers still pay advisors more the better the outcome.
That is, high probabilities of winning are associated with higher fees, despite the
fact that the loss function may be quite steep at low probabilities.
11 This is somewhat akin to managers don’t need to know accounting, because they can hire accountants. Managers only need to know how to “manage.”
Managerial Decision-Making 22
CONCLUSION
As we commented in the introduction, as the field of non-market strategy
develops, it is crucial to understand the degree to which practitioners conform to
the stark behavioral assumptions underlying theories. As a means of assessing the
degree to which the rational assumptions underlying these theories are reasonable
approximations, we provided almost three hundred prospective managers with
increasingly complex strategic situations. Our purpose was to assess the degree to
which the respondents could solve such problems. Indeed, to the extent that the
question had precise answers which could be analytically derived, the first set of
results speak more to the question of whether managers can solve expected utility
problems—in this case couched as non-market problems.
In general our results show that with simple, single-stage problems,
managers are very competent in reaching the optimal choice given their
environment. As problems become more complex, however, they have much
greater difficulty in arriving at the optimal result. In this regard, analysts must use
some caution when evaluating and applying theoretical results. Thus, moving
ahead, we must be careful about how we interpret non-market strategy empirical
results. Studies with non-results do not necessarily suggest that non-market
strategy is not important, but perhaps that managers have not figured out their
optimal strategy.
That said, however, our results also include a strong optimism for
economic analysis of non-market strategy. For they show that at least in the stark
environment we provided, that over time, when confronted with similar problems,
Managerial Decision-Making 23
managers can adapt and learn about their environment and improve their
performance. Further, our final set of results show that when faced with problems
they cannot solve, managers will seek outside advice in order to reach a “better”
solution.
Certainly, experiments in non-market strategy are useful in simplifying
and controlling for a variety of complex situations that make it hard to identify the
extent to which the non-market component has either been effectively pursued or
resulted in favorable competitive advantage. As extensions to the work, it would
be interesting to replicate this experimental study in other settings. Jaffee and
Freeman (2002), in this volume, suggest sophisticated non-market strategies are
being employed in Germany. Creating experiments to compare the sophistication
of managers in other national settings, to those in the United States, would be an
interesting comparative study to follow. In addition, replicating our experiments
in a market setting would be a useful extension of this work, because our survey
cannot determine whether any shortcomings by respondents is due to general
problems of bounded rationality, or specifically to the non-market setting of the
questionnaire. Identifying analogous questions and setups in the market
environment, and conducting a similar survey, would allow us to separate out the
effects of our results that are generated from the “non-market environment”
versus the “analytical setup and bounded rationality.” Nevertheless, there are a
number of reasons to believe that the application of traditional self-interest
calculations might have to be modified when moving to non-market settings.

Managerial Decision-Making 24
Therefore, a final path to pursue is to separate out exactly how non-market
strategy questions might differ systematically from market strategy questions.
Managerial Decision-Making 25
ACKNOWLEDGMENT
Prepared for the "New Institutionalism in Strategic Management" Conference at
Columbia University, April 21-22, 2001. Thanks to John Carroll and Roberto
Fernandez for comments on survey design, and to Brian Silverman for helpful
comments.
Managerial Decision-Making 26
REFERENCES
Austen-Smith, David and John R. Wright (1994). "Counteractive
Lobbying." American Journal of Political Science. 38: 25-44.
Baron, David P. (1996). Business and its Environment. Englewood Cliffs
N.J.: Prentice-Hall.
Baron, David P. (1997). “Integrated Strategy and International Trade
Disputes,” Journal of Economics and Management Strategy 6(2): 291-346.
Baron, David P. (1999). “Integrated Market and Non-market Strategies in
Client and Interest Group Politics,” Business and Politics 1(1): 7-34.
Camerer, Colin F. (1999). “Behavioral Economics: Reunifying Psychology
and Economics. ”Proceedings of the National Academy of Sciences 96
(19): 10575-10577.
Camerer, Colin F. , and Dan Lovallo (1999). “Overconfidence and Excess
Entry: An Experimental Approach.” American Economic Review 89 (1):
306.
Camerer, Colin F. (2001). Behavioral Game Theory: Experiments in
Strategic Interactions. Princeton: Princeton University Press.
Managerial Decision-Making 27
Chacon, Gerard P., and Colin F. Camerer, Colin (1996). “Loss-avoidance
and Forward Induction in Experimental Coordination Games. ”Quarterly
Journal of Economics 111 (1): 165-194.
Cox, James, Vernon Smith, and James Walker (1988). “Theory and
Individual Behavior of First Price Auctions.” Journal of Risk and
Uncertainty 1: 61-99.
de Figueiredo, John M., and Rui J. de Figueiredo (2002). “Lobbying,
Litigation, and Administrative Regulation: The Allocation of Resources by
Interest Groups,” Business and Politics, forthcoming.
de Figueiredo, John M., and Brian S. Silverman (2002). “Academic
Earmarks and the Returns to Lobbying” MIT Working Paper.
de Figueiredo, John M., and James J. Kim (2001). “Strategic Information
Transmission in Lobbying: Getting Ready for Litigation,” MIT Working
Paper.
de Figueiredo, John M., and Emerson H. Tiller (2001). “The Structure and
Conduct of Lobbying: An Empirical Analysis of Corporate Lobbying at
Managerial Decision-Making 28
the Federal Communications Commission,” Journal of Economics and
Management Strategy 10(1): 91-122.
de Figueiredo, Rui J. P., Jr., and Pablo T. Spiller (2000). “Strategy,
Structure and Regulation: Telecommunications in the New Economy.”
Michigan State University – Detroit College of Law Review 1: 253 – 285.
Groseclose, Timothy, and James Snyder (1996). “Buying
Supermajorities,” American Political Science Review 90(2): 303-315.
Henisz, Witold, and Bennet Zelner (2001). “The Institutional Environment
for
Telecommunications Investment,” Journal of Economics and Management
Strategy 10(1): 123-148.
Hermalin, Benjamin E., and Alice Isen (2000). “The Effect of Affect on
Economic and Strategic Decision Making.” University of California,
Berkeley, Working Paper.
Holburn, Guy, and Richard Vanden Bergh (2002). "The Public Policy
Process and the Design of Non-Market Strategy" Advances in Strategic
Management (Vol 19) Elsevier Science (forthcoming).
Managerial Decision-Making 29
Jaffe, Jon and John Freeman (2002). "The Public Policy Process and the
Design of Non-Market Strategy" Advances in Strategic Management (Vol
19) Elsevier Science (forthcoming).
Kagel, John, and Daniel Levin (1986). “The Winner’s Curse and the Value
of Time: Results from a Natural Experiment.” American Economic Review
76: 894-920.
Kagel, John, and Alvin Roth eds. (1995). Handbook of Experimental
Economics. Princeton: Princeton University Press.
Kahneman, Daniel, Jack L. Knetsch and Richard H. Thaler (1990).
“Experimental Tests of the Endowment Effect and the Coase Theorem,”
Journal of Political Economy 98(6): 1325-1348.
Kahneman, Daniel, and Amos Tversky (1979). “Prospect Theory: An
Analysis of Decision Under Risk,” Econometrica 47(2): 263-291.
Krehbiel, Keith. (1999). “Pivotal Politics: A Refinement of Non-market
Analysis for Voting Institutions,” Business and Politics 1(1): 63-82.
Managerial Decision-Making 30
Neale, M., and Bazerman, M.H. (1985). “The Effects of Framing and
Negotiator Overconfidnece on Bargaining Behaviors and Outcomes,”
Academy of Management Journal 28 (1): 34-49.
O'Donoghue, Ted; Rabin, Matthew (1999). “Doing It Now or Later,”
American Economic Review 89(1) (March): 103-24
Roth, Alvin E. (1991). “Game Theory as a Part of Empirical Economics.”
Economic Journal 101: 107-114.
Smith, Vernon (1989). “Theory, Experiment and Economics.” Journal of
Economic Perspectives 3: 151-169.
Thaler, Richard (1980). “Toward a Positive Theory of Consumer Choice.”
Journal of Economic Behavior and Organization 1 (March): 39-60.
Viscusi, W. Kip (2000). “How do Judges think about risk?” American
Law and Economics Review 1(1-2): 26-62.
Weingast, Barry R.,ed. (1987). Political Economy and the Business School
Curriculum. St. Louis: Washington University in St. Louis Press.
Managerial Decision-Making 31
TABLE 1: PARTICIPANT CHARACTERISTICS
Variable Full Sample Business School #1 Business School #2 CALCULATOR USED 0.08 0.08 0.08 MALE 0.67 0.71 0.61 AGE <26 0.13 0.18 0.05 AGE 27-30 0.71 0.70 0.72 AGE 31-35 0.14 0.09 0.21 AGE 35+ 0.01 0.02 0.01 GRADUATE SCHOOL 0.24 0.27 0.20 0-3 YRS WORK EXP 0.22 0.26 0.16 4-6 YRS WORK EXP 0.58 0.58 0.60 7-9 YRS WORK EXP 0.13 0.10 0.17 10+ YRS WORK EXP 0.04 0.05 0.03 ENGLISH FIRST LANGUAGE 0.63 0.65 0.59 WEAR SEAT BELTS 0.89 0.87 0.94 SMOKER 0.09 0.09 0.08 PARENT 0.09 0.07 0.11 90% INVESTMENT STOCKS 0.22 0.23 0.20 FORMER GOVT EMPLOYEE 0.16 0.16 0.15 SUED BEFORE 0.07 0.07 0.07 GMAT <500 0.00 0.00 0.01 GMAT 500-549 0.00 0.01 0.00 GMAT 550-599 0.01 0.00 0.03 GMAT 600-649 0.08 0.08 0.08 GMAT 650-699 0.34 0.31 0.39 GMAT 700-800 0.49 0.53 0.43 CAN NAMECHAIRMAN FCC 0.05 0.06 0.05 Note: Means presented. All variables are dummy variables. N= 289 for full sample, n1=179 for Business School #1, n2=110 for Business School #2
Managerial Decision-Making 32
TABLE 2: SURVEY RESPONSES
Variable Obs Mean Std. Dev Min Max CALCULATOR USED 289 0.08 0.28 0 1 MALE 289 0.67 0.47 0 1 AGE <26 289 0.13 0.34 0 1 AGE 27-30 289 0.71 0.46 0 1 AGE 31-35 289 0.14 0.35 0 1 AGE 35+ 289 0.01 0.12 0 1 GRADUATE SCHOOL 289 0.24 0.43 0 1 0-3 YRS WORK EXP 289 0.22 0.42 0 1 4-6 YRS WORK EXP 289 0.58 0.49 0 1 7-9 YRS WORK EXP 289 0.13 0.33 0 1 10+ YRS WORK EXP 289 0.04 0.20 0 1 ENGLISH FIRST LANGUAGE 289 0.63 0.48 0 1 WEAR SEAT BELTS 289 0.89 0.31 0 1 SMOKER 289 0.09 0.28 0 1 PARENT 289 0.09 0.28 0 1 90% INVESTMENT STOCKS 289 0.22 0.41 0 1 FORMER GOVT EMPLOYEE 289 0.16 0.37 0 1 SUED BEFORE 289 0.07 0.26 0 1 GMAT <500 289 0.00 0.06 0 1 GMAT 500-549 289 0.00 0.06 0 1 GMAT 550-599 289 0.01 0.10 0 1 GMAT 600-649 289 0.08 0.27 0 1 GMAT 650-699 289 0.34 0.47 0 1 GMAT 700-800 289 0.49 0.50 0 1 CAN NAME CHAIRMAN FCC 289 0.05 0.22 0 1 Q1 LOBBYING 274 50.31 12.36 0 149 Q2A 50% LITIGATION 159 46.60 22.22 0 100 Q2B 20% LITIGATION 154 27.52 35.14 0 200 Q2C 50% CONSULTANT PAY 145 20.23 32.29 0 160 Q2D 20% CONSULTANT PAY 140 11.19 28.58 0 160 Q2A MODERATE LITIGATION 110 46.72 23.31 0 160 Q2B LOW LITIGATION 108 21.50 33.15 0 200 Q2C MODERATE CONSULTANT PAY 103 23.04 39.57 0 151 Q2C LOW CONSULTANT PAY 98 17.80 36.81 0 200 Q3A 50M COMPETITOR 275 98.45 12.85 50 150 Q3B 100M COMPETITOR 275 133.02 47.10 0 200 Q3C EQUILIBRIUM COMPETITOR 170 127.79 58.65 0 200 Q3D EQUILIBRIUM OWN 165 25.28 52.17 0 201 Q3C 125M COMPETITOR LEARNING 98 151.08 57.74 0 199 Q3D 175M COMPETITOR LEARNING 98 31.63 72.53 0 225 Q3E 195M COMPETITOR LEARNING 97 25.25 68.64 0 245 Q3F LEARNING EQ COMPETITOR 97 143.68 51.12 0 399 Q3G LEARNING EQ OWN 93 28.70 59.56 0 200
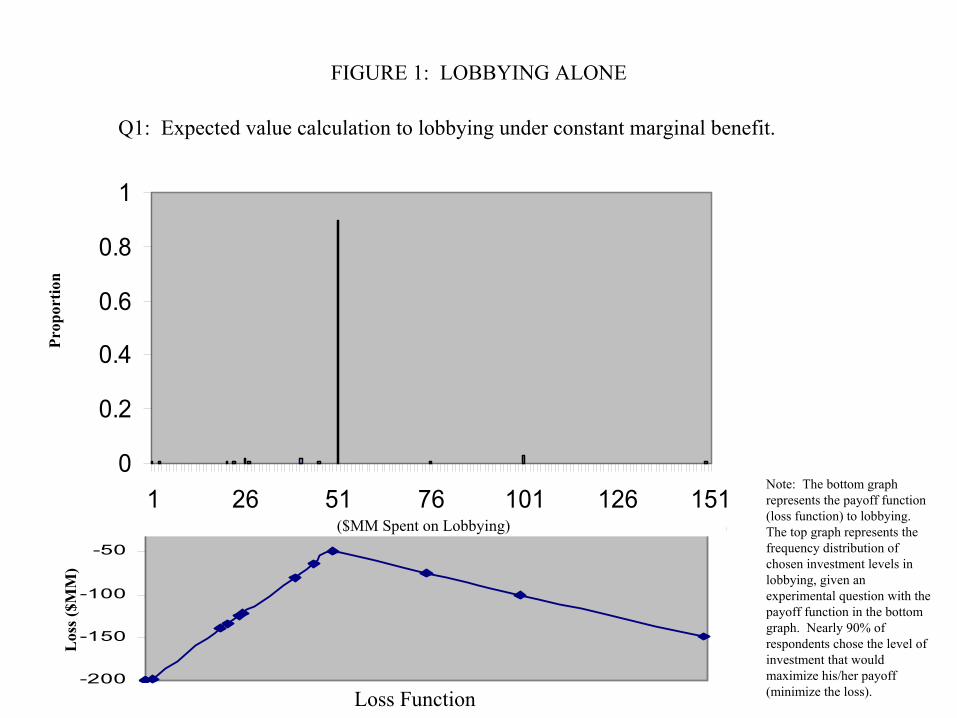
FIGURE 1: LOBBYING ALONE
-200
-150
-100
-50
00 50 100 150
Los
s ($M
M)
Q1: Expected value calculation to lobbying under constant marginal benefit.
Loss Function
Prop
ortio
n
Note: The bottom graph represents the payoff function (loss function) to lobbying. The top graph represents the frequency distribution of chosen investment levels in lobbying, given an experimental question with the payoff function in the bottom graph. Nearly 90% of respondents chose the level of investment that would maximize his/her payoff (minimize the loss).
0
0.2
0.4
0.6
0.8
1
1 26 51 76 101 126 151($MM Spent on Lobbying)
-200
-150
-100
-50
00 20 40 60 80 100
FIGURE 2: LOBBYING AND LITIGATION (50%)L
oss (
$MM
)
Q2: Lobbying with 50% overturn chance in the courts.
Loss Function
Prop
ortio
n
Note: The bottom graph represents the payoff function (loss function) to lobbying when there is a 50% probability that the court will overrule the agency. The top graph represents the frequency distribution of chosen investment levels in lobbying, given an experimental question with the payoff function in the bottom graph. The maximum payoff occurs at $50M investment. Almost 64% of respondents chose the payoff maximizing level of lobbying. Ten percent chose over-investment, while 26% chose to under-invest.
00.10.20.30.40.50.60.7
1 26 51 76 101($MM Spent on Lobbying)
-400-350-300-250-200-150-100-5000 50 100 150 200
FIGURE 3: LOBBYING AND LITIGATION (20%)L
oss (
$MM
)
Q2: Lobbying with 20% overturn chance in the courts.
Loss Function
Prop
ortio
n
Note: The bottom graph represents the payoff function (loss function) to lobbying when there is a 20% probability that the court will overrule the agency. The top graph represents the frequency distribution of chosen investment levels in lobbying, given an experimental question with the payoff function in the bottom graph. The maximum payoff occurs at $0M investment, Almost 35% of respondents chose the payoff maximizing level of lobbying, while nearly two-thirds chose to over-invest. Almost 27% chose to invest between $40M and $50M in lobbying.
0
0.1
0.2
0.3
0.4
1 26 51 76 101 126 151 176 201($MM Spent on Lobbying)
-350
-300
-250
-200
-150
-100
-50
00 50 100 150 200
Loss Function
FIGURE 4: COMPETITIVE LOBBYINGL
oss (
$MM
)
Q3c: Competitive Lobbying Equilibrium
Prop
ortio
n
Note: The bottom graph represents the payoff function (loss function) to competitive lobbying. The top graph represents the frequency distribution of chosen investment levels in lobbying, given an experimental question with the payoff function in the bottom graph. The maximum payoff occurs when one deters a second mover from lobbying. This occurs when the lobbying expenditure by the first mover is sufficiently high. Approximately 50% of respondents chose the maximum of the payoff with 30% under-investing and 20% over-investing.
0
0.1
0.2
0.3
0.4
0.5
0.6
1 26 51 76 101 126 151 176 201($MM Spent on Lobbying)
-350
-300
-250
-200
-150
-100
-50
00 50 100 150 200
Loss Function
FIGURE 5: COMPETITIVE LOBBYING WITH LEARNINGL
oss (
$MM
)
Q3f: Competitive Lobbying with Learning Equilibrium
Prop
ortio
n
Note: The bottom graph represents the payoff function (loss function) to competitive lobbying. The top graph represents the frequency distribution of chosen investment levels in lobbying, given an experimental question with the payoff function in the bottom graph. The maximum payoff occurs when one deters a second mover from lobbying. This occurs when the lobbying expenditure by the first mover is sufficiently high. Approximately 43% of respondents chose the maximum of the payoff function with 25% under-investing and 32% over-investing. Note that 23% of respondents chose to invests $175M, the tipping point in the survey question.
0
0.1
0.2
0.3
0.4
0.5
1 26 51 76 101 126 151 176 201($MM Spent on Lobbying)
Non-Market Strategy Questionnaire
The attached questionnaire is completely OPTIONAL and ANONYMOUS. It will beused for the purposes of teaching and research. In addition, any published results orpresentation of the results will be only concerning aggregate patterns of responses. Allanswers will be kept otherwise anonymous.
You have 25 minutes to answer the questions. You may use blank spaces forcalculations. You may use a calculator or other electronic device.
Please note: the boxed part of each question is identical across all questions.
Please answer the two questions below before you leave.
PLEASE WRITE THE TIME ON THE CLOCK WHEN YOU TURN IN THISSURVEY. TIME ON CLOCK AT COMPLETION: ______________________
DID YOU USE A CALCULATOR OR COMPUTER TO ANSWER ANY OF THEQUESTIONS? YES NO
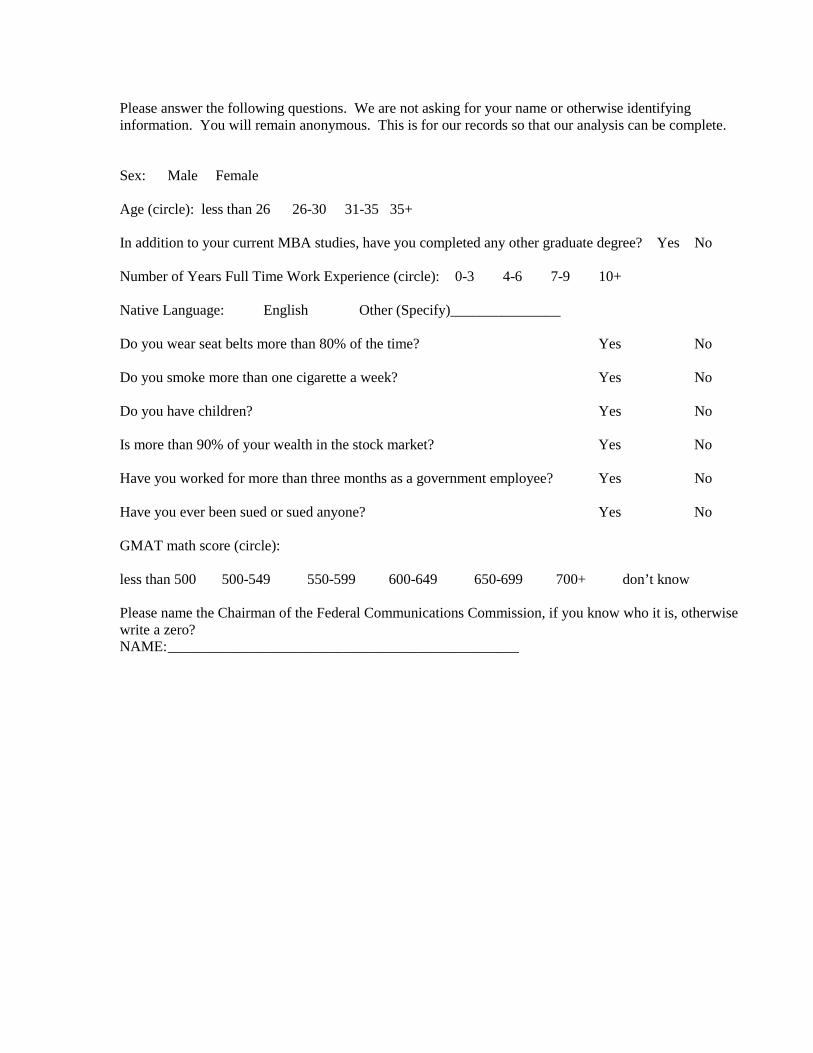
Please answer the following questions. We are not asking for your name or otherwise identifyinginformation. You will remain anonymous. This is for our records so that our analysis can be complete.
Sex: Male Female
Age (circle): less than 26 26-30 31-35 35+
In addition to your current MBA studies, have you completed any other graduate degree? Yes No
Number of Years Full Time Work Experience (circle): 0-3 4-6 7-9 10+
Native Language: English Other (Specify)_______________
Do you wear seat belts more than 80% of the time? Yes No
Do you smoke more than one cigarette a week? Yes No
Do you have children? Yes No
Is more than 90% of your wealth in the stock market? Yes No
Have you worked for more than three months as a government employee? Yes No
Have you ever been sued or sued anyone? Yes No
GMAT math score (circle):
less than 500 500-549 550-599 600-649 650-699 700+ don’t know
Please name the Chairman of the Federal Communications Commission, if you know who it is, otherwisewrite a zero?NAME:________________________________________________
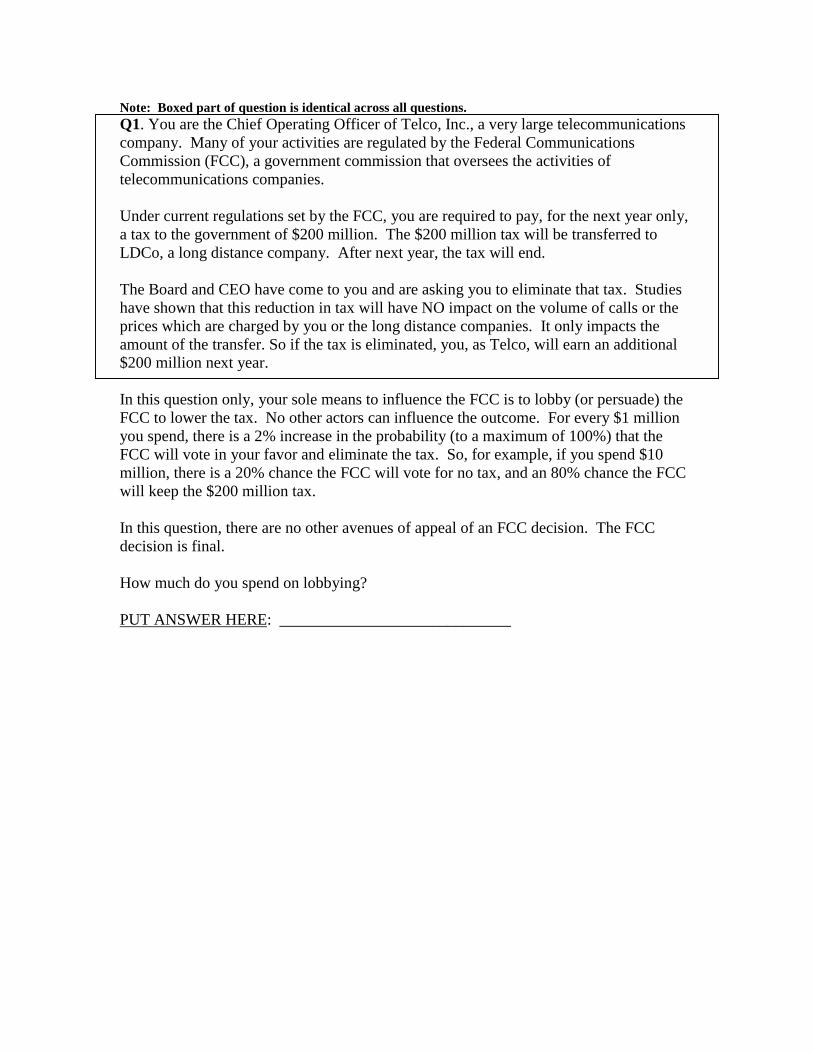
Note: Boxed part of question is identical across all questions.Q1. You are the Chief Operating Officer of Telco, Inc., a very large telecommunicationscompany. Many of your activities are regulated by the Federal CommunicationsCommission (FCC), a government commission that oversees the activities oftelecommunications companies.
Under current regulations set by the FCC, you are required to pay, for the next year only,a tax to the government of $200 million. The $200 million tax will be transferred toLDCo, a long distance company. After next year, the tax will end.
The Board and CEO have come to you and are asking you to eliminate that tax. Studieshave shown that this reduction in tax will have NO impact on the volume of calls or theprices which are charged by you or the long distance companies. It only impacts theamount of the transfer. So if the tax is eliminated, you, as Telco, will earn an additional$200 million next year.
In this question only, your sole means to influence the FCC is to lobby (or persuade) theFCC to lower the tax. No other actors can influence the outcome. For every $1 millionyou spend, there is a 2% increase in the probability (to a maximum of 100%) that theFCC will vote in your favor and eliminate the tax. So, for example, if you spend $10million, there is a 20% chance the FCC will vote for no tax, and an 80% chance the FCCwill keep the $200 million tax.
In this question, there are no other avenues of appeal of an FCC decision. The FCCdecision is final.
How much do you spend on lobbying?
PUT ANSWER HERE: _____________________________
Note: Boxed part of question is identical across all questions.Q2 and 3. You are the Chief Operating Officer of Telco, Inc., a very largetelecommunications company. Many of your activities are regulated by the FederalCommunications Commission (FCC), a government commission that oversees theactivities of telecommunications companies.
Under current regulations set by the FCC, you are required to pay, for the next year only,a tax to the government of $200 million. The $200 million tax will be transferred toLDCo, a long distance company. After next year, the tax will end.
The Board and CEO have come to you and are asking you to eliminate that tax. Studieshave shown that this reduction in tax will have NO impact on the volume of calls or theprices which are charged by you or the long distance companies. It only impacts theamount of the transfer. So if the tax is eliminated, you, as Telco, will earn an additional$200 million next year.
In this question only, regulation in the United States is a two-stage process. First, youcan lobby (or persuade) the FCC to lower the tax. No other actors can influence theoutcome at this stage. For every $1 million you spend, there is a 2% increase in theprobability (to a maximum of 100%) that the FCC will vote in your favor and eliminatethe tax. So, for example, if you spend $10 million, there is a 20% chance the FCC willvote for no tax, and an 80% chance the FCC will keep the $200 million tax.
Second, a party who does not like the ruling, can appeal to the court. You are relativelycertain LDCo would be unhappy by a lower tax, and would choose to take the case tocourt if the FCC decided to lower the tax. In general, the court can uphold the decisionof the FCC, or, if the decision is different from the original state of affairs, revert back tothe original state of affairs. The original state of affairs is a taxation rate of $200 million.
In our example, if the FCC ruled $200 million then the Court could only rule $200million. However, if the FCC ruled no tax, the Court would have a choice of upholdingthe FCC decision at no tax or reverting back to $200 million.
Suppose that the FCC is deciding between reducing the one-time tax to nothing orkeeping the tax at $200 million, and the court will then rule.
[The questions appear on the next page.]
A. Suppose the court has a 50% chance of upholding the FCC and a 50% chance ofoverturning the FCC ruling. How much would you as Telco spend on lobbying?
PUT YOUR ANSWER HERE: ____________________
B. Suppose the court has a 20% chance of upholding the FCC and an 80% chance ofoverturning the FCC ruling. How much would you as Telco spend on lobbying?
PUT YOUR ANSWER HERE: ____________________
C. How much would you as Telco pay a litigation consultant, who is very experienced atmaking these calculations, as a consulting fee, to advise you on your optimalexpenditures, assuming the chances in court are 50/50 as in part A of this question?
PUT YOUR ANSWER HERE: ___________________
D. How much would you as Telco pay a litigation consultant, who is very experienced atmaking these calculations, as a consulting fee, to advise you on your optimalexpenditures, assuming the chances in court are 20/80 as in part B of this question?
PUT YOUR ANSWER HERE: ___________________
Note: Boxed part of question is identical across all questions.
Q4. You are the Chief Operating Officer of Telco, Inc., a very large telecommunicationscompany. Many of your activities are regulated by the Federal CommunicationsCommission (FCC), a government commission that oversees the activities oftelecommunications companies.
Under current regulations set by the FCC, you are required to pay, for the next year only,a tax to the government of $200 million. The $200 million tax will be transferred toLDCo, a long distance company. After next year, the tax will end.
The Board and CEO have come to you and are asking you to eliminate that tax. Studieshave shown that this reduction in tax will have NO impact on the volume of calls or theprices which are charged by you or the long distance companies. It only impacts theamount of the transfer. So if the tax is eliminated, you, as Telco, will earn an additional$200 million next year.
In this question, your sole means to influence the FCC is to lobby (or persuade) the FCCto lower the tax. For every $1 million you spend, there is a 2% increase in the probability(to a maximum of 100%) that the FCC will vote in your favor and eliminate the tax. So,for example, if you spend $10 million, there is a 20% chance the FCC will vote for notax, and an 80% chance the FCC will keep the $200 million tax.
Unfortunately, in this question only, you are not alone. LDCo is also lobbying. The FCCdecision will be determined based on the net amount spent on lobbying. In particular, theprobability the FCC will vote to eliminate the tax will increase by 2% for every $1million more that Telco spends than LDCo (to a maximum of 100%). If the net amount iszero or negative then the FCC will not change the tax. So for example, if LDCo spends$100 million on lobbying and Telco spends $125 million then the probability that theFCC will rule to eliminate the tax will be 50% (i.e. $125 million spent by Telco - $100million spent by LDCo = $25 million x 2% = 50% chance the FCC will rule to eliminatethe tax).
In this question, there are no other avenues of appeal of an FCC decision. The FCCdecision is final.
[The questions appear on the next page.]
A. If LDCo has spent $50 million on lobbying, how much will you as Telco spend onlobbying?
PUT YOUR ANSWER HERE: ____________________
B. If LDCo has spent $100 million on lobbying, how much will you as Telco spend onlobbying?
PUT YOU ANSWER HERE: ____________________
C. If you do not know how much LDCo has spent on lobbying, how much would youexpect them to spend, assuming they spend money first, and they know Telco receives a2% higher probability of winning for every million dollars more Telco spends than LDCospends?
PUT YOUR ANSWER HERE: LDCo:____________
How much would you as Telco spend on lobbying, given LDCo has already spent theamount you have calculated above?
PUT YOUR ANSWER HERE: Telco:______________

Note: Boxed part of question is identical across all questions.
Q5. You are the Chief Operating Officer of Telco, Inc., a very large telecommunicationscompany. Many of your activities are regulated by the Federal CommunicationsCommission (FCC), a government commission that oversees the activities oftelecommunications companies.
Under current regulations set by the FCC, you are required to pay, for the next year only,a tax to the government of $200 million. The $200 million tax will be transferred toLDCo, a long distance company. After next year, the tax will end.
The Board and CEO have come to you and are asking you to eliminate that tax. Studieshave shown that this reduction in tax will have NO impact on the volume of calls or theprices which are charged by you or the long distance companies. It only impacts theamount of the transfer. So if the tax is eliminated, you, as Telco, will earn an additional$200 million next year.
In this question, your sole means to influence the FCC is to lobby (or persuade) the FCCto lower the tax. For every $1 million you spend, there is a 2% increase in the probability(to a maximum of 100%) that the FCC will vote in your favor and eliminate the tax. So,for example, if you spend $10 million, there is a 20% chance the FCC will vote for notax, and an 80% chance the FCC will keep the $200 million tax.
Unfortunately, in this question only, you are not alone. LDCo is also lobbying. The FCCdecision will be determined based on the net amount spent on lobbying. In particular, theprobability the FCC will vote to eliminate the tax will increase by 2% for every $1million more that Telco spends than LDCo (to a maximum of 100%). If the net amount iszero or negative then the FCC will not change the tax. So for example, if LDCo spends$100 million on lobbying and Telco spends $125 million then the probability that theFCC will rule to eliminate the tax will be 50% (i.e. $125 million spent by Telco - $100million spent by LDCo = $25 million x 2% = 50% chance the FCC will rule to eliminatethe tax).
In this question, there are no other avenues of appeal of an FCC decision. The FCCdecision is final.
[The questions appear on the next page.]
A. If LDCo has spent $50 million on lobbying, how much will you as Telco spend onlobbying?
PUT YOUR ANSWER HERE: ____________________
B. If LDCo has spent $100 million on lobbying, how much will you as Telco spend onlobbying?
PUT YOU ANSWER HERE: ____________________
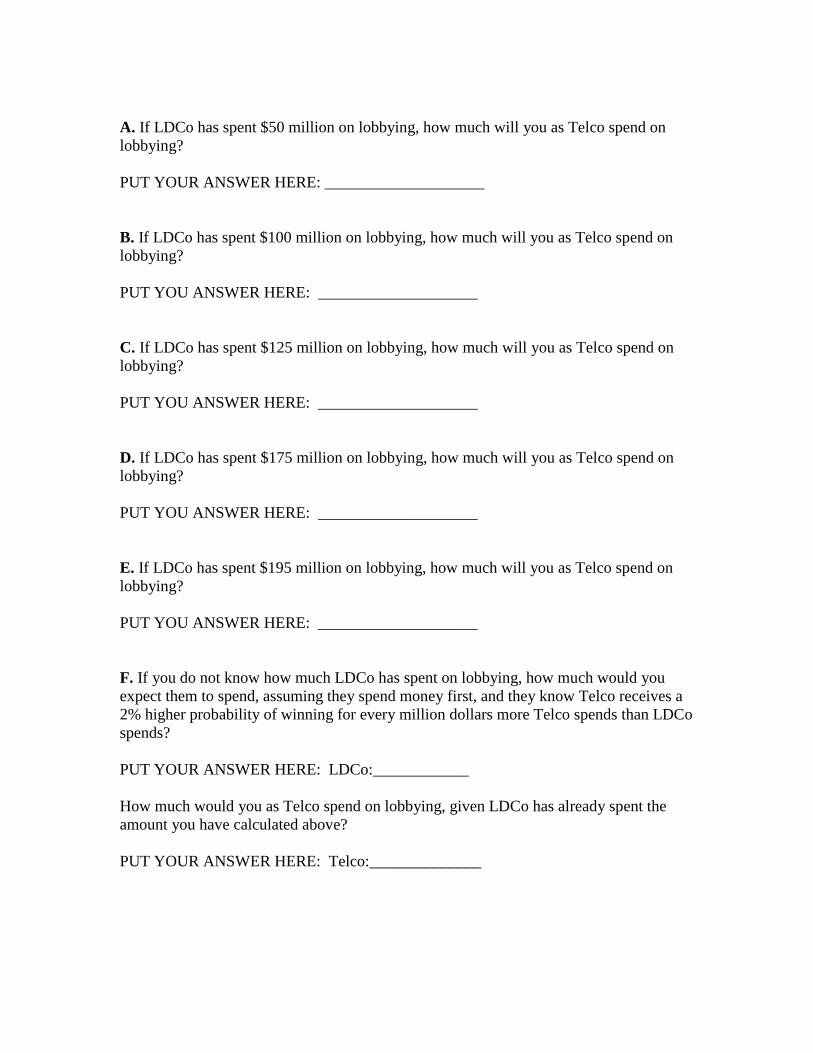
C. If LDCo has spent $125 million on lobbying, how much will you as Telco spend onlobbying?
PUT YOU ANSWER HERE: ____________________
D. If LDCo has spent $175 million on lobbying, how much will you as Telco spend onlobbying?
PUT YOU ANSWER HERE: ____________________
E. If LDCo has spent $195 million on lobbying, how much will you as Telco spend onlobbying?
PUT YOU ANSWER HERE: ____________________
F. If you do not know how much LDCo has spent on lobbying, how much would youexpect them to spend, assuming they spend money first, and they know Telco receives a2% higher probability of winning for every million dollars more Telco spends than LDCospends?
PUT YOUR ANSWER HERE: LDCo:____________
How much would you as Telco spend on lobbying, given LDCo has already spent theamount you have calculated above?
PUT YOUR ANSWER HERE: Telco:______________


![Chapter 3 Managerial Decision Making[1]](https://img.pdfslide.us/doc/110x75/547f0d63b47959a2508b4d46/chapter-3-managerial-decision-making1.jpg)