Embed Size (px)
Citation preview

MAKERERE UNIVERSITY BUSINESS SCHOOL
INSTITUTIONAL LOGICS, RISK ATTITUDE, RISK MANAGEMENT AND PERFORMANCE OF
UGANDA REVENUE AUTHORITY E-TAX PROJECT
By
NULIAT NATUKUNDA
2015/HD10/2098U
A DISSERTATION SUBMITTED TO FACULTY OF GRADUATE STUDIES AND RESEARCH IN
PARTIAL FULFILLMENT OF THE REQUIREMENTS FOR THE AWARD OF THE DEGREE OF
MASTER OF BUSINESS ADMINISTRATION OF MAKERERE UNIVERSITY
PLAN A
SEPTEMBER 2018

i

ii

iii
DEDICATION
This piece of work is dedicated to the Almighty God, who always opens opportunities for me; my
mother, brothers, sisters and my lovely son Adam, thanks for your support. May Allah reward you
abundantly

iv
ACKNOWLEDGEMENT
I wish to greatly thank my supervisors, Mr. Freddie Mawanga and Prof. Joseph Ntayi their time to ensure
that this work is completed on time. I would like to deeply thank all my lecturers at Makerere University
Business School who adequately guided and equipped me with the necessary knowledge and skills. I
would also like to acknowledge the contribution made by my classmates on the Masters of Business
Administration program from whose contributions I have been able to complete the program. My
appreciation also goes to my respondents, research assistants and those who have done the secretarial
services, for their work, the external outlook of this work displays your magnificent design. Finally, I
owe a lot to my entire family, whom I persistently inconvenienced. May the almighty God reward you all
according to His treasures and riches.
Thank you all.

v
ABBREVIATION/ACRONYMS
URA - Revenue Authority
TIN - Tax Identification Number
IT - Information Technology
ICT - Information Communication Technology
CVI - Content Validity Index
SPSS - Statistical Package for Social Scientists

vi
TABLE OF CONTENTS
DECLARATION ................................................................................................. Error! Bookmark not defined.
APPROVAL ........................................................................................................ Error! Bookmark not defined.
DEDICATION ...................................................................................................................................................... iii
ACKNOWLEDGEMENT ................................................................................................................................... iv
ABBREVIATION/ACRONYMS ........................................................................................................................... v
LIST OF TABLES ............................................................................................................................................... ix
ABSTRACT .......................................................................................................................................................... x
CHAPTER ONE ................................................................................................................................................. 1
INTRODUCTION ................................................................................................................................................ 1
1.1 Background to the Study ............................................................................................................................... 1
1.2 Statement of the Problem ........................................................................................................................... 4
1.3 Purpose of the Study ................................................................................................................................... 5
1.4 Objectives of the Study ............................................................................................................................... 5
1.5 Research Questions .................................................................................................................................... 5
1.6 Scope of the Study ...................................................................................................................................... 6
1.6.1 Subject Scope ................................................................................................................................................ 6
1.6.2 Geographical Scope ...................................................................................................................................... 6
1.6.3 Time Scope ................................................................................................................................................... 6
1.7 Significance of the Study ........................................................................................................................... 7
1.8 Conceptual Framework .............................................................................................................................. 7
CHAPTER TWO .............................................................................................................................................. 10
LITERATURE REVIEW ............................................................................................................................... 10
2.0 Introduction ................................................................................................................................................. 10
2.1 Institutional Logics ................................................................................................................................... 10
2.2 Institutional Logics and Project Performance ....................................................................................... 11
2.3 Risk Management and Project Performance.......................................................................................... 13
2.4 Risk Attitude and Project Performance .................................................................................................. 15
2.5 Institutional Logics and Risk Management ........................................................................................... 17
2.6 Risk Attitude and Risk Management ...................................................................................................... 18
2.7 Theoretical Framework ............................................................................................................................ 21
2.7.1 The Theory of Institutional Logics ......................................................................................................... 21

vii
CHAPTER THREE ............................................................................................................................................ 22
METHODOLOGY ............................................................................................................................................. 22
3.0 Introduction ............................................................................................................................................... 22
3.1 Research Design ....................................................................................................................................... 22
3.2 Study Population ....................................................................................................................................... 22
3.3 Sample Size ............................................................................................................................................... 23
3.4 Sampling Design and Procedure ............................................................................................................. 23
3.5 Data Sources and Data Collection Instrument ....................................................................................... 24
3.6 Measurements of the Research Variables .............................................................................................. 25
3.7 Validity and Reliability of Research Instruments ................................................................................. 26
3.7.1 Validity and Reliability for Qualitative Data .............................................................................................. 26
3.7.2 Validity and Reliability for Quantitative Data ............................................................................................ 26
3.8 Data Processing and Analysis ................................................................................................................. 28
3.9 Ethical Considerations ............................................................................................................................... 28
CHAPTER FOUR............................................................................................................................................... 30
PRESENTATION AND INTERPRETATION OF FINDINGS ..................................................................... 30
4.1 Introduction ............................................................................................................................................... 30
4.2 Response Rate ............................................................................................................................................ 30
4.3 Sample Characteristics .............................................................................................................................. 30
4.4.1 Descriptive Characteristics for Respondents .......................................................................................... 31
4.4.2 URA Transaction Particulars ...................................................................................................................... 32
4.4.3 Tax Payer Firm Attributes .......................................................................................................................... 34
4.5 The Relationship between the Study Variables ...................................................................................... 35
4.5.1 Institutional Logics and Project Performance ............................................................................................. 36
4.5.2 Risk Management and Project Performance ............................................................................................... 37
4.5.3 Risk Attitude and Project Performance ....................................................................................................... 38
4.7 Summary of the Chapter ........................................................................................................................... 43
CHAPTER FIVE .............................................................................................................................................. 44
DISCUSSION, CONCLUSION AND RECOMMENDATIONS .............................................................. 44
5.1 Introduction ................................................................................................................................................ 44
5.2 Summary of the Findings .......................................................................................................................... 44

viii
5.3 Discussion of the Findings....................................................................................................................... 45
5.3.1 Institutional Logics and Project Performance ....................................................................................... 45
5.3.2 Risk Attitude and Project Performance .................................................................................................... 45
5.3.3 Risk Management and Project Performance.......................................................................................... 46
5.4 Conclusions ................................................................................................................................................ 47
5.5 Recommendations ..................................................................................................................................... 47
5.6 Limitations of the Study ............................................................................................................................ 50
5.7 Areas for further study .............................................................................................................................. 51
APPENDIX I ....................................................................................................................................................... 55
APPENDIX II ...................................................................................................................................................... 56

ix
LIST OF TABLES
Table 3.1: Sample Size and Sampling Technique ............................................................................................. 23
Table 3.2: Reliability and Validity Tests ...................................................................................................... 27
Table 4.1: Descriptive Characteristics for Respondents .................................................................................. 31
Table 4.2: URA Transaction Particulars ............................................................................................................... 33
Table 4.3: URA Tax Payer Firm Attributes .......................................................................................................... 34
Table 4.4: Pearson Correlations for the Study Variables ...................................................................................... 36
Table 4.5: Prediction Model for the Study Variables ....................................................................................... 42

x
ABSTRACT
The study examined the relationship between institutional logics, risk attitude, risk management and
project performance of the e-tax project in URA. In order to achieve this goal, the following objectives
were developed; to examine the relationship between institutional logics and project performance;
establish the relationship between risk management and project performance; assess the relationship
between risk attitude and project performance; and examine is the mediation effect of risk management
on institutional logics and project performance. The study undertook a case study design with a
population of 700 respondents from which a sample of 310 was selected for the study. Self-administered
questionnaires were used to collect responses. Measurement of the relationships of the study between
institutional logics, risk attitude, risk management and project performance was done and subjected to
rigorous data processing and analysis using the relevant statistical computer software packages. From the
findings, the relationships between institutional logics, risk attitude, risk management and project
performance were found to be positive and significant. Results from regression analysis showed
institutional logics, risk attitude and risk management were significant predictors of project performance.
The study recommends therefore, that since the model could only explain 54.2% in variance of project
performance in URA, a study be carried out comprising of other factors which were not part of the
model. Likewise, to study the true nature and quality of logics, risk attitude, risk management and project
performance, a longitudinal study is more appropriate.

1
CHAPTER ONE
INTRODUCTION
1.1 Background to the Study
Success in public project is indicated by its performance in the achievement of project time, cost,
scope and service quality objectives (Zhou, Zhang and Wang, 2007). Cost and schedule
performance are the primary measures of a project’s success. Project performance is an
important factor for organizational success and the ultimate goal of project performance can be
achieved through cost reduction, timeliness and value for money. Ahsan and Gunawan (2010)
point out that institutional logics can help enhance project performance of an organization.
Through institutional logics, managers are able to implement matters profitably and efficiently
and also avoid risk that may fall on an organisation (Chapman and Ward, 2007). However,
Kumar, Mukerji, Irfan and Ajax (2007) advance that as a result of lapses in institutional logics
and risk management, many organisations continue to exhibit poor project performance.
Therefore, lapses in institutional logics impede on the project performance of an organisation.
Public projects comprise of phases and each phase has its own typical risks. Risk management is
recognised as an essential contributor to project success, since it focuses on addressing
uncertainties in a proactive manner in order to minimise threats, maximise opportunities, and
optimise achievement of objectives (Ahsan and Gunawan, 2010). Therefore, risk analysis and
management continue to be a major feature of project management in an attempt to deal
effectively with uncertainty and unexpected events and to achieve project performance. The
ability to govern or to set up control mechanisms for costs, schedule and quality in a public
project reduces rapidly (Wallace and Blumkin, 2007). Zhou, Zhang and Wang (2007) aver that it

2
is inherent in the nature of risk management for it to be exposed to sources of explicit and
implicit bias, since all elements of the risk process are performed by individuals and groups of
people whose risk attitudes affect every aspect of risk management and in turn project
performance.
Risk attitudes exist at individual and group levels, and these can be assessed and described with
some degree of accuracy (Chapman and Ward, 2007). Sources of bias can also be diagnosed,
exposing their influence on project performance. Where the risk attitude adopted is not
conducive to effective project performance, action is required to modify attitude. On the other
hand, the establishment or improvement of systems for information gathering require careful
planning to ensure that project implementation proceeds in comprehensive, cost-effective and
timely ways asserts Ahsan and Gunawan (2010). This involves a range of tasks that can be
encompassed within a project cycle framework from identification and analysis of needs,
through project formulation and budgeting, to system design, implementation, monitoring and
appraisal. Identification and analysis of needs is a crucial phase of the project cycle.
Infrastructure requirements, mainly policy, legal and institutional frameworks are often not given
enough emphasis.
Kumar, Mukerji, Irfan and Ajax (2007) used the e-government adoption model to explain e-
government adoption which in the case of the study is the e-tax system. Kumar, Mukerji, Irfan
and Ajax (2007) proposed that user characteristics such as perceived risk, perceived control,
internet, satisfaction and website design (perceived usefulness and perceived ease of use) are
considered to have a direct influence on e-government adoption thus e-tax system, while service
quality affects citizen satisfaction and in turn leads to recurring use of e-government services and

3
contributes to adoption of the e-tax system. The model is premised on the belief that e-
government adoption is largely shaped by the extent to which the government can provide a rich,
engaging and hassle-free experience that is reliable and can provide higher levels of satisfaction.
In Uganda, the Revenue Authority (URA) has boosted its tax collections by running an
integrated tax administration system called e-tax that offers 24-hour online services to taxpayers.
However, despite the efforts by URA, the e-tax project runs a high risk poor performance by
being a limitation to large companies, system failures, little backup user support for customers,
insufficient taxpayer sensitization/awareness, lack of user training, negative attitudes to the
system, difficult to use and high internet costs (Mukesh, 2011). According to Focus on Uganda
(2009), the e-tax system offers benefits both to the service provider (URA) and the consumers
like the filing of tax returns in minutes compared to the old manual one that took up to two days,
cost-free transaction, and less time spent on getting a Tax Identification Number (TIN) posits
Johanna (2011).
The Uganda Radio Network (2010) points out that the e-tax system is prone to system failures,
has little back up support for customers, low IT penetration in the country, insufficient taxpayer
sensitization for the online taxation system, the system is in some cases too slow and time-
wasting, little user support especially during the busy dates of return filing and lack of user
training on its use (Lumu, 2011). Taxpayers also cite issues of the system being complicated,
difficult to use, lack of feedback, high internet costs coupled with an internet dial-up system that
slows communication with URA (Kabafunzaki, 2010). Taxpayers also cite the insistence by
URA for customers to provide manually printed back up returns as a disincentive for the
adoption of the online e-ax system asserts Magumba (2011). While some degree of poor cost and
4
time schedule performance is inevitable in e-tax systems, it is possible to improve institutional
framework, risk attitude and risk management strategies to minimize their negative impact and
thus improve the project performance. Owing to the practical gap highlighted above, it is
suspected that inadequate institutional logics, poor risk attitude and discrepancies in risk
management could be the cause of the soaring problem of project performance at URA.
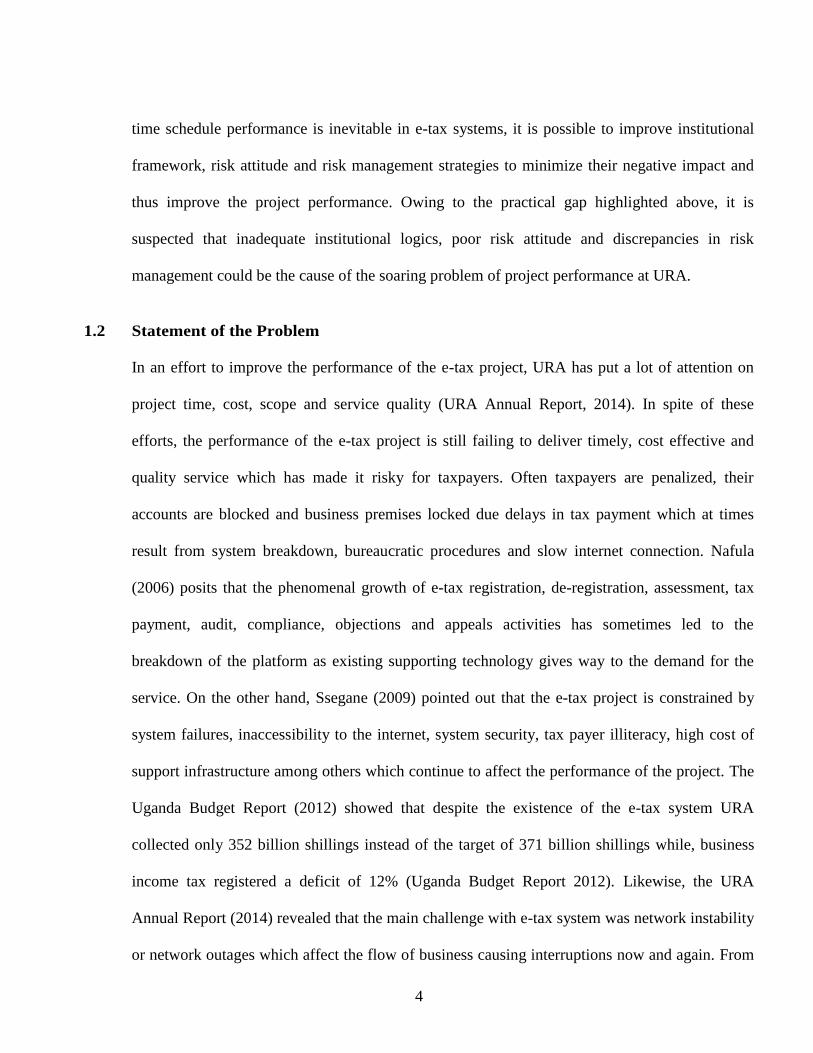
1.2 Statement of the Problem
In an effort to improve the performance of the e-tax project, URA has put a lot of attention on
project time, cost, scope and service quality (URA Annual Report, 2014). In spite of these
efforts, the performance of the e-tax project is still failing to deliver timely, cost effective and
quality service which has made it risky for taxpayers. Often taxpayers are penalized, their
accounts are blocked and business premises locked due delays in tax payment which at times
result from system breakdown, bureaucratic procedures and slow internet connection. Nafula
(2006) posits that the phenomenal growth of e-tax registration, de-registration, assessment, tax
payment, audit, compliance, objections and appeals activities has sometimes led to the
breakdown of the platform as existing supporting technology gives way to the demand for the
service. On the other hand, Ssegane (2009) pointed out that the e-tax project is constrained by
system failures, inaccessibility to the internet, system security, tax payer illiteracy, high cost of
support infrastructure among others which continue to affect the performance of the project. The
Uganda Budget Report (2012) showed that despite the existence of the e-tax system URA
collected only 352 billion shillings instead of the target of 371 billion shillings while, business
income tax registered a deficit of 12% (Uganda Budget Report 2012). Likewise, the URA
Annual Report (2014) revealed that the main challenge with e-tax system was network instability
or network outages which affect the flow of business causing interruptions now and again. From

5
the available evidence above, the undependable risk management, unfavorable risk attitudes and
lapses in institutional logics may explain the poor performance of the e-tax project. Where, if
risk management, risk attitude and institutional logics challenges remain unchecked, URA’s e-
tax project performance could continue to be affected.
1.3 Purpose of the Study
The study examined the relationship between institutional logics, risk attitude, risk management
and project performance in Uganda Revenue Authority e-tax project.
1.4 Objectives of the Study
i) To examine the relationship between institutional logics and project performance in URA
e-tax project.
ii) To establish the relationship between risk management and project performance in URA
e-tax project.
iii) To assess the relationship between risk attitude and project performance in URA e-tax
project.
iv) To examine the mediating effect of risk management in the relationship between
institutional logics and project performance in URA e-tax project.
1.5 Research Questions
i) What is the relationship between institutional logics and project performance in URA e-
tax project?
ii) What is the relationship between risk management and project performance in URA e-tax
project?
iii) What is the relationship between risk attitude and project performance in URA e-tax
6
project?
iv) What is the mediation effect of risk management in the relationship institutional logics
and project performance in URA e-tax project?
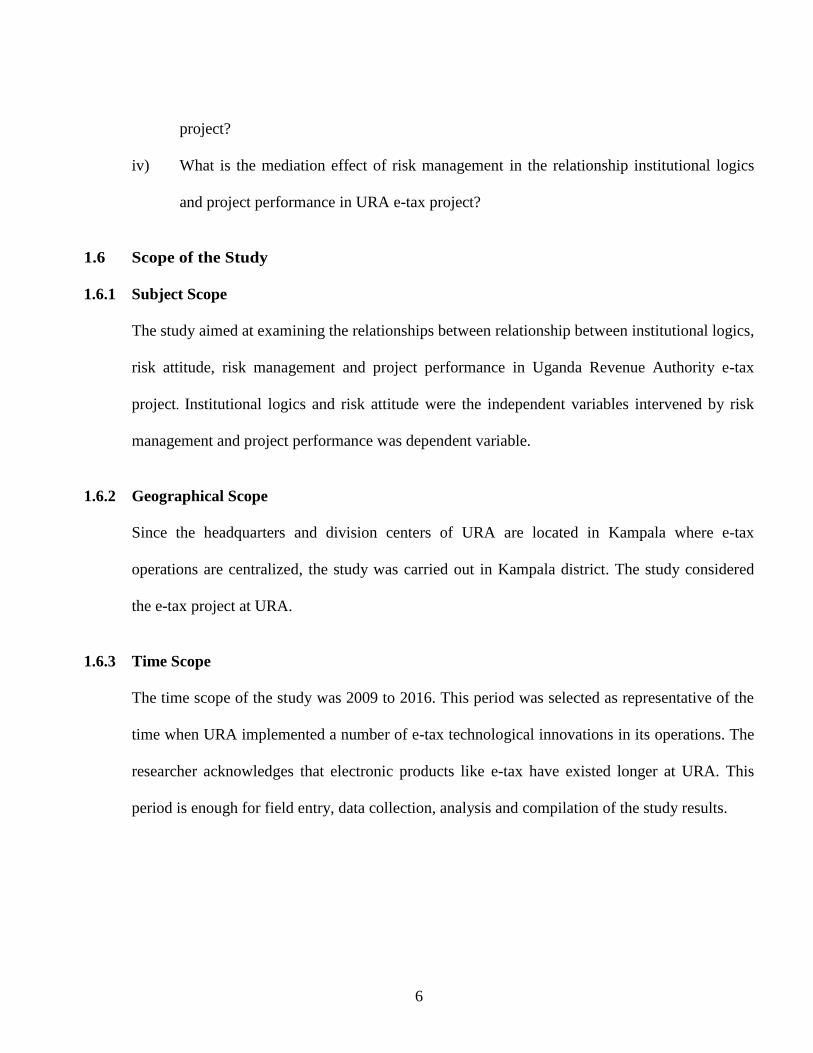
1.6 Scope of the Study
1.6.1 Subject Scope
The study aimed at examining the relationships between relationship between institutional logics,
risk attitude, risk management and project performance in Uganda Revenue Authority e-tax
project. Institutional logics and risk attitude were the independent variables intervened by risk
management and project performance was dependent variable.
1.6.2 Geographical Scope
Since the headquarters and division centers of URA are located in Kampala where e-tax
operations are centralized, the study was carried out in Kampala district. The study considered
the e-tax project at URA.
1.6.3 Time Scope
The time scope of the study was 2009 to 2016. This period was selected as representative of the
time when URA implemented a number of e-tax technological innovations in its operations. The
researcher acknowledges that electronic products like e-tax have existed longer at URA. This
period is enough for field entry, data collection, analysis and compilation of the study results.

7
1.7 Significance of the Study
The results of the study may help the key players in URA in Uganda realize the effect of
institutional logics, risk attitude and risk management on the performance of the e-tax project so
as to develop the necessary strategies to strengthen the project performance of the e-tax project.
The study may contribute and add useful information to already existing literature with regard to
institutional logics, risk attitude, risk management and project performance with a specific
context of Uganda. The findings of the study may contribute and also add useful information to
that which already exists in regard to determinants of project performance in e-tax project at
URA.
The policy makers such as the Parliament, Ministry of ICT and Ministry of Finance may use the
findings and recommendations of the study in the development and strengthening of the existing
policies and regulations in the tax sector. So as to promote better project management strategies
that are critical for improved project performance of the e-tax project.
1.8 Conceptual Framework
The framework as depicted in figure 1 shows the relationship between institutional logics, risk
attitude, risk management and project performance. Likewise, Nafula (2006) posits that there are
significant relationships between institutional logics, risk attitude, risk management and project
performance. Therefore, the study attempted to establish the relationship institutional logics, risk
attitude, risk management and project performance.
8
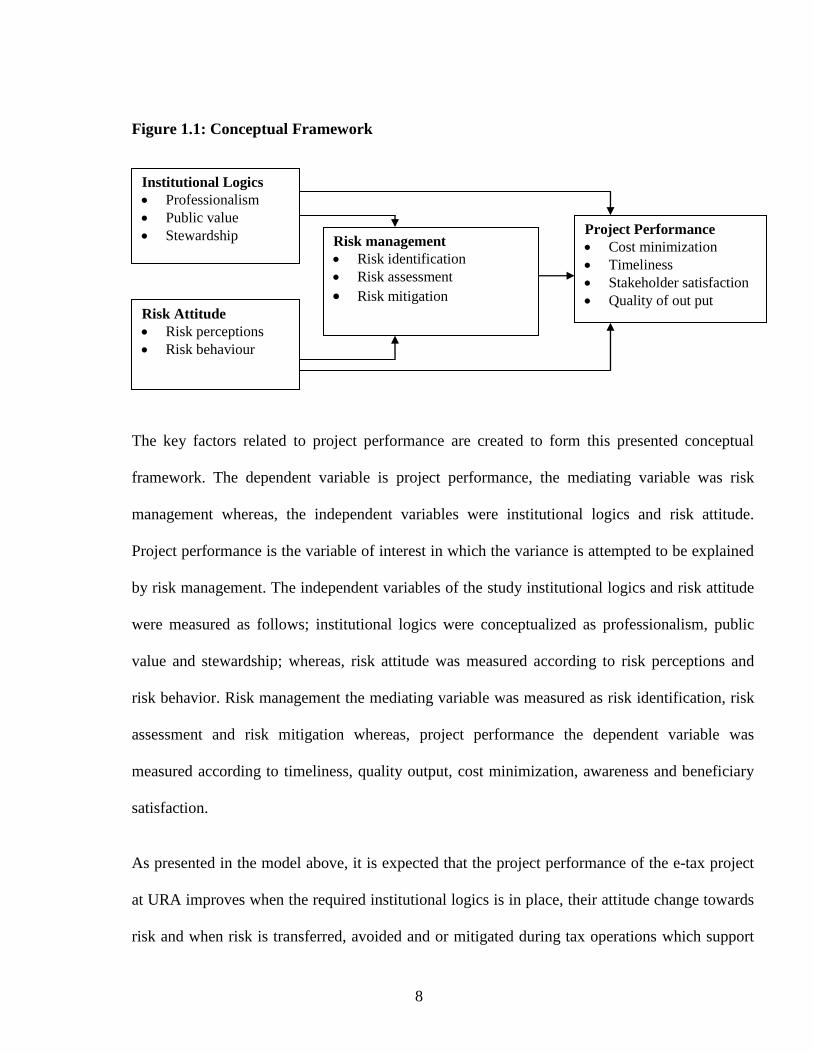
Figure 1.1: Conceptual Framework
The key factors related to project performance are created to form this presented conceptual
framework. The dependent variable is project performance, the mediating variable was risk
management whereas, the independent variables were institutional logics and risk attitude.
Project performance is the variable of interest in which the variance is attempted to be explained
by risk management. The independent variables of the study institutional logics and risk attitude
were measured as follows; institutional logics were conceptualized as professionalism, public
value and stewardship; whereas, risk attitude was measured according to risk perceptions and
risk behavior. Risk management the mediating variable was measured as risk identification, risk
assessment and risk mitigation whereas, project performance the dependent variable was
measured according to timeliness, quality output, cost minimization, awareness and beneficiary
satisfaction.
As presented in the model above, it is expected that the project performance of the e-tax project
at URA improves when the required institutional logics is in place, their attitude change towards
risk and when risk is transferred, avoided and or mitigated during tax operations which support
Project Performance
Cost minimization
Timeliness
Stakeholder satisfaction
Quality of out put
Risk Attitude
Risk perceptions
Risk behaviour
Risk management
Risk identification
Risk assessment
Risk mitigation
Institutional Logics
Professionalism
Public value
Stewardship

9
an effectively functional risk management system. Whereby, absence of institutional logics, risk
attitude and risk management at URA may result into poor performance of the e-tax project. It
can be deduced that institutional logics, risk attitude and risk management support sustainable
project performance in tax bodies.

10
CHAPTER TWO
LITERATURE REVIEW
2.0 Introduction
This chapter reviews the relevant literature to understand the above developed conceptual
framework and deeper concepts highlighted in chapter one above. The chapter consists of three
parts including introduction. Given that the area of inquiry of this research is cross- disciplinary
the literature from each area is initially considered independently, prior to developing a
conceptual framework for the research, it also includes a segment discussing institutional logics,
risk attitude and risk management and their importance to project performance from a strategic
perspective. Under this chapter, literature was reviewed in accordance with the study objectives
which include; the relationship between institutional logics and project performance; establish
the relationship between risk management and project performance; assess the relationship
between risk attitude and project performance; examine is the mediation effect of risk
management on institutional logics and project performance; and establish is the mediation effect
of risk management on risk attitude and project performance.
2.1 Institutional Logics
Meyer and Hammerschmid (2006) referred to institutional logics as a set of material practices
and symbolic constructions [that] constitute organizing principles for institutions or supra-
organizational patterns of human activity. Institutional logics are systems of cultural elements
(values, beliefs, and normative expectations) by which people, groups, and organizations make
sense of and evaluate their everyday activities, and organize those activities in time and space.
Institutional logics are systems of cultural elements: systems because their elements are

11
connected in a coherent and discernable pattern, cultural because they include values, beliefs,
and normative expectations (Kelman, 2006). Individuals, groups and entire organizations use
institutional logics to make sense of and evaluate their everyday activities. Beyond sense-making
and evaluation, institutional logics are used by individuals, groups, and entire organizations
to order their activities in time and space. This encompasses creating, maintaining, evaluating,
and adjusting formal organizational structures, procedures,
informal cultures and power distributions. Institutional logics are socially constructed (Thornton
and Ocasio, 2008). This means, for instance, that judging the worth of something is a social
process while we do it, we reflect on the judgments that others have made of the same or similar
types of things. The exteriority and objectivity of institutional logics is what makes
them institutional. Finally, institutional logics are historically contingent. This means they vary
over time and across space, depending on the distribution of power among social actors, extant
cultural or material technologies, and the objectives of social actors (Kelman, 2006).
2.2 Institutional Logics and Project Performance
A mechanism by which institutional logics exert their effects on individuals and organizations is
when they identify with the collective identities of an institutionalized group, organization,
profession, industry or population. A collective identity is the cognitive, normative, and
emotional connection experienced by members of a social group because of their perceived
common status with other members of the social group (Meyer and Hammerschmid, 2006).
Collective identities emerge out of social interactions and communications between members of
the social group. As individuals identify with the collective identity of the social groups they
belong to they are likely to cooperate with the social group, abide by its norms and prescriptions
(Kelman, 2006), and seek to protect the interests of the collective and its members against

12
contending identities. Individuals are members of multiple social groups with a collective
identity, including professions and occupations, gender, racial and ethnic groups, social
movements, and individual organizations. Collective identities also emerge among populations
of organizational forms, market competitors and industry associations.
As collective identities become institutionalized, they develop their own distinct institutional
logic and these logics prevail within the social group. These effects of institutional logics are
emphasized, among others, in the work of Haveman and Rao (1997), on the theory of moral
sentiments embodied in the collective identities of organizational forms; in Thornton and Ocasio
(1999)’s shift from an editorial logic to a market logic in the collective identity of competitors in
the higher education publishing market; in Jones and Livne Tarandach’s (Forthcoming)
rhetorical strategies of architects based in the institutional logics of business, profession, and
state that focus attention on distinct competencies servicing clients, building great architecture,
or managing facilities, and in Lounsbury’s (2002) analysis of collective identities embodied in
professional associations in the field of finance. In all of these cases, albeit at different levels of
analysis, identification with the respective institutional logics occurs directly, as the
identification with the collective is equivalent to the identification with the institutional logic
prevailing in the collective, whether they are organizational forms, market competitors, or
professional associations, or any other social grouping (Thornton and Ocasio, 2008).
As observed from the assertions of the studies above, at URA, institutional logics has been
adopted to promote project success and efforts by management are still underway to ensure that
institutional logics is implemented adequately. Although, a lot has been done to ensure that the e-
tax system operates more effectively, the agency continues to face project success challenges. To

13
this end, URA has not realized the tangible benefits of institutional logics as a growth strategy.
From the literature on institutional logics much of it is centered on its influence of profitability,
project success among others and not providing adequate literature on how institutional logics
affects project performance of public projects in developing countries. For this reason, the study
focused on establishing the relationship between institutional logics on project performance in
public organisations such as URA so as to close the literature gap that is existing on the subject.
2.3 Risk Management and Project Performance
Risk management is the activity, which comes under project management, and now a day it is
gaining importance due to globalization and increased competition. According to Nocco and
Stulz (2006), risk management has grasped a new variety of multiple risks and risk measures
over the last ten years. Therefore, how to deal with risks and how to understand their nature
became the companies’ first priority. Aabo, et. al., (2005) postulate that it became evident that
risk was considered as one of the primary threats that, if dealt properly, could turn out into an
opportunity. Raz, et. al., (2002) found that risk management is still at its infancy and risk
management practices are used more when the level of risk in project is high and the usage of
these practices were only to meet time and budget goals.
The risk management process consists of a series of steps, which are establishing the context,
identifying, analyzing, assessing, treating, monitoring and communicating risks, which allow
continuous improvement of decision-making (Standards Australia, 1999). Stoddard (2004)
concluded risk management as a daunting task for organizations and it could be made successful
by motivating the individuals. Organizations that implement effective risk management become
successful while others not practicing this activity proved to be unsuccessful. Risk management

14
is an activity within project management that is gaining importance because organisations are
moving towards globalization and because of the increasing competition (Ahmed, et. al., 2007).
Detailed techniques for the above-mentioned steps were presented and it was proposed that
integration of these would result in effective project management (Ahmed, et. al., 2007). By
implementing risk, management organization can reduce unexpected and costly surprises and
effective allocation of resources could be more effective. It improves communication and
provides senior management a concise summary of threats, which can be faced by the
organization, thus ultimately helping them in better decision making. Throughout the world,
administration of risk is something that is more often linked to the building of bridges,
mechanical, engineering, and in the disaster management context. The project based
organizations or other business organizations are not really taking steps to implement risk
management.
Much as the idea of risk management has been extensively studied in the private sector such as
the financial sector, little attention has been focused on the public sector. Similarly, much of the
existing literature focuses on risk management and financial performance causing gaps in the
literature on risk management and project performance in the public sector and more especially
in developing countries where the structures of risk management are still under developed to
support public project success. The little or no decentralized systems in these organisations is the
major challenge affecting risk management and has in turn affected project success. This
explains why at URA there are still e-tax project challenges. This literature deficiency provides a
research gap which will be bridged by this study.

15
2.4 Risk Attitude and Project Performance
A range of possible attitudes can be adopted towards the same situation, and these result in
differing behaviours, which lead to consequences, both intended and unintended. Indeed
behaviour is the only reliable diagnostic indicator of inner attitude, and considerable attention
has therefore been paid to behavioural psychology and management by those seeking to
understand and manage the effects of human factors in business (Hillson and Murray-Webster,
2004). Although attitude manifests itself through behaviour, there are other drivers of behaviour
which can displace the chosen or preferred attitude. The extent to which this occurs depends on
the perception of the situation towards which the attitude is being directed. This is best
understood by considering the two extremes, where the situation is perceived as good or neutral,
and where it is seen as bad. When a situation or environment is perceived as positive or benign,
behaviour is driven largely by attitude. In this case the attitudinal choice of the individual or
group is the key determinant of behaviour. This choice is not mandated by the situation, and the
organisation is free to select its preferred response (Kargi, 2011).
People who adopt this attitude consistently may be labeled as optimists, since they tend to view
all situations as equally positive. This helps such people to retain control of their behaviour since
the key driver when the environment is positive is the chosen attitude, allowing a proactive
response to the prevailing situation. When an individual or group perceives a situation or
environment as negative, the resulting behaviour is largely determined by a direct response to the
situation, and attitude plays a smaller role (Kim and Reinschmidt, 2011a). Indeed a negative
situation may force behaviour which is contrary to that preferred by attitude, leading to a more
reactive stance. Individuals who regularly adopt reactive behaviour driven by a perception that
the environment is negative may be termed pessimists, and in extreme cases this may even lead

16
to paranoia (Hyung, 2009). And since attitude drives behaviour, different people will exhibit
different responses to the same situation, as a result of their differing underlying risk attitudes a
situation regarded as too risky by one person will be seen as acceptable by another (George,
2009).
While most project managers actively accept negative risks, hardly do they accept actively
positive risks. This peculiar attitude of most project managers indirectly implies that as human
beings, most of us are basically risk-averse in risk appetite. In project risk management, most of
a project managers' work time goes in mitigating negative risks rather than exploiting or
enhancing opportunities (Hillson and Murray-Webster, 2004). Risk attitude of project managers
and the enterprises they work for might have played significant role in how the project risks were
managed by these project managers. The risk attitude of a person or organization is influenced by
three major factors that include risk appetite, risk tolerance and risk threshold (George, 2009).
Organizations perceive risk as the effect of uncertainty on projects and organizational objectives.
Organizations and stakeholders’ willingness to accept varying degrees of risk depends on their
risk attitude.
As observed from the above reviewed literature, at URA, risk attitude has been adopted to
promote project performance and the management of the institution is focused on ensuring that
risk attitude is adequate during project undertakings. Although, a lot has been done to ensure that
there is adherence to proper procedures of risk management, the agency still experiences project
performance challenges in the e-tax project. To date, URA has not realized the physical benefits
of risk attitude in promoting project performance. From the reviewed literature on risk attitude
much of it is centred on its influence on financial performance and not providing adequate

17
literature on how risk attitude relates to project in public organisations in developing countries.
For this reason, the study focused on establishing the relationship between risk attitude on
project performance of public organisations in developing countries such as URA so as to close
the literature gap that is existing on the subject.
2.5 Institutional Logics and Risk Management
Institutional logics are enacted and can only be observed at individual and organizational levels.
Modal types of symbolically meaningful, material practice, institutional logics are sustained and
transformed through the multiplicity of their tokens (Boltanski, 2011). Several logics may co-
exist within an organisational field. How actors respond to institutional pressures varies and in
this process of struggle and resolution, actors are understood to gain skills and capital for future
institutional involvement (Reay and Hinings, 2005). In the course of such, the meaning and
priority of activities can change given differing logics, with some becoming redundant or
anachronistic, and others lying dormant, to be resurrected at a later time and others surfacing.
Reay and Hinings (2009) suggest distinct logics in a field can play out competitively as actors
seek to champion and assert one set of values over others, or more broadly by Relman (2007),
subversively, or collaboratively.
Reay and Hining's (2009) study examines a case of collaboration, though here in the more
general organizational field health care provision in Alberta, Canada, finding uneasy but
functional truces between logics of professionalism and business. The tension between
managerialism and professionalism has been described in studies describing conflicting
institutional logics with business-focused institutional logics resisted by professionals delivering
front-line services. Hanlon (1998) identifies separate logics associated with professionalism. He

18
distinguishes individualistic professionalism, social service professionalism and commercialized
professionalism, all of which might persist in evolving mutual influence rather than the
obliteration of one by others (Kitchener and Mertz, 2010). Commercialism can also be nuanced,
with some arguing care is a commodity whose price is governed by forces of scarcity and felt
want and patients become active choosers rather than passive recipients.
Like in the private sector, institutional logics are an important part of a risk management
program for public institutions especially such as URA because they permit organizations to
minimize its chances of taking on another entity’s liability unknowingly or from being exposed
to additional liabilities due to the actions of others thus permit the shifting of liability to others.
Much as this has helped transfer risk to some extent, it has also been constrained by the under
development of the public sector in developing countries such as Uganda. From the reviewed
literature there seems to be agreement that institutional logics results into risk management.
Much as a great deal of literature focuses on the financial sector with few studies conducted on
the public sector. This study seeks to bridge the literature gap on the effect of institutional logics
on risk management in the public sector in developing countries such as Uganda.
2.6 Risk Attitude and Risk Management
It is inherent in the nature of risk management for it to be exposed to sources of explicit and
implicit bias, since all elements of the risk process are performed by individuals and groups of
people whose risk attitudes affect every aspect of risk management. Risk attitudes exist at
individual and group levels, and these can be assessed and described with some degree of
accuracy (Kim and Reinschmidt, 2011a). Sources of bias can also be diagnosed, exposing their
influence on the risk process. Where the risk attitude adopted is not conducive to effective risk

19
management, action is required to modify attitude. Hillson and Murray-Webster (2004) indicate
that the attitude of individuals and organisations has a significant influence on whether risk
management delivers what it promises. Risk management is undertaken by people, acting
individually and in various groups. The human element introduces an additional layer of
complexity into the risk process, with a multitude of influences both explicit and covert.
These act as sources of bias, creating preferred risk attitudes which affect every aspect of risk
management. Risk attitudes exist at individual, group, corporate and national levels, and can be
assessed and described with some degree of accuracy. This allows sources of bias to be
diagnosed, exposing their influence on the risk process. Where preferred risk attitude is not
conducive to effective risk management, action is required to modify attitude (Kim and
Reinschmidt, 2011a). It is important firstly to understand risk attitudes and the impact they can
have on the risk management process if their presence and influence are not recognised or
managed. It is also important to understand how development of emotional literacy can provide
practical and powerful tools for modifying risk attitudes. The goal of risk management is not to
eliminate risk, rather to identify, plan for and manage risk (Kargi, 2011). By making
organisational stakeholders aware of risk and partnering with them to control those risks,
managers safeguard organizations and projects and improve their abilities to complete projects
on time, on budget, within scope and meet our stakeholders’ expectations (Hassan, 2009).
The situational influencers of risk attitude described above mainly arise from the perception of
the external environment. There is, however, an internal environment which has an equally
profound effect on the way uncertainty is perceived, and hence is able to influence the preferred
risk attitude of an individual or organisation (Kim and Reinschmidt, 2011b). These underlying

20
psychological influences which affect attitudes towards uncertainty are known as heuristics. In
the context of risk attitudes, heuristics describe attempts by an individual or group to analyze an
uncertain situation and determine the appropriate response by referring to some previous
experience (Wang and Yuan, 2011). This often occurs subconsciously as an integral part of the
assessment of risk, leading to sources of bias when considering a situation where the answer is
unknown or unfamiliar, and where a person is required to make a judgment with insufficient
information.
While public agencies may have a risk profile in place, the level of knowledge and its
enforcement by members of staff at all levels may be lacking substantially thus threatening the
performance of the organization. In public agencies, risk attitude is preferably used in
conjunction with other risk management strategies, since using this risk management method
alone will not totally eliminate the risk and it can affect the organisations’ project performance at
a later stage. In the case of Uganda and more especially public entities, the idea of risk attitude is
practiced as a way of effectively managing operational risk in relation to set organisational
internal controls. However it should also be noted that the reviewed literature draws a lot of
attention on risk attitude and organisational performance of organisations in the private sector
leaving scanty literature on the effect of risk attitude on risk management in the public sector and
more especially URA. This provides a gap in literature which this study intended to bridge so as
to provide information on the effect of risk attitude on risk management in public organisations
such as URA.

21
2.7 Theoretical Framework
2.7.1 The Theory of Institutional Logics
Traditional institutional theory posits that organizations make structural decisions primarily on
the basis of legitimacy considerations rather than on the basis of efficiency considerations.
Meyer and Rowan (1977) comment, incorporating externally legitimated formal structures
increases the commitment of internal participants and external constituents. Traditional
institutional theory however presumes the existence of exogenous standards according to which
legitimacy can be assessed. With the theory of institutional logics, in contrast, what is legitimate
is subject to ongoing challenge and whether one structure is more legitimate than another is
known only as a consequence of an explicit test. The theory of institutional logics represents an
advance to the extent that it addresses two perceived shortcomings of traditional institutional
theory, one of which is the absence of an explanation for change. In traditional theory, the
presumption is that organizations will conform to rationalized myths (Meyer and Rowan, 1977)
in order to obtain legitimacy but no explanation is provided for how and under what
circumstances organizations will depart from legitimated structures. The theory of institutional
logics does accommodate change via the promotion of alternative logics by individual agents.
The emphasis is on cognitive changes rather than on change in the formal structure. The
literature reviewed looked at the empirical facets of institutional logics, risk attitude, risk
management and project performance as well as a discussion of the theoretical view; the theory
of institutional logics. Studies that have been conducted focus on project governance and project
performance, risk management and project performance of organizations and do not focus on
institutional logics, risk attitude, risk management and project performance of e-tax projects,
there is therefore a gap in the empirical evidence and this study seeks to bridge the gap.

22
CHAPTER THREE
METHODOLOGY
3.0 Introduction
This chapter provides the description of how the study was conducted. It brought out the research
design, target population, sampling design and size, data collection instruments, data analysis
and interpretation tools and limitations of the study.
3.1 Research Design
The study adopted a case study research design to help explain the current situation on project
performance and analyze the inherent problem when dealing with quantitative and qualitative
data. A single-case design was adopted because URA is mandated to implement and oversee the
activities of the e-tax project in the country. The design was descriptive and analytical in nature
and adopted both quantitative and qualitative approaches to study the project performance of the
URA e-tax project at a point in time. For qualitative data, the study adopted the field research
method where the researcher went to the field took extensive field notes which were
subsequently coded and analyzed in a variety of ways (Sekeran, 2003).
3.2 Study Population
The population of the study comprised of 9 senior tax officials involved in management of the e-
tax project, 97 operations tax officers working on the e-tax project and 564 compliant e-tax
payers (URA Annual Report, 2014). The research population consisted of URA senior and
operations staff who are involved in the operations of the e-tax system at the head office and the
division centres of URA Kampala district. The compliant e-tax payers included users of the e-tax

23
system who have been using the system to pay taxes for a period exceeding three years. The
three categories of respondents were targeted for the study because they are the stakeholders and
key players in the URA e-tax project. The population of the study was 700. The researcher
believed that when users of the e-tax systems are professional in the way they use the system, the
system is able to offer the public valuable services in regard to tax payment and the users of the
system are responsible in their operations, this would promote project performance of the e-tax
project.
3.3 Sample Size
From the population, a sample size of 310 was determined basing on a table for determining
sample size developed by Krejcie and Morgan (1970). The unit of analysis was the project and
the unit of inquiry was the staff and e-taxpayer. In the table below, the population size and
sample size are further presented.
Table 3.1: Sample Size and Sampling Technique
Source: URA Annual Report (2015).
3.4 Sampling Design and Procedure
According to Sekaran (2003), sampling is the process of choosing the research units of the target
population, which are to be included in the study. This study adopted both probability and non
probability sampling strategies. A probability sampling method is where all elements have an
Category of Respondents Population Sample Size
Senior tax officers 9 9
Operations tax officers 97 76
e-taxpayers 564 225
Total 700 310

24
equal chance of being selected. This entailed simple random sampling. The simple random
sampling method selects a sample without bias from the target/accessible population. The
method was used to select random samples from the operations tax payers and e-taxpayers. This
method was justified for the study because it ensured that all subjects of the sub groups were
given an equal chance of being selected. This minimized bias and simplified analysis of results.
Non-probability sampling is a sampling technique where the samples are gathered in a process
that does not give all the individuals in the population equal chances of being selected. Under
this category, the purposive sampling method was used. This is a method used by the researcher
to decide who to include in the sample based on their relevance. Purposive sampling technique
was used to collect focused information from particular respondent which included senior tax
officials such as the commissioner domestic taxes, assistant commissioners and managers. The
technique was used because the focus of the researcher is to get in-depth information and not
simply making generalizations.
3.5 Data Sources and Data Collection Instrument
Primary data was the main source and included both qualitative and quantitative data. Primary
data was collected from selected respondents at URA. The respondents included tax officers and
e-taxpayers at URA. The tools that the researcher used for collecting data included the following;
self-administered questionnaire and interview guide. To collect qualitative data, an interview
guide was used (Appendix I). The interview guide was used to collect data from key informants
who included the commissioner domestic taxes, assistant commissioners and managers. This
data assisted in clarifying data collected by the structured questionnaires since it involved a face
to face interaction and it also provided a whole range of views.

25
Quantitative data was collected by the use of self administered questionnaire (Appendix II). A
questionnaire is a carefully designed instrument for collection of data in accordance with the
research questions. The justification for using this instrument was that it was less expensive and
did not require the researcher to be present for the respondent to complete. It was used to collect
data from operations tax officers and e-taxpayers, this was because they had a high level of
literacy and able to read, understand and interpret the questions besides possessing the
information required for the research. The interval Likert scale questionnaire was designed on
values assigned and ranked 5 to 1 in order of; 5-Strongly Agree, 4-Agree, 3- Neither Agree nor
Disagree, 2-Disagree and 1-Strongly Disagree.
3.6 Measurements of the Research Variables
Institutional logics was measured according to the scales developed by Haveman and Rao
(1997). They identified professionalism, public value and stewardship as dimensions of
institutional logics. Therefore, their scales were adopted to measure institutional logics and
were anchored on a 5 point Likert scale ranging from 1-strongly disagree to 5-strongly agree.
Risk attitude was measured according to Chapman and Ward (2007), who identified risk
perceptions and risk behaviour as the components that made up risk attitude. The developed
scales were anchored on a 5 point Likert scale ranging from 1-strongly disagree to 5-strongly
agree.
Risk management was measured according to the scales developed by Ahsan and Gunawan
(2010). They identified risk identification, risk assessment and risk mitigation. Therefore,
their scales were adopted to measure risk management strategies and were anchored on a 5
point Likert scale ranging from 1-strongly disagree to 5-strongly agree.
26
Project performance was measured according to the scales developed by Bhagat and Black,
(2002). They identified timeliness, quality output, cost minimization, awareness and
beneficiary satisfaction as dimensions of project performance. Therefore, their scales were
adopted to measure project performance and were anchored on a 5 point Likert scale ranging
from 1-strongly disagree to 5-strongly agree.
3.7 Validity and Reliability of Research Instruments
3.7.1 Validity and Reliability for Qualitative Data
In order to validate qualitative data from the interviews, the researcher adopted appreciative
inquiry. Drawing the questions for the survey directly from the existing literature on the results
of Appreciative Inquiry instilled confidence that the survey was a valid measurement.
Nevertheless, two testing procedures improved the assurance of validity. To determine content
validity, the survey was shared with several experienced Appreciative Inquiry practitioners to
review and comment on the appropriateness of the terminology and the selection of questions
related to the topic of the research. Appreciative Inquiry senior lecturer, author and consultant
Prof. Joseph Ntayi stated that the questions were clear and specific. He also confirmed that the
survey appropriately captured the concepts of Appreciative Inquiry and the outcomes reflected
the strengths, opportunities, aspirations (wishes) and results one hopes to achieve. He also
confirmed that the survey captured the essential outcomes of Appreciative Inquiry.
3.7.2 Validity and Reliability for Quantitative Data
The validity of the study is concerned with the extent to which data collection instruments
accurately measure what they intend to. Validity refers to the appropriateness of the instrument
in collecting the data that is supposed to be collected (Amin 2005). Validity was ensured by both

27
content and face to face validity. Content validity measures the extent to which the content of the
instrument corresponds to the content of the theoretical frame work of the study (Amin, 2005).
Here, the expert views were obtained by talking to experts both academicians and practitioners in
the field of project management. These were required to comment on the relevance of the
questions/items in the instrument. Validity of the instrument was also obtained by using the
Content Validity Index (CVI) where the cut off point for validity was 0.7.
The researcher ensured that the instrument minimizes random error and hence increase the
reliability of the data collected. Reliability refers to its consistency in measuring whatever it is
intended to measure (Amin 2005). In order to measure reliability, a score obtained in one item is
correlated with scores obtained from other items in the instrument. In addition, reliability of the
scales was carried out by determining the Cronbach’s alpha coefficient to check for the internal
consistency of the scales. In order to meet the acceptable standards for research, all alpha
reliabilities (α) for all scales were above 0.7 (Nunnally, 1987). The Content Validity Indices and
Cronbach Alpha Coefficients on internal consistency test were used with the following results.
Table 3.2: Reliability and Validity Tests for Quantitative Data
Variable Number of Items Cronbach Alpha
Value
Content Validity
Index
Institutional logics 14 0.807 0.890
Risk attitude 21 0.842 0.829
Risk management 22 0.802 0.847
Project performance 26 0.793 0.770
Source: primary data, 2018

28
The table above displays the reliability indices/coefficients for all constructs used in the study.
All alpha reliabilities (α) for all scales were above 0.7, ranging from 0.793 to 0.842 therefore
meeting acceptance standards for research (Nunnally, 1978).
3.8 Data Processing and Analysis
The researcher collected data cleaned, coded and classified it into categories. The data was
edited and entered into the data editor of Statistical Package for Social Scientists (SPSS V22)
software for analysis according to the objectives of the study. Data was organized and analyzed
using a 5 Likert scale. The data from URA staff and e-tax officers was merged using the
amalgamation paradox which is the paradox in which a statistical trend appears to be present
when data are segmented into separate groups of data but disappears (or reverses) when the data
is considered as a whole. The researcher presented data using descriptive and inferential statistics
where frequency tabulations were used to present the data on demographic characteristics
whereas, to present the results of the research objectives, the Pearson correlation matrix was
used. The researcher used correlation analysis to test the relationships between institutional
logics, risk attitude, risk management strategies and project performance. On the other hand,
regression analysis was used to present the results of the combined effect of the study variables
on project performance. Therefore, regression analysis was used to study the combined effect of
institutional logics, risk attitude and risk management strategies on project performance.
3.9 Ethical Considerations
When carrying out research the following ethical considerations were observed. Permission of
the people who were to be studied was sought to conduct research involving them. This was
done by attaining an introductory letter from the University introducing the researcher to the

29
management of URA. Written or verbal informed consent from all respondents was sought
before interviews were conducted and the purpose and objectives of the study were carefully
explained to the respondents. The researcher was careful not to cause physical or emotional harm
to respondents and ensured objectivity during the research so as to eliminate personal biases and
opinions. Likewise to ensure confidentiality of the respondents, the researcher designed the tools
in such a manner where the respondent was not required to provide personal details such as
names.

30
CHAPTER FOUR
PRESENTATION AND INTERPRETATION OF FINDINGS
4.1 Introduction
This chapter presents the results of the study and interpretation of findings. The presentation in
this chapter shows the results as tested according to the objectives of the study. The chapter
comprised of three sections. Section one presents the demographic characteristics showing
gender, tenure of employment/payment of tax, position/title held and level of education whereas,
entity characteristics included ownership, years of operation, number of employees and e-tax
project funding. The presentation begins with a description of the demographic characteristics
using frequency tabulation. The second section of the chapter presents results on the relationship
between the study variables using the Pearson correlation matrix and factor analysis. Section
three presents the results of the impact of the independent variable on the dependent variable
using the regression analysis.
4.2 Response Rate
During data collection, the researcher had to collect data from 310 respondents and the total of
310 questionnaires were distributed. Out of the 310 questionnaires that were distributed, 227were
responded to by the respective respondents from the different taxpayers.
4.3 Sample Characteristics
To present sample characteristics, frequency tabulations were used to indicate variations of
respondents based on gender, tenure of employment/payment of tax, position/title held and level

31
of education. The sample characteristics were presented basing on the responses from the
respondents in table 4.1.
4.4.1 Descriptive Characteristics for Respondents
The results in the table below show the distribution of Gender, Age group and the highest level
of education among the respondents for this study.
Table 4.1: Descriptive Characteristics for Respondents
Source: primary data, 2018
The results in the table 4.1 on gender distribution showed that the majority of the respondents
were male (59.5%) while the females comprised only 40.5% of the sample. These findings
show that there is an increasing trend to recruit staff at URA and to have women engaged in
business transactions with URA.
Gender, Total N = 227 Count Valid Percent
Male 135 59.5
Female 92 40.5
Age Group, Total N = 227 Count Valid Percent
20-25 yrs 13 5.7
26-30 yrs 109 48.0
31-35 yrs 54 23.8
36-40 yrs 36 15.9
40 & yrs 15 6.6
Level of education, Total N = 227 Count Valid Percent
Diploma 24 10.6
Degree 122 53.7
Postgraduate diploma 18 7.9
Masters 39 17.2
Professional qualification 22 9.7
Other 2 0.9

32
In regard to age group distribution as per table 4.1, the majority of the respondents dealing
with URA are between 26 - 35 years of age and these comprise 71.8% of the sample. It is
understandable since these persons are in the most productive period of a person's life and are
expected to be very productive, energetic and engaged in a variety of income generating
enterprises.
From the results on the table 4.1, on respondents’ level of education, the results show that the
most of the respondents were degree holders (53.7%) and only 10.6% had Diplomas. This can
be attributed to the fact that the URA employees only Graduates, and even among the
customers, it is mainly diploma holders and bachelors degree holders who can easily transact
business with URA.
4.4.2 URA Transaction Particulars
The results in the table below show the distribution URA transaction particulars in regard to
period of dealing with URA, designation and e-tax project funding among the respondents for
this study.

33
Table 4.2: URA Transaction Particulars
Period of dealing with URA,
Total N = 227 Count Valid Percent
Less than 1yr 15 6.6
2-5 yrs 105 46.3
6-9 yrs 56 24.7
10-13 yrs 36 15.9
Above 14 yrs 15 6.6
Designation in the study,
Total N = 227 Count Valid Percent
URA staff 59 26.0
Taxpayer 168 74.0
E-Tax Project Funding, Total N = 59 Count Valid Percent
Funded by Government 49 21.6
Partially funded by Government 8 3.5
Funded by development partners 2 0.9
Total 59 100.0
Source: primary data, 2018
The results on period of dealing with URA in table 4.2 show that 46.3% of the taxpayers had
dealt with URA for a period of 2-5 years, 24.7% had transacted with URA for 6-9 years,
15.9% had done business with URA for 10-13 years, whereas, those who had dealt with URA
for less than 1 year and above 14 years accounted for 6.6%. This is justification that the
majority of those who were transacting with URA had done so in the short run and would
continue to grow as the project performance increases.
The results on the designation of taxpayers in table 4.2 above show that the majority were
taxpayers (74%) and the staff accounted for 26%. This is corroboration that the e-tax project
could be used to benefit different users.

34
According to the results on e-tax project funding in table 4.2 above, the results showed that the
project was partially funded by government but government provided the largest funding
(21.6%) and funding from development partners accounted for 0.9% of the total funding of the
project.
4.4.3 Tax Payer Firm Attributes
To present the results of the taxpayer firm attributes, frequency tabulations were used to
indicate variations of respondents based on firm ownership, years of firm operation and
number of employees. The results are presented in tables 4.3.
Table 4.3: URA Tax Payer Firm Attributes
Firm Ownership, Total N = 168 Count Valid Percent
State owned 63 37.5
Privately owned 105 62.5
Years of firm Operation,
Total N = 168 Count Valid Percent
1-10 yrs 41 24.4
11-20 yrs 32 19.0
21-30 yrs 79 47.0
31 Yrs and above 16 9.5
Employees in firm Department,
Total N = 168 Count Valid Percent
20 - 50 19 11.3
51 - 100 34 20.2
101 - 150 35 20.8
150 and above 80 47.6
Source: primary data, 2018
From the results on firm ownership in table 4.3 above, the results showed that the majority of the
firms were private owned whereas, 37.5% were state owned. This is an indicator that the

35
majority of the firms were privately owned which is justification that Uganda’s tax sector was
dominated by private firms due to the liberalization of the sector.
The results in table 4.2, on years of operation show that the majority of the firms (47%) have
been in operation for over 21-30 years, 24.4% of the firms had been in operation for 1-10 years,
19 % had been in operation for 11-20 years and 9.5% had been in existence for over 31 years.
From the information that was provided it is clear that the majority of the firms had been in
operation in the mid-term.
From the results in the table 4.2, on the number of employees revealed that 47.6% of the firms
had over 150 employees, 20.8% had 101-150 employees, 20.2% had 51-100 employees and
11.3% of the firms had 20-50 staff. This implies that more than half of the responding firms are
well established with significant number of employees.
4.5 The Relationship between the Study Variables
Relationships between the study variables were examined first using the Pearson (r) Correlations
coefficient and then later on using the regression model. A Pearson value of 1.000 or -1.000
shows a perfect positive and negative relationship respectively. The focus of the study is
however on the relationships between the study variable and other variables and therefore shall
not dwell on the values of 1.000. The Pearson correlation coefficient (r) was employed to
establish the relationship between institutional logics, risk attitude, risk management and project
performance.

36
Table 4.4: Pearson Correlations for the Study Variables
Institutional
Logics
Risk
Attitude
Risk
Management
Project
Performance
Institutional Logics 1.000
Risk Attitude .537** 1.000
Risk Management .432** .576** 1.000
Project Performance .579** .560** .655** 1.000
**. Correlation is significant at the 0.01 level (2-tailed).
Source: primary data, 2018
4.5.1 Institutional Logics and Project Performance
The researcher observed a positive and significant relationship between institutional logics and
project performance (r = .579**, p<.01). The results show that institutional logics attributes such
as professionalism, are associated with desirable project performance indicators such as cost
minimization. This trend could be explained by the capacity of institutional logics to minimize
such undesirable elements as wastage of resources which in turn improves the project
Performance since there will be minimal costs incurred in effecting the e-tax project. In support,
the qualitative results from key informants also showed that;
“the management of URA put a lot of emphasis on ensuring that staff on the e-tax project
perform their duties in a professional manner by making sure that staff adhere to set
standards, procedures, policies, rules and guidelines (Interview with Participant I, March,
2018).”
Likewise, emphasis is put on making sure that there is efficiency, effectiveness and
economy in operations of the e-tax project which in the process promoted value for
money attainment (Interview with Participant III, March, 2018).”
“As a way of promoting stewardship in the e-tax project at the Authority, emphasis is
also put on planning and management of project resources. Resulting from project staff
conducting their roles in a professional manner, promoting value for money and

37
stewardship, there is cost minimization, timely service delivery, user satisfaction and
quality service delivery”. Says Participant II, March, 2018).
The results support the idea that availability of the required institutional logics at URA was
paramount in determining the e-tax project performance in regard to the project being able to
deliver quality timely tax services in cost efficient manner which also meet customer
expectations and needs. This is justification that promoting professionalism, public value and
stewardship in the e-tax project was vital in improving the performance of the project.
4.5.2 Risk Management and Project Performance
From the results in table 4.4 above, risk management was noted to be positively related to project
performance (r= .655**, p-value<0.01). These results indicate that when the firms were able to
effectively manage risk through risk transfer, avoidance and mitigation, this would make it easy
for the project to realize cost minimization, timely service delivery, stakeholder satisfaction and
deliver quality services. The results imply that if the firms put in place favorable risk
management strategies to deter the occurrence of risk, this would have a positive effect on the e-
tax project performance. The quantitative results were supported by the qualitative results from
the key informants who comprised the top executives revealing that;
“Hmmm… haaaaa with that…..URA tries to manage risk through avoiding of creating
risky activities and eliminating risky activities which done through review of system
operations and indentifying gaps that are addressed immediately. Staff are also
encouraged to report anomalies in the project systems that may cause risk to the project
which are addressed immediately (Interview with participants I, March, 2018)”.
“as a way of mitigating risk in the project, staff receive regular training on how to
manage risk, identify risk and assess risk. Similarly, management carries out monitoring
and evaluation of project activities so as to ensure that there are no deviations from

38
planned activities and that these are in line with budgeted resources (Interview with
participant III, March, 2018)”.
“The authority uses user appraisal, screening, quality financial reporting and scoring to be
able to mitigate risk and in turn be able to carry out effective risk management (Interview
with participant IV, March, 2018)”.
From the results on the association between risk management and project performance, it is
evident that management being able to identify risky situations, assess risk and mitigating risk in
the operations of the e-tax project would enhance the performance of the project. By being able
to achieve set objectives of minimizing project costs, attaining value for money, meeting user
expectations and needs and delivering quality tax-services, this will steer effectiveness and
efficiency in operations of the e-tax project.
4.5.3 Risk Attitude and Project Performance
According to the results in table 4.4 above, the correlation results indicated significant and
positive relationships between risk attitude and project performance (r = .560**, p<.01). This is
indicative of the fact that the taxpayers and staff possessing favourable risk perceptions and risk
behavior were paramount in causing a corresponding improvement in project performance in
regard to cost minimization, timeliness, stakeholder satisfaction and quality of output. Therefore,
a positive change in the risk attitude enhances the level of project performance of the e-tax
project. The qualitative results from key informants also showed that;
“the management of URA made efforts to make sure that the e-tax system is not
perceived to be risky for the users by making easy to use, useful, credible and secure
which has encouraged tax payers and staff to have positive attitudes towards the project
and in turn behave in a manner that promotes e-tax project success (Interview with
participant III, March, 2018)”.

39
Also participant II said that “due to the favourable perceptions and attitudes towards the
project, this has resulted into attainment of project goals of minimizing costs, promoting
efficiency and effectiveness in project activities as well as delivery of quality tax services
in a timely manner”.
This justification that risk attitude in regard to risk perception and behavior was principal in
enhancing the performance of the e-tax project through shaping of favourable attitudes towards
project activities which in turn promote effectiveness and efficiency of project activities. It is
evident that when the attitudes of beneficiaries of the e-tax project are in favour of project
operations, this will results into project success.
4.5.4 The Mediation Effect of Risk Management in the relationship between Institutional Logics
and Project Performance.
The results in the table below were presented to examine the mediation test results for the Risk
Management,
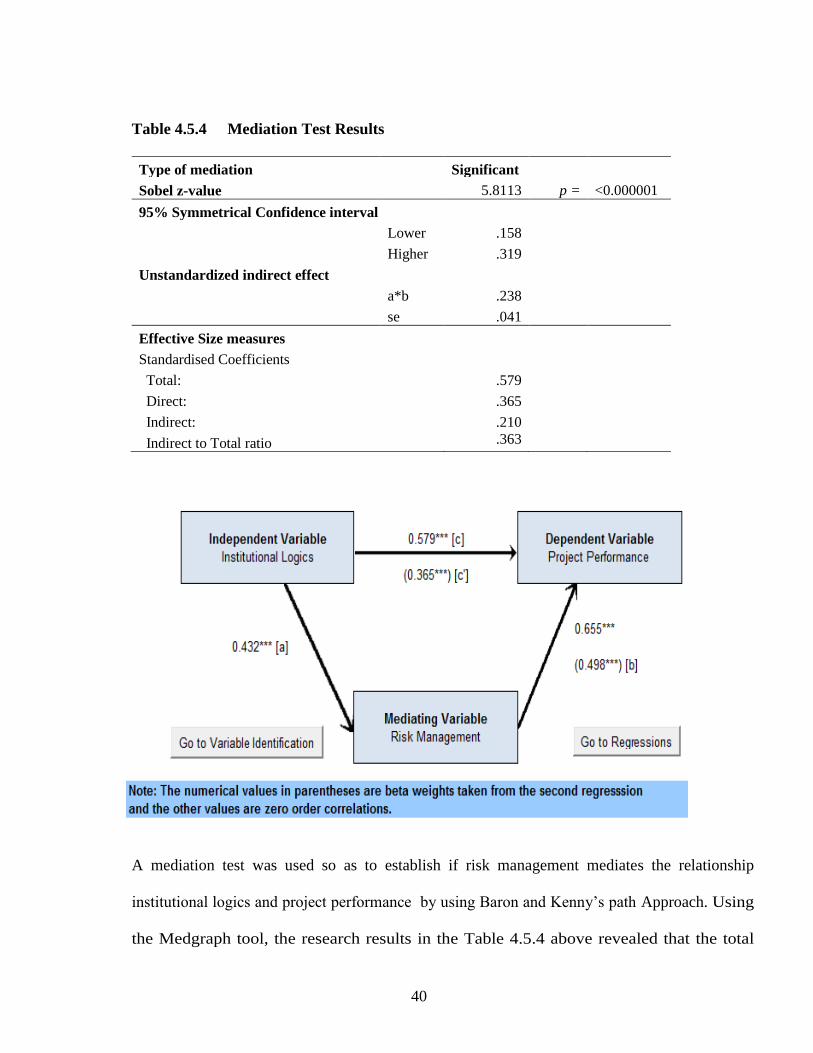
40
Table 4.5.4 Mediation Test Results
Type of mediation Significant
Sobel z-value 5.8113 p = <0.000001
95% Symmetrical Confidence interval
Lower .158
Higher .319
Unstandardized indirect effect
a*b .238
se .041
Effective Size measures
Standardised Coefficients
Total: .579
Direct: .365
Indirect: .210
Indirect to Total ratio .363
A mediation test was used so as to establish if risk management mediates the relationship
institutional logics and project performance by using Baron and Kenny’s path Approach. Using
the Medgraph tool, the research results in the Table 4.5.4 above revealed that the total
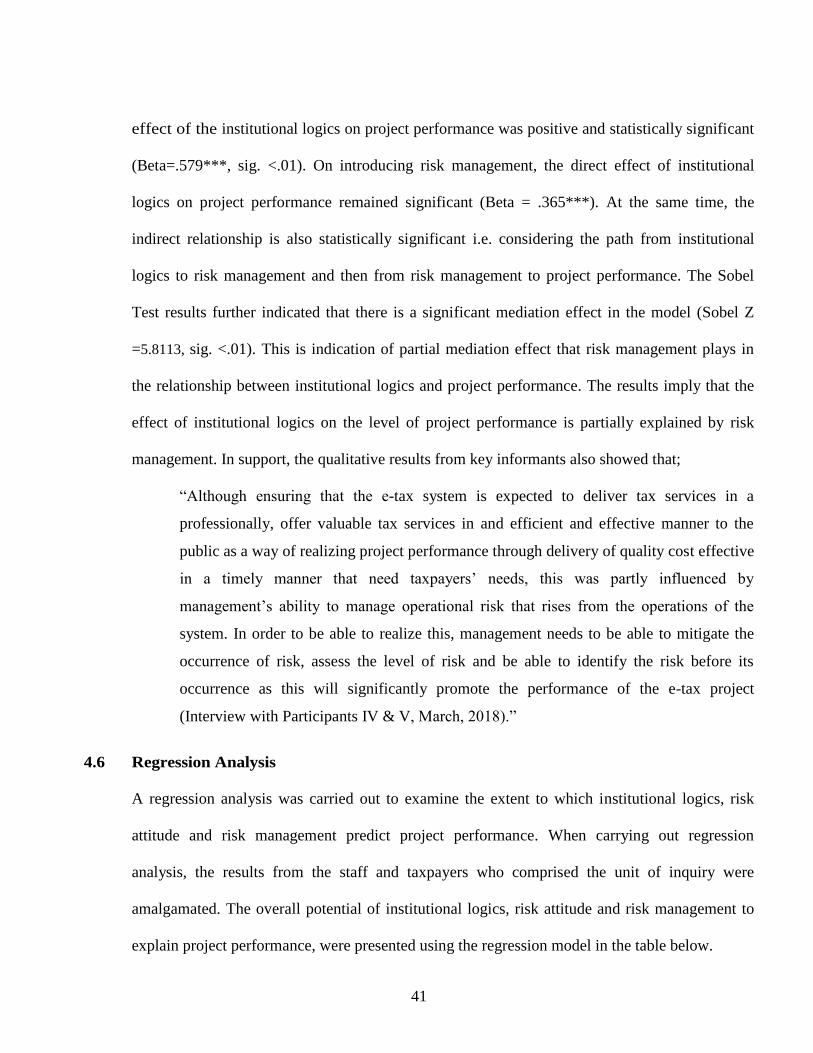
41
effect of the institutional logics on project performance was positive and statistically significant
(Beta=.579***, sig. <.01). On introducing risk management, the direct effect of institutional
logics on project performance remained significant (Beta = .365***). At the same time, the
indirect relationship is also statistically significant i.e. considering the path from institutional
logics to risk management and then from risk management to project performance. The Sobel
Test results further indicated that there is a significant mediation effect in the model (Sobel Z
=5.8113, sig. <.01). This is indication of partial mediation effect that risk management plays in
the relationship between institutional logics and project performance. The results imply that the
effect of institutional logics on the level of project performance is partially explained by risk
management. In support, the qualitative results from key informants also showed that;
“Although ensuring that the e-tax system is expected to deliver tax services in a
professionally, offer valuable tax services in and efficient and effective manner to the
public as a way of realizing project performance through delivery of quality cost effective
in a timely manner that need taxpayers’ needs, this was partly influenced by
management’s ability to manage operational risk that rises from the operations of the
system. In order to be able to realize this, management needs to be able to mitigate the
occurrence of risk, assess the level of risk and be able to identify the risk before its
occurrence as this will significantly promote the performance of the e-tax project
(Interview with Participants IV & V, March, 2018).”
4.6 Regression Analysis
A regression analysis was carried out to examine the extent to which institutional logics, risk
attitude and risk management predict project performance. When carrying out regression
analysis, the results from the staff and taxpayers who comprised the unit of inquiry were
amalgamated. The overall potential of institutional logics, risk attitude and risk management to
explain project performance, were presented using the regression model in the table below.

42
Table 4.5: Prediction Model for the Study Variables
Unstandardized
Coefficients
Standardized
Coefficients t Sig.
B Std. Error Beta
(Constant) -.207 .230
-.899 .370
Institutional Logics .351 .060 .316 5.830 .000
Risk Attitude .174 .076 .137 2.286 .023
Risk Management .474 .060 .440 7.863 .000
Dependent Variable: Project Performance
R .740
R Square .548
Adjusted R Square .542
Std. Error of the Estimate .683
F Change 9.128
Sig. .000
Source: primary data, 2018
It was observed that institutional logics, risk attitude and risk management can jointly predict
54.2% of the variance in the project performance (Adjusted R Square = .542). The regression
model is reliable for making recommendations and policy formulation, considering the 99%
confidence level at which the model was significant. Further, the model was found to be well
specified, implying that all the independent variables combined in the model were appropriate
predictors of project performance, and the variation in all of the independent variables combined
caused up to 54.2% variation project performance. Among the predictors, the most influential at
predicting the project performance was the risk management (Beta = .440, p <.01). This was
followed by the institutional logics (Beta = .316, p <.01) and risk attitude ((Beta = .137, p <.01).
The regression model was overall significant (Sig.<.01). This implies that improving institutional
logics, risk attitude and risk management would lead to an improvement in the project

43
performance of the e-tax project. In line with the quantitative results, the qualitative results from
key informants also showed that;
“ensuring that e-tax project delivers tax services in a professional manner, delivers
valuable tax services in efficiently and effectively to the public; management is able to
mitigate the occurrence of risk, assess risk levels in the operations of the system and
identify risk before occurrence; as well as adhere to set risk management procedures, this
influences the performance of the project by being able to deliver quality cost effective
and timely tax services that meet beneficiary needs (Interview with Participants I, II &
IV, March, 2018).”
4.7 Summary of the Chapter
Chapter four has presented findings on sample characteristics, relationships between the study
variables and regression analysis. This chapter has revealed that there were significant positive
correlations between all the study variables. The regression model has shown that 54.2% of the
variance in project performance is accounted for by institutional logics, risk attitude and risk
management. The next chapter discusses these observed findings and provides recommendations.

44
CHAPTER FIVE
DISCUSSION, CONCLUSION AND RECOMMENDATIONS
5.1 Introduction
This chapter presents the discussion, conclusions, and recommendations arising out of the
research findings in chapter four and suggests areas for further study.
5.2 Summary of the Findings
The study sought to examine the relationship between institutional logics, risk attitude, risk
management and project performance. From the respondent sample characteristics, male were
more responsive, according to the tenure of dealing with URA, those in the category of 2-5 years
provided more responses and the respondents under the 26-30 years age group were more
responsive. The results showed that the respondents holding degrees were more responsive. The
firm characteristics revealed that the majority of the taxpayers were privately owned, the
majority of the firms had been in operation for over 21-30 years and had over 150 employees.
From the results, the majority of the responses were acquired from taxpayers and the results
showed that government was the major funder of the e-tax project. According to the correlational
findings of the study variables, the findings revealed positive and significant relationships
between the study variables and project performance. Similarly, the correlational results were in
line with the regression analysis which revealed that institutional logics, risk attitude and risk
management predicted project performance up to the tune of 54.2%.

45
5.3 Discussion of the Findings
5.3.1 Institutional Logics and Project Performance
The findings revealed that institutional logics was significant and positively related to project
performance. In line with the correlation, the qualitative results, the regression results also
revealed that institutional logics was a determinant of the projects ability to minimize costs,
deliver timely services, promote stakeholder satisfaction and deliver quality of output. This is
corroboration that when taxpayers and URA staff exhibit professionalism and stewardship, this
will promote project performance of the e-tax project. In line with the findings, Kelman (2006)
opines that as collective identities become institutionalized, they develop their own distinct
institutional logic and these logics prevail within the social group. According to Jones and Livne
Tarandach’s rhetorical strategies of architects based in the institutional logics of business,
profession and state that focus attention on distinct competencies servicing clients, building great
architecture, or managing facilities.
5.3.2 Risk Attitude and Project Performance
From the findings it was revealed that there was a significant positive relationship between risk
attitude and project performance. Likewise, the results from regression analysis also supported
the correlation and the qualitative results on the association between risk attitude and project
performance. The findings of the study provide justification that when the taxpayers and URA
staff are able to exhibit favourable risk perceptions and risk behaviour, this will in turn promote
project performance of the e-tax project. In line with the findings, Hillson and Murray-Webster
(2004) posit that although attitude manifests itself through behaviour, there are other drivers of
behaviour which can displace the chosen or preferred attitude. The extent to which this occurs
depends on the perception of the situation towards which the attitude is being directed (Kargi,

46
2011). When an individual or group perceives a situation or environment as negative, the
resulting behaviour is largely determined by a direct response to the situation, and attitude plays
a smaller role (Kim and Reinschmidt, 2011a). Indeed a negative situation may force behaviour
which is contrary to that preferred by attitude, leading to a more reactive stance. The risk attitude
of a person or organization is influenced by risk appetite, risk tolerance and risk threshold
(George, 2009). Organizations perceive risk as the effect of uncertainty on projects and
organizational objectives. Organizations and stakeholders’ willingness to accept varying degrees
of risk depends on their risk attitude.
5.3.3 Risk Management and Project Performance
The findings showed a significant and positive relationship between risk management and
project performance. The findings provide justification that the URA’s ability to put in place
the required risk management strategies that promote risk transfer, avoidance and mitigation, this
would enhance the project’s ability to realize cost minimization, timely service delivery, promote
stakeholder satisfaction and delivery quality output so as to attain the required levels of project
performance. Likewise, the regression results revealed that risk management predicted a change
in the performance of the e-tax project, therefore, making risk management vital in promoting
the success of the e-tax project. In agreement with the findings, Aabo, et. al., (2005) postulate
that it became evident that risk is considered as one of the primary threats that, if dealt properly
could turn out into an opportunity. Stoddard (2004) concluded risk management as a daunting
task for organizations and it could be made successful by motivating the individuals.
Organizations that implement effective risk management become successful while others not
practicing this activity proved to be unsuccessful. By implementing risk, management
47
organization can reduce unexpected and costly surprises and effective allocation of resources
could be more effective.
5.4 Conclusions
The conclusion of the study was made in accordance with the study objectives.
The findings validate that institutional logics was an integral part of project performance.
This indicates that institutional logics in regard to professionalism, public value and stewardship
positively affected the e-tax project performance levels. This is justification that institutional
logics was vital in promoting project performance of the e-tax project. Therefore, availability of
favourable institutional logics at URA would have a positive effect on the e-tax project
performance.
The findings on the relationship between risk attitude and project performance indicated a
positive and significant relationship. This is justification that for the e-tax project to achieve the
required performance, there was need for staff and taxpayers to possess favourable risk
perceptions and risk behavior for the project to be able to minimize costs, delivery services which are of
quality in a timely manner and at the same time promote stakeholder satisfaction.
The findings showed that risk management had a positive influence on project performance
which is an implication that putting in place favorable risk mitigation strategies enhanced the
level of project performance of the e-tax project. This is indication that when risk is managed
in regard to transfer, avoidance and mitigation, this would result into the required project
performance of the e-tax project.
5.5 Recommendations
In light of the research findings, the following recommendations are made:

48
a) Institutional Logics and Project Performance
According to the findings, institutional logics was found to be a major predictor of project
performance. Therefore, project managers should put a lot of emphasis on institutional logics
so as to enhance timely project service delivery, quality service delivery, cost reduction and
beneficiary satisfaction. This can be achieved by ensuring that the users and beneficiaries of
the project act professionally, promote value for money and exhibit stewardship as this will
have a positive effect on the level of project performance.
b) Risk Management and Project Performance
The findings on the relationship between risk management and project performance revealed
that risk transfer, avoidance and mitigation during project activities helped promote project
performance. Therefore, in order to realize timely delivery of project services, value for
money, cost control and beneficiary satisfaction, there should be a move by the managers of
the project to put in place risk management strategies that deter risk. This can be achieved by
setting favorable insurance policies, ensuring that taxpayers provide financial guarantees and
policy reviews among others as this will have a positive effect on the project performance.
URA should also devise strategies that promote risk avoidance such as application of the
right policies, setting the required procedures to be followed during risk evaluation, provision
of the required risk management training to staff, use of relevant technologies to control risk
among other things which will in turn promote project performance. URA should have an
effective risk management policy which should be enshrined in its risk management
practices. The foregoing is likely to enhance the e-tax project’s performance by mitigating
financial losses that would otherwise emanate from risks. Managers should be responsible for

49
identifying the risks to which systems and procedures are exposed, developing and
maintaining effective controls to prevent and detect fraud and ensuring that controls are
being complied with.
Project manager should pay attention to the behavior and performance of its risk mitigants,
whose appropriateness and applicability may also vary with changes in the market. The
bottom line for URA is that they must continue to monitor very carefully the embedded risks,
pay close attention to subtle changes in business practices that could affect the risks related to
a given product and fully understand how the risks in all their business lines intersect and
combine to affect the risk profile of the consolidated entity.
c) Risk attitude and Project Performance
Findings indicate that risk attitude influenced project performance. Based on the current
study results, the managers of the e-tax project need to be moderately risk-averse in their
decisions. By being moderately risk-averse, managers will be able to maintain stable project
operations while avoiding critical risks. By so doing, managers can be successful by taking a
risk-seeking strategy or a highly risk-averse strategy for a short-term as this will promote
project performance. With the required risk attitude among managers of the project, the
project will exist longer, grow more, diversify more, and deliver quality services in a timely
manner. Therefore, when there is reasonable risk attitudes among project managers, the
project will transfer from a less favorable class to a more favorable class.
It is also recommended to take an adaptive approach to identifying and modifying their own
risk attitudes. This adaptive approach should be taken on the basis of an objective evaluation
of the project’s performance. With time, by making incremental adjustments, URA may be

50
able to modify its culture regarding risks. On the other hand, evaluation of the project
managers’ risk attitude can be performed by conducting post-project studies. These allow
managers to compare and analyze their own measure of risk for a project against the realized
results of the project. To be able to achieve this, it requires project managers to document
relevant processes of risk evaluation, which helps the them learn about their risk perception
and evaluation.
5.6 Limitations of the Study
i) Unwillingness of respondents to fill questionnaires and withholding information due to
fear of being victimized. However, the researcher convinced them that the information
they provided was to be kept confidential. The researcher ensured that there were regular
visits to the respondents followed with reminders to fill the questionnaires.
ii) On looking at the limited time which the researcher had to conduct the study, respondents
may suspect that the research findings are to be used for other purposes while others are
likely to delay the questionnaires because of busy schedules. Here the researcher used a
cover letter from the Graduate and Research Centre to mitigate the outcome.
iii) The scales in the questionnaire were adopted from other studies conducted in different
environments from that of Uganda, which is likely to cause bias. The researcher involved
experts in the fields of institutional logics, risk attitude, risk management and project
performance to moderate the scales adapted to fit the local environment.
iv) Fear of giving confidential information as viewed by the organization they work for. Here
the researcher assured them of at most good faith with supporting documents for
undertaking the study.

51
v) The way the questionnaire was designed might limit additional response. This was
however mitigated through prompting the respondents to give more information.
5.7 Areas for further study
i) This study concentrated on institutional logics, risk attitude, risk management and project
performance of the e-tax project in URA. Future research should attempt to collect data
from all projects in URA to ascertain and compare the findings.
ii) The study adopted a case study design which studied the state of affairs on the e-tax
project at URA at a point in time. To study the true nature and quality of institutional
logics, risk attitude, risk management and project performance, a longitudinal study is
more appropriate.
iii) The model could only explain 54.2% of the variance in project performance failing to
account for 45.8% of the variance in project performance. Future studies should comprise
of other variables that were not part of the model to predict the variance in project
performance.
52
REFERENCES
Ahmed, A., Kayis, B. and Amornsawadwatana, S. (2007). A Review of Techniques for Risk Management in
Projects, Benchmarking: An International Journal, Vol. 14 (1), pp. 22-36.
Ahsan, K. and Gunawan, I. (2010). Analysis of Cost and Schedule Performance of International Development
Projects. International Journal of Project Management, Vol. 28(1): pp.68-78.
Amin, M. E. (2005). Social Science Research: Conception, Methodology and Analysis, Makerere University
Printery, Kampala, Uganda.
Arman, A., Bin, A. M. R. and Hassan, B. C. H. M. (2009). Risk Reporting: An Exploratory Study on Risk
Management Disclosure in Malaysian Annual Reports, Managerial Auditing Journal, Vol. 24, (1), pp.39-
57.
Bank of Uganda Report (2012)
Basel II (1999). Principles for the Management of Credit Risk; Consultative paper issued by Basel Committee on
Banking Supervision, Basel.
Boin, A., Eeten, V. and Michel J. G. (2013). The Resilient Organization. Public Management Review Vol. 15(3):
pp.429-45.
Cervone F. H. (2006). Project Risk Management, OCLC Systems & Services: International digital library
perspectives, Vol. 22 (4), pp.256-262.
Chapman, C. and Ward, S. (2007). Project Risk Management: Process, Techniques and Insights (2nd ed.).
Chichester: John Wiley.
Cronbach, L. J. (1950). Further Evidence on Response Sets and Test Design. Educational and Psychological
Measurement, Vol. 10, pp.3-31.
Dey, K., Prasanta, K. J. and Ogunlana, O. S. (2007). Managing Risk in Software Development Projects: A Case
Study, Industrial Management & Data Systems, Vol. 107 (2), pp. 284-303.
Focus on Uganda (2009)
George, L. (2009). Risk Management Why and How. International Risk Management Institute, Inc.
Hassan, M. K. (2009). Risk Management Practices of Islamic Banks of Brunei Darussalam, The Journal of Risk
Finance, Vol. 10 (1), pp.23-37.
Hillson, D. and Murray-Webster, R. (2005). Understanding and managing risk attitude. Aldershot: Gower.
Hyung, J. K. (2009). The Effects of Risk Attitude on Competitive Success in the Construction Industry. PhD,
Texas A&M University.
Ssegane, J. (2009). CATA Newsletter, Vol. 4, pp.26
Kargi, H.S. (2011). Credit Risk and the Performance of Nigerian Banks, Ahmadu Bello University, Zaria.

53
Kim, H. and Reinschmidt, K. F. (2011). Effects of Contractors’ Risk Attitude on Competition in Construction.
Journal of Construction Engineering and Management. Vol. 137 (4), pp. 275-283.
Kim, H. and Reinschmidt, K. F. (2011). Association of Risk Attitude with Market Diversification in the
Construction Business. Journal of Management in Engineering. Vol. 27 ( 2), pp. 66-74.
Kreijce, R, V. and Morgan, D.W. (1970). Determining Sample Size for Research Activities, Educational and
Psychological Measurement, 30: 607-610
Kumar, V., Mukerji, B., Irfan, B. and Ajax, P. (2007). Factors for Successful e-Government Adoption: A
Conceptual Framework, The Electronic Journal of e-Government, Vol. 5 (1), pp.63-77
Meyer, R. E. and Hammerschmid, G. (2006). Changing Institutional Logics and Executive Identities: A
Managerial Challenge to Public Administration in Austria. American Behavioral Scientist, Vol.49,
pp.1000-1014.
Mugenda, O. and Mugenda, A.G. (1999). Research Methods Quantitative and Qualitative. Nairobi Act Press
Nielson L. Norma, Kleffner E. Anne and Lee B. Ryan, (2005). The Evolution of the Role of Risk Communication
in Effective Risk Management, Risk Management and Insurance Review, Vol. 8, No. 2, pp 279-289.
Nunnally, J. C. (1978). Psychometric theory (2nd ed.). New York: McGraw-Hill
Reay, T. and Hinings, C. R. (2005). The Re-composition of An Organizational Field: Health Care in Alberta,’
Organization Studies, Vol. 26 (3), pp.351–384.
Sekaran, U. (2003). Research Methods for Business: A Skill Building Approach. (4th edn.)John Wiley & Sons,
Inc. United States of America
Stoddard, J. and Kwak, H.Y. (2004). Project Risk Management: Lessons Learned From Software Development
Environment, Technovation, Vol. 24, pp. 915-920.
Thornton, P. H. and Ocasio, W. (2008). Institutional Logics. In R.Greenwood, C. Oliver, R. Suddaby, & K. Sahlin
(Eds.), The Sage Handbook of Organizational Institutionalism (pp. 1-46). Los Angeles: Sage
Publications.
Uganda Budget Report (2012)
Uganda Budget Report (2012)
Uganda Radio Network (2010)
Uganda Revenue Authority (2011). www.ura.co.ug
Uganda Revenue Authority Annual Report (2014)
Wallace, P. and Blumkin, M. (2007). Major Construction Projects: Improving Governance and Managing Risks.
Wang, J. and Yuan, H. (2011). Factors Affecting Contractors' Risk Attitudes in Construction Projects: Case Study
From China. International Journal of Project Management. Vol. 29 (2), pp. 209-219.
Yin, R. (2011). Qualitative Research from Start to Finish. New York: The Guildford Press.

54
Zhou, P. X., Zhang, G. M. and Wang, J. (2007). Understanding the Key Risks in Construction Projects in China.
International Journal of Project Management, Vol.25, pp.601-614.
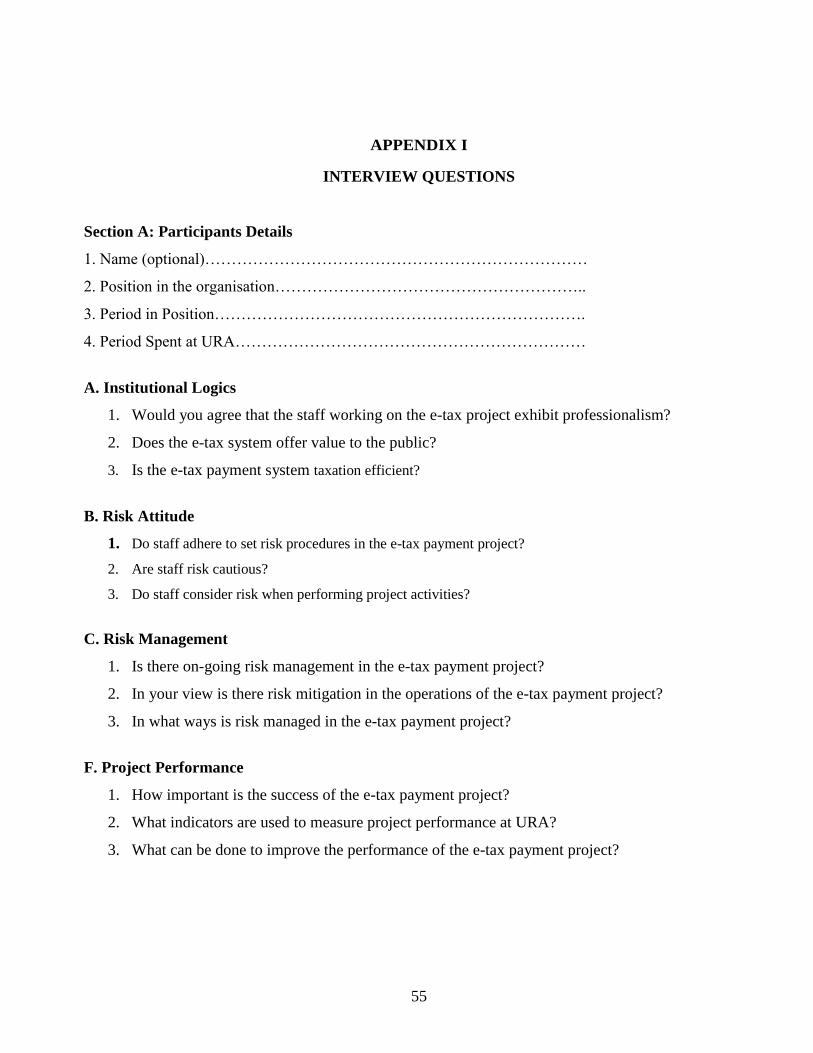
55
APPENDIX I
INTERVIEW QUESTIONS
Section A: Participants Details
1. Name (optional)………………………………………………………………
2. Position in the organisation…………………………………………………..
3. Period in Position…………………………………………………………….
4. Period Spent at URA…………………………………………………………
A. Institutional Logics
1. Would you agree that the staff working on the e-tax project exhibit professionalism?
2. Does the e-tax system offer value to the public?
3. Is the e-tax payment system taxation efficient?
B. Risk Attitude
1. Do staff adhere to set risk procedures in the e-tax payment project?
2. Are staff risk cautious?
3. Do staff consider risk when performing project activities?
C. Risk Management
1. Is there on-going risk management in the e-tax payment project?
2. In your view is there risk mitigation in the operations of the e-tax payment project?
3. In what ways is risk managed in the e-tax payment project?
F. Project Performance
1. How important is the success of the e-tax payment project?
2. What indicators are used to measure project performance at URA?
3. What can be done to improve the performance of the e-tax payment project?

56
APPENDIX II
QUESTIONNAIRE
Dear respondent,
I am researching on Institutional Logics, Risk Attitude, Risk Management Strategies and Performance of
Uganda Revenue Authority E-Tax Project. Given your unique experience and position in taxation, you have
been chosen purposely to participate in this study. Your response is therefore very instrumental to the success of
my project. Kindly assist by answering the following questions as honestly as possible. The data sought shall be
purely for research purpose and will therefore be treated with anonymity and utmost confidentiality.
SECTION I (a): Personal Profile
Kindly tick (√) the appropriate answer option.
1. What is your gender?
Male Female
1 2
2. Your Age of Range
20-25 yrs 26-30 yrs 31-35 yrs 36 – 40 yrs 40+ yrs
1 2 3 4 5
3. How long have you been employed/paid tax at URA?
Less than 1 year 2 – 5 yrs 6 –9 yrs 10 – 13 yrs Above 14 yrs
1 2 3 4 5
4. Your Position/Title held
URA staff Taxpayer
1 2
5. Your highest level of education
Diploma Degree Postgraduate diploma Masters Professional qualification other
1 2 3 4 5 6

57
SECTION I (b):
Characteristics of the Electronic Tax Project
Please provide the information in the table below
1. Services offered by the e-tax system that you/your company uses
3. Advantages of the e-tax system
Others, please specify ..............................................................................................................
4. Disadvantages of the e-tax system
Others, please specify ..............................................................................................................
SECTION I (c):
Characteristics of the Organisation (To be answered by URA Officers)
Please provide the information in the table below
1. Ownership
2. Years of Operation
Services Tick
Filing tax returns
Tax amendments
Assessment of tax returns
Tax refunds
Tax payments
Advantages Tick
Avoids queuing in URA offices
Reduce operational costs
User friendly
Easy to use
It is useful for taxpayers
Safe and secure
System availability
can be used by more than one person at a time
Clients Tick
Very slow
System breakdown
Time wasting
Bureaucratic
State owned Privately owned Other
1-10 yrs 11-20 yrs 21-30 yrs 31 yrs & above

58
3. Number of Employees in Your Department
4. E-Tax Project Funding
Section II: Institutional Logics
Please indicate the extent to which you agree or disagree with the statements below
Key: 1=SD-strongly disagree; 2=D-disagree; 3=NS- not sure; 4=A-agree and 5=SA-strongly agree
Items SD D N A SA
Professionalism
I would prefer to see the e-tax system doing what is best for taxpayers 1 2 3 4 5
The staff of URA received training on how to operate the e-tax system 1 2 3 4 5
There was social authorization of the e-tax system by different stakeholders 1 2 3 4 5
Managers/officers/taxpayers do not take the e-tax system for granted 1 2 3 4 5
The operators of the e-tax system are experienced 1 2 3 4 5
Public value
The e-tax system modernized URA’s taxation systems 1 2 3 4 5
The e-tax system is a tax administration tool 1 2 3 4 5
To support the e-tax system, new physical facilities were put in place 1 2 3 4 5
The users of the e-tax system experience increased control 1 2 3 4 5
Users of the e-tax system hold various perceptions which are sometimes conflicting 1 2 3 4 5
Stewardship
The e-tax system is a taxation efficiency enhancer 1 2 3 4 5
The e-tax system is used to gather information about taxpayers 1 2 3 4 5
The e-tax system is used for documentation, communication and reporting 1 2 3 4 5
The e-tax system is an efficient tax administration improvement tool 1 2 3 4 5
Section III: Risk Attitude
Please indicate the extent to which you agree or disagree with the statements below
Key: 1=SD-strongly disagree; 2=D-disagree; 3=NS- not sure; 4=A-agree and 5=SA-strongly agree
Items SD D N A SA
Risk Perception/Cognition
There is nothing wrong without adhering to risk procedures 1 2 3 4 5
Adhering to risk procedures generally benefits the user 1 2 3 4 5
I consider risk when performing risk activities. 1 2 3 4 5
I think that I am often less cautious than people in general 1 2 3 4 5
I never take any risks that I can avoid when it comes to important things 1 2 3 4 5
I am always very cautious and think of risk first 1 2 3 4 5
I worry about the technological complexity of the e-tax system 1 2 3 4 5
I worry if a certain transaction can be easily found. 1 2 3 4 5
I worry about the ease of use regarding e-tax system 1 2 3 4 5
In my opinion, new technology is often too complicated to be useful 1 2 3 4 5
I have such an image that e-tax services are speedy to use 1 2 3 4 5
20-50 51-100 101-150 150 & above
Funded by
Government
Partially Funded
by Government
Funded by Development
Partners
Partially Funded by Development Partners

59
When I think of an operation, I immediately think of the risk. 1 2 3 4 5
Risk taking/behaviour
I ignore some risk procedures if I am trying to save time. 1 2 3 4 5
I like following set procedures because they help me avoid mistakes 1 2 3 4 5
I constantly refer to risk manuals before starting my day’s work 1 2 3 4 5
I am committed to following risk guidelines 1 2 3 4 5
I often dare to do risky things that other people are reluctant to do 1 2 3 4 5
I can be rather incautious and take big risks 1 2 3 4 5
I don't have a problem with taking risks with the system if the benefits are great enough 1 2 3 4 5
Section IV: Risk Management Strategies
Please indicate the extent to which you agree or disagree with the statements below
Key: 1=SD-strongly disagree; 2=D-disagree; 3=NS- not sure; 4=A-agree and 5=SA-strongly agree
Items SD D N A SA
Mitigation
URA insures different types of risks but not all risks 1 2 3 4 5
URA does not insure catastrophic risks 1 2 3 4 5
The Authority has a mechanism for transferring certain risks to third parties. 1 2 3 4 5
Controls are in place to evaluate the efficiency of the risk management program. 1 2 3 4 5
Employees are properly trained on risk management policies 1 2 3 4 5
Forecasts and projections are adjusted based on risk assessment. 1 2 3 4 5
Resources are allocated to reduce largest risks as early as possible 1 2 3 4 5
Risk management is tailored to specific program/project needs. 1 2 3 4 5
Risk Assessment
Risks are evaluated with assumptions and uncertainties being clearly considered and
presented.
1 2 3 4 5
Risk is evaluated in terms of both quantitative and qualitative value. 1 2 3 4 5
Risk is evaluated in terms of both quantitative and qualitative value. 1 2 3 4 5
Risks are subdivided into individual levels for further analysis 1 2 3 4 5
Regular reviews of risk management efforts and reporting to senior management. 1 2 3 4 5
Risk mitigation actions are evaluated based on the reduction of impact of risk
through the mitigation action.
1 2 3 4 5
Risk Identification
Risk inspection is done by stakeholders 1 2 3 4 5
Roles and responsibilities for risk identification are clearly defined 1 2 3 4 5
Financial statement analysis enhances risk identification 1 2 3 4 5
Establishing standards enhances risk identification 1 2 3 4 5
Risk rating and collateral enhances risk identification 1 2 3 4 5
Risks and risk management activities are communicated to stakeholders 1 2 3 4 5
Section V: Project Performance
Please indicate the extent to which you agree or disagree with the statements below
Key: 1=SD-strongly disagree; 2=D-disagree; 3=NS- not sure; 4=A-agree and 5=SA-strongly agree
Items SD D NS A SA
Cost Minimization
There is increased project costs due to changes in project designs 1 2 3 4 5
The total cost of operation is reducing over the years 1 2 3 4 5
There is cost progress monitoring on the e-tax system 1 2 3 4 5

60
URA sets reliable cost estimates ahead of any project execution 1 2 3 4 5
The actual funds that were spent on the e-tax project were less than the budgeted 1 2 3 4 5
The e-tax project costs are managed well 1 2 3 4 5
e-tax project activities have enabled URA to incur lower costs of operations 1 2 3 4 5
Timeliness
The implementation of the e-tax project was timely 1 2 3 4 5
Reliable time estimates are set ahead of project implementation 1 2 3 4 5
The project team is always committed to beating set deadlines 1 2 3 4 5
URA provides necessary information to project stakeholders in time 1 2 3 4 5
Project activities from initiation to closure are always timely 1 2 3 4 5
Quality of Output
The e-tax project has greatly improved URA’s social relations with taxpayers 1 2 3 4 5
Taxpayers are always happy with the e-tax project activities 1 2 3 4 5
Investing in the e-tax activities has boosted service delivery 1 2 3 4 5
The e-tax project has greatly improved tax payment and collection 1 2 3 4 5
Taxpayers are satisfied with the outcomes of the e-tax project 1 2 3 4 5
The quality of the e-tax services has benefited taxpayers 1 2 3 4 5
Stakeholder satisfaction
The project has benefited tax payers 1 2 3 4 5
There is commitment on the part of the project officials and beneficiaries in the
implementation of the project
1 2 3 4 5
There has been sensitization of the different stakeholders on the project objectives 1 2 3 4 5
There has been delays in project activities due to the increased number of lodged
complaints by the taxpayers
1 2 3 4 5
As a result of stakeholder involvement, there has been effective project service
delivery
1 2 3 4 5
Due to monitoring and evaluation of the project activities, there has been value for
money attainment
1 2 3 4 5
As a result of enough support from beneficiaries before the commencement of the
project, the project has been a success
1 2 3 4 5
Thank You