Embed Size (px)
Citation preview
131
The accompanying audited consolidated financial statements (“financial statements”) of SNC-Lavalin Group Inc. and all the information in this financial report are the responsibility of management and are approved by the Board of Directors.
The financial statements have been prepared by management in accordance with International Financial Reporting Standards. When alternative accounting methods exist, management has chosen those it considers most appropriate in the circumstances.
The significant accounting policies used are described in Note 2 to the financial statements. Certain amounts in the financial statements are based on estimates and judgments. Management has determined such amounts on a reasonable basis in order to ensure that the financial statements are presented fairly, in all material respects. Management has prepared the financial information presented elsewhere in the financial report and has ensured that it is consistent with that in the financial statements.
The Company’s Chief Executive Officer (“CEO”) and Chief Financial Officer (“CFO”) are responsible for establishing and maintaining disclosure controls and procedures and internal control over financial reporting. The CEO and the CFO have supervised an evaluation of the effectiveness of the Company’s internal control over financial reporting, as at December 31, 2017, in accordance with the criteria established in Internal Control – Integrated Framework (2013) issued by the Committee of Sponsoring Organizations of the Treadway Commission (COSO). Based on this evaluation, the CEO and the CFO have concluded that the Company’s internal control over financial reporting, as at December 31, 2017, was effective to provide reasonable assurance regarding the reliability of the Company’s financial reporting and the preparation of its financial statements for external purposes in accordance with International Financial Reporting Standards. Management excluded from its assessment the internal control over financial reporting at WS Atkins Limited (“Atkins”) and Data Transfer Solutions LLC, which were acquired on July 3, 2017 and on October 30, 2017, respectively, and whose revenues, net income attributable to SNC-Lavalin shareholders and total assets constitute approximately 19%, 31% and 10% of the consolidated financial statements as at and for the year ended December 31, 2017.
The Board of Directors is responsible for ensuring that management fulfills its responsibilities for financial reporting and is ultimately responsible for reviewing and approving the financial statements. The Board of Directors carries out this responsibility principally through its Audit Committee.
The Audit Committee is appointed by the Board of Directors, and all of its members are independent directors. The Audit Committee meets periodically with management, as well as with the internal and independent auditors, to discuss disclosure controls and procedures, internal control over financial reporting, management information systems, accounting policies, auditing and financial reporting issues, to satisfy itself that each party is properly discharging its responsibilities, and to review the financial statements, the Management’s Discussion and Analysis and the independent auditor’s report. The Audit Committee reports its findings to the Board of Directors for consideration when approving the financial statements for issuance to the shareholders. The Audit Committee also considers, for review by the Board of Directors and approval by the shareholders, the engagement or reappointment of the independent auditor, and reviews and approves the terms of its engagement as well as the fee, scope and timing of its services.
The financial statements have been audited, on behalf of the shareholders, by Deloitte LLP, the independent auditor, in accordance with Canadian generally accepted auditing standards. The independent auditor has full and free access to the Audit Committee and may meet with or without the presence of management.
NEIL BRUCE (signed) SYLVAIN GIRARD (signed) PRESIDENT AND CHIEF EXECUTIVE OFFICER
EXECUTIVE VICE-PRESIDENT AND CHIEF FINANCIAL OFFICER
FEBRUARY 21, 2018 MONTREAL, CANADA
Management’s Responsibility for Financial Reporting
132
To the Shareholders of SNC-Lavalin Group Inc.
We have audited the accompanying consolidated financial statements of SNC-Lavalin Group Inc., which comprise the consolidated statements of financial position as at December 31, 2017 and December 31, 2016, and the consolidated income statements, consolidated statements of comprehensive income, consolidated statements of changes in equity and consolidated statements of cash flows for the years then ended, and a summary of significant accounting policies and other explanatory information.
Management’s Responsibility for the Consolidated Financial Statements
Management is responsible for the preparation and fair presentation of these consolidated financial statements in accordance with International Financial Reporting Standards, and for such internal control as management determines is necessary to enable the preparation of consolidated financial statements that are free from material misstatement, whether due to fraud or error.
Auditor’s Responsibility
Our responsibility is to express an opinion on these consolidated financial statements based on our audits. We conducted our audits in accordance with Canadian generally accepted auditing standards. Those standards require that we comply with ethical requirements and plan and perform the audit to obtain reasonable assurance about whether the consolidated financial statements are free from material misstatement.
An audit involves performing procedures to obtain audit evidence about the amounts and disclosures in the consolidated financial statements. The procedures selected depend on the auditor’s judgment, including the assessment of the risks of material misstatement of the consolidated financial statements, whether due to fraud or error. In making those risk assessments, the auditor considers internal control relevant to the entity’s preparation and fair presentation of the consolidated financial statements in order to design audit procedures that are appropriate in the circumstances, but not for the purpose of expressing an opinion on the effectiveness of the entity’s internal control. An audit also includes evaluating the appropriateness of accounting policies used and the reasonableness of accounting estimates made by management, as well as evaluating the overall presentation of the consolidated financial statements.
We believe that the audit evidence we have obtained in our audits is sufficient and appropriate to provide a basis for our audit opinion.
Opinion
In our opinion, the consolidated financial statements present fairly, in all material respects, the financial position of SNC-Lavalin Group Inc. as at December 31, 2017 and December 31, 2016, and its financial performance and its cash flows for the years then ended in accordance with International Financial Reporting Standards.
/s/ Deloitte LLP1 FEBRUARY 21, 2018 MONTREAL, CANADA
(1) CPA auditor, CA, public accountancy permit No. A114871
Independent Auditor’s Report
2017 CONSOLIDATED FINANCIAL STATEMENTS 133
(IN THOUSANDS OF CANADIAN DOLLARS) Note
DECEMBER 31 2017
DECEMBER 31 2016
ASSETS
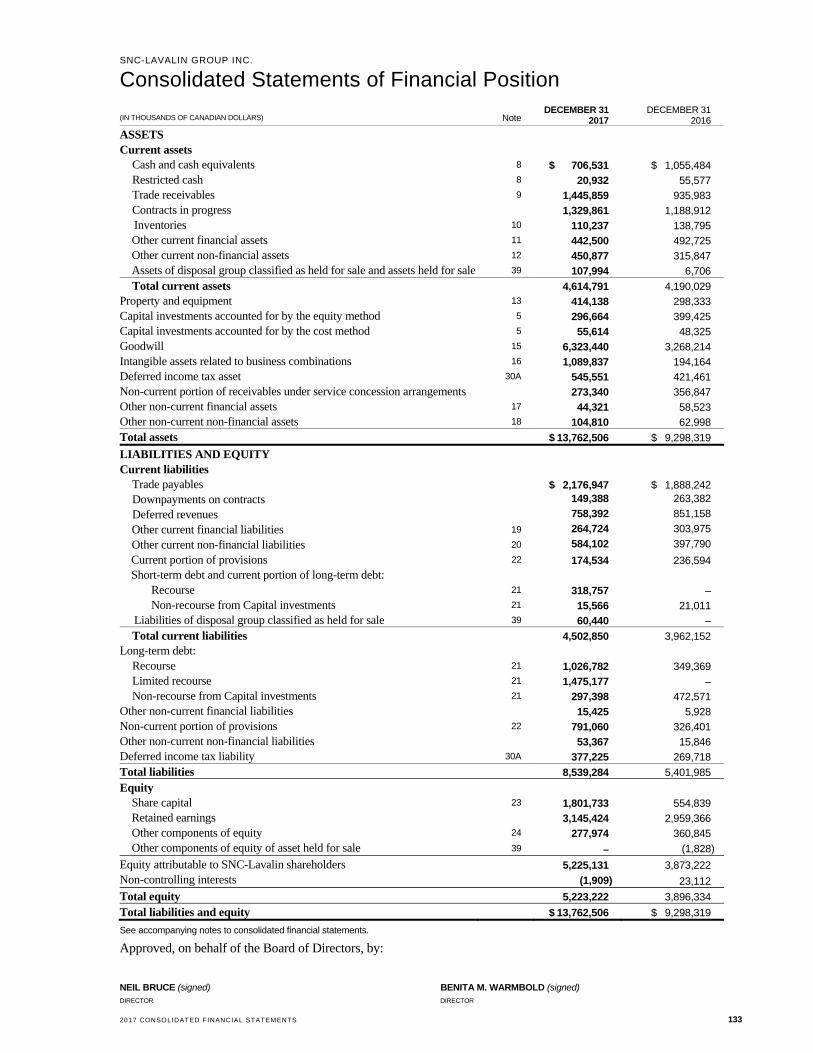
Current assets Cash and cash equivalents 8 $ 706,531 $ 1,055,484 Restricted cash 8 20,932 55,577 Trade receivables 9 1,445,859 935,983 Contracts in progress 1,329,861 1,188,912 Inventories 10 110,237 138,795
Other current financial assets 11 442,500 492,725 Other current non-financial assets 12 450,877 315,847 Assets of disposal group classified as held for sale and assets held for sale 39 107,994 6,706
Total current assets 4,614,791 4,190,029 Property and equipment 13 414,138 298,333 Capital investments accounted for by the equity method 5 296,664 399,425 Capital investments accounted for by the cost method 5 55,614 48,325 Goodwill 15 6,323,440 3,268,214 Intangible assets related to business combinations 16 1,089,837 194,164 Deferred income tax asset 30A 545,551 421,461 Non-current portion of receivables under service concession arrangements 273,340 356,847 Other non-current financial assets 17 44,321 58,523 Other non-current non-financial assets 18 104,810 62,998
Total assets $ 13,762,506 $ 9,298,319
LIABILITIES AND EQUITY
Current liabilities Trade payables $ 2,176,947 $ 1,888,242 Downpayments on contracts 149,388 263,382
Deferred revenues 758,392 851,158
Other current financial liabilities 19 264,724 303,975
Other current non-financial liabilities 20 584,102 397,790
Current portion of provisions 22 174,534 236,594 Short-term debt and current portion of long-term debt: Recourse 21 318,757 – Non-recourse from Capital investments 21 15,566 21,011 Liabilities of disposal group classified as held for sale 39 60,440 –
Total current liabilities 4,502,850 3,962,152 Long-term debt: Recourse 21 1,026,782 349,369 Limited recourse 21 1,475,177 – Non-recourse from Capital investments 21 297,398 472,571 Other non-current financial liabilities 15,425 5,928 Non-current portion of provisions 22 791,060 326,401 Other non-current non-financial liabilities 53,367 15,846 Deferred income tax liability 30A 377,225 269,718
Total liabilities 8,539,284 5,401,985
Equity Share capital 23 1,801,733 554,839 Retained earnings 3,145,424 2,959,366 Other components of equity 24 277,974 360,845 Other components of equity of asset held for sale 39 – (1,828)
Equity attributable to SNC-Lavalin shareholders 5,225,131 3,873,222 Non-controlling interests (1,909) 23,112
Total equity 5,223,222 3,896,334
Total liabilities and equity $ 13,762,506 $ 9,298,319
See accompanying notes to consolidated financial statements.
Approved, on behalf of the Board of Directors, by:
NEIL BRUCE (signed) BENITA M. WARMBOLD (signed) DIRECTOR DIRECTOR
Consolidated Statements of Financial Position SNC-LAVALIN GROUP INC.
134 2017 CONSOLIDATED FINANCIAL STATEMENTS
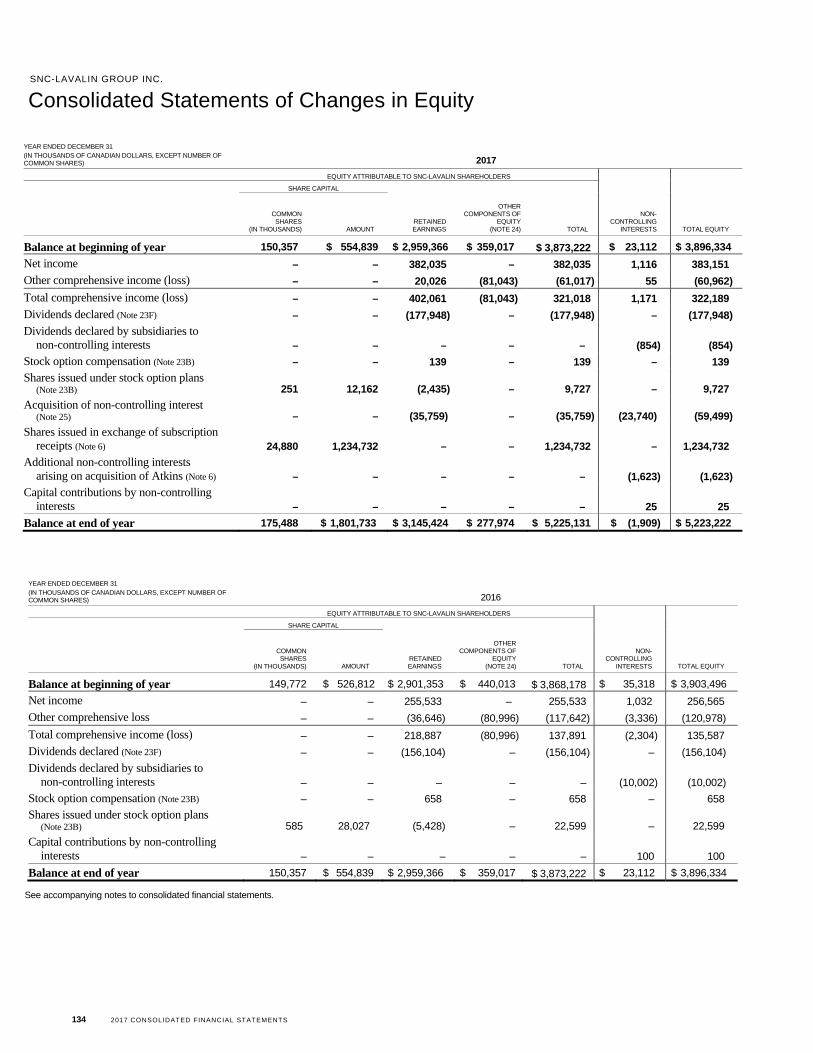
YEAR ENDED DECEMBER 31 (IN THOUSANDS OF CANADIAN DOLLARS, EXCEPT NUMBER OF COMMON SHARES) 2017
EQUITY ATTRIBUTABLE TO SNC-LAVALIN SHAREHOLDERS
SHARE CAPITAL
COMMON SHARES
(IN THOUSANDS) AMOUNT RETAINED EARNINGS
OTHER COMPONENTS OF
EQUITY (NOTE 24) TOTAL
NON-CONTROLLING
INTERESTS TOTAL EQUITY
Balance at beginning of year 150,357 $ 554,839 $ 2,959,366 $ 359,017 $ 3,873,222 $ 23,112 $ 3,896,334
Net income – – 382,035 – 382,035 1,116 383,151
Other comprehensive income (loss) – – 20,026 (81,043) (61,017) 55 (60,962)
Total comprehensive income (loss) – – 402,061 (81,043) 321,018 1,171 322,189
Dividends declared (Note 23F) – – (177,948) – (177,948) – (177,948)
Dividends declared by subsidiaries to non-controlling interests – – – – – (854) (854)
Stock option compensation (Note 23B) – – 139 – 139 – 139
Shares issued under stock option plans (Note 23B) 251 12,162 (2,435) – 9,727 – 9,727
Acquisition of non-controlling interest (Note 25) – – (35,759) – (35,759) (23,740) (59,499)
Shares issued in exchange of subscription receipts (Note 6) 24,880 1,234,732 – – 1,234,732 – 1,234,732
Additional non-controlling interests arising on acquisition of Atkins (Note 6) – – – – – (1,623) (1,623)
Capital contributions by non-controlling interests – – – – – 25 25
Balance at end of year 175,488 $ 1,801,733 $ 3,145,424 $ 277,974 $ 5,225,131 $ (1,909) $ 5,223,222
YEAR ENDED DECEMBER 31 (IN THOUSANDS OF CANADIAN DOLLARS, EXCEPT NUMBER OF COMMON SHARES) 2016
EQUITY ATTRIBUTABLE TO SNC-LAVALIN SHAREHOLDERS
SHARE CAPITAL
COMMON SHARES
(IN THOUSANDS) AMOUNT RETAINED EARNINGS
OTHER COMPONENTS OF
EQUITY (NOTE 24) TOTAL
NON-CONTROLLING
INTERESTS TOTAL EQUITY
Balance at beginning of year 149,772 $ 526,812 $ 2,901,353 $ 440,013 $ 3,868,178 $ 35,318 $ 3,903,496
Net income – – 255,533 – 255,533 1,032 256,565
Other comprehensive loss – – (36,646) (80,996) (117,642) (3,336) (120,978)
Total comprehensive income (loss) – – 218,887 (80,996) 137,891 (2,304) 135,587
Dividends declared (Note 23F) – – (156,104) – (156,104) – (156,104)
Dividends declared by subsidiaries to non-controlling interests – – – – – (10,002) (10,002)
Stock option compensation (Note 23B) – – 658 – 658 – 658
Shares issued under stock option plans (Note 23B) 585 28,027 (5,428) – 22,599 – 22,599
Capital contributions by non-controlling interests – – – – – 100 100
Balance at end of year 150,357 $ 554,839 $ 2,959,366 $ 359,017 $ 3,873,222 $ 23,112 $ 3,896,334
See accompanying notes to consolidated financial statements.
Consolidated Statements of Changes in Equity SNC-LAVALIN GROUP INC.
2017 CONSOLIDATED FINANCIAL STATEMENTS 135
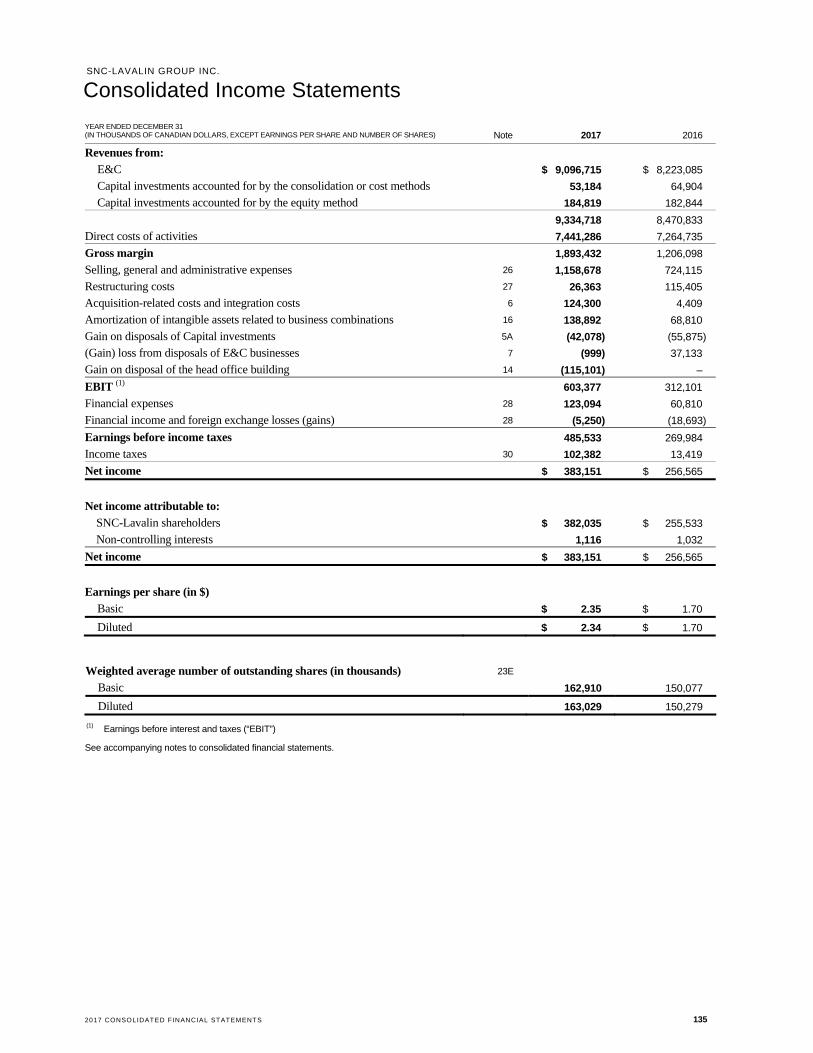
YEAR ENDED DECEMBER 31 (IN THOUSANDS OF CANADIAN DOLLARS, EXCEPT EARNINGS PER SHARE AND NUMBER OF SHARES) Note 2017 2016
Revenues from:
E&C $ 9,096,715 $ 8,223,085
Capital investments accounted for by the consolidation or cost methods 53,184 64,904
Capital investments accounted for by the equity method 184,819 182,844
9,334,718 8,470,833
Direct costs of activities 7,441,286 7,264,735
Gross margin 1,893,432 1,206,098
Selling, general and administrative expenses 26 1,158,678 724,115
Restructuring costs 27 26,363 115,405
Acquisition-related costs and integration costs 6 124,300 4,409
Amortization of intangible assets related to business combinations 16 138,892 68,810
Gain on disposals of Capital investments 5A (42,078) (55,875)
(Gain) loss from disposals of E&C businesses 7 (999) 37,133
Gain on disposal of the head office building 14 (115,101) –
EBIT (1) 603,377 312,101
Financial expenses 28 123,094 60,810
Financial income and foreign exchange losses (gains) 28 (5,250) (18,693)
Earnings before income taxes 485,533 269,984
Income taxes 30 102,382 13,419
Net income $ 383,151 $ 256,565
Net income attributable to:
SNC-Lavalin shareholders $ 382,035 $ 255,533
Non-controlling interests 1,116 1,032
Net income $ 383,151 $ 256,565
Earnings per share (in $)
Basic $ 2.35 $ 1.70
Diluted $ 2.34 $ 1.70
Weighted average number of outstanding shares (in thousands) 23E
Basic 162,910 150,077
Diluted 163,029 150,279
(1) Earnings before interest and taxes (“EBIT”)
See accompanying notes to consolidated financial statements.
Consolidated Income Statements SNC-LAVALIN GROUP INC.
136 2017 CONSOLIDATED FINANCIAL STATEMENTS
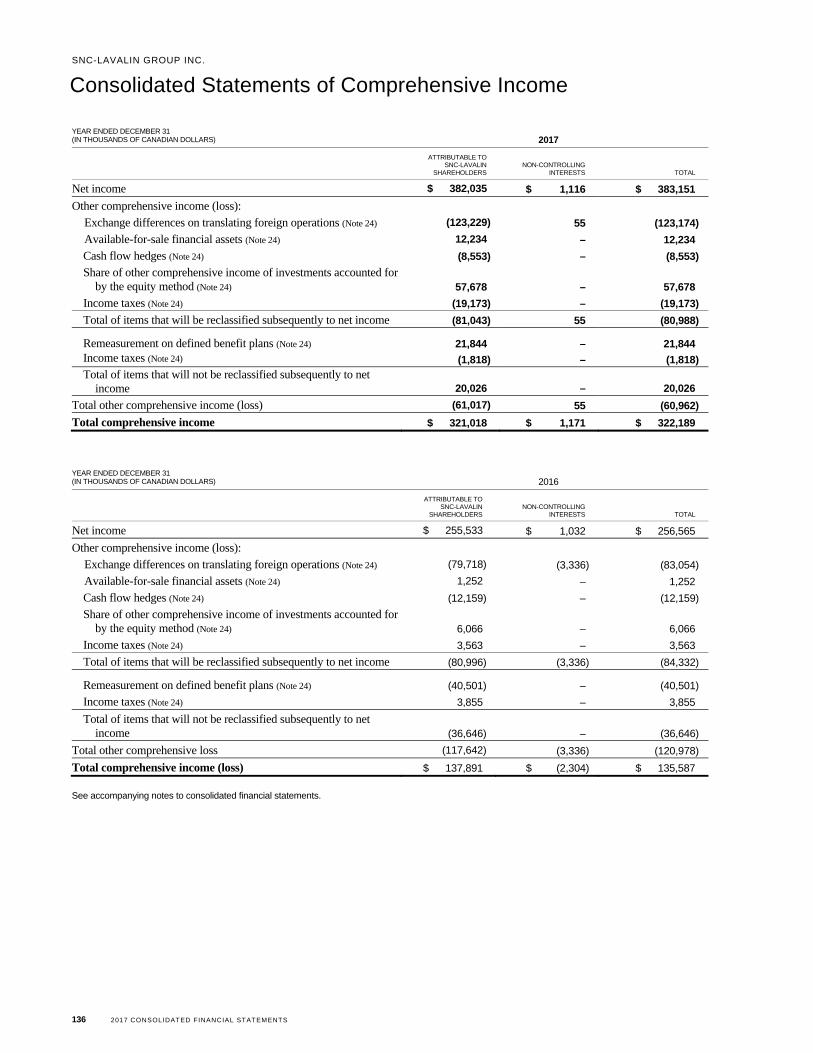
YEAR ENDED DECEMBER 31 (IN THOUSANDS OF CANADIAN DOLLARS) 2017
ATTRIBUTABLE TO SNC-LAVALIN
SHAREHOLDERS NON-CONTROLLING
INTERESTS TOTAL
Net income $ 382,035 $ 1,116 $ 383,151
Other comprehensive income (loss):
Exchange differences on translating foreign operations (Note 24) (123,229) 55 (123,174)
Available-for-sale financial assets (Note 24) 12,234 – 12,234
Cash flow hedges (Note 24) (8,553) – (8,553)
Share of other comprehensive income of investments accounted for by the equity method (Note 24) 57,678 – 57,678
Income taxes (Note 24) (19,173) – (19,173)
Total of items that will be reclassified subsequently to net income (81,043) 55 (80,988)
Remeasurement on defined benefit plans (Note 24) 21,844 – 21,844 Income taxes (Note 24) (1,818) – (1,818)
Total of items that will not be reclassified subsequently to net income 20,026 – 20,026
Total other comprehensive income (loss) (61,017) 55 (60,962)
Total comprehensive income $ 321,018 $ 1,171 $ 322,189
YEAR ENDED DECEMBER 31 (IN THOUSANDS OF CANADIAN DOLLARS) 2016
ATTRIBUTABLE TO SNC-LAVALIN
SHAREHOLDERS NON-CONTROLLING
INTERESTS TOTAL
Net income $ 255,533 $ 1,032 $ 256,565
Other comprehensive income (loss):
Exchange differences on translating foreign operations (Note 24) (79,718) (3,336) (83,054)
Available-for-sale financial assets (Note 24) 1,252 – 1,252
Cash flow hedges (Note 24) (12,159) – (12,159)
Share of other comprehensive income of investments accounted for by the equity method (Note 24) 6,066 – 6,066
Income taxes (Note 24) 3,563 – 3,563
Total of items that will be reclassified subsequently to net income (80,996) (3,336) (84,332)
Remeasurement on defined benefit plans (Note 24) (40,501) – (40,501)
Income taxes (Note 24) 3,855 – 3,855
Total of items that will not be reclassified subsequently to net income (36,646) – (36,646)
Total other comprehensive loss (117,642) (3,336) (120,978)
Total comprehensive income (loss) $ 137,891 $ (2,304) $ 135,587
See accompanying notes to consolidated financial statements.
Consolidated Statements of Comprehensive Income SNC-LAVALIN GROUP INC.
2017 CONSOLIDATED FINANCIAL STATEMENTS 137
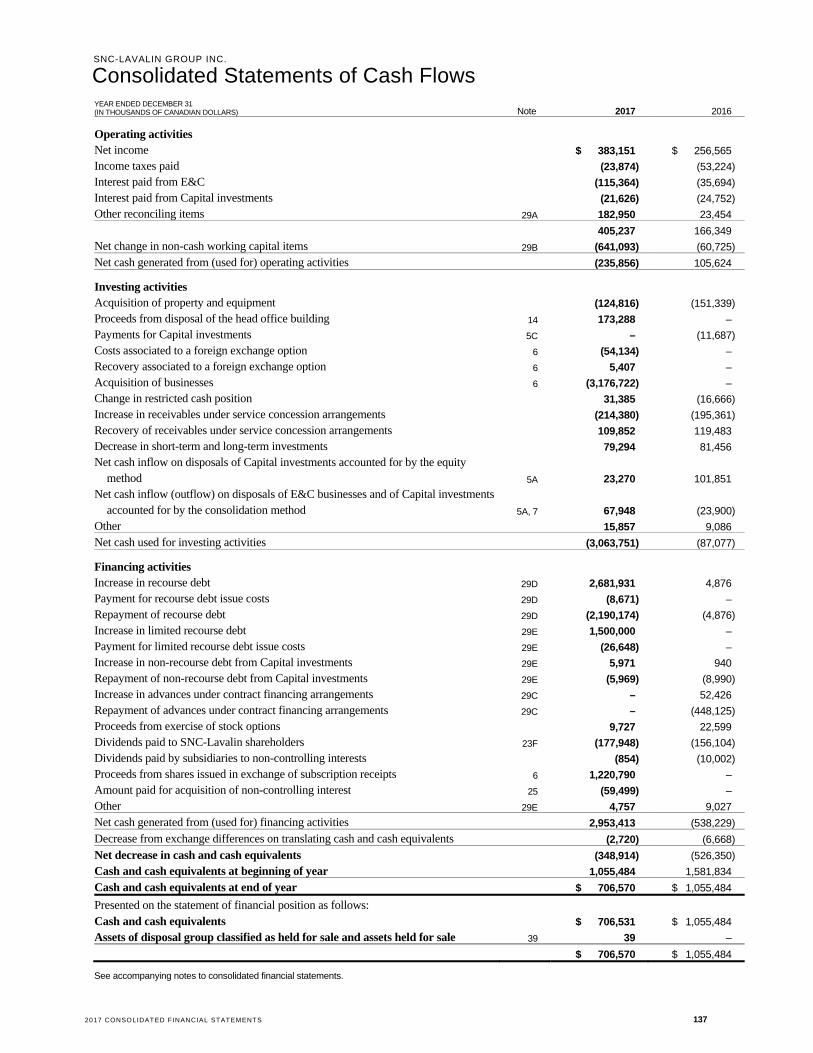
YEAR ENDED DECEMBER 31 (IN THOUSANDS OF CANADIAN DOLLARS) Note 2017 2016
Operating activities
Net income $ 383,151 $ 256,565
Income taxes paid (23,874) (53,224)
Interest paid from E&C (115,364) (35,694)
Interest paid from Capital investments (21,626) (24,752)
Other reconciling items 29A 182,950 23,454
405,237 166,349
Net change in non-cash working capital items 29B (641,093) (60,725)
Net cash generated from (used for) operating activities (235,856) 105,624
Investing activities
Acquisition of property and equipment (124,816) (151,339)
Proceeds from disposal of the head office building 14 173,288 –
Payments for Capital investments 5C – (11,687)
Costs associated to a foreign exchange option 6 (54,134) –
Recovery associated to a foreign exchange option 6 5,407 –
Acquisition of businesses 6 (3,176,722) –
Change in restricted cash position 31,385 (16,666)
Increase in receivables under service concession arrangements (214,380) (195,361)
Recovery of receivables under service concession arrangements 109,852 119,483
Decrease in short-term and long-term investments 79,294 81,456
Net cash inflow on disposals of Capital investments accounted for by the equity method 5A 23,270 101,851
Net cash inflow (outflow) on disposals of E&C businesses and of Capital investments accounted for by the consolidation method 5A, 7 67,948 (23,900)
Other 15,857 9,086
Net cash used for investing activities (3,063,751) (87,077)
Financing activities
Increase in recourse debt 29D 2,681,931 4,876
Payment for recourse debt issue costs 29D (8,671) –
Repayment of recourse debt 29D (2,190,174) (4,876)
Increase in limited recourse debt 29E 1,500,000 –
Payment for limited recourse debt issue costs 29E (26,648) –
Increase in non-recourse debt from Capital investments 29E 5,971 940
Repayment of non-recourse debt from Capital investments 29E (5,969) (8,990)
Increase in advances under contract financing arrangements 29C – 52,426
Repayment of advances under contract financing arrangements 29C – (448,125)
Proceeds from exercise of stock options 9,727 22,599
Dividends paid to SNC-Lavalin shareholders 23F (177,948) (156,104)
Dividends paid by subsidiaries to non-controlling interests (854) (10,002)
Proceeds from shares issued in exchange of subscription receipts 6 1,220,790 –
Amount paid for acquisition of non-controlling interest 25 (59,499) –
Other 29E 4,757 9,027
Net cash generated from (used for) financing activities 2,953,413 (538,229)
Decrease from exchange differences on translating cash and cash equivalents (2,720) (6,668)
Net decrease in cash and cash equivalents (348,914) (526,350)
Cash and cash equivalents at beginning of year 1,055,484 1,581,834
Cash and cash equivalents at end of year $ 706,570 $ 1,055,484
Presented on the statement of financial position as follows:
Cash and cash equivalents $ 706,531 $ 1,055,484
Assets of disposal group classified as held for sale and assets held for sale 39 39 –
$ 706,570 $ 1,055,484
See accompanying notes to consolidated financial statements.
Consolidated Statements of Cash Flows SNC-LAVALIN GROUP INC.
138 NOTES TO 2017 CONSOLIDATED FINANCIAL STATEMENTS
NOTE ...................................................................................................................................................................................... PAGE
1. DESCRIPTION OF BUSINESS ..................................................................................................................................... 139
2. SUMMARY OF SIGNIFICANT ACCOUNTING POLICIES ..................................................................................... 139
3. CRITICAL ACCOUNTING JUDGMENTS AND KEY SOURCES OF ESTIMATION UNCERTAINTY ............. 154
4. SEGMENT DISCLOSURES ........................................................................................................................................... 156
5. CAPITAL INVESTMENTS ............................................................................................................................................ 161
6. BUSINESS COMBINATIONS ....................................................................................................................................... 169
7. DISPOSALS OF E&C BUSINESSES AND MAYOTTE AIRPORT .......................................................................... 173
8. CASH AND CASH EQUIVALENTS AND RESTRICTED CASH ............................................................................. 175
9. TRADE RECEIVABLES ................................................................................................................................................ 175
10. INVENTORIES ............................................................................................................................................................... 175
11. OTHER CURRENT FINANCIAL ASSETS .................................................................................................................. 176
12. OTHER CURRENT NON-FINANCIAL ASSETS ........................................................................................................ 176
13. PROPERTY AND EQUIPMENT ................................................................................................................................... 176
14. DISPOSAL OF THE HEAD OFFICE BUILDING ....................................................................................................... 177
15. GOODWILL .................................................................................................................................................................... 177
16. INTANGIBLE ASSETS RELATED TO BUSINESS COMBINATIONS ................................................................... 178
17. OTHER NON-CURRENT FINANCIAL ASSETS ........................................................................................................ 179
18. OTHER NON-CURRENT NON-FINANCIAL ASSETS ............................................................................................. 179
19. OTHER CURRENT FINANCIAL LIABILITIES ......................................................................................................... 179
20. OTHER CURRENT NON-FINANCIAL LIABILITIES ............................................................................................... 179
21. SHORT-TERM DEBT AND LONG-TERM DEBT ...................................................................................................... 179
22. PROVISIONS .................................................................................................................................................................. 182
23. SHARE CAPITAL ........................................................................................................................................................... 183
24. OTHER COMPONENTS OF EQUITY.......................................................................................................................... 186
25. ACQUISITION OF NON-CONTROLLING INTEREST ............................................................................................. 188
26. SELLING, GENERAL AND ADMINISTRATIVE EXPENSES ................................................................................. 188
27. RESTRUCTURING COSTS ........................................................................................................................................... 188
28. NET FINANCIAL EXPENSES ...................................................................................................................................... 189
29. STATEMENTS OF CASH FLOWS ............................................................................................................................... 189
30. INCOME TAXES ............................................................................................................................................................ 192
31. FINANCIAL INSTRUMENTS ....................................................................................................................................... 195
32. CAPITAL MANAGEMENT ........................................................................................................................................... 201
33. PENSION PLANS, OTHER LONG-TERM BENEFITS AND OTHER POST-EMPLOYMENT BENEFITS ......... 202
34. CONTINGENT LIABILITIES ........................................................................................................................................ 207
35. OPERATING LEASE ARRANGEMENTS ................................................................................................................... 211
36. REMUNERATION .......................................................................................................................................................... 212
37. RELATED PARTY TRANSACTIONS ......................................................................................................................... 213
38. SUBSIDIARIES, JOINT ARRANGEMENTS AND ASSOCIATES ........................................................................... 214
39. DISPOSAL GROUP AND NON-CURRENT ASSETS CLASSIFIED AS HELD FOR SALE ................................. 216
Notes to Consolidated Financial Statements
SNC-LAVALIN GROUP INC.
NOTES TO 2017 CONSOLIDATED FINANCIAL STATEMENTS 139
1. DESCRIPTION OF BUSINESS
SNC-Lavalin Group Inc. is incorporated under the Canada Business Corporations Act and has its registered office at 455 René-Lévesque Boulevard West, Montreal, Quebec, Canada H2Z 1Z3. SNC-Lavalin Group Inc. is a public company listed on the Toronto Stock Exchange in Canada. Reference to the “Company” or to “SNC-Lavalin” means, as the context may require, SNC-Lavalin Group Inc. and all or some of its subsidiaries or joint arrangements, or SNC-Lavalin Group Inc. or one or more of its subsidiaries or joint arrangements.
The Company provides consulting, design, engineering, construction as well as sustaining capital and operations and maintenance expertise, which together are referred to as “E&C”, through its network of offices in over 50 countries, and is currently working on projects around the world. SNC-Lavalin also makes select investments that are complementary to its other activities, which are referred to as “Capital investments” or “Capital” in these financial statements.
The Company reports its revenues as follows:
E&C includes contracts generating revenues related to consulting, design, engineering, construction, sustaining capital and Operations & Maintenace (“O&M”) activities. Such activities include, among others, Engineering, Procurement and Construction (“EPC”), Engineering, Procurement and Construction Management (“EPCM”), and O&M contracts.
Capital investments include SNC-Lavalin’s investments in infrastructure concessions for public services or in certain other long-term assets.
In these consolidated financial statements (“financial statements”), activities from consulting and advisory, engineering and construction, sustaining capital and operations and maintenance expertise are collectively referred to as “from E&C” or “excluding Capital investments” to distinguish them from activities related to the Capital investments.
2. SUMMARY OF SIGNIFICANT ACCOUNTING POLICIES
A) BASIS OF PREPARATION
The Company’s financial statements have been prepared in accordance with International Financial Reporting Standards (“IFRS”) issued and effective for the year ended December 31, 2017, and are presented in Canadian dollars. All values are rounded to the nearest thousand dollars, except where otherwise indicated.
The IFRS accounting policies set out below were consistently applied to all periods presented.
The preparation of financial statements in conformity with IFRS requires the use of certain critical accounting estimates. It also requires management to exercise its judgment in the process of applying the Company’s accounting policies. The areas involving a higher degree of judgment or complexity, or areas where assumptions and estimates are significant are disclosed in Note 3.
The Company’s financial statements have been prepared on the historical cost basis, with the exception of i) certain financial instruments, derivative financial instruments and liabilities for share unit plans, which are measured at fair value; ii) the defined benefit liabilities, which are measured as the net total of the present value of the defined benefit obligation minus the fair value of plan assets; and iii) investments measured at fair value, which are held by SNC-Lavalin Infrastructure Partners LP, an investment entity accounted for by the equity method and for which SNC-Lavalin elected to retain the fair value measurement applied by that investment entity (see Note 5A). Historical cost generally represents the fair value of consideration given in exchange for assets upon initial recognition.
Fair value is the price that would be received to sell an asset or paid to transfer a liability in an orderly transaction between market participants at the measurement date, regardless of whether that price is directly observable or estimated using another valuation technique. In estimating the fair value of an asset or a liability, the Company takes into account the characteristics of the asset or liability if market participants would take those characteristics into account when pricing the asset or liability at the measurement date. Fair value for measurement and/or disclosure purposes in these consolidated financial statements is determined on such a basis, except for share-based payment transactions that are within the scope of IFRS 2, Share-based Payment, and measurements that have some similarities to fair value but are not fair value, such as net realisable value in IAS 2, Inventories, or value in use in IAS 36, Impairment of Assets.
The Company’s financial statements were authorized for issue by the Board of Directors on February 21, 2018.
Notes to Consolidated Financial Statements (ALL TABULAR FIGURES IN THOUSANDS OF CANADIAN DOLLARS, UNLESS OTHERWISE INDICATED)
140 NOTES TO 2017 CONSOLIDATED FINANCIAL STATEMENTS
2. SUMMARY OF SIGNIFICANT ACCOUNTING POLICIES (CONTINUED)
B) CHANGE IN AN ACCOUNTING POLICY
In 2017, the Company updated its definition of the segment EBIT, which now excludes the gain on disposal of the head office building (see Note 14). This change in the definition was made to take into consideration a transaction that took place in 2017. This change in the definition did not have any impact on the Company’s financial statements, other than on its segment disclosures, and was made in accordance with IAS 8, Accounting Policies, Changes in Accounting Estimates and Errors.
C) CHANGE IN PRESENTATION
In 2017, the Company combined the financial results of its Infrastructure & Construction and Operations & Maintenance sub-segments, which were previously presented separately as additional information of the Infrastructure segment. The combination mainly comes from the disposal of a significant portion of the Operations & Maintenance sub-segment in 2016, which decreased the level of activities of the Operations & Maintenance sub-segment. As a result of the combination, comparative figures have been adjusted, with no impact on the Infrastructure segmented results.
D) NEW ACCOUNTING POLICY ADOPTED IN 2017
As a result of the disposal of the Company’s head office building in 2017, as detailed in Note 14, the Company adopted a new accounting policy applicable to sale and leaseback transactions, which is as follows:
A sale and leaseback transaction involves the sale of an asset by the Company and the leasing back of the same asset from the buyer.
Where a sale and leaseback transaction results in a finance lease, any excess of sales proceeds over the carrying amount is not immediately recognized as income by a seller-lessee. Instead, it is deferred and amortized over the lease term.
Where a leaseback transaction results in an operating lease:
if the sale price of the asset is at fair value, the gain or loss from the sale is recognized immediately in the Company’s income statement;
if the sale price of the asset is above fair value, the excess over fair value is deferred and amortized over the period for which the asset is expected to be used; and
if the sale price of the asset is below fair value, any gain or loss is recognized immediately in the Company’s income statement except that, if the loss is compensated for by future lease payments at below market price, it is deferred and amortized in proportion to the lease payments over the period for which the asset is expected to be used.
E) AMENDMENTS ADOPTED IN 2017
The following amendments to existing standards have been adopted by the Company on January 1, 2017:
Disclosure Initiative (Amendments to IAS 7, Statement of Cash Flows) require disclosures of information enabling users of financial statements to evaluate changes in liabilities arising from financing activities.
Amendments to IFRS 12, Disclosure of Interests in Other Entities, clarify the scope of the standard by specifying that the disclosure requirements in the standard, except for summarized financial information for subsidiaries, joint ventures and associates, apply to an entity’s interests in subsidiaries, joint arrangements, associates and unconsolidated structured entities that are classified as held for sale, as held for distribution or as discontinued operations in accordance with IFRS 5, Non-current Assets Held for Sale and Discontinued Operations.
The adoption of the amendments listed above did not have any impact on the Company’s financial statements, other than on its disclosures of the financial information related to the statement of cash flows (see Note 29E).
F) STANDARDS, AMENDMENTS AND INTERPRETATION ISSUED TO BE ADOPTED AT A LATER DATE
The following standards, amendments to standards and an interpretation have been issued and are applicable to the Company for its annual periods beginning on January 1, 2018 and thereafter, with an earlier application permitted:
IFRS 9, Financial Instruments, (“IFRS 9”) covers mainly: i) the classification and measurement of financial assets and financial liabilities; ii) the new impairment model for the recognition of expected credit losses; and iii) the new hedge accounting model. Refer to considerations for the implementation of IFRS 9 and IFRS 15 below for more information.
NOTES TO 2017 CONSOLIDATED FINANCIAL STATEMENTS 141
2. SUMMARY OF SIGNIFICANT ACCOUNTING POLICIES (CONTINUED)
IFRS 15, Revenue from Contracts with Customers, (“IFRS 15”) outlines a single comprehensive model for entities to use in accounting for revenue arising from contracts with customers. It will supersede current revenue recognition guidance including IAS 18, Revenue, IAS 11, Construction Contracts, and related Interpretations. Refer to considerations for the implementation of IFRS 9 and IFRS 15 below for more information.
Amendments to IFRS 15 clarify how to: i) identify a performance obligation in a contract; ii) determine whether a company is a principal or an agent; and iii) determine whether the revenue from granting a license should be recognized at a point in time or over time. In addition, the amendments to IFRS 15 include two additional transition reliefs.
Amendments to IFRS 2, Share-based Payment, provide requirements on the accounting for: i) the effects of vesting and non-vesting conditions on the measurement of cash-settled share-based payments; ii) share-based payment transactions with a net settlement feature for withholding tax obligations; and iii) a modification to the terms and conditions of a share-based payment that changes the classification of a transaction from cash-settled to equity-settled.
Amendments to IAS 28, Investments in Associates and Joint Ventures, clarify that the election to measure at fair value through profit or loss an investment in an associate or a joint venture that is held by an entity that is a venture capital organisation, or other qualifying entity, is available for each investment in an associate or joint venture on an investment-by-investment basis, upon initial recognition.
IFRIC Interpretation 22, Foreign Currency Transactions and Advance Consideration, clarifies that: i) the date of the transaction, for the purpose of determining the exchange rate, is the date of initial recognition of the non-monetary prepayment asset and deferred income liability; and ii) if there are multiple payments or receipts in advance, a date of transaction is established for each payment or receipt.
Transfers of Investment Property (Amendments to IAS 40, Investment Property) state that an entity shall transfer a property to, or from, investment property when, and only when, there is an evidence of a change in use. A change in use occurs if property meets, or ceases to meet, the definition of investment property. A change in management’s intentions for the use of a property by itself does not constitute evidence of a change in use.
The following standard has been issued and is applicable to the Company for its annual periods beginning on January 1, 2019 and thereafter, with an earlier application permitted for entities that have also adopted IFRS 15:
IFRS 16, Leases, provides a comprehensive model for the identification of lease arrangements and their treatment in the financial statements of both lessees and lessors. It will supersede IAS 17, Leases, and its associated interpretative guidance.
The following amendments to standards have been issued and are applicable to the Company for its annual periods beginning on January 1, 2019 and thereafter, with an earlier application permitted:
Prepayment Features with Negative Compensation (Amendments to IFRS 9, Financial Instruments) allow financial assets with a prepayment option that could result in the option’s holder receiving compensation for early termination to meet the solely payments of principal and interest condition if specified criteria are met.
Long-term Interests in Associates and Joint Ventures (Amendments to IAS 28, Investments in Associates and Joint Ventures) clarify that an entity applies IFRS 9, including its impairment requirements, to long-term interests in an associate or joint venture that form part of the net investment in the associate or joint venture but to which the equity method is not applied.
Amendments to IFRS 3, Business Combinations, state that an entity shall remeasure its previously held interest in a joint operation when it obtains control of the business.
Amendments to IFRS 11, Joint Arrangements, state that an entity shall not remeasure its previously held interest in a joint operation when it obtains joint control of the business.
Amendments to IAS 12, Income Taxes, clarify that all income tax consequences of dividends (i.e., distribution of profits) should be recognized in profit or loss, regardless of how the tax arises.
Amendments to IAS 23, Borrowing Costs, clarify that if any specific borrowing remains outstanding after the related asset is ready for its intended use or sale, that borrowing becomes part of the funds that an entity borrows generally when calculating the capitalization rate on general borrowings.
142 NOTES TO 2017 CONSOLIDATED FINANCIAL STATEMENTS
2. SUMMARY OF SIGNIFICANT ACCOUNTING POLICIES (CONTINUED)
Plan Amendment, Curtailment or Settlement (Amendments to IAS 19, Employee Benefits) specifies how an entity determines pension expenses when changes to a defined benefit pension plan occur. When a change to a plan – an amendment, curtailment or settlement – takes place, IAS 19 requires an entity to remeasure its net defined benefit liability or asset. The amendments require an entity to use the updated assumptions from this remeasurement to determine current service cost and net interest for the remainder of the reporting period after the change to the plan.
The Company is currently evaluating the impact of adopting these standards, amendments and interpretation on its financial statements.
Considerations for the implementation of IFRS 9 and IFRS 15
IFRS 9 and IFRS 15 are applicable for annual reporting periods beginning on or after January 1, 2018.
IFRS 9
IFRS 9 is applicable retrospectively in accordance with IAS 8, Accounting Policies, Changes in Accounting Estimates and Errors, subject to certain exemptions and exceptions. In general, the main changes introduced by IFRS 9 are related to the classification and measurement of financial assets, the introduction of a new impairment model based on expected credit losses (rather than incurred losses as per IAS 39, Financial Instruments: Recognition and Measurement) and hedge accounting. Although the methodology related to the classification of financial assets will change, the Company expects that most of its financial assets currently classified as “loans and receivables” and measured at amortized cost (approximately $2.1 billion as at December 31, 2017) will be classified as “financial assets subsequently measured at amortized cost”. Excluding the potential impact from the change in the impairment model applicable to these financial assets, which is currently being analyzed (see below), the Company does not expect any significant impact on their measurement. Furthermore, the Company had $55.1 million of investments in equity instruments classified as “available-for-sale” as at December 31, 2017 which will be classified as financial assets subsequently measured at fair value through profit or loss or designated at fair value through other comprehensive income upon transition to IFRS 9. The Company does not expect any significant impact from the classification of its financial liabilities.
The Company is currently evaluating the impact of determining the amount of impairment of certain financial assets based on the expected credit loss model. While the Company had approximately $164 million of allowance for doubtful accounts on its trade receivables as at December 31, 2017, most of this allowance was related to commercial reasons, such as balances being disputed or subject to negotiation, rather than credit risk. The Company also has reserves on its contract in progress amounts, but most of these reserves are also due to commercial reasons rather than credit risk.
As permitted by IFRS 9, the Company will continue to apply the requirements contained in IAS 39 for hedge accounting.
Upon adoption of IFRS 9, the Company expects to apply the exemption from the requirement to restate comparative information. Therefore, differences between the previous carrying amounts and the carrying amounts at the date of initial application, if any, will be recognized in the opening balance of retained earnings or other components of equity, as appropriate, as at January 1, 2018.
The Company is currently assessing the impact of the change on its financial systems, internal controls and policies and procedures related to the adoption of IFRS 9.
IFRS 15
IFRS 15 introduces a 5-step model to revenue recognition on contracts with customers. Such model requires to: 1) identify the contract with the customer; 2) identify the performance obligations related to that contract; 3) determine the transaction price of the contract; 4) allocate such transaction price between the performance obligations; and 5) recognize revenue when (or as) performance obligation is satisfied. In addition to recognition and measurement, IFRS 15 also provides new requirements on presentation and disclosures.
Transition considerations
IFRS 15 can be applied using one of the following two methods: retrospectively to each prior reporting period presented in accordance with IAS 8, Accounting Policies, Changes in Accounting Estimates and Errors, or retrospectively with the cumulative effect of initially applying IFRS 15 recognized in opening retained earnings at the date of initial application (the “modified retrospective method”). The Company decided to adopt IFRS 15 using the modified retrospective method, with recognition of transitional adjustments in retained earnings on the date of initial application (January 1, 2018), without restatement of comparative figures.
NOTES TO 2017 CONSOLIDATED FINANCIAL STATEMENTS 143
2. SUMMARY OF SIGNIFICANT ACCOUNTING POLICIES (CONTINUED)
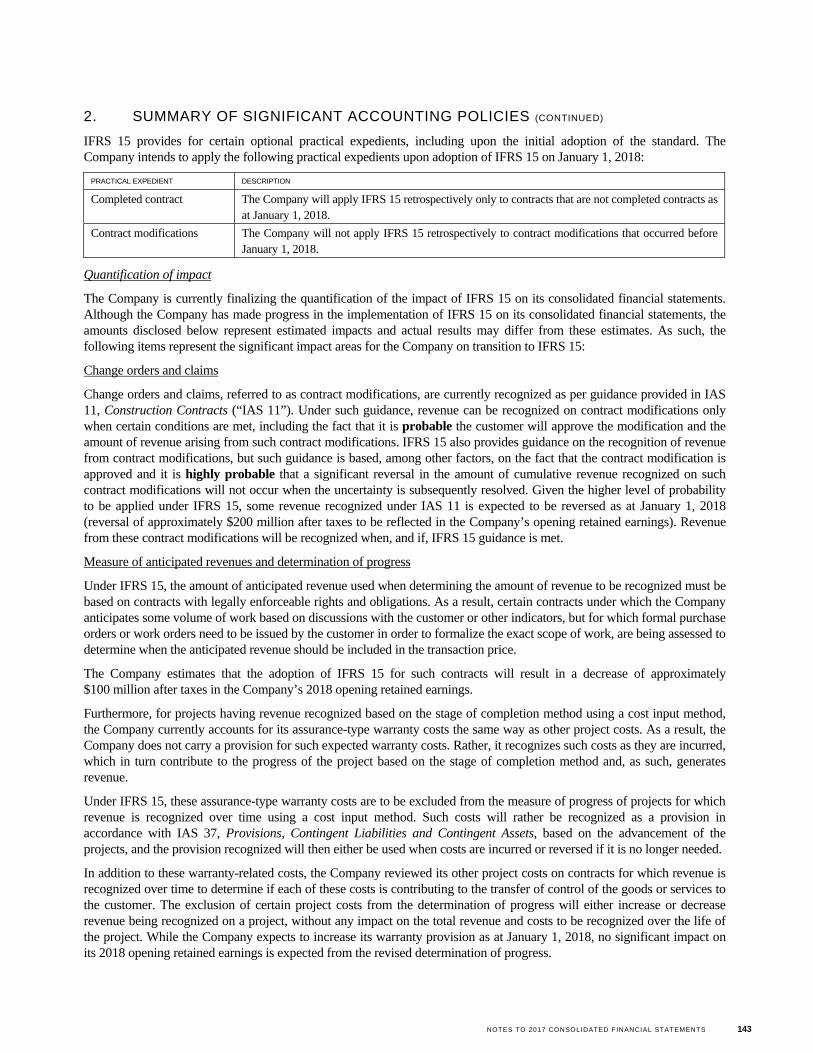
IFRS 15 provides for certain optional practical expedients, including upon the initial adoption of the standard. The Company intends to apply the following practical expedients upon adoption of IFRS 15 on January 1, 2018:
PRACTICAL EXPEDIENT DESCRIPTION
Completed contract The Company will apply IFRS 15 retrospectively only to contracts that are not completed contracts as at January 1, 2018.
Contract modifications The Company will not apply IFRS 15 retrospectively to contract modifications that occurred before January 1, 2018.
Quantification of impact
The Company is currently finalizing the quantification of the impact of IFRS 15 on its consolidated financial statements. Although the Company has made progress in the implementation of IFRS 15 on its consolidated financial statements, the amounts disclosed below represent estimated impacts and actual results may differ from these estimates. As such, the following items represent the significant impact areas for the Company on transition to IFRS 15:
Change orders and claims
Change orders and claims, referred to as contract modifications, are currently recognized as per guidance provided in IAS 11, Construction Contracts (“IAS 11”). Under such guidance, revenue can be recognized on contract modifications only when certain conditions are met, including the fact that it is probable the customer will approve the modification and the amount of revenue arising from such contract modifications. IFRS 15 also provides guidance on the recognition of revenue from contract modifications, but such guidance is based, among other factors, on the fact that the contract modification is approved and it is highly probable that a significant reversal in the amount of cumulative revenue recognized on such contract modifications will not occur when the uncertainty is subsequently resolved. Given the higher level of probability to be applied under IFRS 15, some revenue recognized under IAS 11 is expected to be reversed as at January 1, 2018 (reversal of approximately $200 million after taxes to be reflected in the Company’s opening retained earnings). Revenue from these contract modifications will be recognized when, and if, IFRS 15 guidance is met.
Measure of anticipated revenues and determination of progress
Under IFRS 15, the amount of anticipated revenue used when determining the amount of revenue to be recognized must be based on contracts with legally enforceable rights and obligations. As a result, certain contracts under which the Company anticipates some volume of work based on discussions with the customer or other indicators, but for which formal purchase orders or work orders need to be issued by the customer in order to formalize the exact scope of work, are being assessed to determine when the anticipated revenue should be included in the transaction price.
The Company estimates that the adoption of IFRS 15 for such contracts will result in a decrease of approximately $100 million after taxes in the Company’s 2018 opening retained earnings.
Furthermore, for projects having revenue recognized based on the stage of completion method using a cost input method, the Company currently accounts for its assurance-type warranty costs the same way as other project costs. As a result, the Company does not carry a provision for such expected warranty costs. Rather, it recognizes such costs as they are incurred, which in turn contribute to the progress of the project based on the stage of completion method and, as such, generates revenue.
Under IFRS 15, these assurance-type warranty costs are to be excluded from the measure of progress of projects for which revenue is recognized over time using a cost input method. Such costs will rather be recognized as a provision in accordance with IAS 37, Provisions, Contingent Liabilities and Contingent Assets, based on the advancement of the projects, and the provision recognized will then either be used when costs are incurred or reversed if it is no longer needed.
In addition to these warranty-related costs, the Company reviewed its other project costs on contracts for which revenue is recognized over time to determine if each of these costs is contributing to the transfer of control of the goods or services to the customer. The exclusion of certain project costs from the determination of progress will either increase or decrease revenue being recognized on a project, without any impact on the total revenue and costs to be recognized over the life of the project. While the Company expects to increase its warranty provision as at January 1, 2018, no significant impact on its 2018 opening retained earnings is expected from the revised determination of progress.
144 NOTES TO 2017 CONSOLIDATED FINANCIAL STATEMENTS
2. SUMMARY OF SIGNIFICANT ACCOUNTING POLICIES (CONTINUED)
Presentation and disclosures
In accordance with IFRS 15, the Company will change its presentation of contract-related assets and liabilities. As such, the Company will present its contract balances, on a contract-by-contract basis, in a net contract asset or liability position, separately from its accounts receivable. Contract assets and accounts receivable are both rights to consideration in exchange for goods or services that the Company has transferred to a customer, however the classification depends on whether such right is only conditional on the passage of time (accounts receivable) or if it is also conditional on something else (contract assets), such as the satisfaction of further performance obligations under the contract. A contract liability is the amount received by the Company that exceeds the right to consideration resulting from the Company’s performance under a given contract.
As previously mentioned, the Company will adopt IFRS 15 using the modified retrospective method, without restatement of the comparative figures. In addition to the new disclosure requirements under IFRS 15, the Company will also disclose the amount by which each financial statement line item is affected in the reporting period by the application of IFRS 15 as compared with the previous standards, as well as an explanation of the reasons for significant changes identified in IFRS 15.
Procedures and controls
The Company has updated and is finalizing the implementation of revised procedures and controls in order to meet the requirements of IFRS 15, notably the recording of the transition adjustment and the change in presentation to be reported in the Company’s unaudited consolidated financial statements for the three-month period ended March 31, 2018, as well as additional disclosures to be provided in the Company’s 2018 audited annual consolidated financial statements.
G) BASIS OF CONSOLIDATION
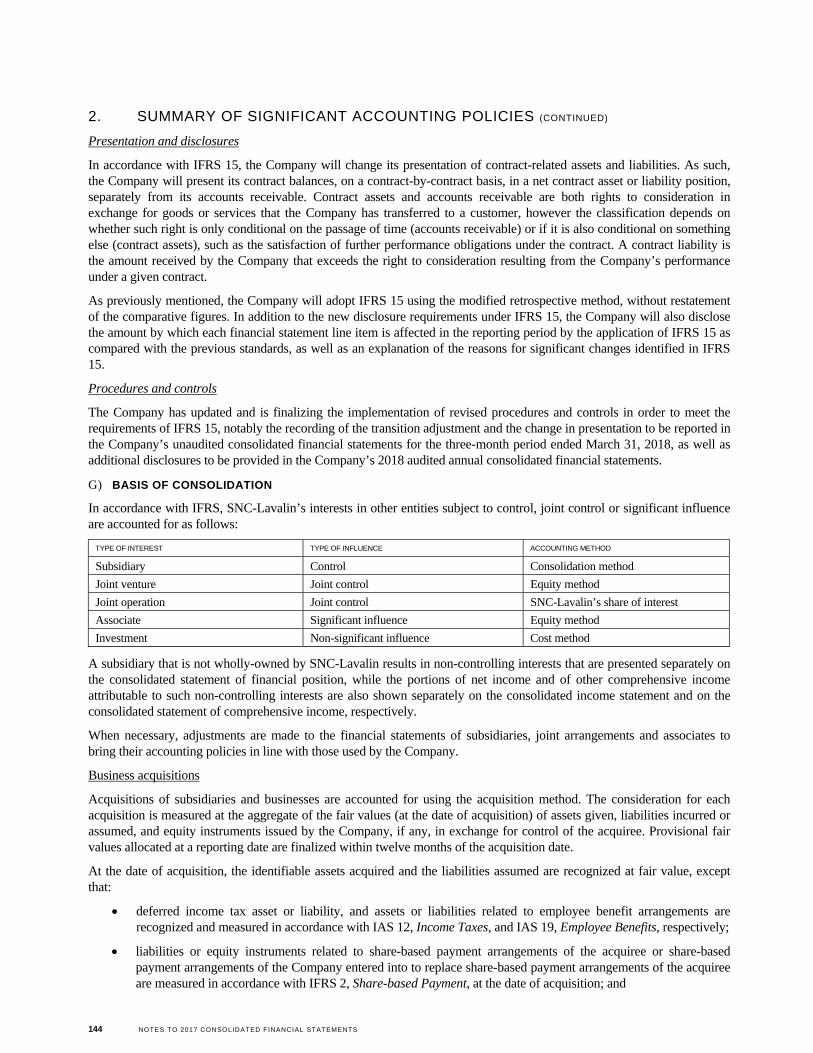
In accordance with IFRS, SNC-Lavalin’s interests in other entities subject to control, joint control or significant influence are accounted for as follows:
TYPE OF INTEREST TYPE OF INFLUENCE ACCOUNTING METHOD
Subsidiary Control Consolidation method
Joint venture Joint control Equity method
Joint operation Joint control SNC-Lavalin’s share of interest
Associate Significant influence Equity method
Investment Non-significant influence Cost method
A subsidiary that is not wholly-owned by SNC-Lavalin results in non-controlling interests that are presented separately on the consolidated statement of financial position, while the portions of net income and of other comprehensive income attributable to such non-controlling interests are also shown separately on the consolidated income statement and on the consolidated statement of comprehensive income, respectively.
When necessary, adjustments are made to the financial statements of subsidiaries, joint arrangements and associates to bring their accounting policies in line with those used by the Company.
Business acquisitions
Acquisitions of subsidiaries and businesses are accounted for using the acquisition method. The consideration for each acquisition is measured at the aggregate of the fair values (at the date of acquisition) of assets given, liabilities incurred or assumed, and equity instruments issued by the Company, if any, in exchange for control of the acquiree. Provisional fair values allocated at a reporting date are finalized within twelve months of the acquisition date.
At the date of acquisition, the identifiable assets acquired and the liabilities assumed are recognized at fair value, except that:
deferred income tax asset or liability, and assets or liabilities related to employee benefit arrangements are recognized and measured in accordance with IAS 12, Income Taxes, and IAS 19, Employee Benefits, respectively;
liabilities or equity instruments related to share-based payment arrangements of the acquiree or share-based payment arrangements of the Company entered into to replace share-based payment arrangements of the acquiree are measured in accordance with IFRS 2, Share-based Payment, at the date of acquisition; and
NOTES TO 2017 CONSOLIDATED FINANCIAL STATEMENTS 145
2. SUMMARY OF SIGNIFICANT ACCOUNTING POLICIES (CONTINUED)
assets (or disposal groups) that are classified as held for sale in accordance with IFRS 5, Non-current Assets Held for Sale and Discontinued Operations, are measured in accordance with this standard.
Acquisition-related costs are expensed in the periods in which these costs are incurred and the services are received.
The results of businesses acquired are included in the consolidated financial statements from the date on which control is obtained.
H) FOREIGN CURRENCY TRANSLATION
Functional and presentation currency
The individual financial statements of each entity within the Company are prepared in the currency of the primary economic environment in which the entity operates (its functional currency). For the purpose of the consolidated financial statements, the results and financial position of each entity within the Company are expressed in Canadian dollars, which is the presentation currency of the Company for its consolidated financial statements.
Foreign currency transactions and balances
For the purpose of preparing financial statements, Canadian and foreign operations apply the following procedure on transactions and balances in currencies other than their functional currency: 1) monetary items are translated in their functional currency using the exchange rate in effect at the period end rate; 2) non-monetary items are translated in their functional currency using the historical exchange rate if they are measured at cost, or using the exchange rate at the measurement date if they are measured at fair value; and 3) revenues and expenses are translated in their functional currency using the appropriate average exchange rate of the period. Any resulting gains or losses are recognized in net income and, if hedge accounting is applied, offsetting losses or gains from the hedging items are also recognized in net income.
As a result of applying the procedures described above, Canadian and foreign operations produce financial statements presented in their functional currency.
Translation of financial statements of foreign operations
For the purpose of presenting consolidated financial statements in Canadian dollars, the assets and liabilities of the Company’s foreign operations that have a functional currency other than Canadian dollars are expressed in Canadian dollars using exchange rates prevailing at the end of the reporting period, while revenues and expenses items are translated at the appropriate average exchange rate for the period. Exchange differences arising on consolidation, if any, are recognized initially in other comprehensive income and reclassified from equity to net income on disposal or partial disposal of foreign operations.
Goodwill and fair value adjustments arising on the acquisition of a foreign operation are treated as assets and liabilities of the foreign operation and translated at the period end rate.
I) REVENUE RECOGNITION
REVENUES FROM E&C
Revenues from E&C are recognized based on the nature of the contract, which are mainly as follows:
Revenues from cost-plus reimbursable contracts (usually providing for the reimbursement of costs related to time and material, plus an applicable margin) are recognized as costs are incurred, and include applicable margin earned as services are provided. Revenues from fixed-price contracts and unit-rate contracts are recognized on the stage of completion basis over the duration of the contract, which consists of recognizing revenue on a given contract proportionately with its stage of completion at any given time. Revenues from mixed contracts (providing for a mix of fixed-price and cost-plus reimbursable) are also recognized based on the stage of completion method. The stage of completion is determined by dividing the cumulative costs incurred as at the period end date by the sum of incurred costs and anticipated costs for completing a contract.
The fixed-fee revenue portion from cost reimbursable with fixed-fee contracts for O&M activity is recognized on a straight-line basis over the term of the contract, while the revenues from the cost-reimbursable portion are recognized as costs are incurred.
146 NOTES TO 2017 CONSOLIDATED FINANCIAL STATEMENTS
2. SUMMARY OF SIGNIFICANT ACCOUNTING POLICIES (CONTINUED)
For contracts using the stage of completion method to recognize revenue, the cumulative effect of changes to anticipated costs and anticipated revenues for completing a contract are recognized in the period in which the revisions are identified. SNC-Lavalin has numerous contracts that are in various stages of completion. Estimates are required to determine the appropriate anticipated costs and revenues. Anticipated revenues on contracts may include future revenues from unapproved change orders, if such additional revenues can be reliably estimated and it is considered probable that they will be recovered. Also, anticipated revenues on contracts may include future revenues from claims, if negotiations have reached an advanced stage such that it is probable that the customer will accept the claim and the amount that it is probable will be accepted by the customer can be measured reliably. Anticipated revenues on contracts may also include estimated volume of work, notably for unit-rate contracts. Revenues from performance incentives are recognized when specific indicators have been met and collection is reasonably assured.
In the event that the total anticipated costs exceed the total anticipated revenues on a contract, such loss is recognized in its entirety in the period it becomes known.
In all cases, the value of construction activities, material and equipment purchased by SNC-Lavalin, when acting as purchasing agent for a client, is not recorded as revenue.
REVENUES FROM CAPITAL INVESTMENTS
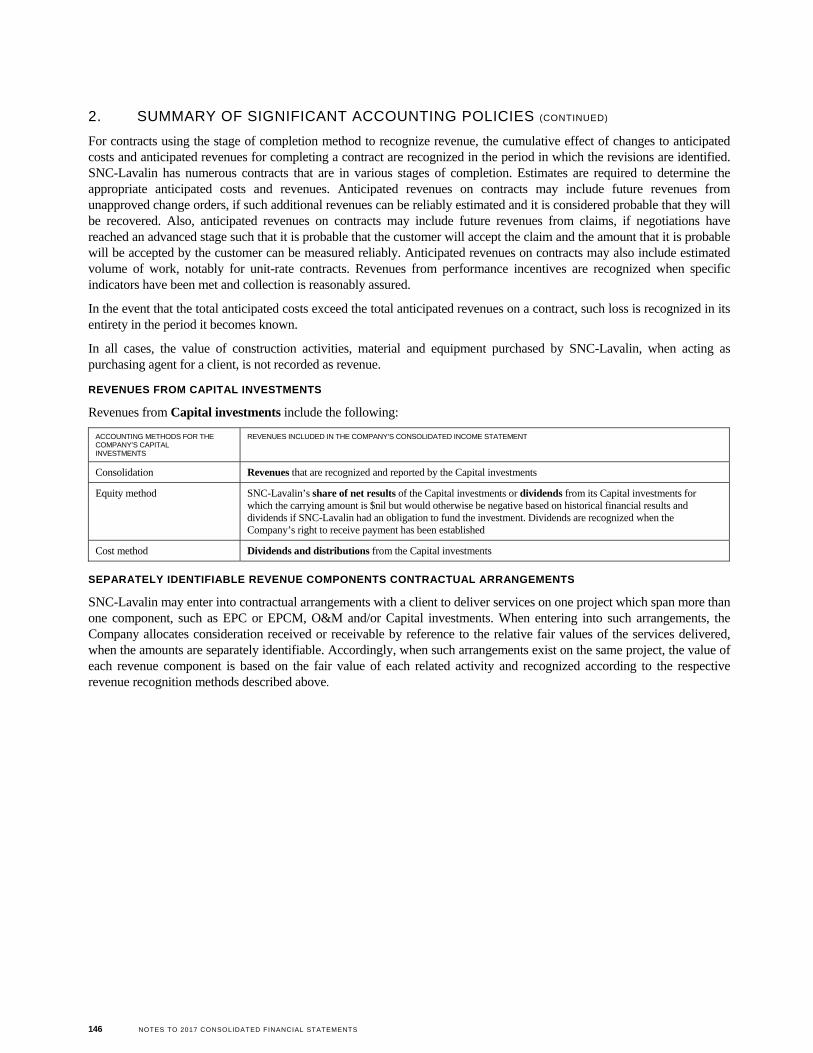
Revenues from Capital investments include the following:
ACCOUNTING METHODS FOR THE COMPANY’S CAPITAL INVESTMENTS
REVENUES INCLUDED IN THE COMPANY’S CONSOLIDATED INCOME STATEMENT
Consolidation Revenues that are recognized and reported by the Capital investments
Equity method SNC-Lavalin’s share of net results of the Capital investments or dividends from its Capital investments for which the carrying amount is $nil but would otherwise be negative based on historical financial results and dividends if SNC-Lavalin had an obligation to fund the investment. Dividends are recognized when the Company’s right to receive payment has been established
Cost method Dividends and distributions from the Capital investments
SEPARATELY IDENTIFIABLE REVENUE COMPONENTS CONTRACTUAL ARRANGEMENTS
SNC-Lavalin may enter into contractual arrangements with a client to deliver services on one project which span more than one component, such as EPC or EPCM, O&M and/or Capital investments. When entering into such arrangements, the Company allocates consideration received or receivable by reference to the relative fair values of the services delivered, when the amounts are separately identifiable. Accordingly, when such arrangements exist on the same project, the value of each revenue component is based on the fair value of each related activity and recognized according to the respective revenue recognition methods described above.
NOTES TO 2017 CONSOLIDATED FINANCIAL STATEMENTS 147
2. SUMMARY OF SIGNIFICANT ACCOUNTING POLICIES (CONTINUED)
J) FINANCIAL INSTRUMENTS
FINANCIAL ASSETS AND LIABILITIES
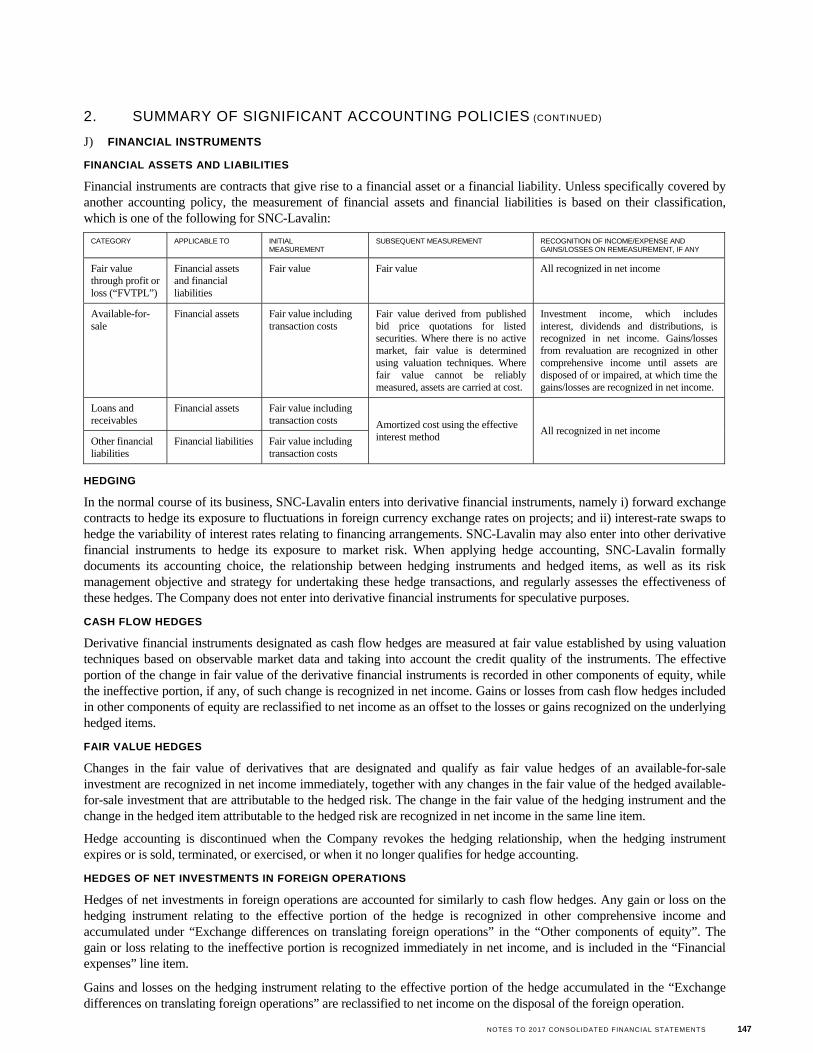
Financial instruments are contracts that give rise to a financial asset or a financial liability. Unless specifically covered by another accounting policy, the measurement of financial assets and financial liabilities is based on their classification, which is one of the following for SNC-Lavalin:
CATEGORY APPLICABLE TO INITIAL MEASUREMENT
SUBSEQUENT MEASUREMENT RECOGNITION OF INCOME/EXPENSE AND GAINS/LOSSES ON REMEASUREMENT, IF ANY
Fair value through profit or loss (“FVTPL”)
Financial assets and financial liabilities
Fair value Fair value All recognized in net income
Available-for-sale
Financial assets Fair value including transaction costs
Fair value derived from published bid price quotations for listed securities. Where there is no active market, fair value is determined using valuation techniques. Where fair value cannot be reliably measured, assets are carried at cost.
Investment income, which includes interest, dividends and distributions, is recognized in net income. Gains/losses from revaluation are recognized in other comprehensive income until assets are disposed of or impaired, at which time the gains/losses are recognized in net income.
Loans and receivables
Financial assets Fair value including transaction costs Amortized cost using the effective
interest method All recognized in net income
Other financial liabilities
Financial liabilities Fair value including transaction costs
HEDGING
In the normal course of its business, SNC-Lavalin enters into derivative financial instruments, namely i) forward exchange contracts to hedge its exposure to fluctuations in foreign currency exchange rates on projects; and ii) interest-rate swaps to hedge the variability of interest rates relating to financing arrangements. SNC-Lavalin may also enter into other derivative financial instruments to hedge its exposure to market risk. When applying hedge accounting, SNC-Lavalin formally documents its accounting choice, the relationship between hedging instruments and hedged items, as well as its risk management objective and strategy for undertaking these hedge transactions, and regularly assesses the effectiveness of these hedges. The Company does not enter into derivative financial instruments for speculative purposes.
CASH FLOW HEDGES
Derivative financial instruments designated as cash flow hedges are measured at fair value established by using valuation techniques based on observable market data and taking into account the credit quality of the instruments. The effective portion of the change in fair value of the derivative financial instruments is recorded in other components of equity, while the ineffective portion, if any, of such change is recognized in net income. Gains or losses from cash flow hedges included in other components of equity are reclassified to net income as an offset to the losses or gains recognized on the underlying hedged items.
FAIR VALUE HEDGES
Changes in the fair value of derivatives that are designated and qualify as fair value hedges of an available-for-sale investment are recognized in net income immediately, together with any changes in the fair value of the hedged available-for-sale investment that are attributable to the hedged risk. The change in the fair value of the hedging instrument and the change in the hedged item attributable to the hedged risk are recognized in net income in the same line item.
Hedge accounting is discontinued when the Company revokes the hedging relationship, when the hedging instrument expires or is sold, terminated, or exercised, or when it no longer qualifies for hedge accounting.
HEDGES OF NET INVESTMENTS IN FOREIGN OPERATIONS
Hedges of net investments in foreign operations are accounted for similarly to cash flow hedges. Any gain or loss on the hedging instrument relating to the effective portion of the hedge is recognized in other comprehensive income and accumulated under “Exchange differences on translating foreign operations” in the “Other components of equity”. The gain or loss relating to the ineffective portion is recognized immediately in net income, and is included in the “Financial expenses” line item.
Gains and losses on the hedging instrument relating to the effective portion of the hedge accumulated in the “Exchange differences on translating foreign operations” are reclassified to net income on the disposal of the foreign operation.
148 NOTES TO 2017 CONSOLIDATED FINANCIAL STATEMENTS
2. SUMMARY OF SIGNIFICANT ACCOUNTING POLICIES (CONTINUED)
IMPAIRMENT OF FINANCIAL ASSETS
Financial assets, other than those at FVTPL, are assessed for indicators of impairment at the end of each reporting period. Financial assets are considered to be impaired when there is objective evidence that, as a result of one or more events that occurred after the initial recognition of the financial asset, the estimated future cash flows of the investment have been affected.
For financial assets carried at amortized cost, the amount of the impairment loss recognized is the difference between the asset’s carrying amount and the present value of estimated future cash flows, discounted at the financial asset’s original effective interest rate. The carrying amount of the asset is reduced with the amount of the loss recognized in net income.
When an available-for-sale financial asset is considered to be impaired, the cumulative gains or losses previously recognized in other comprehensive income are reclassified to net income. For available-for-sale equity instruments, impairment losses previously recognized in net income are not reversed through net income. Any increase in fair value subsequent to an impairment is recognized in other comprehensive income. For available-for-sale debt securities, impairment losses are subsequently reversed through net income if an increase in fair value of the investment can be objectively related to an event occurring after the recognition of the impairment loss.
K) SERVICE CONCESSION ARRANGEMENTS UNDER IFRIC INTERPRETATION 12
IFRIC Interpretation 12, Service Concession Arrangements, (“IFRIC 12”) provides guidance on the accounting for certain qualifying public-private partnership arrangements, whereby the grantor (i.e., usually a government):
controls or regulates what services the operator (i.e. “the concessionaire”) must provide with the infrastructure, to whom it must provide them, and at what price; and
controls any significant residual interest in the infrastructure at the end of the term of the arrangement.
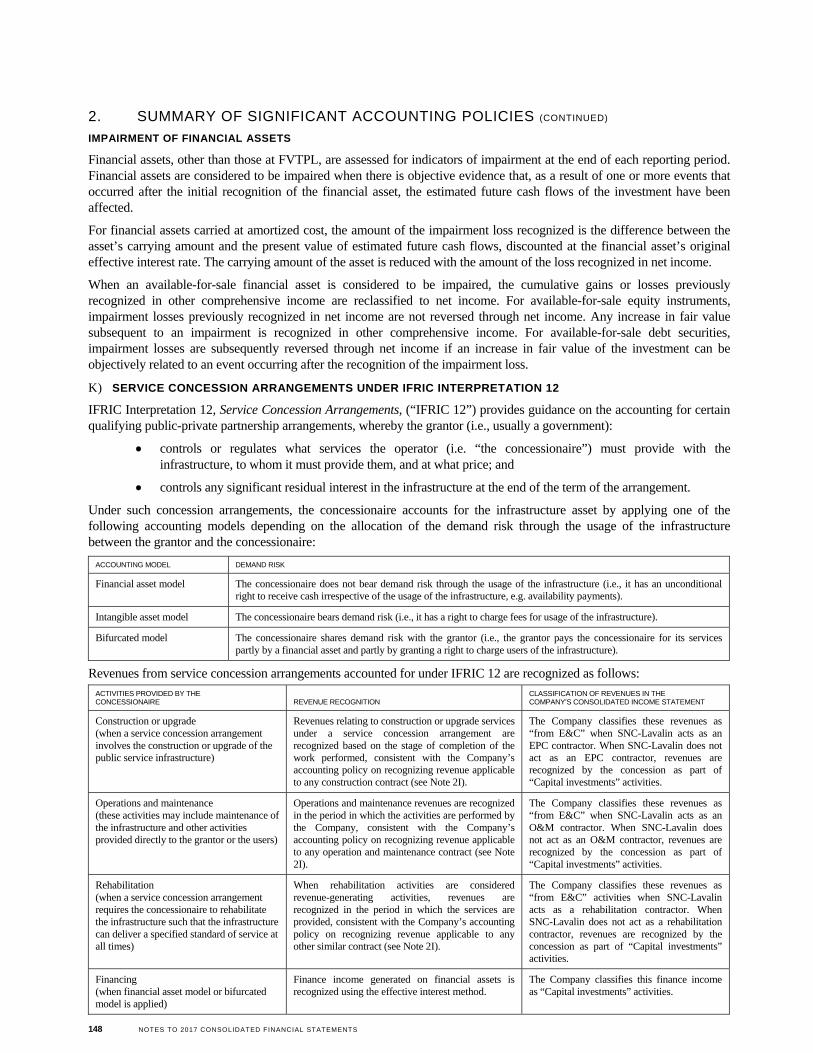
Under such concession arrangements, the concessionaire accounts for the infrastructure asset by applying one of the following accounting models depending on the allocation of the demand risk through the usage of the infrastructure between the grantor and the concessionaire:
ACCOUNTING MODEL DEMAND RISK
Financial asset model The concessionaire does not bear demand risk through the usage of the infrastructure (i.e., it has an unconditional right to receive cash irrespective of the usage of the infrastructure, e.g. availability payments).
Intangible asset model The concessionaire bears demand risk (i.e., it has a right to charge fees for usage of the infrastructure).
Bifurcated model The concessionaire shares demand risk with the grantor (i.e., the grantor pays the concessionaire for its services partly by a financial asset and partly by granting a right to charge users of the infrastructure).
Revenues from service concession arrangements accounted for under IFRIC 12 are recognized as follows:
ACTIVITIES PROVIDED BY THE CONCESSIONAIRE REVENUE RECOGNITION
CLASSIFICATION OF REVENUES IN THE COMPANY’S CONSOLIDATED INCOME STATEMENT
Construction or upgrade (when a service concession arrangement involves the construction or upgrade of the public service infrastructure)
Revenues relating to construction or upgrade services under a service concession arrangement are recognized based on the stage of completion of the work performed, consistent with the Company’s accounting policy on recognizing revenue applicable to any construction contract (see Note 2I).
The Company classifies these revenues as “from E&C” when SNC-Lavalin acts as an EPC contractor. When SNC-Lavalin does not act as an EPC contractor, revenues are recognized by the concession as part of “Capital investments” activities.
Operations and maintenance (these activities may include maintenance of the infrastructure and other activities provided directly to the grantor or the users)
Operations and maintenance revenues are recognized in the period in which the activities are performed by the Company, consistent with the Company’s accounting policy on recognizing revenue applicable to any operation and maintenance contract (see Note 2I).
The Company classifies these revenues as “from E&C” when SNC-Lavalin acts as an O&M contractor. When SNC-Lavalin does not act as an O&M contractor, revenues are recognized by the concession as part of “Capital investments” activities.
Rehabilitation (when a service concession arrangement requires the concessionaire to rehabilitate the infrastructure such that the infrastructure can deliver a specified standard of service at all times)
When rehabilitation activities are considered revenue-generating activities, revenues are recognized in the period in which the services are provided, consistent with the Company’s accounting policy on recognizing revenue applicable to any other similar contract (see Note 2I).
The Company classifies these revenues as “from E&C” activities when SNC-Lavalin acts as a rehabilitation contractor. When SNC-Lavalin does not act as a rehabilitation contractor, revenues are recognized by the concession as part of “Capital investments” activities.
Financing (when financial asset model or bifurcated model is applied)
Finance income generated on financial assets is recognized using the effective interest method.
The Company classifies this finance income as “Capital investments” activities.
NOTES TO 2017 CONSOLIDATED FINANCIAL STATEMENTS 149
2. SUMMARY OF SIGNIFICANT ACCOUNTING POLICIES (CONTINUED)
Financial asset model
When the Company delivers more than one category of activity in a service concession arrangement, the consideration received or receivable is allocated by reference to the relative fair values of the activity delivered, when the amounts are separately identifiable.
Revenues recognized by the Company under the financial asset model are accumulated in “Receivables under service concession arrangements”, a financial asset that is recovered through payments received from the grantor.
Intangible asset model
The Company recognizes an intangible asset arising from a service concession arrangement when it has a right to charge for usage of the concession infrastructure. The intangible asset received as consideration for providing construction or upgrade services in a service concession arrangement is measured at fair value upon initial recognition. Borrowing costs, if any, are capitalized until the infrastructure is ready for its intended use as part of the carrying amount of the intangible asset.
The intangible asset is then amortized over its expected useful life, which is the concession period in a service concession arrangement. Amortization period begins when the infrastructure is available for use.
Fees collected by the concessionaire upon the usage of the infrastructure are classified as revenues from “Capital investments” activities.
L) CASH EQUIVALENTS
Cash equivalents include short-term liquid investments that are readily convertible into a known amount of cash and which are subject to an insignificant risk of changes in value. Cash equivalents are designated as FVTPL and accounted for at fair value.
M) RESTRICTED CASH
Restricted cash includes cash and cash equivalents for which the use is restricted for specific purposes under certain arrangements. Restricted cash that is not expected to become unrestricted within the next twelve months is included in “Other non-current financial assets” (Note 17). Restricted cash is designated as FVTPL and accounted for at fair value.
N) CONTRACTS IN PROGRESS
Contracts in progress represent the gross unbilled amount for a given project that is expected to be collected from customers for contract work performed to date. It is measured at cost plus profit recognized by the Company to date less progress billings.
If progress billings for a given project exceed costs incurred plus recognized profits, then the difference is presented as deferred revenues.
O) INVENTORIES
Inventories are stated at the lower of cost and net realisable value. Costs of inventories are determined: i) by using specific identification of the individual costs; or ii) on a weighted average cost basis. Net realisable value represents the estimated selling price for inventories less all estimated costs of completion and costs necessary to make the sale.
P) PROPERTY AND EQUIPMENT
Property and equipment are recorded at cost. Depreciation is recorded at rates set to charge operations with the cost of depreciable assets less their residual values (if any) over their estimated useful lives.
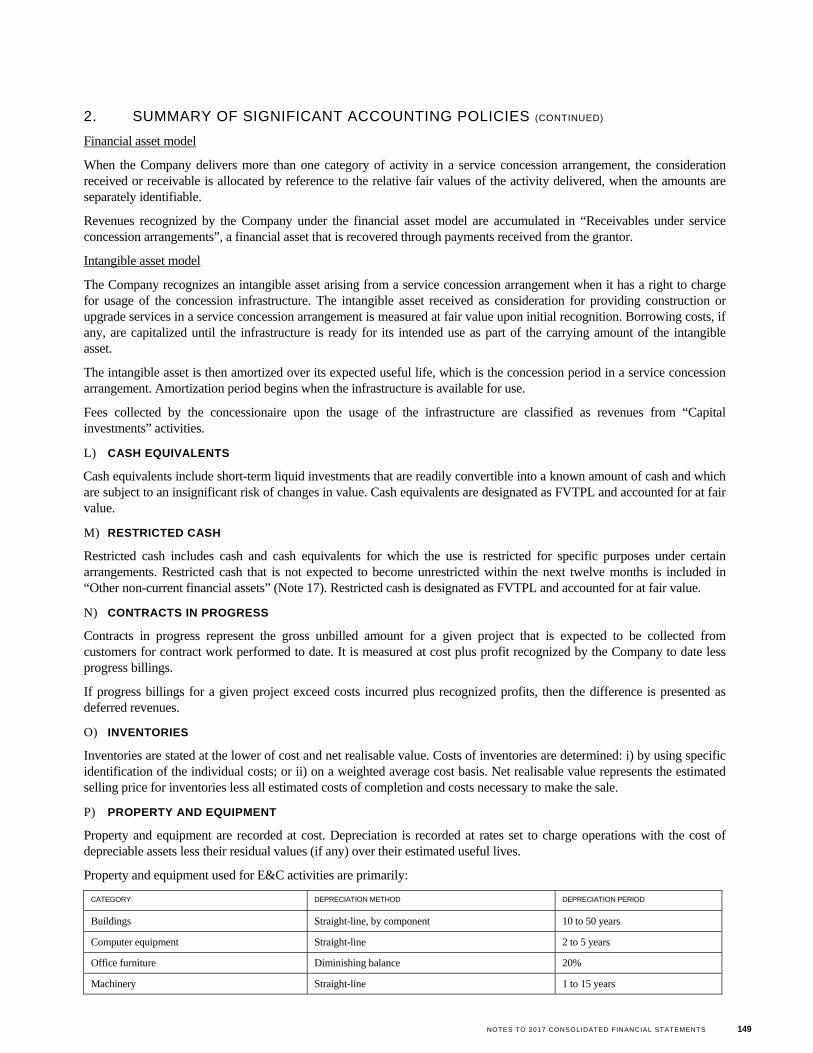
Property and equipment used for E&C activities are primarily:
CATEGORY DEPRECIATION METHOD DEPRECIATION PERIOD
Buildings Straight-line, by component 10 to 50 years
Computer equipment Straight-line 2 to 5 years
Office furniture Diminishing balance 20%
Machinery Straight-line 1 to 15 years
150 NOTES TO 2017 CONSOLIDATED FINANCIAL STATEMENTS
2. SUMMARY OF SIGNIFICANT ACCOUNTING POLICIES (CONTINUED)
Q) INTANGIBLE ASSETS OTHER THAN GOODWILL
Intangible assets acquired in a business combination
Intangible assets acquired in a business combination and recognized separately from goodwill are initially recognized at their fair value at the acquisition date (which is regarded as their cost).
Subsequent to initial recognition, intangible assets acquired in a business combination are reported at cost less accumulated amortization and accumulated impairment losses, on the same basis as intangible assets that are acquired separately.
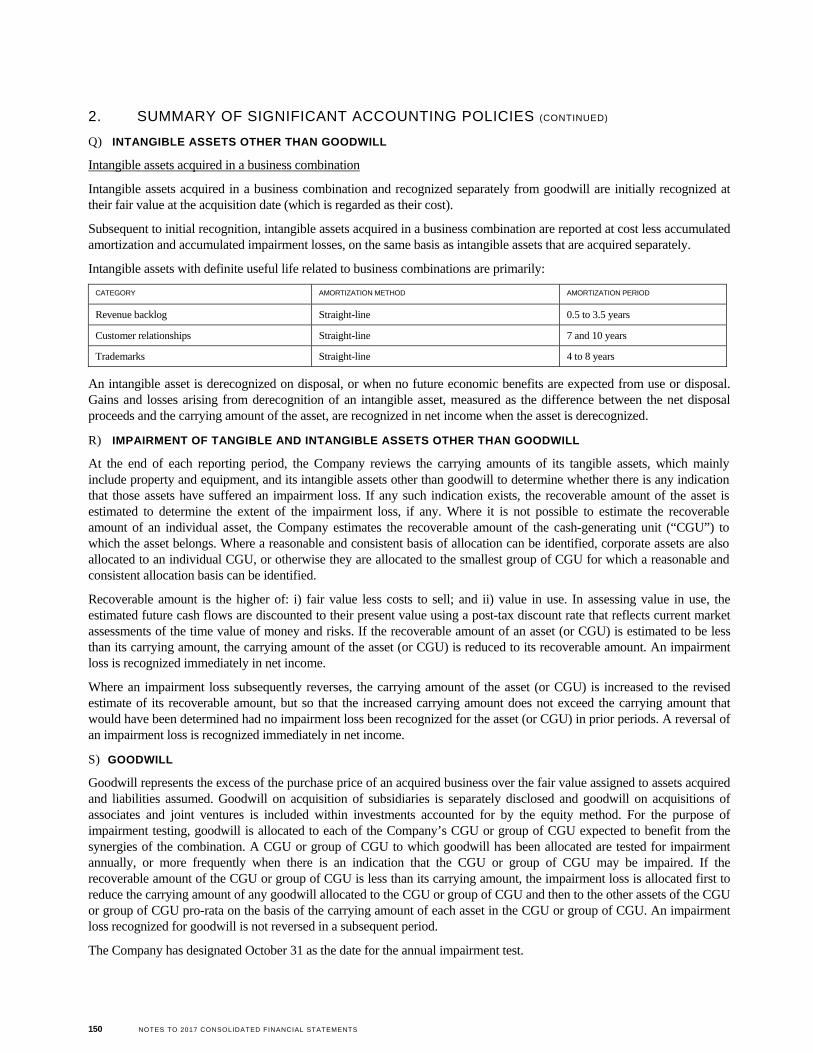
Intangible assets with definite useful life related to business combinations are primarily:
CATEGORY AMORTIZATION METHOD AMORTIZATION PERIOD
Revenue backlog Straight-line 0.5 to 3.5 years
Customer relationships Straight-line 7 and 10 years
Trademarks Straight-line 4 to 8 years
An intangible asset is derecognized on disposal, or when no future economic benefits are expected from use or disposal. Gains and losses arising from derecognition of an intangible asset, measured as the difference between the net disposal proceeds and the carrying amount of the asset, are recognized in net income when the asset is derecognized.
R) IMPAIRMENT OF TANGIBLE AND INTANGIBLE ASSETS OTHER THAN GOODWILL
At the end of each reporting period, the Company reviews the carrying amounts of its tangible assets, which mainly include property and equipment, and its intangible assets other than goodwill to determine whether there is any indication that those assets have suffered an impairment loss. If any such indication exists, the recoverable amount of the asset is estimated to determine the extent of the impairment loss, if any. Where it is not possible to estimate the recoverable amount of an individual asset, the Company estimates the recoverable amount of the cash-generating unit (“CGU”) to which the asset belongs. Where a reasonable and consistent basis of allocation can be identified, corporate assets are also allocated to an individual CGU, or otherwise they are allocated to the smallest group of CGU for which a reasonable and consistent allocation basis can be identified.
Recoverable amount is the higher of: i) fair value less costs to sell; and ii) value in use. In assessing value in use, the estimated future cash flows are discounted to their present value using a post-tax discount rate that reflects current market assessments of the time value of money and risks. If the recoverable amount of an asset (or CGU) is estimated to be less than its carrying amount, the carrying amount of the asset (or CGU) is reduced to its recoverable amount. An impairment loss is recognized immediately in net income.
Where an impairment loss subsequently reverses, the carrying amount of the asset (or CGU) is increased to the revised estimate of its recoverable amount, but so that the increased carrying amount does not exceed the carrying amount that would have been determined had no impairment loss been recognized for the asset (or CGU) in prior periods. A reversal of an impairment loss is recognized immediately in net income.
S) GOODWILL
Goodwill represents the excess of the purchase price of an acquired business over the fair value assigned to assets acquired and liabilities assumed. Goodwill on acquisition of subsidiaries is separately disclosed and goodwill on acquisitions of associates and joint ventures is included within investments accounted for by the equity method. For the purpose of impairment testing, goodwill is allocated to each of the Company’s CGU or group of CGU expected to benefit from the synergies of the combination. A CGU or group of CGU to which goodwill has been allocated are tested for impairment annually, or more frequently when there is an indication that the CGU or group of CGU may be impaired. If the recoverable amount of the CGU or group of CGU is less than its carrying amount, the impairment loss is allocated first to reduce the carrying amount of any goodwill allocated to the CGU or group of CGU and then to the other assets of the CGU or group of CGU pro-rata on the basis of the carrying amount of each asset in the CGU or group of CGU. An impairment loss recognized for goodwill is not reversed in a subsequent period.
The Company has designated October 31 as the date for the annual impairment test.
NOTES TO 2017 CONSOLIDATED FINANCIAL STATEMENTS 151
2. SUMMARY OF SIGNIFICANT ACCOUNTING POLICIES (CONTINUED)
T) RESEARCH AND DEVELOPMENT COSTS
Research and development costs are expensed as incurred, except if the costs are related to the development and setup of new products, processes and systems and satisfy generally accepted conditions for capitalization, including reasonable assurance that they will be recovered. All capitalized development costs are amortized when commercial production begins, using the straight-line method over a period not exceeding five years.
U) DOWNPAYMENTS ON CONTRACTS
Downpayments on contracts are contractually agreed advance payments made by clients that are deducted from future billings to such clients as work is performed.
V) DEFERRED REVENUES
Deferred revenues consist of amounts billed to clients for a given project in excess of revenue recognized according to the corresponding revenue recognition method and represents the opposite of contracts in progress. A given project may present an amount in either deferred revenues or in contracts in progress, but not both.
W) INCOME TAXES
Income taxes recognized in net income comprise the sum of deferred income tax and current income tax not recognized in other comprehensive income or directly in equity.
Current income tax assets and/or liabilities comprise amounts receivable from or payable to tax authorities relating to the current or prior reporting periods, which are uncollected or unpaid at the reporting date. Current tax is payable on taxable income, which differs from net income in the financial statements. Calculation of current tax is based on tax rates and tax laws that have been enacted or substantively enacted by the end of the reporting period.
Deferred income taxes are calculated using the liability method on temporary differences between the carrying amounts of assets and liabilities and their tax bases. Deferred income tax on temporary differences associated with shares in subsidiaries, joint arrangements and associates is not provided for if reversal of these temporary differences can be controlled by the Company and it is probable that reversal will not occur in the foreseeable future.
Deferred income tax assets and liabilities are calculated, without discounting, at tax rates that are expected to apply to their respective period of realization, provided they are enacted or substantively enacted by the end of the reporting period.
Deferred income tax assets are recognized for unused tax losses, tax credits and deductible temporary differences, to the extent that it is probable that future taxable income will be available against which they can be utilized. For management’s assessment of the probability of future taxable income to utilize against deferred income tax assets, see Note 3. Deferred income tax liabilities are always provided for in full.
Deferred income tax assets and liabilities are offset only when the Company has a right and intention to offset current tax assets and liabilities from the same taxation authority.
Changes in deferred income tax assets or liabilities are recognized as a component of income taxes in net income, except where they relate to items that are recognized in other comprehensive income or directly in equity, in which case the related deferred income tax is recognized in other comprehensive income or equity, respectively.
X) DEFINED BENEFIT PENSION PLANS, OTHER LONG-TERM BENEFITS AND OTHER POST-EMPLOYMENT
BENEFITS
Defined benefit pension plans, other long-term benefits and other post-employment benefits obligations are included in “Provisions” in the consolidated statement of financial position and have been determined using the projected unit credit method, which sees each period of service as giving rise to an additional unit of benefit entitlement to the eligible employees and measures each unit separately to build up the final obligation. In valuing the defined benefit cost as well as other post-employment benefits, assumptions are based on management’s best estimates, except for the discount rate where the Company uses the market interest rate at the measurement date based on high quality corporate bonds with cash flows that match the timing and amount of expected benefit payments.
Remeasurement, comprising: i) actuarial gains and losses, ii) the effect of the changes to the asset ceiling (if applicable), and iii) the return on plans’ assets (excluding interest), is credited or charged to equity in other comprehensive income in the period in which it arises. Remeasurement recognized in other comprehensive income is not reclassified to net income in subsequent periods. The cumulative amount of remeasurement is included in retained earnings.
152 NOTES TO 2017 CONSOLIDATED FINANCIAL STATEMENTS
2. SUMMARY OF SIGNIFICANT ACCOUNTING POLICIES (CONTINUED)
Defined benefit costs comprise: i) service cost (including current service cost, past service cost, as well as gains and losses on curtailments and settlements), ii) net interest expense or income; and iii) remeasurement. Service cost and net interest income or expense are recognized in net income while the remeasurement is recognized in other comprehensive income in the period. Net interest is calculated by applying the discount rate at the beginning of the period to the net defined benefit liability or asset.
Y) SELLING EXPENSES
All costs related to contract proposals are expensed as incurred.
Z) EARNINGS PER SHARE
Basic and diluted earnings per share have been determined by dividing the consolidated net income attributable to SNC-Lavalin shareholders for the period by the basic and diluted weighted average number of shares, respectively.
The diluted weighted average number of shares outstanding is calculated as if all dilutive options had been exercised at the later of the beginning of the reporting period or date of grant with deemed proceeds from the exercise of such dilutive options used to repurchase common shares at the average market price for the period.
AA) SHARE-BASED PAYMENTS
Stock options
Stock options granted to employees are measured at their fair value at the grant date. The estimated fair value of the stock options is determined using the Black-Scholes option pricing model.
The fair value determined at the grant date of the stock options is expensed on a straight-line basis over the shorter of the vesting period or the term over which an employee becomes eligible to retire, based on the Company’s estimate of stock options that will eventually vest. At the end of each reporting period, the Company revises its estimate of the number of stock options expected to vest and the impact of such revision, if any, is recognized in net income.
Share units
The 2017 Performance Share Unit plan (“2017 PSU plan”), 2014 Performance Share Unit plan (“2014 PSU plan”), Restricted Share Unit plan (“RSU plan”), and Deferred Share Unit plan (“DSU plan”) are collectively referred as “share units”. For share units granted to employees under the share unit plans, a liability is recognized and measured at the fair value of the liability, which is based on the Company’s share price. At the end of each reporting period until the liability is settled, and at the date of settlement, the fair value of the liability is remeasured, with any changes in fair value recognized in net income for the period.
BB) PROVISIONS
A provision is a liability of uncertain timing or amount that is recognized in the consolidated statement of financial position.
Provisions are recognized when the Company has a present obligation (legal or constructive) as a result of a past event, it is probable that the Company will be required to settle the obligation, and a reliable estimate can be made of the amount of the obligation.
The amount recognized as a provision is the best estimate of the consideration required to settle the present obligation at the end of the reporting period, taking into account the risks and uncertainties surrounding the obligation. Where a provision is measured using the cash flows estimated to settle the present obligation, its carrying amount is the present value of those cash flows.
When some or all of the economic benefits required to settle a provision are expected to be recovered from a third party, a receivable is recognized as an asset if it is virtually certain that reimbursement will be received and the amount of the receivable can be measured reliably.
Restructuring
A restructuring provision is recognized when the Company has developed a detailed formal plan for the restructuring and has raised a valid expectation in those affected that it will carry out the restructuring by starting to implement the plan or announcing its main features to those affected by it. The measurement of a restructuring provision includes only the direct expenditures arising from the restructuring, which are those amounts that are both necessarily entailed by the restructuring and not associated with the ongoing activities of the entity.
NOTES TO 2017 CONSOLIDATED FINANCIAL STATEMENTS 153
2. SUMMARY OF SIGNIFICANT ACCOUNTING POLICIES (CONTINUED)
Onerous contracts
Present obligations arising under onerous contracts are recognized and measured as provisions. An onerous contract is considered to exist where the Company has a contract under which the unavoidable costs of meeting the obligations under the contract exceed the economic benefits expected to be received from the contract.
CC) NON-CURRENT ASSETS HELD FOR SALE
Non-current assets and disposal groups are classified as held for sale if their carrying amount will be recovered principally through a sale transaction rather than continuing use. This condition is regarded as met only when the asset (or disposal group) is available for immediate sale in its present condition subject only to terms that are usual and customary for sales of such asset (or disposal group) and its sale is highly probable. Management must be committed to the sale, which should be expected to qualify for recognition as a completed sale within one year from the date of classification.
When the Company is committed to a sale plan involving loss of control of a subsidiary, all of the assets and liabilities of that subsidiary are classified as held for sale when the criteria described above are met, regardless of whether the Company will retain non-controlling interest in its former subsidiary after the sale.
When the Company is committed to a sale plan involving disposal of an investment, or a portion of an investment, in an associate or a joint venture, the investment or the portion of the investment that will be disposed of is classified as held for sale when the criteria described above are met, and the Company discontinues the use of the equity method in relation to the portion that is classified as held for sale. Any retained portion of an investment in an associate or a joint venture that has not been classified as held for sale continues to be accounted for using the equity method. The Company discontinues the use of the equity method at the time of disposal when the disposal results in the Company losing significant influence over the associate or joint control over the joint venture.
After the disposal takes place, the Company accounts for any retained interest in the associate or joint venture in accordance with IAS 39, Financial Instruments: Recognition and Measurement, unless the retained interest continues to be an associate or a joint venture, in which case the Company uses the equity method.
Non-current assets (and disposal groups) classified as held for sale are measured at the lower of their previous carrying amount and fair value less costs to sell.
DD) LEASING
Leases are classified as finance leases whenever the terms of the lease transfer substantially all the risk and rewards of ownership to the lessee. All other leases are classified as operating leases.
Operating leases
Operating lease payments are recognized as an expense on a straight-line basis over the lease term, except where another systematic basis is more representative of the time pattern in which economic benefits from the leased assets are consumed. Contingent rentals, if any, arising under operating leases are recognized as an expense in the period in which they are incurred.
In the event that lease incentives are received to enter into operating leases, such incentives are recognized as a liability. The aggregate benefit of incentives is recognized as a reduction of rental expense on a straight-line basis, except where another systematic basis is more representative of the time pattern in which economic benefits from the leased asset are consumed.
Finance leases
Assets held under finance leases are initially recognized as assets of the Company at their fair value at the inception of the lease or, if lower, at the present value of the minimum lease payments. The corresponding liability to the lessor is included in the consolidated statement of financial position as a finance lease obligation.
Lease payments are apportioned between financial expenses and reduction of the lease obligation so as to achieve a constant rate of interest on the remaining balance of the liability. Financial expenses are recognized immediately in net income, unless they are directly attributable to qualifying assets, which are assets that necessarily take a substantial period of time to get ready for their intended use or sale, in which case they are capitalized to the cost of those assets. Contingent rentals, if any, are recognized as expenses in the periods in which they are incurred.
154 NOTES TO 2017 CONSOLIDATED FINANCIAL STATEMENTS
3. CRITICAL ACCOUNTING JUDGMENTS AND KEY SOURCES OF ESTIMATION UNCERTAINTY
In the application of the Company’s accounting policies, which are described in Note 2, management is required to make judgments, estimates, and assumptions about the carrying amounts of assets and liabilities recognized that are not readily apparent from other sources. The estimates and underlying assumptions are based on historical experience and other factors that are considered to be relevant. Actual results may differ from these estimates.
The estimates and underlying assumptions are reviewed on an ongoing basis. Revisions to accounting estimates are recognized in the period in which the estimate is revised if the revision affects only that period or in the period of the revision and future periods if the revision affects both current and future periods.
The following are the critical accounting judgments and key estimates concerning the future, and other key sources of estimation uncertainty at the end of the reporting period, that have a significant risk of causing a material adjustment to the carrying amounts of assets and liabilities within the next financial year.
Revenue and gross margin recognition
The determination of anticipated costs for completing a contract is based on estimates that can be affected by a variety of factors such as potential variances in scheduling and cost of materials along with the availability and cost of qualified labour and subcontractors, productivity, and possible claims from subcontractors.
The determination of anticipated revenues includes the contractually agreed revenue and may also involve estimates of future revenues, notably from estimated volume of work, claims and unapproved change orders if such additional revenues can be reliably estimated and it is considered probable that they will be recovered. A change order results from a change to the scope of the work to be performed compared to the original contract that was signed. An example of such contract variation could be a change in the specifications or design of the project, whereby costs related to such variation might be incurred prior to the client’s formal contract amendment signature. A claim represents an amount expected to be collected from the client or a third-party as reimbursement for costs incurred that are not part of the original contract. In both cases, management’s judgments are required in determining the probability that additional revenue will be recovered from these variations and in determining the measurement of the amount to be recovered.
As risks and uncertainties are different for each project, the sources of variations between anticipated costs and actual costs incurred will also vary for each project. In particular, while consulting, design, engineering and construction activities usually do not exceed 4 years, operations and maintenance activities include contracts for which the duration might exceed 20 years, notably on certain public-private partnership arrangements. The long-term nature of certain arrangements usually results in significant estimates related to scheduling and prices.
The determination of estimates is based on SNC-Lavalin’s business practices as well as its historical experience. Furthermore, management regularly reviews underlying estimates of project profitability.
Service concession arrangements
The accounting for certain Capital investment activities requires the application of judgment in determining if they fall within the scope of IFRIC Interpretation 12, Service Concession Arrangements, (“IFRIC 12”). Additional judgments need to be exercised when determining, among other things, the accounting model to be applied under IFRIC 12, the allocation of the consideration receivable between revenue-generating activities, the classification of costs incurred on such activities, the accounting treatment of rehabilitation costs and associated estimates, as well as the effective interest rate to be applied to the financial asset. As the accounting for Capital investments under IFRIC 12 requires the use of estimates over the term of the arrangement, any changes to these long-term estimates could result in a significant variation in the accounting for the Capital investments.
Basis of consolidation
Under certain circumstances, the determination of the Company’s level of power over an investee requires exercise of judgment. As such, the classification of the entity as a subsidiary, a joint arrangement, an associate or a cost investment might require the application of judgment through the analysis of various indicators, such as the percentage of ownership interest held in the entity, the representation on the entity’s board of directors, and various other factors.
NOTES TO 2017 CONSOLIDATED FINANCIAL STATEMENTS 155
3. CRITICAL ACCOUNTING JUDGMENTS AND KEY SOURCES OF ESTIMATION UNCERTAINTY (CONTINUED)
Values used in impairment tests
Determining whether goodwill is impaired requires an estimation of the value in use of the CGU or group of CGU to which goodwill has been allocated. The value in use calculation requires management to estimate future cash flows expected to arise from the CGU or group of CGU and a suitable discount rate in order to calculate present value. The key assumptions required for the value in use estimation are the future cash flows growth rate and the discount rate. Cash flows for each CGU or group of CGU are derived from the budget for the upcoming year and a long-term forecast prepared by management, which covers an additional period from 3 to 5 years. The budget, which is approved on an annual basis by members of the Company’s Board of Directors, and long-term forecast, which is prepared on an annual basis by the Company’s senior management, are the primary sources for the determination of value in use. Cash flows beyond the long-term forecast are extrapolated using a growth rate of 2.5% in 2017 (2016: 2.5%). The discount rate is derived from the Company’s post-tax weighted average cost of capital and is adjusted, where applicable, to take into account any specific risks. Discount rates ranging from 10.3% to 12.6% have been used for goodwill impairment calculations performed in 2017 (2016: from 9.7% to 12.9%). The values assigned to these key assumptions reflect past experience and are consistent with external sources of information.
As at October 31, 2017 and 2016, goodwill was not considered to be impaired.
In 2017, approximately 44% (2016: 90%) of the Company’s goodwill balance is allocated to the Oil & Gas CGU. The recoverable amount of this CGU, based on a terminal growth rate of 2.5% in 2017 (2016: 2.5%) and a discount rate of 12.6% in 2017 (2016: 12.9%), exceeded its carrying amount by $309.4 million as at October 31, 2017 (2016: $253.0 million). Assuming all other assumptions remain the same, a 130-basis point decrease in 2017 (2016: a 130-basis point decrease) in the terminal growth rate or a 90-basis increase in 2017 (2016: a 260-basis point increase) in the discount rate would have caused the Oil & Gas CGU’s carrying amount to be comparable to its recoverable amount as at that date. No reasonable change in the key assumptions used for the other CGU or group of CGU would have resulted in an impairment loss as at October 31, 2017 and 2016.
In 2017, approximately 51% of the Company’s goodwill balance is allocated to the Atkins CGU, following the acquisition of Atkins in July 2017 and Data Transfer Solutions in October 2017.
When there is any indication that the tangible and intangible assets other than goodwill have suffered an impairment loss, the determination of the recoverable amount of tangible and intangible assets other than goodwill requires management to estimate cash flows expected to arise from these assets and a suitable discount rate in order to calculate the present value in a manner described above for goodwill.
The identification of events that could have an impact on the estimated cash flows of the assets and the determination of these estimated cash flows require the exercise of judgment, which might result in significant variances in the carrying amount of these assets if found to be impaired.
Measurement of retirement benefit obligations, other long-term benefit and other post-employment benefit obligations
SNC-Lavalin’s obligations and expenses relating to defined benefit pension plans, other long-term benefits and other post-employment benefits are determined using actuarial valuations, and are dependent on assumptions such as the rate of compensation increase, as determined by management. While management believes these assumptions represent its best estimate, differences in actual results or changes in assumptions could have an impact on the obligations, expenses and amounts of actuarial gains (losses) recognized in the consolidated statement of comprehensive income.
Measurement of provisions shown in the consolidated statement of financial position
In measuring a provision, the Company takes risks and uncertainties into account. The uncertainties mainly relate to timing and amount of a provision. Also, risks and uncertainties arise from discounting a provision, where the effect of the time value of money is significant, using a pre-tax discount rate that reflects current market assessments of the time value of money. Additionally, the Company takes future events, such as changes in the law, into account where there is sufficient objective evidence that they will occur when measuring a provision.
Contingent liabilities
As described in more detail in Note 34, the Company is subject to certain ongoing investigations and class action lawsuits have been filed against the Company. The outcome of these investigations or actions, while not determinable, could have a material adverse impact on the Company’s liquidity and financial results.
156 NOTES TO 2017 CONSOLIDATED FINANCIAL STATEMENTS
3. CRITICAL ACCOUNTING JUDGMENTS AND KEY SOURCES OF ESTIMATION UNCERTAINTY (CONTINUED)
Measurement of share-based payment expenses
The Company offers the 2017 PSU plan and 2014 PSU plan to selected individuals within the organization. Subject to performance conditions, the number of units granted is adjusted depending on specific indicators to determine the number of units to which all participants receiving the award will be entitled at the end of the vesting period. At each measurement date, management is required to estimate the number of 2017 performance share units and 2014 performance share units that will vest, which impacts the amount of associated liabilities and expenses.
Assessment of deferred income tax assets and liabilities
Deferred income tax assets and liabilities arise from temporary differences between the tax bases of assets and liabilities and their carrying amounts reported in the financial statements. Deferred income tax assets also reflect the benefit of unutilized tax losses that can be carried forward to reduce income taxes in future years. This method requires the exercise of significant judgment in determining whether or not the Company’s deferred income tax assets are probable to be recovered from future taxable income and therefore, can be recognized in the Company’s consolidated financial statements. Also, estimates are required to determine the expected timing upon which tax assets will be realized and upon which tax liabilities will be settled, and the enacted or substantively enacted tax rates that will apply at such time.
Measurement of financial instruments at fair value
The Company measures certain of its financial instruments at fair value. The determination of such fair value is based on the most readily available market data. When data is not readily available, management is required to estimate the fair value of the instrument using various inputs that are either directly or indirectly observable, or that are not based on observable market data.
Assets and liabilities acquired in a business combination
Intangible assets and goodwill arising out of business combinations are accounted for by applying the acquisition method of accounting to these transactions. In measuring the fair value of the assets acquired and the liabilities assumed and estimating their useful lives, the Company uses significant estimates and assumptions regarding cash flow projections, economic risk, and weighted average cost of capital.
These estimates and assumptions determine the amount allocated to intangible assets and goodwill, as well as the amortization period for intangible assets with finite lives. If results differ from estimates, the Company may increase amortization or recognize impairment charges.
Identification of functional currency
The functional currency for each subsidiary, joint operation, joint venture and associate, is the currency of the primary economic environment in which it operates. Determination of functional currency involves significant judgment and other entities may make different judgments based on similar facts. SNC-Lavalin reconsiders the functional currency of its businesses if there is a change in the underlying transactions, events or conditions which determine their primary economic environment.
The determination of functional currency affects the carrying value of non-current assets included in the statement of financial position and, as a consequence, the amortization of those assets included in the income statement. It also impacts exchange gains and losses included in the income statement and in equity.
4. SEGMENT DISCLOSURES
SNC-Lavalin’s reportable segments are i) Mining & Metallurgy; ii) Oil & Gas; iii) Power; iv) Infrastructure; v) Atkins; and vi) Capital.
The description of each of the segments is as follows:
Mining & Metallurgy combines global-caliber expertise with deep local capabilities to provide tailored solutions for projects of any size, scope or complexity in the aluminium, gold, copper, iron ore, nickel, fertilizer, commodities related to rechargeable batteries for cars, mobile phone and other electronic devices, and sulphur product sectors, among others. It includes a full range of activities and services in studies, sustaining capital and consulting, and major projects.
NOTES TO 2017 CONSOLIDATED FINANCIAL STATEMENTS 157
4. SEGMENT DISCLOSURES (CONTINUED)
Oil & Gas includes projects in the upstream, midstream, downstream and supporting infrastructure sectors for major oil and gas and resources companies. It supports these clients across the asset life cycle, from front-end evaluation through decommissioning (operational and capital expenditures).
Power covers projects and services in hydro, nuclear and thermal power generation, renewable power generation, energy from waste, and electrical power delivery systems. It also has a wealth of expertise in clean and sustainable power technologies.
Infrastructure provides end-to-end services to a broad range of sectors, including mass transit, heavy rail, roads, bridges, airports, ports and harbours, facilities architecture and engineering (structural, mechanical, electrical), industrial (pharmaceutical, agrifood, life sciences, automation, industrial processes), geotechnical engineering, materials testing, and water infrastructure. In addition, Infrastructure includes O&M projects.
Atkins, acquired by the Company on July 3, 2017, has projects in the energy, transportation and infrastructure sectors. Atkins also includes the brands Faithful+Gould, a world leading integrated project and programme management consultancy, Atkins Acuity, an advisory business operating worldwide that offers seamless end-to-end advisory services in the infrastructure and energy sectors, and Howard Humphreys, a multidisciplinary engineering consultancy based in Kenya and Tanzania. Atkins also includes Data Transfer Solutions LLC, acquired by the Company on October 30, 2017.
Capital is the investment and asset management arm of SNC-Lavalin. Its main purpose is to invest equity or subordinated debt into projects to generate integrated, whole life-cycle revenues in engineering and construction, as well as operations and maintenance. All investments are structured to earn a return on capital adequate for the risk profile of each individual project. SNC-Lavalin makes capital investments in a variety of infrastructure assets such as bridges and highways, mass transit systems, power facilities, energy infrastructure and water treatment plants, for which further details are provided in Note 5.
As disclosed in Note 2B, the Company modified the definition of segment EBIT, its measure of profit or loss for its reportable segments, to exclude the gain on disposal of the head office building recognized in 2017. Also, as disclosed in Note 2C, the Company combined the financial results of its Infrastructure & Construction and Operations & Maintenance sub-segments, which were previously presented separately as additional information of the Infrastructure segment.
The accounting policies for the segments are the same as those described in the Summary of Significant Accounting Policies (Note 2). The Company evaluates segment performance using segment EBIT, which consists, except for the Capital segment, of gross margin less i) directly related selling, general and administrative expenses; ii) corporate selling, general and administrative expenses that are directly related to projects or segments; and iii) non-controlling interests before income taxes. Corporate selling, general and administrative expenses that are not directly related to projects or segments, restructuring costs, goodwill impairment, acquisition-related costs and integration costs, amortization of intangible assets related to business combinations, gains (losses) from disposal(s) of E&C businesses and gain on disposal of the head office building are not allocated to the Company’s segments.
The Company evaluates the Capital segment performance using: i) dividends or distributions received from investments accounted for by the cost method; ii) SNC-Lavalin’s share of the net results of its investments, or dividends from its Capital investments for which the carrying amount is $nil, but would otherwise be negative based on historical financial results and dividends, for investments accounted for by the equity method; and iii) net result from investments accounted for by the consolidation method, less the portion attributable to non-controlling interests.
The Capital segment EBIT also reflects selling, general and administrative expenses, including corporate selling, general and administrative expenses that are related to the segment. Accordingly, the segment EBIT from Capital is reported net of selling, general and administrative expenses.
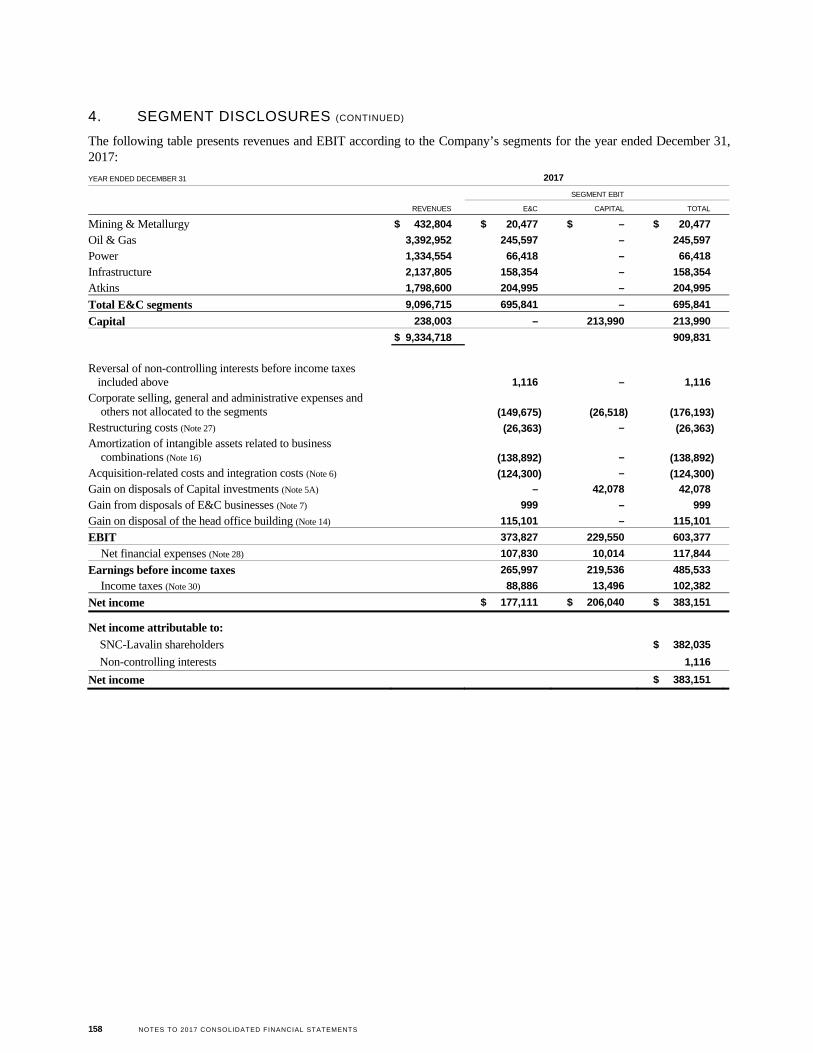
158 NOTES TO 2017 CONSOLIDATED FINANCIAL STATEMENTS
4. SEGMENT DISCLOSURES (CONTINUED)
The following table presents revenues and EBIT according to the Company’s segments for the year ended December 31, 2017:
YEAR ENDED DECEMBER 31 2017
SEGMENT EBIT
REVENUES E&C CAPITAL TOTAL
Mining & Metallurgy $ 432,804 $ 20,477 $ – $ 20,477
Oil & Gas 3,392,952 245,597 – 245,597
Power 1,334,554 66,418 – 66,418
Infrastructure 2,137,805 158,354 – 158,354
Atkins 1,798,600 204,995 – 204,995
Total E&C segments 9,096,715 695,841 – 695,841
Capital 238,003 – 213,990 213,990
$ 9,334,718 909,831
Reversal of non-controlling interests before income taxes included above 1,116 – 1,116
Corporate selling, general and administrative expenses and others not allocated to the segments (149,675) (26,518) (176,193)
Restructuring costs (Note 27) (26,363) – (26,363)
Amortization of intangible assets related to business combinations (Note 16) (138,892) – (138,892)
Acquisition-related costs and integration costs (Note 6) (124,300) – (124,300)
Gain on disposals of Capital investments (Note 5A) – 42,078 42,078
Gain from disposals of E&C businesses (Note 7) 999 – 999
Gain on disposal of the head office building (Note 14) 115,101 – 115,101
EBIT 373,827 229,550 603,377
Net financial expenses (Note 28) 107,830 10,014 117,844
Earnings before income taxes 265,997 219,536 485,533
Income taxes (Note 30) 88,886 13,496 102,382
Net income $ 177,111 $ 206,040 $ 383,151
Net income attributable to:
SNC-Lavalin shareholders $ 382,035
Non-controlling interests 1,116
Net income $ 383,151
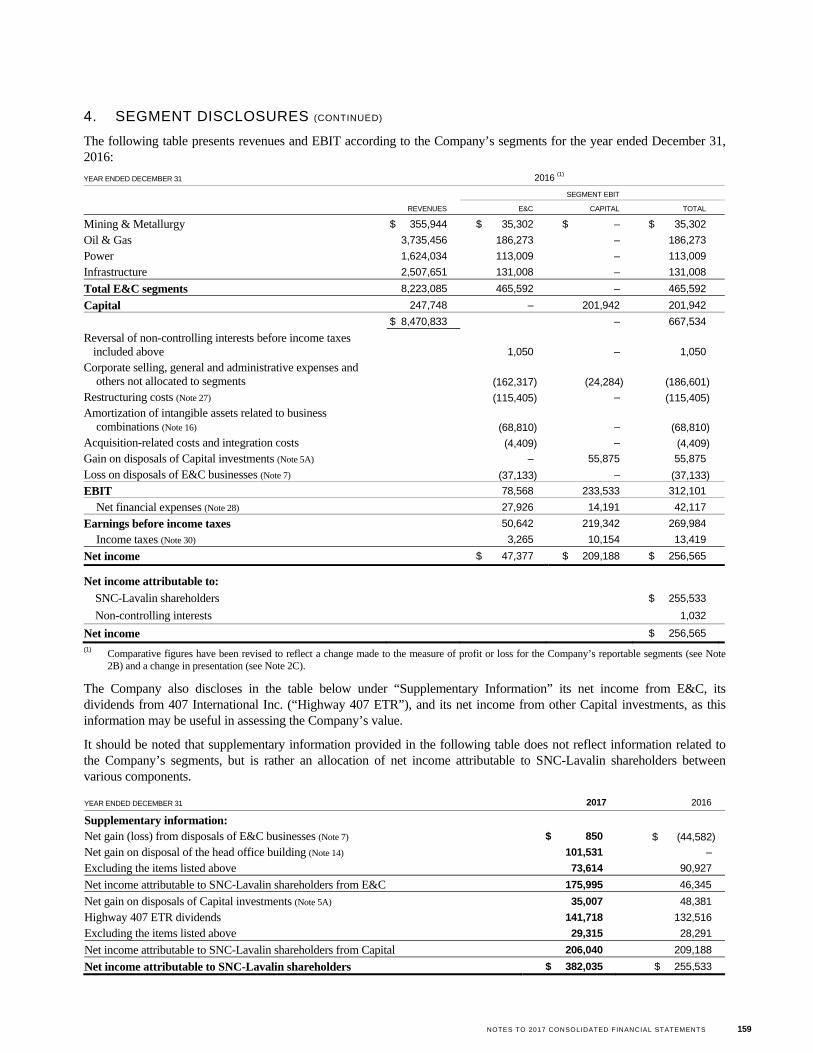
NOTES TO 2017 CONSOLIDATED FINANCIAL STATEMENTS 159
4. SEGMENT DISCLOSURES (CONTINUED)
The following table presents revenues and EBIT according to the Company’s segments for the year ended December 31, 2016:
YEAR ENDED DECEMBER 31 2016 (1)
SEGMENT EBIT
REVENUES E&C CAPITAL TOTAL
Mining & Metallurgy $ 355,944 $ 35,302 $ – $ 35,302
Oil & Gas 3,735,456 186,273 – 186,273
Power 1,624,034 113,009 – 113,009
Infrastructure 2,507,651 131,008 – 131,008
Total E&C segments 8,223,085 465,592 – 465,592
Capital 247,748 – 201,942 201,942
$ 8,470,833 – 667,534
Reversal of non-controlling interests before income taxes included above 1,050 – 1,050
Corporate selling, general and administrative expenses and others not allocated to segments (162,317) (24,284) (186,601)
Restructuring costs (Note 27) (115,405) – (115,405)
Amortization of intangible assets related to business combinations (Note 16) (68,810) – (68,810)
Acquisition-related costs and integration costs (4,409) – (4,409)
Gain on disposals of Capital investments (Note 5A) – 55,875 55,875
Loss on disposals of E&C businesses (Note 7) (37,133) – (37,133)
EBIT 78,568 233,533 312,101
Net financial expenses (Note 28) 27,926 14,191 42,117
Earnings before income taxes 50,642 219,342 269,984
Income taxes (Note 30) 3,265 10,154 13,419
Net income $ 47,377 $ 209,188 $ 256,565
Net income attributable to:
SNC-Lavalin shareholders $ 255,533
Non-controlling interests 1,032
Net income $ 256,565
(1) Comparative figures have been revised to reflect a change made to the measure of profit or loss for the Company’s reportable segments (see Note 2B) and a change in presentation (see Note 2C).
The Company also discloses in the table below under “Supplementary Information” its net income from E&C, its dividends from 407 International Inc. (“Highway 407 ETR”), and its net income from other Capital investments, as this information may be useful in assessing the Company’s value.
It should be noted that supplementary information provided in the following table does not reflect information related to the Company’s segments, but is rather an allocation of net income attributable to SNC-Lavalin shareholders between various components.
YEAR ENDED DECEMBER 31 2017 2016
Supplementary information:
Net gain (loss) from disposals of E&C businesses (Note 7) $ 850 $ (44,582)
Net gain on disposal of the head office building (Note 14) 101,531 –
Excluding the items listed above 73,614 90,927
Net income attributable to SNC-Lavalin shareholders from E&C 175,995 46,345
Net gain on disposals of Capital investments (Note 5A) 35,007 48,381
Highway 407 ETR dividends 141,718 132,516
Excluding the items listed above 29,315 28,291
Net income attributable to SNC-Lavalin shareholders from Capital 206,040 209,188
Net income attributable to SNC-Lavalin shareholders $ 382,035 $ 255,533
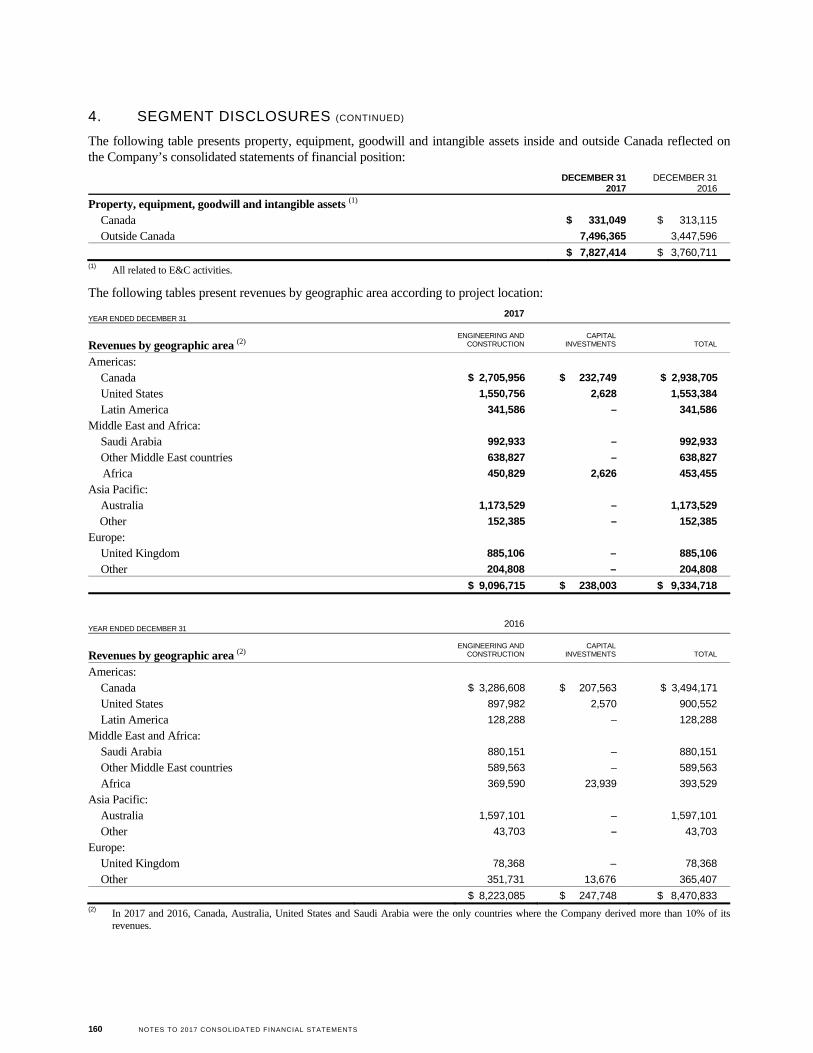
160 NOTES TO 2017 CONSOLIDATED FINANCIAL STATEMENTS
4. SEGMENT DISCLOSURES (CONTINUED)
The following table presents property, equipment, goodwill and intangible assets inside and outside Canada reflected on the Company’s consolidated statements of financial position:
DECEMBER 31
2017 DECEMBER 31
2016
Property, equipment, goodwill and intangible assets (1)
Canada $ 331,049 $ 313,115
Outside Canada 7,496,365 3,447,596
$ 7,827,414 $ 3,760,711 (1) All related to E&C activities.
The following tables present revenues by geographic area according to project location:
YEAR ENDED DECEMBER 31 2017
Revenues by geographic area (2) ENGINEERING AND
CONSTRUCTION CAPITAL
INVESTMENTS TOTAL
Americas:
Canada $ 2,705,956 $ 232,749 $ 2,938,705
United States 1,550,756 2,628 1,553,384
Latin America 341,586 – 341,586
Middle East and Africa:
Saudi Arabia 992,933 – 992,933
Other Middle East countries 638,827 – 638,827
Africa 450,829 2,626 453,455
Asia Pacific:
Australia 1,173,529 – 1,173,529
Other 152,385 – 152,385
Europe:
United Kingdom 885,106 – 885,106
Other 204,808 – 204,808
$ 9,096,715 $ 238,003 $ 9,334,718
YEAR ENDED DECEMBER 31 2016
Revenues by geographic area (2) ENGINEERING AND
CONSTRUCTION CAPITAL
INVESTMENTS TOTAL
Americas:
Canada $ 3,286,608 $ 207,563 $ 3,494,171
United States 897,982 2,570 900,552
Latin America 128,288 – 128,288
Middle East and Africa:
Saudi Arabia 880,151 – 880,151
Other Middle East countries 589,563 – 589,563
Africa 369,590 23,939 393,529
Asia Pacific:
Australia 1,597,101 – 1,597,101
Other 43,703 – 43,703
Europe:
United Kingdom 78,368 – 78,368
Other 351,731 13,676 365,407
$ 8,223,085 $ 247,748 $ 8,470,833 (2) In 2017 and 2016, Canada, Australia, United States and Saudi Arabia were the only countries where the Company derived more than 10% of its
revenues.
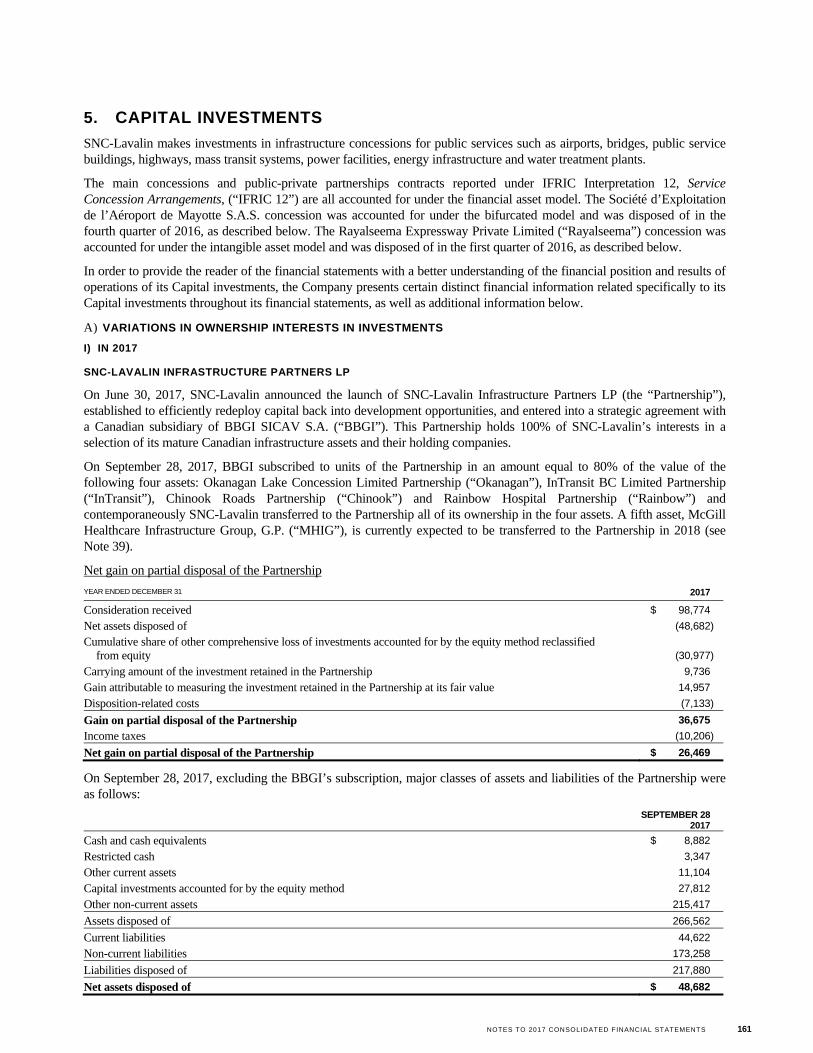
NOTES TO 2017 CONSOLIDATED FINANCIAL STATEMENTS 161
5. CAPITAL INVESTMENTS
SNC-Lavalin makes investments in infrastructure concessions for public services such as airports, bridges, public service buildings, highways, mass transit systems, power facilities, energy infrastructure and water treatment plants.
The main concessions and public-private partnerships contracts reported under IFRIC Interpretation 12, Service Concession Arrangements, (“IFRIC 12”) are all accounted for under the financial asset model. The Société d’Exploitation de l’Aéroport de Mayotte S.A.S. concession was accounted for under the bifurcated model and was disposed of in the fourth quarter of 2016, as described below. The Rayalseema Expressway Private Limited (“Rayalseema”) concession was accounted for under the intangible asset model and was disposed of in the first quarter of 2016, as described below.
In order to provide the reader of the financial statements with a better understanding of the financial position and results of operations of its Capital investments, the Company presents certain distinct financial information related specifically to its Capital investments throughout its financial statements, as well as additional information below.
A) VARIATIONS IN OWNERSHIP INTERESTS IN INVESTMENTS
I) IN 2017
SNC-LAVALIN INFRASTRUCTURE PARTNERS LP
On June 30, 2017, SNC-Lavalin announced the launch of SNC-Lavalin Infrastructure Partners LP (the “Partnership”), established to efficiently redeploy capital back into development opportunities, and entered into a strategic agreement with a Canadian subsidiary of BBGI SICAV S.A. (“BBGI”). This Partnership holds 100% of SNC-Lavalin’s interests in a selection of its mature Canadian infrastructure assets and their holding companies.
On September 28, 2017, BBGI subscribed to units of the Partnership in an amount equal to 80% of the value of the following four assets: Okanagan Lake Concession Limited Partnership (“Okanagan”), InTransit BC Limited Partnership (“InTransit”), Chinook Roads Partnership (“Chinook”) and Rainbow Hospital Partnership (“Rainbow”) and contemporaneously SNC-Lavalin transferred to the Partnership all of its ownership in the four assets. A fifth asset, McGill Healthcare Infrastructure Group, G.P. (“MHIG”), is currently expected to be transferred to the Partnership in 2018 (see Note 39).
Net gain on partial disposal of the Partnership
YEAR ENDED DECEMBER 31 2017
Consideration received $ 98,774
Net assets disposed of (48,682)
Cumulative share of other comprehensive loss of investments accounted for by the equity method reclassified from equity (30,977)
Carrying amount of the investment retained in the Partnership 9,736
Gain attributable to measuring the investment retained in the Partnership at its fair value 14,957
Disposition-related costs (7,133)
Gain on partial disposal of the Partnership 36,675
Income taxes (10,206)
Net gain on partial disposal of the Partnership $ 26,469
On September 28, 2017, excluding the BBGI’s subscription, major classes of assets and liabilities of the Partnership were as follows:
SEPTEMBER 28
2017
Cash and cash equivalents $ 8,882
Restricted cash 3,347
Other current assets 11,104
Capital investments accounted for by the equity method 27,812
Other non-current assets 215,417
Assets disposed of 266,562
Current liabilities 44,622
Non-current liabilities 173,258
Liabilities disposed of 217,880
Net assets disposed of $ 48,682
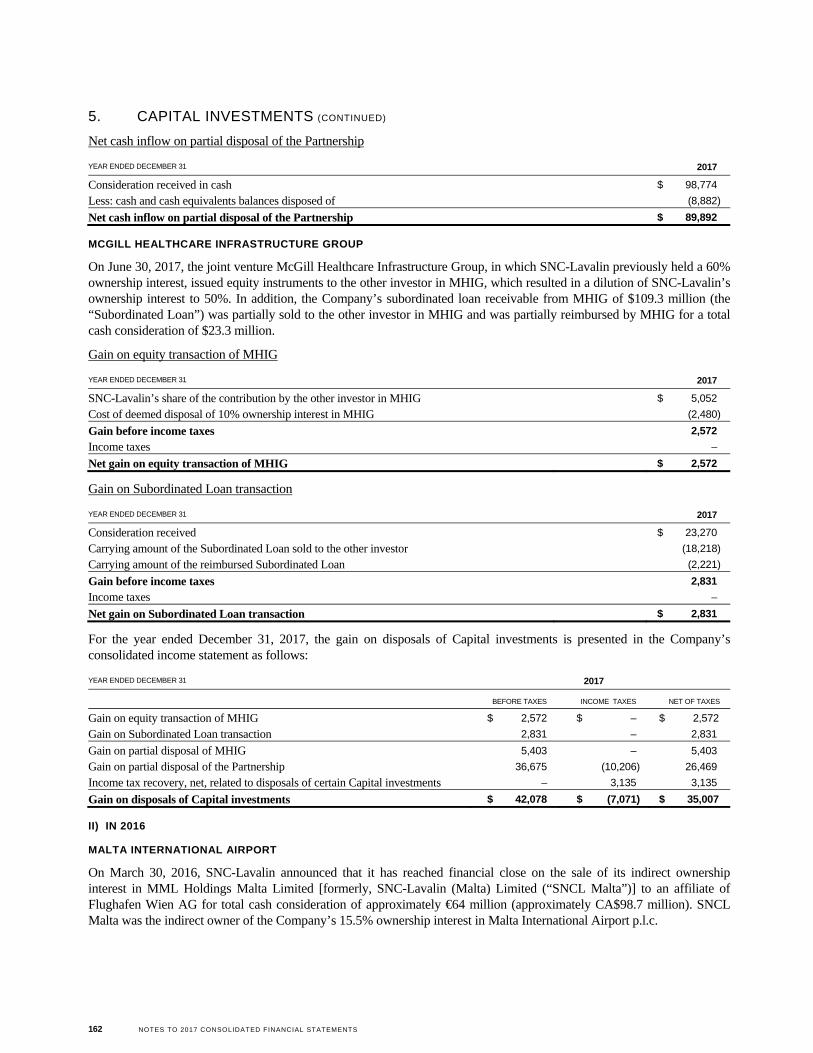
162 NOTES TO 2017 CONSOLIDATED FINANCIAL STATEMENTS
5. CAPITAL INVESTMENTS (CONTINUED)
Net cash inflow on partial disposal of the Partnership
YEAR ENDED DECEMBER 31 2017
Consideration received in cash $ 98,774
Less: cash and cash equivalents balances disposed of (8,882)
Net cash inflow on partial disposal of the Partnership $ 89,892
MCGILL HEALTHCARE INFRASTRUCTURE GROUP
On June 30, 2017, the joint venture McGill Healthcare Infrastructure Group, in which SNC-Lavalin previously held a 60% ownership interest, issued equity instruments to the other investor in MHIG, which resulted in a dilution of SNC-Lavalin’s ownership interest to 50%. In addition, the Company’s subordinated loan receivable from MHIG of $109.3 million (the “Subordinated Loan”) was partially sold to the other investor in MHIG and was partially reimbursed by MHIG for a total cash consideration of $23.3 million.
Gain on equity transaction of MHIG
YEAR ENDED DECEMBER 31 2017
SNC-Lavalin’s share of the contribution by the other investor in MHIG $ 5,052
Cost of deemed disposal of 10% ownership interest in MHIG (2,480)
Gain before income taxes 2,572
Income taxes –
Net gain on equity transaction of MHIG $ 2,572
Gain on Subordinated Loan transaction
YEAR ENDED DECEMBER 31 2017
Consideration received $ 23,270
Carrying amount of the Subordinated Loan sold to the other investor (18,218)
Carrying amount of the reimbursed Subordinated Loan (2,221)
Gain before income taxes 2,831
Income taxes –
Net gain on Subordinated Loan transaction $ 2,831
For the year ended December 31, 2017, the gain on disposals of Capital investments is presented in the Company’s consolidated income statement as follows:
YEAR ENDED DECEMBER 31 2017
BEFORE TAXES INCOME TAXES NET OF TAXES
Gain on equity transaction of MHIG $ 2,572 $ – $ 2,572
Gain on Subordinated Loan transaction 2,831 – 2,831
Gain on partial disposal of MHIG 5,403 – 5,403
Gain on partial disposal of the Partnership 36,675 (10,206) 26,469
Income tax recovery, net, related to disposals of certain Capital investments – 3,135 3,135
Gain on disposals of Capital investments $ 42,078 $ (7,071) $ 35,007
II) IN 2016
MALTA INTERNATIONAL AIRPORT
On March 30, 2016, SNC-Lavalin announced that it has reached financial close on the sale of its indirect ownership interest in MML Holdings Malta Limited [formerly, SNC-Lavalin (Malta) Limited (“SNCL Malta”)] to an affiliate of Flughafen Wien AG for total cash consideration of approximately €64 million (approximately CA$98.7 million). SNCL Malta was the indirect owner of the Company’s 15.5% ownership interest in Malta International Airport p.l.c.
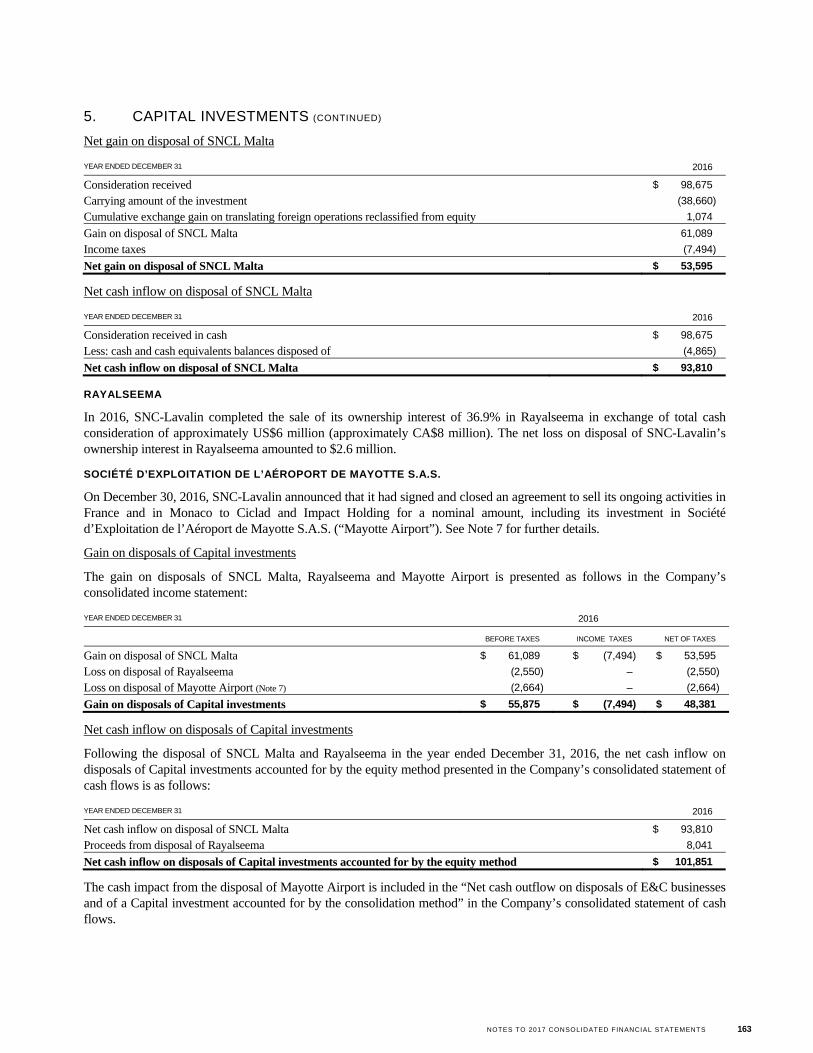
NOTES TO 2017 CONSOLIDATED FINANCIAL STATEMENTS 163
5. CAPITAL INVESTMENTS (CONTINUED)
Net gain on disposal of SNCL Malta
YEAR ENDED DECEMBER 31 2016
Consideration received $ 98,675
Carrying amount of the investment (38,660)
Cumulative exchange gain on translating foreign operations reclassified from equity 1,074
Gain on disposal of SNCL Malta 61,089
Income taxes (7,494)
Net gain on disposal of SNCL Malta $ 53,595
Net cash inflow on disposal of SNCL Malta
YEAR ENDED DECEMBER 31 2016
Consideration received in cash $ 98,675
Less: cash and cash equivalents balances disposed of (4,865)
Net cash inflow on disposal of SNCL Malta $ 93,810
RAYALSEEMA
In 2016, SNC-Lavalin completed the sale of its ownership interest of 36.9% in Rayalseema in exchange of total cash consideration of approximately US$6 million (approximately CA$8 million). The net loss on disposal of SNC-Lavalin’s ownership interest in Rayalseema amounted to $2.6 million.
SOCIÉTÉ D’EXPLOITATION DE L’AÉROPORT DE MAYOTTE S.A.S.
On December 30, 2016, SNC-Lavalin announced that it had signed and closed an agreement to sell its ongoing activities in France and in Monaco to Ciclad and Impact Holding for a nominal amount, including its investment in Société d’Exploitation de l’Aéroport de Mayotte S.A.S. (“Mayotte Airport”). See Note 7 for further details.
Gain on disposals of Capital investments
The gain on disposals of SNCL Malta, Rayalseema and Mayotte Airport is presented as follows in the Company’s consolidated income statement:
YEAR ENDED DECEMBER 31 2016
BEFORE TAXES INCOME TAXES NET OF TAXES
Gain on disposal of SNCL Malta $ 61,089 $ (7,494) $ 53,595
Loss on disposal of Rayalseema (2,550) – (2,550)
Loss on disposal of Mayotte Airport (Note 7) (2,664) – (2,664)
Gain on disposals of Capital investments $ 55,875 $ (7,494) $ 48,381
Net cash inflow on disposals of Capital investments
Following the disposal of SNCL Malta and Rayalseema in the year ended December 31, 2016, the net cash inflow on disposals of Capital investments accounted for by the equity method presented in the Company’s consolidated statement of cash flows is as follows:
YEAR ENDED DECEMBER 31 2016
Net cash inflow on disposal of SNCL Malta $ 93,810
Proceeds from disposal of Rayalseema 8,041
Net cash inflow on disposals of Capital investments accounted for by the equity method $ 101,851
The cash impact from the disposal of Mayotte Airport is included in the “Net cash outflow on disposals of E&C businesses and of a Capital investment accounted for by the consolidation method” in the Company’s consolidated statement of cash flows.
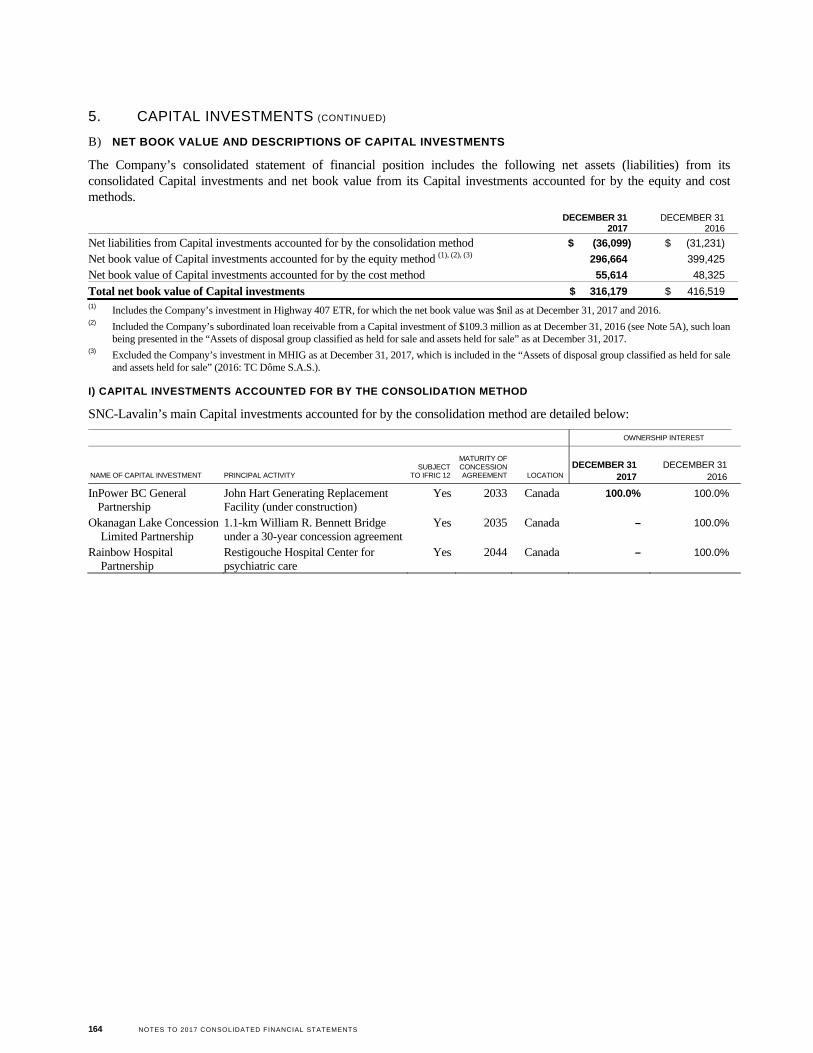
164 NOTES TO 2017 CONSOLIDATED FINANCIAL STATEMENTS
5. CAPITAL INVESTMENTS (CONTINUED)
B) NET BOOK VALUE AND DESCRIPTIONS OF CAPITAL INVESTMENTS
The Company’s consolidated statement of financial position includes the following net assets (liabilities) from its consolidated Capital investments and net book value from its Capital investments accounted for by the equity and cost methods.
DECEMBER 31
2017 DECEMBER 31
2016
Net liabilities from Capital investments accounted for by the consolidation method $ (36,099) $ (31,231)
Net book value of Capital investments accounted for by the equity method (1), (2), (3) 296,664 399,425
Net book value of Capital investments accounted for by the cost method 55,614 48,325
Total net book value of Capital investments $ 316,179 $ 416,519 (1) Includes the Company’s investment in Highway 407 ETR, for which the net book value was $nil as at December 31, 2017 and 2016. (2) Included the Company’s subordinated loan receivable from a Capital investment of $109.3 million as at December 31, 2016 (see Note 5A), such loan
being presented in the “Assets of disposal group classified as held for sale and assets held for sale” as at December 31, 2017. (3) Excluded the Company’s investment in MHIG as at December 31, 2017, which is included in the “Assets of disposal group classified as held for sale
and assets held for sale” (2016: TC Dôme S.A.S.).
I) CAPITAL INVESTMENTS ACCOUNTED FOR BY THE CONSOLIDATION METHOD
SNC-Lavalin’s main Capital investments accounted for by the consolidation method are detailed below:
OWNERSHIP INTEREST
NAME OF CAPITAL INVESTMENT PRINCIPAL ACTIVITY SUBJECT
TO IFRIC 12
MATURITY OF CONCESSION AGREEMENT LOCATION
DECEMBER 31 2017
DECEMBER 31 2016
InPower BC General Partnership
John Hart Generating Replacement Facility (under construction)
Yes 2033 Canada 100.0% 100.0%
Okanagan Lake Concession Limited Partnership
1.1-km William R. Bennett Bridge under a 30-year concession agreement
Yes 2035 Canada – 100.0%
Rainbow Hospital Partnership
Restigouche Hospital Center for psychiatric care
Yes 2044 Canada – 100.0%
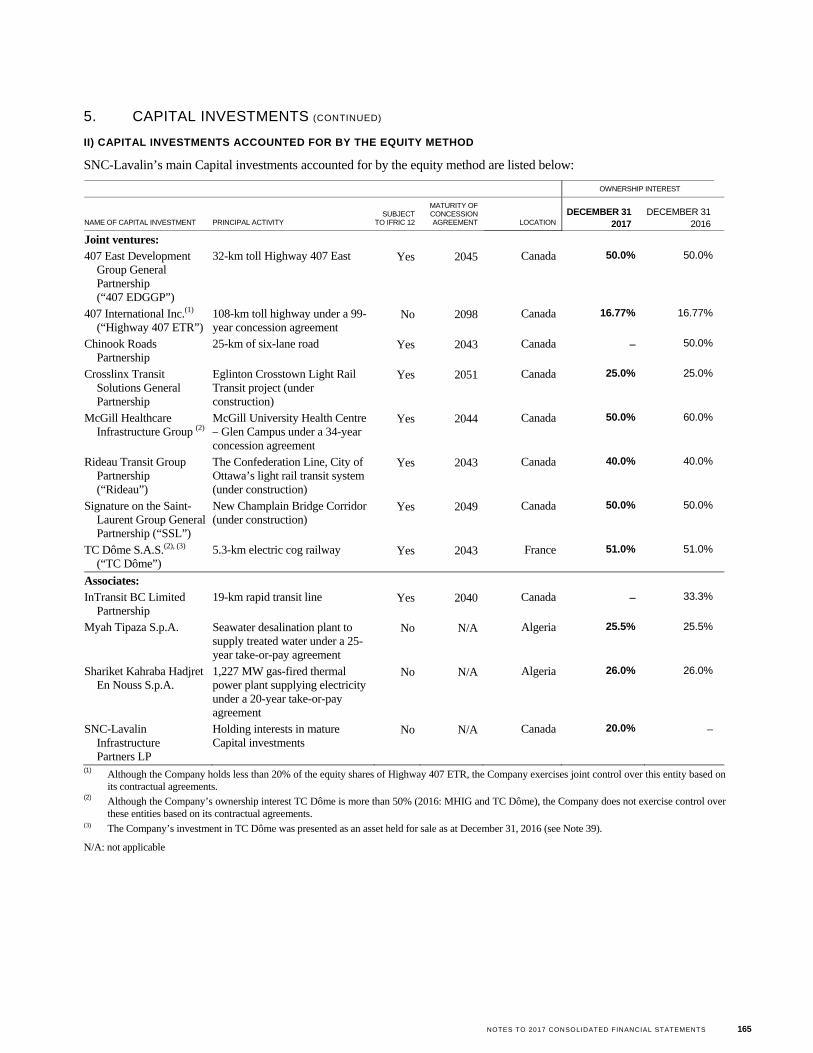
NOTES TO 2017 CONSOLIDATED FINANCIAL STATEMENTS 165
5. CAPITAL INVESTMENTS (CONTINUED)
II) CAPITAL INVESTMENTS ACCOUNTED FOR BY THE EQUITY METHOD
SNC-Lavalin’s main Capital investments accounted for by the equity method are listed below:
OWNERSHIP INTEREST
NAME OF CAPITAL INVESTMENT PRINCIPAL ACTIVITY SUBJECT
TO IFRIC 12
MATURITY OF CONCESSION AGREEMENT LOCATION
DECEMBER 31 2017
DECEMBER 31 2016
Joint ventures:
407 East Development Group General Partnership (“407 EDGGP”)
32-km toll Highway 407 East Yes 2045 Canada 50.0% 50.0%
407 International Inc.(1) (“Highway 407 ETR”)
108-km toll highway under a 99-year concession agreement
No 2098 Canada 16.77% 16.77%
Chinook Roads Partnership
25-km of six-lane road Yes 2043 Canada – 50.0%
Crosslinx Transit Solutions General Partnership
Eglinton Crosstown Light Rail Transit project (under construction)
Yes 2051 Canada 25.0% 25.0%
McGill Healthcare Infrastructure Group (2)
McGill University Health Centre – Glen Campus under a 34-year concession agreement
Yes 2044 Canada 50.0% 60.0%
Rideau Transit Group Partnership (“Rideau”)
The Confederation Line, City of Ottawa’s light rail transit system (under construction)
Yes 2043 Canada 40.0% 40.0%
Signature on the Saint-Laurent Group General Partnership (“SSL”)
New Champlain Bridge Corridor (under construction)
Yes 2049 Canada 50.0% 50.0%
TC Dôme S.A.S.(2), (3) (“TC Dôme”)
5.3-km electric cog railway Yes 2043 France 51.0% 51.0%
Associates:
InTransit BC Limited Partnership
19-km rapid transit line Yes 2040 Canada – 33.3%
Myah Tipaza S.p.A. Seawater desalination plant to supply treated water under a 25-year take-or-pay agreement
No N/A Algeria 25.5% 25.5%
Shariket Kahraba Hadjret En Nouss S.p.A.
1,227 MW gas-fired thermal power plant supplying electricity under a 20-year take-or-pay agreement
No N/A Algeria 26.0% 26.0%
SNC-Lavalin Infrastructure Partners LP
Holding interests in mature Capital investments
No N/A Canada 20.0% –
(1) Although the Company holds less than 20% of the equity shares of Highway 407 ETR, the Company exercises joint control over this entity based on its contractual agreements.
(2) Although the Company’s ownership interest TC Dôme is more than 50% (2016: MHIG and TC Dôme), the Company does not exercise control over these entities based on its contractual agreements.
(3) The Company’s investment in TC Dôme was presented as an asset held for sale as at December 31, 2016 (see Note 39).
N/A: not applicable
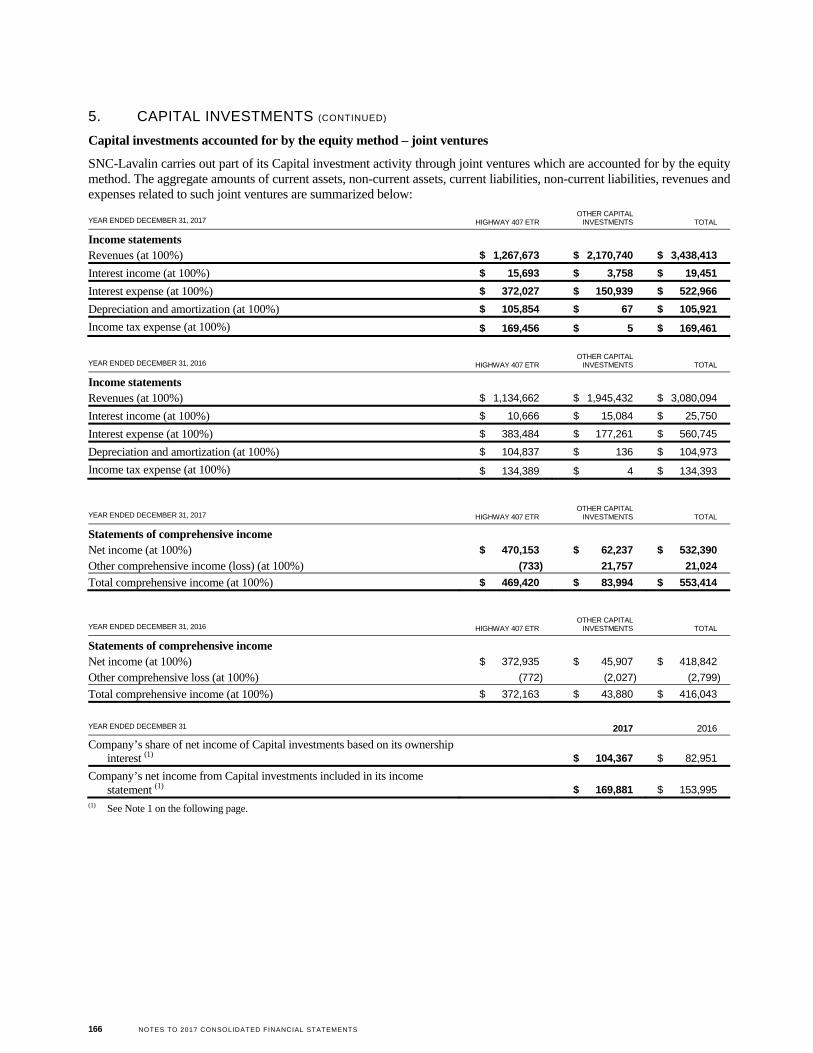
166 NOTES TO 2017 CONSOLIDATED FINANCIAL STATEMENTS
5. CAPITAL INVESTMENTS (CONTINUED)
Capital investments accounted for by the equity method – joint ventures
SNC-Lavalin carries out part of its Capital investment activity through joint ventures which are accounted for by the equity method. The aggregate amounts of current assets, non-current assets, current liabilities, non-current liabilities, revenues and expenses related to such joint ventures are summarized below:
YEAR ENDED DECEMBER 31, 2017 HIGHWAY 407 ETR OTHER CAPITAL
INVESTMENTS TOTAL
Income statements Revenues (at 100%) $ 1,267,673 $ 2,170,740 $ 3,438,413
Interest income (at 100%) $ 15,693 $ 3,758 $ 19,451
Interest expense (at 100%) $ 372,027 $ 150,939 $ 522,966
Depreciation and amortization (at 100%) $ 105,854 $ 67 $ 105,921
Income tax expense (at 100%) $ 169,456 $ 5 $ 169,461
YEAR ENDED DECEMBER 31, 2016 HIGHWAY 407 ETR
OTHER CAPITAL INVESTMENTS TOTAL
Income statements Revenues (at 100%) $ 1,134,662 $ 1,945,432 $ 3,080,094
Interest income (at 100%) $ 10,666 $ 15,084 $ 25,750
Interest expense (at 100%) $ 383,484 $ 177,261 $ 560,745
Depreciation and amortization (at 100%) $ 104,837 $ 136 $ 104,973
Income tax expense (at 100%) $ 134,389 $ 4 $ 134,393
YEAR ENDED DECEMBER 31, 2017 HIGHWAY 407 ETR OTHER CAPITAL
INVESTMENTS TOTAL
Statements of comprehensive income
Net income (at 100%) $ 470,153 $ 62,237 $ 532,390
Other comprehensive income (loss) (at 100%) (733) 21,757 21,024
Total comprehensive income (at 100%) $ 469,420 $ 83,994 $ 553,414
YEAR ENDED DECEMBER 31, 2016 HIGHWAY 407 ETR OTHER CAPITAL
INVESTMENTS TOTAL
Statements of comprehensive income
Net income (at 100%) $ 372,935 $ 45,907 $ 418,842
Other comprehensive loss (at 100%) (772) (2,027) (2,799)
Total comprehensive income (at 100%) $ 372,163 $ 43,880 $ 416,043
YEAR ENDED DECEMBER 31 2017 2016
Company’s share of net income of Capital investments based on its ownership interest (1) $ 104,367 $ 82,951
Company’s net income from Capital investments included in its income statement (1) $ 169,881 $ 153,995
(1) See Note 1 on the following page.
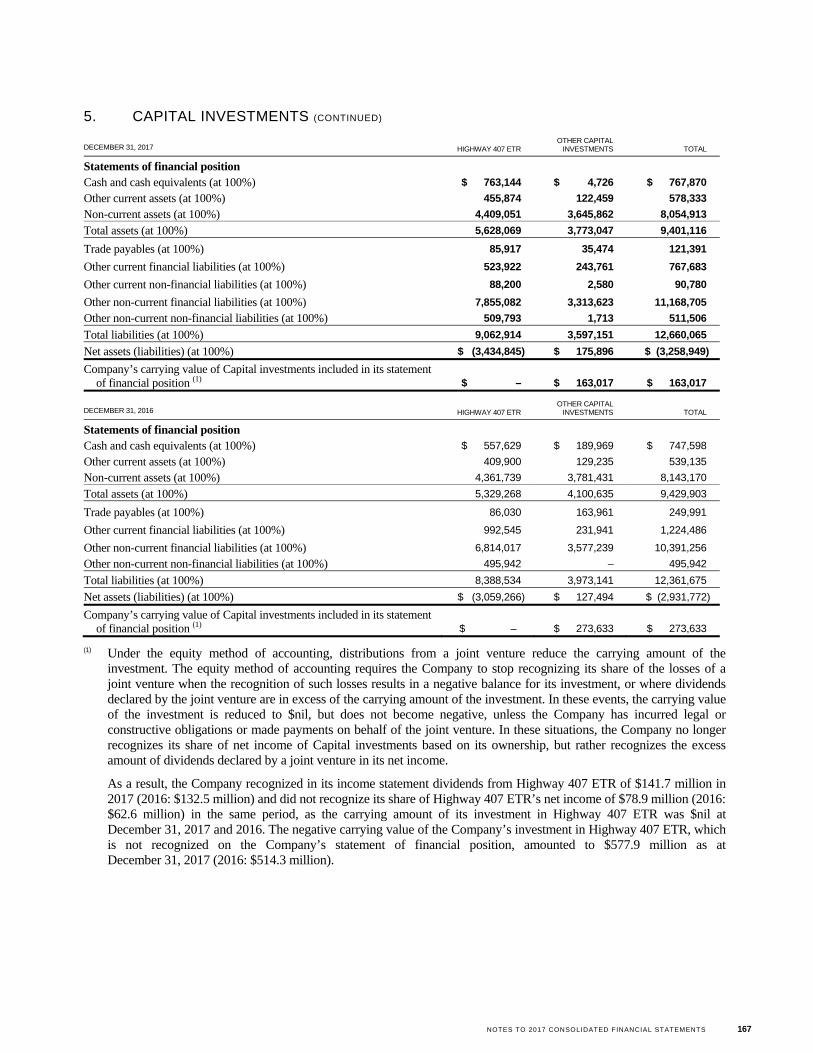
NOTES TO 2017 CONSOLIDATED FINANCIAL STATEMENTS 167
5. CAPITAL INVESTMENTS (CONTINUED)
DECEMBER 31, 2017 HIGHWAY 407 ETR OTHER CAPITAL
INVESTMENTS TOTAL
Statements of financial position
Cash and cash equivalents (at 100%) $ 763,144 $ 4,726 $ 767,870
Other current assets (at 100%) 455,874 122,459 578,333
Non-current assets (at 100%) 4,409,051 3,645,862 8,054,913
Total assets (at 100%) 5,628,069 3,773,047 9,401,116
Trade payables (at 100%) 85,917 35,474 121,391
Other current financial liabilities (at 100%) 523,922 243,761 767,683
Other current non-financial liabilities (at 100%) 88,200 2,580 90,780
Other non-current financial liabilities (at 100%) 7,855,082 3,313,623 11,168,705
Other non-current non-financial liabilities (at 100%) 509,793 1,713 511,506
Total liabilities (at 100%) 9,062,914 3,597,151 12,660,065
Net assets (liabilities) (at 100%) $ (3,434,845) $ 175,896 $ (3,258,949)
Company’s carrying value of Capital investments included in its statement of financial position (1) $ – $ 163,017 $ 163,017
DECEMBER 31, 2016 HIGHWAY 407 ETR OTHER CAPITAL
INVESTMENTS TOTAL
Statements of financial position
Cash and cash equivalents (at 100%) $ 557,629 $ 189,969 $ 747,598
Other current assets (at 100%) 409,900 129,235 539,135
Non-current assets (at 100%) 4,361,739 3,781,431 8,143,170
Total assets (at 100%) 5,329,268 4,100,635 9,429,903
Trade payables (at 100%) 86,030 163,961 249,991
Other current financial liabilities (at 100%) 992,545 231,941 1,224,486
Other non-current financial liabilities (at 100%) 6,814,017 3,577,239 10,391,256
Other non-current non-financial liabilities (at 100%) 495,942 – 495,942
Total liabilities (at 100%) 8,388,534 3,973,141 12,361,675
Net assets (liabilities) (at 100%) $ (3,059,266) $ 127,494 $ (2,931,772)
Company’s carrying value of Capital investments included in its statement of financial position (1) $ – $ 273,633 $ 273,633
(1) Under the equity method of accounting, distributions from a joint venture reduce the carrying amount of the investment. The equity method of accounting requires the Company to stop recognizing its share of the losses of a joint venture when the recognition of such losses results in a negative balance for its investment, or where dividends declared by the joint venture are in excess of the carrying amount of the investment. In these events, the carrying value of the investment is reduced to $nil, but does not become negative, unless the Company has incurred legal or constructive obligations or made payments on behalf of the joint venture. In these situations, the Company no longer recognizes its share of net income of Capital investments based on its ownership, but rather recognizes the excess amount of dividends declared by a joint venture in its net income.
As a result, the Company recognized in its income statement dividends from Highway 407 ETR of $141.7 million in 2017 (2016: $132.5 million) and did not recognize its share of Highway 407 ETR’s net income of $78.9 million (2016: $62.6 million) in the same period, as the carrying amount of its investment in Highway 407 ETR was $nil at December 31, 2017 and 2016. The negative carrying value of the Company’s investment in Highway 407 ETR, which is not recognized on the Company’s statement of financial position, amounted to $577.9 million as at December 31, 2017 (2016: $514.3 million).
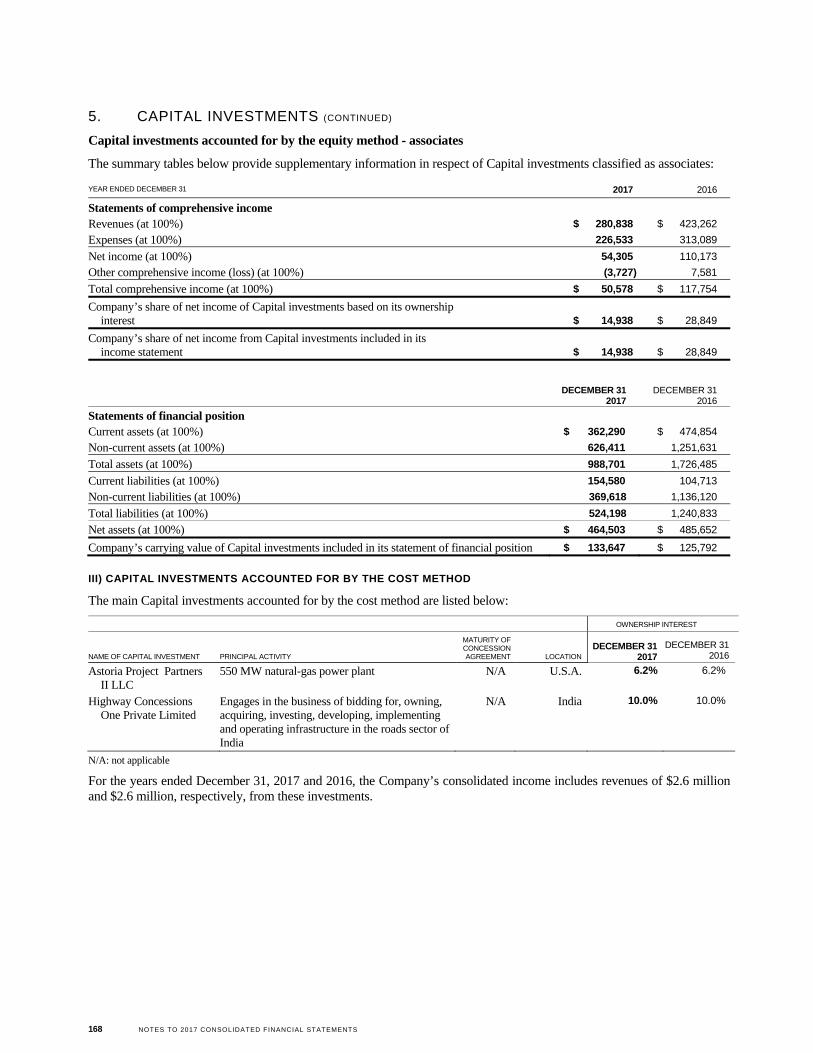
168 NOTES TO 2017 CONSOLIDATED FINANCIAL STATEMENTS
5. CAPITAL INVESTMENTS (CONTINUED)
Capital investments accounted for by the equity method - associates
The summary tables below provide supplementary information in respect of Capital investments classified as associates:
YEAR ENDED DECEMBER 31 2017 2016
Statements of comprehensive income
Revenues (at 100%) $ 280,838 $ 423,262
Expenses (at 100%) 226,533 313,089
Net income (at 100%) 54,305 110,173
Other comprehensive income (loss) (at 100%) (3,727) 7,581
Total comprehensive income (at 100%) $ 50,578 $ 117,754
Company’s share of net income of Capital investments based on its ownership interest $ 14,938 $ 28,849
Company’s share of net income from Capital investments included in its income statement $ 14,938 $ 28,849
DECEMBER 31
2017 DECEMBER 31
2016
Statements of financial position
Current assets (at 100%) $ 362,290 $ 474,854
Non-current assets (at 100%) 626,411 1,251,631
Total assets (at 100%) 988,701 1,726,485
Current liabilities (at 100%) 154,580 104,713
Non-current liabilities (at 100%) 369,618 1,136,120
Total liabilities (at 100%) 524,198 1,240,833
Net assets (at 100%) $ 464,503 $ 485,652
Company’s carrying value of Capital investments included in its statement of financial position $ 133,647 $ 125,792
III) CAPITAL INVESTMENTS ACCOUNTED FOR BY THE COST METHOD
The main Capital investments accounted for by the cost method are listed below:
OWNERSHIP INTEREST
NAME OF CAPITAL INVESTMENT PRINCIPAL ACTIVITY
MATURITY OF CONCESSION AGREEMENT LOCATION
DECEMBER 31 2017
DECEMBER 31 2016
Astoria Project Partners II LLC
550 MW natural-gas power plant N/A U.S.A. 6.2% 6.2%
Highway Concessions One Private Limited
Engages in the business of bidding for, owning, acquiring, investing, developing, implementing and operating infrastructure in the roads sector of India
N/A India 10.0% 10.0%
N/A: not applicable
For the years ended December 31, 2017 and 2016, the Company’s consolidated income includes revenues of $2.6 million and $2.6 million, respectively, from these investments.
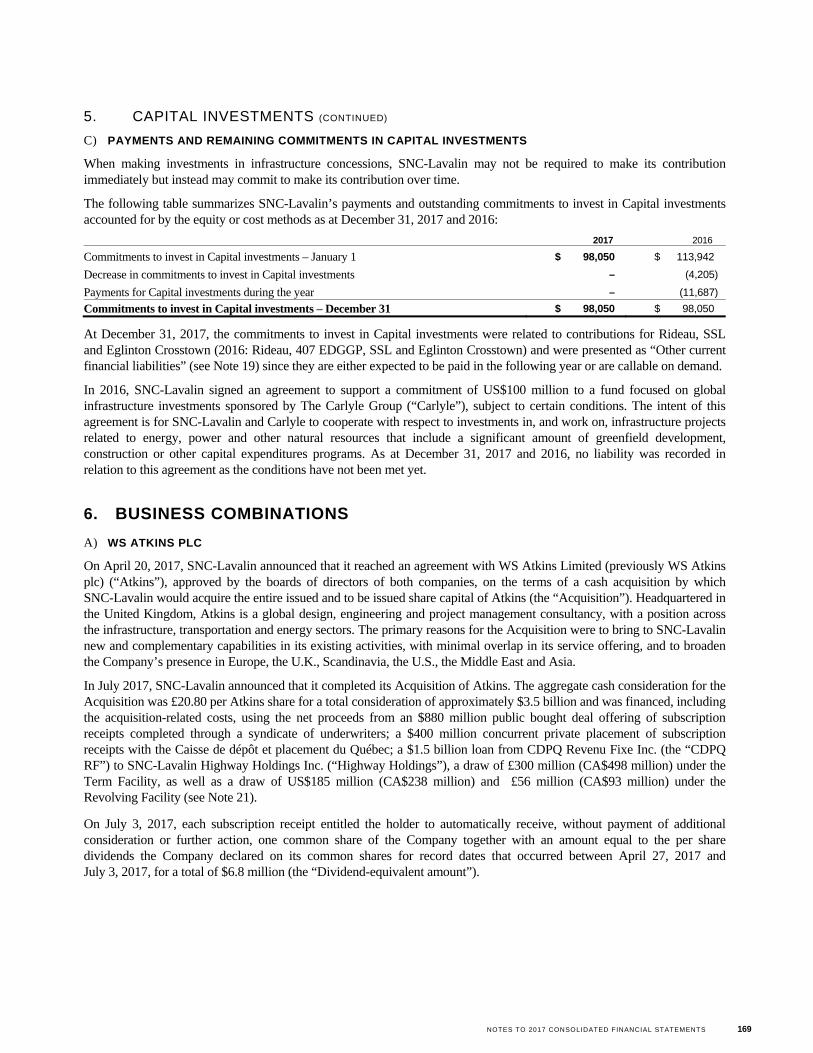
NOTES TO 2017 CONSOLIDATED FINANCIAL STATEMENTS 169
5. CAPITAL INVESTMENTS (CONTINUED)
C) PAYMENTS AND REMAINING COMMITMENTS IN CAPITAL INVESTMENTS
When making investments in infrastructure concessions, SNC-Lavalin may not be required to make its contribution immediately but instead may commit to make its contribution over time.
The following table summarizes SNC-Lavalin’s payments and outstanding commitments to invest in Capital investments accounted for by the equity or cost methods as at December 31, 2017 and 2016:
2017 2016
Commitments to invest in Capital investments – January 1 $ 98,050 $ 113,942
Decrease in commitments to invest in Capital investments – (4,205)
Payments for Capital investments during the year – (11,687)
Commitments to invest in Capital investments – December 31 $ 98,050 $ 98,050
At December 31, 2017, the commitments to invest in Capital investments were related to contributions for Rideau, SSL and Eglinton Crosstown (2016: Rideau, 407 EDGGP, SSL and Eglinton Crosstown) and were presented as “Other current financial liabilities” (see Note 19) since they are either expected to be paid in the following year or are callable on demand.
In 2016, SNC-Lavalin signed an agreement to support a commitment of US$100 million to a fund focused on global infrastructure investments sponsored by The Carlyle Group (“Carlyle”), subject to certain conditions. The intent of this agreement is for SNC-Lavalin and Carlyle to cooperate with respect to investments in, and work on, infrastructure projects related to energy, power and other natural resources that include a significant amount of greenfield development, construction or other capital expenditures programs. As at December 31, 2017 and 2016, no liability was recorded in relation to this agreement as the conditions have not been met yet.
6. BUSINESS COMBINATIONS
A) WS ATKINS PLC
On April 20, 2017, SNC-Lavalin announced that it reached an agreement with WS Atkins Limited (previously WS Atkins plc) (“Atkins”), approved by the boards of directors of both companies, on the terms of a cash acquisition by which SNC-Lavalin would acquire the entire issued and to be issued share capital of Atkins (the “Acquisition”). Headquartered in the United Kingdom, Atkins is a global design, engineering and project management consultancy, with a position across the infrastructure, transportation and energy sectors. The primary reasons for the Acquisition were to bring to SNC-Lavalin new and complementary capabilities in its existing activities, with minimal overlap in its service offering, and to broaden the Company’s presence in Europe, the U.K., Scandinavia, the U.S., the Middle East and Asia.
In July 2017, SNC-Lavalin announced that it completed its Acquisition of Atkins. The aggregate cash consideration for the Acquisition was £20.80 per Atkins share for a total consideration of approximately $3.5 billion and was financed, including the acquisition-related costs, using the net proceeds from an $880 million public bought deal offering of subscription receipts completed through a syndicate of underwriters; a $400 million concurrent private placement of subscription receipts with the Caisse de dépôt et placement du Québec; a $1.5 billion loan from CDPQ Revenu Fixe Inc. (the “CDPQ RF”) to SNC-Lavalin Highway Holdings Inc. (“Highway Holdings”), a draw of £300 million (CA$498 million) under the Term Facility, as well as a draw of US$185 million (CA$238 million) and £56 million (CA$93 million) under the Revolving Facility (see Note 21).
On July 3, 2017, each subscription receipt entitled the holder to automatically receive, without payment of additional consideration or further action, one common share of the Company together with an amount equal to the per share dividends the Company declared on its common shares for record dates that occurred between April 27, 2017 and July 3, 2017, for a total of $6.8 million (the “Dividend-equivalent amount”).
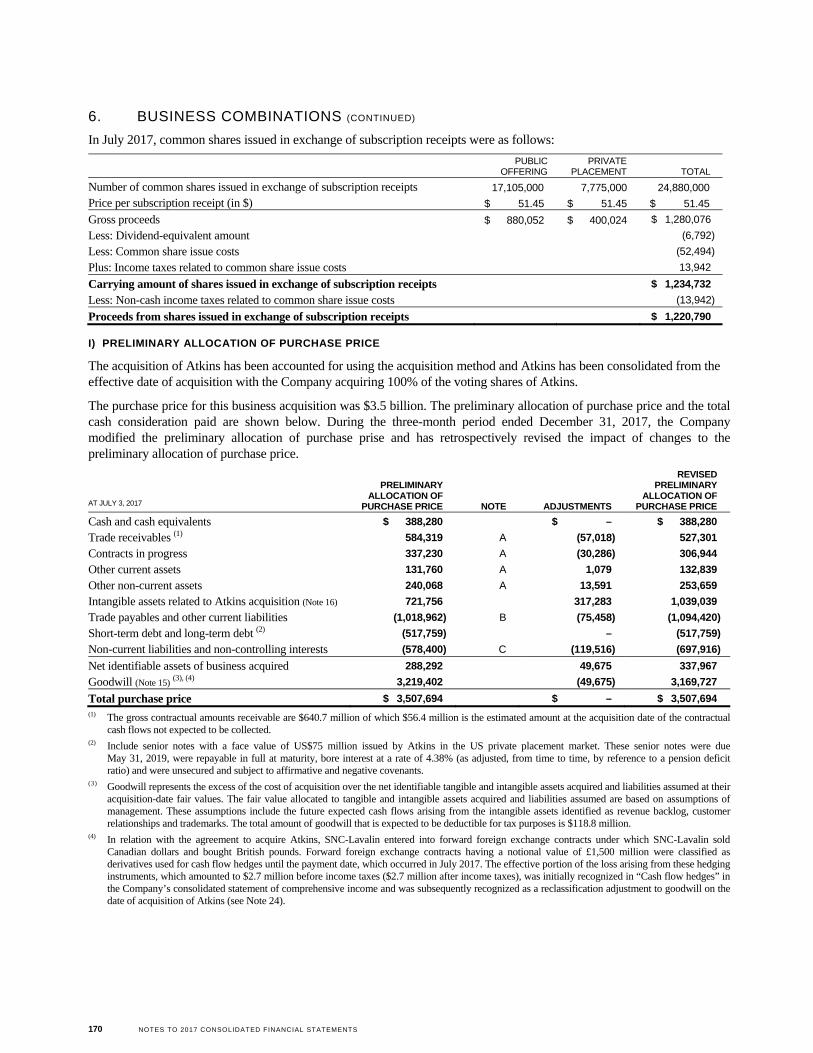
170 NOTES TO 2017 CONSOLIDATED FINANCIAL STATEMENTS
6. BUSINESS COMBINATIONS (CONTINUED)
In July 2017, common shares issued in exchange of subscription receipts were as follows:
PUBLIC
OFFERING PRIVATE
PLACEMENT TOTAL
Number of common shares issued in exchange of subscription receipts 17,105,000 7,775,000 24,880,000
Price per subscription receipt (in $) $ 51.45 $ 51.45 $ 51.45
Gross proceeds $ 880,052 $ 400,024 $ 1,280,076
Less: Dividend-equivalent amount (6,792)
Less: Common share issue costs (52,494)
Plus: Income taxes related to common share issue costs 13,942
Carrying amount of shares issued in exchange of subscription receipts $ 1,234,732
Less: Non-cash income taxes related to common share issue costs (13,942)
Proceeds from shares issued in exchange of subscription receipts $ 1,220,790
I) PRELIMINARY ALLOCATION OF PURCHASE PRICE
The acquisition of Atkins has been accounted for using the acquisition method and Atkins has been consolidated from the effective date of acquisition with the Company acquiring 100% of the voting shares of Atkins.
The purchase price for this business acquisition was $3.5 billion. The preliminary allocation of purchase price and the total cash consideration paid are shown below. During the three-month period ended December 31, 2017, the Company modified the preliminary allocation of purchase prise and has retrospectively revised the impact of changes to the preliminary allocation of purchase price.
AT JULY 3, 2017
PRELIMINARY ALLOCATION OF
PURCHASE PRICE NOTE ADJUSTMENTS
REVISED PRELIMINARY
ALLOCATION OF PURCHASE PRICE
Cash and cash equivalents $ 388,280 $ – $ 388,280
Trade receivables (1) 584,319 A (57,018) 527,301
Contracts in progress 337,230 A (30,286) 306,944
Other current assets 131,760 A 1,079 132,839
Other non-current assets 240,068 A 13,591 253,659
Intangible assets related to Atkins acquisition (Note 16) 721,756 317,283 1,039,039
Trade payables and other current liabilities (1,018,962) B (75,458) (1,094,420)
Short-term debt and long-term debt (2) (517,759) – (517,759)
Non-current liabilities and non-controlling interests (578,400) C (119,516) (697,916)
Net identifiable assets of business acquired 288,292 49,675 337,967
Goodwill (Note 15) (3), (4) 3,219,402 (49,675) 3,169,727
Total purchase price $ 3,507,694 $ – $ 3,507,694 (1) The gross contractual amounts receivable are $640.7 million of which $56.4 million is the estimated amount at the acquisition date of the contractual
cash flows not expected to be collected. (2) Include senior notes with a face value of US$75 million issued by Atkins in the US private placement market. These senior notes were due
May 31, 2019, were repayable in full at maturity, bore interest at a rate of 4.38% (as adjusted, from time to time, by reference to a pension deficit ratio) and were unsecured and subject to affirmative and negative covenants.
(3) Goodwill represents the excess of the cost of acquisition over the net identifiable tangible and intangible assets acquired and liabilities assumed at their acquisition-date fair values. The fair value allocated to tangible and intangible assets acquired and liabilities assumed are based on assumptions of management. These assumptions include the future expected cash flows arising from the intangible assets identified as revenue backlog, customer relationships and trademarks. The total amount of goodwill that is expected to be deductible for tax purposes is $118.8 million.
(4) In relation with the agreement to acquire Atkins, SNC-Lavalin entered into forward foreign exchange contracts under which SNC-Lavalin sold Canadian dollars and bought British pounds. Forward foreign exchange contracts having a notional value of £1,500 million were classified as derivatives used for cash flow hedges until the payment date, which occurred in July 2017. The effective portion of the loss arising from these hedging instruments, which amounted to $2.7 million before income taxes ($2.7 million after income taxes), was initially recognized in “Cash flow hedges” in the Company’s consolidated statement of comprehensive income and was subsequently recognized as a reclassification adjustment to goodwill on the date of acquisition of Atkins (see Note 24).
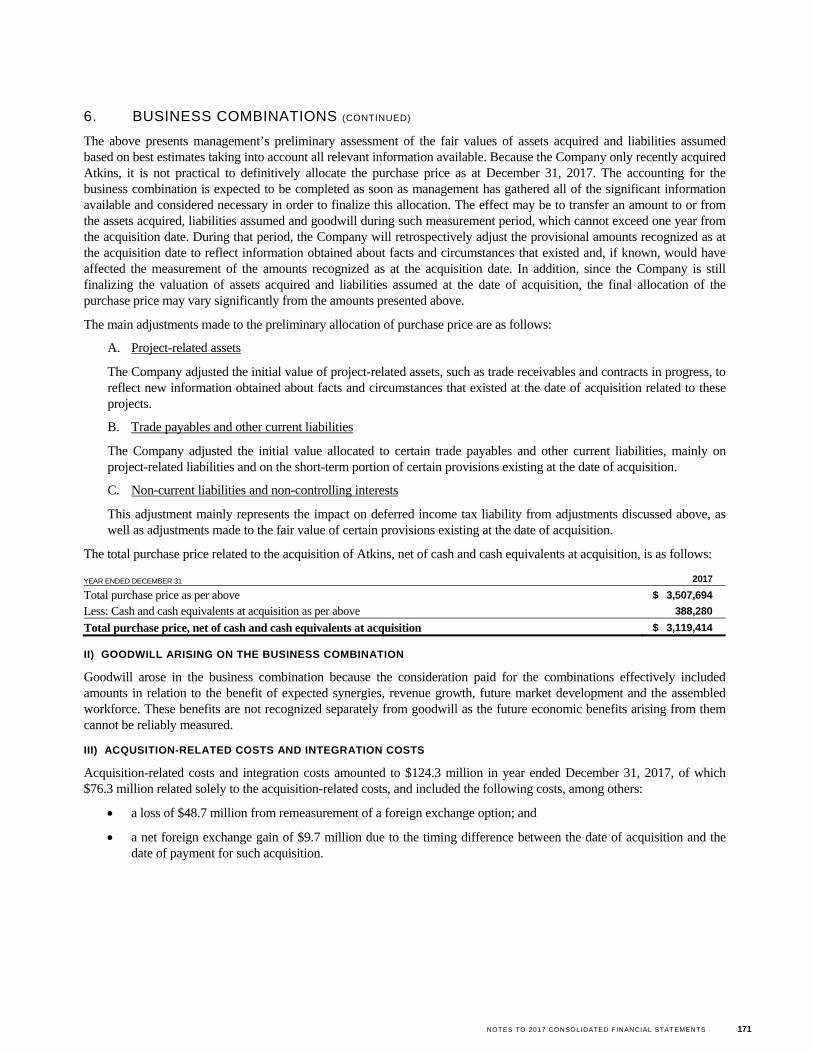
NOTES TO 2017 CONSOLIDATED FINANCIAL STATEMENTS 171
6. BUSINESS COMBINATIONS (CONTINUED)
The above presents management’s preliminary assessment of the fair values of assets acquired and liabilities assumed based on best estimates taking into account all relevant information available. Because the Company only recently acquired Atkins, it is not practical to definitively allocate the purchase price as at December 31, 2017. The accounting for the business combination is expected to be completed as soon as management has gathered all of the significant information available and considered necessary in order to finalize this allocation. The effect may be to transfer an amount to or from the assets acquired, liabilities assumed and goodwill during such measurement period, which cannot exceed one year from the acquisition date. During that period, the Company will retrospectively adjust the provisional amounts recognized as at the acquisition date to reflect information obtained about facts and circumstances that existed and, if known, would have affected the measurement of the amounts recognized as at the acquisition date. In addition, since the Company is still finalizing the valuation of assets acquired and liabilities assumed at the date of acquisition, the final allocation of the purchase price may vary significantly from the amounts presented above.
The main adjustments made to the preliminary allocation of purchase price are as follows:
A. Project-related assets
The Company adjusted the initial value of project-related assets, such as trade receivables and contracts in progress, to reflect new information obtained about facts and circumstances that existed at the date of acquisition related to these projects.
B. Trade payables and other current liabilities
The Company adjusted the initial value allocated to certain trade payables and other current liabilities, mainly on project-related liabilities and on the short-term portion of certain provisions existing at the date of acquisition.
C. Non-current liabilities and non-controlling interests
This adjustment mainly represents the impact on deferred income tax liability from adjustments discussed above, as well as adjustments made to the fair value of certain provisions existing at the date of acquisition.
The total purchase price related to the acquisition of Atkins, net of cash and cash equivalents at acquisition, is as follows:
YEAR ENDED DECEMBER 31 2017
Total purchase price as per above $ 3,507,694
Less: Cash and cash equivalents at acquisition as per above 388,280
Total purchase price, net of cash and cash equivalents at acquisition $ 3,119,414
II) GOODWILL ARISING ON THE BUSINESS COMBINATION
Goodwill arose in the business combination because the consideration paid for the combinations effectively included amounts in relation to the benefit of expected synergies, revenue growth, future market development and the assembled workforce. These benefits are not recognized separately from goodwill as the future economic benefits arising from them cannot be reliably measured.
III) ACQUSITION-RELATED COSTS AND INTEGRATION COSTS
Acquisition-related costs and integration costs amounted to $124.3 million in year ended December 31, 2017, of which $76.3 million related solely to the acquisition-related costs, and included the following costs, among others:
a loss of $48.7 million from remeasurement of a foreign exchange option; and
a net foreign exchange gain of $9.7 million due to the timing difference between the date of acquisition and the date of payment for such acquisition.
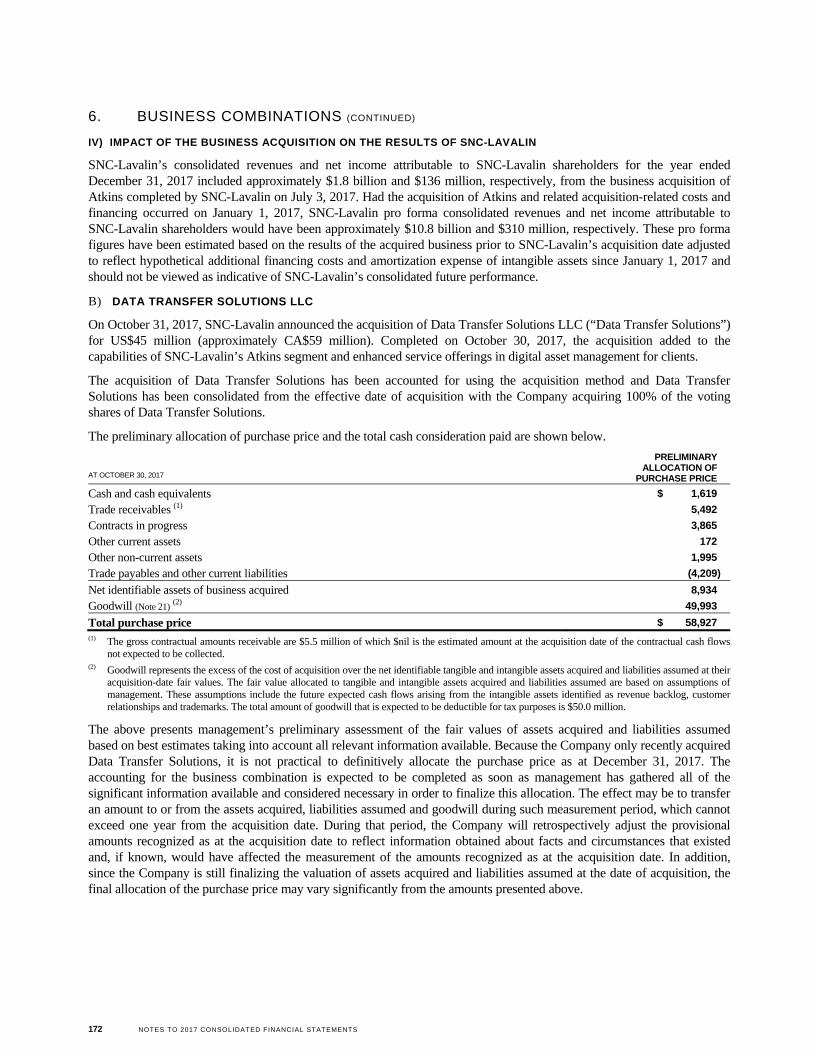
172 NOTES TO 2017 CONSOLIDATED FINANCIAL STATEMENTS
6. BUSINESS COMBINATIONS (CONTINUED)
IV) IMPACT OF THE BUSINESS ACQUISITION ON THE RESULTS OF SNC-LAVALIN
SNC-Lavalin’s consolidated revenues and net income attributable to SNC-Lavalin shareholders for the year ended December 31, 2017 included approximately $1.8 billion and $136 million, respectively, from the business acquisition of Atkins completed by SNC-Lavalin on July 3, 2017. Had the acquisition of Atkins and related acquisition-related costs and financing occurred on January 1, 2017, SNC-Lavalin pro forma consolidated revenues and net income attributable to SNC-Lavalin shareholders would have been approximately $10.8 billion and $310 million, respectively. These pro forma figures have been estimated based on the results of the acquired business prior to SNC-Lavalin’s acquisition date adjusted to reflect hypothetical additional financing costs and amortization expense of intangible assets since January 1, 2017 and should not be viewed as indicative of SNC-Lavalin’s consolidated future performance.
B) DATA TRANSFER SOLUTIONS LLC
On October 31, 2017, SNC-Lavalin announced the acquisition of Data Transfer Solutions LLC (“Data Transfer Solutions”) for US$45 million (approximately CA$59 million). Completed on October 30, 2017, the acquisition added to the capabilities of SNC-Lavalin’s Atkins segment and enhanced service offerings in digital asset management for clients.
The acquisition of Data Transfer Solutions has been accounted for using the acquisition method and Data Transfer Solutions has been consolidated from the effective date of acquisition with the Company acquiring 100% of the voting shares of Data Transfer Solutions.
The preliminary allocation of purchase price and the total cash consideration paid are shown below.
AT OCTOBER 30, 2017
PRELIMINARY ALLOCATION OF
PURCHASE PRICE
Cash and cash equivalents $ 1,619
Trade receivables (1) 5,492
Contracts in progress 3,865
Other current assets 172
Other non-current assets 1,995
Trade payables and other current liabilities (4,209)
Net identifiable assets of business acquired 8,934
Goodwill (Note 21) (2) 49,993
Total purchase price $ 58,927 (1) The gross contractual amounts receivable are $5.5 million of which $nil is the estimated amount at the acquisition date of the contractual cash flows
not expected to be collected. (2) Goodwill represents the excess of the cost of acquisition over the net identifiable tangible and intangible assets acquired and liabilities assumed at their
acquisition-date fair values. The fair value allocated to tangible and intangible assets acquired and liabilities assumed are based on assumptions of management. These assumptions include the future expected cash flows arising from the intangible assets identified as revenue backlog, customer relationships and trademarks. The total amount of goodwill that is expected to be deductible for tax purposes is $50.0 million.
The above presents management’s preliminary assessment of the fair values of assets acquired and liabilities assumed based on best estimates taking into account all relevant information available. Because the Company only recently acquired Data Transfer Solutions, it is not practical to definitively allocate the purchase price as at December 31, 2017. The accounting for the business combination is expected to be completed as soon as management has gathered all of the significant information available and considered necessary in order to finalize this allocation. The effect may be to transfer an amount to or from the assets acquired, liabilities assumed and goodwill during such measurement period, which cannot exceed one year from the acquisition date. During that period, the Company will retrospectively adjust the provisional amounts recognized as at the acquisition date to reflect information obtained about facts and circumstances that existed and, if known, would have affected the measurement of the amounts recognized as at the acquisition date. In addition, since the Company is still finalizing the valuation of assets acquired and liabilities assumed at the date of acquisition, the final allocation of the purchase price may vary significantly from the amounts presented above.
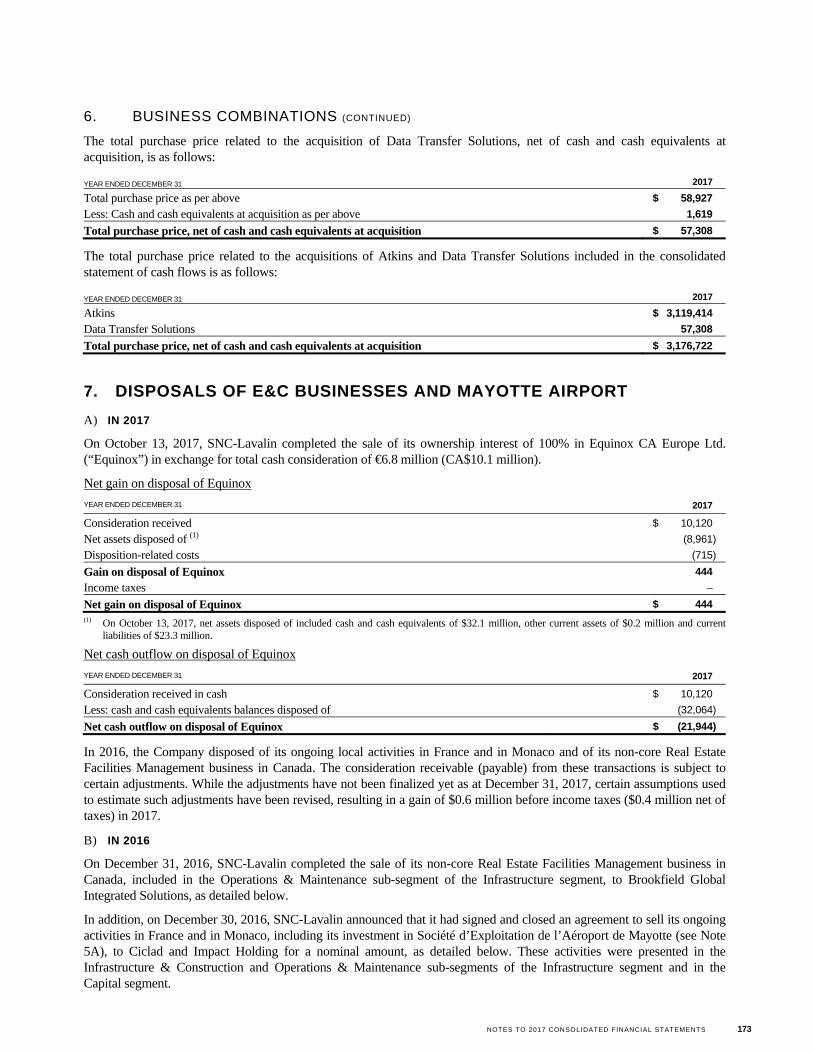
NOTES TO 2017 CONSOLIDATED FINANCIAL STATEMENTS 173
6. BUSINESS COMBINATIONS (CONTINUED)
The total purchase price related to the acquisition of Data Transfer Solutions, net of cash and cash equivalents at acquisition, is as follows:
YEAR ENDED DECEMBER 31 2017
Total purchase price as per above $ 58,927
Less: Cash and cash equivalents at acquisition as per above 1,619
Total purchase price, net of cash and cash equivalents at acquisition $ 57,308
The total purchase price related to the acquisitions of Atkins and Data Transfer Solutions included in the consolidated statement of cash flows is as follows:
YEAR ENDED DECEMBER 31 2017
Atkins $ 3,119,414
Data Transfer Solutions 57,308
Total purchase price, net of cash and cash equivalents at acquisition $ 3,176,722
7. DISPOSALS OF E&C BUSINESSES AND MAYOTTE AIRPORT
A) IN 2017
On October 13, 2017, SNC-Lavalin completed the sale of its ownership interest of 100% in Equinox CA Europe Ltd. (“Equinox”) in exchange for total cash consideration of €6.8 million (CA$10.1 million).
Net gain on disposal of Equinox
YEAR ENDED DECEMBER 31 2017
Consideration received $ 10,120
Net assets disposed of (1) (8,961)
Disposition-related costs (715)
Gain on disposal of Equinox 444
Income taxes –
Net gain on disposal of Equinox $ 444 (1) On October 13, 2017, net assets disposed of included cash and cash equivalents of $32.1 million, other current assets of $0.2 million and current
liabilities of $23.3 million.
Net cash outflow on disposal of Equinox
YEAR ENDED DECEMBER 31 2017
Consideration received in cash $ 10,120
Less: cash and cash equivalents balances disposed of (32,064)
Net cash outflow on disposal of Equinox $ (21,944)
In 2016, the Company disposed of its ongoing local activities in France and in Monaco and of its non-core Real Estate Facilities Management business in Canada. The consideration receivable (payable) from these transactions is subject to certain adjustments. While the adjustments have not been finalized yet as at December 31, 2017, certain assumptions used to estimate such adjustments have been revised, resulting in a gain of $0.6 million before income taxes ($0.4 million net of taxes) in 2017.
B) IN 2016
On December 31, 2016, SNC-Lavalin completed the sale of its non-core Real Estate Facilities Management business in Canada, included in the Operations & Maintenance sub-segment of the Infrastructure segment, to Brookfield Global Integrated Solutions, as detailed below.
In addition, on December 30, 2016, SNC-Lavalin announced that it had signed and closed an agreement to sell its ongoing activities in France and in Monaco, including its investment in Société d’Exploitation de l’Aéroport de Mayotte (see Note 5A), to Ciclad and Impact Holding for a nominal amount, as detailed below. These activities were presented in the Infrastructure & Construction and Operations & Maintenance sub-segments of the Infrastructure segment and in the Capital segment.
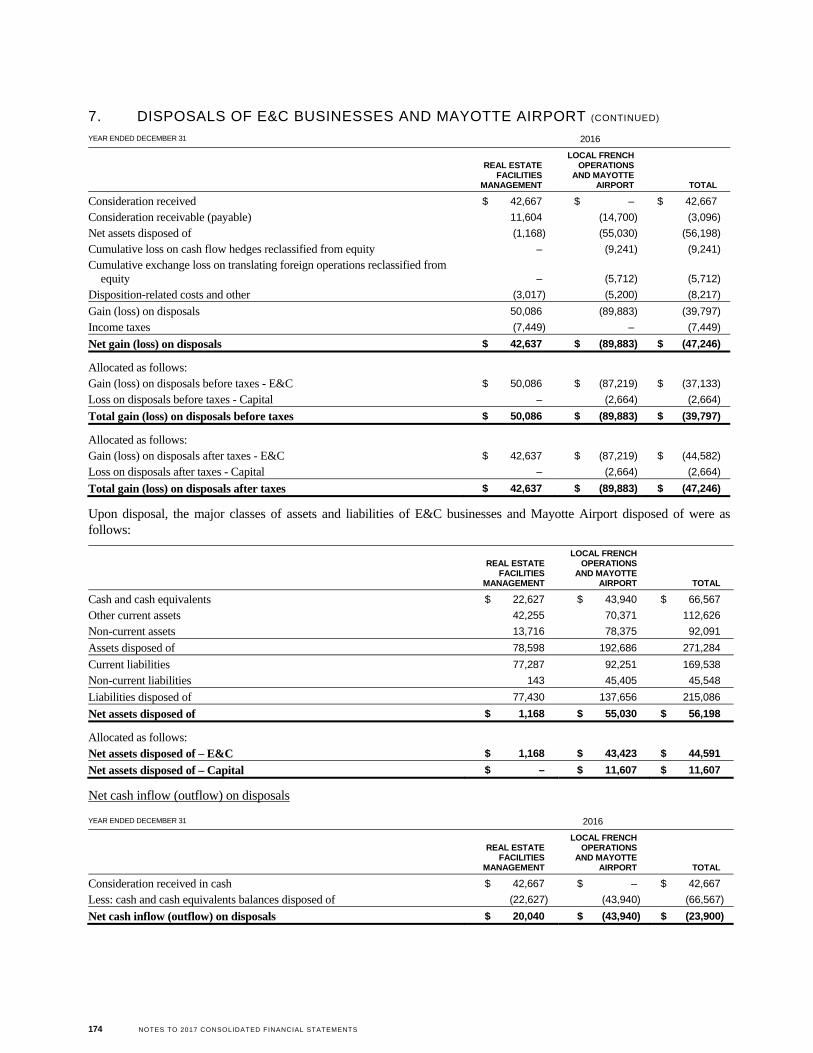
174 NOTES TO 2017 CONSOLIDATED FINANCIAL STATEMENTS
7. DISPOSALS OF E&C BUSINESSES AND MAYOTTE AIRPORT (CONTINUED)
YEAR ENDED DECEMBER 31 2016
REAL ESTATE FACILITIES
MANAGEMENT
LOCAL FRENCH OPERATIONS
AND MAYOTTE AIRPORT TOTAL
Consideration received $ 42,667 $ – $ 42,667
Consideration receivable (payable) 11,604 (14,700) (3,096)
Net assets disposed of (1,168) (55,030) (56,198)
Cumulative loss on cash flow hedges reclassified from equity – (9,241) (9,241)
Cumulative exchange loss on translating foreign operations reclassified from equity – (5,712) (5,712)
Disposition-related costs and other (3,017) (5,200) (8,217)
Gain (loss) on disposals 50,086 (89,883) (39,797)
Income taxes (7,449) – (7,449)
Net gain (loss) on disposals $ 42,637 $ (89,883) $ (47,246)
Allocated as follows:
Gain (loss) on disposals before taxes - E&C $ 50,086 $ (87,219) $ (37,133)
Loss on disposals before taxes - Capital – (2,664) (2,664)
Total gain (loss) on disposals before taxes $ 50,086 $ (89,883) $ (39,797)
Allocated as follows:
Gain (loss) on disposals after taxes - E&C $ 42,637 $ (87,219) $ (44,582)
Loss on disposals after taxes - Capital – (2,664) (2,664)
Total gain (loss) on disposals after taxes $ 42,637 $ (89,883) $ (47,246)
Upon disposal, the major classes of assets and liabilities of E&C businesses and Mayotte Airport disposed of were as follows:
REAL ESTATE FACILITIES
MANAGEMENT
LOCAL FRENCH OPERATIONS
AND MAYOTTE AIRPORT TOTAL
Cash and cash equivalents $ 22,627 $ 43,940 $ 66,567
Other current assets 42,255 70,371 112,626
Non-current assets 13,716 78,375 92,091
Assets disposed of 78,598 192,686 271,284
Current liabilities 77,287 92,251 169,538
Non-current liabilities 143 45,405 45,548
Liabilities disposed of 77,430 137,656 215,086
Net assets disposed of $ 1,168 $ 55,030 $ 56,198
Allocated as follows:
Net assets disposed of – E&C $ 1,168 $ 43,423 $ 44,591
Net assets disposed of – Capital $ – $ 11,607 $ 11,607
Net cash inflow (outflow) on disposals
YEAR ENDED DECEMBER 31 2016
REAL ESTATE FACILITIES
MANAGEMENT
LOCAL FRENCH OPERATIONS
AND MAYOTTE AIRPORT TOTAL
Consideration received in cash $ 42,667 $ – $ 42,667
Less: cash and cash equivalents balances disposed of (22,627) (43,940) (66,567)
Net cash inflow (outflow) on disposals $ 20,040 $ (43,940) $ (23,900)
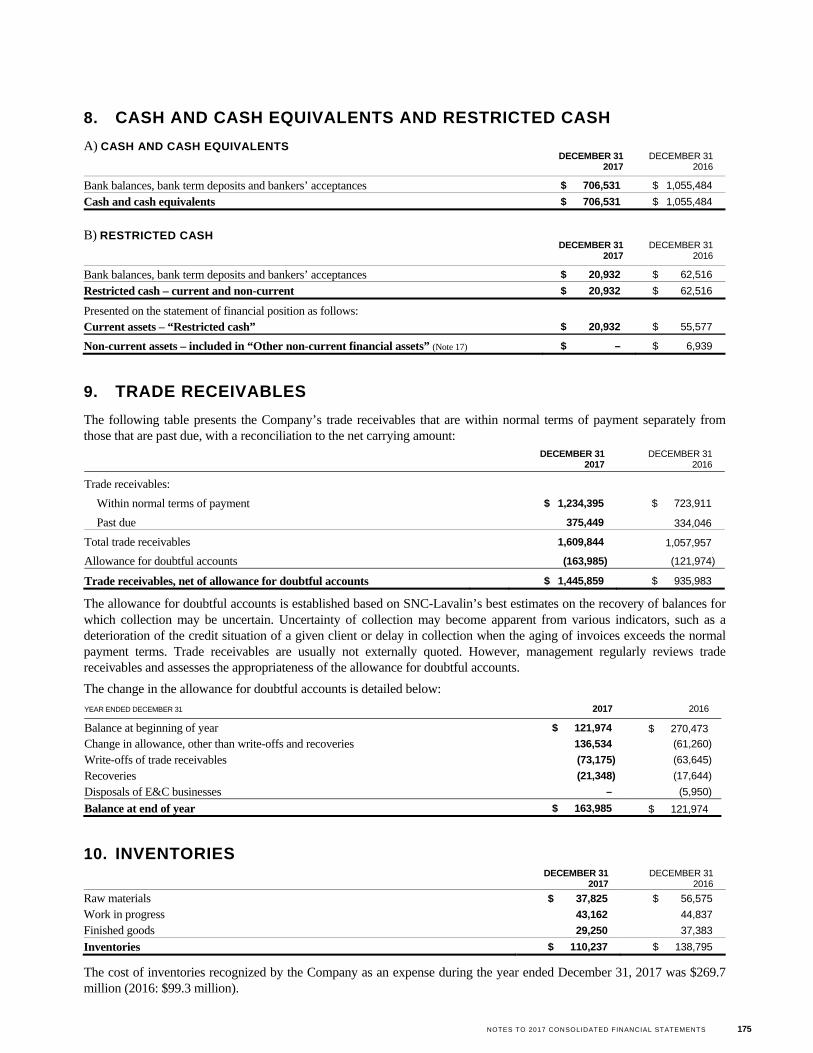
NOTES TO 2017 CONSOLIDATED FINANCIAL STATEMENTS 175
8. CASH AND CASH EQUIVALENTS AND RESTRICTED CASH
A) CASH AND CASH EQUIVALENTS
DECEMBER 31
2017
DECEMBER 31 2016
Bank balances, bank term deposits and bankers’ acceptances $ 706,531 $ 1,055,484
Cash and cash equivalents $ 706,531 $ 1,055,484
B) RESTRICTED CASH
DECEMBER 31
2017 DECEMBER 31
2016
Bank balances, bank term deposits and bankers’ acceptances $ 20,932 $ 62,516
Restricted cash – current and non-current $ 20,932 $ 62,516
Presented on the statement of financial position as follows:
Current assets – “Restricted cash” $ 20,932 $ 55,577
Non-current assets – included in “Other non-current financial assets” (Note 17) $ – $ 6,939
9. TRADE RECEIVABLES
The following table presents the Company’s trade receivables that are within normal terms of payment separately from those that are past due, with a reconciliation to the net carrying amount:
DECEMBER 31 2017
DECEMBER 31 2016
Trade receivables:
Within normal terms of payment $ 1,234,395 $ 723,911
Past due 375,449 334,046
Total trade receivables 1,609,844 1,057,957
Allowance for doubtful accounts (163,985) (121,974)
Trade receivables, net of allowance for doubtful accounts $ 1,445,859 $ 935,983
The allowance for doubtful accounts is established based on SNC-Lavalin’s best estimates on the recovery of balances for which collection may be uncertain. Uncertainty of collection may become apparent from various indicators, such as a deterioration of the credit situation of a given client or delay in collection when the aging of invoices exceeds the normal payment terms. Trade receivables are usually not externally quoted. However, management regularly reviews trade receivables and assesses the appropriateness of the allowance for doubtful accounts.
The change in the allowance for doubtful accounts is detailed below:
YEAR ENDED DECEMBER 31 2017 2016
Balance at beginning of year $ 121,974 $ 270,473
Change in allowance, other than write-offs and recoveries 136,534 (61,260)
Write-offs of trade receivables (73,175) (63,645)
Recoveries (21,348) (17,644)
Disposals of E&C businesses – (5,950)
Balance at end of year $ 163,985 $ 121,974
10. INVENTORIES
DECEMBER 31
2017
DECEMBER 31 2016
Raw materials $ 37,825 $ 56,575
Work in progress 43,162 44,837
Finished goods 29,250 37,383
Inventories $ 110,237 $ 138,795
The cost of inventories recognized by the Company as an expense during the year ended December 31, 2017 was $269.7 million (2016: $99.3 million).
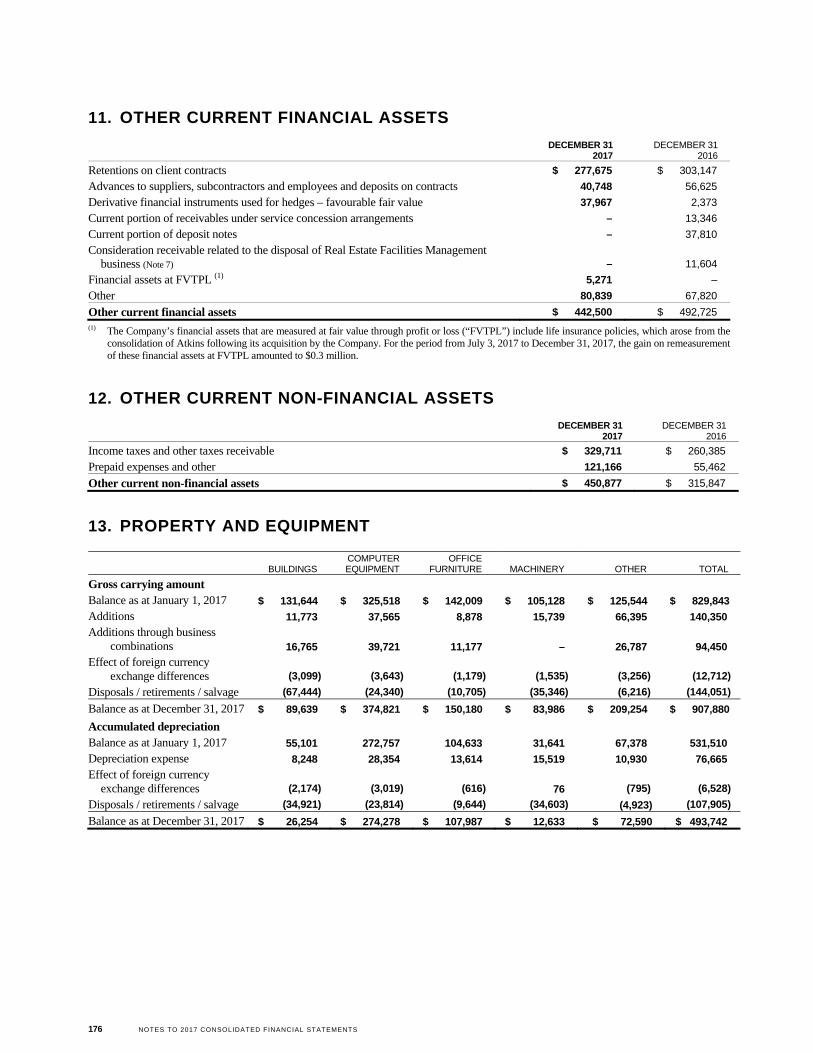
176 NOTES TO 2017 CONSOLIDATED FINANCIAL STATEMENTS
11. OTHER CURRENT FINANCIAL ASSETS
DECEMBER 31
2017
DECEMBER 31 2016
Retentions on client contracts $ 277,675 $ 303,147
Advances to suppliers, subcontractors and employees and deposits on contracts 40,748 56,625
Derivative financial instruments used for hedges – favourable fair value 37,967 2,373
Current portion of receivables under service concession arrangements – 13,346
Current portion of deposit notes – 37,810
Consideration receivable related to the disposal of Real Estate Facilities Management business (Note 7) – 11,604
Financial assets at FVTPL (1) 5,271 –
Other 80,839 67,820
Other current financial assets $ 442,500 $ 492,725 (1) The Company’s financial assets that are measured at fair value through profit or loss (“FVTPL”) include life insurance policies, which arose from the
consolidation of Atkins following its acquisition by the Company. For the period from July 3, 2017 to December 31, 2017, the gain on remeasurement of these financial assets at FVTPL amounted to $0.3 million.
12. OTHER CURRENT NON-FINANCIAL ASSETS
DECEMBER 31
2017
DECEMBER 31 2016
Income taxes and other taxes receivable $ 329,711 $ 260,385
Prepaid expenses and other 121,166 55,462
Other current non-financial assets $ 450,877 $ 315,847
13. PROPERTY AND EQUIPMENT
BUILDINGS COMPUTER EQUIPMENT
OFFICE FURNITURE MACHINERY OTHER TOTAL
Gross carrying amount
Balance as at January 1, 2017 $ 131,644 $ 325,518 $ 142,009 $ 105,128 $ 125,544 $ 829,843
Additions 11,773 37,565 8,878 15,739 66,395 140,350
Additions through business combinations 16,765 39,721 11,177 – 26,787 94,450
Effect of foreign currency exchange differences (3,099) (3,643) (1,179) (1,535) (3,256) (12,712)
Disposals / retirements / salvage (67,444) (24,340) (10,705) (35,346) (6,216) (144,051)
Balance as at December 31, 2017 $ 89,639 $ 374,821 $ 150,180 $ 83,986 $ 209,254 $ 907,880
Accumulated depreciation
Balance as at January 1, 2017 55,101 272,757 104,633 31,641 67,378 531,510
Depreciation expense 8,248 28,354 13,614 15,519 10,930 76,665
Effect of foreign currency exchange differences (2,174) (3,019) (616) 76 (795) (6,528)
Disposals / retirements / salvage (34,921) (23,814) (9,644) (34,603) (4,923) (107,905)
Balance as at December 31, 2017 $ 26,254 $ 274,278 $ 107,987 $ 12,633 $ 72,590 $ 493,742
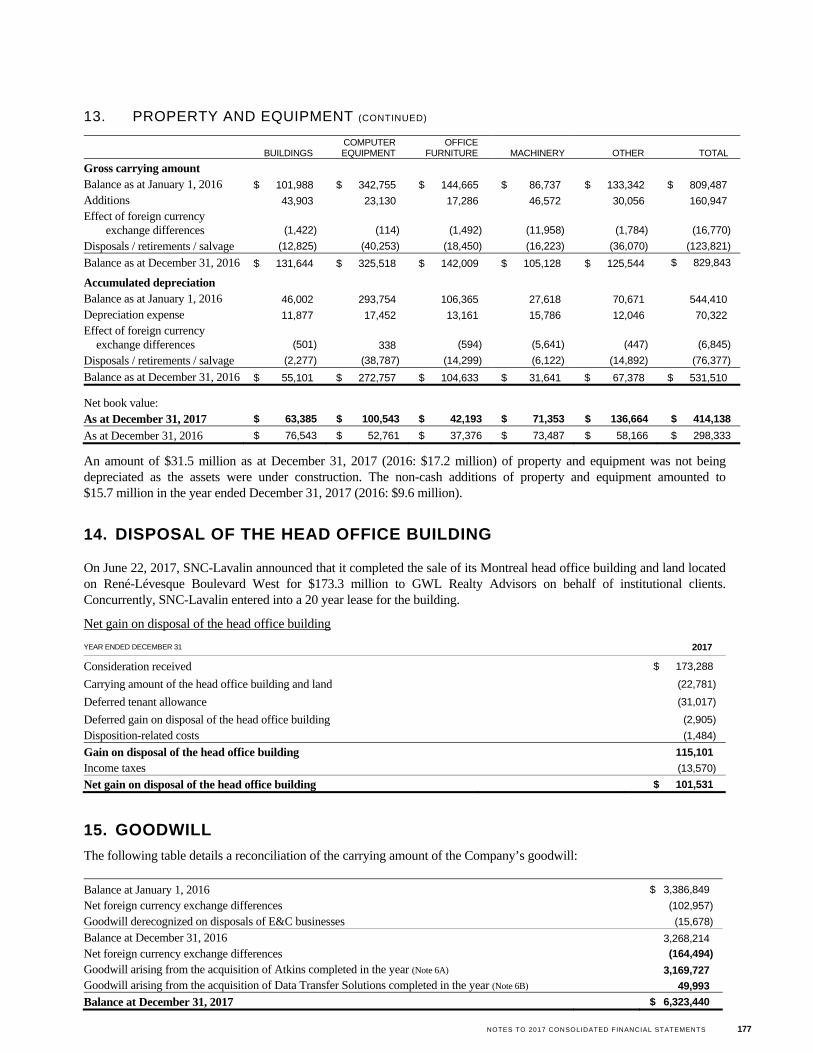
NOTES TO 2017 CONSOLIDATED FINANCIAL STATEMENTS 177
13. PROPERTY AND EQUIPMENT (CONTINUED)
BUILDINGS COMPUTER EQUIPMENT
OFFICE FURNITURE MACHINERY OTHER TOTAL
Gross carrying amount
Balance as at January 1, 2016 $ 101,988 $ 342,755 $ 144,665 $ 86,737 $ 133,342 $ 809,487
Additions 43,903 23,130 17,286 46,572 30,056 160,947
Effect of foreign currency exchange differences (1,422) (114) (1,492) (11,958) (1,784) (16,770)
Disposals / retirements / salvage (12,825) (40,253) (18,450) (16,223) (36,070) (123,821)
Balance as at December 31, 2016 $ 131,644 $ 325,518 $ 142,009 $ 105,128 $ 125,544 $ 829,843
Accumulated depreciation
Balance as at January 1, 2016 46,002 293,754 106,365 27,618 70,671 544,410
Depreciation expense 11,877 17,452 13,161 15,786 12,046 70,322
Effect of foreign currency exchange differences (501) 338 (594) (5,641) (447) (6,845)
Disposals / retirements / salvage (2,277) (38,787) (14,299) (6,122) (14,892) (76,377)
Balance as at December 31, 2016 $ 55,101 $ 272,757 $ 104,633 $ 31,641 $ 67,378 $ 531,510
Net book value:
As at December 31, 2017 $ 63,385 $ 100,543 $ 42,193 $ 71,353 $ 136,664 $ 414,138
As at December 31, 2016 $ 76,543 $ 52,761 $ 37,376 $ 73,487 $ 58,166 $ 298,333
An amount of $31.5 million as at December 31, 2017 (2016: $17.2 million) of property and equipment was not being depreciated as the assets were under construction. The non-cash additions of property and equipment amounted to $15.7 million in the year ended December 31, 2017 (2016: $9.6 million).
14. DISPOSAL OF THE HEAD OFFICE BUILDING
On June 22, 2017, SNC-Lavalin announced that it completed the sale of its Montreal head office building and land located on René-Lévesque Boulevard West for $173.3 million to GWL Realty Advisors on behalf of institutional clients. Concurrently, SNC-Lavalin entered into a 20 year lease for the building.
Net gain on disposal of the head office building
YEAR ENDED DECEMBER 31 2017
Consideration received $ 173,288
Carrying amount of the head office building and land (22,781)
Deferred tenant allowance (31,017)
Deferred gain on disposal of the head office building (2,905)
Disposition-related costs (1,484)
Gain on disposal of the head office building 115,101
Income taxes (13,570)
Net gain on disposal of the head office building $ 101,531
15. GOODWILL
The following table details a reconciliation of the carrying amount of the Company’s goodwill:
Balance at January 1, 2016 $ 3,386,849
Net foreign currency exchange differences (102,957)
Goodwill derecognized on disposals of E&C businesses (15,678)
Balance at December 31, 2016 3,268,214
Net foreign currency exchange differences (164,494)
Goodwill arising from the acquisition of Atkins completed in the year (Note 6A) 3,169,727
Goodwill arising from the acquisition of Data Transfer Solutions completed in the year (Note 6B) 49,993
Balance at December 31, 2017 $ 6,323,440
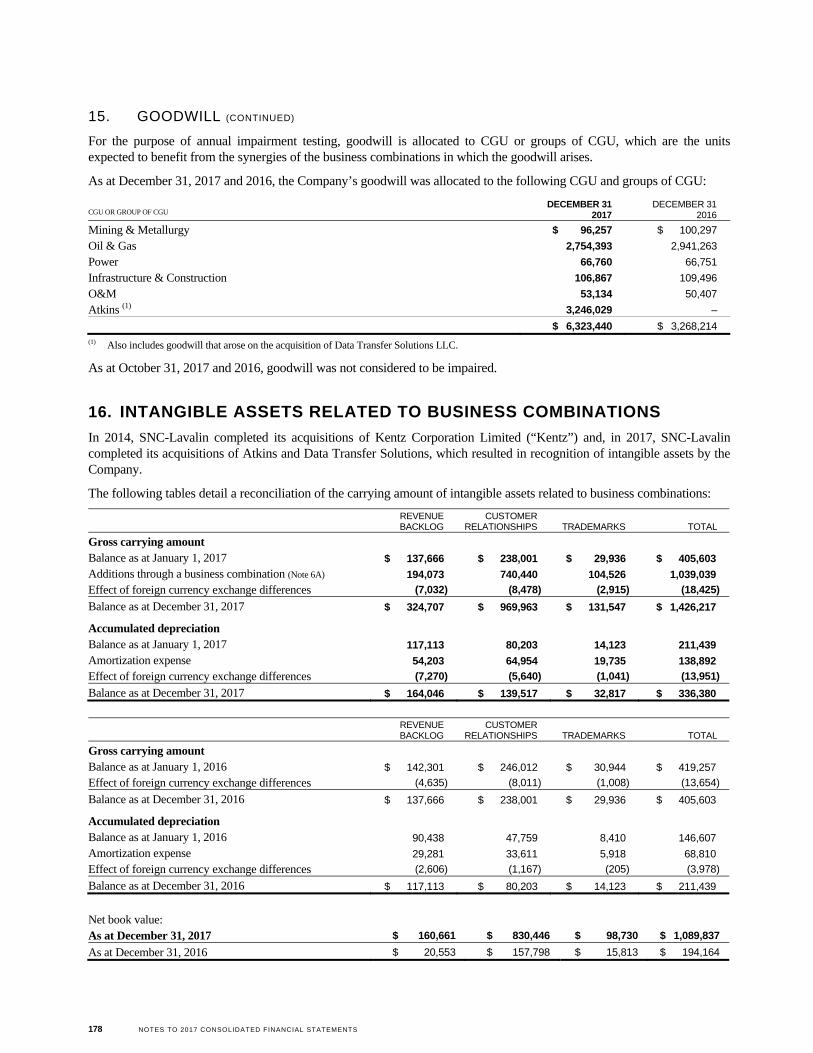
178 NOTES TO 2017 CONSOLIDATED FINANCIAL STATEMENTS
15. GOODWILL (CONTINUED)
For the purpose of annual impairment testing, goodwill is allocated to CGU or groups of CGU, which are the units expected to benefit from the synergies of the business combinations in which the goodwill arises.
As at December 31, 2017 and 2016, the Company’s goodwill was allocated to the following CGU and groups of CGU:
CGU OR GROUP OF CGU DECEMBER 31
2017 DECEMBER 31
2016
Mining & Metallurgy $ 96,257 $ 100,297
Oil & Gas 2,754,393 2,941,263
Power 66,760 66,751
Infrastructure & Construction 106,867 109,496
O&M 53,134 50,407
Atkins (1) 3,246,029 –
$ 6,323,440 $ 3,268,214 (1) Also includes goodwill that arose on the acquisition of Data Transfer Solutions LLC.
As at October 31, 2017 and 2016, goodwill was not considered to be impaired.
16. INTANGIBLE ASSETS RELATED TO BUSINESS COMBINATIONS
In 2014, SNC-Lavalin completed its acquisitions of Kentz Corporation Limited (“Kentz”) and, in 2017, SNC-Lavalin completed its acquisitions of Atkins and Data Transfer Solutions, which resulted in recognition of intangible assets by the Company.
The following tables detail a reconciliation of the carrying amount of intangible assets related to business combinations:
REVENUE BACKLOG
CUSTOMER RELATIONSHIPS TRADEMARKS TOTAL
Gross carrying amount
Balance as at January 1, 2017 $ 137,666 $ 238,001 $ 29,936 $ 405,603
Additions through a business combination (Note 6A) 194,073 740,440 104,526 1,039,039
Effect of foreign currency exchange differences (7,032) (8,478) (2,915) (18,425)
Balance as at December 31, 2017 $ 324,707 $ 969,963 $ 131,547 $ 1,426,217
Accumulated depreciation
Balance as at January 1, 2017 117,113 80,203 14,123 211,439
Amortization expense 54,203 64,954 19,735 138,892
Effect of foreign currency exchange differences (7,270) (5,640) (1,041) (13,951)
Balance as at December 31, 2017 $ 164,046 $ 139,517 $ 32,817 $ 336,380
REVENUE BACKLOG
CUSTOMER RELATIONSHIPS TRADEMARKS TOTAL
Gross carrying amount
Balance as at January 1, 2016 $ 142,301 $ 246,012 $ 30,944 $ 419,257
Effect of foreign currency exchange differences (4,635) (8,011) (1,008) (13,654)
Balance as at December 31, 2016 $ 137,666 $ 238,001 $ 29,936 $ 405,603
Accumulated depreciation
Balance as at January 1, 2016 90,438 47,759 8,410 146,607
Amortization expense 29,281 33,611 5,918 68,810
Effect of foreign currency exchange differences (2,606) (1,167) (205) (3,978)
Balance as at December 31, 2016 $ 117,113 $ 80,203 $ 14,123 $ 211,439
Net book value:
As at December 31, 2017 $ 160,661 $ 830,446 $ 98,730 $ 1,089,837
As at December 31, 2016 $ 20,553 $ 157,798 $ 15,813 $ 194,164
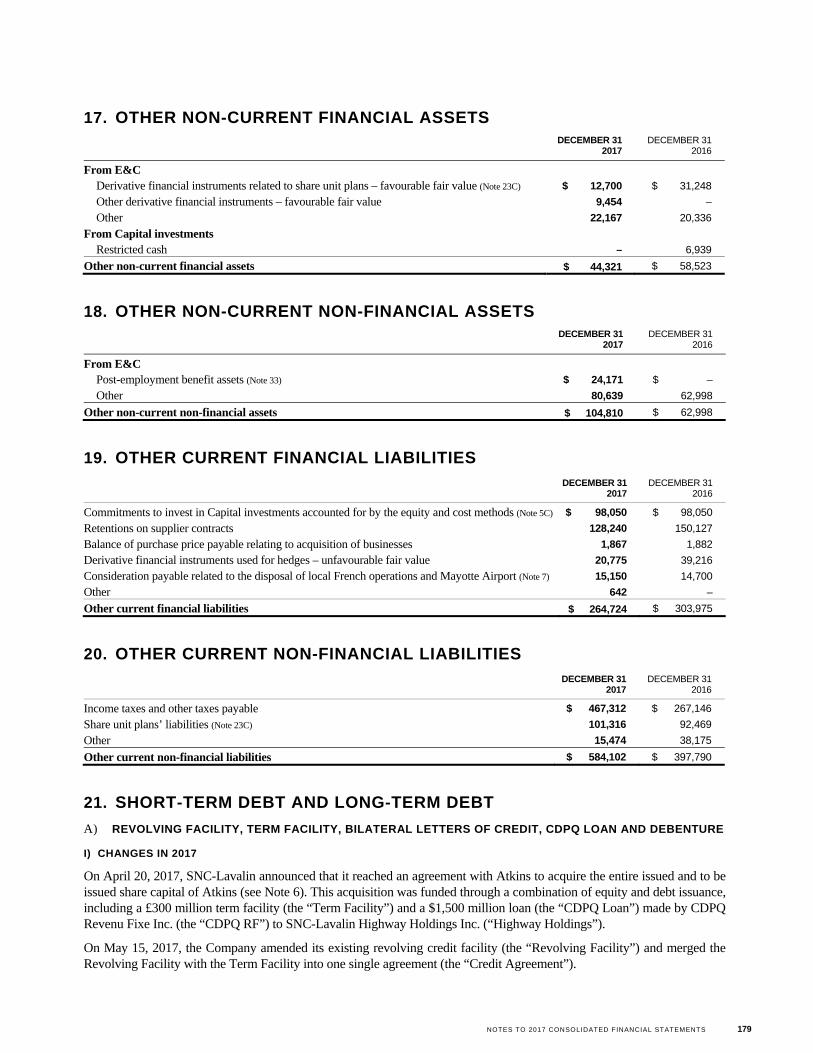
NOTES TO 2017 CONSOLIDATED FINANCIAL STATEMENTS 179
17. OTHER NON-CURRENT FINANCIAL ASSETS
DECEMBER 31 2017
DECEMBER 31 2016
From E&C
Derivative financial instruments related to share unit plans – favourable fair value (Note 23C) $ 12,700 $ 31,248
Other derivative financial instruments – favourable fair value 9,454 –
Other 22,167 20,336
From Capital investments
Restricted cash – 6,939
Other non-current financial assets $ 44,321 $ 58,523
18. OTHER NON-CURRENT NON-FINANCIAL ASSETS
DECEMBER 31 2017
DECEMBER 31 2016
From E&C
Post-employment benefit assets (Note 33) $ 24,171 $ –
Other 80,639 62,998
Other non-current non-financial assets $ 104,810 $ 62,998
19. OTHER CURRENT FINANCIAL LIABILITIES
DECEMBER 31 2017
DECEMBER 31 2016
Commitments to invest in Capital investments accounted for by the equity and cost methods (Note 5C) $ 98,050 $ 98,050
Retentions on supplier contracts 128,240 150,127
Balance of purchase price payable relating to acquisition of businesses 1,867 1,882
Derivative financial instruments used for hedges – unfavourable fair value 20,775 39,216
Consideration payable related to the disposal of local French operations and Mayotte Airport (Note 7) 15,150 14,700
Other 642 –
Other current financial liabilities $ 264,724 $ 303,975
20. OTHER CURRENT NON-FINANCIAL LIABILITIES
DECEMBER 31 2017
DECEMBER 31 2016
Income taxes and other taxes payable $ 467,312 $ 267,146
Share unit plans’ liabilities (Note 23C) 101,316 92,469
Other 15,474 38,175
Other current non-financial liabilities $ 584,102 $ 397,790
21. SHORT-TERM DEBT AND LONG-TERM DEBT
A) REVOLVING FACILITY, TERM FACILITY, BILATERAL LETTERS OF CREDIT, CDPQ LOAN AND DEBENTURE
I) CHANGES IN 2017
On April 20, 2017, SNC-Lavalin announced that it reached an agreement with Atkins to acquire the entire issued and to be issued share capital of Atkins (see Note 6). This acquisition was funded through a combination of equity and debt issuance, including a £300 million term facility (the “Term Facility”) and a $1,500 million loan (the “CDPQ Loan”) made by CDPQ Revenu Fixe Inc. (the “CDPQ RF”) to SNC-Lavalin Highway Holdings Inc. (“Highway Holdings”).
On May 15, 2017, the Company amended its existing revolving credit facility (the “Revolving Facility”) and merged the Revolving Facility with the Term Facility into one single agreement (the “Credit Agreement”).
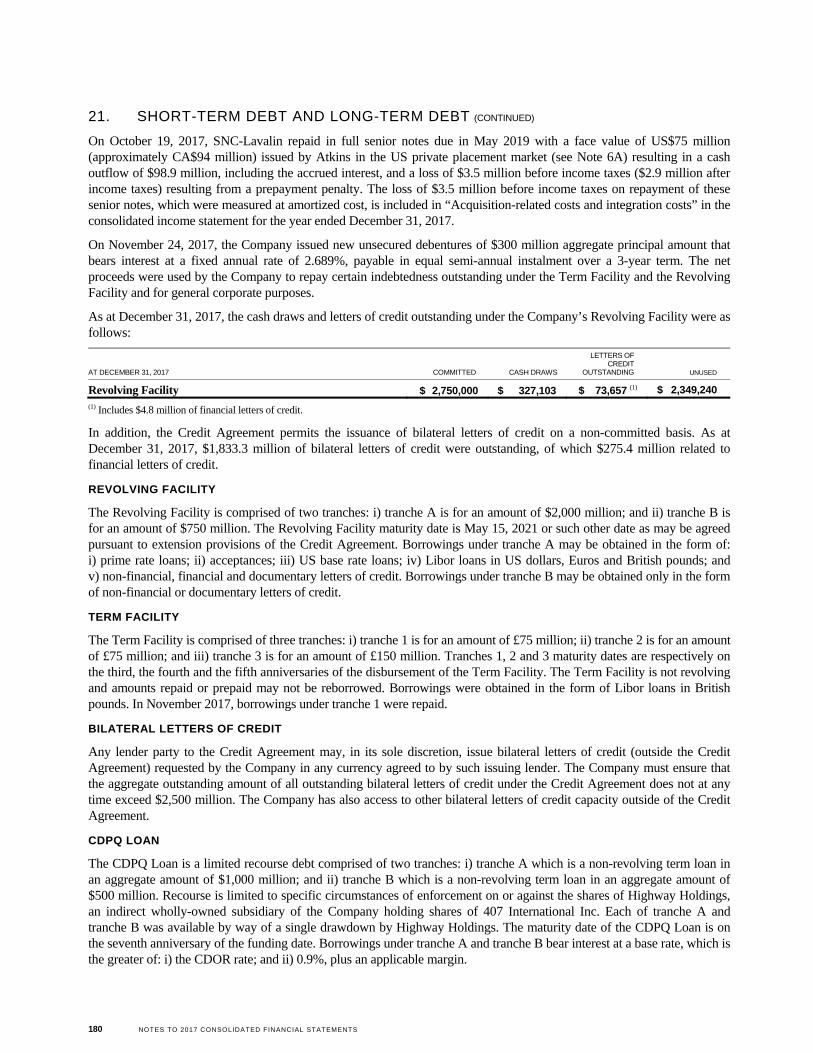
180 NOTES TO 2017 CONSOLIDATED FINANCIAL STATEMENTS
21. SHORT-TERM DEBT AND LONG-TERM DEBT (CONTINUED)
On October 19, 2017, SNC-Lavalin repaid in full senior notes due in May 2019 with a face value of US$75 million (approximately CA$94 million) issued by Atkins in the US private placement market (see Note 6A) resulting in a cash outflow of $98.9 million, including the accrued interest, and a loss of $3.5 million before income taxes ($2.9 million after income taxes) resulting from a prepayment penalty. The loss of $3.5 million before income taxes on repayment of these senior notes, which were measured at amortized cost, is included in “Acquisition-related costs and integration costs” in the consolidated income statement for the year ended December 31, 2017.
On November 24, 2017, the Company issued new unsecured debentures of $300 million aggregate principal amount that bears interest at a fixed annual rate of 2.689%, payable in equal semi-annual instalment over a 3-year term. The net proceeds were used by the Company to repay certain indebtedness outstanding under the Term Facility and the Revolving Facility and for general corporate purposes.
As at December 31, 2017, the cash draws and letters of credit outstanding under the Company’s Revolving Facility were as follows:
AT DECEMBER 31, 2017 COMMITTED CASH DRAWS
LETTERS OF CREDIT
OUTSTANDING UNUSED
Revolving Facility $ 2,750,000 $ 327,103 $ 73,657 (1) $ 2,349,240
(1) Includes $4.8 million of financial letters of credit.
In addition, the Credit Agreement permits the issuance of bilateral letters of credit on a non-committed basis. As at December 31, 2017, $1,833.3 million of bilateral letters of credit were outstanding, of which $275.4 million related to financial letters of credit.
REVOLVING FACILITY
The Revolving Facility is comprised of two tranches: i) tranche A is for an amount of $2,000 million; and ii) tranche B is for an amount of $750 million. The Revolving Facility maturity date is May 15, 2021 or such other date as may be agreed pursuant to extension provisions of the Credit Agreement. Borrowings under tranche A may be obtained in the form of: i) prime rate loans; ii) acceptances; iii) US base rate loans; iv) Libor loans in US dollars, Euros and British pounds; and v) non-financial, financial and documentary letters of credit. Borrowings under tranche B may be obtained only in the form of non-financial or documentary letters of credit.
TERM FACILITY
The Term Facility is comprised of three tranches: i) tranche 1 is for an amount of £75 million; ii) tranche 2 is for an amount of £75 million; and iii) tranche 3 is for an amount of £150 million. Tranches 1, 2 and 3 maturity dates are respectively on the third, the fourth and the fifth anniversaries of the disbursement of the Term Facility. The Term Facility is not revolving and amounts repaid or prepaid may not be reborrowed. Borrowings were obtained in the form of Libor loans in British pounds. In November 2017, borrowings under tranche 1 were repaid.
BILATERAL LETTERS OF CREDIT
Any lender party to the Credit Agreement may, in its sole discretion, issue bilateral letters of credit (outside the Credit Agreement) requested by the Company in any currency agreed to by such issuing lender. The Company must ensure that the aggregate outstanding amount of all outstanding bilateral letters of credit under the Credit Agreement does not at any time exceed $2,500 million. The Company has also access to other bilateral letters of credit capacity outside of the Credit Agreement.
CDPQ LOAN
The CDPQ Loan is a limited recourse debt comprised of two tranches: i) tranche A which is a non-revolving term loan in an aggregate amount of $1,000 million; and ii) tranche B which is a non-revolving term loan in an aggregate amount of $500 million. Recourse is limited to specific circumstances of enforcement on or against the shares of Highway Holdings, an indirect wholly-owned subsidiary of the Company holding shares of 407 International Inc. Each of tranche A and tranche B was available by way of a single drawdown by Highway Holdings. The maturity date of the CDPQ Loan is on the seventh anniversary of the funding date. Borrowings under tranche A and tranche B bear interest at a base rate, which is the greater of: i) the CDOR rate; and ii) 0.9%, plus an applicable margin.
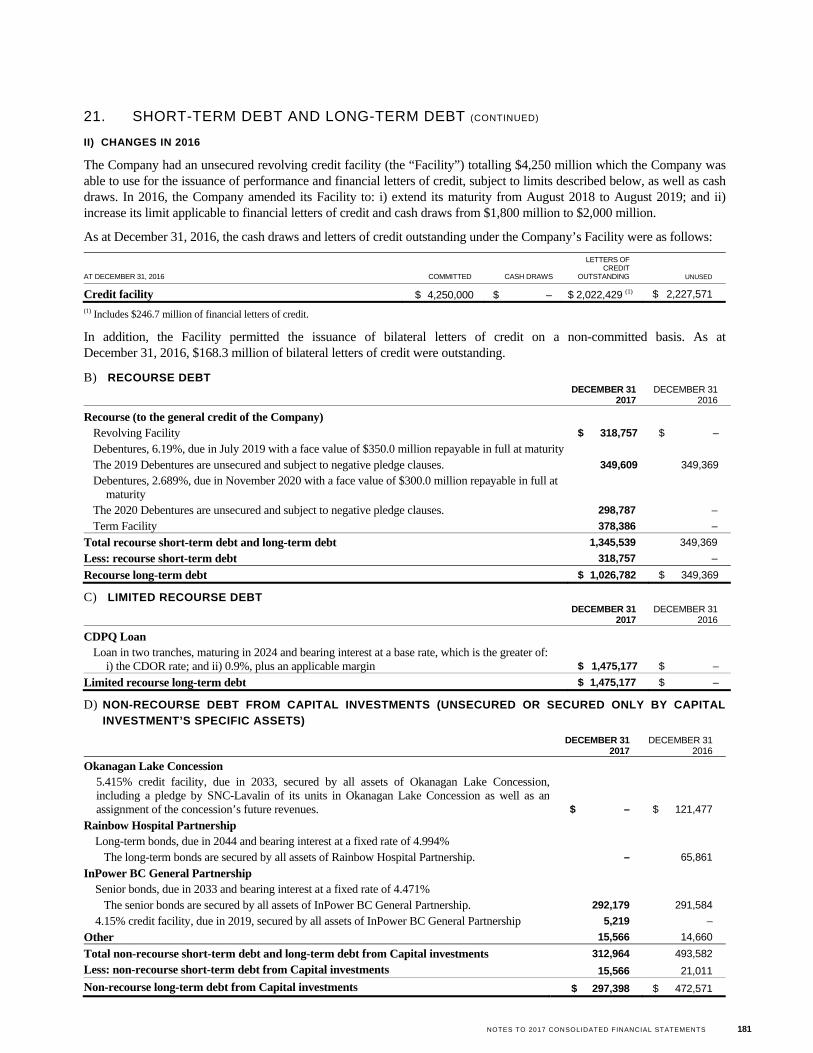
NOTES TO 2017 CONSOLIDATED FINANCIAL STATEMENTS 181
21. SHORT-TERM DEBT AND LONG-TERM DEBT (CONTINUED)
II) CHANGES IN 2016
The Company had an unsecured revolving credit facility (the “Facility”) totalling $4,250 million which the Company was able to use for the issuance of performance and financial letters of credit, subject to limits described below, as well as cash draws. In 2016, the Company amended its Facility to: i) extend its maturity from August 2018 to August 2019; and ii) increase its limit applicable to financial letters of credit and cash draws from $1,800 million to $2,000 million.
As at December 31, 2016, the cash draws and letters of credit outstanding under the Company’s Facility were as follows:
AT DECEMBER 31, 2016 COMMITTED CASH DRAWS
LETTERS OF CREDIT
OUTSTANDING UNUSED
Credit facility $ 4,250,000 $ – $ 2,022,429 (1) $ 2,227,571
(1) Includes $246.7 million of financial letters of credit.
In addition, the Facility permitted the issuance of bilateral letters of credit on a non-committed basis. As at December 31, 2016, $168.3 million of bilateral letters of credit were outstanding.
B) RECOURSE DEBT
DECEMBER 31
2017 DECEMBER 31
2016
Recourse (to the general credit of the Company) Revolving Facility $ 318,757 $ –
Debentures, 6.19%, due in July 2019 with a face value of $350.0 million repayable in full at maturity
The 2019 Debentures are unsecured and subject to negative pledge clauses. 349,609 349,369
Debentures, 2.689%, due in November 2020 with a face value of $300.0 million repayable in full at maturity
The 2020 Debentures are unsecured and subject to negative pledge clauses. 298,787 –
Term Facility 378,386 –
Total recourse short-term debt and long-term debt 1,345,539 349,369
Less: recourse short-term debt 318,757 –
Recourse long-term debt $ 1,026,782 $ 349,369
C) LIMITED RECOURSE DEBT
DECEMBER 31
2017 DECEMBER 31
2016
CDPQ Loan Loan in two tranches, maturing in 2024 and bearing interest at a base rate, which is the greater of:
i) the CDOR rate; and ii) 0.9%, plus an applicable margin $ 1,475,177 $ –
Limited recourse long-term debt $ 1,475,177 $ –
D) NON-RECOURSE DEBT FROM CAPITAL INVESTMENTS (UNSECURED OR SECURED ONLY BY CAPITAL
INVESTMENT’S SPECIFIC ASSETS)
DECEMBER 31
2017 DECEMBER 31
2016
Okanagan Lake Concession
5.415% credit facility, due in 2033, secured by all assets of Okanagan Lake Concession, including a pledge by SNC-Lavalin of its units in Okanagan Lake Concession as well as anassignment of the concession’s future revenues. $ – $ 121,477
Rainbow Hospital Partnership
Long-term bonds, due in 2044 and bearing interest at a fixed rate of 4.994%
The long-term bonds are secured by all assets of Rainbow Hospital Partnership. – 65,861
InPower BC General Partnership
Senior bonds, due in 2033 and bearing interest at a fixed rate of 4.471%
The senior bonds are secured by all assets of InPower BC General Partnership. 292,179 291,584
4.15% credit facility, due in 2019, secured by all assets of InPower BC General Partnership 5,219 –
Other 15,566 14,660
Total non-recourse short-term debt and long-term debt from Capital investments 312,964 493,582
Less: non-recourse short-term debt from Capital investments 15,566 21,011
Non-recourse long-term debt from Capital investments $ 297,398 $ 472,571
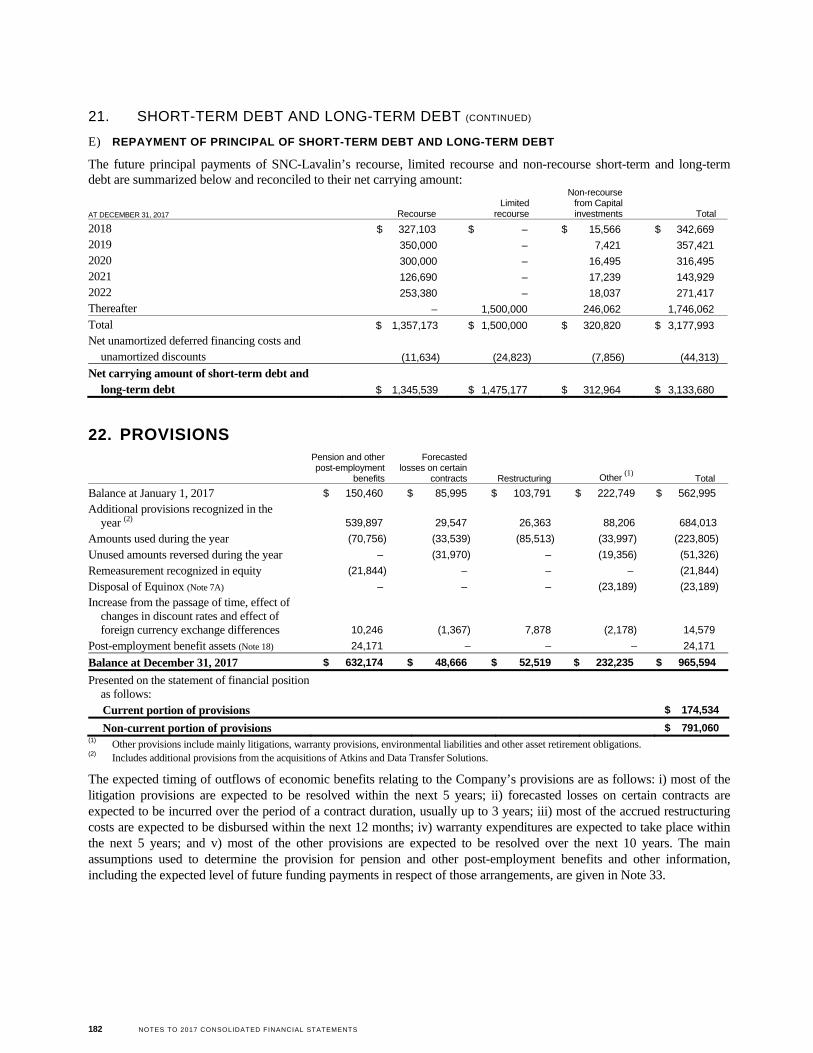
182 NOTES TO 2017 CONSOLIDATED FINANCIAL STATEMENTS
21. SHORT-TERM DEBT AND LONG-TERM DEBT (CONTINUED)
E) REPAYMENT OF PRINCIPAL OF SHORT-TERM DEBT AND LONG-TERM DEBT
The future principal payments of SNC-Lavalin’s recourse, limited recourse and non-recourse short-term and long-term debt are summarized below and reconciled to their net carrying amount:
AT DECEMBER 31, 2017 Recourse Limited
recourse
Non-recourse from Capital investments Total
2018 $ 327,103 $ – $ 15,566 $ 342,669
2019 350,000 – 7,421 357,421
2020 300,000 – 16,495 316,495
2021 126,690 – 17,239 143,929
2022 253,380 – 18,037 271,417
Thereafter – 1,500,000 246,062 1,746,062
Total $ 1,357,173 $ 1,500,000 $ 320,820 $ 3,177,993
Net unamortized deferred financing costs and unamortized discounts (11,634) (24,823) (7,856) (44,313)
Net carrying amount of short-term debt and long-term debt $ 1,345,539 $ 1,475,177 $ 312,964 $ 3,133,680
22. PROVISIONS
Pension and other post-employment
benefits
Forecasted losses on certain
contracts Restructuring Other (1)
Total
Balance at January 1, 2017 $ 150,460 $ 85,995 $ 103,791 $ 222,749 $ 562,995
Additional provisions recognized in the year (2) 539,897 29,547 26,363 88,206 684,013
Amounts used during the year (70,756) (33,539) (85,513) (33,997) (223,805)
Unused amounts reversed during the year – (31,970) – (19,356) (51,326)
Remeasurement recognized in equity (21,844) – – – (21,844)
Disposal of Equinox (Note 7A) – – – (23,189) (23,189)
Increase from the passage of time, effect of changes in discount rates and effect of foreign currency exchange differences 10,246 (1,367) 7,878 (2,178) 14,579
Post-employment benefit assets (Note 18) 24,171 – – – 24,171
Balance at December 31, 2017 $ 632,174 $ 48,666 $ 52,519 $ 232,235 $ 965,594
Presented on the statement of financial position as follows:
Current portion of provisions $ 174,534
Non-current portion of provisions $ 791,060 (1) Other provisions include mainly litigations, warranty provisions, environmental liabilities and other asset retirement obligations. (2) Includes additional provisions from the acquisitions of Atkins and Data Transfer Solutions.
The expected timing of outflows of economic benefits relating to the Company’s provisions are as follows: i) most of the litigation provisions are expected to be resolved within the next 5 years; ii) forecasted losses on certain contracts are expected to be incurred over the period of a contract duration, usually up to 3 years; iii) most of the accrued restructuring costs are expected to be disbursed within the next 12 months; iv) warranty expenditures are expected to take place within the next 5 years; and v) most of the other provisions are expected to be resolved over the next 10 years. The main assumptions used to determine the provision for pension and other post-employment benefits and other information, including the expected level of future funding payments in respect of those arrangements, are given in Note 33.
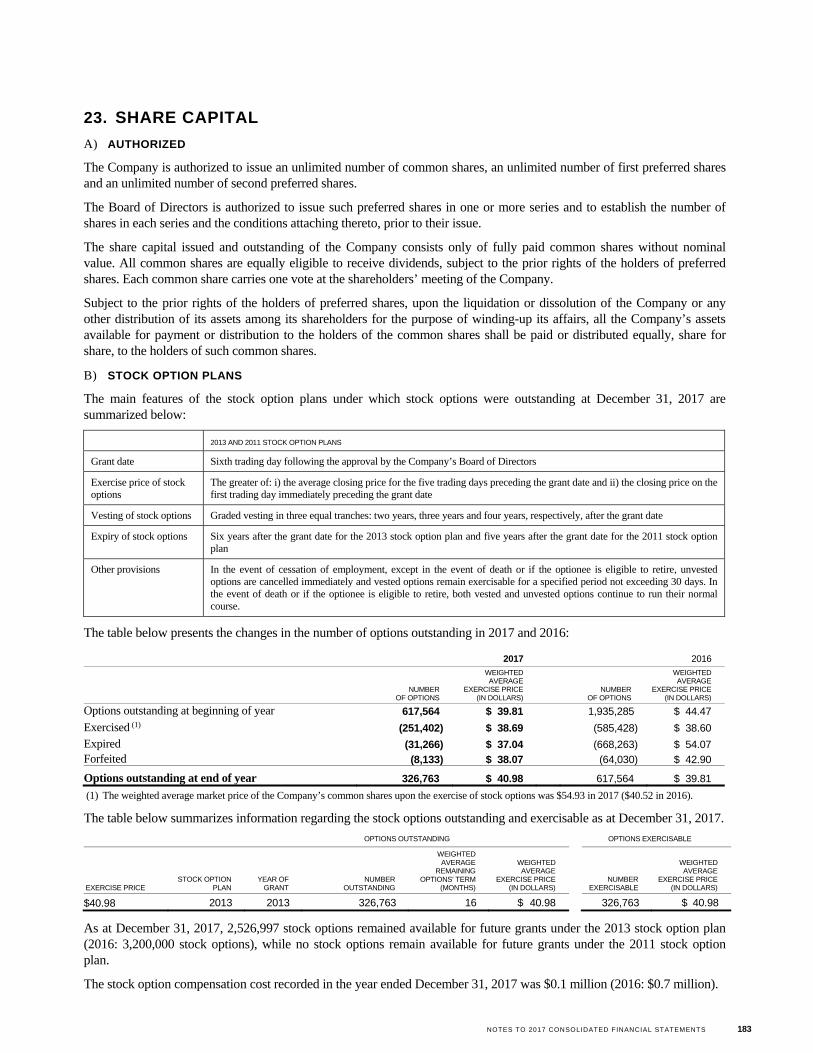
NOTES TO 2017 CONSOLIDATED FINANCIAL STATEMENTS 183
23. SHARE CAPITAL
A) AUTHORIZED
The Company is authorized to issue an unlimited number of common shares, an unlimited number of first preferred shares and an unlimited number of second preferred shares.
The Board of Directors is authorized to issue such preferred shares in one or more series and to establish the number of shares in each series and the conditions attaching thereto, prior to their issue.
The share capital issued and outstanding of the Company consists only of fully paid common shares without nominal value. All common shares are equally eligible to receive dividends, subject to the prior rights of the holders of preferred shares. Each common share carries one vote at the shareholders’ meeting of the Company.
Subject to the prior rights of the holders of preferred shares, upon the liquidation or dissolution of the Company or any other distribution of its assets among its shareholders for the purpose of winding-up its affairs, all the Company’s assets available for payment or distribution to the holders of the common shares shall be paid or distributed equally, share for share, to the holders of such common shares.
B) STOCK OPTION PLANS
The main features of the stock option plans under which stock options were outstanding at December 31, 2017 are summarized below:
2013 AND 2011 STOCK OPTION PLANS
Grant date Sixth trading day following the approval by the Company’s Board of Directors
Exercise price of stock options
The greater of: i) the average closing price for the five trading days preceding the grant date and ii) the closing price on the first trading day immediately preceding the grant date
Vesting of stock options Graded vesting in three equal tranches: two years, three years and four years, respectively, after the grant date
Expiry of stock options Six years after the grant date for the 2013 stock option plan and five years after the grant date for the 2011 stock option plan
Other provisions In the event of cessation of employment, except in the event of death or if the optionee is eligible to retire, unvested options are cancelled immediately and vested options remain exercisable for a specified period not exceeding 30 days. In the event of death or if the optionee is eligible to retire, both vested and unvested options continue to run their normal course.
The table below presents the changes in the number of options outstanding in 2017 and 2016:
2017 2016
NUMBER
OF OPTIONS
WEIGHTED AVERAGE
EXERCISE PRICE (IN DOLLARS)
NUMBER OF OPTIONS
WEIGHTED AVERAGE
EXERCISE PRICE (IN DOLLARS)
Options outstanding at beginning of year 617,564 $ 39.81 1,935,285 $ 44.47
Exercised (1) (251,402) $ 38.69 (585,428) $ 38.60
Expired (31,266) $ 37.04 (668,263) $ 54.07 Forfeited (8,133) $ 38.07 (64,030) $ 42.90
Options outstanding at end of year 326,763 $ 40.98 617,564 $ 39.81
(1) The weighted average market price of the Company’s common shares upon the exercise of stock options was $54.93 in 2017 ($40.52 in 2016).
The table below summarizes information regarding the stock options outstanding and exercisable as at December 31, 2017.
OPTIONS OUTSTANDING OPTIONS EXERCISABLE
EXERCISE PRICE STOCK OPTION
PLAN YEAR OF
GRANT NUMBER
OUTSTANDING
WEIGHTED AVERAGE
REMAINING OPTIONS’ TERM
(MONTHS)
WEIGHTED AVERAGE
EXERCISE PRICE (IN DOLLARS)
NUMBER EXERCISABLE
WEIGHTED AVERAGE
EXERCISE PRICE (IN DOLLARS)
$40.98 2013 2013 326,763 16 $ 40.98 326,763 $ 40.98
As at December 31, 2017, 2,526,997 stock options remained available for future grants under the 2013 stock option plan (2016: 3,200,000 stock options), while no stock options remain available for future grants under the 2011 stock option plan.
The stock option compensation cost recorded in the year ended December 31, 2017 was $0.1 million (2016: $0.7 million).
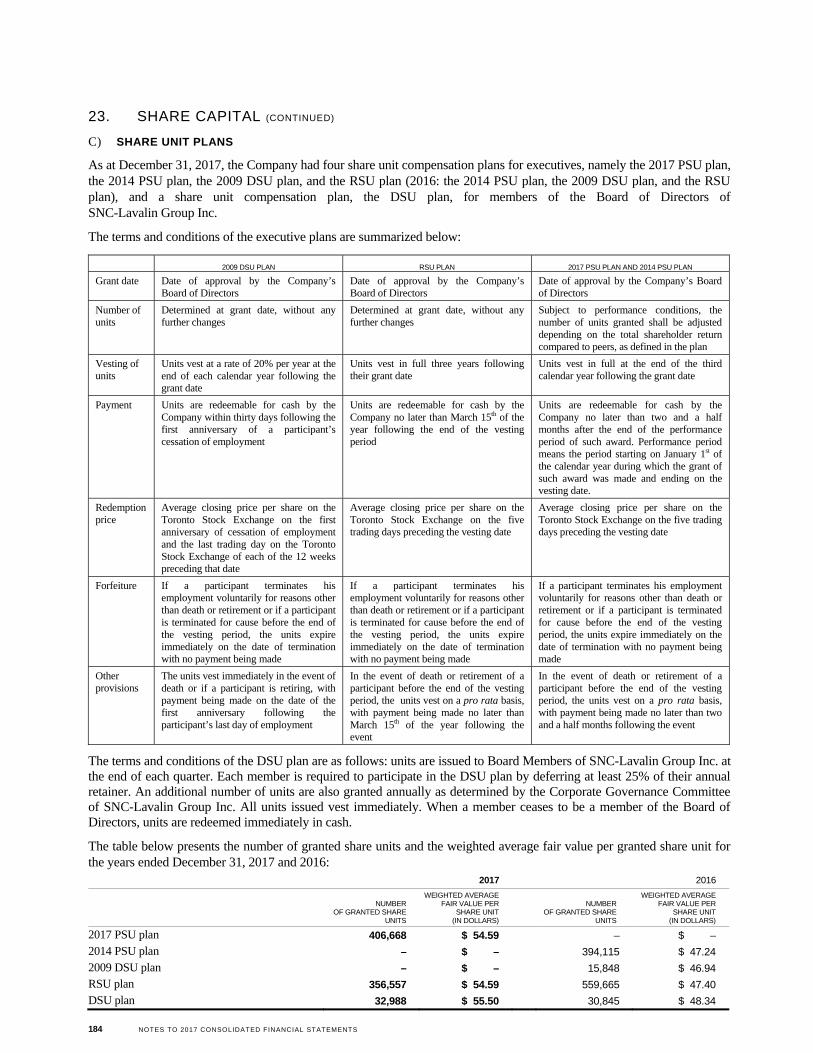
184 NOTES TO 2017 CONSOLIDATED FINANCIAL STATEMENTS
23. SHARE CAPITAL (CONTINUED)
C) SHARE UNIT PLANS
As at December 31, 2017, the Company had four share unit compensation plans for executives, namely the 2017 PSU plan, the 2014 PSU plan, the 2009 DSU plan, and the RSU plan (2016: the 2014 PSU plan, the 2009 DSU plan, and the RSU plan), and a share unit compensation plan, the DSU plan, for members of the Board of Directors of SNC-Lavalin Group Inc.
The terms and conditions of the executive plans are summarized below:
2009 DSU PLAN RSU PLAN 2017 PSU PLAN AND 2014 PSU PLAN
Grant date Date of approval by the Company’s Board of Directors
Date of approval by the Company’s Board of Directors
Date of approval by the Company’s Board of Directors
Number of units
Determined at grant date, without any further changes
Determined at grant date, without any further changes
Subject to performance conditions, the number of units granted shall be adjusted depending on the total shareholder return compared to peers, as defined in the plan
Vesting of units
Units vest at a rate of 20% per year at the end of each calendar year following the grant date
Units vest in full three years following their grant date
Units vest in full at the end of the third calendar year following the grant date
Payment Units are redeemable for cash by the Company within thirty days following the first anniversary of a participant’s cessation of employment
Units are redeemable for cash by the Company no later than March 15th of the year following the end of the vesting period
Units are redeemable for cash by the Company no later than two and a half months after the end of the performance period of such award. Performance period means the period starting on January 1st of the calendar year during which the grant of such award was made and ending on the vesting date.
Redemption price
Average closing price per share on the Toronto Stock Exchange on the first anniversary of cessation of employment and the last trading day on the Toronto Stock Exchange of each of the 12 weeks preceding that date
Average closing price per share on the Toronto Stock Exchange on the five trading days preceding the vesting date
Average closing price per share on the Toronto Stock Exchange on the five trading days preceding the vesting date
Forfeiture If a participant terminates his employment voluntarily for reasons other than death or retirement or if a participant is terminated for cause before the end of the vesting period, the units expire immediately on the date of termination with no payment being made
If a participant terminates his employment voluntarily for reasons other than death or retirement or if a participant is terminated for cause before the end of the vesting period, the units expire immediately on the date of termination with no payment being made
If a participant terminates his employment voluntarily for reasons other than death or retirement or if a participant is terminated for cause before the end of the vesting period, the units expire immediately on the date of termination with no payment being made
Other provisions
The units vest immediately in the event of death or if a participant is retiring, with payment being made on the date of the first anniversary following the participant’s last day of employment
In the event of death or retirement of a participant before the end of the vesting period, the units vest on a pro rata basis, with payment being made no later than March 15th of the year following the event
In the event of death or retirement of a participant before the end of the vesting period, the units vest on a pro rata basis, with payment being made no later than two and a half months following the event
The terms and conditions of the DSU plan are as follows: units are issued to Board Members of SNC-Lavalin Group Inc. at the end of each quarter. Each member is required to participate in the DSU plan by deferring at least 25% of their annual retainer. An additional number of units are also granted annually as determined by the Corporate Governance Committee of SNC-Lavalin Group Inc. All units issued vest immediately. When a member ceases to be a member of the Board of Directors, units are redeemed immediately in cash.
The table below presents the number of granted share units and the weighted average fair value per granted share unit for the years ended December 31, 2017 and 2016:
2017 2016
NUMBER
OF GRANTED SHARE UNITS
WEIGHTED AVERAGE FAIR VALUE PER
SHARE UNIT (IN DOLLARS)
NUMBER OF GRANTED SHARE
UNITS
WEIGHTED AVERAGE FAIR VALUE PER
SHARE UNIT (IN DOLLARS)
2017 PSU plan 406,668 $ 54.59 – $ –
2014 PSU plan – $ – 394,115 $ 47.24
2009 DSU plan – $ – 15,848 $ 46.94
RSU plan 356,557 $ 54.59 559,665 $ 47.40
DSU plan 32,988 $ 55.50 30,845 $ 48.34
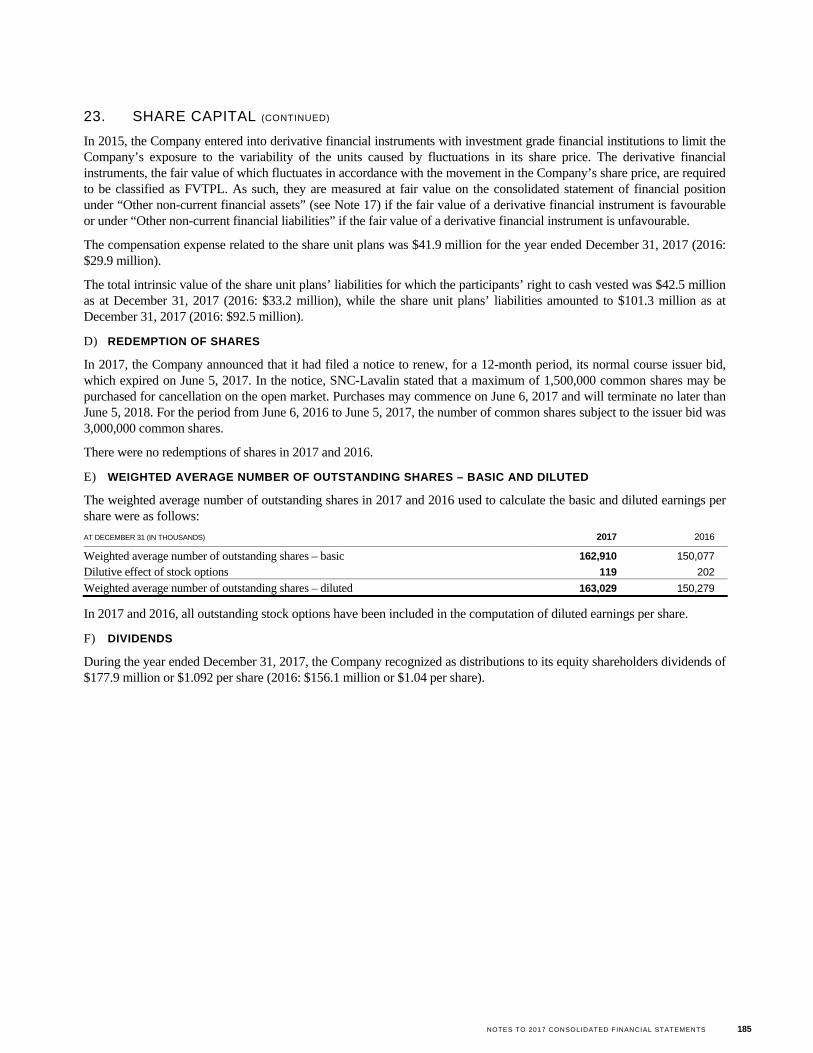
NOTES TO 2017 CONSOLIDATED FINANCIAL STATEMENTS 185
23. SHARE CAPITAL (CONTINUED)
In 2015, the Company entered into derivative financial instruments with investment grade financial institutions to limit the Company’s exposure to the variability of the units caused by fluctuations in its share price. The derivative financial instruments, the fair value of which fluctuates in accordance with the movement in the Company’s share price, are required to be classified as FVTPL. As such, they are measured at fair value on the consolidated statement of financial position under “Other non-current financial assets” (see Note 17) if the fair value of a derivative financial instrument is favourable or under “Other non-current financial liabilities” if the fair value of a derivative financial instrument is unfavourable.
The compensation expense related to the share unit plans was $41.9 million for the year ended December 31, 2017 (2016: $29.9 million).
The total intrinsic value of the share unit plans’ liabilities for which the participants’ right to cash vested was $42.5 million as at December 31, 2017 (2016: $33.2 million), while the share unit plans’ liabilities amounted to $101.3 million as at December 31, 2017 (2016: $92.5 million).
D) REDEMPTION OF SHARES
In 2017, the Company announced that it had filed a notice to renew, for a 12-month period, its normal course issuer bid, which expired on June 5, 2017. In the notice, SNC-Lavalin stated that a maximum of 1,500,000 common shares may be purchased for cancellation on the open market. Purchases may commence on June 6, 2017 and will terminate no later than June 5, 2018. For the period from June 6, 2016 to June 5, 2017, the number of common shares subject to the issuer bid was 3,000,000 common shares.
There were no redemptions of shares in 2017 and 2016.
E) WEIGHTED AVERAGE NUMBER OF OUTSTANDING SHARES – BASIC AND DILUTED
The weighted average number of outstanding shares in 2017 and 2016 used to calculate the basic and diluted earnings per share were as follows:
AT DECEMBER 31 (IN THOUSANDS) 2017 2016
Weighted average number of outstanding shares – basic 162,910 150,077
Dilutive effect of stock options 119 202
Weighted average number of outstanding shares – diluted 163,029 150,279
In 2017 and 2016, all outstanding stock options have been included in the computation of diluted earnings per share.
F) DIVIDENDS
During the year ended December 31, 2017, the Company recognized as distributions to its equity shareholders dividends of $177.9 million or $1.092 per share (2016: $156.1 million or $1.04 per share).
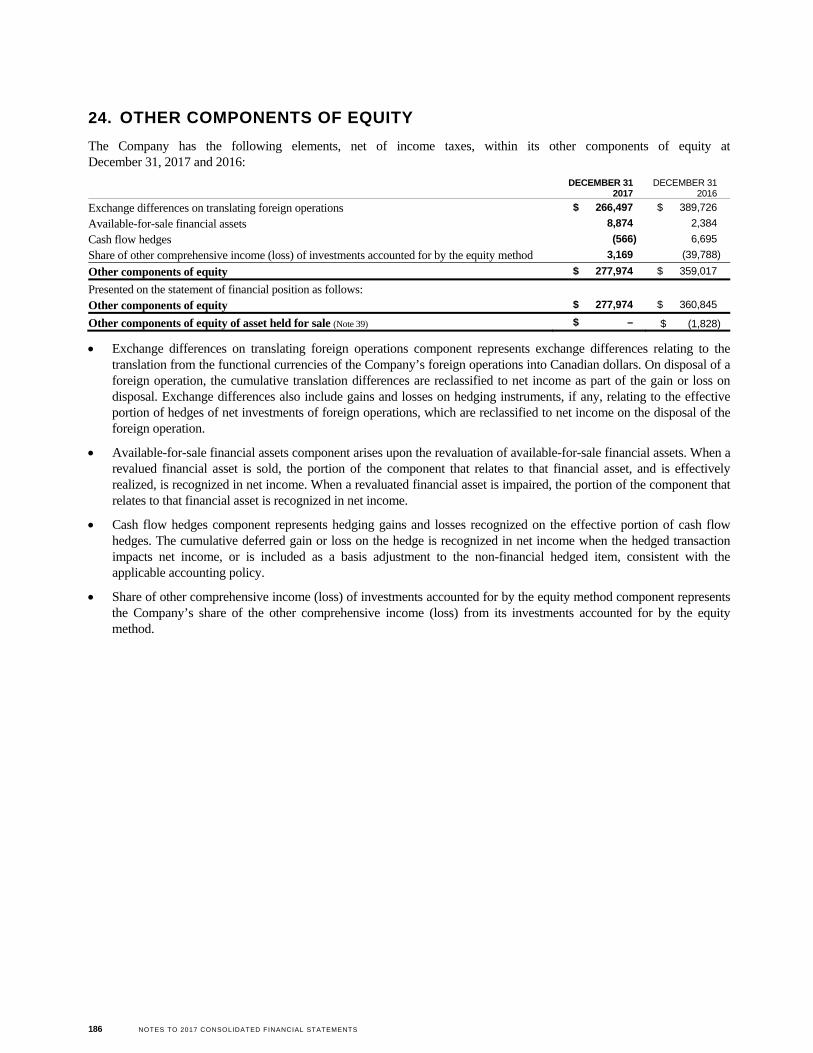
186 NOTES TO 2017 CONSOLIDATED FINANCIAL STATEMENTS
24. OTHER COMPONENTS OF EQUITY
The Company has the following elements, net of income taxes, within its other components of equity at December 31, 2017 and 2016:
DECEMBER 31 2017
DECEMBER 31 2016
Exchange differences on translating foreign operations $ 266,497 $ 389,726
Available-for-sale financial assets 8,874 2,384
Cash flow hedges (566) 6,695
Share of other comprehensive income (loss) of investments accounted for by the equity method 3,169 (39,788)
Other components of equity $ 277,974 $ 359,017
Presented on the statement of financial position as follows:
Other components of equity $ 277,974 $ 360,845
Other components of equity of asset held for sale (Note 39) $ – $ (1,828)
Exchange differences on translating foreign operations component represents exchange differences relating to the translation from the functional currencies of the Company’s foreign operations into Canadian dollars. On disposal of a foreign operation, the cumulative translation differences are reclassified to net income as part of the gain or loss on disposal. Exchange differences also include gains and losses on hedging instruments, if any, relating to the effective portion of hedges of net investments of foreign operations, which are reclassified to net income on the disposal of the foreign operation.
Available-for-sale financial assets component arises upon the revaluation of available-for-sale financial assets. When a revalued financial asset is sold, the portion of the component that relates to that financial asset, and is effectively realized, is recognized in net income. When a revaluated financial asset is impaired, the portion of the component that relates to that financial asset is recognized in net income.
Cash flow hedges component represents hedging gains and losses recognized on the effective portion of cash flow hedges. The cumulative deferred gain or loss on the hedge is recognized in net income when the hedged transaction impacts net income, or is included as a basis adjustment to the non-financial hedged item, consistent with the applicable accounting policy.
Share of other comprehensive income (loss) of investments accounted for by the equity method component represents the Company’s share of the other comprehensive income (loss) from its investments accounted for by the equity method.
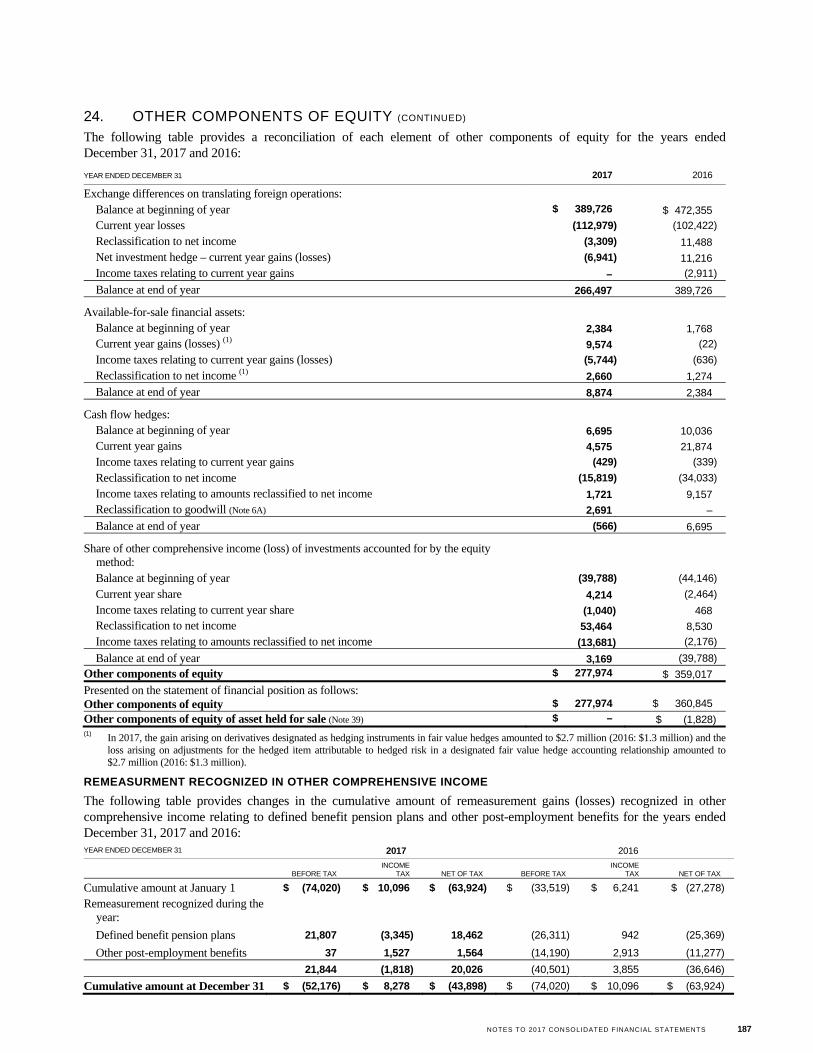
NOTES TO 2017 CONSOLIDATED FINANCIAL STATEMENTS 187
24. OTHER COMPONENTS OF EQUITY (CONTINUED)
The following table provides a reconciliation of each element of other components of equity for the years ended December 31, 2017 and 2016:
YEAR ENDED DECEMBER 31 2017 2016
Exchange differences on translating foreign operations:
Balance at beginning of year $ 389,726 $ 472,355
Current year losses (112,979) (102,422)
Reclassification to net income (3,309) 11,488
Net investment hedge – current year gains (losses) (6,941) 11,216
Income taxes relating to current year gains – (2,911)
Balance at end of year 266,497 389,726
Available-for-sale financial assets:
Balance at beginning of year 2,384 1,768
Current year gains (losses) (1) 9,574 (22)
Income taxes relating to current year gains (losses) (5,744) (636)
Reclassification to net income (1) 2,660 1,274
Balance at end of year 8,874 2,384
Cash flow hedges:
Balance at beginning of year 6,695 10,036
Current year gains 4,575 21,874
Income taxes relating to current year gains (429) (339)
Reclassification to net income (15,819) (34,033)
Income taxes relating to amounts reclassified to net income 1,721 9,157
Reclassification to goodwill (Note 6A) 2,691 –
Balance at end of year (566) 6,695
Share of other comprehensive income (loss) of investments accounted for by the equity method:
Balance at beginning of year (39,788) (44,146)
Current year share 4,214 (2,464)
Income taxes relating to current year share (1,040) 468
Reclassification to net income 53,464 8,530
Income taxes relating to amounts reclassified to net income (13,681) (2,176)
Balance at end of year 3,169 (39,788)
Other components of equity $ 277,974 $ 359,017
Presented on the statement of financial position as follows: Other components of equity $ 277,974 $ 360,845
Other components of equity of asset held for sale (Note 39) $ – $ (1,828) (1) In 2017, the gain arising on derivatives designated as hedging instruments in fair value hedges amounted to $2.7 million (2016: $1.3 million) and the
loss arising on adjustments for the hedged item attributable to hedged risk in a designated fair value hedge accounting relationship amounted to $2.7 million (2016: $1.3 million).
REMEASURMENT RECOGNIZED IN OTHER COMPREHENSIVE INCOME
The following table provides changes in the cumulative amount of remeasurement gains (losses) recognized in other comprehensive income relating to defined benefit pension plans and other post-employment benefits for the years ended December 31, 2017 and 2016: YEAR ENDED DECEMBER 31 2017 2016
BEFORE TAX
INCOME TAX NET OF TAX BEFORE TAX
INCOME TAX NET OF TAX
Cumulative amount at January 1 $ (74,020) $ 10,096 $ (63,924) $ (33,519) $ 6,241 $ (27,278)
Remeasurement recognized during the year:
Defined benefit pension plans 21,807 (3,345) 18,462 (26,311) 942 (25,369)
Other post-employment benefits 37 1,527 1,564 (14,190) 2,913 (11,277)
21,844 (1,818) 20,026 (40,501) 3,855 (36,646)
Cumulative amount at December 31 $ (52,176) $ 8,278 $ (43,898) $ (74,020) $ 10,096 $ (63,924)
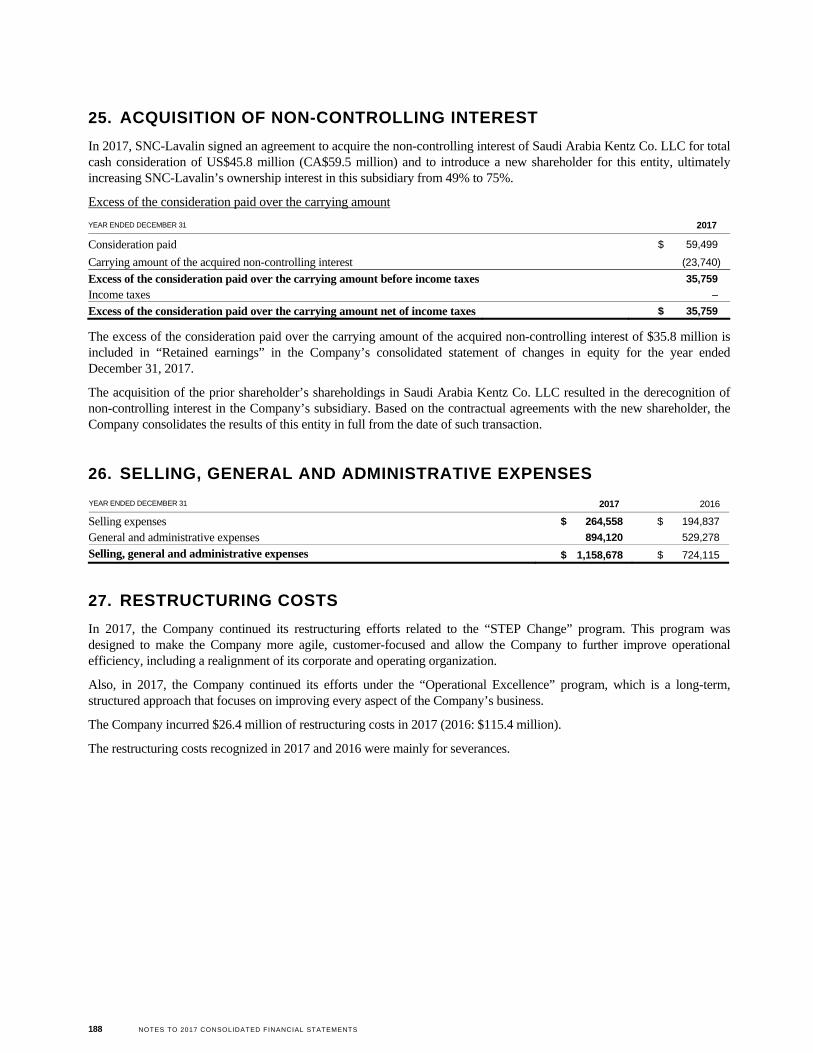
188 NOTES TO 2017 CONSOLIDATED FINANCIAL STATEMENTS
25. ACQUISITION OF NON-CONTROLLING INTEREST
In 2017, SNC-Lavalin signed an agreement to acquire the non-controlling interest of Saudi Arabia Kentz Co. LLC for total cash consideration of US$45.8 million (CA$59.5 million) and to introduce a new shareholder for this entity, ultimately increasing SNC-Lavalin’s ownership interest in this subsidiary from 49% to 75%.
Excess of the consideration paid over the carrying amount
YEAR ENDED DECEMBER 31 2017
Consideration paid $ 59,499
Carrying amount of the acquired non-controlling interest (23,740)
Excess of the consideration paid over the carrying amount before income taxes 35,759
Income taxes –
Excess of the consideration paid over the carrying amount net of income taxes $ 35,759
The excess of the consideration paid over the carrying amount of the acquired non-controlling interest of $35.8 million is included in “Retained earnings” in the Company’s consolidated statement of changes in equity for the year ended December 31, 2017.
The acquisition of the prior shareholder’s shareholdings in Saudi Arabia Kentz Co. LLC resulted in the derecognition of non-controlling interest in the Company’s subsidiary. Based on the contractual agreements with the new shareholder, the Company consolidates the results of this entity in full from the date of such transaction.
26. SELLING, GENERAL AND ADMINISTRATIVE EXPENSES
YEAR ENDED DECEMBER 31 2017 2016
Selling expenses $ 264,558 $ 194,837
General and administrative expenses 894,120 529,278
Selling, general and administrative expenses $ 1,158,678 $ 724,115
27. RESTRUCTURING COSTS
In 2017, the Company continued its restructuring efforts related to the “STEP Change” program. This program was designed to make the Company more agile, customer-focused and allow the Company to further improve operational efficiency, including a realignment of its corporate and operating organization.
Also, in 2017, the Company continued its efforts under the “Operational Excellence” program, which is a long-term, structured approach that focuses on improving every aspect of the Company’s business.
The Company incurred $26.4 million of restructuring costs in 2017 (2016: $115.4 million).
The restructuring costs recognized in 2017 and 2016 were mainly for severances.
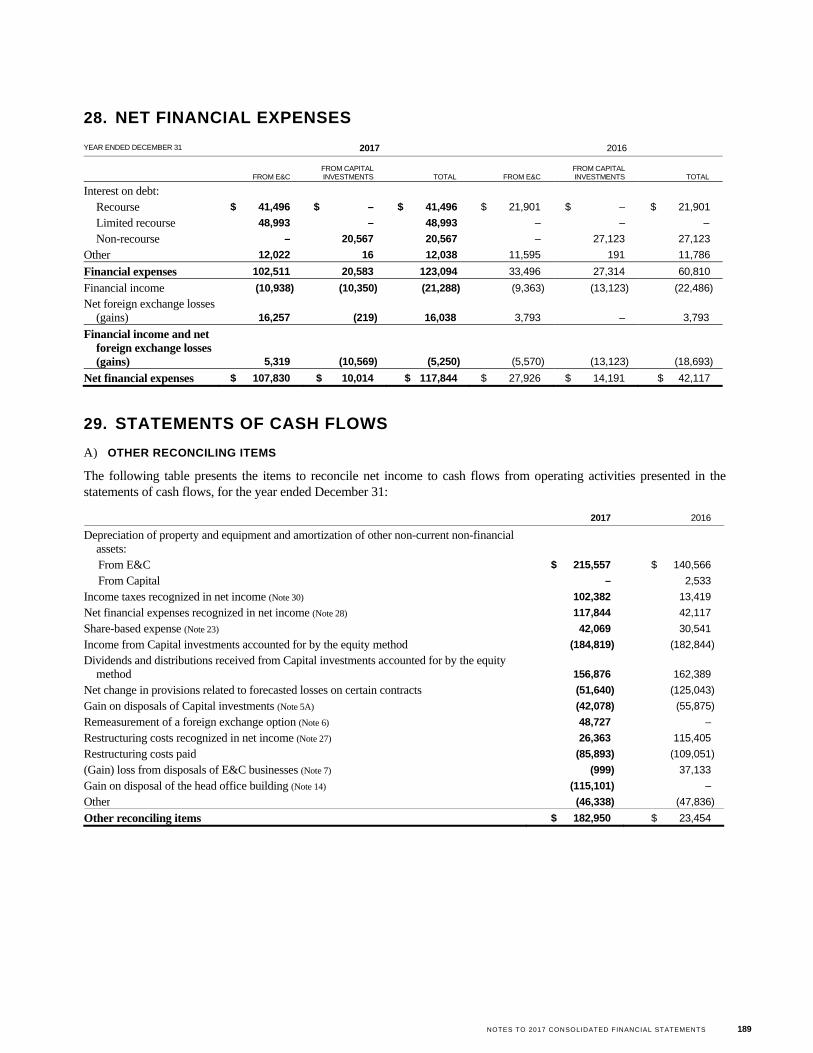
NOTES TO 2017 CONSOLIDATED FINANCIAL STATEMENTS 189
28. NET FINANCIAL EXPENSES
YEAR ENDED DECEMBER 31 2017 2016
FROM E&C
FROM CAPITAL INVESTMENTS TOTAL FROM E&C
FROM CAPITAL INVESTMENTS TOTAL
Interest on debt:
Recourse $ 41,496 $ – $ 41,496 $ 21,901 $ – $ 21,901
Limited recourse 48,993 – 48,993 – – –
Non-recourse – 20,567 20,567 – 27,123 27,123
Other 12,022 16 12,038 11,595 191 11,786
Financial expenses 102,511 20,583 123,094 33,496 27,314 60,810
Financial income (10,938) (10,350) (21,288) (9,363) (13,123) (22,486)
Net foreign exchange losses (gains) 16,257 (219) 16,038 3,793 – 3,793
Financial income and net foreign exchange losses (gains) 5,319 (10,569) (5,250) (5,570) (13,123) (18,693)
Net financial expenses $ 107,830 $ 10,014 $ 117,844 $ 27,926 $ 14,191 $ 42,117
29. STATEMENTS OF CASH FLOWS
A) OTHER RECONCILING ITEMS
The following table presents the items to reconcile net income to cash flows from operating activities presented in the statements of cash flows, for the year ended December 31:
2017 2016
Depreciation of property and equipment and amortization of other non-current non-financial assets:
From E&C $ 215,557 $ 140,566
From Capital – 2,533
Income taxes recognized in net income (Note 30) 102,382 13,419
Net financial expenses recognized in net income (Note 28) 117,844 42,117
Share-based expense (Note 23) 42,069 30,541
Income from Capital investments accounted for by the equity method (184,819) (182,844)
Dividends and distributions received from Capital investments accounted for by the equity method 156,876 162,389
Net change in provisions related to forecasted losses on certain contracts (51,640) (125,043)
Gain on disposals of Capital investments (Note 5A) (42,078) (55,875)
Remeasurement of a foreign exchange option (Note 6) 48,727 –
Restructuring costs recognized in net income (Note 27) 26,363 115,405
Restructuring costs paid (85,893) (109,051)
(Gain) loss from disposals of E&C businesses (Note 7) (999) 37,133
Gain on disposal of the head office building (Note 14) (115,101) –
Other (46,338) (47,836)
Other reconciling items $ 182,950 $ 23,454
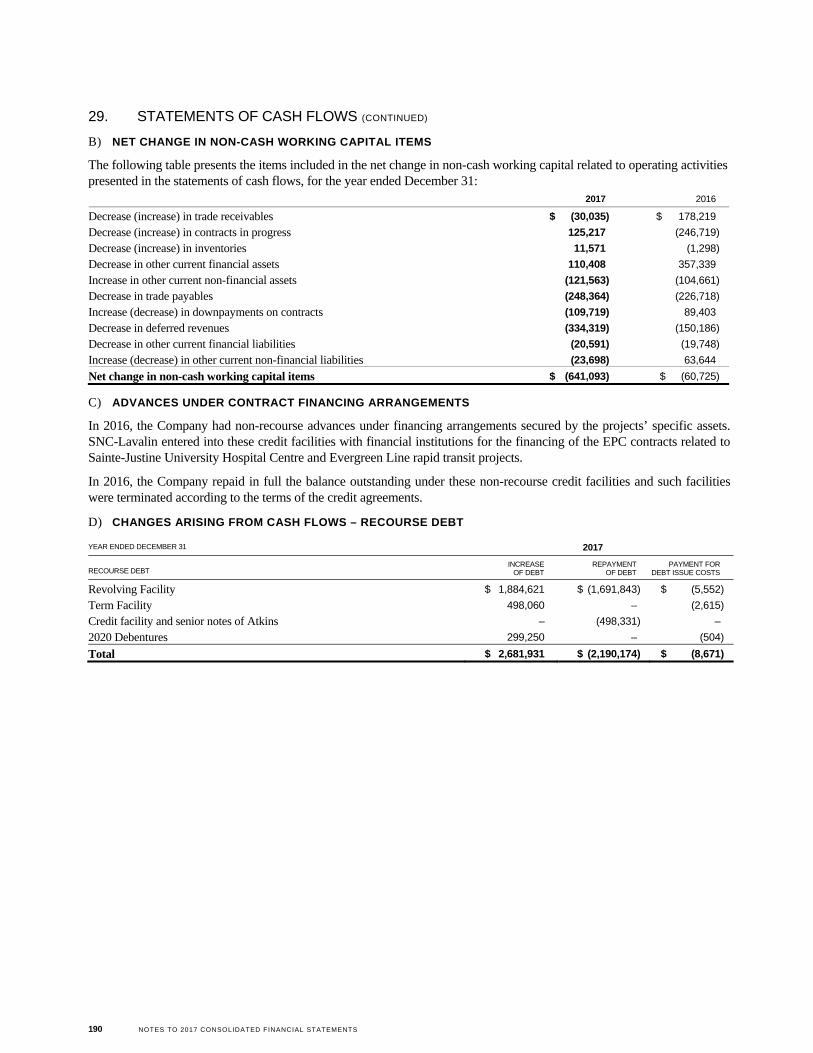
190 NOTES TO 2017 CONSOLIDATED FINANCIAL STATEMENTS
29. STATEMENTS OF CASH FLOWS (CONTINUED)
B) NET CHANGE IN NON-CASH WORKING CAPITAL ITEMS
The following table presents the items included in the net change in non-cash working capital related to operating activities presented in the statements of cash flows, for the year ended December 31:
2017 2016
Decrease (increase) in trade receivables $ (30,035) $ 178,219
Decrease (increase) in contracts in progress 125,217 (246,719)
Decrease (increase) in inventories 11,571 (1,298)
Decrease in other current financial assets 110,408 357,339
Increase in other current non-financial assets (121,563) (104,661)
Decrease in trade payables (248,364) (226,718)
Increase (decrease) in downpayments on contracts (109,719) 89,403
Decrease in deferred revenues (334,319) (150,186)
Decrease in other current financial liabilities (20,591) (19,748)
Increase (decrease) in other current non-financial liabilities (23,698) 63,644
Net change in non-cash working capital items $ (641,093) $ (60,725)
C) ADVANCES UNDER CONTRACT FINANCING ARRANGEMENTS
In 2016, the Company had non-recourse advances under financing arrangements secured by the projects’ specific assets. SNC-Lavalin entered into these credit facilities with financial institutions for the financing of the EPC contracts related to Sainte-Justine University Hospital Centre and Evergreen Line rapid transit projects.
In 2016, the Company repaid in full the balance outstanding under these non-recourse credit facilities and such facilities were terminated according to the terms of the credit agreements.
D) CHANGES ARISING FROM CASH FLOWS – RECOURSE DEBT
YEAR ENDED DECEMBER 31 2017
RECOURSE DEBT INCREASE OF DEBT
REPAYMENT OF DEBT
PAYMENT FOR DEBT ISSUE COSTS
Revolving Facility $ 1,884,621 $ (1,691,843) $ (5,552)
Term Facility 498,060 – (2,615)
Credit facility and senior notes of Atkins – (498,331) –
2020 Debentures 299,250 – (504)
Total $ 2,681,931 $ (2,190,174) $ (8,671)
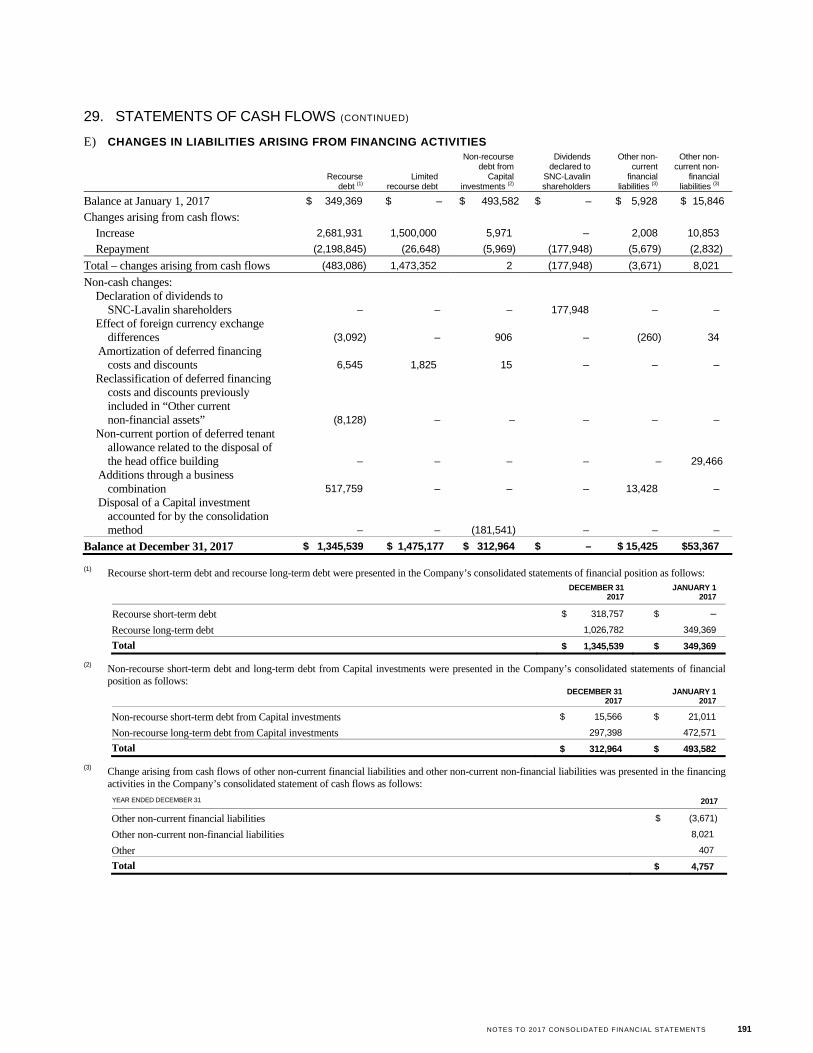
NOTES TO 2017 CONSOLIDATED FINANCIAL STATEMENTS 191
29. STATEMENTS OF CASH FLOWS (CONTINUED)
E) CHANGES IN LIABILITIES ARISING FROM FINANCING ACTIVITIES
Recourse
debt (1) Limited
recourse debt
Non-recourse debt from
Capital investments (2)
Dividends declared to
SNC-Lavalin shareholders
Other non-current
financial liabilities (3)
Other non-current non-
financial liabilities (3)
Balance at January 1, 2017 $ 349,369 $ – $ 493,582 $ – $ 5,928 $ 15,846
Changes arising from cash flows:
Increase 2,681,931 1,500,000 5,971 – 2,008 10,853
Repayment (2,198,845) (26,648) (5,969) (177,948) (5,679) (2,832)
Total – changes arising from cash flows (483,086) 1,473,352 2 (177,948) (3,671) 8,021
Non-cash changes: Declaration of dividends to
SNC-Lavalin shareholders – – – 177,948 – – Effect of foreign currency exchange
differences (3,092) – 906 – (260) 34 Amortization of deferred financing
costs and discounts 6,545 1,825 15 – – – Reclassification of deferred financing
costs and discounts previously included in “Other current non-financial assets” (8,128) – – – – –
Non-current portion of deferred tenant allowance related to the disposal of the head office building – – – – – 29,466
Additions through a business combination 517,759 – – – 13,428 –
Disposal of a Capital investment accounted for by the consolidation method – – (181,541) – – –
Balance at December 31, 2017 $ 1,345,539 $ 1,475,177 $ 312,964 $ – $ 15,425 $53,367
(1) Recourse short-term debt and recourse long-term debt were presented in the Company’s consolidated statements of financial position as follows:
DECEMBER 31
2017 JANUARY 1
2017
Recourse short-term debt $ 318,757 $ –
Recourse long-term debt 1,026,782 349,369
Total $ 1,345,539 $ 349,369
(2) Non-recourse short-term debt and long-term debt from Capital investments were presented in the Company’s consolidated statements of financial position as follows:
DECEMBER 31
2017 JANUARY 1
2017
Non-recourse short-term debt from Capital investments $ 15,566 $ 21,011
Non-recourse long-term debt from Capital investments 297,398 472,571
Total $ 312,964 $ 493,582
(3) Change arising from cash flows of other non-current financial liabilities and other non-current non-financial liabilities was presented in the financing activities in the Company’s consolidated statement of cash flows as follows:
YEAR ENDED DECEMBER 31 2017
Other non-current financial liabilities $ (3,671)
Other non-current non-financial liabilities 8,021
Other 407
Total $ 4,757
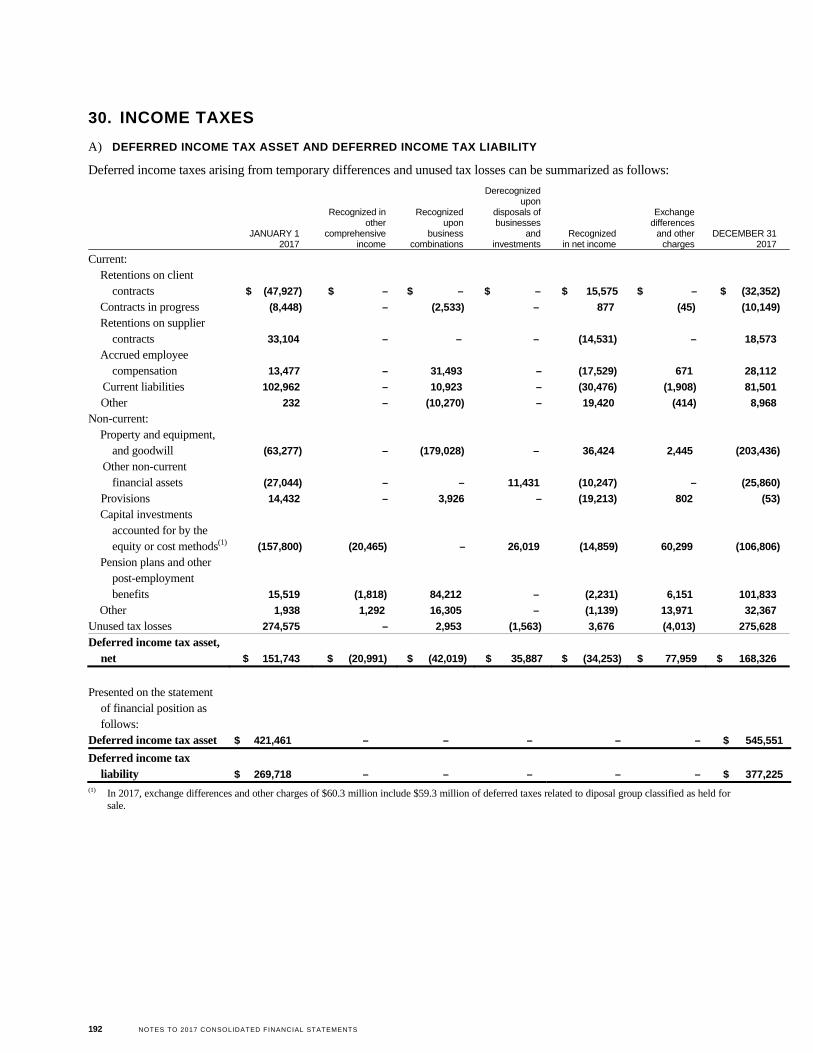
192 NOTES TO 2017 CONSOLIDATED FINANCIAL STATEMENTS
30. INCOME TAXES
A) DEFERRED INCOME TAX ASSET AND DEFERRED INCOME TAX LIABILITY
Deferred income taxes arising from temporary differences and unused tax losses can be summarized as follows:
JANUARY 1 2017
Recognized in other
comprehensive income
Recognized upon
business combinations
Derecognized upon
disposals of businesses
and investments
Recognized in net income
Exchange differences
and other charges
DECEMBER 31 2017
Current:
Retentions on client contracts $ (47,927) $ – $ – $ – $ 15,575 $ – $ (32,352)
Contracts in progress (8,448) – (2,533) – 877 (45) (10,149)
Retentions on supplier contracts 33,104 – – – (14,531) – 18,573
Accrued employee compensation 13,477 – 31,493 – (17,529) 671 28,112
Current liabilities 102,962 – 10,923 – (30,476) (1,908) 81,501
Other 232 – (10,270) – 19,420 (414) 8,968
Non-current:
Property and equipment, and goodwill (63,277) – (179,028) – 36,424 2,445 (203,436)
Other non-current financial assets (27,044) – – 11,431 (10,247) – (25,860)
Provisions 14,432 – 3,926 – (19,213) 802 (53)
Capital investments accounted for by the equity or cost methods(1) (157,800) (20,465) – 26,019 (14,859) 60,299 (106,806)
Pension plans and other post-employment benefits 15,519 (1,818) 84,212 – (2,231) 6,151 101,833
Other 1,938 1,292 16,305 – (1,139) 13,971 32,367
Unused tax losses 274,575 – 2,953 (1,563) 3,676 (4,013) 275,628
Deferred income tax asset, net $ 151,743 $ (20,991) $ (42,019) $ 35,887 $ (34,253) $ 77,959 $ 168,326
Presented on the statement
of financial position as follows:
Deferred income tax asset $ 421,461 – – – – – $ 545,551
Deferred income tax liability $ 269,718 – – – – – $ 377,225
(1) In 2017, exchange differences and other charges of $60.3 million include $59.3 million of deferred taxes related to diposal group classified as held for sale.
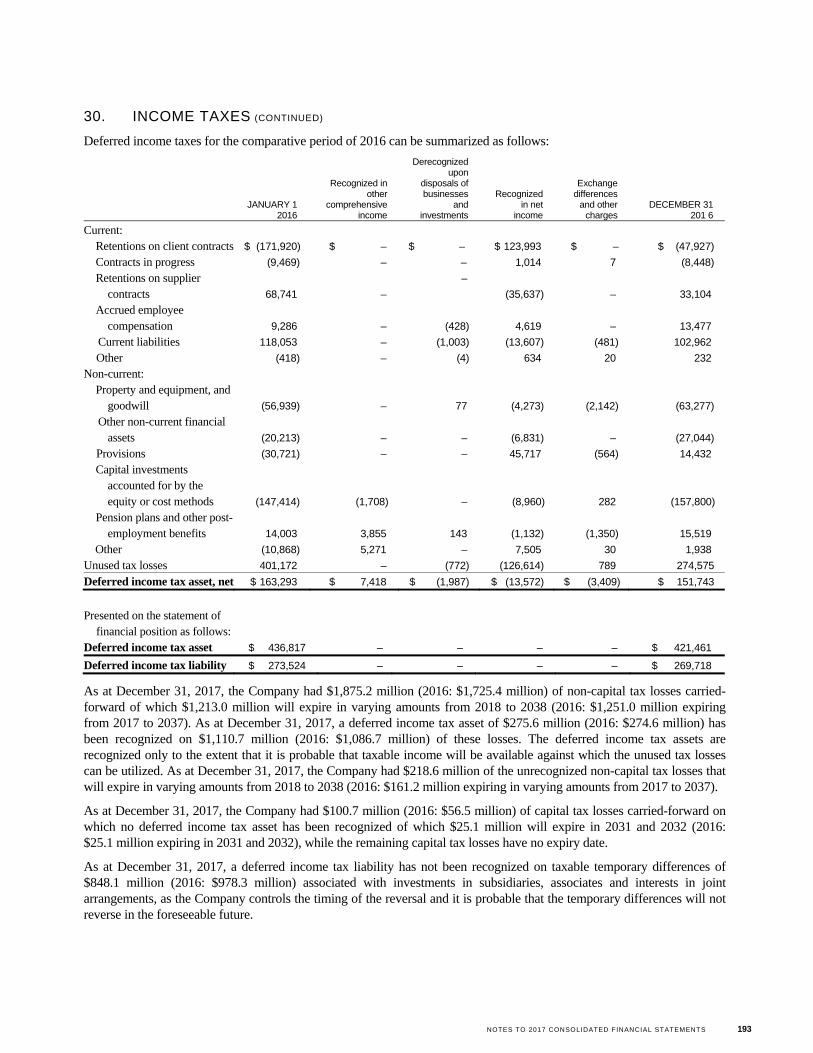
NOTES TO 2017 CONSOLIDATED FINANCIAL STATEMENTS 193
30. INCOME TAXES (CONTINUED)
Deferred income taxes for the comparative period of 2016 can be summarized as follows:
JANUARY 1 2016
Recognized in other
comprehensive income
Derecognized upon
disposals of businesses
and investments
Recognized in net
income
Exchange differences
and other charges
DECEMBER 31 201 6
Current:
Retentions on client contracts $ (171,920) $ – $ – $ 123,993 $ – $ (47,927)
Contracts in progress (9,469) – – 1,014 7 (8,448)
Retentions on supplier contracts 68,741 –
–
(35,637) – 33,104
Accrued employee compensation 9,286 – (428) 4,619 – 13,477
Current liabilities 118,053 – (1,003) (13,607) (481) 102,962
Other (418) – (4) 634 20 232
Non-current:
Property and equipment, and goodwill (56,939) – 77 (4,273) (2,142) (63,277)
Other non-current financial assets (20,213) – – (6,831) – (27,044)
Provisions (30,721) – – 45,717 (564) 14,432
Capital investments accounted for by the equity or cost methods (147,414) (1,708) – (8,960) 282 (157,800)
Pension plans and other post-employment benefits 14,003 3,855 143 (1,132) (1,350) 15,519
Other (10,868) 5,271 – 7,505 30 1,938
Unused tax losses 401,172 – (772) (126,614) 789 274,575
Deferred income tax asset, net $ 163,293 $ 7,418 $ (1,987) $ (13,572) $ (3,409) $ 151,743
Presented on the statement of financial position as follows:
Deferred income tax asset $ 436,817 – – – – $ 421,461
Deferred income tax liability $ 273,524 – – – – $ 269,718
As at December 31, 2017, the Company had $1,875.2 million (2016: $1,725.4 million) of non-capital tax losses carried-forward of which $1,213.0 million will expire in varying amounts from 2018 to 2038 (2016: $1,251.0 million expiring from 2017 to 2037). As at December 31, 2017, a deferred income tax asset of $275.6 million (2016: $274.6 million) has been recognized on $1,110.7 million (2016: $1,086.7 million) of these losses. The deferred income tax assets are recognized only to the extent that it is probable that taxable income will be available against which the unused tax losses can be utilized. As at December 31, 2017, the Company had $218.6 million of the unrecognized non-capital tax losses that will expire in varying amounts from 2018 to 2038 (2016: $161.2 million expiring in varying amounts from 2017 to 2037).
As at December 31, 2017, the Company had $100.7 million (2016: $56.5 million) of capital tax losses carried-forward on which no deferred income tax asset has been recognized of which $25.1 million will expire in 2031 and 2032 (2016: $25.1 million expiring in 2031 and 2032), while the remaining capital tax losses have no expiry date.
As at December 31, 2017, a deferred income tax liability has not been recognized on taxable temporary differences of $848.1 million (2016: $978.3 million) associated with investments in subsidiaries, associates and interests in joint arrangements, as the Company controls the timing of the reversal and it is probable that the temporary differences will not reverse in the foreseeable future.
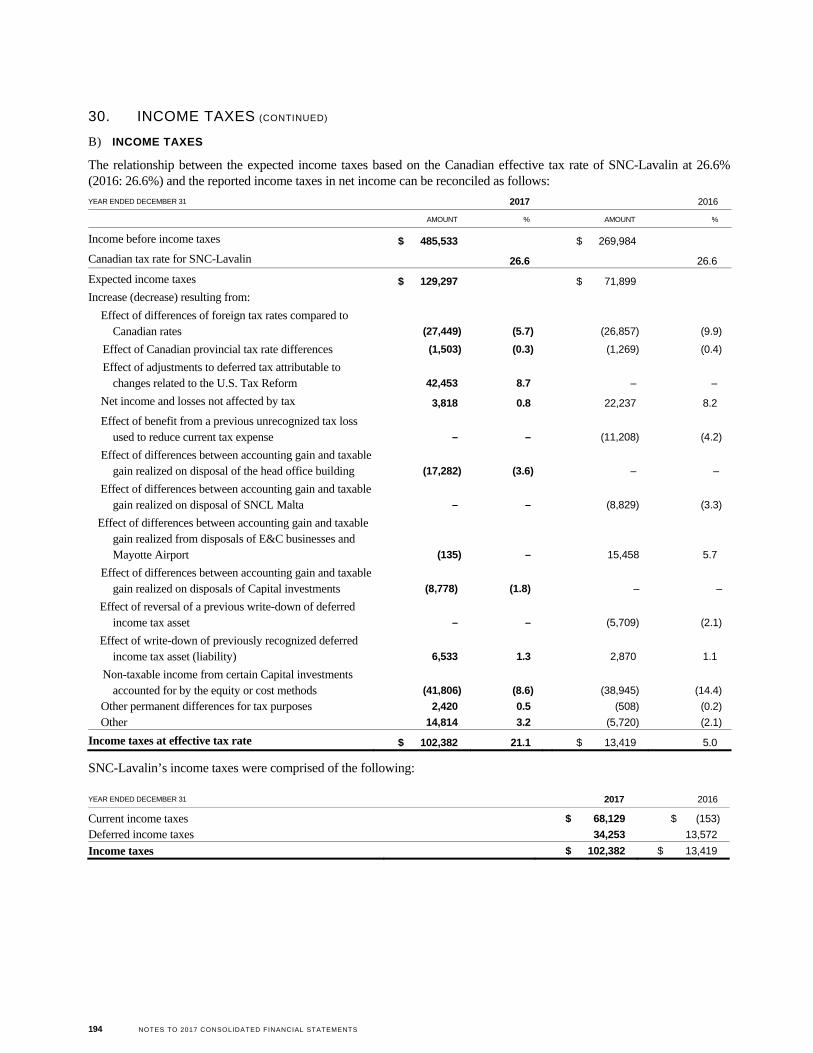
194 NOTES TO 2017 CONSOLIDATED FINANCIAL STATEMENTS
30. INCOME TAXES (CONTINUED)
B) INCOME TAXES
The relationship between the expected income taxes based on the Canadian effective tax rate of SNC-Lavalin at 26.6% (2016: 26.6%) and the reported income taxes in net income can be reconciled as follows:
YEAR ENDED DECEMBER 31 2017 2016
AMOUNT % AMOUNT %
Income before income taxes $ 485,533 $ 269,984
Canadian tax rate for SNC-Lavalin 26.6 26.6
Expected income taxes $ 129,297 $ 71,899
Increase (decrease) resulting from:
Effect of differences of foreign tax rates compared to Canadian rates (27,449) (5.7) (26,857) (9.9)
Effect of Canadian provincial tax rate differences (1,503) (0.3) (1,269) (0.4)
Effect of adjustments to deferred tax attributable to changes related to the U.S. Tax Reform 42,453 8.7 – –
Net income and losses not affected by tax 3,818 0.8 22,237 8.2
Effect of benefit from a previous unrecognized tax loss used to reduce current tax expense – – (11,208) (4.2)
Effect of differences between accounting gain and taxable gain realized on disposal of the head office building (17,282) (3.6) – –
Effect of differences between accounting gain and taxable gain realized on disposal of SNCL Malta – – (8,829) (3.3)
Effect of differences between accounting gain and taxable gain realized from disposals of E&C businesses and Mayotte Airport (135) – 15,458 5.7
Effect of differences between accounting gain and taxable gain realized on disposals of Capital investments (8,778) (1.8) – –
Effect of reversal of a previous write-down of deferred income tax asset – – (5,709) (2.1)
Effect of write-down of previously recognized deferred income tax asset (liability) 6,533 1.3 2,870 1.1
Non-taxable income from certain Capital investments accounted for by the equity or cost methods (41,806) (8.6) (38,945) (14.4)
Other permanent differences for tax purposes 2,420 0.5 (508) (0.2)
Other 14,814 3.2 (5,720) (2.1)
Income taxes at effective tax rate $ 102,382 21.1 $ 13,419 5.0
SNC-Lavalin’s income taxes were comprised of the following:
YEAR ENDED DECEMBER 31 2017 2016
Current income taxes $ 68,129 $ (153)
Deferred income taxes 34,253 13,572
Income taxes $ 102,382 $ 13,419
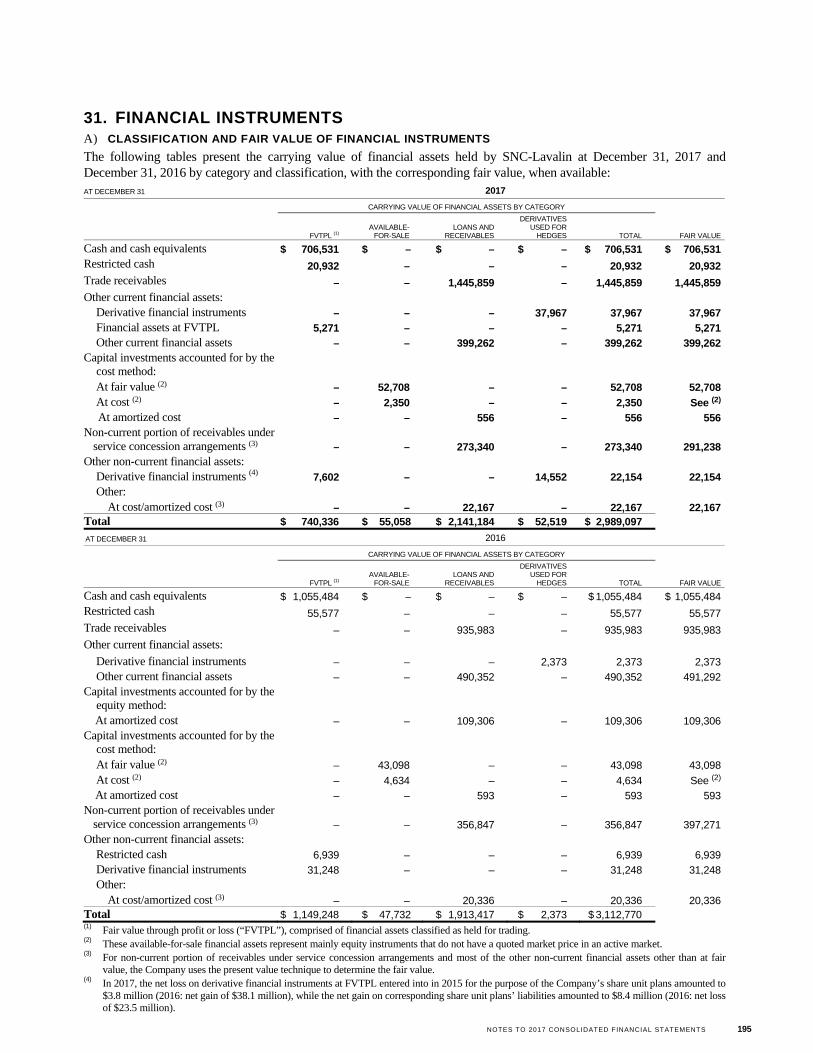
NOTES TO 2017 CONSOLIDATED FINANCIAL STATEMENTS 195
31. FINANCIAL INSTRUMENTS A) CLASSIFICATION AND FAIR VALUE OF FINANCIAL INSTRUMENTS
The following tables present the carrying value of financial assets held by SNC-Lavalin at December 31, 2017 and December 31, 2016 by category and classification, with the corresponding fair value, when available: AT DECEMBER 31 2017
CARRYING VALUE OF FINANCIAL ASSETS BY CATEGORY
FVTPL (1) AVAILABLE-
FOR-SALE LOANS AND
RECEIVABLES
DERIVATIVES USED FOR
HEDGES TOTAL FAIR VALUE
Cash and cash equivalents $ 706,531 $ – $ – $ – $ 706,531 $ 706,531Restricted cash 20,932 – – – 20,932 20,932Trade receivables – – 1,445,859 – 1,445,859 1,445,859Other current financial assets: Derivative financial instruments – – – 37,967 37,967 37,967 Financial assets at FVTPL 5,271 – – – 5,271 5,271 Other current financial assets – – 399,262 – 399,262 399,262Capital investments accounted for by the
cost method:
At fair value (2) – 52,708 – – 52,708 52,708
At cost (2) – 2,350 – – 2,350 See (2) At amortized cost – – 556 – 556 556Non-current portion of receivables under
service concession arrangements (3) – – 273,340 – 273,340 291,238Other non-current financial assets: Derivative financial instruments (4) 7,602 – – 14,552 22,154 22,154 Other:
At cost/amortized cost (3) – – 22,167 – 22,167 22,167Total $ 740,336 $ 55,058 $ 2,141,184 $ 52,519 $ 2,989,097
AT DECEMBER 31 2016
CARRYING VALUE OF FINANCIAL ASSETS BY CATEGORY
FVTPL (1) AVAILABLE-
FOR-SALE LOANS AND
RECEIVABLES
DERIVATIVES USED FOR
HEDGES TOTAL FAIR VALUE
Cash and cash equivalents $ 1,055,484 $ – $ – $ – $ 1,055,484 $ 1,055,484Restricted cash 55,577 – – – 55,577 55,577Trade receivables – – 935,983 – 935,983 935,983Other current financial assets: Derivative financial instruments – – – 2,373 2,373 2,373 Other current financial assets – – 490,352 – 490,352 491,292Capital investments accounted for by the
equity method: At amortized cost – – 109,306 – 109,306 109,306Capital investments accounted for by the
cost method:
At fair value (2) – 43,098 – – 43,098 43,098
At cost (2) – 4,634 – – 4,634 See (2) At amortized cost – – 593 – 593 593Non-current portion of receivables under
service concession arrangements (3) – – 356,847 – 356,847 397,271Other non-current financial assets: Restricted cash 6,939 – – – 6,939 6,939 Derivative financial instruments 31,248 – – – 31,248 31,248 Other:
At cost/amortized cost (3) – – 20,336 – 20,336 20,336Total $ 1,149,248 $ 47,732 $ 1,913,417 $ 2,373 $ 3,112,770 (1) Fair value through profit or loss (“FVTPL”), comprised of financial assets classified as held for trading. (2) These available-for-sale financial assets represent mainly equity instruments that do not have a quoted market price in an active market. (3) For non-current portion of receivables under service concession arrangements and most of the other non-current financial assets other than at fair
value, the Company uses the present value technique to determine the fair value. (4) In 2017, the net loss on derivative financial instruments at FVTPL entered into in 2015 for the purpose of the Company’s share unit plans amounted to
$3.8 million (2016: net gain of $38.1 million), while the net gain on corresponding share unit plans’ liabilities amounted to $8.4 million (2016: net loss of $23.5 million).
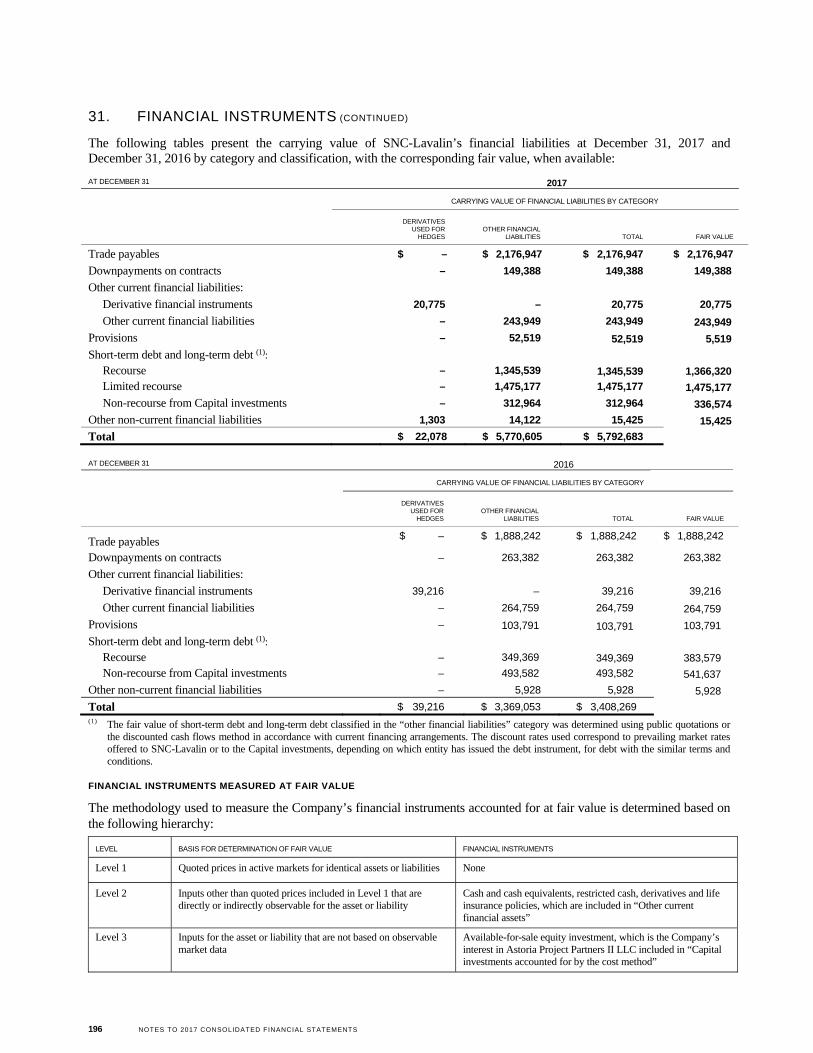
196 NOTES TO 2017 CONSOLIDATED FINANCIAL STATEMENTS
31. FINANCIAL INSTRUMENTS (CONTINUED)
The following tables present the carrying value of SNC-Lavalin’s financial liabilities at December 31, 2017 and December 31, 2016 by category and classification, with the corresponding fair value, when available:
AT DECEMBER 31 2016
CARRYING VALUE OF FINANCIAL LIABILITIES BY CATEGORY
DERIVATIVES USED FOR
HEDGES OTHER FINANCIAL
LIABILITIES TOTAL FAIR VALUE
Trade payables $ – $ 1,888,242 $ 1,888,242 $ 1,888,242
Downpayments on contracts – 263,382 263,382 263,382
Other current financial liabilities:
Derivative financial instruments 39,216 – 39,216 39,216
Other current financial liabilities – 264,759 264,759 264,759
Provisions – 103,791 103,791 103,791
Short-term debt and long-term debt (1): Recourse
– 349,369 349,369 383,579
Non-recourse from Capital investments – 493,582 493,582 541,637
Other non-current financial liabilities – 5,928 5,928 5,928
Total $ 39,216 $ 3,369,053 $ 3,408,269 (1) The fair value of short-term debt and long-term debt classified in the “other financial liabilities” category was determined using public quotations or
the discounted cash flows method in accordance with current financing arrangements. The discount rates used correspond to prevailing market rates offered to SNC-Lavalin or to the Capital investments, depending on which entity has issued the debt instrument, for debt with the similar terms and conditions.
FINANCIAL INSTRUMENTS MEASURED AT FAIR VALUE
The methodology used to measure the Company’s financial instruments accounted for at fair value is determined based on the following hierarchy:
LEVEL BASIS FOR DETERMINATION OF FAIR VALUE FINANCIAL INSTRUMENTS
Level 1 Quoted prices in active markets for identical assets or liabilities None
Level 2 Inputs other than quoted prices included in Level 1 that are directly or indirectly observable for the asset or liability
Cash and cash equivalents, restricted cash, derivatives and life insurance policies, which are included in “Other current financial assets”
Level 3 Inputs for the asset or liability that are not based on observable market data
Available-for-sale equity investment, which is the Company’s interest in Astoria Project Partners II LLC included in “Capital investments accounted for by the cost method”
AT DECEMBER 31
2017
CARRYING VALUE OF FINANCIAL LIABILITIES BY CATEGORY
DERIVATIVES USED FOR
HEDGES OTHER FINANCIAL
LIABILITIES TOTAL FAIR VALUE
Trade payables $ – $ 2,176,947 $ 2,176,947 $ 2,176,947
Downpayments on contracts – 149,388 149,388 149,388
Other current financial liabilities:
Derivative financial instruments 20,775 – 20,775 20,775
Other current financial liabilities – 243,949 243,949 243,949
Provisions – 52,519 52,519 5,519
Short-term debt and long-term debt (1): Recourse
– 1,345,539 1,345,539 1,366,320
Limited recourse – 1,475,177 1,475,177 1,475,177
Non-recourse from Capital investments – 312,964 312,964 336,574
Other non-current financial liabilities 1,303 14,122 15,425 15,425
Total $ 22,078 $ 5,770,605 $ 5,792,683
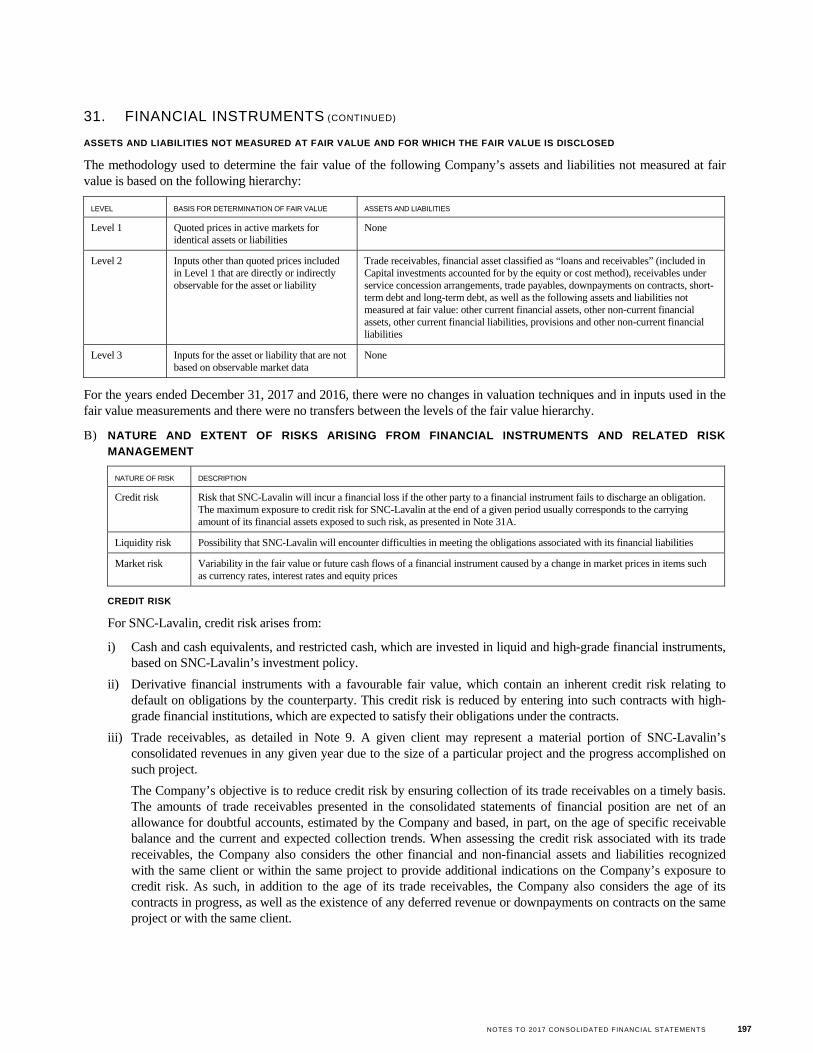
NOTES TO 2017 CONSOLIDATED FINANCIAL STATEMENTS 197
31. FINANCIAL INSTRUMENTS (CONTINUED)
ASSETS AND LIABILITIES NOT MEASURED AT FAIR VALUE AND FOR WHICH THE FAIR VALUE IS DISCLOSED
The methodology used to determine the fair value of the following Company’s assets and liabilities not measured at fair value is based on the following hierarchy:
LEVEL BASIS FOR DETERMINATION OF FAIR VALUE ASSETS AND LIABILITIES
Level 1 Quoted prices in active markets for identical assets or liabilities
None
Level 2 Inputs other than quoted prices included in Level 1 that are directly or indirectly observable for the asset or liability
Trade receivables, financial asset classified as “loans and receivables” (included in Capital investments accounted for by the equity or cost method), receivables under service concession arrangements, trade payables, downpayments on contracts, short-term debt and long-term debt, as well as the following assets and liabilities not measured at fair value: other current financial assets, other non-current financial assets, other current financial liabilities, provisions and other non-current financial liabilities
Level 3 Inputs for the asset or liability that are not based on observable market data
None
For the years ended December 31, 2017 and 2016, there were no changes in valuation techniques and in inputs used in the fair value measurements and there were no transfers between the levels of the fair value hierarchy.
B) NATURE AND EXTENT OF RISKS ARISING FROM FINANCIAL INSTRUMENTS AND RELATED RISK
MANAGEMENT
NATURE OF RISK DESCRIPTION
Credit risk Risk that SNC-Lavalin will incur a financial loss if the other party to a financial instrument fails to discharge an obligation. The maximum exposure to credit risk for SNC-Lavalin at the end of a given period usually corresponds to the carrying amount of its financial assets exposed to such risk, as presented in Note 31A.
Liquidity risk Possibility that SNC-Lavalin will encounter difficulties in meeting the obligations associated with its financial liabilities
Market risk Variability in the fair value or future cash flows of a financial instrument caused by a change in market prices in items such as currency rates, interest rates and equity prices
CREDIT RISK
For SNC-Lavalin, credit risk arises from:
i) Cash and cash equivalents, and restricted cash, which are invested in liquid and high-grade financial instruments, based on SNC-Lavalin’s investment policy.
ii) Derivative financial instruments with a favourable fair value, which contain an inherent credit risk relating to default on obligations by the counterparty. This credit risk is reduced by entering into such contracts with high-grade financial institutions, which are expected to satisfy their obligations under the contracts.
iii) Trade receivables, as detailed in Note 9. A given client may represent a material portion of SNC-Lavalin’s consolidated revenues in any given year due to the size of a particular project and the progress accomplished on such project.
The Company’s objective is to reduce credit risk by ensuring collection of its trade receivables on a timely basis. The amounts of trade receivables presented in the consolidated statements of financial position are net of an allowance for doubtful accounts, estimated by the Company and based, in part, on the age of specific receivable balance and the current and expected collection trends. When assessing the credit risk associated with its trade receivables, the Company also considers the other financial and non-financial assets and liabilities recognized with the same client or within the same project to provide additional indications on the Company’s exposure to credit risk. As such, in addition to the age of its trade receivables, the Company also considers the age of its contracts in progress, as well as the existence of any deferred revenue or downpayments on contracts on the same project or with the same client.
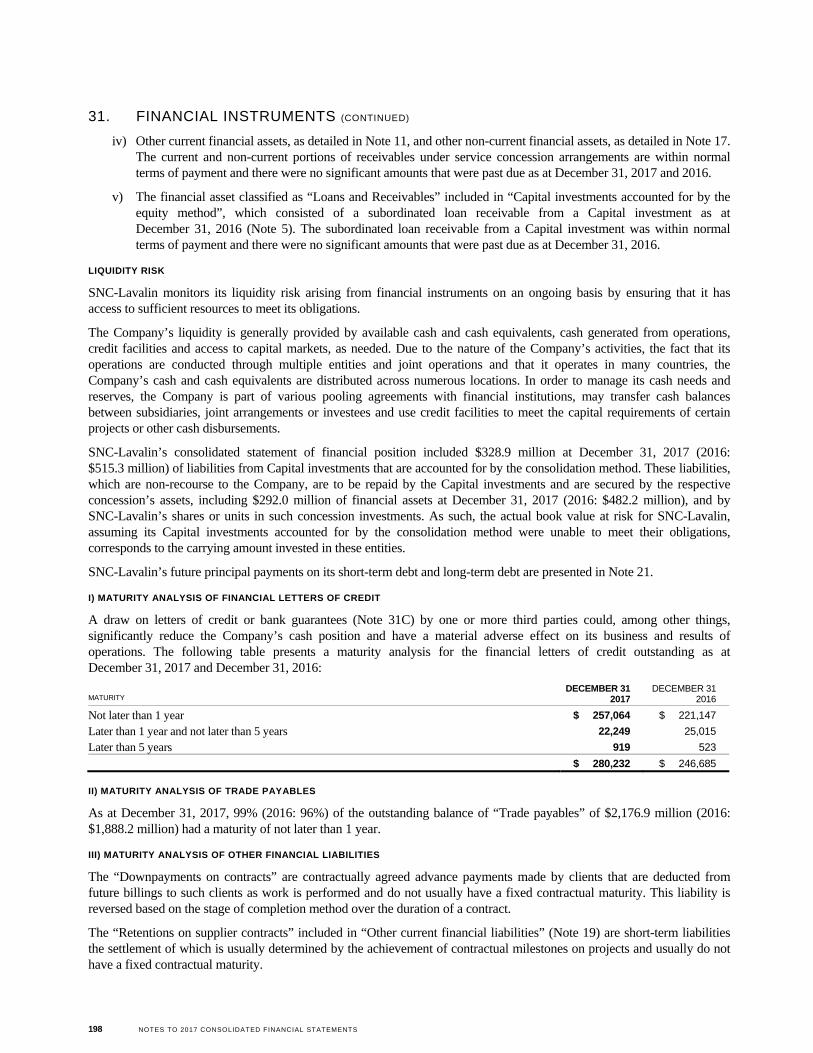
198 NOTES TO 2017 CONSOLIDATED FINANCIAL STATEMENTS
31. FINANCIAL INSTRUMENTS (CONTINUED)
iv) Other current financial assets, as detailed in Note 11, and other non-current financial assets, as detailed in Note 17. The current and non-current portions of receivables under service concession arrangements are within normal terms of payment and there were no significant amounts that were past due as at December 31, 2017 and 2016.
v) The financial asset classified as “Loans and Receivables” included in “Capital investments accounted for by the equity method”, which consisted of a subordinated loan receivable from a Capital investment as at December 31, 2016 (Note 5). The subordinated loan receivable from a Capital investment was within normal terms of payment and there were no significant amounts that were past due as at December 31, 2016.
LIQUIDITY RISK
SNC-Lavalin monitors its liquidity risk arising from financial instruments on an ongoing basis by ensuring that it has access to sufficient resources to meet its obligations.
The Company’s liquidity is generally provided by available cash and cash equivalents, cash generated from operations, credit facilities and access to capital markets, as needed. Due to the nature of the Company’s activities, the fact that its operations are conducted through multiple entities and joint operations and that it operates in many countries, the Company’s cash and cash equivalents are distributed across numerous locations. In order to manage its cash needs and reserves, the Company is part of various pooling agreements with financial institutions, may transfer cash balances between subsidiaries, joint arrangements or investees and use credit facilities to meet the capital requirements of certain projects or other cash disbursements.
SNC-Lavalin’s consolidated statement of financial position included $328.9 million at December 31, 2017 (2016: $515.3 million) of liabilities from Capital investments that are accounted for by the consolidation method. These liabilities, which are non-recourse to the Company, are to be repaid by the Capital investments and are secured by the respective concession’s assets, including $292.0 million of financial assets at December 31, 2017 (2016: $482.2 million), and by SNC-Lavalin’s shares or units in such concession investments. As such, the actual book value at risk for SNC-Lavalin, assuming its Capital investments accounted for by the consolidation method were unable to meet their obligations, corresponds to the carrying amount invested in these entities.
SNC-Lavalin’s future principal payments on its short-term debt and long-term debt are presented in Note 21.
I) MATURITY ANALYSIS OF FINANCIAL LETTERS OF CREDIT
A draw on letters of credit or bank guarantees (Note 31C) by one or more third parties could, among other things, significantly reduce the Company’s cash position and have a material adverse effect on its business and results of operations. The following table presents a maturity analysis for the financial letters of credit outstanding as at December 31, 2017 and December 31, 2016:
II) MATURITY ANALYSIS OF TRADE PAYABLES
As at December 31, 2017, 99% (2016: 96%) of the outstanding balance of “Trade payables” of $2,176.9 million (2016: $1,888.2 million) had a maturity of not later than 1 year.
III) MATURITY ANALYSIS OF OTHER FINANCIAL LIABILITIES
The “Downpayments on contracts” are contractually agreed advance payments made by clients that are deducted from future billings to such clients as work is performed and do not usually have a fixed contractual maturity. This liability is reversed based on the stage of completion method over the duration of a contract.
The “Retentions on supplier contracts” included in “Other current financial liabilities” (Note 19) are short-term liabilities the settlement of which is usually determined by the achievement of contractual milestones on projects and usually do not have a fixed contractual maturity.
MATURITY DECEMBER 31
2017 DECEMBER 31
2016
Not later than 1 year $ 257,064 $ 221,147
Later than 1 year and not later than 5 years 22,249 25,015
Later than 5 years 919 523
$ 280,232 $ 246,685
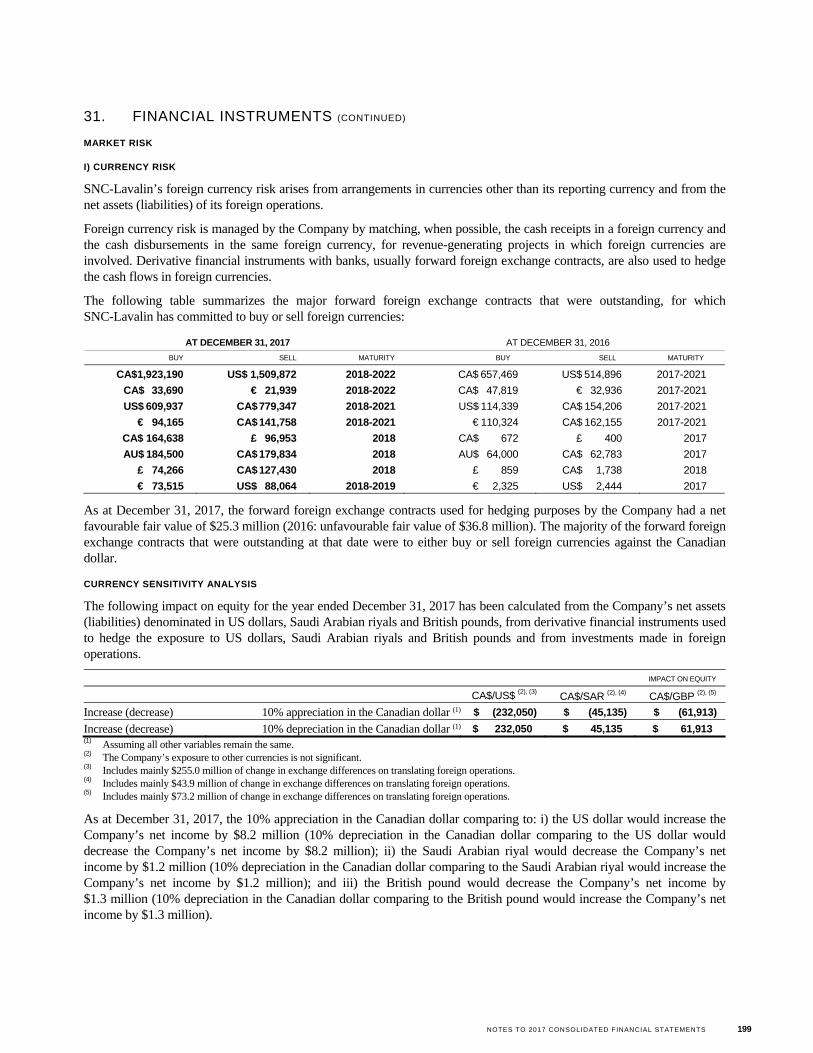
NOTES TO 2017 CONSOLIDATED FINANCIAL STATEMENTS 199
31. FINANCIAL INSTRUMENTS (CONTINUED)
MARKET RISK
I) CURRENCY RISK
SNC-Lavalin’s foreign currency risk arises from arrangements in currencies other than its reporting currency and from the net assets (liabilities) of its foreign operations.
Foreign currency risk is managed by the Company by matching, when possible, the cash receipts in a foreign currency and the cash disbursements in the same foreign currency, for revenue-generating projects in which foreign currencies are involved. Derivative financial instruments with banks, usually forward foreign exchange contracts, are also used to hedge the cash flows in foreign currencies.
The following table summarizes the major forward foreign exchange contracts that were outstanding, for which SNC-Lavalin has committed to buy or sell foreign currencies:
AT DECEMBER 31, 2017 AT DECEMBER 31, 2016
BUY SELL MATURITY BUY SELL MATURITY
CA$1,923,190 US$ 1,509,872 2018-2022 CA$ 657,469 US$ 514,896 2017-2021
CA$ 33,690 € 21,939 2018-2022 CA$ 47,819 € 32,936 2017-2021
US$ 609,937 CA$ 779,347 2018-2021 US$ 114,339 CA$ 154,206 2017-2021
€ 94,165 CA$ 141,758 2018-2021 € 110,324 CA$ 162,155 2017-2021
CA$ 164,638 £ 96,953 2018 CA$ 672 £ 400 2017
AU$ 184,500 CA$ 179,834 2018 AU$ 64,000 CA$ 62,783 2017
£ 74,266 CA$ 127,430 2018 £ 859 CA$ 1,738 2018
€ 73,515 US$ 88,064 2018-2019 € 2,325 US$ 2,444 2017
As at December 31, 2017, the forward foreign exchange contracts used for hedging purposes by the Company had a net favourable fair value of $25.3 million (2016: unfavourable fair value of $36.8 million). The majority of the forward foreign exchange contracts that were outstanding at that date were to either buy or sell foreign currencies against the Canadian dollar.
CURRENCY SENSITIVITY ANALYSIS
The following impact on equity for the year ended December 31, 2017 has been calculated from the Company’s net assets (liabilities) denominated in US dollars, Saudi Arabian riyals and British pounds, from derivative financial instruments used to hedge the exposure to US dollars, Saudi Arabian riyals and British pounds and from investments made in foreign operations.
IMPACT ON EQUITY
CA$/US$ (2), (3) CA$/SAR (2), (4) CA$/GBP (2), (5)
Increase (decrease) 10% appreciation in the Canadian dollar (1) $ (232,050) $ (45,135) $ (61,913)
Increase (decrease) 10% depreciation in the Canadian dollar (1) $ 232,050 $ 45,135 $ 61,913 (1) Assuming all other variables remain the same. (2) The Company’s exposure to other currencies is not significant. (3) Includes mainly $255.0 million of change in exchange differences on translating foreign operations. (4) Includes mainly $43.9 million of change in exchange differences on translating foreign operations. (5) Includes mainly $73.2 million of change in exchange differences on translating foreign operations.
As at December 31, 2017, the 10% appreciation in the Canadian dollar comparing to: i) the US dollar would increase the Company’s net income by $8.2 million (10% depreciation in the Canadian dollar comparing to the US dollar would decrease the Company’s net income by $8.2 million); ii) the Saudi Arabian riyal would decrease the Company’s net income by $1.2 million (10% depreciation in the Canadian dollar comparing to the Saudi Arabian riyal would increase the Company’s net income by $1.2 million); and iii) the British pound would decrease the Company’s net income by $1.3 million (10% depreciation in the Canadian dollar comparing to the British pound would increase the Company’s net income by $1.3 million).
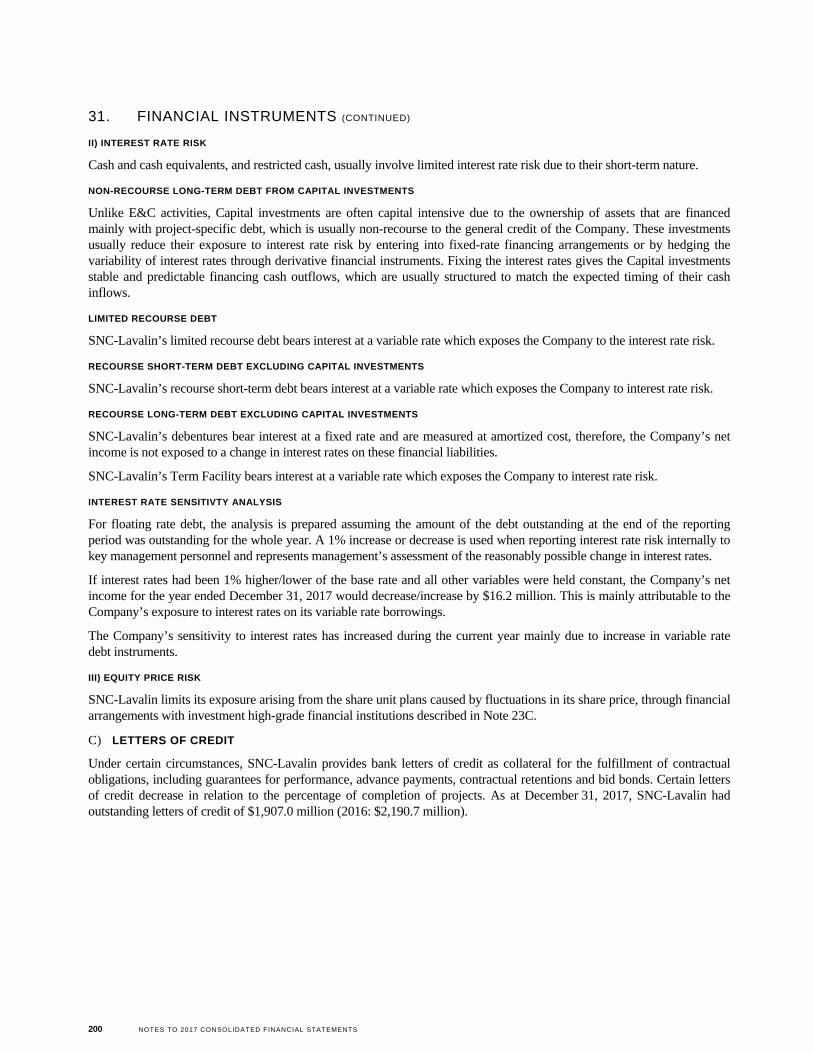
200 NOTES TO 2017 CONSOLIDATED FINANCIAL STATEMENTS
31. FINANCIAL INSTRUMENTS (CONTINUED)
II) INTEREST RATE RISK
Cash and cash equivalents, and restricted cash, usually involve limited interest rate risk due to their short-term nature.
NON-RECOURSE LONG-TERM DEBT FROM CAPITAL INVESTMENTS
Unlike E&C activities, Capital investments are often capital intensive due to the ownership of assets that are financed mainly with project-specific debt, which is usually non-recourse to the general credit of the Company. These investments usually reduce their exposure to interest rate risk by entering into fixed-rate financing arrangements or by hedging the variability of interest rates through derivative financial instruments. Fixing the interest rates gives the Capital investments stable and predictable financing cash outflows, which are usually structured to match the expected timing of their cash inflows.
LIMITED RECOURSE DEBT
SNC-Lavalin’s limited recourse debt bears interest at a variable rate which exposes the Company to the interest rate risk.
RECOURSE SHORT-TERM DEBT EXCLUDING CAPITAL INVESTMENTS
SNC-Lavalin’s recourse short-term debt bears interest at a variable rate which exposes the Company to interest rate risk.
RECOURSE LONG-TERM DEBT EXCLUDING CAPITAL INVESTMENTS
SNC-Lavalin’s debentures bear interest at a fixed rate and are measured at amortized cost, therefore, the Company’s net income is not exposed to a change in interest rates on these financial liabilities.
SNC-Lavalin’s Term Facility bears interest at a variable rate which exposes the Company to interest rate risk.
INTEREST RATE SENSITIVTY ANALYSIS
For floating rate debt, the analysis is prepared assuming the amount of the debt outstanding at the end of the reporting period was outstanding for the whole year. A 1% increase or decrease is used when reporting interest rate risk internally to key management personnel and represents management’s assessment of the reasonably possible change in interest rates.
If interest rates had been 1% higher/lower of the base rate and all other variables were held constant, the Company’s net income for the year ended December 31, 2017 would decrease/increase by $16.2 million. This is mainly attributable to the Company’s exposure to interest rates on its variable rate borrowings.
The Company’s sensitivity to interest rates has increased during the current year mainly due to increase in variable rate debt instruments.
III) EQUITY PRICE RISK
SNC-Lavalin limits its exposure arising from the share unit plans caused by fluctuations in its share price, through financial arrangements with investment high-grade financial institutions described in Note 23C.
C) LETTERS OF CREDIT
Under certain circumstances, SNC-Lavalin provides bank letters of credit as collateral for the fulfillment of contractual obligations, including guarantees for performance, advance payments, contractual retentions and bid bonds. Certain letters of credit decrease in relation to the percentage of completion of projects. As at December 31, 2017, SNC-Lavalin had outstanding letters of credit of $1,907.0 million (2016: $2,190.7 million).
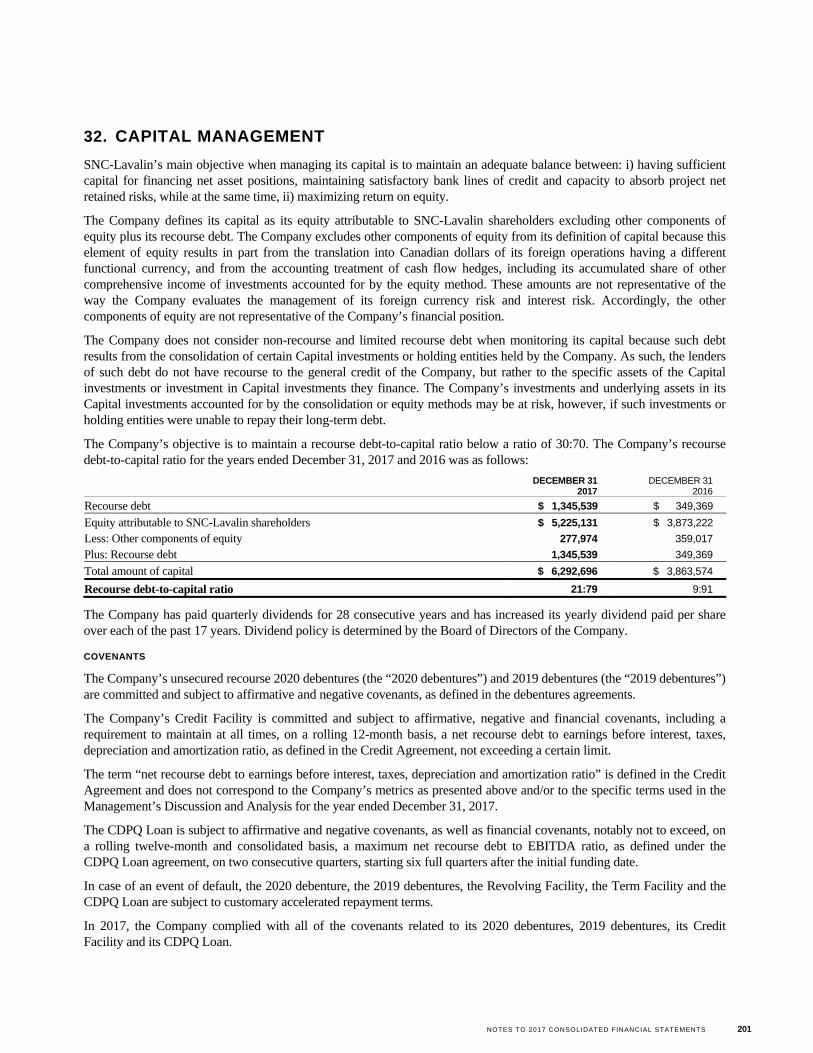
NOTES TO 2017 CONSOLIDATED FINANCIAL STATEMENTS 201
32. CAPITAL MANAGEMENT
SNC-Lavalin’s main objective when managing its capital is to maintain an adequate balance between: i) having sufficient capital for financing net asset positions, maintaining satisfactory bank lines of credit and capacity to absorb project net retained risks, while at the same time, ii) maximizing return on equity.
The Company defines its capital as its equity attributable to SNC-Lavalin shareholders excluding other components of equity plus its recourse debt. The Company excludes other components of equity from its definition of capital because this element of equity results in part from the translation into Canadian dollars of its foreign operations having a different functional currency, and from the accounting treatment of cash flow hedges, including its accumulated share of other comprehensive income of investments accounted for by the equity method. These amounts are not representative of the way the Company evaluates the management of its foreign currency risk and interest risk. Accordingly, the other components of equity are not representative of the Company’s financial position.
The Company does not consider non-recourse and limited recourse debt when monitoring its capital because such debt results from the consolidation of certain Capital investments or holding entities held by the Company. As such, the lenders of such debt do not have recourse to the general credit of the Company, but rather to the specific assets of the Capital investments or investment in Capital investments they finance. The Company’s investments and underlying assets in its Capital investments accounted for by the consolidation or equity methods may be at risk, however, if such investments or holding entities were unable to repay their long-term debt.
The Company’s objective is to maintain a recourse debt-to-capital ratio below a ratio of 30:70. The Company’s recourse debt-to-capital ratio for the years ended December 31, 2017 and 2016 was as follows:
DECEMBER 31
2017
DECEMBER 31 2016
Recourse debt $ 1,345,539 $ 349,369
Equity attributable to SNC-Lavalin shareholders $ 5,225,131 $ 3,873,222
Less: Other components of equity 277,974 359,017
Plus: Recourse debt 1,345,539 349,369
Total amount of capital $ 6,292,696 $ 3,863,574
Recourse debt-to-capital ratio 21:79 9:91
The Company has paid quarterly dividends for 28 consecutive years and has increased its yearly dividend paid per share over each of the past 17 years. Dividend policy is determined by the Board of Directors of the Company.
COVENANTS
The Company’s unsecured recourse 2020 debentures (the “2020 debentures”) and 2019 debentures (the “2019 debentures”) are committed and subject to affirmative and negative covenants, as defined in the debentures agreements.
The Company’s Credit Facility is committed and subject to affirmative, negative and financial covenants, including a requirement to maintain at all times, on a rolling 12-month basis, a net recourse debt to earnings before interest, taxes, depreciation and amortization ratio, as defined in the Credit Agreement, not exceeding a certain limit.
The term “net recourse debt to earnings before interest, taxes, depreciation and amortization ratio” is defined in the Credit Agreement and does not correspond to the Company’s metrics as presented above and/or to the specific terms used in the Management’s Discussion and Analysis for the year ended December 31, 2017.
The CDPQ Loan is subject to affirmative and negative covenants, as well as financial covenants, notably not to exceed, on a rolling twelve-month and consolidated basis, a maximum net recourse debt to EBITDA ratio, as defined under the CDPQ Loan agreement, on two consecutive quarters, starting six full quarters after the initial funding date.
In case of an event of default, the 2020 debenture, the 2019 debentures, the Revolving Facility, the Term Facility and the CDPQ Loan are subject to customary accelerated repayment terms.
In 2017, the Company complied with all of the covenants related to its 2020 debentures, 2019 debentures, its Credit Facility and its CDPQ Loan.
202 NOTES TO 2017 CONSOLIDATED FINANCIAL STATEMENTS
33. PENSION PLANS, OTHER LONG-TERM BENEFITS AND OTHER POST-EMPLOYMENT BENEFITS
A) PENSION PLANS
SNC-Lavalin has defined contribution and defined benefit pension plans. The total cash amount paid by SNC-Lavalin for its pension plans, consisting of contributions to its defined contribution and defined benefit pension plans, was $125.6 million in 2017 (2016: $60.2 million).
DEFINED CONTRIBUTION PENSION PLANS
SNC-Lavalin’s contributions to its defined contribution plans are recorded as expenses in the year in which they are incurred and totalled $86.9 million in 2017 (2016: $53.3 million).
DEFINED BENEFIT PENSION PLANS
SNC-Lavalin has a number of defined benefit pension plans, which are mostly closed to new entrants, and that provide pension benefits based on length of service and final pensionable earnings. An individual actuarial valuation is performed every year for two plans and at least every three years for the remaining plans. The measurement date used for the benefit obligation and plan assets is December 31 of each year. All SNC-Lavalin’s defined benefit pension plans are partly funded, except for two plans, of which one plan is unfunded and one plan is secured by a letter of credit.
The defined benefit plans are administrated by committees composed of a number of representatives from employer’s representatives, active employees, inactive employees and independent members. Members of the committees are required by law and by their articles of association to act in the best interest of the pension plans and all their relevant stakeholders, i.e. active employees, inactive employees, retirees and employers. The pension plan committees are responsible for the investment policy with regard to the assets of the pension plans, which are held by a trustee legally separated from SNC-Lavalin.
SNC-Lavalin’s defined benefit pension plans typically expose the Company to actuarial risks such as: investment risk, interest rate risk, compensation risk and longevity risk.
NATURE OF RISK DESCRIPTION
Investment risk The present value of the defined benefit pension plan obligation is calculated using a discount rate determined by reference to high quality corporate bond yields; if the return on the plans’ assets is below this rate, it will create a plan deficit.
Interest risk A decrease in the bond interest rate will increase the plans’ liabilities; however, this will be partially offset by an increase in the return on the plans’ debt securities.
Compensation risk The present value of the defined benefit pension plan obligation is calculated by reference to the final pensionable earnings of the plans’ participants.
Longevity risk The present value of the defined benefit plan liability is calculated by reference to the best estimate of the mortality of the plans’ participants both during and after their employment. An increase in the life expectancy of the plans’ participants will increase the plans’ liability.
The two main defined benefit schemes of the Company are the Atkins Pension Plan and the U.K. Railways Pension Scheme (the “Railways Pension Scheme”), both of which are funded final salary schemes in the U.K. The latest actuarial valuations were performed on March 31, 2016 for the Atkins Pension Plan and on December 31, 2013 for the Railways Pension Scheme.
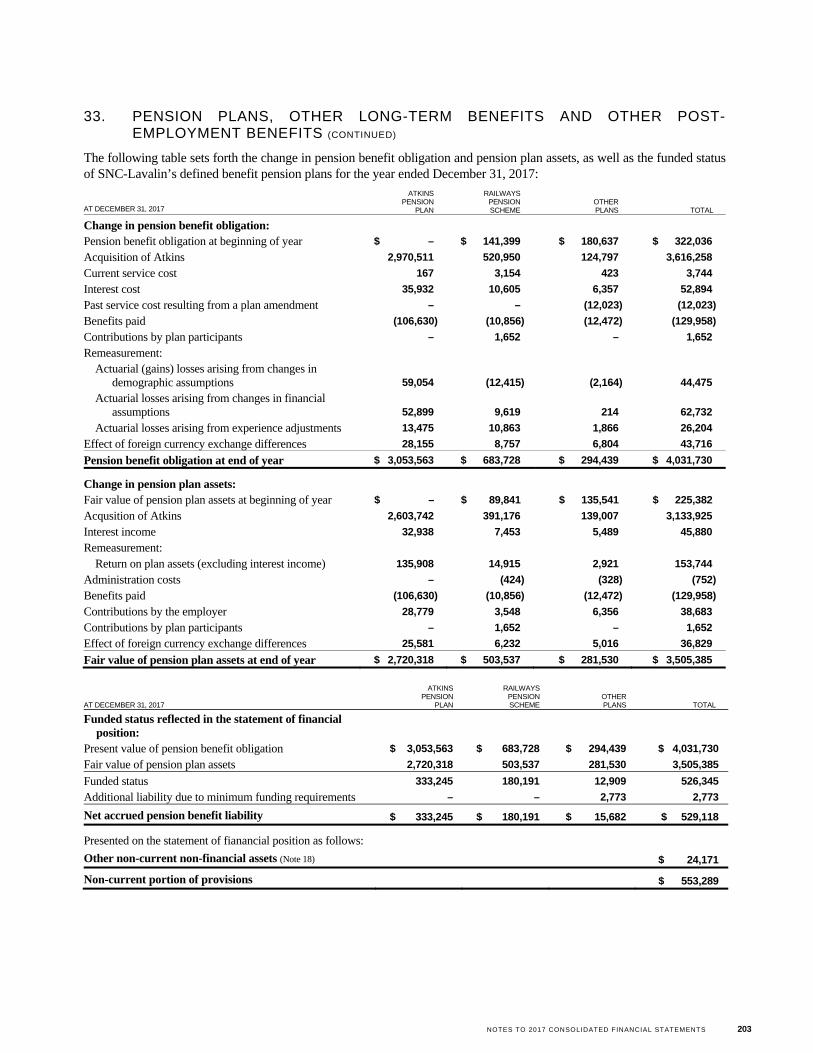
NOTES TO 2017 CONSOLIDATED FINANCIAL STATEMENTS 203
33. PENSION PLANS, OTHER LONG-TERM BENEFITS AND OTHER POST-EMPLOYMENT BENEFITS (CONTINUED)
The following table sets forth the change in pension benefit obligation and pension plan assets, as well as the funded status of SNC-Lavalin’s defined benefit pension plans for the year ended December 31, 2017:
AT DECEMBER 31, 2017
ATKINS PENSION
PLAN
RAILWAYS PENSION SCHEME
OTHER PLANS TOTAL
Change in pension benefit obligation:
Pension benefit obligation at beginning of year $ – $ 141,399 $ 180,637 $ 322,036
Acquisition of Atkins 2,970,511 520,950 124,797 3,616,258
Current service cost 167 3,154 423 3,744
Interest cost 35,932 10,605 6,357 52,894
Past service cost resulting from a plan amendment – – (12,023) (12,023)
Benefits paid (106,630) (10,856) (12,472) (129,958)
Contributions by plan participants – 1,652 – 1,652
Remeasurement:
Actuarial (gains) losses arising from changes in demographic assumptions 59,054 (12,415) (2,164) 44,475
Actuarial losses arising from changes in financial assumptions 52,899 9,619 214 62,732
Actuarial losses arising from experience adjustments 13,475 10,863 1,866 26,204
Effect of foreign currency exchange differences 28,155 8,757 6,804 43,716
Pension benefit obligation at end of year $ 3,053,563 $ 683,728 $ 294,439 $ 4,031,730
Change in pension plan assets: Fair value of pension plan assets at beginning of year $ – $ 89,841 $ 135,541 $ 225,382
Acqusition of Atkins 2,603,742 391,176 139,007 3,133,925
Interest income 32,938 7,453 5,489 45,880
Remeasurement:
Return on plan assets (excluding interest income) 135,908 14,915 2,921 153,744
Administration costs – (424) (328) (752)
Benefits paid (106,630) (10,856) (12,472) (129,958)
Contributions by the employer 28,779 3,548 6,356 38,683
Contributions by plan participants – 1,652 – 1,652
Effect of foreign currency exchange differences 25,581 6,232 5,016 36,829
Fair value of pension plan assets at end of year $ 2,720,318 $ 503,537 $ 281,530 $ 3,505,385
AT DECEMBER 31, 2017
ATKINS PENSION
PLAN
RAILWAYS PENSION SCHEME
OTHER PLANS TOTAL
Funded status reflected in the statement of financial position:
Present value of pension benefit obligation $ 3,053,563 $ 683,728 $ 294,439 $ 4,031,730
Fair value of pension plan assets 2,720,318 503,537 281,530 3,505,385
Funded status 333,245 180,191 12,909 526,345
Additional liability due to minimum funding requirements – – 2,773 2,773
Net accrued pension benefit liability $ 333,245 $ 180,191 $ 15,682 $ 529,118
Presented on the statement of fianancial position as follows:
Other non-current non-financial assets (Note 18) $ 24,171
Non-current portion of provisions $ 553,289
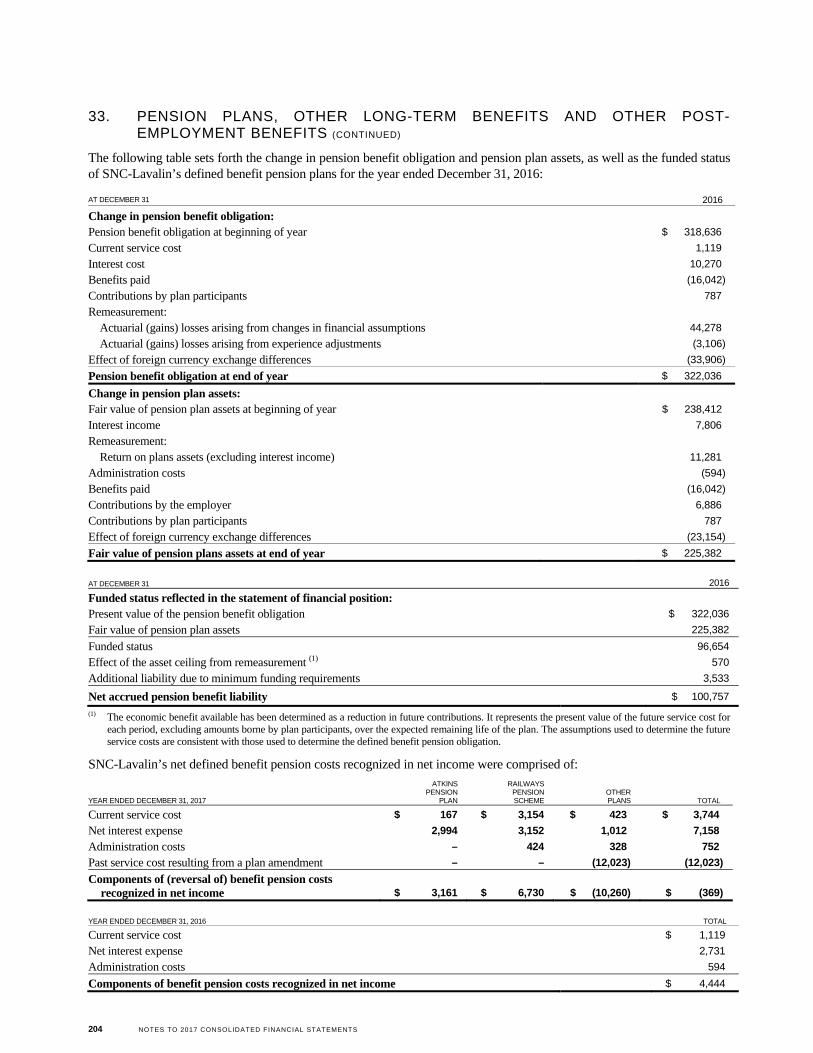
204 NOTES TO 2017 CONSOLIDATED FINANCIAL STATEMENTS
33. PENSION PLANS, OTHER LONG-TERM BENEFITS AND OTHER POST-EMPLOYMENT BENEFITS (CONTINUED)
The following table sets forth the change in pension benefit obligation and pension plan assets, as well as the funded status of SNC-Lavalin’s defined benefit pension plans for the year ended December 31, 2016:
(1) The economic benefit available has been determined as a reduction in future contributions. It represents the present value of the future service cost for each period, excluding amounts borne by plan participants, over the expected remaining life of the plan. The assumptions used to determine the future service costs are consistent with those used to determine the defined benefit pension obligation.
SNC-Lavalin’s net defined benefit pension costs recognized in net income were comprised of:
YEAR ENDED DECEMBER 31, 2016 TOTAL
Current service cost $ 1,119
Net interest expense 2,731
Administration costs 594
Components of benefit pension costs recognized in net income $ 4,444
AT DECEMBER 31 2016
Change in pension benefit obligation:
Pension benefit obligation at beginning of year $ 318,636
Current service cost 1,119
Interest cost 10,270
Benefits paid (16,042)
Contributions by plan participants 787
Remeasurement:
Actuarial (gains) losses arising from changes in financial assumptions 44,278
Actuarial (gains) losses arising from experience adjustments (3,106)
Effect of foreign currency exchange differences (33,906)
Pension benefit obligation at end of year $ 322,036
Change in pension plan assets: Fair value of pension plan assets at beginning of year $ 238,412
Interest income 7,806
Remeasurement:
Return on plans assets (excluding interest income) 11,281
Administration costs (594)
Benefits paid (16,042)
Contributions by the employer 6,886
Contributions by plan participants 787
Effect of foreign currency exchange differences (23,154)
Fair value of pension plans assets at end of year $ 225,382
AT DECEMBER 31 2016
Funded status reflected in the statement of financial position:
Present value of the pension benefit obligation $ 322,036
Fair value of pension plan assets 225,382
Funded status 96,654
Effect of the asset ceiling from remeasurement (1) 570
Additional liability due to minimum funding requirements 3,533
Net accrued pension benefit liability $ 100,757
YEAR ENDED DECEMBER 31, 2017
ATKINS PENSION
PLAN
RAILWAYS PENSION SCHEME
OTHER PLANS TOTAL
Current service cost $ 167 $ 3,154 $ 423 $ 3,744
Net interest expense 2,994 3,152 1,012 7,158
Administration costs – 424 328 752
Past service cost resulting from a plan amendment – – (12,023) (12,023)
Components of (reversal of) benefit pension costs recognized in net income $ 3,161 $ 6,730 $ (10,260) $ (369)
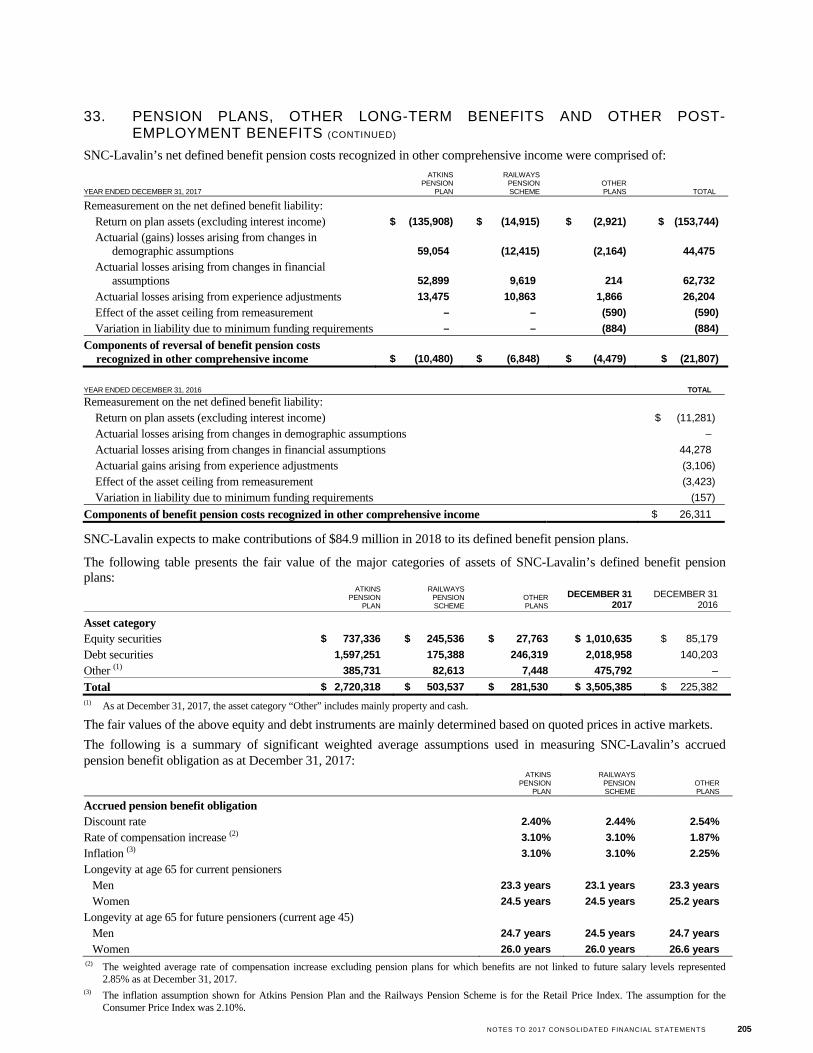
NOTES TO 2017 CONSOLIDATED FINANCIAL STATEMENTS 205
33. PENSION PLANS, OTHER LONG-TERM BENEFITS AND OTHER POST-EMPLOYMENT BENEFITS (CONTINUED)
SNC-Lavalin’s net defined benefit pension costs recognized in other comprehensive income were comprised of:
YEAR ENDED DECEMBER 31, 2016 TOTAL
Remeasurement on the net defined benefit liability:
Return on plan assets (excluding interest income) $ (11,281)
Actuarial losses arising from changes in demographic assumptions –
Actuarial losses arising from changes in financial assumptions 44,278
Actuarial gains arising from experience adjustments (3,106)
Effect of the asset ceiling from remeasurement (3,423)
Variation in liability due to minimum funding requirements (157)
Components of benefit pension costs recognized in other comprehensive income $ 26,311
SNC-Lavalin expects to make contributions of $84.9 million in 2018 to its defined benefit pension plans.
The following table presents the fair value of the major categories of assets of SNC-Lavalin’s defined benefit pension plans:
(1) As at December 31, 2017, the asset category “Other” includes mainly property and cash.
The fair values of the above equity and debt instruments are mainly determined based on quoted prices in active markets.
The following is a summary of significant weighted average assumptions used in measuring SNC-Lavalin’s accrued pension benefit obligation as at December 31, 2017:
(2) The weighted average rate of compensation increase excluding pension plans for which benefits are not linked to future salary levels represented 2.85% as at December 31, 2017.
(3) The inflation assumption shown for Atkins Pension Plan and the Railways Pension Scheme is for the Retail Price Index. The assumption for the Consumer Price Index was 2.10%.
YEAR ENDED DECEMBER 31, 2017
ATKINS PENSION
PLAN
RAILWAYS PENSION SCHEME
OTHER PLANS TOTAL
Remeasurement on the net defined benefit liability:
Return on plan assets (excluding interest income) $ (135,908) $ (14,915) $ (2,921) $ (153,744)
Actuarial (gains) losses arising from changes in demographic assumptions 59,054 (12,415) (2,164) 44,475
Actuarial losses arising from changes in financial assumptions 52,899 9,619 214 62,732
Actuarial losses arising from experience adjustments 13,475 10,863 1,866 26,204
Effect of the asset ceiling from remeasurement – – (590) (590)
Variation in liability due to minimum funding requirements – – (884) (884)
Components of reversal of benefit pension costs recognized in other comprehensive income $ (10,480) $ (6,848) $ (4,479) $ (21,807)
ATKINS
PENSION PLAN
RAILWAYS PENSION SCHEME
OTHER PLANS
DECEMBER 31 2017
DECEMBER 31 2016
Asset category
Equity securities $ 737,336 $ 245,536 $ 27,763 $ 1,010,635 $ 85,179
Debt securities 1,597,251 175,388 246,319 2,018,958 140,203
Other (1) 385,731 82,613 7,448 475,792 –
Total $ 2,720,318 $ 503,537 $ 281,530 $ 3,505,385 $ 225,382
ATKINS
PENSION PLAN
RAILWAYS PENSION SCHEME
OTHER PLANS
Accrued pension benefit obligation
Discount rate 2.40% 2.44% 2.54%
Rate of compensation increase (2) 3.10% 3.10% 1.87%
Inflation (3) 3.10% 3.10% 2.25%
Longevity at age 65 for current pensioners
Men 23.3 years 23.1 years 23.3 years
Women 24.5 years 24.5 years 25.2 years
Longevity at age 65 for future pensioners (current age 45)
Men 24.7 years 24.5 years 24.7 years
Women 26.0 years 26.0 years 26.6 years
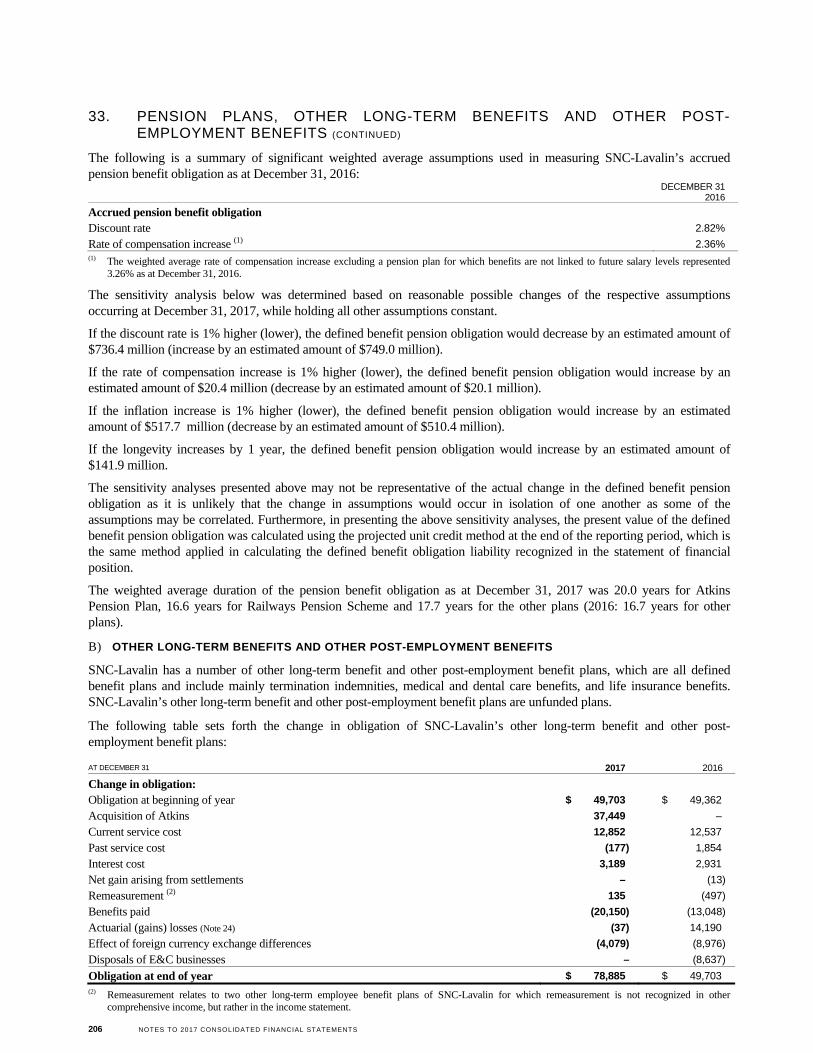
206 NOTES TO 2017 CONSOLIDATED FINANCIAL STATEMENTS
33. PENSION PLANS, OTHER LONG-TERM BENEFITS AND OTHER POST-EMPLOYMENT BENEFITS (CONTINUED)
The following is a summary of significant weighted average assumptions used in measuring SNC-Lavalin’s accrued pension benefit obligation as at December 31, 2016:
(1) The weighted average rate of compensation increase excluding a pension plan for which benefits are not linked to future salary levels represented 3.26% as at December 31, 2016.
The sensitivity analysis below was determined based on reasonable possible changes of the respective assumptions occurring at December 31, 2017, while holding all other assumptions constant.
If the discount rate is 1% higher (lower), the defined benefit pension obligation would decrease by an estimated amount of $736.4 million (increase by an estimated amount of $749.0 million).
If the rate of compensation increase is 1% higher (lower), the defined benefit pension obligation would increase by an estimated amount of $20.4 million (decrease by an estimated amount of $20.1 million).
If the inflation increase is 1% higher (lower), the defined benefit pension obligation would increase by an estimated amount of $517.7 million (decrease by an estimated amount of $510.4 million).
If the longevity increases by 1 year, the defined benefit pension obligation would increase by an estimated amount of $141.9 million.
The sensitivity analyses presented above may not be representative of the actual change in the defined benefit pension obligation as it is unlikely that the change in assumptions would occur in isolation of one another as some of the assumptions may be correlated. Furthermore, in presenting the above sensitivity analyses, the present value of the defined benefit pension obligation was calculated using the projected unit credit method at the end of the reporting period, which is the same method applied in calculating the defined benefit obligation liability recognized in the statement of financial position.
The weighted average duration of the pension benefit obligation as at December 31, 2017 was 20.0 years for Atkins Pension Plan, 16.6 years for Railways Pension Scheme and 17.7 years for the other plans (2016: 16.7 years for other plans).
B) OTHER LONG-TERM BENEFITS AND OTHER POST-EMPLOYMENT BENEFITS
SNC-Lavalin has a number of other long-term benefit and other post-employment benefit plans, which are all defined benefit plans and include mainly termination indemnities, medical and dental care benefits, and life insurance benefits. SNC-Lavalin’s other long-term benefit and other post-employment benefit plans are unfunded plans.
The following table sets forth the change in obligation of SNC-Lavalin’s other long-term benefit and other post-employment benefit plans:
(2) Remeasurement relates to two other long-term employee benefit plans of SNC-Lavalin for which remeasurement is not recognized in other comprehensive income, but rather in the income statement.
DECEMBER 31
2016
Accrued pension benefit obligation
Discount rate 2.82%
Rate of compensation increase (1) 2.36%
AT DECEMBER 31 2017 2016
Change in obligation:
Obligation at beginning of year $ 49,703 $ 49,362
Acquisition of Atkins 37,449 –
Current service cost 12,852 12,537
Past service cost (177) 1,854
Interest cost 3,189 2,931
Net gain arising from settlements – (13)
Remeasurement (2) 135 (497)
Benefits paid (20,150) (13,048)
Actuarial (gains) losses (Note 24) (37) 14,190
Effect of foreign currency exchange differences (4,079) (8,976)
Disposals of E&C businesses – (8,637)
Obligation at end of year $ 78,885 $ 49,703
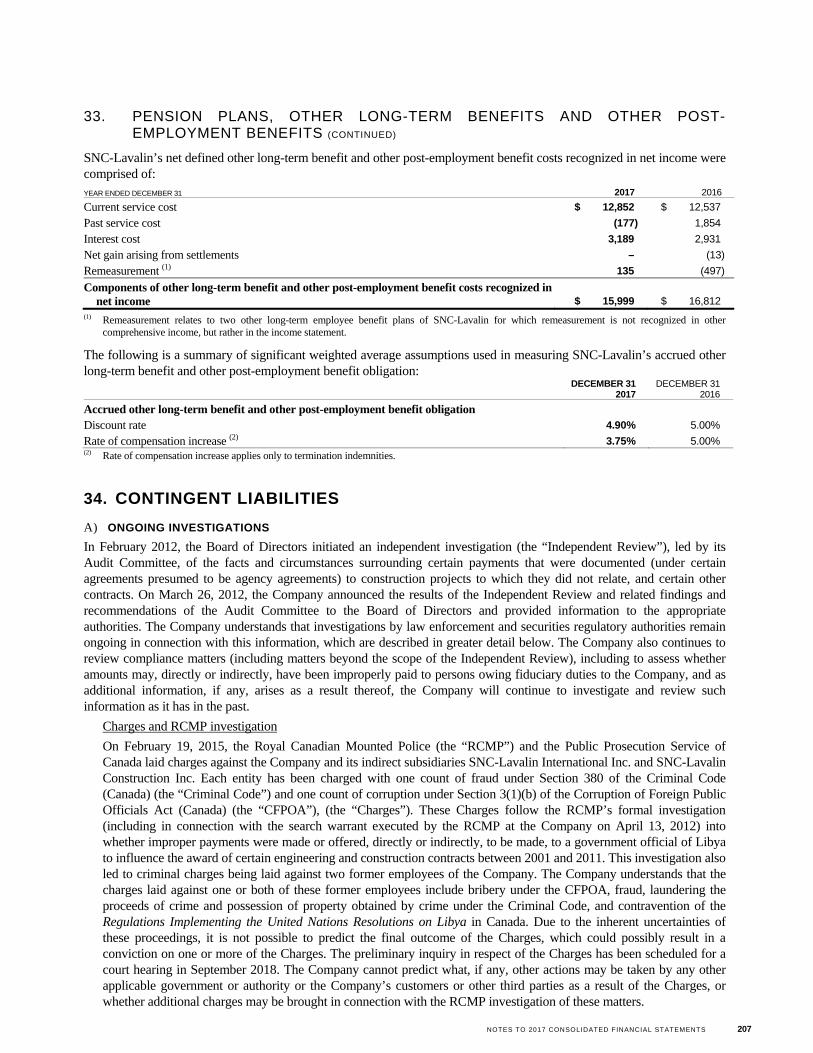
NOTES TO 2017 CONSOLIDATED FINANCIAL STATEMENTS 207
33. PENSION PLANS, OTHER LONG-TERM BENEFITS AND OTHER POST-EMPLOYMENT BENEFITS (CONTINUED)
SNC-Lavalin’s net defined other long-term benefit and other post-employment benefit costs recognized in net income were comprised of: YEAR ENDED DECEMBER 31 2017 2016
Current service cost $ 12,852 $ 12,537
Past service cost (177) 1,854
Interest cost 3,189 2,931
Net gain arising from settlements – (13)
Remeasurement (1) 135 (497)
Components of other long-term benefit and other post-employment benefit costs recognized in net income $ 15,999 $ 16,812
(1) Remeasurement relates to two other long-term employee benefit plans of SNC-Lavalin for which remeasurement is not recognized in other comprehensive income, but rather in the income statement.
The following is a summary of significant weighted average assumptions used in measuring SNC-Lavalin’s accrued other long-term benefit and other post-employment benefit obligation:
(2) Rate of compensation increase applies only to termination indemnities.
34. CONTINGENT LIABILITIES
A) ONGOING INVESTIGATIONS
In February 2012, the Board of Directors initiated an independent investigation (the “Independent Review”), led by its Audit Committee, of the facts and circumstances surrounding certain payments that were documented (under certain agreements presumed to be agency agreements) to construction projects to which they did not relate, and certain other contracts. On March 26, 2012, the Company announced the results of the Independent Review and related findings and recommendations of the Audit Committee to the Board of Directors and provided information to the appropriate authorities. The Company understands that investigations by law enforcement and securities regulatory authorities remain ongoing in connection with this information, which are described in greater detail below. The Company also continues to review compliance matters (including matters beyond the scope of the Independent Review), including to assess whether amounts may, directly or indirectly, have been improperly paid to persons owing fiduciary duties to the Company, and as additional information, if any, arises as a result thereof, the Company will continue to investigate and review such information as it has in the past.
Charges and RCMP investigation
On February 19, 2015, the Royal Canadian Mounted Police (the “RCMP”) and the Public Prosecution Service of Canada laid charges against the Company and its indirect subsidiaries SNC-Lavalin International Inc. and SNC-Lavalin Construction Inc. Each entity has been charged with one count of fraud under Section 380 of the Criminal Code (Canada) (the “Criminal Code”) and one count of corruption under Section 3(1)(b) of the Corruption of Foreign Public Officials Act (Canada) (the “CFPOA”), (the “Charges”). These Charges follow the RCMP’s formal investigation (including in connection with the search warrant executed by the RCMP at the Company on April 13, 2012) into whether improper payments were made or offered, directly or indirectly, to be made, to a government official of Libya to influence the award of certain engineering and construction contracts between 2001 and 2011. This investigation also led to criminal charges being laid against two former employees of the Company. The Company understands that the charges laid against one or both of these former employees include bribery under the CFPOA, fraud, laundering the proceeds of crime and possession of property obtained by crime under the Criminal Code, and contravention of the Regulations Implementing the United Nations Resolutions on Libya in Canada. Due to the inherent uncertainties of these proceedings, it is not possible to predict the final outcome of the Charges, which could possibly result in a conviction on one or more of the Charges. The preliminary inquiry in respect of the Charges has been scheduled for a court hearing in September 2018. The Company cannot predict what, if any, other actions may be taken by any other applicable government or authority or the Company’s customers or other third parties as a result of the Charges, or whether additional charges may be brought in connection with the RCMP investigation of these matters.
DECEMBER 31
2017 DECEMBER 31
2016
Accrued other long-term benefit and other post-employment benefit obligation
Discount rate 4.90% 5.00%
Rate of compensation increase (2) 3.75% 5.00%
208 NOTES TO 2017 CONSOLIDATED FINANCIAL STATEMENTS
34. CONTINGENT LIABILITIES (CONTINUED)
The Charges and potential outcomes thereof, and any negative publicity associated therewith, could adversely affect the Company’s business, results of operations and reputation and could subject the Company to sanctions, fines and other penalties, some of which may be significant. In addition, potential consequences of the Charges could include, in respect of the Company or one or more of its subsidiaries, mandatory or discretionary suspension, prohibition or debarment from participating in projects by certain governments (such as the Government of Canada and/or Canadian provincial governments) or by certain administrative organizations under applicable procurement laws, regulations, policies or practices. The Company derives a significant percentage of its annual global revenue (and an even larger percentage of its annual Canadian revenue) from government and government-related contracts. As a result, suspension, prohibition or debarment, whether discretionary or mandatory, from participating in certain government and government-related contracts (in Canada, Canadian provinces or elsewhere) could have a material adverse effect on the Company’s business, financial condition and liquidity and the market prices of the Company’s publicly traded securities.
AMF Investigation; AMF Certification under the Quebec Act Respecting Contracting by Public Bodies
The Company understands that there is an ongoing investigation being conducted in the context of applicable securities laws and regulations by the securities regulator in the Province of Quebec, the Autorité des marchés financiers (the “AMF”).
Certain subsidiaries of the Company require certification from the AMF, subject to periodic renewal, to contract with public bodies in the Province of Quebec, as required pursuant to the Act Respecting Contracting by Public Bodies. If an entity or any of its affiliates is convicted of certain specified offences under the Criminal Code or the CFPOA, AMF certification can be automatically revoked. In addition, the AMF has the discretionary power to refuse to grant an authorization or revoke or not renew an authorization if it determines that the enterprise concerned fails to meet the high standards of integrity that the public is entitled to expect from a party to a public contract or subcontract. Those subsidiaries of the Company that need to be certified by the AMF have obtained that certification.
World Bank Settlement
On April 17, 2013, the Company announced a settlement in connection with the previously announced investigations by the World Bank Group relating to a project in Bangladesh and a project in Cambodia, which includes a suspension of the right to bid on and to be awarded World Bank Group-financed projects by SNC-Lavalin Inc., a subsidiary of the Company, and its controlled affiliates for a period of 10 years (the “World Bank Settlement”). The suspension could be lifted after eight years, if the terms and conditions of the settlement agreement are complied with fully. According to the terms of the World Bank Settlement, the Company and certain of its other affiliates continue to be eligible to bid on and be awarded World Bank Group-financed projects as long as they comply with all of the terms and conditions imposed upon them under the terms of the World Bank Settlement, including an obligation not to evade the sanction imposed. The World Bank Settlement also requires that the Company cooperate with the World Bank on various compliance matters in the future. The World Bank Settlement has led to certain other multilateral development banks following suit, debarring SNC-Lavalin Inc. and its controlled affiliates on the same terms.
African Development Bank Settlement
On October 1, 2015, the Company announced a settlement with the African Development Bank relating to allegations of corruption in two African countries (the “African Development Bank Settlement”). The African Development Bank Settlement requires that the Company cooperate with the African Development Bank on various compliance matters in the future.
Canada’s Integrity Regime
The Canadian government announced the Integrity Regime for procurement and real property transactions on July 3, 2015. The scope of offences which may cause a supplier to be deemed ineligible to carry on business with the federal government are broad and encompass offences under the Criminal Code, the Competition Act, and the CFPOA, among others. Some of the offences qualifying for ineligibility include: bribery, fraud, money laundering, falsification of books and documents, extortion, and offences related to drug trafficking. A determination of ineligibility to participate in federal government procurement projects may apply for 10 years for listed offences. However, the Integrity Regime permits the ineligibility period to be reduced by up to five years if a supplier can establish that it has cooperated with law enforcement authorities or addressed the causes of misconduct.
NOTES TO 2017 CONSOLIDATED FINANCIAL STATEMENTS 209
34. CONTINGENT LIABILITIES (CONTINUED)
If a supplier is charged with a listed offence (as is presently the case with the Company), it may under the Integrity Regime be ineligible to do business with the Canadian government while legal proceedings are ongoing.
If a supplier applies for a reduced ineligibility period, or if a supplier charged with a listed offence is notified that it could be ineligible to do business with the Canadian government, as a condition of granting the reduced ineligibility period or not suspending the supplier an administrative agreement may be imposed to monitor the supplier. Administrative agreements include conditions and compliance measures that the supplier must meet to remain eligible to contract with the federal government.
The Company has signed an administrative agreement with Public Services and Procurement (PSP) of the Government of Canada under the Integrity Regime.
Failure of the Company to abide by the terms of any of its certification from the AMF, the World Bank Settlement, the African Development Bank Settlement and/or the PSP Administrative Agreement could result in serious consequences for the Company, including new sanctions, legal actions and/or suspension from eligibility to carry on business with the government or agency involved or to work on projects funded by them. The Company is taking steps that are expected to mitigate this risk.
Quebec’s Voluntary Reimbursement Program (the “Program”)
The Company participated in the Voluntary Reimbursement Program (“Bill 26”) which was put into force by the Government of Quebec on November 2, 2015. The Program provided for a period of time within which the Government of Quebec and various municipalities, governmental agencies and others could assess whether settlement proposals by program participants should cover a governmental or municipal entity. The Company settled all issues that it notified under the Program, or which the Program brought to its attention, on a timely and substantiated basis.
Other Investigations
The Company understands that there are also investigations by various authorities ongoing in various jurisdictions with respect to the above and other matters. In addition, Pierre Duhaime and Riadh Ben Aïssa, former Company employees, have been charged by authorities in the Province of Quebec with various fraud offences allegedly in connection with a Company project in the Province of Quebec.
On October 1, 2014, Mr. Ben Aïssa entered guilty pleas to certain criminal charges in the Federal Criminal Court of Switzerland following a lengthy investigation by Swiss authorities and the detention of Mr. Ben Aïssa by Swiss authorities from April 2012 to October 2014. The Company was recognized as an injured party in the context of the Swiss proceedings and was awarded for certain offences for which Mr. Ben Aïssa has plead guilty a sum equivalent to CA$17.2 million translated using the exchange rates as at October 1, 2014 (representing the equivalent of 12.9 million CHF and US$2.0 million) plus interest. As at December 31, 2017, the Company has received all amounts due under this award.
The Company is currently unable to determine when any of the above investigations will be completed or whether other investigations of the Company by these or other authorities will be initiated or the scope of current investigations broadened. While the Company continues to cooperate and communicate with authorities in connection with all ongoing investigations as noted above, if regulatory, enforcement or administrative authorities or third parties determine to take action against the Company or to sanction the Company in connection with possible violations of law, contracts or otherwise, the consequences of any such sanctions or other actions, whether actual or alleged, could require the Company to pay material fines or damages, consent to injunctions on future conduct or lead to other penalties including temporary or permanent, mandatory or discretionary suspension, prohibition or debarment from participating in projects by certain administrative organizations (such as those provided for in the World Bank Settlement) or by governments (such as the Government of Canada and/or the Government of Quebec) under applicable procurement laws, regulations, policies or practices, each of which could, materially adversely affect the Company’s business, financial condition and liquidity and the market price of the Company’s publicly traded securities.
The outcomes of the above investigations or the Charges could also result in, among other things, i) covenant defaults under various project contracts, ii) third party claims, which may include claims for special, indirect, derivative or consequential damages, or iii) adverse consequences on the Company’s ability to secure or continue its own financing, or to continue or secure financing for current or future projects, any of which could materially adversely affect the Company’s business, financial condition and liquidity and the market prices of the Company’s publicly traded securities. In addition, the Charges, these investigations and outcomes of these investigations or Charges and any negative publicity associated therewith, could damage SNC-Lavalin’s reputation and ability to do business. Finally, the findings and outcomes of the Charges or these investigations may affect the course of the class action lawsuits (described below).
210 NOTES TO 2017 CONSOLIDATED FINANCIAL STATEMENTS
34. CONTINGENT LIABILITIES (CONTINUED)
Due to the uncertainties related to the outcome of the Charges and each of the above investigations, the Company is currently unable to reliably estimate an amount of potential liabilities or a range of potential liabilities, if any, in connection with the Charges or any of these investigations.
The Company’s senior management and Board of Directors have been required to devote significant time and resources to the investigations described above and ongoing related matters which have distracted and may continue to distract from the conduct of the Company’s daily business, and significant expenses have been and may continue to be incurred in connection with these investigations including substantial fees of lawyers and other advisors. In addition, the Company and/or other employees or additional former employees of the Company could become the subject of these or other investigations by law enforcement and/or regulatory authorities in respect of the matters described above or other matters which, in turn, could require the devotion of additional time of senior management and the diversion or utilization of other resources.
B) CLASS ACTION LAWSUITS
The Company is subject to class actions in Quebec and Ontario commenced in 2012 on behalf of security holders (collectively, the “Actions”). The Actions are brought pursuant to the secondary market civil liability provisions in the various Canadian provincial and territorial securities statutes. The Actions allege the agent payments that were the subject of the Independent Review were bribes to public officials and that bribes were also offered in relation to the project in Bangladesh that forms part of the World Bank Settlement. Consequently, it is alleged that various of the Company’s public disclosure documents issued between November 2009 and November 2011 included misrepresentations. The Actions seek damages, on behalf of all persons who acquired securities of SNC-Lavalin between November 6, 2009 and February 27, 2012, based on the decline in market value of SNC-Lavalin shares following the Company’s February 28, 2012 news release and other public announcements.
The Ontario Action is presently completing the oral discovery stage. The Quebec Action is presently in abeyance while the Ontario Action proceeds.
Due to the inherent uncertainties of litigation, it is not possible to predict the final outcome of these lawsuits or determine the amount of any potential losses, if any, and SNC-Lavalin may, in the future, be subject to further class action lawsuits or other litigation. While SNC-Lavalin has directors’ and officers’ liability insurance insuring individuals against liability for acts or omissions in their capacities as directors and officers, the Company does not maintain any other insurance in connection with the Actions. The amount of coverage under the directors’ and officers’ policy is limited and such coverage may be an insignificant portion of any amounts the Company is required or determines to pay in connection with the Actions. In the event the Company is required or determines to pay amounts in connection with these lawsuits or other litigation, such amounts could be significant and may have a material adverse impact on SNC-Lavalin’s liquidity and financial results.
C) OTHER
On June 12, 2014, the Quebec Superior Court rendered a decision in “Wave 1” of the matter commonly referred to as the “Pyrrhotite Case” in Trois-Rivières, Quebec and in which SNC-Lavalin is one of numerous defendants. The Superior Court ruled in favour of the plaintiffs, awarding an aggregate amount of approximately $168 million in damages apportioned amongst the then-known defendants, on an in solidum basis (the “Wave 1 claims”). SNC-Lavalin, among other parties, filed a Notice to Appeal the Superior Court decision both on merit and on the apportionment of liability. Based on the current judgment, SNC-Lavalin’s share of the damages would be approximately 70%, a significant portion of which the Company would expect to recover from its external insurers (such insurance coverage is itself subject to litigation). In addition to the appeal of the decision, recourses in warranty were filed against another party, which may result in reduction of SNC-Lavalin’s share of the damages. The appeal hearing has started in October 2017 and will be completed in April 2018.
In parallel to the appeal and warranty recourses for Wave 1 claims, additional potential claims were notified and continue to be notified against numerous defendants, including SNC-Lavalin, in “Wave 2” of the Pyrrhotite Case. Wave 2 claims are currently undergoing discovery stage and it is still premature to evaluate SNC-Lavalin’s total liability exposure in respect of same, if any. It is currently estimated that a significant portion of the damages claimed are in respect of buildings for which the concrete foundations were poured outside of SNC-Lavalin’s liability period, as determined in the Wave 1 judgement. SNC-Lavalin expects some insurance coverage for claims filed up to March 31, 2015. In addition, SNC-Lavalin has undertaken warranty recourse against another party with respect to Wave 2 claims.
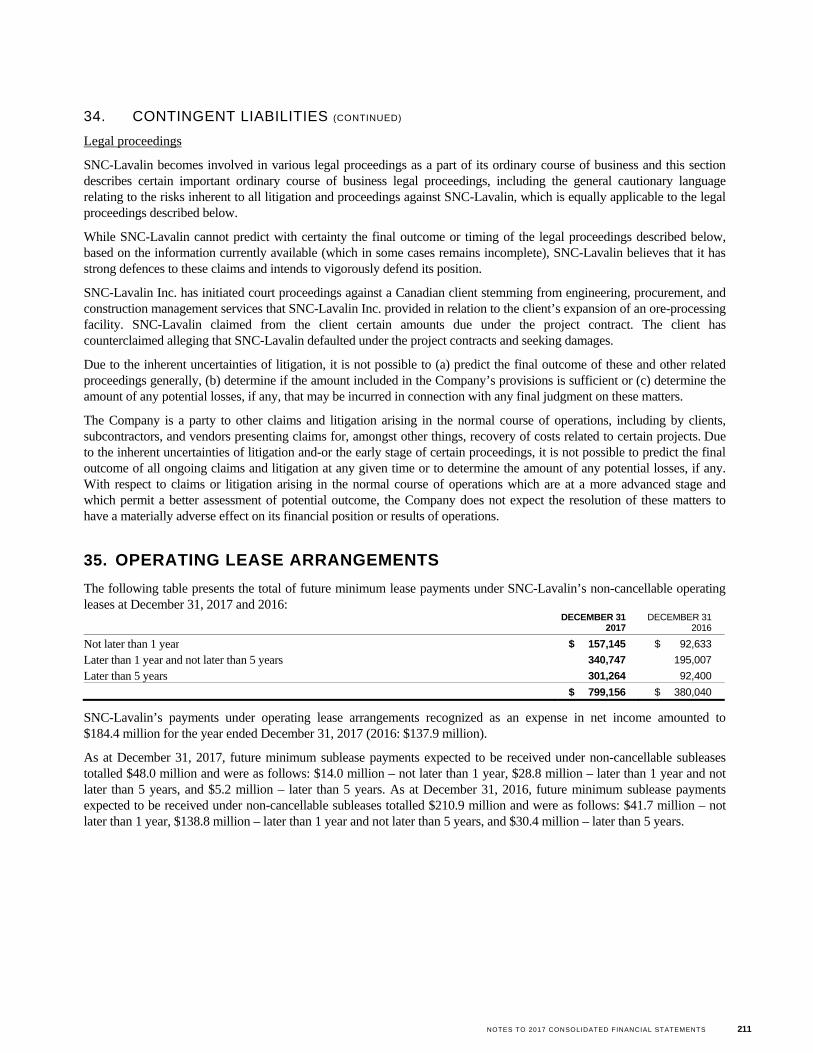
NOTES TO 2017 CONSOLIDATED FINANCIAL STATEMENTS 211
34. CONTINGENT LIABILITIES (CONTINUED)
Legal proceedings
SNC-Lavalin becomes involved in various legal proceedings as a part of its ordinary course of business and this section describes certain important ordinary course of business legal proceedings, including the general cautionary language relating to the risks inherent to all litigation and proceedings against SNC-Lavalin, which is equally applicable to the legal proceedings described below.
While SNC-Lavalin cannot predict with certainty the final outcome or timing of the legal proceedings described below, based on the information currently available (which in some cases remains incomplete), SNC-Lavalin believes that it has strong defences to these claims and intends to vigorously defend its position.
SNC-Lavalin Inc. has initiated court proceedings against a Canadian client stemming from engineering, procurement, and construction management services that SNC-Lavalin Inc. provided in relation to the client’s expansion of an ore-processing facility. SNC-Lavalin claimed from the client certain amounts due under the project contract. The client has counterclaimed alleging that SNC-Lavalin defaulted under the project contracts and seeking damages.
Due to the inherent uncertainties of litigation, it is not possible to (a) predict the final outcome of these and other related proceedings generally, (b) determine if the amount included in the Company’s provisions is sufficient or (c) determine the amount of any potential losses, if any, that may be incurred in connection with any final judgment on these matters.
The Company is a party to other claims and litigation arising in the normal course of operations, including by clients, subcontractors, and vendors presenting claims for, amongst other things, recovery of costs related to certain projects. Due to the inherent uncertainties of litigation and-or the early stage of certain proceedings, it is not possible to predict the final outcome of all ongoing claims and litigation at any given time or to determine the amount of any potential losses, if any. With respect to claims or litigation arising in the normal course of operations which are at a more advanced stage and which permit a better assessment of potential outcome, the Company does not expect the resolution of these matters to have a materially adverse effect on its financial position or results of operations.
35. OPERATING LEASE ARRANGEMENTS
The following table presents the total of future minimum lease payments under SNC-Lavalin’s non-cancellable operating leases at December 31, 2017 and 2016:
SNC-Lavalin’s payments under operating lease arrangements recognized as an expense in net income amounted to $184.4 million for the year ended December 31, 2017 (2016: $137.9 million).
As at December 31, 2017, future minimum sublease payments expected to be received under non-cancellable subleases totalled $48.0 million and were as follows: $14.0 million – not later than 1 year, $28.8 million – later than 1 year and not later than 5 years, and $5.2 million – later than 5 years. As at December 31, 2016, future minimum sublease payments expected to be received under non-cancellable subleases totalled $210.9 million and were as follows: $41.7 million – not later than 1 year, $138.8 million – later than 1 year and not later than 5 years, and $30.4 million – later than 5 years.
DECEMBER 31
2017 DECEMBER 31
2016
Not later than 1 year $ 157,145 $ 92,633
Later than 1 year and not later than 5 years 340,747 195,007
Later than 5 years 301,264 92,400
$ 799,156 $ 380,040
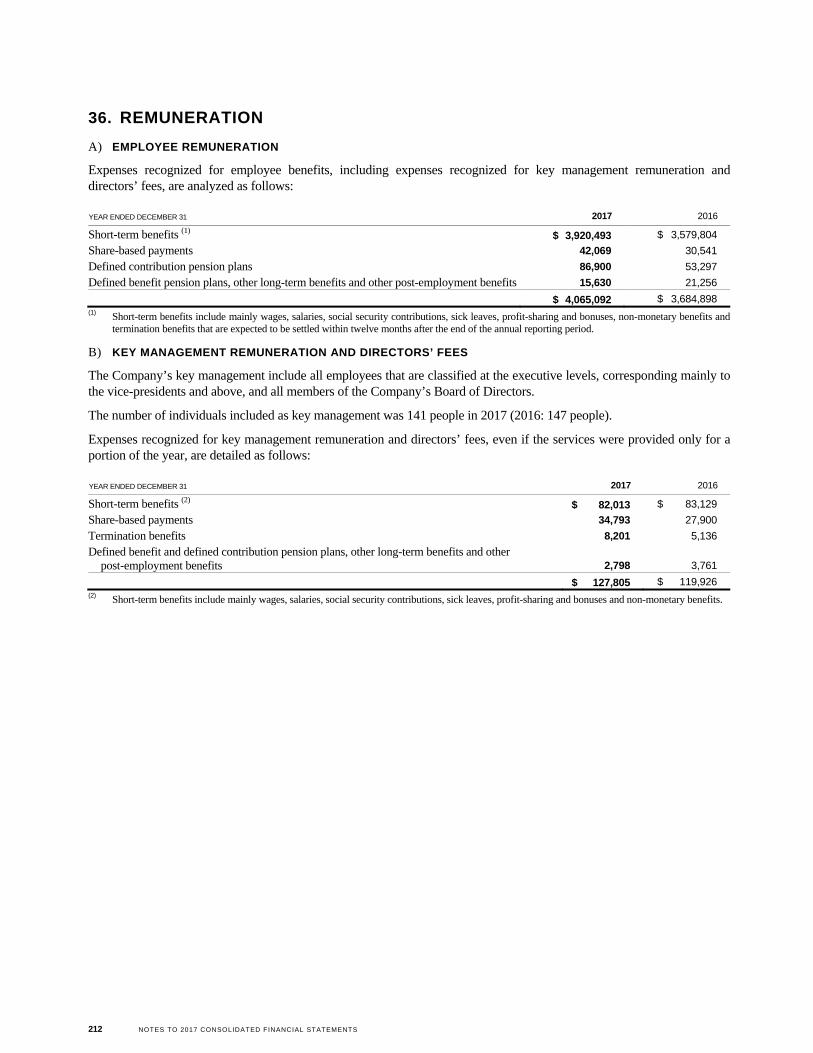
212 NOTES TO 2017 CONSOLIDATED FINANCIAL STATEMENTS
36. REMUNERATION
A) EMPLOYEE REMUNERATION
Expenses recognized for employee benefits, including expenses recognized for key management remuneration and directors’ fees, are analyzed as follows:
YEAR ENDED DECEMBER 31 2017 2016
Short-term benefits (1) $ 3,920,493 $ 3,579,804
Share-based payments 42,069 30,541
Defined contribution pension plans 86,900 53,297
Defined benefit pension plans, other long-term benefits and other post-employment benefits 15,630 21,256
$ 4,065,092 $ 3,684,898 (1) Short-term benefits include mainly wages, salaries, social security contributions, sick leaves, profit-sharing and bonuses, non-monetary benefits and
termination benefits that are expected to be settled within twelve months after the end of the annual reporting period.
B) KEY MANAGEMENT REMUNERATION AND DIRECTORS’ FEES
The Company’s key management include all employees that are classified at the executive levels, corresponding mainly to the vice-presidents and above, and all members of the Company’s Board of Directors.
The number of individuals included as key management was 141 people in 2017 (2016: 147 people).
Expenses recognized for key management remuneration and directors’ fees, even if the services were provided only for a portion of the year, are detailed as follows:
YEAR ENDED DECEMBER 31 2017 2016
Short-term benefits (2) $ 82,013 $ 83,129
Share-based payments 34,793 27,900
Termination benefits 8,201 5,136
Defined benefit and defined contribution pension plans, other long-term benefits and other post-employment benefits 2,798 3,761
$ 127,805 $ 119,926 (2) Short-term benefits include mainly wages, salaries, social security contributions, sick leaves, profit-sharing and bonuses and non-monetary benefits.
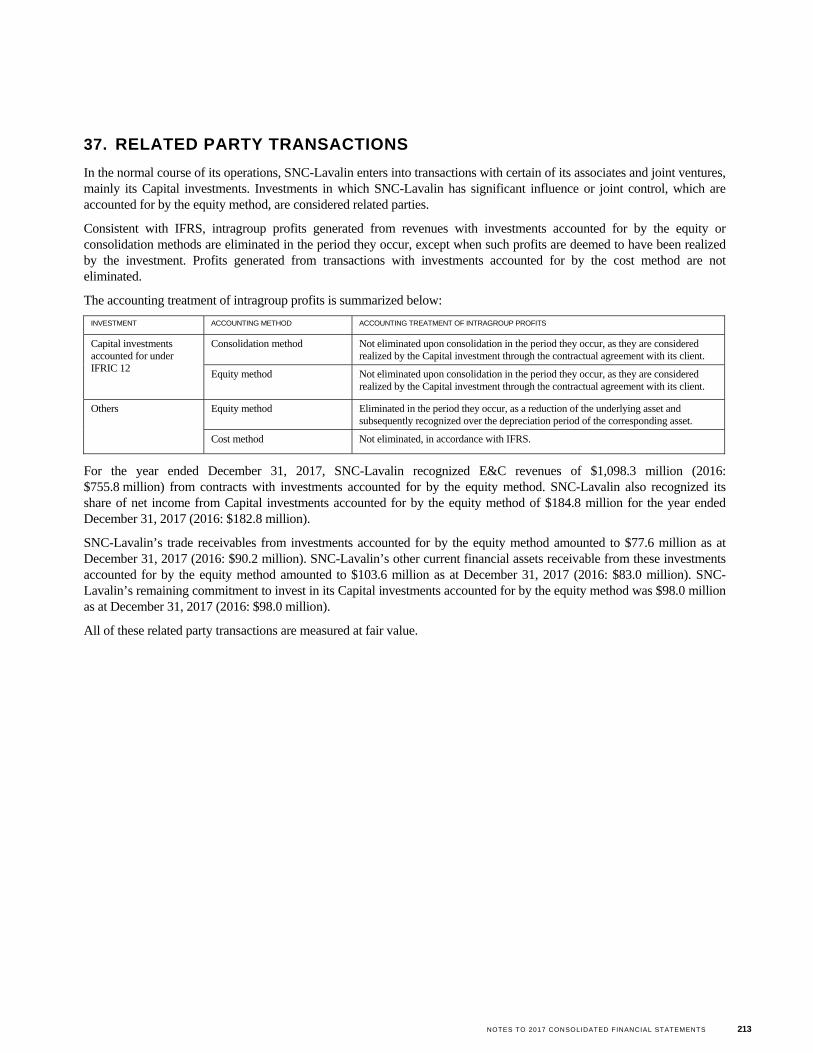
NOTES TO 2017 CONSOLIDATED FINANCIAL STATEMENTS 213
37. RELATED PARTY TRANSACTIONS
In the normal course of its operations, SNC-Lavalin enters into transactions with certain of its associates and joint ventures, mainly its Capital investments. Investments in which SNC-Lavalin has significant influence or joint control, which are accounted for by the equity method, are considered related parties.
Consistent with IFRS, intragroup profits generated from revenues with investments accounted for by the equity or consolidation methods are eliminated in the period they occur, except when such profits are deemed to have been realized by the investment. Profits generated from transactions with investments accounted for by the cost method are not eliminated.
The accounting treatment of intragroup profits is summarized below:
INVESTMENT ACCOUNTING METHOD ACCOUNTING TREATMENT OF INTRAGROUP PROFITS
Capital investments accounted for under IFRIC 12
Consolidation method Not eliminated upon consolidation in the period they occur, as they are considered realized by the Capital investment through the contractual agreement with its client.
Equity method Not eliminated upon consolidation in the period they occur, as they are considered realized by the Capital investment through the contractual agreement with its client.
Others Equity method Eliminated in the period they occur, as a reduction of the underlying asset and subsequently recognized over the depreciation period of the corresponding asset.
Cost method Not eliminated, in accordance with IFRS.
For the year ended December 31, 2017, SNC-Lavalin recognized E&C revenues of $1,098.3 million (2016: $755.8 million) from contracts with investments accounted for by the equity method. SNC-Lavalin also recognized its share of net income from Capital investments accounted for by the equity method of $184.8 million for the year ended December 31, 2017 (2016: $182.8 million).
SNC-Lavalin’s trade receivables from investments accounted for by the equity method amounted to $77.6 million as at December 31, 2017 (2016: $90.2 million). SNC-Lavalin’s other current financial assets receivable from these investments accounted for by the equity method amounted to $103.6 million as at December 31, 2017 (2016: $83.0 million). SNC-Lavalin’s remaining commitment to invest in its Capital investments accounted for by the equity method was $98.0 million as at December 31, 2017 (2016: $98.0 million).
All of these related party transactions are measured at fair value.
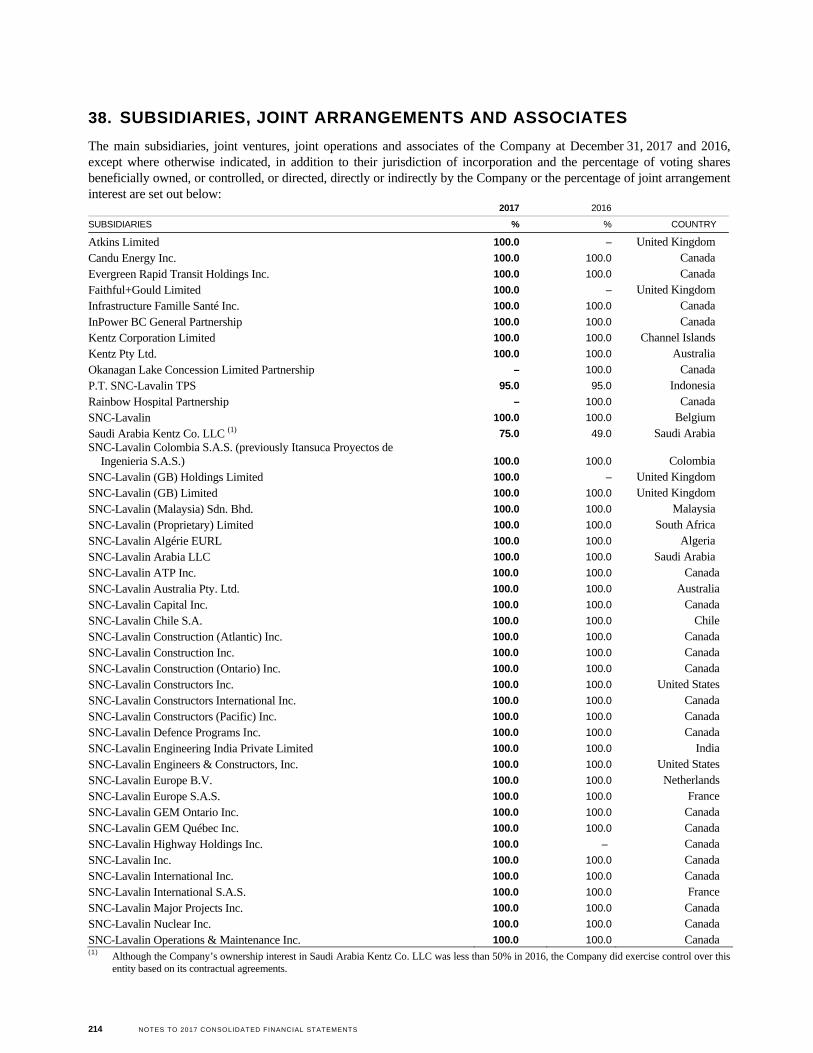
214 NOTES TO 2017 CONSOLIDATED FINANCIAL STATEMENTS
38. SUBSIDIARIES, JOINT ARRANGEMENTS AND ASSOCIATES
The main subsidiaries, joint ventures, joint operations and associates of the Company at December 31, 2017 and 2016, except where otherwise indicated, in addition to their jurisdiction of incorporation and the percentage of voting shares beneficially owned, or controlled, or directed, directly or indirectly by the Company or the percentage of joint arrangement interest are set out below: 2017 2016
SUBSIDIARIES % % COUNTRY
Atkins Limited 100.0 – United Kingdom Candu Energy Inc. 100.0 100.0 Canada Evergreen Rapid Transit Holdings Inc. 100.0 100.0 Canada Faithful+Gould Limited 100.0 – United Kingdom Infrastructure Famille Santé Inc. 100.0 100.0 Canada InPower BC General Partnership 100.0 100.0 Canada Kentz Corporation Limited 100.0 100.0 Channel Islands Kentz Pty Ltd. 100.0 100.0 Australia Okanagan Lake Concession Limited Partnership – 100.0 Canada P.T. SNC-Lavalin TPS 95.0 95.0 Indonesia Rainbow Hospital Partnership – 100.0 Canada SNC-Lavalin 100.0 100.0 Belgium Saudi Arabia Kentz Co. LLC (1) 75.0 49.0 Saudi Arabia SNC-Lavalin Colombia S.A.S. (previously Itansuca Proyectos de
Ingenieria S.A.S.) 100.0 100.0 Colombia SNC-Lavalin (GB) Holdings Limited 100.0 – United Kingdom SNC-Lavalin (GB) Limited 100.0 100.0 United Kingdom SNC-Lavalin (Malaysia) Sdn. Bhd. 100.0 100.0 Malaysia SNC-Lavalin (Proprietary) Limited 100.0 100.0 South Africa SNC-Lavalin Algérie EURL 100.0 100.0 Algeria SNC-Lavalin Arabia LLC 100.0 100.0 Saudi Arabia SNC-Lavalin ATP Inc. 100.0 100.0 Canada SNC-Lavalin Australia Pty. Ltd. 100.0 100.0 Australia SNC-Lavalin Capital Inc. 100.0 100.0 Canada SNC-Lavalin Chile S.A. 100.0 100.0 Chile SNC-Lavalin Construction (Atlantic) Inc. 100.0 100.0 Canada SNC-Lavalin Construction Inc. 100.0 100.0 Canada SNC-Lavalin Construction (Ontario) Inc. 100.0 100.0 Canada SNC-Lavalin Constructors Inc. 100.0 100.0 United States SNC-Lavalin Constructors International Inc. 100.0 100.0 Canada SNC-Lavalin Constructors (Pacific) Inc. 100.0 100.0 Canada SNC-Lavalin Defence Programs Inc. 100.0 100.0 Canada SNC-Lavalin Engineering India Private Limited 100.0 100.0 India SNC-Lavalin Engineers & Constructors, Inc. 100.0 100.0 United States SNC-Lavalin Europe B.V. 100.0 100.0 Netherlands SNC-Lavalin Europe S.A.S. 100.0 100.0 France SNC-Lavalin GEM Ontario Inc. 100.0 100.0 Canada SNC-Lavalin GEM Québec Inc. 100.0 100.0 Canada SNC-Lavalin Highway Holdings Inc. 100.0 – Canada SNC-Lavalin Inc. 100.0 100.0 Canada SNC-Lavalin International Inc. 100.0 100.0 Canada SNC-Lavalin International S.A.S. 100.0 100.0 France SNC-Lavalin Major Projects Inc. 100.0 100.0 Canada SNC-Lavalin Nuclear Inc. 100.0 100.0 Canada SNC-Lavalin Operations & Maintenance Inc. 100.0 100.0 Canada (1) Although the Company’s ownership interest in Saudi Arabia Kentz Co. LLC was less than 50% in 2016, the Company did exercise control over this
entity based on its contractual agreements.
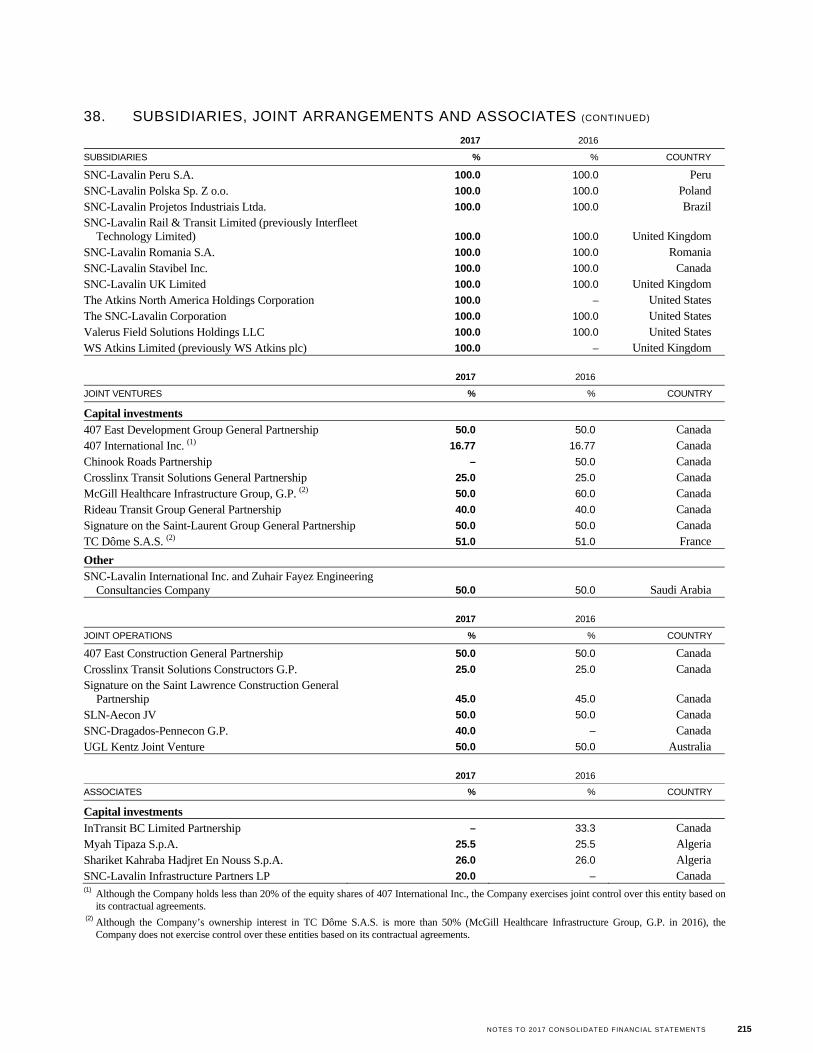
NOTES TO 2017 CONSOLIDATED FINANCIAL STATEMENTS 215
38. SUBSIDIARIES, JOINT ARRANGEMENTS AND ASSOCIATES (CONTINUED)
2017 2016
SUBSIDIARIES % % COUNTRY
SNC-Lavalin Peru S.A. 100.0 100.0 Peru SNC-Lavalin Polska Sp. Z o.o. 100.0 100.0 Poland SNC-Lavalin Projetos Industriais Ltda. 100.0 100.0 Brazil SNC-Lavalin Rail & Transit Limited (previously Interfleet
Technology Limited) 100.0 100.0 United Kingdom SNC-Lavalin Romania S.A. 100.0 100.0 Romania SNC-Lavalin Stavibel Inc. 100.0 100.0 Canada SNC-Lavalin UK Limited 100.0 100.0 United Kingdom The Atkins North America Holdings Corporation 100.0 – United States The SNC-Lavalin Corporation 100.0 100.0 United States Valerus Field Solutions Holdings LLC 100.0 100.0 United States WS Atkins Limited (previously WS Atkins plc) 100.0 – United Kingdom
2017 2016
JOINT VENTURES % % COUNTRY
Capital investments
407 East Development Group General Partnership 50.0 50.0 Canada 407 International Inc. (1) 16.77 16.77 Canada Chinook Roads Partnership – 50.0 Canada Crosslinx Transit Solutions General Partnership 25.0 25.0 Canada McGill Healthcare Infrastructure Group, G.P. (2) 50.0 60.0 Canada Rideau Transit Group General Partnership 40.0 40.0 Canada Signature on the Saint-Laurent Group General Partnership 50.0 50.0 Canada TC Dôme S.A.S. (2) 51.0 51.0 France
Other
SNC-Lavalin International Inc. and Zuhair Fayez Engineering Consultancies Company 50.0 50.0 Saudi Arabia
2017 2016
JOINT OPERATIONS % % COUNTRY
407 East Construction General Partnership 50.0 50.0 Canada Crosslinx Transit Solutions Constructors G.P. 25.0 25.0 Canada Signature on the Saint Lawrence Construction General
Partnership 45.0 45.0 Canada SLN-Aecon JV 50.0 50.0 Canada SNC-Dragados-Pennecon G.P. 40.0 – Canada UGL Kentz Joint Venture 50.0 50.0 Australia
2017 2016
ASSOCIATES % % COUNTRY
Capital investments
InTransit BC Limited Partnership – 33.3 Canada Myah Tipaza S.p.A. 25.5 25.5 Algeria Shariket Kahraba Hadjret En Nouss S.p.A. 26.0 26.0 Algeria SNC-Lavalin Infrastructure Partners LP 20.0 – Canada (1) Although the Company holds less than 20% of the equity shares of 407 International Inc., the Company exercises joint control over this entity based on
its contractual agreements. (2) Although the Company’s ownership interest in TC Dôme S.A.S. is more than 50% (McGill Healthcare Infrastructure Group, G.P. in 2016), the
Company does not exercise control over these entities based on its contractual agreements.
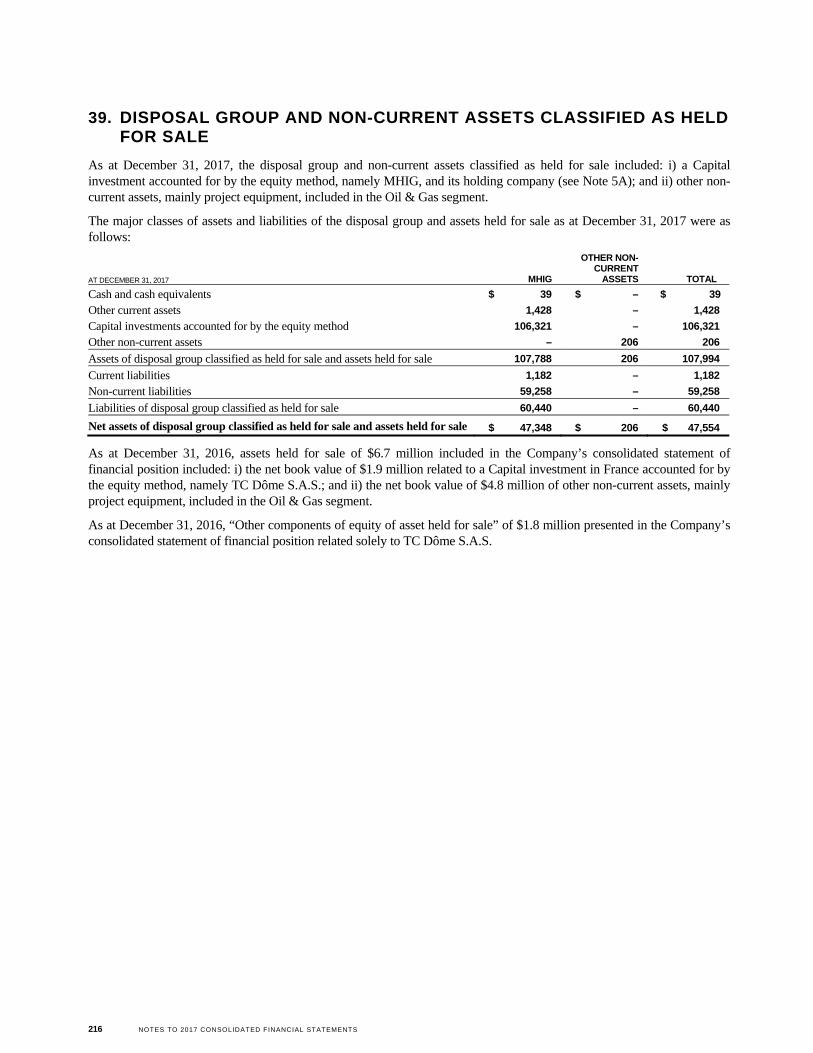
216 NOTES TO 2017 CONSOLIDATED FINANCIAL STATEMENTS
39. DISPOSAL GROUP AND NON-CURRENT ASSETS CLASSIFIED AS HELD FOR SALE
As at December 31, 2017, the disposal group and non-current assets classified as held for sale included: i) a Capital investment accounted for by the equity method, namely MHIG, and its holding company (see Note 5A); and ii) other non-current assets, mainly project equipment, included in the Oil & Gas segment.
The major classes of assets and liabilities of the disposal group and assets held for sale as at December 31, 2017 were as follows:
As at December 31, 2016, assets held for sale of $6.7 million included in the Company’s consolidated statement of financial position included: i) the net book value of $1.9 million related to a Capital investment in France accounted for by the equity method, namely TC Dôme S.A.S.; and ii) the net book value of $4.8 million of other non-current assets, mainly project equipment, included in the Oil & Gas segment.
As at December 31, 2016, “Other components of equity of asset held for sale” of $1.8 million presented in the Company’s consolidated statement of financial position related solely to TC Dôme S.A.S.
AT DECEMBER 31, 2017 MHIG
OTHER NON-CURRENT
ASSETS TOTAL
Cash and cash equivalents $ 39 $ – $ 39
Other current assets 1,428 – 1,428
Capital investments accounted for by the equity method 106,321 – 106,321
Other non-current assets – 206 206
Assets of disposal group classified as held for sale and assets held for sale 107,788 206 107,994
Current liabilities 1,182 – 1,182
Non-current liabilities 59,258 – 59,258
Liabilities of disposal group classified as held for sale 60,440 – 60,440
Net assets of disposal group classified as held for sale and assets held for sale $ 47,348 $ 206 $ 47,554