Embed Size (px)
Citation preview

2
Management’s Discussion and Analysis
This section of Tennessee State University’s annual financial report presents a discussion and analysis of the financial performance of the university during the fiscal year ended June 30, 2012, with comparative information presented for the fiscal year ended June 30, 2011. This discussion has been prepared by management along with the financial statements and related note disclosures and should be read in conjunction with the financial statements and notes. The financial statements, notes, and this discussion are the responsibility of management. Using This Annual Report This report consists of three basic financial statements. The Statement of Net Assets; the Statement of Revenues, Expenses, and Changes in Net Assets; and the Statement of Cash Flows provide information on Tennessee State University as a whole and present a long-term view of the university’s finances. The Statement of Net Assets The Statement of Net Assets presents the financial position of the university at the end of the fiscal year and includes all assets and liabilities of the university. The difference between total assets and total liabilities – net assets – is an indicator of the current financial condition of the university. Assets and liabilities are generally measured using current values. One notable exception is capital assets, which are stated at historical cost, less an allowance for depreciation. Net assets are divided into three major categories. The first category, invested in capital assets, net of related debt, provides the university’s equity in property, plant, and equipment owned by the university. The next asset category is restricted net assets, which is divided into two categories, nonexpendable and expendable. The corpus of nonexpendable restricted resources is only available for investment purposes. Expendable restricted net assets are available for expenditure by the university, but must be spent for purposes as determined by donors and/or external entities that have placed time or purpose restrictions on the use of the assets. The final category is unrestricted net assets. Unrestricted net assets are available to the institution for any lawful purpose of the institution.

3
Comparison of FY 2012 to FY 2011 - Institution
• Current Assets increased due to an increase in Accounts Receivable that resulted from an increase in student fees, and due to an increase in funds held in current investments due to lower interest rates.
• Invested in capital assets, net of related debt and capital assets, net decreased due to a change in account estimate related to the value of Library Holdings.
• Unrestricted Net Assets increased due to the increase of $2.5 million in net assets held for the Nursery Crop Research Station, TSU Cooperative Extension, TSU Agricultural Research , and the increase in revenues due to an increase in Tuition and Fees.
2012 2011 2012 2011Assets
Current assets 40,336$ 37,402$ 7,148$ 4,882$ Capital assets, net 163,119 167,144 6,000 6,000 Other assets 62,353 62,295 37,897 37,249
Total Assets 265,808 266,841 51,045 48,131
LiabilitiesCurrent liabilities 22,584 22,324 1,131 8
Noncurrent liabilities 50,588 51,036 - - Total Liabilities 73,172 73,360 1,131 8
Net AssetsInvested in capital assets, net of related debt 125,143 132,365 6,000 6,000
Restricted - nonexpendable 74 74 36,617 34,195 Restricted - expendable 6,145 6,339 7,125 7,748 Unrestricted 61,274 54,703 172 180
Total Net Assets 192,636$ 193,481$ 49,914$ 48,123$
Institution Component Unit
Tennessee State University Statement of Net Assets (in thousands of dollars)

4
Comparison of FY 2012 to FY 2011 - Component Unit
• Current Assets increased due to internal charges made by the Foundation for the University for scholarships and other expenditures in which the transfer of cash was not made until after the end of the fiscal year.
• Restricted nonexpendable net assets increased in fiscal year 2012 due to the increased investment income from 2011 being allocated for reinvestment into the endowment.
Many of the university’s unrestricted net assets have been designated for specific purposes, such as: repair and replacement of equipment, future debt service, quasi-endowments, capital projects, and student loans. The following graph shows the allocations:

C Comparison of F
• The increTSU Coogrant fun
• The increcapital or
$‐
$5,000
$10,000
$15,000
$20,000
$25,000
$30,000
$35,000
$40,000
FY 2012 to FY
ease in unreserveoperative Extensinds being expende
ease in plant consr capital maintena
UNRE
2011
ed/undesignated nion, and TSU Aged first. Expendit
struction is due toance projects.
ESTRICTED(in thousands
net assets is due gricultural Researtures were also li
o transfers from A
D NET ASSEof dollars)
5
primarily to an inrch due to federamited due to posi
Auxiliary and Un
ETS
ncrease in Net Aal and other grantitions not being f
nrestricted Fundin
2012
2011
Assets for the Nurt revenues being filled during the c
ng of $3.2 million
rsery Crop Reseaawarded and the
current fiscal year
n for future unive
arch Station, erefore these r.
ersity funded

6
The Statement of Revenues, Expenses, and Changes in Net Assets The Statement of Revenues, Expenses, and Changes in Net Assets presents the operating results of the university, as well as the non-operating revenues and expenses. Annual state appropriations, while budgeted for operations, are considered non-operating revenues according to accounting principles generally accepted in the United States of America.
2012 2011 2012 2011Operating Revenues:
Net tuition and fees 49,297$ 44,446$ -$ -$ Grants and contracts 36,146 40,915 - 1,190 Auxiliary 13,387 13,699 - - Other 4,897 5,098 2,458 290
Total Operating Revenues 103,727 104,158 2,458 1,480 Operating Expenses 177,060 171,580 1,930 1,529
Operating loss (73,333) (67,422) 528 (49) Nonoperating Revenues and Expenses:
State appropriations 36,276 48,745 - - Gifts 213 75 - - Grants and contracts 31,272 29,574 239 773 Investment income 429 342 741 5,333 Other revenues and expenses (1,696) (1,880) - -
Total nonoperating revenues and expenses 66,494 76,856 980 6,106 Income (loss) before other revenuesexpenses, gain, or losses (6,839) 9,434 1,508 6,057 Other revenues, expenses, gains, or losses
Capital appropriations 2,819 1,560 - - Capital grants and gifts 4,095 1,199 - - Additions to permanent endowments 283 114
Total other revenues, expenses, gains, or losses: 6,914 2,759 283 114 Increase (decrease) in net assets 75 12,193 1,791 6,171 Net assets at beginning of year 193,481 181,027 48,123 42,022 Prior Period Adjustment (920) 262 - (70) Net assets at end of year 192,636$ 193,482$ 49,914$ 48,123$
Institution Component Unit
Tennessee State University Statement of Revenues, Expenses, and Changes in Net Assets (in thousands of dollars)

R Tu
Revenues
The following university’s ope
$‐
$10,000
$20,000
$30,000
$40,000
$50,000
$60,000
$70,000
$80,000
is a graphic ilerating activities
llustration of res for the years en
Reven(in thousands
evenues by sounded June 30, 2
nuesof dollars)
7
urce (both oper012, and June 3
rating and non-30, 2011.
2012
2011
-operating), whhich are used to fund the

C Comparison of F
• Tuition a
• State Appfunds rec
• Governm(TECTA)
• Capital Aincluding
• Other Re
$‐
$1,000
$2,000
$3,000
$4,000
$5,000
$6,000
FY 2012 to FY
and Fees increased
propriations decreceived in fiscal ye
ment Grants and C), which decrease
Appropriations ang the Research Bu
venues decreased
TSU
2011 - Institutio
d due to an increa
eased due to a onear 2010.
Contracts decreaseed over $2.5 milli
nd Capital Gifts anuilding, Boswell F
d due to the decre
Foundatio(in thousands
on
ase approved by t
ne-time additional
ed due to a decreion.
nd Grants increasFume Hoods, Ag
ease in Athletic ga
on Revenueof dollars)
8
the Tennessee Bo
l state appropriati
ease in grant awar
sed due to construriculture Greenho
ame guarantees r
es
2012
2011
oard of Regents.
ion received in fis
rds, including Ten
uction-related expouse, and the Rad
eceived.
scal year 2011 du
nnessee Early Ch
penditures and revdio Station.
ue to the reductio
hildhood Training
venues for severa
n of ARRA
g Alliance
al projects,

9
Comparison of FY 2012 to FY 2011 - Component Unit
• In fiscal year 2011, investment income increased by $5 million due to market changes, but less than $1 million was received in investment income for fiscal year 2012.
• Contributions increased in fiscal year 2012 due to increased giving for the centennial anniversary.
• Grants and Contracts decreased due to state funding received in 2011 for the Consent Decree settlement.
Expenses Operating expenses can be displayed in two formats, natural classification and program classification. Both formats are displayed below.
2012 2011 2012 2011SALARIES 74,941$ 73,824$ -$ -$ BENEFITS 25,205 24,994 - - OPERATING 47,628 47,366 794 746 SCHOLARSHIPS 14,870 15,704 947 707 PAYMENTS TO TSU - - 189 75 DEPRECIATION 14,416 9,692 - -
TOTAL 177,060$ 171,580$ 1,930$ 1,528$
University Component Unit
(in thousands of dollars)NATURAL CLASSIFICATION

$‐$10,000
$20,000 $30,000
$40,000 $50,000
$60,000 $70,000
$80,000
Natural C(in thous
Classificatisands of dollars)
ion
20122011
10

C
C
Comparison of F
• Depreciamillion o
Comparison of F
• Scholars• The incr
universit
$‐
$200
$400
$600
$800
$1,000
TSU
FY 2012 to FY
ation expenses iof previously un
FY 2012 to FY
ship expenses inrease in Paymenty for centennia
Operating Expenses
Sch
U Foundat(in thous
2011 - Institutio
increased due ton-depreciated lib
2011 - Compon
ncreased in fiscants Made to TSUal-related expend
holarships and Fellowships Te
tion Expensands of dollars)
on
o a change in accbrary holdings to
nent Unit
al year 2012 dueU is the result ofditures.
Payments to ennessee State University
ditures
20122011
11
counting estimao be expensed.
e to increased mf a transfer of $1
ate regarding the
market returns rec135,803.42 from
e useful life of p
ceived in fiscal m Title III Endow
periodicals, caus
year 2011. wment interest t
sing $5.6
to the

INSRESPUBACASTUINSMASCHAUDEPTOT
$‐
$10,000
$20,000
$30,000
$40,000
$50,000
$60,000
$70,000
STRUCTIONSEARCHBLIC SERVICEADEMIC SUPPORUDENT SERVICESSTITUTIONAL SUAINTENANCE ANHOLARSHIPS
UXILIARYPRECIATIONTAL
PR
Pro
RTSUPPORTND OPERATION
ROGRAM CLASS(in thousands o
ogram Clas(in thousands o
201261,701$ 12,692 9,514
11,343 17,759 15,728 12,972 8,962
11,973 14,416
177,060$
SIFICATIONof dollars)
ssificationof dollars)
12
201165,994$ 11,564 7,658
10,700 16,852 15,425 12,271 9,807
11,617 9,692
171,580$
201201
21
13
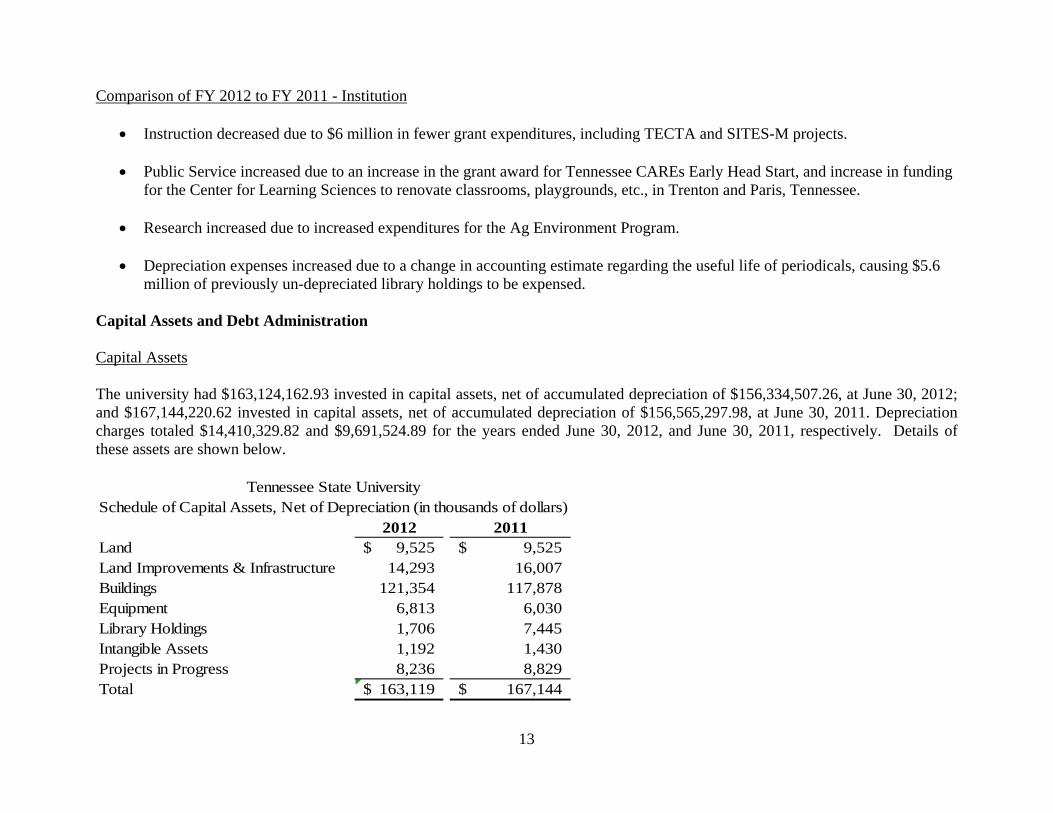
Comparison of FY 2012 to FY 2011 - Institution
• Instruction decreased due to $6 million in fewer grant expenditures, including TECTA and SITES-M projects.
• Public Service increased due to an increase in the grant award for Tennessee CAREs Early Head Start, and increase in funding for the Center for Learning Sciences to renovate classrooms, playgrounds, etc., in Trenton and Paris, Tennessee.
• Research increased due to increased expenditures for the Ag Environment Program.
• Depreciation expenses increased due to a change in accounting estimate regarding the useful life of periodicals, causing $5.6 million of previously un-depreciated library holdings to be expensed.
Capital Assets and Debt Administration Capital Assets The university had $163,124,162.93 invested in capital assets, net of accumulated depreciation of $156,334,507.26, at June 30, 2012; and $167,144,220.62 invested in capital assets, net of accumulated depreciation of $156,565,297.98, at June 30, 2011. Depreciation charges totaled $14,410,329.82 and $9,691,524.89 for the years ended June 30, 2012, and June 30, 2011, respectively. Details of these assets are shown below.
Schedule of Capital Assets, Net of Depreciation (in thousands of dollars)2012 2011
Land 9,525$ 9,525$ Land Improvements & Infrastructure 14,293 16,007 Buildings 121,354 117,878 Equipment 6,813 6,030 Library Holdings 1,706 7,445 Intangible Assets 1,192 1,430 Projects in Progress 8,236 8,829 Total 163,119$ 167,144$
Tennessee State University

14
Comparison of FY 2012 to FY 2011 - Institution
• Library holdings decreased due to a change in accounting estimate regarding the useful life of periodicals. The change expensed approximately $11 million of periodicals, of which, approximately $5.7 million was previously depreciated.
• The increase in buildings is due to many projects in progress being completed during fiscal year 2012.
• Improvements & Infrastructure and Intangible Assets decreased due to depreciation for the year.
• Equipment increased due to the addition of over $2.1 million in equipment offset by $1.3 in depreciation.
Construction will continue in FY13 on the Boswell Fume Hoods and the Gentry Storm Drainage projects from state funding. Federally funded projects included the Ag Biotech Building and Research Build-out. University funded projects will include the completion of Hale Stadium renovations. More detailed information about the university’s capital assets is presented in Note 6 to the financial statements.
2012 2011Intangible assets 6,000$ 6,000$ Total 6,000$ 6,000$
Component UnitSchedule of Capital Assets(in thousands of dollars)
Debt The university had $37,975,708.76 and $39,142,358.22 in debt outstanding at June 30, 2012, and June 30, 2011, respectively. The table below summarizes these amounts by type of debt instrument. (in thousands of dollars) 2012 2011Bonds 33,645$ 35,942$ Unamortized Bond Premium/Discount 1,130 - Commercial paper 3,200 3,200 Total 37,975$ 39,142$
15
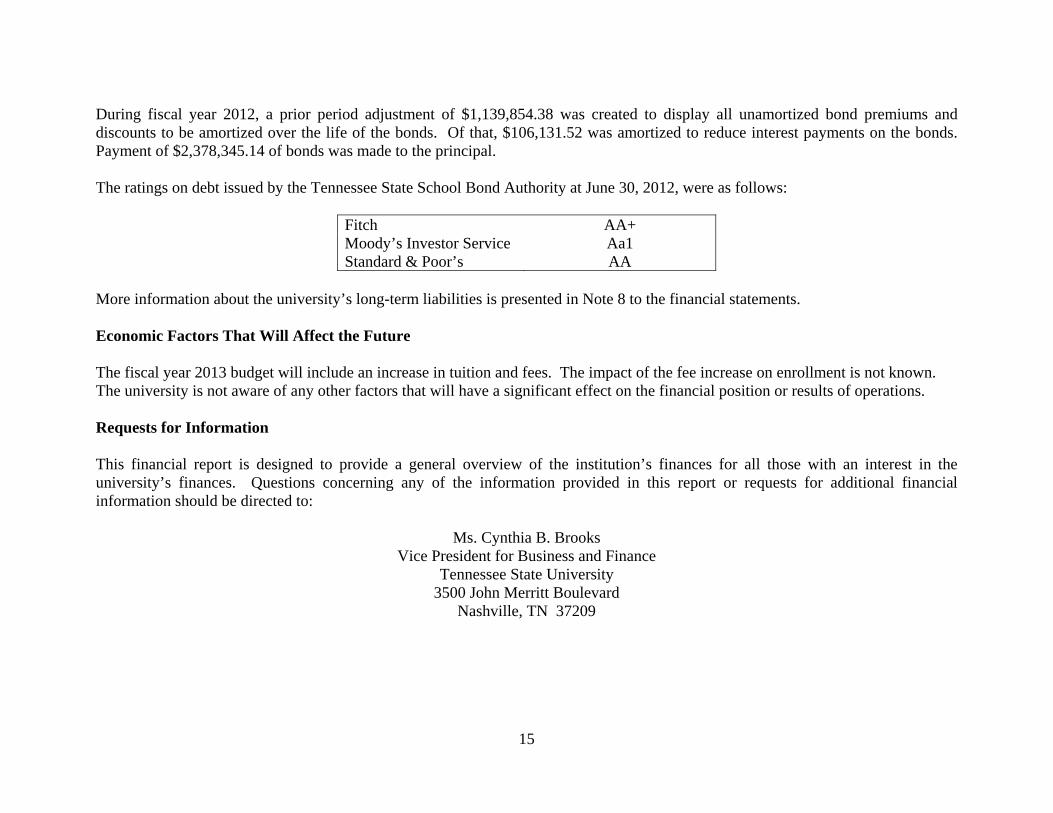
During fiscal year 2012, a prior period adjustment of $1,139,854.38 was created to display all unamortized bond premiums and discounts to be amortized over the life of the bonds. Of that, $106,131.52 was amortized to reduce interest payments on the bonds. Payment of $2,378,345.14 of bonds was made to the principal. The ratings on debt issued by the Tennessee State School Bond Authority at June 30, 2012, were as follows:
Fitch AA+ Moody’s Investor Service Aa1 Standard & Poor’s AA
More information about the university’s long-term liabilities is presented in Note 8 to the financial statements. Economic Factors That Will Affect the Future The fiscal year 2013 budget will include an increase in tuition and fees. The impact of the fee increase on enrollment is not known. The university is not aware of any other factors that will have a significant effect on the financial position or results of operations. Requests for Information This financial report is designed to provide a general overview of the institution’s finances for all those with an interest in the university’s finances. Questions concerning any of the information provided in this report or requests for additional financial information should be directed to:
Ms. Cynthia B. Brooks Vice President for Business and Finance
Tennessee State University 3500 John Merritt Boulevard
Nashville, TN 37209

Component Unit
ASSETSCurrent assets: Cash and cash equivalents (Notes 2, 3, and 20 ) 24,056,897.01$ 7,147,904.04$ Short-term investments (Note 4) 951,210.43 - Accounts, notes, and grants receivable (net) (Note 5 ) 12,067,720.57 656.80 Due from primary government 156,100.00 - Inventories (at lower of cost or market) 25,018.00 - Prepaid expenses and deferred charges 39,198.21 - Accrued interest receivable 1,955,455.08 - Other assets 1,084,785.27 - Total current assets 40,336,384.57 7,148,560.84 Noncurrent assets: Cash and cash equivalents (Notes 2, 3, and 20 ) 45,053,481.51 1,363,441.79 Investments (Notes 4 and 20 ) 15,023,028.42 36,533,262.78 Accounts, notes, and grants receivable (net) (Note 5 ) 2,276,850.13 - Capital assets (net) (Notes 6 and 20 ) 163,118,486.79 6,000,000.00 Total noncurrent assets 225,471,846.85 43,896,704.57 Total assets 265,808,231.42 51,045,265.41
LIABILITIESCurrent liabilities: Accounts payable (Note 7 ) 5,013,760.67 46,594.72 Accrued liabilities 7,728,961.06 - Deferred revenue 5,827,832.43 - Compensated absences (Note 8 ) 993,097.54 - Accrued interest payable 284,222.94 - Long-term liabilities, current portion (Note 8 ) 2,378,345.14 - Deposits held in custody for others 320,651.05 - Other liabilities 37,200.00 1,084,785.27 Total current liabilities 22,584,070.83 1,131,379.99
T ennessee S tate U niversityUnaudited Statement of Net Assets
June 30, 2012
Institution
16

Component Unit
T ennessee S tate U niversityUnaudited Statement of Net Assets
June 30, 2012
Institution
Noncurrent liabilities: Net OPEB obligation (Notes 8 and 13 ) 6,898,453.54 - Compensated absences (Note 8 ) 4,190,038.46 - Long-term liabilities (Note 8 ) 35,597,363.62 - Due to grantors (Note 8 ) 3,902,237.17 - Total noncurrent liabilities 50,588,092.79 - Total liabilities 73,172,163.62 1,131,379.99
NET ASSETSInvested in capital assets, net of related debt 125,142,778.03 6,000,000.00 Restricted for: Nonexpendable: Scholarships and fellowships 24,384.64 3,867,594.87 Research - 503,712.88 Instructional department uses 50,000.00 77,076.94 Other - 32,168,920.63 Expendable: Scholarships and fellowships 1,319,438.40 1,881,285.69 Research 456,755.48 37,983.92 Instructional department uses 2,179,754.27 414,177.45 Loans 849,637.75 - Debt service 14,272.00 - Other 1,325,009.41 4,791,349.97 Unrestricted (Note 10 ) 61,274,037.82 171,783.07 Total net assets 192,636,067.80$ 49,913,885.42$
The notes to the financial statements are integral part of this statement.
17

Institution Component Unit
REVENUESOperating revenues: Student tuition and fees ( net of scholarship allowances of 23,705,740.90$ 49,297,430.57$ -$ Gifts and contributions - 2,031,042.70 Governmental grants and contracts 34,991,522.91 - Non-governmental grants and contracts 1,154,073.51 - Sales and services of educational activities 139,072.61 - Sales and services of other activities 4,585,189.29 - Auxiliary enterprises: Residential life ( net of scholarship allowances of 3,087,797.70 all residential life revenues are used as security for revenue bonds, see Note 8 ) 6,664,517.54 - Bookstore 308,929.47 - Food service 5,524,654.81 - Other auxiliaries 888,734.44 - Interest earned on loans to students 160,005.95 - Other operating revenues 13,131.25 427,283.25 Total operating revenues 103,727,262.35 2,458,325.95
EXPENSESOperating Expenses Salaries and wages 74,940,859.92 - Benefits 25,205,017.17 - Utilities, supplies, and other services 47,628,131.43 794,662.84 Scholarships and fellowships 14,869,522.78 947,028.43 Depreciation expense 14,416,005.96 - Payments to or on behalf of TSU (see Note 20) - 188,523.42 Total operating expenses 177,059,537.26 1,930,214.69 Operating income (loss) (73,332,274.91) 528,111.26
NONOPERATING REVENUES (EXPENSES)
T ennessee S tate U niversityUnaudited Statement of Revenues, Expenses, and Changes in Net Assets
For the Year Ended June 30, 2012
18

Institution Component Unit
T ennessee S tate U niversityUnaudited Statement of Revenues, Expenses, and Changes in Net Assets
For the Year Ended June 30, 2012
State appropriations 36,275,644.34 - Gifts, including 188,523.42 from component unit 212,973.42 - Grants and contracts 31,271,933.21 239,056.22 Investment income (net of investment expense of 224,157.29 for the institution and 185,675.92 for the component unit) 429,053.42 740,897.03 Interest on capital asset-related debt (1,643,670.46) - Other non-operating revenues/(expenses) (52,715.39) - Net nonoperating revenues 66,493,218.54 979,953.25 Income before other revenues, expenses gains, or losses (6,839,056.37) 1,508,064.51 Capital appropriations 2,819,382.66 - Capital grants and gifts 4,095,053.26 - Additions to permanent endowments - 282,482.58 Total other revenues 6,914,435.92 282,482.58 Increase (decrease) in net assets 75,379.55 1,790,547.09
NET ASSETSNet Assets -beginning of year 193,481,478.88 48,123,338.33 Prior period adjustment (Note 18 ) (920,790.63) - Net Assets - end of year 192,636,067.80$ 49,913,885.42$
19
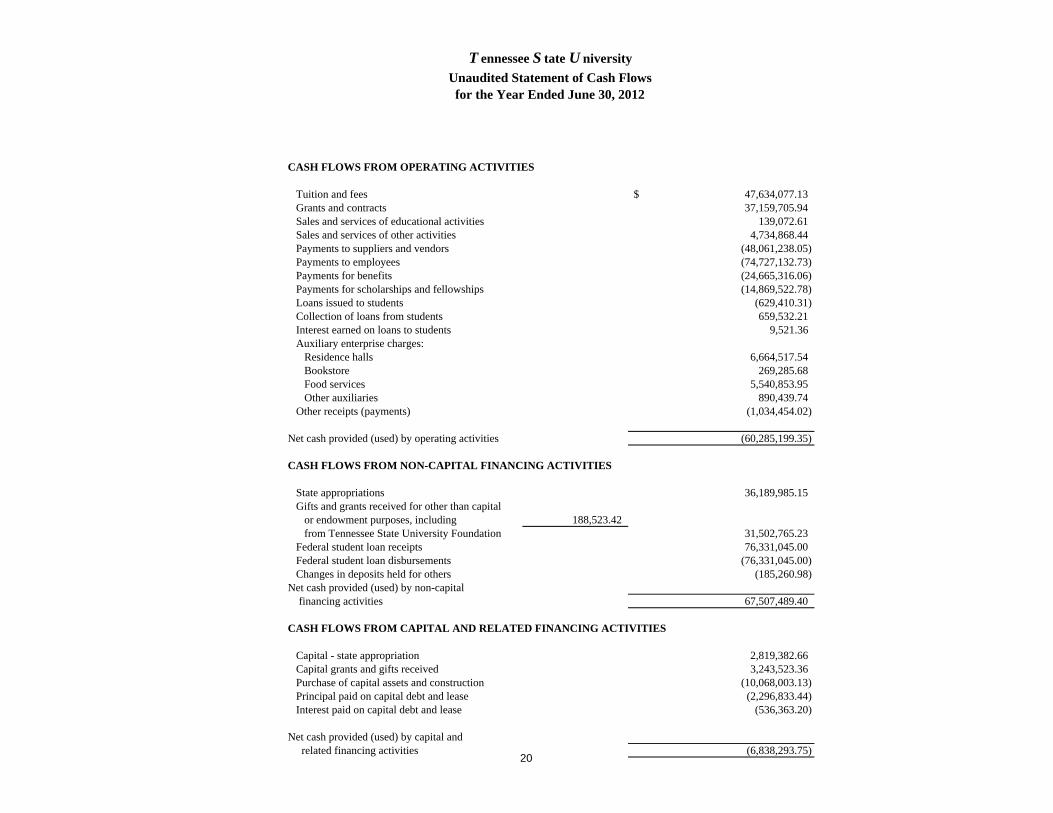
CASH FLOWS FROM OPERATING ACTIVITIES
Tuition and fees 47,634,077.13$ Grants and contracts 37,159,705.94 Sales and services of educational activities 139,072.61 Sales and services of other activities 4,734,868.44 Payments to suppliers and vendors (48,061,238.05) Payments to employees (74,727,132.73) Payments for benefits (24,665,316.06) Payments for scholarships and fellowships (14,869,522.78) Loans issued to students (629,410.31) Collection of loans from students 659,532.21 Interest earned on loans to students 9,521.36 Auxiliary enterprise charges: Residence halls 6,664,517.54 Bookstore 269,285.68 Food services 5,540,853.95 Other auxiliaries 890,439.74 Other receipts (payments) (1,034,454.02)
Net cash provided (used) by operating activities (60,285,199.35)
CASH FLOWS FROM NON-CAPITAL FINANCING ACTIVITIES
State appropriations 36,189,985.15 Gifts and grants received for other than capital or endowment purposes, including 188,523.42 from Tennessee State University Foundation 31,502,765.23 Federal student loan receipts 76,331,045.00 Federal student loan disbursements (76,331,045.00) Changes in deposits held for others (185,260.98) Net cash provided (used) by non-capital financing activities 67,507,489.40
CASH FLOWS FROM CAPITAL AND RELATED FINANCING ACTIVITIES
Capital - state appropriation 2,819,382.66 Capital grants and gifts received 3,243,523.36 Purchase of capital assets and construction (10,068,003.13) Principal paid on capital debt and lease (2,296,833.44) Interest paid on capital debt and lease (536,363.20)
Net cash provided (used) by capital and related financing activities (6,838,293.75)
T ennessee S tate U niversityUnaudited Statement of Cash Flowsfor the Year Ended June 30, 2012
20

T ennessee S tate U niversityUnaudited Statement of Cash Flowsfor the Year Ended June 30, 2012
CASH FLOWS FROM INVESTING ACTIVITIES
Proceeds from sales and maturities of investments 14,298,270.20 Income on investments 727,860.34 Purchase of investments (12,821,782.12)
Net cash provided (used) by investing activities 2,204,348.42
Net increase (decrease) in cash and cash equivalents 2,588,344.72 Cash and cash equivalents - beginning of year 66,522,033.80 Cash and cash equivalents - end of year (Note 2 ) 69,110,378.52$
RECONCILIATION OF OPERATING INCOME/(LOSS) TO NET CASH PROVIDED (USED) BY OPERATING ACTIVITIES
Operating income/(loss) (73,332,274.91)$ Adjustments to reconcile operating loss to net cash provided (used) by operating activities: Depreciation expense 14,416,005.96 Other adjustments 67,159.19 Change in assets and liabilities: Receivables, net (845,579.73) Inventories (3,022.66) Other assets (1,084,785.27) Accounts payable 510,075.59 Accrued liabilities 516,313.95 Deferred revenues 308,292.67 Deposits (1,198,930.21) Compensated absences 242,484.57 Due to grantors 106,159.62 Loans to students (24,298.12) Other 37,200.00 Net cash provided (used) by operating activities (60,285,199.35)$
Non-cash investing, capital, and financing transactions Unrealized gains/(losses) on investments 632,861.33 Gain/(loss) on disposal of capital assets (49,455.28)
The notes to the financial statements are integral part of this statement.
21

22
TENNESSEE BOARD OF REGENTS Tennessee State University
Standard Notes to the Financial Statements
June 30, 2012 1. Summary of Significant Accounting Policies REPORTING ENTITY The university is a part of the State University and Community College System of Tennessee (Tennessee Board of Regents). This system is a component unit
of the State of Tennessee because the state appoints a majority of the system’s governing body and provides significant financial support; the system is discretely presented in the Tennessee Comprehensive Annual Financial Report.
The financial statements present only that portion of the Tennessee Board of Regents’ activities that is attributable to the transactions of Tennessee State
University.
The Tennessee State University Foundation is considered a component unit of the university. Although the university does not control the timing or amount of receipts from the foundation, the majority of resources, or income thereon, that the foundation holds and invests are restricted to the activities of the university by the donors. Because these restricted resources held by the foundation can only be used by, or for the benefit of, the university, the foundation is considered a component unit of the university and is discretely presented in the university’s financial statements. See Note 20 for more detailed information about the component unit and how to obtain the report.
BASIS OF PRESENTATION The university and foundation’s financial statements have been prepared in conformity with accounting principles generally accepted in the United States of
America applicable to governmental colleges and universities engaged in business-type activities as prescribed by the Governmental Accounting Standards Board (GASB).
BASIS OF ACCOUNTING For financial statement purposes, the university is considered a special-purpose government engaged only in business-type activities. Accordingly, the financial
statements have been prepared using the economic resources measurement focus and the accrual basis of accounting. Revenues are recorded when earned and expenses are recorded when a liability is incurred, regardless of the timing of related cash flows. Grants and similar items are recognized as revenue as soon as all eligibility requirements imposed by the provider have been met. All significant interfund transactions have been eliminated.
Private-sector standards of accounting and financial reporting issued prior to December 1, 1989, generally are followed to the extent that those standards do not conflict with or contradict guidance of the Governmental Accounting Standards Board (GASB). The university has the option of following private-sector guidance issued subsequent to November 30, 1989, subject to the above limitation. The university has elected not to follow private-sector guidance issued subsequent to November 30, 1989.

23
Amounts reported as operating revenues include: 1) tuition and fees, net of waivers and discounts, 2) certain federal, state, local and private grants and contracts, 3) sales and services of auxiliary enterprises, and 4) other sources of revenue. Operating expenses for the university include: 1) salaries and wages, 2) employee benefits, 3) scholarships and fellowships, 4) depreciation, and 5) utilities, supplies, and other services. All other activity is nonoperating in nature. This activity includes: 1) state appropriations for operations, 2) investment income, 3) bond issuance costs, 4) interest on capital asset-related debt, and 5) gifts and non-exchange transactions. When both restricted and unrestricted resources are available for use, generally it is the university’s policy to use the restricted resources first.
CASH EQUIVALENTS This classification includes instruments that are readily convertible to known amounts of cash and have original maturities of three months or less. INVENTORIES
Inventories are valued at the lower of cost or market. All other items are maintained on an average cost or first-in, first-out basis.
COMPENSATED ABSENCES The university’s employees accrue annual and sick leave at varying rates, depending upon length of service or classification. Some employees also earn
compensatory time. The amount of the liabilities for annual leave and compensatory time and their related benefits are reported in the Statement of Net Assets. There is no liability for unpaid accumulated sick leave since the university’s policy is to pay this only if the employee is sick or upon death.
CAPITAL ASSETS
Capital assets, which include property, plant, equipment, library holdings, and intangible assets, are reported in the Statement of Net Assets at historical cost or at fair value at date of donation, less accumulated depreciation. The costs of normal maintenance and repairs that do not add to the value of the assets or materially extend the assets’ useful lives are not capitalized. A capitalization threshold of $100,000 is used for buildings and $50,000 is used for infrastructure. Equipment is capitalized when the unit acquisition cost is $5,000 or greater. The capitalization threshold for additions and improvements to buildings and land is set at $50,000. The capitalization threshold for intangible assets is set at $100,000. These assets, with the exception of land, are depreciated/amortized using the straight-line method over the estimated useful lives of the assets, which range from 5 to 40 years.
NET ASSETS
The university’s net assets are classified as follows:

24
INVESTED IN CAPITAL ASSETS, NET OF RELATED DEBT: This represents the university’s total investment in capital assets, net of outstanding debt obligations related to those capital assets. To the extent debt has been incurred but not yet expended for capital assets, such amounts are not included as a component of invested in capital assets, net of related debt. RESTRICTED NET ASSETS – NONEXPENDABLE: Nonexpendable restricted net assets consist of endowment and similar type funds in which donors or other outside sources have stipulated, as a condition of the gift instrument, that the principal is to be maintained inviolate and in perpetuity, and invested for the purpose of producing present and future income, which may be expendable or added to principal. RESTRICTED NET ASSETS – EXPENDABLE: Restricted expendable net assets include resources in which the university is legally or contractually obligated to spend in accordance with restrictions imposed by external third parties. UNRESTRICTED NET ASSETS: Unrestricted net assets represent resources derived from student tuition and fees, state appropriations, and sales and services of educational departments and auxiliary enterprises. These resources are used for transactions relating to the educational and general operations of the university, and may be used at the discretion of the university to meet current expenses for any purpose. The auxiliary enterprises are substantially self-supporting activities that provide services for students, faculty, and staff. SCHOLARSHIP DISCOUNTS AND ALLOWANCES Student tuition and fee revenues, and certain other revenues from students, are reported net of scholarship discount and allowances in the statement of revenues, expenses, and changes in net assets. Scholarship discounts and allowances are the difference between the stated charge for goods and services provided by the university, and the amount that is paid by the student and/or third parties making payments on the students’ behalf. Certain governmental grants, such as Pell grants, and other federal, state or nongovernmental programs are recorded as either operating or nonoperating revenues in the university’s financial statements. To the extent that revenues from such programs are used to satisfy tuition and fees and other student charges, the university has recorded a scholarship discount and allowance.
2. Cash and Cash Equivalents In addition to demand deposits and petty cash on hand, this classification includes instruments which are readily convertible to known amounts of cash and
which have original maturities of three months or less. At June 30, 2012, cash and cash equivalents consists of $14,400,754.01 in bank accounts, $3,750 of petty cash on hand, $27,354,200.55 in the State of Tennessee Local Government Investment Pool administered by the State Treasurer, $2,238,335.21 in the LGIP Deposits – Capital Projects account, and $25,113,338.75 in a money market account.
LGIP Deposits – Capital Projects - Payments related to the university’s capital projects are made by the State of Tennessee’s Department of Finance and Administration. The university’s estimated local share of the cost of each project is held in a separate Local Government Investment Pool (LGIP) account. As expenses are incurred, funds are withdrawn from the LGIP account by the Tennessee Board of Regents and transferred to the Department of Finance and Administration. The funds in the account are not available to the university for any other purpose until the project is completed and the Tennessee Board of Regents releases any remaining funds.
3. Deposits In accordance with the laws of the State of Tennessee, financial institutions have pledged securities as collateral for university funds on deposit. Financial
institutions may participate in a bank collateral pool administered by the State Treasurer. For those financial institutions participating in the bank collateral pool, the required collateral accepted as security for deposits shall be collateral whose market value is equal to either one hundred fifteen percent (115%), one

25
hundred percent (100%), or ninety percent (90%) of the uninsured deposits. The pledge level is based on financial criteria set by the Collateral Pool Board with the financially strongest institutions being eligible for the lowest pledge level. For all other financial institutions, the required collateral accepted as security for deposits shall be collateral whose market value is equal to one hundred five percent (105%) of the uninsured deposits.
At June 30, 2012, $107,940.53 of the university’s bank balance of $69,110,378.52 was exposed to custodial credit risk as follows:
Uninsured and uncollateralized $107,940.53 Total $107,940.53
The university also has deposits in the Local Government Investment Pool (LGIP) administered by the State Treasurer. The LGIP is part of the State Pooled
Investment Fund. The fund’s required risks disclosures are presented in the State of Tennessee’s Treasurer’s Report. That report is available on the state’s website at http://www.tn.gov/treasury or by calling (615) 741-2956.
4. Investments All investments permitted to be reported at fair value under GASB Statement 31 are reported at fair value, including those with a maturity date of one year or
less at the time of purchase.
As of June 30, 2012, the university had the following investments and maturities.
More No MaturityInvestment Type Fair Value Less than 1 1 to 5 6 to 10 than 10 DateUS Agencies 15,570,659.56$ 621,448.55$ 5,672,076.42$ 7,184,730.93$ 2,092,403.66$ -$ Certificates of Deposit 403,579.29 393,579.29 10,000.00 - - - Total 15,974,238.85$ 1,015,027.84$ 5,682,076.42$ 7,184,730.93$ 2,092,403.66$ -$
Investment Maturities (In Years)
Interest Rate Risk. Interest rate risk is the risk that changes in interest rates will adversely affect the fair value of a debt investment. The university does not have a formal investment policy that limits investment maturities as a means of managing its exposure to fair value losses arising from increasing interest rates.
Credit Risk. Credit risk is the risk that an issuer or other counterparty to an investment will not fulfill its obligations. The university is authorized by statute to invest funds in accordance with Tennessee Board of Regents policies. Under the current policy, funds other than endowments may be invested only in obligations of the United States or its agencies which are backed by the full faith and credit of the United States, repurchase agreements for United States securities, certificates of deposit in banks and savings and loan associations, banker's acceptances, commercial paper, money market mutual funds and the State of Tennessee Local Government Investment Pool. The policy requires that investments of endowments in equity securities be limited to funds from private gifts or other sources external to the university and that endowment investments be prudently diversified. Securities are rated using Standard and Poor’s, Moody’s, and/or Fitch’s and are presented below using the Standard and Poor’s rating scale.

26
TBR policy restricts investments in banker’s acceptances and commercial paper. The policy requires that prime banker’s acceptances must be issued by domestic banks with a minimum AA rating or foreign banks with a AAA long-term debt rating by a majority of the rating services that have rated the issuer. Prime banker’s acceptances are required to be eligible for purchase by the Federal Reserve System. To be eligible, the original maturity must not be more than 270 days, and it must: 1) arise out of the current shipment of goods between countries or within the United States, or 2) arise out of storage within the United States of goods under contract of sale or expected to move into the channel or trade within a reasonable time and that are secured throughout their life by a warehouse receipt or similar document conveying title to the underlying goods. The policy requires that prime commercial paper shall be limited to that of corporations that meet the following criteria: 1) Senior long-term debt, if any, should have a minimum rating of A1 or equivalent, and short-term debt should have a minimum rating of A1 or equivalent, as provided by a majority of the rating services that rate the issuer. If there is no long-term debt rating, the short-term debt rating must be A1 by all rating services (minimum of two). 2) The rating should be based on the merits of the issuer or guarantee by a nonbank. 3) A financial review should be made to ascertain the issuer’s financial strength to cover the debt. 4) Commercial paper of a banking institution should not be purchased. Prime commercial paper shall not have a maturity that exceeds 270 days. As of June 30, 2012, the university’s investments were rated as follows:
Investment Type Fair Value AAA AA UnratedLGIP 29,592,535.76$ -$ -$ 29,592,535.76$ US Agencies 13,339,545.55 591,782.08 12,747,763.47 - Total 42,932,081.31$ 591,782.08$ 12,747,763.47$ 29,592,535.76$
Credit Quality Rating
Concentration of Credit Risk. Concentration of credit risk is the risk of loss attributed to the magnitude of the university’s investment in a single issuer. TBR policy restricts investments in banker’s acceptances, commercial paper, and money market mutual funds. The policy limits banker’s acceptances to not exceed twenty percent of total investments on the date of acquisition and limits the combined amount of banker’s acceptances and commercial paper to not exceed thirty-five percent of total investments at the date of acquisition. The amount invested in any one bank shall not exceed five percent of total investments on the date of acquisition. Additionally, no more than five percent of total investments at the date of acquisition may be invested in the commercial paper of a single issuer. The policy further limits the total holdings of an issuer’s commercial paper to not more than two percent of the issuing corporation’s total outstanding commercial paper. TBR policy limits investments in money market mutual funds to not exceed ten percent of total investments on the date of acquisition. More than 5 percent of the university’s investments were invested in the following single issuers:
Issuer Percentage of Total InvestmentsFederal National Mortgage Assn. 26%Federal Home Loan Bank 32%Federal Home Loan Mortgage Corp. 25%

27
5. Accounts, Notes, and Grants Receivable
Accounts receivable included the following: June 30, 2012
Student accounts receivable 5,369,254.77$ Grants receivable 8,853,942.78 Notes receivable 2,105.80 Other receivables 529,013.35 Subtotal 14,754,316.70 Less allowance for doubtful account (2,672,466.75) Total 12,081,849.95$
Federal Perkins Loan Program funds include the following:
June 30, 2012Perkins Loans receivable 2,328,570.53$ Less allowance for doubtful accounts (65,849.78) Total 2,262,720.75$

28
6. Capital Assets
Capital asset activity for the year ended June 30, 2012, was as follows:
Beginning EndingBalance Additions Transfers Reduction Balance
Land 9,525,009.24$ -$ -$ -$ 9,525,009.24$ Land Improve & Infrastructure 48,900,213.88 85,788.25 - - 48,986,002.13 Buildings 209,616,191.98 51,260.00 8,428,998.26 - 218,096,450.24 Equipment 27,369,678.44 2,154,119.49 - (1,899,838.09) 27,623,959.84 Library Holdings 16,789,657.29 313,040.00 - (12,790,737.73) 4,311,959.56 Intangible Assets 2,679,599.36 - - - 2,679,599.36 Projects in Progress 8,829,168.41 7,845,980.79 (8,428,998.26) (10,461.12) 8,235,689.82 Total 323,709,518.60 10,450,188.53 - (14,701,036.94) 319,458,670.19
Less Accumulated Depreciation Amort:Land Improve & Infrasstructure 32,892,885.70 1,800,366.71 - - 34,693,252.41
Buildings 91,737,881.78 5,004,624.97 - - 96,742,506.75 Equipment 21,340,001.04 1,321,768.76 - (1,850,382.81) 20,811,386.99 Library Holdings 9,345,278.11 6,050,854.18 - (12,790,737.73) 2,605,394.56 Intangible Assets 1,249,251.35 238,391.34 - - 1,487,642.69 Total Accumulated Depreciation 156,565,297.98 14,416,005.96 - (14,641,120.54) 156,340,183.40
Capital assets, net 167,144,220.62$ (3,965,817.43)$ -$ (59,916.40)$ 163,118,486.79$ The decrease in library holdings is due to a change in accounting estimate. During fiscal year 2012, it was determined that periodicals are more appropriately expensed. The estimated useful life of periodicals was decreased from 10 years to 0 years, resulting in a current year adjustment of $11,512,603.24 from library holdings and $5,892,945.00 in accumulated depreciation on library holdings.
7. Accounts Payable Accounts payable included the following:
June 30, 2012Vendor Payable 4,307,297.36$ Other Payables 706,463.31
Total 5,013,760.67$

29
8. Long-term Liabilities
Long term liability activity for the year ended June 30, 2012, was as follows:
Beginning Ending CurrentBalance Additions Reduction Balance Portion
TSSBA debt:Bonds 35,942,358.22$ -$ (2,296,833.44)$ 33,645,524.78$ 2,378,345.14$ Unamortized Bond Premium/Discounts - 1,248,373.14 (118,189.16) 1,130,183.98 - Commercial Paper 3,200,000.00 - - 3,200,000.00 -
Subtotal 39,142,358.22 1,248,373.14 (2,415,022.60) 37,975,708.76 2,378,345.14
Other Liabilities:Compensated Absences 4,940,651.43 2,681,304.31 (2,438,819.74) 5,183,136.00 993,097.54 Due to Grantor 3,818,275.93 159,585.24 (75,624.00) 3,902,237.17 - Net OPEB Obligation 6,488,748.44 409,705.10 - 6,898,453.54 -
Subtotal 15,247,675.80 3,250,594.65 (2,514,443.74) 15,983,826.71 993,097.54
Total Liabilities 54,390,034.02$ 4,498,967.79$ (4,929,466.34)$ 53,959,535.47$ 3,371,442.68$
TSSBA Debt - Bonds Payable
Bonds, with interest rates ranging from 3.5% to 5%, were issued by the Tennessee State School Bond Authority. The bonds are due serially until May 1, 2032 and are secured by pledges of the facilities’ revenues to which they relate and certain other revenues and fees of the university, including state appropriations, see Note 11 for further details. The bonded indebtedness with the Tennessee State School Bond Authority included in long-term liabilities on the Statement of Net Assets is shown net of assets held by the authority in the debt service reserve and net of unexpended debt proceeds. The reserve amount was $530,473.56 at June 30, 2012.
Debt service requirements to maturity for the university’s portion of TSSBA bonds at June 30, 2012, are as follows:

30
For the Year(s)Ending June 30 Principal Interest Total
2013 2,378,345.14$ 1,678,048.66$ 4,056,393.80$ 2014 2,484,823.22 1,565,070.01 4,049,893.23 2015 2,545,961.60 1,454,319.91 4,000,281.51 2016 2,373,503.55 1,340,368.56 3,713,872.11 2017 2,485,257.06 1,227,518.82 3,712,775.88
2018 - 2022 10,880,081.37 4,432,996.87 15,313,078.24 2023 - 2027 7,591,122.15 1,906,672.96 9,497,795.11 2028 - 2032 2,906,430.69 383,868.64 3,290,299.33
Total 33,645,524.78$ 13,988,864.43$ 47,634,389.21$
TSSBA Debt - Commercial Paper
The Tennessee State School Bond Authority issues commercial paper to finance costs of various capital projects during the construction phase. When projects are placed in service, long-term, fixed-rate debt is issued by TSSBA to finance the project over its useful payback period and the commercial paper is redeemed. The amount outstanding for projects at the university was $3,200,000 at June 30, 2012. For the commercial paper program, the Tennessee State School Bond Authority maintains an interest rate reserve fund. The university contributes amounts to the reserve fund based on the amounts drawn. The principal of the reserve will be contributed to pay off notes or credited back to the university when the notes are converted to bonds. The interest earned on the reserve is used to pay interest due during the month. More detailed information regarding the bonds and commercial paper can be found in the notes to the financial statements in the financial report for the Tennessee State School Bond Authority. That report is available on the state’s website at http://tn.gov/comptroller/bf/tssbacafr.htm.
9. Endowments
If a donor has not provided specific instructions to the Tennessee State University, state law permits the university to authorize for expenditure the net appreciation (realized and unrealized) of the investments of endowment funds. When administering its power to spend these earnings, the university is required to consider the university’s long-term and short-term needs, present and anticipated financial requirements, expected return on its investments, price-level trends, and general economic conditions. Any earnings spent are required to be spent for the purposes for which the endowment was established.
The university chooses to spend only a portion of the investment income each year. At June 30, 2012, net appreciation of $ 43,906.54 is available to be spent, of which $2,349.88 is included in restricted net assets expendable for scholarships and fellowships, and $41,556.66 is included in restricted net assets expendable for instructional departmental uses.

31
10. Unrestricted Net Assets Unrestricted net assets include funds that have been designated for specific purposes. These purposes include the following:
FY 2012Working Capital 2,054,386.13$ Encumbrances 1,783,582.49 Designated Fees 1,173,603.90 Auxiliaries 2,772,956.73 Plant Construction 35,343,638.81 Renewal and Replacement of Equipment 8,948,562.91 Undesignated Balance 9,197,306.85 Total 61,274,037.82$
11. Pledged Revenues
The university has pledged certain revenues and fees, including state appropriations, to repay $33,645,524.78 in revenue bonds issued from December 1989 to November 2008. Proceeds from the bonds provided financing for Avon Williams Campus Improvements, Chiller Replacement, Dormitory Renovations, Energy Savings and Performance Contracts, Student Housing/Apartments, Research and Sponsored Programs, , and Student Housing Fire Suppression. The bonds are payable through 2032. Annual principal and interest payments on the bonds are expected to require 3% of available revenues. The total principal and interest remaining to be paid on the bonds is $47,634,389.21. Principal and interest paid for the current year and total available revenues were $4,070,853.21 and $132,044,854.06, respectively.
12. Pension Plans
Defined Benefit Plan Plan Description - The university contributes to the State Employees, Teachers, and Higher Education Employees Pension Plan (SETHEEPP), a cost-sharing multiple-employer defined benefit pension plan administered by the Tennessee Consolidated Retirement System (TCRS). TCRS provides retirement, death, and disability benefits as well as annual cost-of-living adjustments to plan members and their beneficiaries. Title 8, Chapters 34-37, Tennessee Code Annotated, establishes benefit provisions. State statutes are amended by the Tennessee General Assembly. The TCRS issues a publicly available financial report that includes financial statements and required supplementary information for SETHEEPP. That report is available on the state’s website at http://www.state.tn.us/treasury/tcrs/index.html. Funding Policy - Plan members are noncontributory. The university is required to contribute at an actuarially determined rate. The current rate is 15.03% of annual covered payroll. The contribution requirements of the university are established and may be amended by the TCRS Board of Trustees. The university’s contributions to TCRS for the years ending June 30, 2012, 2011, and 2010 were $4,191,277.07, $4,078,956.87, and $3,621,292.79, respectively, equal to the required contributions for each year.

32
Federal Retirement Program Plan Description – The University contributes to the Federal Retirement Program, a cost-sharing multiple-employer defined benefit pension plan administered by the Civil Service Retirement System (CSRS) for participants employed prior to January 1, 1984, and the Federal Employees Retirement System (FERS) for participants employed after December 31, 1983. Both systems provide retirement, death, and disability benefits as well as annual cost-of-living adjustments to plan members and beneficiaries. All regular full-time employees of the Tennessee State University Agricultural Extension Service who hold federal appointments for 51% or more of their time are required to participate in either one of the two Federal Retirement Programs. For both systems, benefit provisions are established in federal statutes. Federal statutes are amended by the U.S. Congress. All the university’s extension employees currently participate in CSRS.
The CSRS issues a publicly available financial report that includes financial statements and required supplementary information. The report may be obtained by writing to the Office of Personnel Management, Retirement Information Office, P.O. Box 45, Boyers, Pennsylvania, 16017-0045, or by calling (202) 606-0500.
Funding Policy – Participating employees and the university are required to contribute to the CSRS plan. Contribution requirements are established and may be amended by federal statutes. The university was required to contribute 7% of covered payroll to the CSRS plan. Employees were required to contribute 7% of the covered payroll. Contributions to CSRS for the year ended June 30, 2012, were $45,370.20, which consisted of $22,685.10 from the university and $22,685.10 from the employees; contributions for the year ended June 30, 2011, were $42,711.56, which consisted of $21,355.78 from the university and $21,355.78 from the employees; contributions for the year ended June 30, 2010, were $45,778.12, which consisted of $22,889.06 from the university and $22,889.06 from the employees. Contributions met the requirements for each year. Defined Contribution Plans
Plan Description – The university contributes to three defined contribution plans: Teachers Insurance and Annuity Association-College Retirement Equities Fund (TIAA-CREF), ING Life and Annuity Company, and Variable Annuity Life Insurance Company (VALIC). These plans are administered by the Tennessee Department of the Treasury. Each plan provides retirement benefits to faculty and staff who are exempt from the overtime provisions of the Fair Labor Standards Act and who waive membership in the TCRS. Benefits depend solely on amounts contributed to the plan plus investment earnings. Plan provisions are established by state statute in Title 8, Chapter 35, Part 4, Tennessee Code Annotated. State statutes are amended by the Tennessee General Assembly. Funding Policy – Plan members are noncontributory. The university contributes an amount equal to 10% of the employee’s base salary up to the social security wage base and 11% above the social security wage base. Contribution requirements are established and amended by state statute. The contribution made by the university to the plans for the year ended June 30, 2012, was $3,544,088.19 and for the year ended June 30, 2011, was $3,668,221.04. Contributions met the requirements for each year.
13. Other Postemployment Benefits Healthcare is the only “other postemployment benefit” (OPEB) provided to employees. The State of Tennessee administers a group health insurance program
that provides postemployment health insurance benefits to eligible university retirees. This program includes two plans available to higher education employees – the State Employee Group Plan and the Medicare Supplement Plan. Both plans are agent multiple-employer defined benefit OPEB plans. Benefits are established and amended by an insurance committee created by Tennessee Code Annotated (TCA) 8-27-201 for the state plan and TCA 8-27-701for the Medicare Supplement Plan. Prior to reaching the age of 65, all members have the option of choosing between the standard or partnership preferred provider

33
organization (PPO) plan for healthcare benefits. Subsequent to age 65, members who are also in the state’s retirement system may participate in the Medicare Supplement Plan. That plan does not include pharmacy. The state makes on-behalf payments to the Medicare Supplement Plan for the university’s eligible retirees, see Note 19. The plans are reported in the State of Tennessee Comprehensive Annual Financial Report (CAFR). The CAFR is available on the state’s website at http://tennessee.gov/finance/act/cafr.html.
Funding Policy. The premium requirements of plan members are established and may be amended by the insurance committee. The plans are self-insured and
financed on a pay-as-you-go basis with the risk shared equally among the participants. Claims liabilities of the plan are periodically computed using actuarial and statistical techniques to establish premium rates. Administrative costs of the plan are allocated to plan participants. Retired employees who have not reached the age of 65 pay the same base premium as active employees in the plan adjusted for years of service. Retirees with 30 years of service are subsidized 80 percent; 20 but less than 30 years, 70 percent; and less than 20 years, 60 percent. Retired employees who are 65 years of age or older have flat rate premium subsidies based on years of service. Retirees with 30 years of service receive $50 per month; 20 but less than 30 years, $37.50; and 15 but less than 20 years, $25. Contributions for the State Employee Group Plan for the year ended June 30, 2012, were $12,212,486.48, which consisted of $9,792,607.71 from the university and $2,419,878.77 from the employees.
Annual required contribution (ARC) 1,713,000.00$ Interest on the net OPEB obligation 261,803.81 Adjustment to the ARC (277,899.77) Annual OPEB cost 1,696,904.04 Amount of contribution (1,343,545.78) Increase/decrease in net OPEB obligation 353,358.26 Net OPEB Obligation - beginning of year 6,488,748.44 Prior Period Adjustment 56,346.84 Net OPEB Obligation - ending of year 6,898,453.54$
University's Annual OPEB Cost and Net OPEB ObligationState Employee Group Plan
Annual OPEB Percentage of Net OPEBCost Annual OPEB Obligation at
Cost Contributed Year-end6/30/2012 State Employee Group Plan 1,696,904.04$ 79.2% 6,898,453.54$ 6/30/2011 State Employee Group Plan 2,287,964.77$ 52.4% 6,545,095.28$ 6/30/2010 State Employee Group Plan 2,516,339.06$ 39.4% 5,456,386.81$
Year-end Plan

34
Funded Status and Funding Progress. The funded status of the plan as of July 1, 2011, was as follows:
Actuarial valuations involve estimates of the value of reported amounts and assumptions about the probability of events far into the future, and actuarially
determined amounts are subject to continual revision as actual results are compared to past expectations and new estimates are made about the future. The schedule of funding progress, presented as Required Supplementary Information following the notes to the financial statements, presents multiyear trend information about whether the actuarial value of plan assets is increasing or decreasing over time relative to the actuarial accrued liability for benefits.
Actuarial Methods and Assumptions. Calculations are based on the types of benefits provided under the terms of the substantive plan at the time of each
valuation and on the pattern of sharing of costs between the employer and plan members to that point. Actuarial calculations reflect a long-term perspective. Consistent with that perspective, actuarial methods and assumptions used include techniques that are designed to reduce short-term volatility in actuarial accrued liabilities and the actuarial value of assets.
In the July 1, 2011, actuarial valuation, the Projected Unit Credit actuarial cost method was used. The actuarial assumptions included a 4.0 percent investment rate of return (net of administrative expenses) and an annual healthcare cost trend rate of 9.25 percent in fiscal year 2012, decreased to 8.75 percent in fiscal year 2013 and then reduced by decrements to an ultimate rate of 5 percent in fiscal year 2021. All rates include a 2.5 percent inflation assumption. The unfunded actuarial accrued liability is being amortized as a level percentage of payroll on a closed basis over a 30 year period beginning with July 1, 2007.
14. Chairs of Excellence The university had $4,958,160.98 on deposit at June 30, 2012, with the State Treasurer for its Chairs of Excellence program. These funds are held in trust by
the state and are not included in these financial statements. 15. Insurance-Related Activities
It is the policy of the state not to purchase commercial insurance for the risks of losses for general liability, automobile liability, professional malpractice, and workers’ compensation. The state’s management believes it is more economical to manage these risks internally and set aside assets for claim settlement in its internal service fund, the Risk Management Fund. The state purchases commercial insurance for real property, flood, earthquake, and builder’s risk losses and surety bond coverage on the state’s officials and employees. The amounts of settlements have not exceeded insurance coverage for each of the three past fiscal years. The Risk Management Fund is also responsible for claims for damages to state owned property up to the amount of the property insurance aggregate deductible amount. The insurance policy deductibles vary from $25,000 per occurrence, depending on the type of coverage, to an aggregate of $5 million.
Actuarial valuation date July 1, 2011Actuarial accrued liability (AAL) 13,336,000.00$ Actuarial value of plan assets - Unfunded actuarial accrued (UAAL) 13,336,000.00$ Actuarial value of assets as a % of AAL 0%Covered payroll (active plan members) 71,294,387.91$ UAAL as percentage of covered payroll 18.7%

35
The university participates in the Risk Management Fund. The fund allocates the cost of providing claims servicing and claims payment by charging a premium to the university based on a percentage of the university’s expected loss costs, which include both experience and exposures. This charge considers recent trends in actual claims experience of the state as a whole. An actuarial valuation is performed as of fiscal year-end to determine the fund liability and premium allocation. Information regarding the determination of the claims liabilities and the changes in the balances of the claims liabilities for the years ended June 30, 2011, and June 30, 2010, are presented in the Tennessee Comprehensive Annual Financial Report (CAFR). The CAFR is available on the state’s website at http://tennessee.gov/finance/act/cafr.html. Since the university participates in the Risk Management Fund, it is subject to the liability limitations under the provisions of the Tennessee Claims Commission Act, Tennessee Code Annotated, Section 9-8-101 et seq. Liability for negligence of the university for bodily injury and property damage is limited to $300,000 per person and $1,000,000 per occurrence. The limits of liability under workers’ compensation are set forth in Tennessee Code Annotated Section 50-6-101 et seq. Claims are paid through the state’s Risk Management Fund. The amount of cash and cash equivalents designated for payment of claims held by the Risk Management Fund at June 30, 2012, was not available. At June 30, 2011, the Risk Management Fund held $107.6 million in cash and cash equivalents designated for payment of claims.
At June 30, 2012, the scheduled coverage for the university was $541,237,700 for buildings and $103,977,200 for contents.
The state has also set aside assets in the Employee Group Insurance Fund, an internal service fund, to provide a program of health insurance coverage for the employees of the state with the risk retained by the state. The university participates in the Employee Group Insurance Fund. The fund allocates the cost of providing claims servicing and claims payment by charging a premium to the university based on estimates of the ultimate cost of claims, including the costs of claims that have been reported but not settled and of claims that have been incurred but not reported. Employees and providers have 13 months to file medical claims.
16. Commitments and Contingencies Sick Leave - The university records the cost of sick leave when paid. Generally, since sick leave (earned one day per month with unlimited accumulation) is
paid only when an employee dies or is absent because of illness, injury, or related family death, there is no liability for sick leave at June 30. The dollar amount of unused sick leave was $30,642,027.28 at June 30, 2012.
Operating Leases - The university has entered into various operating leases for buildings and equipment. Such leases will probably continue to be required.
Expenses under operating leases for real and personal property were $515,813.39 and $210,671.24, respectively for the year ended June 30, 2012. All operating leases are cancelable at the lessee's option.
Construction in Progress - At June 30, 2012, outstanding commitments under construction contracts totaled $1,680,974.58 for Hale Stadium, Ag Biotech
Building, Boswell Fume Hoods, Avon Williams, Gentry Storm Drainage, LRC Building, and Research Build-out, of which $1,416,062.14 will be funded by future state capital outlay appropriations.
Litigation - The university is involved in several lawsuits, none of which is expected to have a material effect on the accompanying financial statements. 17. Natural Classifications with Functional Classifications
The university’s operating expenses by functional classification for the year ended June 30, 2012, are as follows:

36
Functional Other Classification Salaries Benefits Operating Scholarships Depreciation Total
Instruction 37,111,832.73$ 11,859,248.43$ 10,894,461.35$ 1,835,485.08$ -$ 61,701,027.59$ Research 6,467,640.16 1,760,689.91 3,301,613.27 1,162,009.25 - 12,691,952.59 Public Service 5,060,645.41 1,946,343.26 2,497,779.83 9,103.00 - 9,513,871.50 Academic Support 5,931,001.37 2,039,558.50 3,254,957.71 117,828.87 - 11,343,346.45 Student Services 7,555,785.31 2,576,600.37 4,664,041.08 2,962,862.63 - 17,759,289.39 Institutional Support 7,735,224.86 2,957,390.18 5,023,246.62 11,790.95 - 15,727,652.61 M&O 2,918,995.47 1,400,304.40 8,651,541.48 1,215.00 - 12,972,056.35 Scholarships & Fellowships - - 211,634.74 8,750,178.50 - 8,961,813.24 Auxiliary 2,159,734.61 664,882.12 9,128,855.35 19,049.50 - 11,972,521.58 Depreciation - - - - 14,416,005.96 14,416,005.96
Total Expenses 74,940,859.92$ 25,205,017.17$ 47,628,131.43$ 14,869,522.78$ 14,416,005.96$ 177,059,537.26$
Natural Classification
18. Prior Period Adjustment(s) In the year ended June 30, 2012, the university began amortizing TSSBA bond premiums and discounts over the life of the bonds. Prior issuances were
reviewed. The university identified 11 projects with a bond premium and 1 project with a bond discount. Unamortized premiums and discounts of $1,248,373.14 at June 30, 2011 were recorded. As a result, invested in capital assets, net of related debt, was reduced by $1,248,373.14 at June 30, 2011.
An increase of $56,346.84 was made to the Net OPEB obligation - beginning of year, due to being excluded in the prior year. The CARP roof replacement
expense was overstated in the previous year by $12,205.07 and has been removed; and, capitalized Projects in Progress were understated by $371,724.28 in the prior year.
19. On-Behalf Payments During the year ended June 30, 2012, the State of Tennessee made payments of $67,159.19 on behalf of the university for retirees participating in the
Medicare Supplement Plan. The Medicare Supplement Plan is a postemployment benefit healthcare plan and is discussed further in Note 13. The plan is reported in the State of Tennessee Comprehensive Annual Financial Report (CAFR). The CAFR is available on the state’s website at http://tennessee.gov/finance/act/cafr.html.
20. Component Unit(s)
Tennessee State University is a legally separate, tax-exempt organization supporting Tennessee State University. The Foundation acts primarily as a fund-raising organization to supplement the resources that are available to the University in support of its programs. The 22-member board of the Foundation is self-perpetuating and consists of graduates and friends of the University. The size of the board shall be determined by the majority votes of its members, and any vacancy in its membership shall be filled in the same way. The entire membership of the Board of Trustees shall not exceed twenty-five (25) in number and a minimum of eight (8). All trustees shall serve until the expiration of their respective terms and until their respective successors are selected and qualified. Although the University does not control the timing or amount of receipts from the Foundation, the majority of resources, or income thereon,

37
that the Foundation holds and invests are restricted to the activities of the University by the donors. Because these restricted resources held by the Foundation can only be used by, or for the benefit of, the University, the Foundation is considered a component unit of the University and is discretely presented in the University’s financial statements. During the year ended June 30, 2012, the Foundation made distributions of $188,523.42 to or on behalf of the University for both restricted and unrestricted purposes. Complete financial statements for the Foundation can be obtained from Ms. Betsy Jackson, Executive Director, 3500 John A. Merritt Boulevard, Nashville, TN 37209. Cash and Cash Equivalents – In addition to demand deposits and petty cash on hand, this classification includes instruments which are readily convertible to known amounts of cash and which have original maturities of three months or less. At June 30, 2012, cash and cash equivalents consists of $7,303,901.28 in bank accounts, and $1,207,444.55 in money market accounts. Investments – The Foundation is authorized to invest funds in accordance with its board of directors’ policies. All investments permitted to be reported at fair value under GASB Statement 31 are reported at fair value, including those with a maturity date of one year or less at the time of purchase.
As of June 30, 2012, the Foundation had the following investments and maturities:
Investment Type Fair Value Less than 1 1 to 5 6 to 10 More than 10 No Maturity DateUS Treasury 2,449,213.17$ -$ 76,259.92$ 2,372,953.25$ -$ -$ US Agencies 912,985.76 - 912,985.76 - - - Corporate Stocks 14,400,728.36 - - - - 14,400,728.36 Corporate Bonds 7,186,832.70 354,960.92 3,908,039.37 2,923,832.41 - - Mutual Bond Funds 250,996.19 - - - - 250,996.19 Mutual Equity Funds 2,243,693.67 - - - - 2,243,693.67 Foreign Stock 2,034,146.42 - - - - 2,034,146.42 Foreign Bonds 49,329.28 - 49,329.28 - - - Foreign Mutual Funds 2,724,533.48 - - - - 2,724,533.48 Mortgage Backed Securities 1,124,335.58 - - 80,045.96 1,044,289.62 - Collateralized Mortgage Obligatio 987,404.40 - 613,347.27 29,410.48 344,646.65 - Real Estate Investment Trusts 2,169,063.77 - - - - 2,169,063.77 Money Market Accounts 1,207,444.55 - - - - 1,207,444.55 Savings Accounts 159,127.78 - - - - 159,127.78
Less Amounts Reported as Cash and Cash Equivalent:Money Markets (1,207,444.55) - - - - (1,207,444.55) Savings Accounts (159,127.78) - - - - (159,127.78)
Total 36,533,262.78$ 354,960.92$ 5,559,961.60$ 5,406,242.10$ 1,388,936.27$ 23,823,161.89$
Investment Maturit ies (in Years)

38
Interest Rate Risk. The Foundation does not have a formal investment policy that limits investment maturities as a means of managing its exposure to fair value arising from increasing interest rates.
Credit Risk. Credit risk is the risk that an issuer or other counterparty to an investment will not fulfill its obligations. Securities are rated using Standard and Poor’s, Moody’s, and/or Fitch’s and are presented below using the Standard and Poor’s rating scale. The Foundation has no investment policy limiting its investment choices based on ratings issued by nationally recognized statistical rating organizations. As of June 30, 2012, the Foundation’s investments were rated as follows:
Investment Type Fair Value AAA AA A BBB UnratedUS Agencies 912,285.76$ -$ 912,985.76$ -$ -$ -$ Corporate bonds 7,186,832.70 260,268.34 743,727.75 5,256,379.24 926,457.37 Mutual bond funds 250,996.19 - - - - 250,996.19 Foreign bonds 49,329.28 - - 49,329.28 - - Mortgage backed securities 1,124,335.58 - 1,124,335.58 - - - Collateralized mortgage obligations 987,404.40 642,757.75 344,646.65 - - -
Total 10,511,183.91$ 903,026.09$ 3,125,695.74$ 5,305,708.52$ 926,457.37$ 250,996.19$
Credit Quality Rating
Alternative Investments.
The foundation has investments in Real Estate Investment Trusts (REITs). The estimated fair value of these assets is $2,169,063.77 at June 30, 2012.
The foundation believes that the carrying amount of its alternative investments is a reasonable estimate of fair value as of June 30, 2012. Because these investments are not readily marketable, the estimated value is subject to uncertainty and, therefore, may differ from the value that would have been used had a ready market for the investments existed, and such differences could be material. These investments are made in accordance with the foundation’s investment policy. These investments are designed to enhance diversification and provide reductions in overall portfolio volatility. These fair values are estimated using various valuation techniques. The value of shares for Inland America is estimated to be the offering of $7.22 per share (ignoring purchase price discounts for certain categories of purchasers); provided however that if the Company has sold property and has made one or more special distributions to its stockholders of all or a portion of the net proceeds, per share will be equal to $7.22 per share distributed to the stockholders prior to the valuation date. The value of shares for Behringer Harvard is estimated to be the offering of $4.64 per share (ignoring purchase price discounts for certain categories of purchasers); provided however that if the Company has sold property and has made one or more special distributions to its stockholders of all or a portion of the net proceeds, per share will be equal to $4.64 per share distributed to the stockholders prior to the valuation date.

39
Capital Assets - Capital asset activity for the year ended June 30, 2012, was as follows:
Beg Balance Additions Transfers Reductions End Balance Intangible assets $6,000,000.00 $6,000,000.00 Capital assets, net $6,000,000.00 $6,000,000.00
Endowments - If a donor has not provided specific instructions to the foundation, the foundation’s policies and procedures permit the foundation to authorize for expenditure the net appreciation (realized and unrealized) of the investments of endowment funds. When administering its power to spend net appreciation, the foundation is required to consider its long-term and short-term needs, present and anticipated financial requirements, expected total return on its investments, price-level trends, and general economic conditions. Any net appreciation that is spent is required to be spent for the purposes for which the endowment was established. General Endowment--The foundation chooses to spend only a portion of the investment income (including changes in the value of investments) each year. Under the spending plan established by the foundation, 70% of the 3-year rolling average of net earnings has been authorized for expenditure. The remaining amount, is reinvested in the endowment. At June 30, 2012, net appreciation of $423,219.41 is available to be spent, of which $351,637.29 is included in restricted net assets expendable for scholarships and fellowships, $13,258.23 is included in restricted net assets expendable for instructional departmental uses, and $58,323.89 is included in restricted net assets expendable for other.
Consent Decree Endowment--According to the established agreement within the Consent Decree, the budget committee shall appropriate for distribution each year from Consent Decree Endowment Funds, an amount equal to 75% of the interest and dividend income. The remaining 25% is to be reinvested in the corpus of the fund. At June 30, 2012, net appreciation of $387,393.48 is available to be spent, all of which is included in restricted net assets expendable for other. Title III Endowment--According to the established agreement between the Foundation and the Tennessee State University Title III Program, an amount equal to 50% of the interest and dividend income should be allocated for distribution annually. The remaining 50% is to be reinvested in the corpus of the fund. At June 30, 2012, net appreciation of $578,626.02 is available to be spent, all of which is included in restricted net assets expendable for other.

Actuarial UAAL as aActuarial Accrued Unfunded Percentage of
Actuarial Value of Liability (AAL) AAL Funded Covered Covered Valuation Assets Entry Age (UAAL) Ratio Payroll Payroll
Date (a) (b) (b-a) (a/b) (c) ((b-a)/c)
July 1, 2009 - 22,568,000$ 22,568,000$ -$ 72,648,998$ 31.06%
July 1, 2010 - 20,747,000 20,747,000 - 71,599,111 28.98%
July 1, 2011 - 13,336,000 13,336,000 - 71,294,388 18.71%
The amounts reported here for covered payroll relate to the fiscal years in which the valuations were performed, with the exception of the July 1, 2010, actuarial valuation. The covered payroll date for the July 1, 2010, actuarial valuation is July 1, 2009.
REQUIRED SUPPLEMENTARY INFORMATIONSchedule of Funding Progress for Tennessee State University
40

Component Unit
CASH FLOWS FROM OPERATING ACTIVITIES
Gifts and contributions 2,031,042.70$ Grants and contracts 34,693.79 Sales and services of other activities 761.60 Payments to suppliers and vendors (791,311.09) Payments for scholarships and fellowships (947,028.43) Payments to TSU (188,523.42) Other receipts (payments) 1,512,068.52
Net cash provided (used) by operating activities 1,651,703.67
CASH FLOWS FROM NON-CAPITAL FINANCING ACTIVITIES
Gifts and grants received for other than capital or endowment purposes 239,056.22 Private gifts for endowment purposes 282,482.58 Net cash provided (used) by non-capital financing activities 521,538.80
CASH FLOWS FROM INVESTING ACTIVITIES
Proceeds from sales and maturities of investments 8,817,815.83 Income on investments 955,632.22 Purchase of investments (10,374,074.49) Other investing receipts (payments) 1,741.93
Net cash provided (used) by investing activities (598,884.51)
Net increase (decrease) in cash and cash equivalents 1,574,357.96 Cash and cash equivalents - beginning of year 6,936,987.87 Cash and cash equivalents - end of year (Note 20 ) 8,511,345.83$
T ennessee S tate U niversity Foundation
Supplementary Schedule of Cash Flows - Component Unitfor the Year Ended June 30, 2012
Supplementary Information
41

RECONCILIATION OF OPERATING INCOME/(LOSS) TO NET CASH PROVIDED (USED) BY OPERATING ACTIVITIES
Operating income/(loss) 528,111.26$ Adjustments to reconcile operating loss to net cash provided (used) by operating activities: Change in assets and liabilities: Receivables, net 168.80 Accounts payable 38,638.34 Other 1,084,785.27 Net cash provided (used) by operating activities 1,651,703.67$
Non-cash investing, capital, and financing transactions Unrealized gains/(losses) on investments 477,345.41
The notes to the financial statements are integral part of this statement.
42