Embed Size (px)
Citation preview

120 | Annual Report 2011-12
MANAgEMENT’S DISCUSSIoN AND ANALYSIS oF FINANCIAL CoNDITIoN AND RESULTS oF CoNSoLIDATED oPERATIoNS oF NUCLEUS SoFTwARE
ExPoRTS LTD. AND SUBSIDIARY CoMPANIESForming Part of the Consolidated Financial Statements for the year ended March 31, 2012

Annual Report 2011-12 | 121
Management’s discussion and analysis of financial condition and results of operations include forward-looking statements based on certain assumptions and expectations of future events. The Company cannot assure that these assumptions and expectations are accurate. Although the Management has considered future risks as part of the discussions, future uncertainties are not limited to the Management perceptions.
Financial statements of the Company are prepared under the historical cost convention in compliance with the requirements of the Companies Act, 1956, Generally Accepted Accounting Principles (GAAP) in India and mandatory accounting standards issued by the Institute of Chartered Accountants of India (“ICAI”). All income and expenditure iteams having a material bearing on the financial statements are recognized on accrual basis. The consolidated financial statements have been prepared in accordance with the principles and procedures for the preparation and presentation as laid under Accounting Standard 21 on “Consolidated Financial Statements” issued by the ICAI.
The Company has prepared its financials for the year, as per the Revised Schedule VI notified by Ministry of Corporate Affairs vide Notification number S.O. 447(E) dated 28 February, 2011. This has significantly impacted the disclosure and presentation made in the financial statements. Previous period/year figures also have been regrouped/ reclassified wherever necessary to make them comparable with the current period figures.
overview
The Company was incorporated on January 9, 1989 as Nucleus Software Exports Private Limited with its registered office at 33-35 Thyagraj Nagar Market, New Delhi 110 003. Subsequently in October 1994, it was converted into a Public Limited Company. In August 1995, Nucleus made an Initial Public Offer and is currently listed at National Stock Exchange of India Ltd., and Bombay Stock Exchange Ltd. In absence of any trading activity, the Company applied for voluntary delisting of shares from Madras Stock Exchange Ltd. and was granted the same w.e.f. September, 2011.
Nucleus provides software solutions to the Banking and Financial Services Industry. For over 20 years, we have developed solutions spanning from Retail Banking to Corporate Banking, Cash Management, Internet Banking and Credit Cards. FinnOneTM, the Flagship product of Nucleus Software is a comprehensive suite for Retail Banking applications comprising of modules like Customer Acquisition System, Loan Management, Delinquency and Recovery Management, Deposits and Finance Against Securities. Cash@WillTM and BankONetTM are the offerings from Nucleus Software in the area of Cash Management and Internet Banking respectively. Over the years, our committed professionals have provided solutions par excellence and with the experience and skills, we have been able to create a global footprint of clients and partners across multiple continents with multi-product, multi-service, multi-currency and multi-lingual implementations, leading to worldwide acceptability and customer satisfaction. Nucleus operates through integrated and well-networked subsidiaries in India, Japan, Netherlands, Singapore and USA and branch offices in Chennai and Mumbai in India and in London, UK and Dubai. The Singapore subsidiary has branch offices in Seoul in Korea and Manila in Philippines. These Subsidiaries/branch offices help the Company in providing front-end support to clients and explore new opportunities.
Since 1995, product development has been our forte and the Company has chosen to exclusively develop products and further add value through dedicated research and development initiatives.
Company Strengths
The Company’s business broadly consists of Development and Marketing of Software Products and Software Services for business entities in the Banking and Financial Services (BFS) vertical. With a single point focus on the banking and financial industry, the Company’s focus on product development is to build products on latest architecture & technology stack. They will have advanced feature & functionalities to support growing need of business. At Nucleus our strategy is to ultimately touch and improve lives of more and more people across the world by equipping Banks with superior technology products for managing lending operations.
The emergence of disruptive technologies such as cloud, mobility, sustainability and social networking are all adding up in making the ecosystem conducive for product development. The technology products sector in India, which for the last two decades has been dormant and overshadowed by the country’s software services industry, is on a steep growth trajectory. India is emerging as a software hub globally with product firms also now marking their presence.
The need of the hour for the Indian IT industry is to change its business model whereby it can create more value to its customers by facilitating business process transformation, using technology innovations. This paradigm shift would require IT companies to acquire in-depth understanding of their customers’ business and new technologies to serve them Better. Innovation and IP creation are the foundation of our efforts, and brick by brick we are making progress every year to provide ‘Made in India’ software products which compete globally.
We are grateful for having received various accolades, a few of them to list would be:
FinnOne• TM ranked for the fourth consecutive year as the ‘world’s No 1 Selling Lending Software Product’ (for the year 2011) and ranked fourth in global sales across all banking products by IBS Publishing, UK.
Annual Report and Accounts of the Company for the year ended •March 31, 2011 adjudged as the BEST under the Category XI – Service Sector (other than financial services sector, transport services Turn over less than ` 500 crore) of the ‘ICAI Awards for Excellence in Financial Reporting’. A GOLD SHIELD was awarded to the Company, for the fourth consecutive year.
Annual Report of the Company for the year ended March 31, 2011 •won the Platinum award under Technology-Software category and ranked fourth worldwide in the Top 100 Annual Reports in the Vision Awards by the League of American Communications Professionals (LACP), USA.
South Asian Federation of Accountants (SAFA) • adjudged Nucleus’ Annual Report as the recipient of ‘Certificate of Merit’ for the Best Presented Accounts and Corporate Governance Disclosures Award 2010 in the category ‘Communication & Information Technology’
Management’s Discussion and Analysis of Financial Condition and Results of Consolidated operations of Nucleus Software Exports Ltd. and Subsidiary Companies
Management’s Discussion and Analysis

122 | Annual Report 2011-12
Nucleus Software • ranked amongst the Top 5 Companies for Best Corporate Governance Practices in India by IR Global Rankings 2011.
Forrester recognized Nucleus as a “• global Pursuer” and stated it “regained traction in 2010”. Based on the number of deals and regions covered, Nucleus was ranked among top Banking Platform providers. Source: Global Banking Platform Deals 2010, Forrester Research, Inc., 31 March 2011.
HDFC Bank, Nucleus Software customer, won the prestigious •Celent 2010 Model Bank Award for its loan origination system, FinnOneTM.
Nucleus ranked amongst the Top 25 companies adopting •“good Corporate governance Practices” by ICSI for fourth consecutive year in 2009.
Forrester Research, a leading independent analyst firm, recognized •Nucleus Software as an industry vertical specialist in their report “Working With Tier Two Offshore Providers”.
Nucleus Software ranked amongst India’s • Top 15 Exciting Emerging Companies to Work For by Nasscom.
Nucleus Software recognized under “• Best Practices” for Performance Management System by NASSCOM, 2008.
Nucleus selected as one of • Forbes ASIA’s 200 Best Under A Billion companies, for the second consecutive year, list released in September 2008.
Nucleus Software conferred the • Best Independent Software Vendor (ISV) Partner (North India for 2008) award by IBM.
Nucleus Software awarded the “• D&B - ECgC Indian Exporters’ Excellence Award” by Dun & Bradstreet India (D&B India) and Export Credit Guarantee Corporation of India Ltd (ECGC) for the year 2007.
Nucleus Software adjudged as • one of the fastest growing companies in Asia Pacific under Deloitte Technology Fast 500 - 2007.
Nucleus Software conferred with • oracle Partner of the Year Award in Fusion Middleware category at an APAC level.
Nucleus Software awarded for being the • Fastest growing ISV in 2007 by Oracle Corporation.
Nucleus Software ranked 13th in Dataquest • Top 20 Best Employers Survey 2006. Survey was conducted by IDC-Dataquest amongst 200 IT employers across India.
A brief on the functionality of our products is given below:
FinnoneTM, the flagship product of Nucleus, is an integrated suite of applications designed to support the business offerings of Banks and Financial Services companies. FinnOneTM provides solutions for both the asset as well as the liability side of the business, core financial accounting and customer service. FinnOneTM caters to the business needs of banks, financial institutions, captive auto finance companies and retail businesses.
The suite offers the following line of products for banks and financial institutions to streamline their processes:
Customer Acquisition System (CAS) • automates and manages the complete application processing flow of retail loans, corporate loans and credit card applications. It allows online credit evaluation, and if desired, automatic credit evaluation of the application and processing till disbursement initiation. User can define the various
parameters as per the policies of the banking or financial services Company, thereby reducing the time and manpower involved in the scrutiny of applications. A variety of tools such as online calculators, activity schedulers, mailers, and contact activity planners help in improving efficiency of the acquisition process. In addition to a strong Deduplication module, CAS can also take data feeds from external agencies, such as credit bureaus and Central Banks. CAS has a robust scoring module wherein the parameters and rules, which are used by the system to generate credit scores, are maintained. With the centralized and controlled master set-up, the organizations can effectively introduce quick-to-market products and schemes to hone their competitive edge of being change leaders.
• Loan Management System (LMS) focuses on the loan servicing aspects of a retail and corporate loans business. The system supports the financial institution in billing, accrual, rescheduling or restructuring, prepayments, termination, interest and overdue calculation, classification of non-performing assets and its relevant provisioning, repossession of asset. LMS is the backbone of all customer servicing activities with respect to the loans with the objective of providing operational control. LMS has robust features pertaining to repayment from customer through various modes like cheque, auto debit or ECS. LMS also has integrated cheque printing system for printing payment of cheque’s or draft. The system supports accounting as defined by the user at various stages of loan life cycle.
• Collections Management System focuses on the tracking and management of delinquent customers. The system helps to queue up delinquent agreements cases based on severity of client risk profiles. The system then automatically allocates the cases to collectors based on user-defined logic or hierarchy. Manual allocation and reallocation of agreements is also feasible in the system. It builds customer delinquency history and also aids in the building of the defaulters’ databases. Collectors are provided with periodical work-list and contact recording facilities. The system also facilitates escalation of agreement to effectively monitor and administer the agreements.
• Islamic Financing is a an offering comprising of CAS and LMS modules designed as per Islamic/Shariah rules. It is designed with function specific modules, managing the complete finance cycle starting from the origination till after sales transactions. Islamic Financing has integrated process flow as per Islamic rules of transaction by providing dynamic user defined workflows. Islamic Financing caters to the originating and servicing requirements of finance. It supports the requirements of the Vehicle/Goods Finance (Murabaha, Ijarah), Service Ijarah (Rent, Education, Medical, Travel and Wedding), Home Finance (Murabaha, Ijarah and Istisna’a) and Tawaruq business. The product covers the entire life cycle of a finance transaction right from product definition, application processing and documentation tracking, billing and accruals to rescheduling, foreclosures and terminations.
• Customer Service Module (CSM) delivers business solutions by integrating the front and back office of banks to enable execution of a customer-centric business strategy. CSM will help its users to record all customer interactions and help provide standard services within defined timelines. The system helps its users monitor service level agreements, take care of user inaction through escalations, and instances of errors can be analyzed using root cause analysis for future remedial and preventive actions.

Annual Report 2011-12 | 123
The system also supports features such as workflow based request assignment, root cause analysis, escalations and graphical representation of data in form of dashboards.
• Collateral Management System (CMS) is pluggable component that can be integrated with any credit origination system, servicing system or any other system where collateral details are captured and various activities are performed on the captured information. CMS offers end-to-end collateral management services relevant in the lending scenario. This includes collateral acceptance, collateral maintenance, verification, valuation, lien marking, full or partial release of collateral and liquidation. The system also supports features such as multi currency handling, rule based collateral rating and collateral dedupe.
• Central Liability System (CLS) is an integrated system that collates limits and exposures from disparate source systems and provides a consolidated view of exposure limits for tracking and monitoring. These help risk manager, business managers and top management to take decisions on the level of exposures that the lending organization can take at obligor level or obligor group level and manage the product portfolio effectively. With the help of CLS, business managers and risk managers can segregate the business areas where the bank has taken more exposure which needs to be tracked or curtailed and also the areas where the bank can concentrate for increasing exposures. The system supports features such as consolidated information on credit risk & exposure for monitoring, earmarking and sub-allocation.
• Finance Against Securities (FAS) is a comprehensive solution that establishes credit lines to individuals and corporate against the pledging of financial securities like shares, mutual funds and bonds. The objective of the product is to value the collateral security provided by the customer and determine the credit limits that may be granted to a customer. The credit limits are computed based on a number of risk and exposure parameters. As the market value of the security offered is volatile in nature, the system conducts valuation at regular intervals. Deposits system caters to the requirements of the liability business of a financial institution. The system enables the banks to launch and setup term and demand deposit schemes. The system is capable of handling the lifecycle of the deposit business like account opening, financial transactions on these accounts like cash withdrawal/deposit, funds transfer, FD booking, revision, premature closure, standing instructions, tax deduction, interest accrual and account closure. The system has predefined reports to monitor the performance of the business, prepare MIS for statutory reporting to Central Bank.
• general Ledger (gL) is a double entry accounting system that comprehensively manages accounting procedures including those specific to the financial services industry. Besides chart of account maintenance, and balance sheet and P&L statement generation, it has a number of innovative features like soft closing of periods, allocation of cost centers over profit centers, budgets, profitability analysis and bank reconciliation. GL also has a strong sub module on bank reconciliation.
• Bank Reconciliation System is a tool to reconcile Bank accounts maintained by business units with its bankers. The system helps in identification of differences in transaction between bank statement and books. It reduces risk of fraud, enables credit to vendor/customers on time, shows the true and fair position of books of accounts at any given point of time.
• Forecaster System is a web-based data-mining tool that involves access to and manipulation of business data available with the organization. It is used to identify patterns and relationships in data and do a case-based reasoning. Based on this reasoning, it creates models that can be used to visualize the situation and hence make informed decisions and do predictive analysis. It uses advanced statistics and data mining algorithms such as decision tree, logistic and multiple linear regressions. The system provides an end to end solution to implement data mining projects by using Cross Industry Standard process (CRISP) for data mining.
• PowerPay is an effective tool to enable bank and finance companies to calculate the commissions and other payouts payable to various service providers. The system takes data from various source systems and calculates the payouts based on various parameters defined. Before calculating the payout, it provides facility to get the data validated from respective business partners. It provides facility of handling disputes raised by any business partner. It also facilitates claw back of payouts already given.
• Lead Management System is an effective tool for sales and marketing management. The Lead Management System is an independent module providing tools for effective and systematic customer acquisition process by handling the lead throughout its lifecycle. The system will automate the process of lead capture, tracking, follow up, and closure. The system supports dedupe functionality, prospect/lead curing, and reference management. The system provides a flexible rule based lead classification and allocation process.
• Asset Based Securitization is a module which helps the NBFC/ Bank to securitize or selloff their lending portfolio. It is aimed at providing the users with a simple and comprehensive module which helps in bringing operational and system control in the securitization process of the NBFC / Bank. The system helps in pool generation on the basis of filter criteria, pool upload and download, partial or full release of pool, buyback of securitized pool etc. The system also takes care of the accounting for securitized pool.
Cash@willTM is a web-enabled comprehensive solution of cash management that caters to Collections, Payments and Liquidity Management aspects of Cash Management Business. Cash@WillTM suite offers the following line of products for banks to streamline their processes:
• Cash@will – Collections: Collection Services in Cash@WillTM
undertake the overall Receipts Management for the Corporate Customer. The collections can be instrument based (Cheque / Draft / PDC), electronic (direct debit) or Cash. It facilitates multiple points of information capture and supports the centralized model of operations as well as the decentralized model. The models can be extended to logistics providers also for encapsulating the information processed / captured by the outsourced Data Entry teams as well. Further, it also provides the integration options with the Clearing House, ACH, Correspondent Bank, etc to reduce the information capture efforts.
• Cash@will – Payments: Payments Module of Cash@WillTM
is a value enhancing payments solution that enables banks to handle low-value and high value payments of corporate like vendor payments, salaries, tax payments, dividends and interest payments. Payment solution is capable of managing bulk physical processing as well as electronic payments. It provides multiple
Management’s Discussion and Analysis

124 | Annual Report 2011-12
payment capabilities like – inter bank, intra-bank, domestic and overseas. The Payment Module enables the bank to meet the fund outflow needs of an organization by streamlining the operations and increasing efficiency. Payments module offers the customer paper based and electronic payments. It offers multiple initiation modes (standing Instructions, Payment Entry or File upload), Instrument designing, Inventory management, MICR or non MICR printing, Signatory Management, Logo Printing, Printer Watch, Online Core banking interface.
• Cash@will – Liquidity Management: Liquidity Management is the art of managing the Company’s most valuable asset, cash. Liquidity management tools and techniques focus on minimizing the external borrowings, thereby reducing the interest expense, and simultaneously investing the excess funds to maximize the income.
BankonetTM the internet banking front end interfaces with the bank backend processors to provide the customer with a wide range of services for which he is eligible and has subscribed for. Key services are for cash management, reports and account balances.
New products Finnone ProTM gold and Finnone - Transaction Banking System are in development phase and our R&D efforts are being dedicated to formalize these products.
FinnOneTM is flagship product for the lending business from Nucleus Software. It was developed more than a decade back to serve lending needs of the BFS sector. Cash@WillTM, our existent product was developed about a decade ago to serve Cash Management needs of the Banks while serving their corporate customers. In past few years technology & business needs have changed rapidly. To mitigate the risk of obsolescence and align with market needs, the Company decided to initiate new product development; Finnone ProTM gold in the lending vertical and Finnone - Transaction Banking System in the Cash Management verticals of the banking space.
The focus of this new product development is to build product on latest architecture & technology stack. In addition new products will have advanced feature & functionalities to support growing needs of business.
Figure 1
group Structure
Nucleus’ operations are managed through Parent Company based in India and well-networked subsidiaries in India, Japan, Netherlands, Singapore and USA. All major software development takes place in development centres in India and Singapore; the subsidiaries above and branch offices in India, Korea, Philippines, UAE and UK provide an effective front-end of customer acquisition and servicing. At the Parent Company level, global responsibilities for Software Delivery, Quality Assurance, Product and Account Management, Sales and Marketing, Finance and Human Resources have been defined to achieve the objectives.
The Board took some major decisions during the year to reorganize the Company’s top management team, necessary to take a major leap forward. Critical functions of the organisation were strengthened with the hiring of senior members in Global Delivery and Product Development.
Another major initiative during the year was the formation of Review Committee; as a Committee of the Board with the objective of reviewing the operations and systems of the Company. The Committee conducted weekly reviews with the Management and also made recommendations to the Board in respect of required changes to policies, procedures, budget allocations, financial management and operational management. Through these efforts we continue to build a robust Brand Nucleus with business from all global markets, creation of an effective distribution network through partnership’s, alliances and acquisitions, seamless and high quality delivery with high customer satisfaction rating.
FINANCIAL PERFoRMANCE
Financial statements of the Company are prepared under the historical cost convention in compliance with the requirements of the Companies Act, 1956, the Generally Accepted Accounting Principles (GAAP) in India and mandatory accounting standards issued by the Institute of Chartered Accountants of India (“ICAI”). The Company has six subsidiary Companies, all of which are wholly-owned subsidiaries.The Company discloses standalone audited financial results on a quarterly and annual basis, consolidated unaudited financial results on a quarterly basis and consolidated audited financial results on an annual basis. The financial results of the Company have been discussed in this report in two parts:
Nucleus Software Exports Limited (Consolidated) including i) performance of subsidiaries of Nucleus Software, discussed in this chapter. This consolidated presentation is more relevant for understanding the overall performance of the group especially as intercompany transactions are eliminated being contra.
Nucleus Software Exports Limited (Standalone) which excludes ii) the performance of subsidiaries of the Company, has been discussed in the earlier part of this Annual Report.
The Company has prepared its financials for the year, as per the Revised Schedule VI notified by Ministry of Corporate Affairs vide Notification number S.O. 447(E) dated 28 February, 2011. This has significantly impacted the disclosure and presentation made in the financial statements. Previous period/year figures also have been regrouped/ reclassified wherever necessary to make them comparable with the current period figures.
Salient features that differentiate these two new products are:
J2EE technologySOA & multi-layer architectureDatabase independenceDesign to support multi-entity Support for Gold & Educational loans Support for Fleet financeHooks to plug-in standard workflow enginePolicy frame work with factory supplied defaultValue dated transactionOn-line process & bulk processingHigh performance & low bandwidth usage

Annual Report 2011-12 | 125
The consolidated financial results are as below:
For the Year Ended March 31, 2012 % of Revenue 2011 % of Revenue growth (%)
Revenue From operations 282.25 100.00 270.48 100.00 4.35
Expenses
a) Employee benefit expense 157.08 55.65 150.74 55.73 4.21
c) Travel expenditure 19.54 6.92 17.72 6.55 10.27
b) Finance cost (Bank charges) 0.33 0.12 0.31 0.11 6.45
e) Other expenses 69.75 24.71 71.23 26.33 (2.08)
Total Expenses 246.70 87.40 240.00 88.73 2.79
operating Profit (EBITDA) 35.55 12.60 30.48 11.27 16.63
Depreciation 7.45 2.64 9.28 3.43 (19.73)
operating Profit after Interest and Depreciation 28.10 9.96 21.20 7.84 32.55
Other Income 16.87 5.98 9.40 3.48 79.47
Foreign Exchange Gain/ (Loss) 3.34 1.18 (0.74) (0.27) NA
Profit Before Tax 48.31 17.12 29.86 11.04 61.79
Taxation
– Withholding Taxes 0.92 0.33 2.69 0.99 (65.80)
– Current (Net of MAT credit entitlement) 11.45 4.06 2.90 1.07 NA
– Other taxes 0.60 0.21 (2.07) (0.77) NA
Profit After Tax 35.34 12.52 26.34 9.74 34.17
Revenue from operations
Our revenues from software development comprise of income from time and material and fixed price contracts. Revenue from time and material contracts is recognised as the services are rendered and revenue from fixed price contracts comprise of sale of license, related customisation and implementation and is recognised in accordance with the output method based on percentage completion. Revenue from annual technical service contracts is recognised on a pro rata basis over the period in which such services are rendered.
We witnessed year on year growth driven by good product sales and successful implementations across locations. During the year, the total revenue from operations is ` 282.25 crore, registering a growth of 4.35 % over ` 270.48 crore, total revenue for the previous year.
Revenue from Products
We are a Product Company and derive most of our revenues from Products and related services, categorized under revenue from “Products”. It comprises of license fees, revenue from customization and implementation of products and post-production maintenance support. Product revenue for the year is ` 204.99 crore, 72.63 % of the total revenue, which is an increase of 5.90 % over Product revenue of ` 193.57 crore, 71.57% of total revenue, in the previous year.
Revenue from Projects and Services
Software services rendered by the Company, classified under this segment, typically consist of development of software to meet specific customer requirements. These services consist of application development & maintenance, testing, consulting and infrastructure management services with a strong banking domain focus. Revenue from Software projects and services has grown marginally for the year to ` 77.26 crore, 27.37% of the total revenue for fiscal 2012 against ` 76.91 crore constituting 28.43% of the total revenue for fiscal 2011.
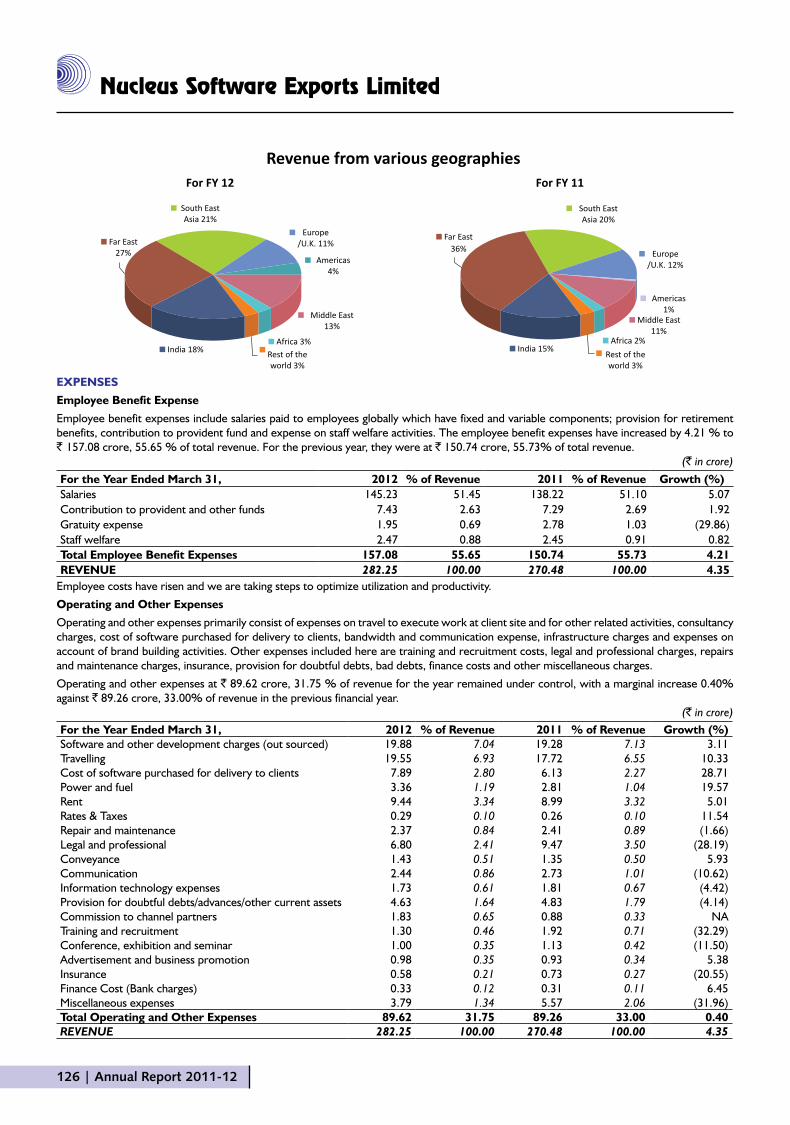
Revenue from Various geographies
Your Company is incorporated in India, caters to customers situated all across the globe, and hence significant part of the revenue is derived from international sales. The graph below presents a geography-wise distribution for the year as well as the previous year.
(` in crore)
Management’s Discussion and Analysis
126 | Annual Report 2011-12
ExPENSES
Employee Benefit Expense
Employee benefit expenses include salaries paid to employees globally which have fixed and variable components; provision for retirement benefits, contribution to provident fund and expense on staff welfare activities. The employee benefit expenses have increased by 4.21 % to ` 157.08 crore, 55.65 % of total revenue. For the previous year, they were at ` 150.74 crore, 55.73% of total revenue.
(` in crore) For the Year Ended March 31, 2012 % of Revenue 2011 % of Revenue growth (%)Salaries 145.23 51.45 138.22 51.10 5.07 Contribution to provident and other funds 7.43 2.63 7.29 2.69 1.92 Gratuity expense 1.95 0.69 2.78 1.03 (29.86)Staff welfare 2.47 0.88 2.45 0.91 0.82 Total Employee Benefit Expenses 157.08 55.65 150.74 55.73 4.21 REVENUE 282.25 100.00 270.48 100.00 4.35
Employee costs have risen and we are taking steps to optimize utilization and productivity.
operating and other Expenses
Operating and other expenses primarily consist of expenses on travel to execute work at client site and for other related activities, consultancy charges, cost of software purchased for delivery to clients, bandwidth and communication expense, infrastructure charges and expenses on account of brand building activities. Other expenses included here are training and recruitment costs, legal and professional charges, repairs and maintenance charges, insurance, provision for doubtful debts, bad debts, finance costs and other miscellaneous charges.
Operating and other expenses at ` 89.62 crore, 31.75 % of revenue for the year remained under control, with a marginal increase 0.40% against ` 89.26 crore, 33.00% of revenue in the previous financial year.
(` in crore) For the Year Ended March 31, 2012 % of Revenue 2011 % of Revenue growth (%)Software and other development charges (out sourced) 19.88 7.04 19.28 7.13 3.11 Travelling 19.55 6.93 17.72 6.55 10.33 Cost of software purchased for delivery to clients 7.89 2.80 6.13 2.27 28.71 Power and fuel 3.36 1.19 2.81 1.04 19.57 Rent 9.44 3.34 8.99 3.32 5.01 Rates & Taxes 0.29 0.10 0.26 0.10 11.54 Repair and maintenance 2.37 0.84 2.41 0.89 (1.66)Legal and professional 6.80 2.41 9.47 3.50 (28.19)Conveyance 1.43 0.51 1.35 0.50 5.93 Communication 2.44 0.86 2.73 1.01 (10.62)Information technology expenses 1.73 0.61 1.81 0.67 (4.42)Provision for doubtful debts/advances/other current assets 4.63 1.64 4.83 1.79 (4.14)Commission to channel partners 1.83 0.65 0.88 0.33 NATraining and recruitment 1.30 0.46 1.92 0.71 (32.29)Conference, exhibition and seminar 1.00 0.35 1.13 0.42 (11.50)Advertisement and business promotion 0.98 0.35 0.93 0.34 5.38 Insurance 0.58 0.21 0.73 0.27 (20.55)Finance Cost (Bank charges) 0.33 0.12 0.31 0.11 6.45 Miscellaneous expenses 3.79 1.34 5.57 2.06 (31.96)Total operating and other Expenses 89.62 31.75 89.26 33.00 0.40 REVENUE 282.25 100.00 270.48 100.00 4.35

Annual Report 2011-12 | 127
Software and other development charges relate to outsourced •work for software development and is higher than previous year by 3.11%.
Cost of software purchased for delivery to clients has increased •by 28.71% for the year against the previous year.
Provisions for doubtful debts include bad debts written off and •provision for all invoices outstanding for a period of 365 days or more and those invoices which are considered doubtful based on the management’s perception of risk of collection as per the Company’s policies. This figure is ` 4.63 crore against ` 4.83 crore previous year.
Finance cost includes bank charges and fee for issuance of bank •guarantees to customers.
We have taken a number of steps to improve our operational efficiency and there has been a very strong control and focus on costs.
operating Profit (EBITDA)
Operating Profit improved to ` 35.55 crore, 12.60 % of revenue against ` 30.48 crore, 11.27 % of revenue in the previous year. We achieved operating margin growth in rupee terms with favorable exchange rate movement, with Dollar revenues remaining flat.
Depreciation
Depreciation on fixed assets was ` 7.45 crore, 2.64 % of revenue for the year against ` 9.28 crore, 3.43% of revenue in the previous year.
other Income
Other Income represents income received in the form of dividends from non-trade investments, interest on fixed deposits, capital gains on the sale of current investments. All these investments are in India.
(` in crore)
For the Year Ended March 31, 2012 2011On Investments Capital Gain- Mutual Funds 1.02 - Dividend on investment in Mutual fund units 8.88 6.13 Interest Income 3.94 2.60 Foreign Exchange differences on consolidation 0.20 (0.11)Provisions written back 0.84 0.11 Others 1.99 0.67 Total 16.87 9.40
Other income for the year is ` 16.87 crore, against ` 9.40 crore in the previous year.
The Company maintained a prudent investment mix by investing funds into both Mutual Funds and Fixed Deposits. The Company had an investment of ` 104.13 crore in Mutual Funds and ` 70.69 crore in Fixed Deposits as on March 31, 2012, against ̀ 125.76 crore in Mutual Funds and ` 40.37 crore in Fixed Deposits as on March 31, 2011.
Foreign Exchange gain / (Loss)
Foreign Exchange Gain (Loss) includes gain (loss) from translation of current assets and liabilities at quarter end rates, those arising from realization/payments of receivables/payables and from cancellation of options and forward contracts, respectively. During the year, the Company had a foreign exchange gain of ` 3.34 crore against a loss of ` 0.74 crore for the previous year.
Foreign Exchange continues to be volatile, as depicted in the below mentioned chart.
With risk appetite varying and the Dollar fluctuating inversely with higher risk appetite, most of the global currencies remained under pressure against the US Dollar. After a rather eventful year the Indian Rupee ended the year on historically the lowest year ending level of 50.88 against the US $, weakened by 14 percent, against 44.68 on March 31, 2011.
The Company follows a well-defined policy of hedging close to receivables through Forward Contracts which are designated as Highly Probable forecast transactions. The Company has a conservative approach and does not speculate in foreign currency markets. Forwards are held to maturity and regular reporting and monitoring systems are in place including quarterly updates to the Audit Committee. In terms of foreign currency hedges, we had on March 31, 2012, 12.00 million US dollars of forward contracts at an average rate of 51.87, designated as highly probable forecast transactions. There is a mark-to-market loss of ` 0.09 crore reflected in the hedging reserve in balance sheet. Currency-wise revenues for the year along with a comparison with the previous year is as follows:
For the Year Ended March 31, 2012 2011Indian Rupee ` 18.12% 15.11%Japanese Yen 7.16% 6.40%Singapore $ 8.38% 8.98%US $ 61.66% 64.40%Malaysian Ringgit 1.53% 2.04%South Korean Won 1.17% 1.18%United Arab Emirates Dirham – 0.25%Euro 1.98% 1.64%ToTAL 100.00% 100.00%
Taxation
It represents provision for corporate & income taxes in various countries where the Company and subsidiaries operate.
(` in crore)
For the Year Ended March 31, 2012 2011Withholding taxes charged off 0.92 2.69 Current Tax 11.45 6.43 MAT Credit Entitlement – (3.52)Deferred Tax Credit (net) (0.30) (2.24)Earlier Year Tax 0.90 0.16 Total 12.97 3.52
Management’s Discussion and Analysis

128 | Annual Report 2011-12
Total effective tax for the year is 26.85% of Profit Before Tax, in comparison to 11.78% of Profit Before Tax for the previous year. The tax holiday enjoyed by units in STP/ FTZ under Section 10A of the IT Act expired on April 1, 2012, which resulted in an increase in tax implication for all our units in India w.e.f this financial year 2011-12. During the year, a unit of the Company commenced operations from the SEZ in Jaipur. SEZ’s in India are eligible for tax exemptions and a host of other fiscal benefits, incentives and concessions both from the State and Union Government.
Minimum Alternate Tax at 18.50% (plus applicable surcharge and cess) of book profits was made applicable to SEZ Units and SEZ Developers vide Finance Act 2011. Company may claim set off of taxes paid under MAT against taxes payable under normal provisions in future years, but it is possible that the set off may not be available in its entirety. In such a scenario, taxes paid under MAT would become a cost for the Company. Further, Dividend Distribution Tax at 15% (plus applicable surcharge and cess) has also been made applicable to SEZ Developers. These developments have adversely impacted the prospective investments in the SEZ scheme.
Profit After Tax
Our profit after tax for the year is ` 35.34 crore, 12.52% of revenue, against ` 26.34 crore, 9.74% of revenue, during the previous year.
Overall revenue growth is critical for meeting our strategic objectives, and we are conscious of the need to achieve the same. We would continue with our major emphasis on increasing revenue growth coupled with higher productivity to generate better margins. Capturing greater market share in products would also yield better realizations. Emerging markets across the world will continue to provide stability and growth would be led by larger engagements and value offerings.
Share Capital
Share Capital of the Company consists of Equity Share Capital. The paid-up share capital as on March 31, 2012 is 32,383,454 equity shares of ̀ 10 each as against 32,382,524 equity shares of ̀ 10 each as on March 31, 2011. The increase in the paid-up share capital of the Company during the year has been due to allotment of 930 shares on exercise under Employee Stock Option Plan 2005.
Subsidiaries
The Company has six wholly owned subsidiary companies, all over the world. There is also a step down subsidiary at Singapore. As 100% of the Share Capital of the Subsidiaries is held by Nucleus Software Exports Limited and nominees; on consolidation of accounts, these amounts are contra with investments in Subsidiaries amounts in the accounts of the Parent Company. Paid-up Share Capital of the Subsidiaries as on March 31, 2012 is as per the below table.
Name of Subsidiary Company
Currency
As at March 31, 2012 As at March 31, 2011
In foreign Currency
Eqv. `in crore
In foreign Currency
Eqv. `in crore
Nucleus Software Solutions Pte. Ltd., Singapore 625,000 equity shares of S$ 1 each
SgD 625,000 1.63 625,000 1.63
Nucleus Software Inc., USA 1,000,000 shares of US$ 0.35 cents each
USD 350,000 1.63 350,000 1.63
Nucleus Software Japan Kabushiki Kaisha, Japan 200 equity shares of JPY 50,000 each
JPY 10,000,000 0.41 10,000,000 0.41
VirStra i-Technology Services Ltd., India 1,000,000 equity shares of ` 10 each
INR – 1.00 – 1.00
Nucleus Software Netherlands B.V., Netherlands 4,000 equity shares of Euro 100 each
Euro 400,000 2.42 400,000 2.42
Nucleus Software Limited, India 10,000,000 equity shares of ` 10/- each
INR – 10.00 – 10.00
Step down Subsidiary of Nucleus Software Exports Ltd.
VirStra i-Technology (Singapore) Pte. Ltd., Singapore 200,000 equity shares of S$ 1 each
SgD 200,000 0.56 200,000 0.56
The profits/losses of the Subsidiary Companies are fully reflected in consolidated accounts of the Company and Subsidiaries.
As per General Circular No: 2 /2011 issued by the Government of India, Ministry of Corporate Affairs, a general exemption was provided to Companies for attaching the Directors’ Report, Balance Sheet and Profit and Loss Account of all subsidiaries to its balance sheet, subject to fulfilling certain conditions as stipulated in the circular. Your Company complies with those conditions and, therefore, has been
generally exempted by the Central Government from attaching detailed accounts of the subsidiaries, and accordingly, the financial statements of the subsidiaries are not attached in the Annual Report.
For providing information to Shareholders, the annual accounts of these subsidiary Companies along with related information are available for inspection during business hours at the Company’s registered office and at the concerned subsidiary’s offices.

Annual Report 2011-12 | 129
Reserves and Surplus
The movement in the components of reserves and surplus is as below:
(` in crore)
opening Balance as on April 1,
2011
Additions/ (Deletions) during the
year
Closing Balance as on March 31, 2012
General Reserve 75.68 3.65 79.33 Securities Premium 2.17 0.02 2.19 Capital Reserve 0.67 0.20 0.87 Employee Stock Options
0.62 (0.62) -
Foreign Currency Translation Reserve
5.39 2.36 7.75
Hedging Reserve 1.62 (1.71) (0.09)Profit and Loss Account Balance
169.41 22.28 191.69
Total 255.56 26.18 281.74
Fixed Assets
As at March 31, 2012, gross block of fixed assets including investment in technology assets is ` 119.22 crore (` 110.32 crore as on March 31, 2011).
(` in crore)
As at March 31, 2012 2011 Inc/Dec (%)gross BlockFreehold land 0.34 0.33 3.03 Leasehold land 18.78 18.78 –Leasehold improvement 1.27 1.27 –Building 28.14 24.34 15.61 Office and other equipment 18.83 16.94 11.16 Computers 31.16 29.69 4.95 Vehicles 1.51 1.68 (10.12)Furniture and fixtures 5.15 4.48 14.96 Software 14.04 12.81 9.60 Total 119.22 110.32 8.07 Less; accumulated depreciation 70.31 63.25 11.16 Net Block 48.91 47.07 3.91 Add: Capital Work In Progress – 2.53 NA Net Fixed Assets 48.91 49.60 (1.39)
There are fresh additions of ̀ 9.42 crore during the year, consisiting of ` 3.79 crore in Nucleus Software Ltd. on construction of SEZ unit in Jaipur and ` 2.54 crore in technology assets by the Parent Company. The net fixed assets after depreciation are ` 48.91 crore as on March 31, 2012 against ` 49.60 crore as on March 31, 2011.
Current Investments and Bank Balances
Our capital requirements are completely financed by internal accruals. Your Company continues to remain debt-free and we believe that cash generated from operations and reserves and surplus are sufficient to meet our obligations and requirements towards capital expenditure and working capital requirements.
As of March 31, 2012 the cash and bank balances stood at ` 92.19 crore (` 61.75 crore on March 31, 2011) and current investments in liquid schemes and Fixed Maturity Plans of mutual funds were ̀ 104.13 crore (` 125.76 crore on March 31, 2011).
Total cash and cash equivalents are thus at ` 196.32 crore on March 31, 2012 against ` 187.51 crore as on March 31, 2011.
(` in crore)
As at March 31, 2012 2011
Balances with Bank
In Current Accounts 21.50 21.38
In Fixed Deposit Account 70.69 40.37
Investments in Mutual Funds 104.13 125.76
Total 196.32 187.51
As a part of the financial policies, the Company believes in maintaining high level of liquidity as it provides immense support against contingencies and uncertainties.
Complete details of Bank Balances and Fixed Deposits of the Company are given below:
(` in crore)
As at March 31, 2012 2011
Balances with Banks
In Current Accounts in India
Citi Bank 0.43 0.18
Citi Bank – EEFC accounts in US dollar 1.94 6.24
DBS Bank 0.10 0.01
HDFC Bank – EEFC accounts in US dollar 0.76 0.26
HDFC Bank 0.18 0.90
HDFC Bank – Unclaimed dividend accounts 0.18 0.14
HSBC Bank – Unclaimed dividend accounts 0.02 0.03
ICICI Bank 0.07 0.06
State Bank of India 0.02 0.10
In Current Accounts in overseas locations
Citibank UAE 0.11 0.13
Citibank UK 0.08 0.10
Citibank Spain 0.08 –
Citibank Singapore 5.72 7.26
Citibank Korea 0.90 0.98
Citibank Philippines 0.13 0.05
PNC Bank USA 4.46 0.89
Bank of Tokyo Mitshubishi - Japan 0.91 0.62
Shinsei Bank Japan 2.48 1.11
Citibank Japan 1.32 2.05
Management’s Discussion and Analysis

130 | Annual Report 2011-12
As at March 31, 2012 2011
Citibank Singapore 0.06 0.07
Citibank Netherlands. 1.55 0.20
Total Balances in Current Accounts 21.50 21.38
In Fixed Deposit Accounts
HDFC Bank 0.10 0.09
Citi Bank 0.44 0.70
Punjab National Bank 10.01 –
State Bank of India 0.22 –
Corporation Bank 19.90 –
Bank of India 20.02 20.02
State Bank of Travancore 20.00 16.59
Syndicate Bank – 1.98
State Bank of Bikaner & Jaipur – 0.99
Total Balances in Fixed Deposit Accounts 70.69 40.37
Total Bank Balance & Fixed Deposits 92.19 61.75
Net cash flow from operating activities before working capital changes is ` 43.95 crore for the financial year against ` 35.89 crore in the previous year. After considering working capital changes, operating cash flow is ` 13.63 crore against ` 31.74 crore.
Operating cash flow is today considered a better measure of operations of the Company than the net profits as it measures the cash generated by the operations and there is a decline this year with lower operating profitability.
To summarise the Company’s liquidity position, given below are few ratios based on consolidated figures:
As at March 31, 2012 2011
Operating cash flow as % of revenue 15.57 13.27
Days of sale receivable 114 63
Cash and Equivalents as % of assets 47.99 51.44
Cash and Equivalents as % of revenue 69.55 69.32
Current investments as % of assets 25.45 34.50
Current investments as % of revenue 36.89 46.50
other Long-Term Investments
Other long term investments comprise of investment in 250,000 Equity Shares of face value of ̀ 10/- each in Ujjivan Financial Services Private Ltd., a Company promoted in the area of micro finance by a group of experienced professionals with banking and technology background.
Trade Receivables
Our trade receivables (net of provision) as on March 31, 2012 are ` 87.83 crore, against ` 46.90 crore as on March 31, 2011. In the opinion of Management, all the trade receivables are recoverable. We have modified the grouping of receivables this year and have reported as below :
(` in crore)
As at March 31, 2012 2011Gross Receivables 87.83 46.90 Advances from customers and unearned income 20.72 14.55Net receivables 67.11 32.35
In 2011 and in earlier years, we reported net receivables. In 2012, we have reported gross receivables and moved customer advances and unearned income under current liabilities and also regrouped 2011 figures. Days of sales receivables (DSR) is higher at 114 days as on March 31, 2012 against 63 days on March 31, 2011.
The age profile of the debtors (net of provision) is given below:
As at March 31, 2012 2011Less than 6 months 97.64% 91.86%More than 6 months 2.36% 8.14%
The Company has a policy of providing for all invoices outstanding for a period of 365 days or more and for those invoices which are otherwise considered doubtful based on the Management’s perception of risk of collection.
Loans and Advances
In accordance with the revised Schedule VI notified by MCA, Loans and Advances have been classified into long-term and short-term based on their period of realization.
(` in crore)
As at March 31, 2012 2011Long term Loans and advances Security deposits 2.87 2.60 Advance income tax 10.91 13.24 Prepaid expenses 0.66 1.26 MAT credit entitlement 4.91 6.51 Staff Loans 0.61 0.25 Capital advances 0.01 0.30 Total 19.97 24.16 Short term Loans and advances Prepaid expenses 3.21 1.44 Supplier advances 1.74 1.43 MAT credit entitlement 2.43 5.50 Employee advances 2.16 1.17 Others 1.78 3.83 Total 11.32 13.37 Total Loans and Advances 31.29 37.53
(` in crore)
Annual Report 2011-12 | 131
Management’s Discussion and Analysis
Security Deposits, utilised primarily for hiring of office premises and staff accommodation, amounts to ` 2.87 crore as on March 31,2012 (` 2.60 crore as on March 31, 2011).
Advance income tax is ` 10.91 crore as on March 31, 2012 (` 13.24 crore as on March 31, 2011)
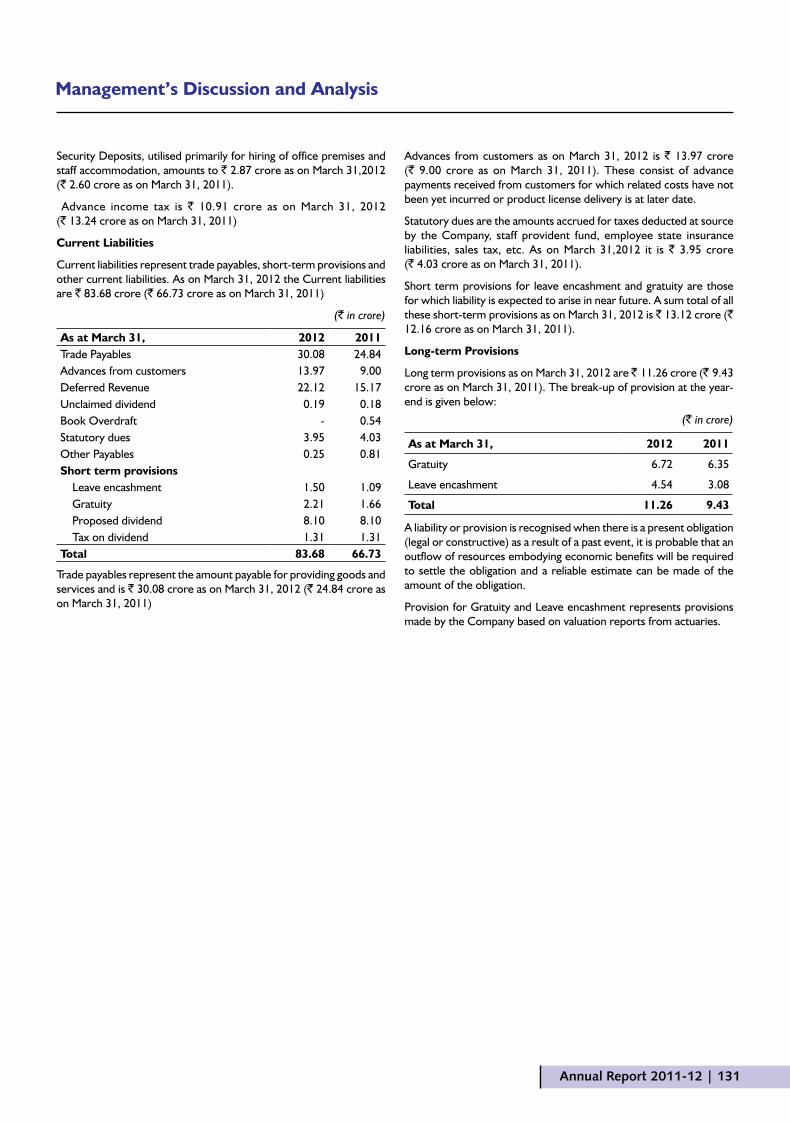
Current Liabilities
Current liabilities represent trade payables, short-term provisions and other current liabilities. As on March 31, 2012 the Current liabilities are ` 83.68 crore (` 66.73 crore as on March 31, 2011)
(` in crore)
As at March 31, 2012 2011Trade Payables 30.08 24.84 Advances from customers 13.97 9.00 Deferred Revenue 22.12 15.17 Unclaimed dividend 0.19 0.18 Book Overdraft - 0.54 Statutory dues 3.95 4.03 Other Payables 0.25 0.81 Short term provisions Leave encashment 1.50 1.09 Gratuity 2.21 1.66 Proposed dividend 8.10 8.10 Tax on dividend 1.31 1.31 Total 83.68 66.73
Trade payables represent the amount payable for providing goods and services and is ` 30.08 crore as on March 31, 2012 (` 24.84 crore as on March 31, 2011)
Advances from customers as on March 31, 2012 is ` 13.97 crore (` 9.00 crore as on March 31, 2011). These consist of advance payments received from customers for which related costs have not been yet incurred or product license delivery is at later date.
Statutory dues are the amounts accrued for taxes deducted at source by the Company, staff provident fund, employee state insurance liabilities, sales tax, etc. As on March 31,2012 it is ` 3.95 crore (` 4.03 crore as on March 31, 2011).
Short term provisions for leave encashment and gratuity are those for which liability is expected to arise in near future. A sum total of all these short-term provisions as on March 31, 2012 is ` 13.12 crore (` 12.16 crore as on March 31, 2011).
Long-term Provisions
Long term provisions as on March 31, 2012 are ` 11.26 crore (` 9.43 crore as on March 31, 2011). The break-up of provision at the year-end is given below:
(` in crore)
As at March 31, 2012 2011
Gratuity 6.72 6.35
Leave encashment 4.54 3.08
Total 11.26 9.43
A liability or provision is recognised when there is a present obligation (legal or constructive) as a result of a past event, it is probable that an outflow of resources embodying economic benefits will be required to settle the obligation and a reliable estimate can be made of the amount of the obligation.
Provision for Gratuity and Leave encashment represents provisions made by the Company based on valuation reports from actuaries.