Embed Size (px)
Citation preview
PTT Public Company Limited 1
Q3/2014
Management’s Discussion and Analysis (MD&A) and operating results for the three-month and
nine-month periods ended September 30, 2014
Economic Overview in the third quarter of 2014
The world economy in the third quarter (Q3/2014) expanded at a slower pace than the second quarter of
2014 (Q2/2014) due to an uneven recovery continued in advanced economies. The US economy continued to
grow so the Federal Reserve (Fed) decided, in September, to taper its Quantitative Easing program (QE) to $US
15 billion per month. Meanwhile, the euro economy weakened especially from domestic consumption and
investment. In addition, the inflation continued to decline amidst growing concerns that the economy could face
deflation risk. Thus, the European Central Bank (ECB) stimulated the economy by cutting the policy interest rate.
Moreover, activities in developing and emerging economies continued to slow. The Chinese economy was
affected by a sluggish property market and a weakness in domestic consumption and investment. The Russian
economy was affected by geopolitical tensions and sanctions from various countries. Thus, the International
Monetary Fund (IMF), in October 2014, projected the world economy to grow 3.3%, decreasing from its 3.4%
projection in July.
According to the International Energy Agency (IEA) in September 2014, global oil demand in Q3/2014
projected at 93.3 million barrels per day (MMBD), higher than 91.6 and 92.5 MMBD seen in Q2/2014 and the third
quarter of 2013 (Q3/2013) respectively, caused by an increase in demand from both OECD and Non-OECD
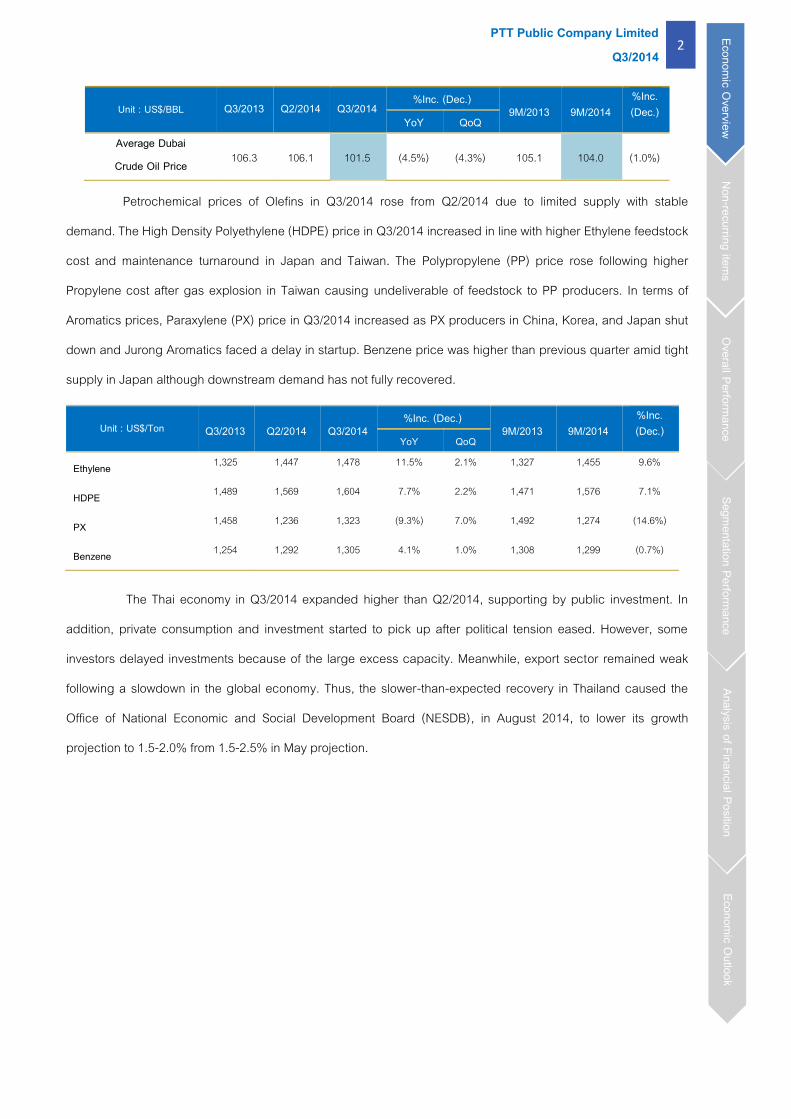
countries. However, average Dubai oil price in Q3/2014 was US$101.5 per barrel, plunging from US$106.1 and
US$106.3 per barrel seen in Q2/2014 and Q3/2013 respectively, due to additional supply from Non-OPEC, driven
by the US production. In addition, a surge in OPEC crude oil production (Call on OPEC) to over 30 MMBD level
resulted from Libyan oil output has been resumed. Petroleum product prices in the Singapore spot Market in
Q3/2014 decreased from those in Q2/2014, in line with fallen crude oil price. The average gasoline octane 95
price in Q3/2014 declined due largely to additional supply from US, Middle East, and China. Diesel price dropped
from lower demand in Indian during rainy season. Moreover, there were additional supply from Vietnam and China
as well as ample Singapore diesel inventories. The average fuel oil price fell, however, fuel oil crack spread was
improved from previous quarter. The reason behind was that strong bunker and power generator demand had the
positive effect on fuel oil. Moreover, low Iranian exports caused by its rising domestic use for power plant was
also supportive.
แนวโน้ม
สถาน
การณ
์เศรษ
ฐกิจ
วิเคร
าะห์ฐ
านะก
ารเงิน
ผลกา
รด าเนิน
งานร
ายกลุ่
มธุรกิ
จ ภา
พรวม
ผลกา
รด าเนิน
งาน
เหตุก
ารณ์ส า
คัญ
ภาวะเศรษ
ฐกิจ
แนวโน้ม
สถาน
การณ
์เศรษ
ฐกิจ
ผลกา
รด าเนิน
งานร
ายกลุ่
มธุรกิ
จ ภา
พรวม
ผลกา
รด าเนิน
งาน
เหตุก
ารณ์ส า
คัญ
ภาวะเศรษ
ฐกิจ
Economic Overview
Non-recurring items
Overall Performance Segm
entation Performance Analysis of Financial Position
Economic Outlook
PTT Public Company Limited 2
Q3/2014
Unit : US$/BBL Q3/2013 Q2/2014 Q3/2014 %Inc. (Dec.)
9M/2013 9M/2014 %Inc. (Dec.)
YoY QoQ Average Dubai
Crude Oil Price 106.3 106.1 101.5 (4.5%) (4.3%) 105.1 104.0 (1.0%)
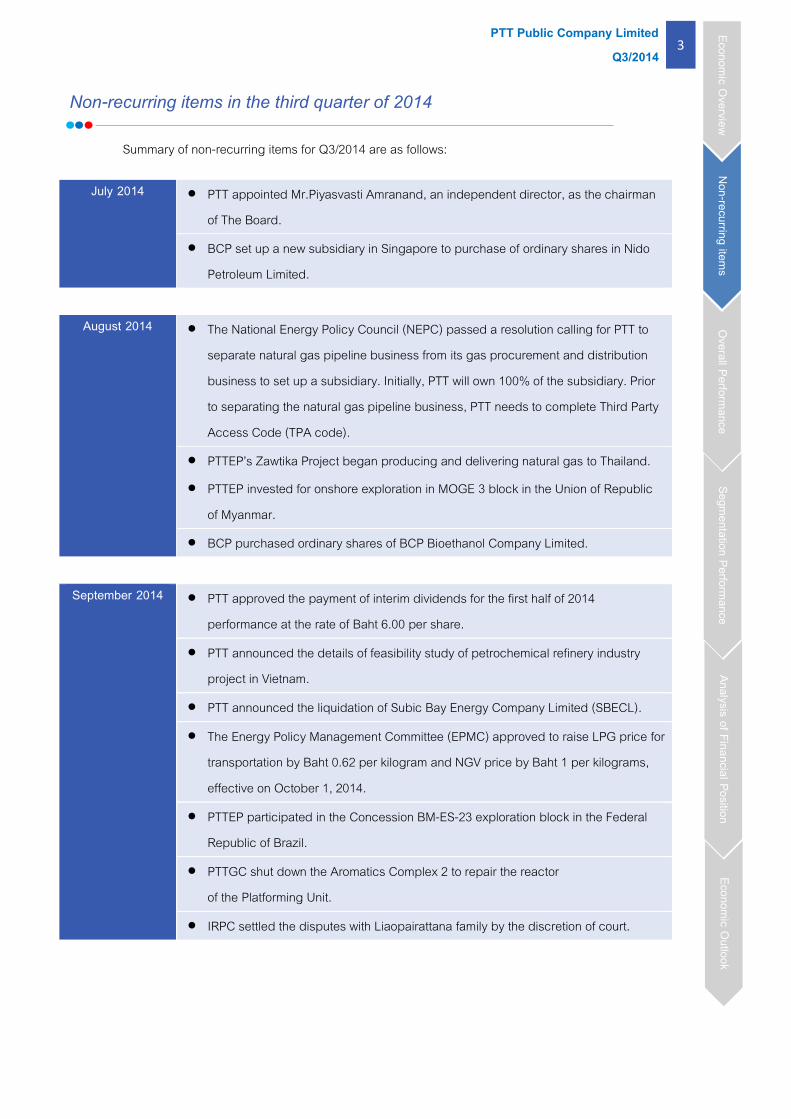
Petrochemical prices of Olefins in Q3/2014 rose from Q2/2014 due to limited supply with stable
demand. The High Density Polyethylene (HDPE) price in Q3/2014 increased in line with higher Ethylene feedstock
cost and maintenance turnaround in Japan and Taiwan. The Polypropylene (PP) price rose following higher
Propylene cost after gas explosion in Taiwan causing undeliverable of feedstock to PP producers. In terms of
Aromatics prices, Paraxylene (PX) price in Q3/2014 increased as PX producers in China, Korea, and Japan shut
down and Jurong Aromatics faced a delay in startup. Benzene price was higher than previous quarter amid tight
supply in Japan although downstream demand has not fully recovered.
Unit : US$/Ton Q3/2013 Q2/2014 Q3/2014 %Inc. (Dec.)
9M/2013 9M/2014 %Inc. (Dec.)
YoY QoQ
Ethylene 1,325 1,447 1,478 11.5% 2.1% 1,327 1,455 9.6%
HDPE 1,489 1,569 1,604 7.7% 2.2% 1,471 1,576 7.1%
PX 1,458 1,236 1,323 (9.3%) 7.0% 1,492 1,274 (14.6%)
Benzene 1,254 1,292 1,305 4.1% 1.0% 1,308 1,299 (0.7%)
The Thai economy in Q3/2014 expanded higher than Q2/2014, supporting by public investment. In
addition, private consumption and investment started to pick up after political tension eased. However, some
investors delayed investments because of the large excess capacity. Meanwhile, export sector remained weak
following a slowdown in the global economy. Thus, the slower-than-expected recovery in Thailand caused the
Office of National Economic and Social Development Board (NESDB), in August 2014, to lower its growth
projection to 1.5-2.0% from 1.5-2.5% in May projection.
Economic Overview
Non-recurring items
Overall Performance Segm
entation Performance Analysis of Financial Position
Economic Outlook
PTT Public Company Limited 3
Q3/2014
Non-recurring items in the third quarter of 2014
Summary of non-recurring items for Q3/2014 are as follows:
July 2014 PTT appointed Mr.Piyasvasti Amranand, an independent director, as the chairman of The Board.
BCP set up a new subsidiary in Singapore to purchase of ordinary shares in Nido Petroleum Limited.
August 2014 The National Energy Policy Council (NEPC) passed a resolution calling for PTT to
separate natural gas pipeline business from its gas procurement and distribution business to set up a subsidiary. Initially, PTT will own 100% of the subsidiary. Prior to separating the natural gas pipeline business, PTT needs to complete Third Party Access Code (TPA code).
PTTEP’s Zawtika Project began producing and delivering natural gas to Thailand.
PTTEP invested for onshore exploration in MOGE 3 block in the Union of Republic of Myanmar.
BCP purchased ordinary shares of BCP Bioethanol Company Limited.
September 2014 PTT approved the payment of interim dividends for the first half of 2014 performance at the rate of Baht 6.00 per share.
PTT announced the details of feasibility study of petrochemical refinery industry project in Vietnam.
PTT announced the liquidation of Subic Bay Energy Company Limited (SBECL).
The Energy Policy Management Committee (EPMC) approved to raise LPG price for transportation by Baht 0.62 per kilogram and NGV price by Baht 1 per kilograms, effective on October 1, 2014.
PTTEP participated in the Concession BM-ES-23 exploration block in the Federal Republic of Brazil.
PTTGC shut down the Aromatics Complex 2 to repair the reactor of the Platforming Unit.
IRPC settled the disputes with Liaopairattana family by the discretion of court.
Economic Overview
Non-recurring items
Overall Performance Segm
entation Performance Analysis of Financial Position
Economic Outlook
PTT Public Company Limited 4
Q3/2014
Overall performance of PTT and its subsidiaries
Financial performance of Q3/2014 compared with Q3/2013 and Q2/2014 as well as 9M/2014 compared with
9M/2013 are as follows:
% Inc.
YoY QoQ (Dec.)
Sales & services income 723,080 716,692 757,619 4.8% 5.7% 2,092,487 2,190,881 4.7%
: Exploration & Production 57,100 64,255 64,021 12.1% (0.4%) 166,182 187,469 12.8%
: Natural gas 132,772 145,243 140,486 5.8% (3.3%) 395,773 416,846 5.3%
: Oil 150,642 165,408 155,360 3.1% (6.1%) 459,337 487,474 6.1%
: International trading 429,002 396,335 455,041 6.1% 14.8% 1,207,651 1,262,690 4.6%
: Petrochemical 23,296 29,471 26,937 15.6% (8.6%) 67,366 83,129 23.4%
: Coal 6,465 5,017 4,734 (26.8%) (5.6%) 17,709 16,131 (8.9%)
: Others 1,039 1,059 1,056 1.6% (0.3%) 2,969 2,999 1.0%
EBITDA 56,637 68,627 66,052 16.6% (3.8%) 169,845 199,171 17.3%
: Exploration & Production 40,804 47,215 45,565 11.7% (3.5%) 121,145 134,517 11.0%
: Natural gas 11,022 14,094 15,840 43.7% 12.4% 32,574 44,422 36.4%
: Oil 3,034 3,639 3,126 3.0% (14.1%) 11,273 11,814 4.8%
: International trading (217) 1,223 (708) n.m. n.m. (1,593) 826 n.m.
: Petrochemical 562 1,077 853 51.8% (20.8%) 1,532 3,079 n.m.
: Coal 1,043 1,036 1,147 10.0% 10.7% 3,502 3,535 0.9%
: Others 201 381 174 (13.4%) (54.3%) 765 821 7.3%
EBIT 37,595 42,337 38,457 2.3% (9.2%) 115,881 122,758 5.9%
: Exploration & Production 27,887 27,160 24,209 (13.2%) (10.9%) 85,379 76,810 (10.0%)
: Natural gas 7,537 10,547 12,229 62.3% 15.9% 22,340 33,809 51.3%
: Oil 2,353 2,944 2,410 2.4% (18.1%) 9,305 9,719 4.4%
: International trading
- Excluding effect of FX (220) 1,219 (728) n.m. n.m. (1,601) 797 n.m.
- Including effect of FX 1,550 2,785 1,474 (4.9%) (47.1%) 3,746 7,187 91.9%
: Petrochemical 236 759 529 n.m. (30.3%) 595 2,110 n.m.
: Coal (158) (174) 42 n.m. n.m. (284) (87) 69.4%
: Others (228) (81) (290) 27.2% n.m. (502) (559) 11.4%
Depreciation and amortization expenses 19,042 26,290 27,595 44.9% 5.0% 53,964 76,413 41.6%
Finance costs 5,084 5,622 5,369 5.6% (4.5%) 15,115 16,385 8.4%
Gain (loss) on foreign exchange 1,978 1,897 1,312 (33.7%) (30.8%) 5,112 5,898 15.4%
Income taxes 9,320 9,260 10,704 14.8% 15.6% 34,333 33,032 (3.8%)
Net income 30,802 30,438 24,558 (20.3%) (19.3%) 78,293 82,444 5.3%
Earnings per share (Baht/share) 10.77 10.64 8.58 (20.3%) (19.4%) 27.36 28.82 5.3%
9M/2014Unit : Million Baht Q3/2013 Q2/2014 Q3/2014% Inc. (Dec.)
9M/2013
Economic Overview
Non-recurring items
Overall Performance Segm
entation Performance Analysis of Financial Position
Economic Outlook
PTT Public Company Limited 5
Q3/2014
Third quarter of 2014 compared with Second quarter of 2014
Net income of PTT and its subsidiaries in Q3/2014 was Baht 24,558 million, decreasing from Q2/2014 by
Baht 5,880 million or 19.3% mainly due to lower performance of PTTEP, caused by exploratory well write-off costs
of noncommercial wells in overseas, together with higher depreciation expenses of Zawtika project, starting its
natural gas export sales to Thailand. Moreover, the refining business also had lower performance due to stock
losses from large drop of crude oil prices during the period.
In Q3/2014, sales revenue of PTT and its subsidiaries was Baht 757,619 million, increasing by Baht
40,927 million. The main reason was higher sales volume of crude oil and condensate of the international trading
business. However, sales revenue of oil business, gas business, and PTTEP decreased mainly due to lower
product selling prices in relation to product reference prices. Therefore, earnings before interest, taxes,
depreciation and amortization (excluding other non-operating incomes and expenses) (EBITDA) of PTT and
subsidiaries in this period was Baht 66,052 million, decreasing by Baht 2,575 million or 3.8%, mainly from lower
average product selling prices and higher petroleum exploration costs of PTTEP from uncommercial well write-off
of PTTEP Australasia and Kenya L10A projects.
1,803
-946
2,680
3,951
172 146
265 278
40 70
Q2/2014 Q3/2014
Others
Gas
Oil
Petrochemical
Refinery
Share of net income (loss) from investments in associates
29.5%
Economic Overview
Non-recurring items
Overall Performance Segm
entation Performance Analysis of Financial Position
Economic Outlook
3,499 4,960
Unit: Million Baht
PTT Public Company Limited 6
Q3/2014
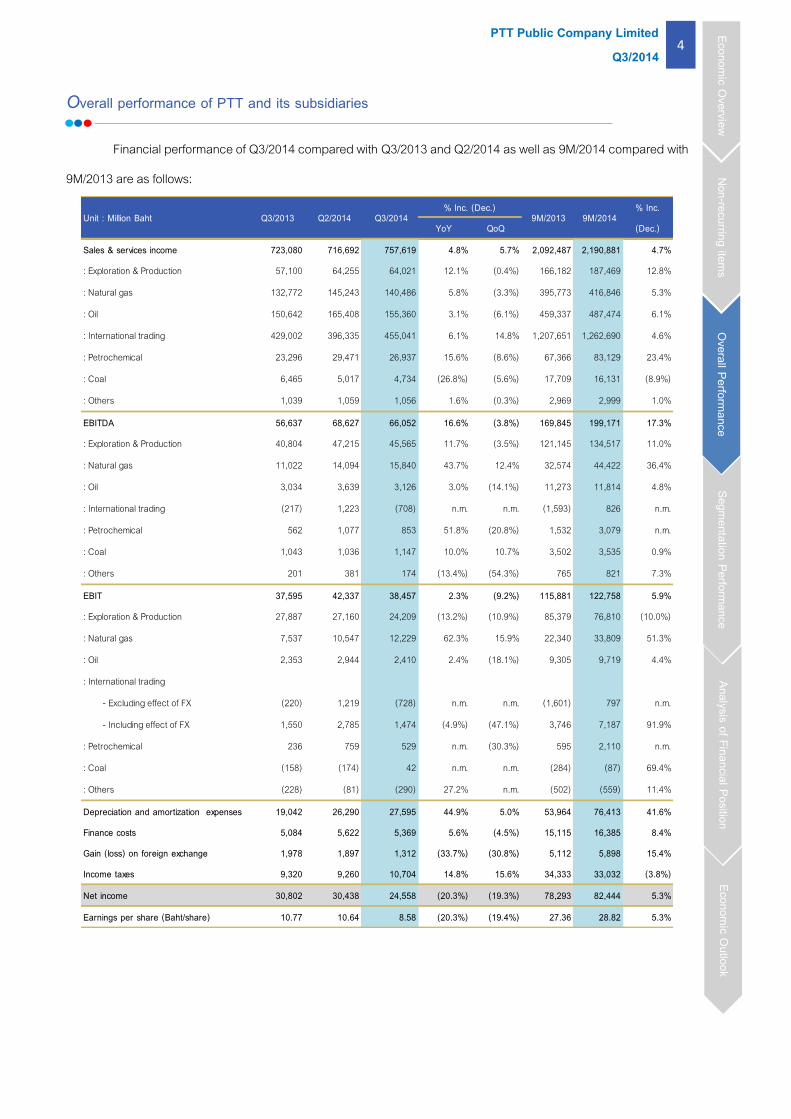
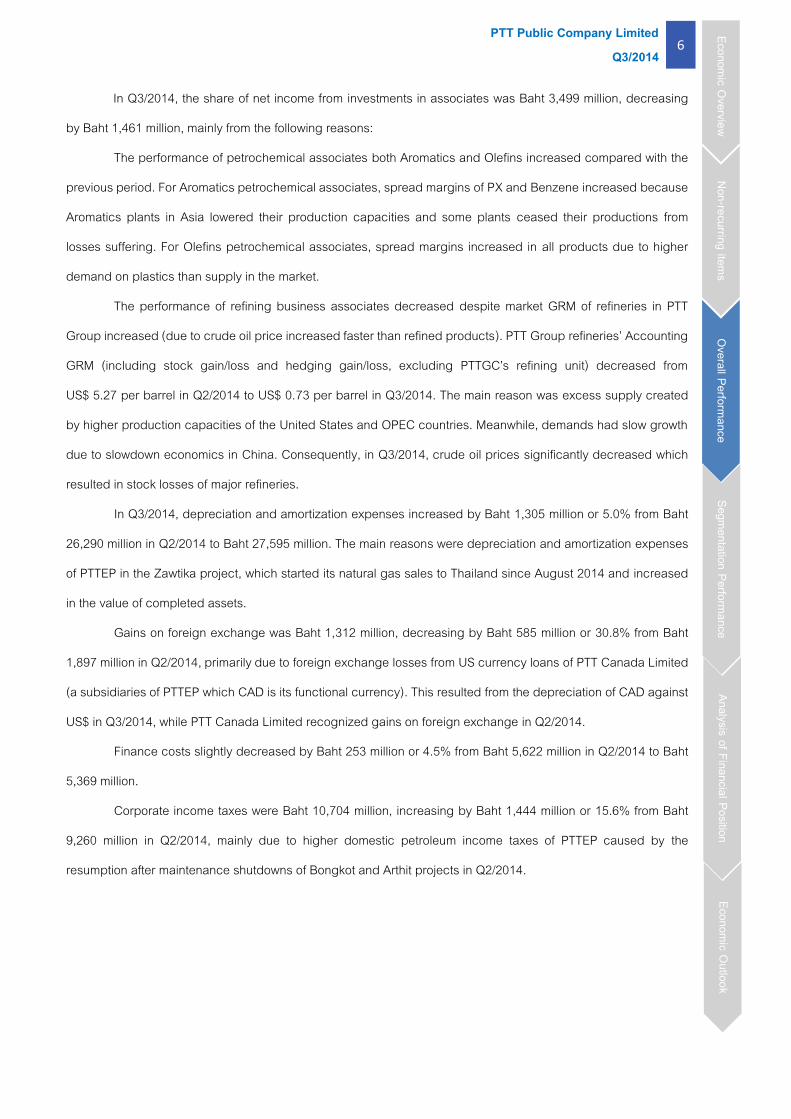
In Q3/2014, the share of net income from investments in associates was Baht 3,499 million, decreasing
by Baht 1,461 million, mainly from the following reasons:
The performance of petrochemical associates both Aromatics and Olefins increased compared with the
previous period. For Aromatics petrochemical associates, spread margins of PX and Benzene increased because
Aromatics plants in Asia lowered their production capacities and some plants ceased their productions from
losses suffering. For Olefins petrochemical associates, spread margins increased in all products due to higher
demand on plastics than supply in the market.
The performance of refining business associates decreased despite market GRM of refineries in PTT
Group increased (due to crude oil price increased faster than refined products). PTT Group refineries’ Accounting
GRM (including stock gain/loss and hedging gain/loss, excluding PTTGC’s refining unit) decreased from
US$ 5.27 per barrel in Q2/2014 to US$ 0.73 per barrel in Q3/2014. The main reason was excess supply created
by higher production capacities of the United States and OPEC countries. Meanwhile, demands had slow growth
due to slowdown economics in China. Consequently, in Q3/2014, crude oil prices significantly decreased which
resulted in stock losses of major refineries.
In Q3/2014, depreciation and amortization expenses increased by Baht 1,305 million or 5.0% from Baht
26,290 million in Q2/2014 to Baht 27,595 million. The main reasons were depreciation and amortization expenses
of PTTEP in the Zawtika project, which started its natural gas sales to Thailand since August 2014 and increased
in the value of completed assets.
Gains on foreign exchange was Baht 1,312 million, decreasing by Baht 585 million or 30.8% from Baht
1,897 million in Q2/2014, primarily due to foreign exchange losses from US currency loans of PTT Canada Limited
(a subsidiaries of PTTEP which CAD is its functional currency). This resulted from the depreciation of CAD against
US$ in Q3/2014, while PTT Canada Limited recognized gains on foreign exchange in Q2/2014.
Finance costs slightly decreased by Baht 253 million or 4.5% from Baht 5,622 million in Q2/2014 to Baht
5,369 million.
Corporate income taxes were Baht 10,704 million, increasing by Baht 1,444 million or 15.6% from Baht
9,260 million in Q2/2014, mainly due to higher domestic petroleum income taxes of PTTEP caused by the
resumption after maintenance shutdowns of Bongkot and Arthit projects in Q2/2014.
Economic Overview
Non-recurring items
Overall Performance Segm
entation Performance Analysis of Financial Position
Economic Outlook
PTT Public Company Limited 7
Q3/2014
First nine months of 2014 compared with First nine months of 2013
First nine months of 2014 (9M/2014), net income of PTT and its subsidiaries was 82,444 million,
increasing by Baht 4,151 million or 5.3% from Baht 78,293 million in the first nine months of 2013 (9M/2013) mainly
due to better performance of PTT, especially from gas business unit. This was contributed by higher average
selling prices of GSP products in relation to higher petrochemical reference prices and the Baht depreciation
against US$. However, the performance of major subsidiaries decreased, especially PTTEP and Aromatics
petrochemical and refinery associates, as a result of higher operating expenses and lower spread margins in
relation to market conditions.
In 9M/2014, sales revenue of PTT and its subsidiaries was Baht 2,190,881 million, increasing by Baht
98,394 million or 4.7%, mainly from higher product selling prices of international trading and gas business groups
in relation to market reference prices, together with the Baht depreciation against $US. Thai Baht depreciated
from 30.5 per US$ in 9M/2013 to 32.5 per US$ in 9M/2014. Additionally, sales revenue of oil business group and
PTTEP increased due to higher sales volume; even though, average selling prices decreased in relation to the
drop in crude oil price. Average Dubai crude oil price decreased from US$ 105.1 per barrel in 9M/2013 to US$
104.0 per barrel in 9M/2014. Consequently, EBITDA of PTT and its subsidiaries was Baht 199,171 million,
increasing by Bath 29,326 million or 17.3% compared with 9M/2013.
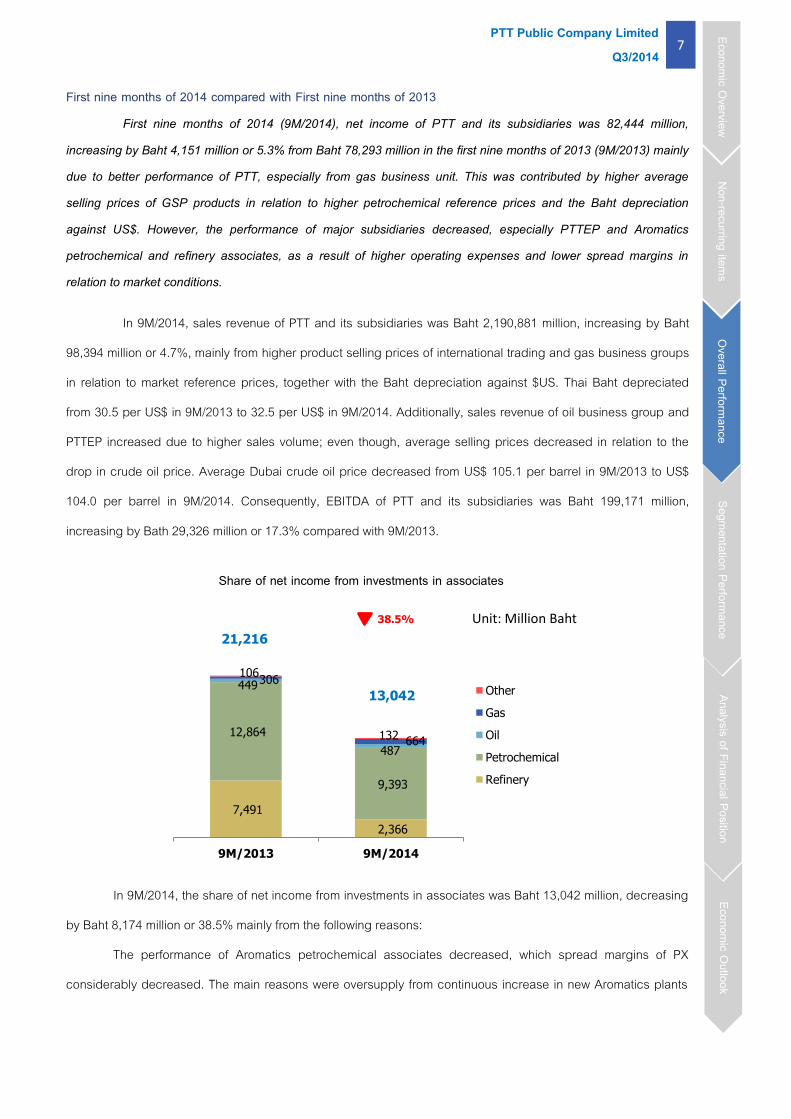
In 9M/2014, the share of net income from investments in associates was Baht 13,042 million, decreasing
by Baht 8,174 million or 38.5% mainly from the following reasons:
The performance of Aromatics petrochemical associates decreased, which spread margins of PX
considerably decreased. The main reasons were oversupply from continuous increase in new Aromatics plants
7,491
2,366
12,864
9,393
449
487
306
664
106
132
9M/2013 9M/2014
Other
Gas
Oil
Petrochemical
Refinery
Share of net income from investments in associates
38.5%
Economic Overview
Non-recurring items
Overall Performance Segm
entation Performance Analysis of Financial Position
Economic Outlook
13,042
21,216
Unit: Million Baht
PTT Public Company Limited 8
Q3/2014
and lower downstream-product demands from economic slowdown in China. Nevertheless, the performance of
Olefins petrochemical associates increased because spread margins of Olefins and derivatives increased in
accordance with demand in the market.
The performance of refining business associates decreased because PTT Group refineries’ Accounting
GRM (excluding PTTGC’s refining unit) decreased from US$ 5.07 per barrel in 9M/2013 to US$ 3.23 per barrel in
9M/2014. The main reason was higher stock loss, while there was stock gain in 9M/2013, as a result of dramatic
drop in crude oil price in Q3/2014 in relation to higher supply of crude oil in the market. Furthermore, Market GRM
of refined petroleum products declined in all products in relation to lower demand from China. Additionally, there
were shutdowns for major turnaround in all refineries of PTT Group in 9M/2014.
In 9M/2014, PTT had gain on disposal of investments in Vietnam LPG Co.,Ltd. (VLPG), Nava Nakorn
Electricity Generating Co.,Ltd. (NNEG), and Ratchaburi Power Co.,Ltd. (RPCL) totaling to Baht 1,033 million.
PTT and its subsidiaries’ depreciation and amortization expenses increased by Baht 22,449 million or
41.6% from Baht 53,964 million in 9M/2013 to Baht 76,413 million. This was resulted from the higher depreciation
and amortization expenses of PTTEP in PTTEP Australasia project, which began offloading crude oil for sales in
August 2013, Contract 4 and Zawtika projects in relation to the increase in production volume and completed
assets.
Gains on foreign exchange increased by Baht 786 million or 15.4% from Baht 5,112 million in 9M/2013 to
Baht 5,898 million. This was mainly resulted from the rise in gain on foreign exchange of PTT because Thai Baht
appreciated against US$ in 9M/2014, while Thai Baht depreciated in 9M/2013.
Finance costs increased by Baht 1,270 million or 8.4% from Baht 15,115 million in 9M/2013 to Baht
16,385 million in 9M/2014.
The corporate income taxes were Baht 33,032 million, decreasing by Baht 1,301 million or 3.8% from
Baht 34,333 million in 9M/2013. The drop was mostly from domestic petroleum income taxes of PTTEP as a result
of maintenance shutdown of Bongkot and S1 projects. Nonetheless, income taxes of PTT increased in relation to
higher operating income.
Economic Overview
Non-recurring items
Overall Performance Segm
entation Performance Analysis of Financial Position
Economic Outlook
PTT Public Company Limited 9
Q3/2014
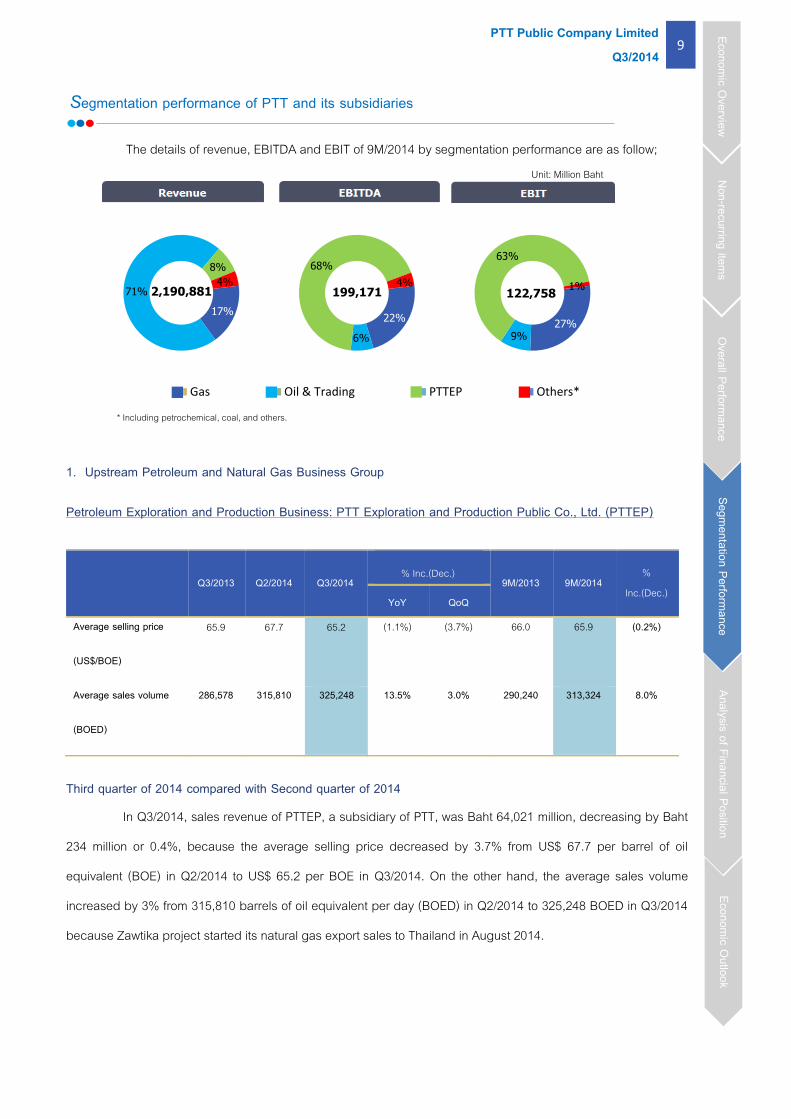
Segmentation performance of PTT and its subsidiaries
The details of revenue, EBITDA and EBIT of 9M/2014 by segmentation performance are as follow;
1. Upstream Petroleum and Natural Gas Business Group
Petroleum Exploration and Production Business: PTT Exploration and Production Public Co., Ltd. (PTTEP)
Q3/2013 Q2/2014 Q3/2014 % Inc.(Dec.)
9M/2013 9M/2014 %
Inc.(Dec.) YoY QoQ
Average selling price
(US$/BOE)
65.9 67.7 65.2 (1.1%) (3.7%) 66.0 65.9 (0.2%)
Average sales volume
(BOED)
286,578 315,810 325,248 13.5% 3.0% 290,240 313,324 8.0%
Third quarter of 2014 compared with Second quarter of 2014
In Q3/2014, sales revenue of PTTEP, a subsidiary of PTT, was Baht 64,021 million, decreasing by Baht
234 million or 0.4%, because the average selling price decreased by 3.7% from US$ 67.7 per barrel of oil
equivalent (BOE) in Q2/2014 to US$ 65.2 per BOE in Q3/2014. On the other hand, the average sales volume
increased by 3% from 315,810 barrels of oil equivalent per day (BOED) in Q2/2014 to 325,248 BOED in Q3/2014
because Zawtika project started its natural gas export sales to Thailand in August 2014.
17%
71%
8%
4%
22%
6%
68%
4%
27% 9%
63%
1%
Gas Oil & Trading PTTEP Others*
Unit: Million Baht
Economic Overview
Non-recurring items
Overall Performance Segm
entation Performance Analysis of Financial Position
Economic Outlook
2,190,881 199,171 122,758
* Including petrochemical, coal, and others.
PTT Public Company Limited 10
Q3/2014
In Q3/2014, EBITDA was Baht 45,565 million, decreasing by Baht 1,650 million or 3.5%, because the exploration expenses increased by Baht 2,522 million in Q3/2014 mainly due to exploratory well write-off costs of noncommercial wells in PTTEP Australasia and Kenya L10A projects.
In Q3/2014, EBIT was Baht 24,209 million, decreasing by Baht 2,951 million or 10.9%, as a result of a drop of EBITDA as aforementioned. Furthermore, depreciation and amortization expenses of Zawtika project increased mainly from a start-up in natural gas export sales to Thailand and an increase in completed assets.
First nine months of 2014 compared with First nine months of 2013
In 9M/2014, sales revenue of PTTEP was Baht 187,469 million, increasing by Baht 21,287 million or
12.8% from 9M/2013, mainly due to the followings:
The average sales volume increased from 290,240 BOED in 9M/2013 to 313,324 BOED in 9M/2014.
The increase in sales volume was primarily from Montara of PTTEP Australasia project, which began offloading
crude oil for sales in August 2013, Contract 4 and Sinphuhorm projects generated by the share acquisition of
Hess Corporation’s subsidiaries, and Zawtika project from its first gas sales in March 2014 and export to Thailand
in August 2014. Nevertheless, sales volume of S1 and Bongkot projects dropped due to maintenance shutdowns.
The average selling price slightly dropped by 0.2% from US$ 66.0 per BOE in 9M/2013 to US$ 65.9 per
BOE in 9M/2014.
In 9M/2014, EBITDA was Baht 134,517 million, increasing by Baht 13,372 million or 11.0%, mainly due to the rise in the sales revenue as aforementioned. However, the exploration expenses increased by Baht 3,161 million in 9M/2014 mainly due to exploratory well write-off costs in PTTEP Australasia and Kenya L10A projects.
In 9M/2014, EBIT was Baht 76,810 million, decreasing by Baht 8,569 million or 10.0% due to higher
depreciation expenses in relation to increases in completed assets, production and sales volume mainly from
PTTEP Australasia, Contract 4, and Zawtika projects.
Economic Overview
Non-recurring items
Overall Performance Segm
entation Performance Analysis of Financial Position
Economic Outlook
PTT Public Company Limited 11
Q3/2014
Natural Gas Business Group
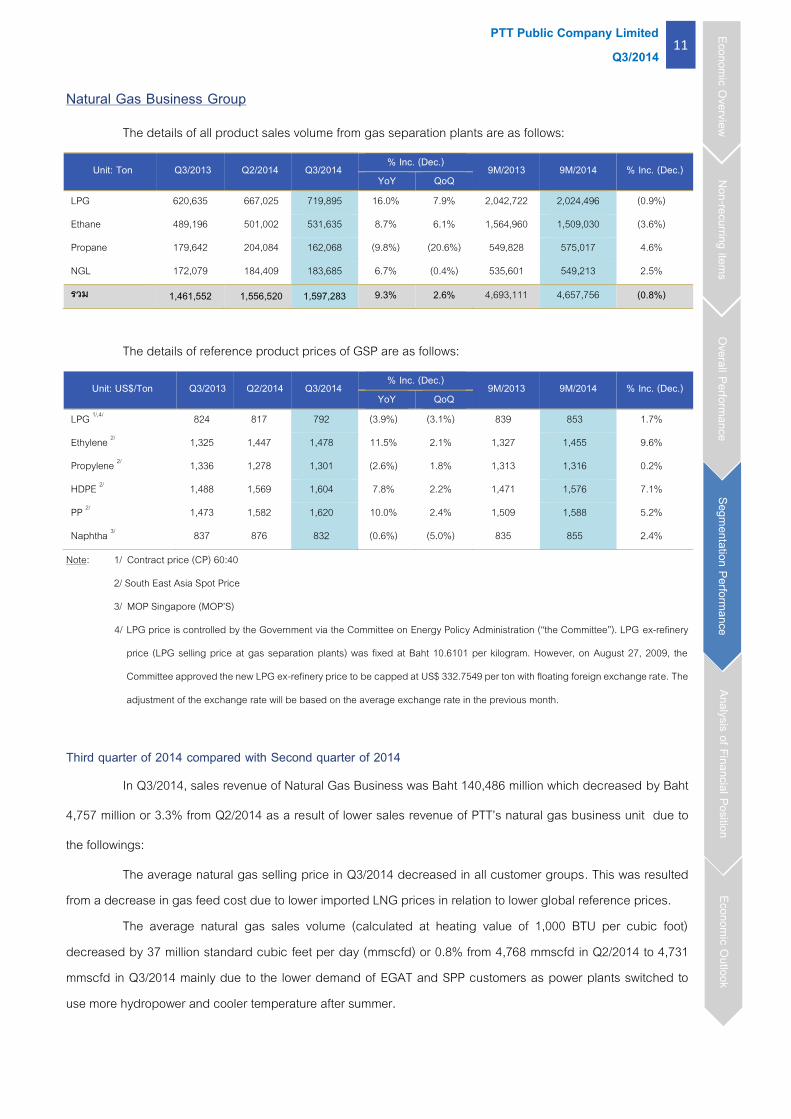
The details of all product sales volume from gas separation plants are as follows:
The details of reference product prices of GSP are as follows:
Note: 1/ Contract price (CP) 60:40
2/ South East Asia Spot Price
3/ MOP Singapore (MOP’S)
4/ LPG price is controlled by the Government via the Committee on Energy Policy Administration (“the Committee”). LPG ex-refinery
price (LPG selling price at gas separation plants) was fixed at Baht 10.6101 per kilogram. However, on August 27, 2009, the
Committee approved the new LPG ex-refinery price to be capped at US$ 332.7549 per ton with floating foreign exchange rate. The
adjustment of the exchange rate will be based on the average exchange rate in the previous month.
Third quarter of 2014 compared with Second quarter of 2014
In Q3/2014, sales revenue of Natural Gas Business was Baht 140,486 million which decreased by Baht
4,757 million or 3.3% from Q2/2014 as a result of lower sales revenue of PTT’s natural gas business unit due to
the followings:
The average natural gas selling price in Q3/2014 decreased in all customer groups. This was resulted from a decrease in gas feed cost due to lower imported LNG prices in relation to lower global reference prices.
The average natural gas sales volume (calculated at heating value of 1,000 BTU per cubic foot) decreased by 37 million standard cubic feet per day (mmscfd) or 0.8% from 4,768 mmscfd in Q2/2014 to 4,731 mmscfd in Q3/2014 mainly due to the lower demand of EGAT and SPP customers as power plants switched to use more hydropower and cooler temperature after summer.
Unit: Ton Q3/2013 Q2/2014 Q3/2014 % Inc. (Dec.) 9M/2013 9M/2014 % Inc. (Dec.) YoY QoQ
LPG 620,635 667,025 719,895 16.0% 7.9% 2,042,722 2,024,496 (0.9%)
Ethane 489,196 501,002 531,635 8.7% 6.1% 1,564,960 1,509,030 (3.6%)
Propane 179,642 204,084 162,068 (9.8%) (20.6%) 549,828 575,017 4.6%
NGL 172,079 184,409 183,685 6.7% (0.4%) 535,601 549,213 2.5%
รวม 1,461,552 1,556,520 1,597,283 9.3% 2.6% 4,693,111 4,657,756 (0.8%)
Unit: US$/Ton Q3/2013 Q2/2014 Q3/2014 % Inc. (Dec.)
9M/2013 9M/2014 % Inc. (Dec.) YoY QoQ
LPG 1/,4/ 824 817 792 (3.9%) (3.1%) 839 853 1.7%
Ethylene 2/ 1,325 1,447 1,478 11.5% 2.1% 1,327 1,455 9.6%
Propylene 2/ 1,336 1,278 1,301 (2.6%) 1.8% 1,313 1,316 0.2%
HDPE 2/ 1,488 1,569 1,604 7.8% 2.2% 1,471 1,576 7.1%
PP 2/ 1,473 1,582 1,620 10.0% 2.4% 1,509 1,588 5.2%
Naphtha 3/ 837 876 832 (0.6%) (5.0%) 835 855 2.4%
Economic Overview
Non-recurring items
Overall Performance Segm
entation Performance Analysis of Financial Position
Economic Outlook
PTT Public Company Limited 12
Q3/2014
The average selling prices of GSPs products decreased. The total sales volume of products from GSPs (including NGL derived from Dew Point Control units)
increased by 2.6% from 1,556,520 tons in Q2/2014 to 1,597,283 tons in Q3/2014 mainly due to the higher
demands of LPG and Ethane.
EBITDA of Natural Gas Business in Q3/2014 was Baht 15,840 million, increasing by Baht 1,746 million
or 12.4%. The main reason was that gas producers were unable to supply gas as in agreement (Shortfall) of
Zawtika project, which PTT started to import gas since August 5, 2014. Additionally, loss of NGV business slightly
decreased. Nonetheless, the drop in profit of products from GSPs was mainly caused by lower average product
selling prices. Consequently, EBIT in Q3/2014 was Baht 12,229 million, increasing by 15.9% in line with the rise in
EBITDA.
First nine months of 2014 compared with First nine months of 2013
In 9M/2014, sales revenue of Natural Gas Business was Baht 416,846 million which increased by Baht
21,073 million or 5.3% from 9M/2013 as a result of higher sales revenue of PTT’s natural gas business unit due to
the followings:
The average natural gas selling price in 9M/2014 increased in all customer groups. This was resulted
from an increase in gas feed cost mainly due to higher imported LNG prices in relation to higher global reference
price and the Baht depreciation.
The average natural gas sales volume (calculated at heating value of 1,000 BTU per cubic foot)
increased by 22 mmscfd or 0.5% from 4,628 mmscfd in 9M/2013 to 4,650 mmscfd in 9M/2014 mainly due to the
higher demand from SPP and NGV customers.
The product prices of the gas separation plants in 9M/2014 increased in all products in relation to the
global reference petrochemical prices and the Baht depreciation.
The sales volume of products from GSPs (including NGL derived from Dew Point Control units) slightly
dropped by 0.8% from 4,693,111 tons in 9M/2013 to 4,657,756 tons in 9M/2014, especially Ethane and LPG,
because utilization rate of GSP slightly dropped from 90.8% to 90.4% as PTT’s GSP Unit 5 shut down from
lightning strike incident in August 2013. However, it has resumed its normal production since April 2014.
Furthermore, the shutdown period of gas separation plant decreased by 26 days from 103 days in 9M/2013 to 77
days in 9M/2014.
EBITDA of Natural Gas Business in 9M/2014 was Baht 44,422 million, increasing by Baht 11,848 million
or 36.4%. The main reason was the rise in profit of products from the gas separation plants as a result of the
increase in GSP product selling prices in relation to global petrochemical price. In addition, there were gas
Economic Overview
Non-recurring items
Overall Performance Segm
entation Performance Analysis of Financial Position
Economic Outlook
PTT Public Company Limited 13
Q3/2014
discounts from producers that were unable to supply gas as in agreements (Shortfall) mainly from Zawtika project.
Moreover, higher profit of natural gas sold to industrial and SPP customers was in relation to higher selling prices.
However, the loss from NGV business increased in relation to an increase in sales volume. EBIT in 9M/2014 was
Baht 33,809 million, increasing by 51.3%, in relation to the increase in EBITDA.
2. Downstream Petroleum Business Group
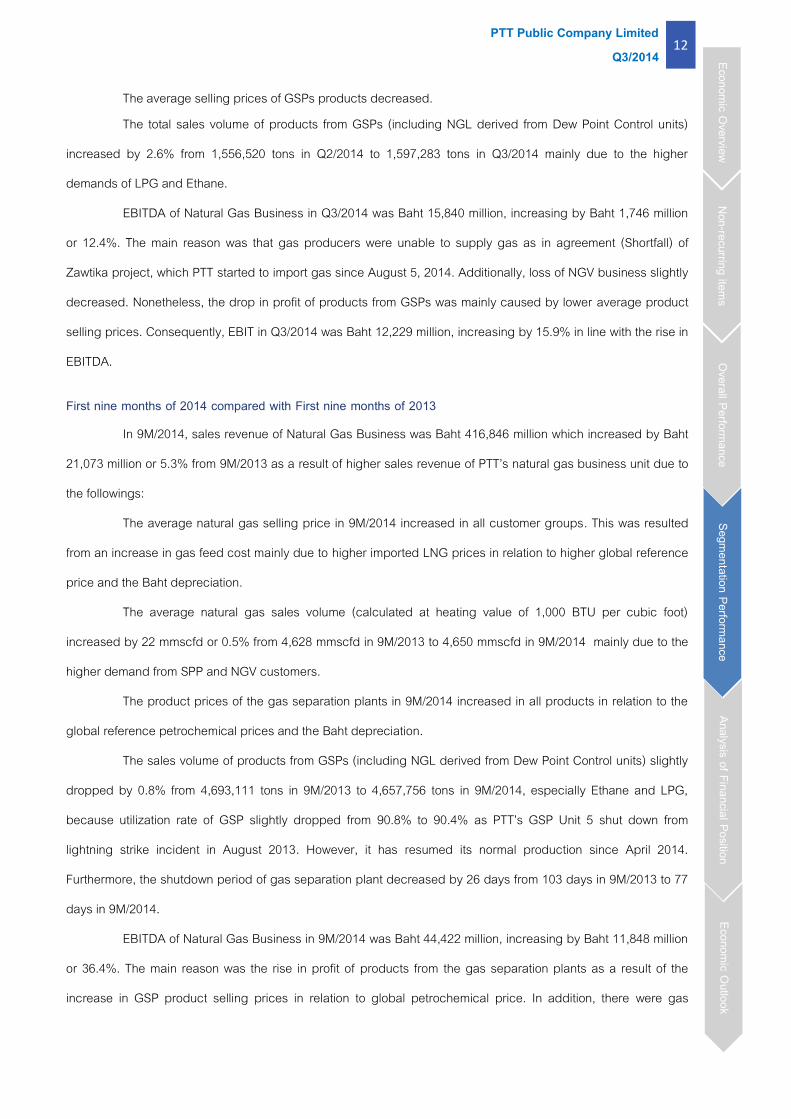
Oil Business Group
Unit : million liter Q3/2013 Q2/2014 Q3/2014 % Inc.(Dec.)
9M/2013 9M/2014 % Inc.(Dec.)
YoY QoQ
Average sales volume 5,673 6,199 5,943 4.8% (4.1%) 17,904 18,448 2.8%
Third quarter of 2014 compared with Second quarter of 2014
Sales revenue of Oil Business in Q3/2014 was Baht 155,360 million, decreasing by Baht 10,048 million
or 6.1% because sales volume in this quarter dropped by 256 million liters or 4.1% from 6,199 million liters or
equivalent to 428,479 barrels per day in Q2/2014 to 5,943 million liters or equivalent to 406,317 barrels per day,
especially decreases in sales volume of diesel and fuel oil in relation to lower seasonal demands. Moreover,
selling prices decreased as a result of the decrease in the Dubai crude oil price from US$ 106.1 per barrel in
Q2/2014 to US$ 101.5 per barrel in Q3/2014.
EBITDA in Q3/2014 was Baht 3,126 million, decreasing by Baht 513 million or 14.1% mainly due to the
drop in margin of gasoline after traveling season. Hence, EBIT in this quarter was Baht 2,410 million, decreasing
by Baht 534 million as a result of the drop in EBITDA as aforementioned.
First nine months of 2014 compared with First nine months of 2013
Sales revenue of Oil Business in 9M/2014 was Baht 487,474 million, increasing by Baht 28,137 million
or 6.1% because sales volume increased by 508 million liters or 2.8% from 17,940 million liters or equivalent to
413,332 barrels per day in 9M/2014 to 18,448 million liters or equivalent to 425,049 barrels per day in 9M/2014,
especially aviation fuel due to an increase in number of flights and gasoline caused by higher demand of
imported oil in Indonesia.
EBITDA in 9M/2014 was Baht 11,814 million, increasing by Baht 541 million or 4.8% due to the rise in
margins of gasoline and aviation fuel. Consequently, EBIT in 9M/2014 was Baht 9,719 million, increasing by Baht
414 million, in line with the increase in EBITDA as aforementioned.
Economic Overview
Non-recurring items
Overall Performance Segm
entation Performance Analysis of Financial Position
Economic Outlook
PTT Public Company Limited 14
Q3/2014
International Trading Business Group
Unit : million liter Q3/2013 Q2/2014 Q3/2014 % Inc.(Dec.)
9M/2013 9M/2014 % Inc.(Dec.)
YoY QoQ
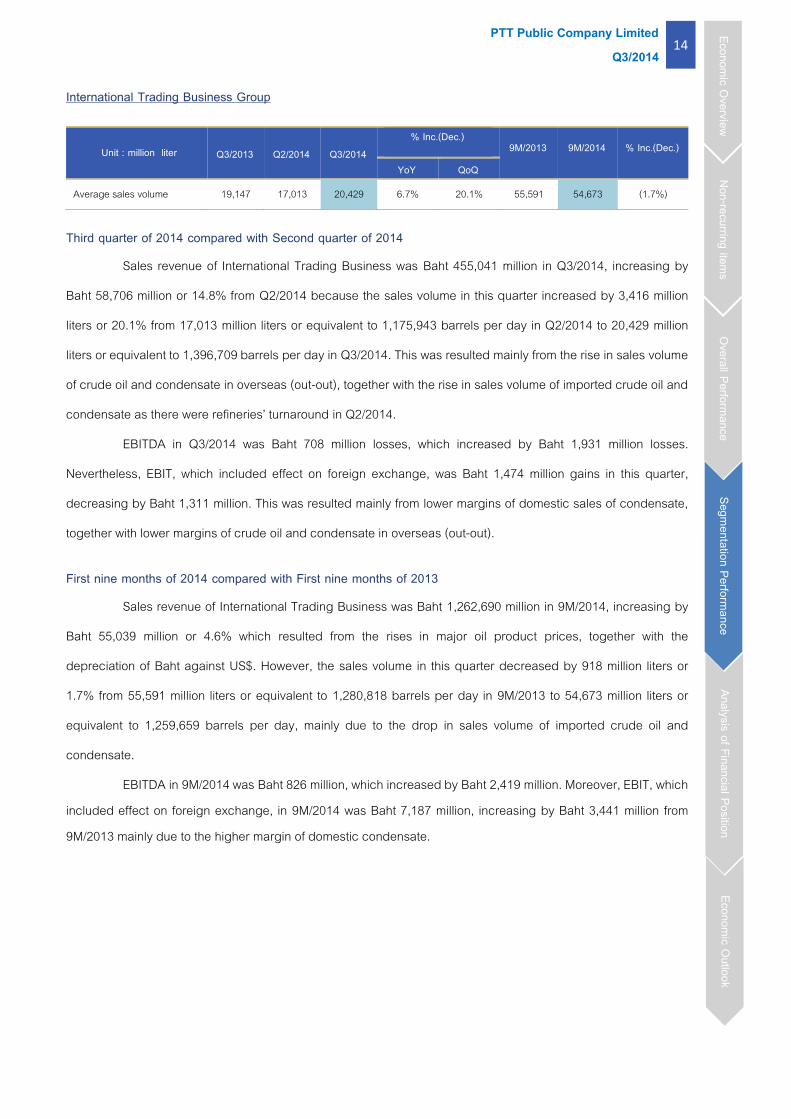
Average sales volume 19,147 17,013 20,429 6.7% 20.1% 55,591 54,673 (1.7%)
Third quarter of 2014 compared with Second quarter of 2014
Sales revenue of International Trading Business was Baht 455,041 million in Q3/2014, increasing by
Baht 58,706 million or 14.8% from Q2/2014 because the sales volume in this quarter increased by 3,416 million
liters or 20.1% from 17,013 million liters or equivalent to 1,175,943 barrels per day in Q2/2014 to 20,429 million
liters or equivalent to 1,396,709 barrels per day in Q3/2014. This was resulted mainly from the rise in sales volume
of crude oil and condensate in overseas (out-out), together with the rise in sales volume of imported crude oil and
condensate as there were refineries’ turnaround in Q2/2014.
EBITDA in Q3/2014 was Baht 708 million losses, which increased by Baht 1,931 million losses.
Nevertheless, EBIT, which included effect on foreign exchange, was Baht 1,474 million gains in this quarter,
decreasing by Baht 1,311 million. This was resulted mainly from lower margins of domestic sales of condensate,
together with lower margins of crude oil and condensate in overseas (out-out).
First nine months of 2014 compared with First nine months of 2013
Sales revenue of International Trading Business was Baht 1,262,690 million in 9M/2014, increasing by
Baht 55,039 million or 4.6% which resulted from the rises in major oil product prices, together with the
depreciation of Baht against US$. However, the sales volume in this quarter decreased by 918 million liters or
1.7% from 55,591 million liters or equivalent to 1,280,818 barrels per day in 9M/2013 to 54,673 million liters or
equivalent to 1,259,659 barrels per day, mainly due to the drop in sales volume of imported crude oil and
condensate.
EBITDA in 9M/2014 was Baht 826 million, which increased by Baht 2,419 million. Moreover, EBIT, which included effect on foreign exchange, in 9M/2014 was Baht 7,187 million, increasing by Baht 3,441 million from 9M/2013 mainly due to the higher margin of domestic condensate.
Economic Overview
Non-recurring items
Overall Performance Segm
entation Performance Analysis of Financial Position
Economic Outlook
PTT Public Company Limited 15
Q3/2014
Petrochemical Business Group
Unit : US$/Ton Q3/2013 Q2/2014 Q3/2014
% Inc.(Dec.)
9M/2013 9M/2014
% Inc.
(Dec.) YoY QoQ
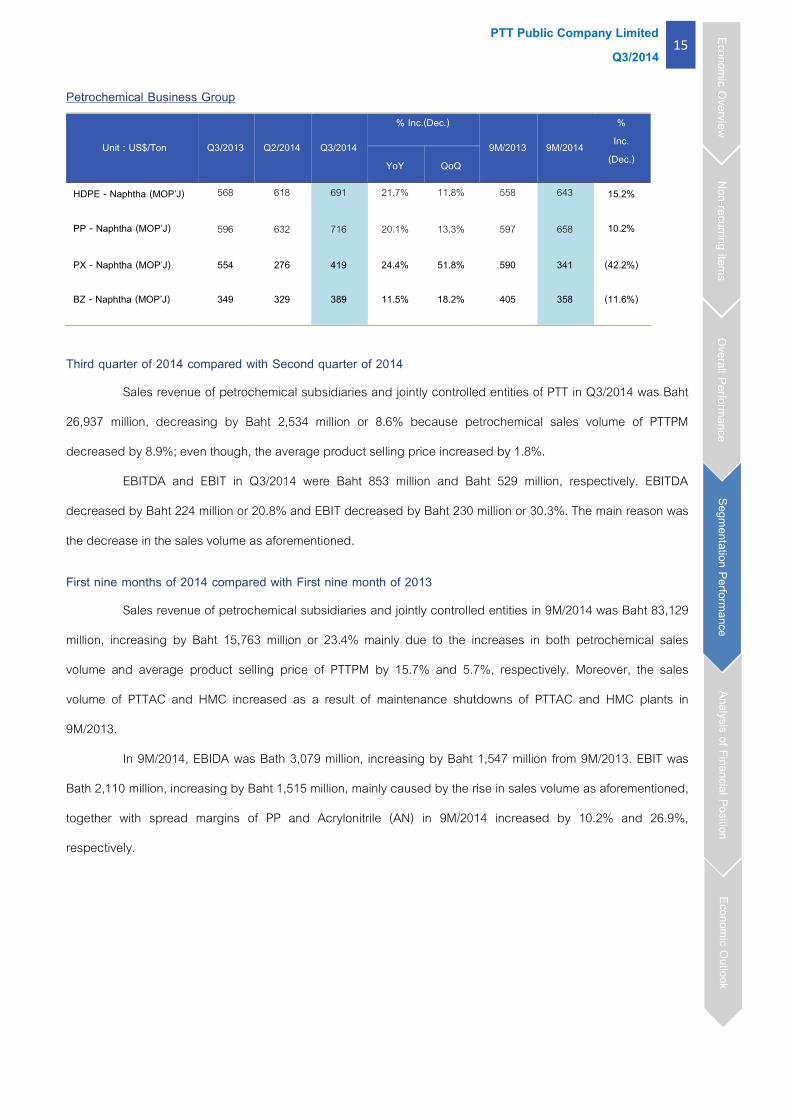
HDPE - Naphtha (MOP’J)
PP - Naphtha (MOP’J)
568
596
618
632
691
716
21.7%
20.1%
11.8%
13.3%
558
597
643
658
15.2%
10.2%
PX - Naphtha (MOP’J)
BZ - Naphtha (MOP’J)
554
349
276
329
419
389
24.4%
11.5%
51.8%
18.2%
590
405
341
358
(42.2%)
(11.6%)
Third quarter of 2014 compared with Second quarter of 2014
Sales revenue of petrochemical subsidiaries and jointly controlled entities of PTT in Q3/2014 was Baht
26,937 million, decreasing by Baht 2,534 million or 8.6% because petrochemical sales volume of PTTPM
decreased by 8.9%; even though, the average product selling price increased by 1.8%.
EBITDA and EBIT in Q3/2014 were Baht 853 million and Baht 529 million, respectively. EBITDA
decreased by Baht 224 million or 20.8% and EBIT decreased by Baht 230 million or 30.3%. The main reason was
the decrease in the sales volume as aforementioned.
First nine months of 2014 compared with First nine month of 2013
Sales revenue of petrochemical subsidiaries and jointly controlled entities in 9M/2014 was Baht 83,129
million, increasing by Baht 15,763 million or 23.4% mainly due to the increases in both petrochemical sales
volume and average product selling price of PTTPM by 15.7% and 5.7%, respectively. Moreover, the sales
volume of PTTAC and HMC increased as a result of maintenance shutdowns of PTTAC and HMC plants in
9M/2013.
In 9M/2014, EBIDA was Bath 3,079 million, increasing by Baht 1,547 million from 9M/2013. EBIT was
Bath 2,110 million, increasing by Baht 1,515 million, mainly caused by the rise in sales volume as aforementioned,
together with spread margins of PP and Acrylonitrile (AN) in 9M/2014 increased by 10.2% and 26.9%,
respectively.
Economic Overview
Non-recurring items
Overall Performance Segm
entation Performance Analysis of Financial Position
Economic Outlook
PTT Public Company Limited 16
Q3/2014
Coal Business
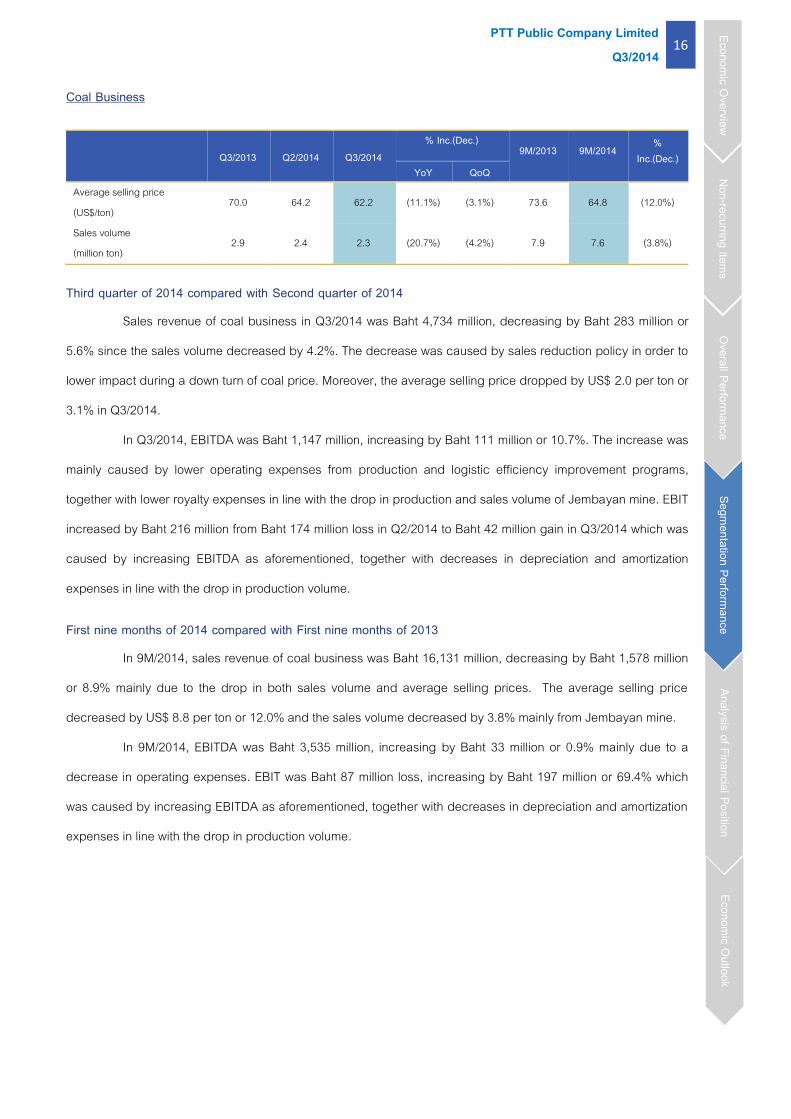
Q3/2013 Q2/2014 Q3/2014 % Inc.(Dec.)
9M/2013 9M/2014 % Inc.(Dec.)
YoY QoQ Average selling price (US$/ton)
70.0 64.2 62.2 (11.1%) (3.1%) 73.6 64.8 (12.0%)
Sales volume (million ton)
2.9 2.4 2.3 (20.7%) (4.2%) 7.9 7.6 (3.8%)
Third quarter of 2014 compared with Second quarter of 2014
Sales revenue of coal business in Q3/2014 was Baht 4,734 million, decreasing by Baht 283 million or
5.6% since the sales volume decreased by 4.2%. The decrease was caused by sales reduction policy in order to
lower impact during a down turn of coal price. Moreover, the average selling price dropped by US$ 2.0 per ton or
3.1% in Q3/2014.
In Q3/2014, EBITDA was Baht 1,147 million, increasing by Baht 111 million or 10.7%. The increase was
mainly caused by lower operating expenses from production and logistic efficiency improvement programs,
together with lower royalty expenses in line with the drop in production and sales volume of Jembayan mine. EBIT
increased by Baht 216 million from Baht 174 million loss in Q2/2014 to Baht 42 million gain in Q3/2014 which was
caused by increasing EBITDA as aforementioned, together with decreases in depreciation and amortization
expenses in line with the drop in production volume.
First nine months of 2014 compared with First nine months of 2013
In 9M/2014, sales revenue of coal business was Baht 16,131 million, decreasing by Baht 1,578 million
or 8.9% mainly due to the drop in both sales volume and average selling prices. The average selling price
decreased by US$ 8.8 per ton or 12.0% and the sales volume decreased by 3.8% mainly from Jembayan mine.
In 9M/2014, EBITDA was Baht 3,535 million, increasing by Baht 33 million or 0.9% mainly due to a
decrease in operating expenses. EBIT was Baht 87 million loss, increasing by Baht 197 million or 69.4% which
was caused by increasing EBITDA as aforementioned, together with decreases in depreciation and amortization
expenses in line with the drop in production volume.
Economic Overview
Non-recurring items
Overall Performance Segm
entation Performance Analysis of Financial Position
Economic Outlook
PTT Public Company Limited 17
Q3/2014
The analysis of PTT and its subsidiaries’ consolidated financial position as of September 30, 2014 compared with December 31, 2013
Assets
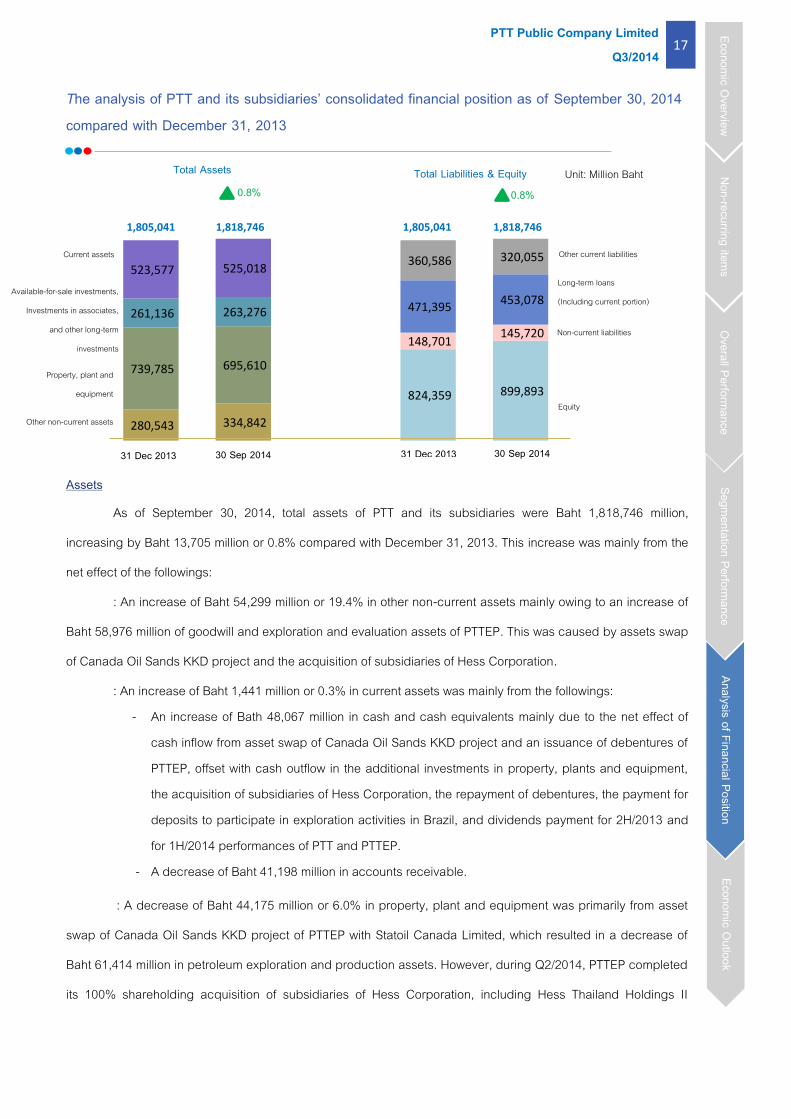
As of September 30, 2014, total assets of PTT and its subsidiaries were Baht 1,818,746 million,
increasing by Baht 13,705 million or 0.8% compared with December 31, 2013. This increase was mainly from the
net effect of the followings:
: An increase of Baht 54,299 million or 19.4% in other non-current assets mainly owing to an increase of
Baht 58,976 million of goodwill and exploration and evaluation assets of PTTEP. This was caused by assets swap
of Canada Oil Sands KKD project and the acquisition of subsidiaries of Hess Corporation.
: An increase of Baht 1,441 million or 0.3% in current assets was mainly from the followings: - An increase of Bath 48,067 million in cash and cash equivalents mainly due to the net effect of
cash inflow from asset swap of Canada Oil Sands KKD project and an issuance of debentures of PTTEP, offset with cash outflow in the additional investments in property, plants and equipment, the acquisition of subsidiaries of Hess Corporation, the repayment of debentures, the payment for deposits to participate in exploration activities in Brazil, and dividends payment for 2H/2013 and for 1H/2014 performances of PTT and PTTEP.
- A decrease of Baht 41,198 million in accounts receivable.
: A decrease of Baht 44,175 million or 6.0% in property, plant and equipment was primarily from asset
swap of Canada Oil Sands KKD project of PTTEP with Statoil Canada Limited, which resulted in a decrease of
Baht 61,414 million in petroleum exploration and production assets. However, during Q2/2014, PTTEP completed
its 100% shareholding acquisition of subsidiaries of Hess Corporation, including Hess Thailand Holdings II
280,543 334,842
739,785 695,610
261,136 263,276
523,577 525,018
824,359 899,893
148,701 145,720
471,395 453,078
360,586 320,055
1,805,041 1,805,041 1,818,746 1,818,746
0.8%
Current assets
Long-term loans
(Including current portion)
Non-current liabilities
Other current liabilities
Equity
Available-for-sale investments,
Investments in associates,
and other long-term
investments
Other non-current assets
Property, plant and
equipment
31 Dec 2013 30 Sep 2014 31 Dec 2013 30 Sep 2014
Total Assets Total Liabilities & Equity 0.8%
Economic Overview
Non-recurring items
Overall Performance Segm
entation Performance Analysis of Financial Position
Economic Outlook
Unit: Million Baht
PTT Public Company Limited 18
Q3/2014
Limited (HTH) and Hess Exploration Thailand Company Limited (HETCL), leading to an increase of Baht 19,059
million in petroleum exploration and production assets.
Liabilities
As of September 30, 2014, PTT and its subsidiaries had total liabilities of Baht 918,853 million,
decreasing by Baht 61,829 million or 6.3% from the year-ended 2013. This decrease was mainly from the net
effect of the followings:
: A decrease of Baht 40,531 million or 11.2% in current liabilities was primarily from a decrease of Baht
46,289 million in trade accounts payable.
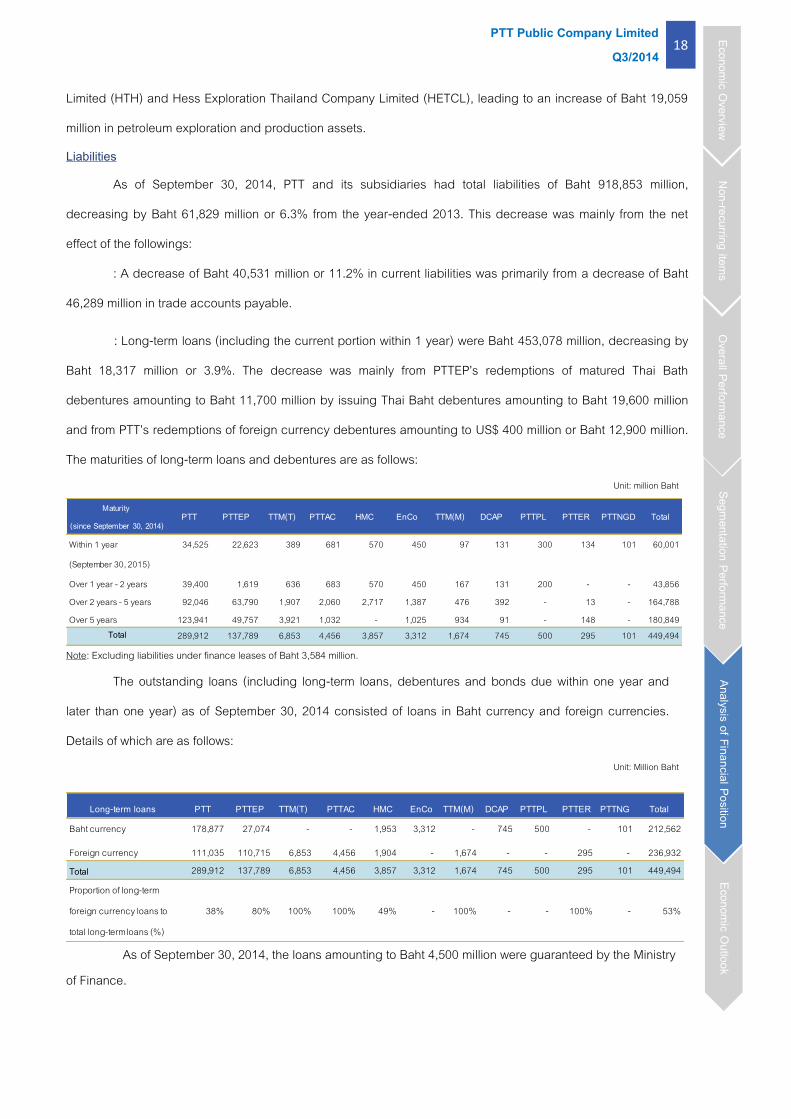
: Long-term loans (including the current portion within 1 year) were Baht 453,078 million, decreasing by
Baht 18,317 million or 3.9%. The decrease was mainly from PTTEP’s redemptions of matured Thai Bath
debentures amounting to Baht 11,700 million by issuing Thai Baht debentures amounting to Baht 19,600 million
and from PTT’s redemptions of foreign currency debentures amounting to US$ 400 million or Baht 12,900 million.
The maturities of long-term loans and debentures are as follows: Unit: million Baht
Maturity
(since September 30, 2014)PTT PTTEP TTM(T) PTTAC HMC EnCo TTM(M) DCAP PTTPL PTTER PTTNGD Total
Within 1 year
(September 30, 2015)
34,525 22,623 389 681 570 450 97 131 300 134 101 60,001
Over 1 year - 2 years 39,400 1,619 636 683 570 450 167 131 200 - - 43,856Over 2 years - 5 years 92,046 63,790 1,907 2,060 2,717 1,387 476 392 - 13 - 164,788Over 5 years 123,941 49,757 3,921 1,032 - 1,025 934 91 - 148 - 180,849
Total 289,912 137,789 6,853 4,456 3,857 3,312 1,674 745 500 295 101 449,494
Note: Excluding liabilities under finance leases of Baht 3,584 million.
The outstanding loans (including long-term loans, debentures and bonds due within one year and
later than one year) as of September 30, 2014 consisted of loans in Baht currency and foreign currencies.
Details of which are as follows: Unit: Million Baht
Long-term loans PTT PTTEP TTM(T) PTTAC HMC EnCo
TTM(M)
DCAP
PTTPL PTTER
PTTNG Total
Baht currency 178,877 27,074 - - 1,953 3,312 - 745 500 - 101 212,562
Foreign currency 111,035 110,715 6,853 4,456 1,904 - 1,674 - - 295 - 236,932Total 289,912 137,789 6,853 4,456 3,857 3,312 1,674 745 500 295 101 449,494
Proportion of long-term
foreign currency loans to
total long-term loans (%)
38% 80% 100% 100% 49% - 100% - - 100% - 53%
As of September 30, 2014, the loans amounting to Baht 4,500 million were guaranteed by the Ministry of Finance.
Economic Overview
Non-recurring items
Overall Performance Segm
entation Performance Analysis of Financial Position
Economic Outlook
PTT Public Company Limited 19
Q3/2014
Equity
As of September 30, 2014, PTT and its subsidiaries had total shareholders’ equity of Baht 899,893
million, increasing by Baht 75,534 million or 9.2% from the year-ended 2013 principally from the followings:
: An increase of Baht 41,915 million in unappropriated retained earnings mainly due to the performance
of PTT and subsidiaries for 9M/2014 amounting to Baht 82,444 million and dividends paid for 2H/2013 and for
1H/2014 performances totaling to Baht 39,985 million.
: An increase of Baht 35,328 million in non-controlling interests mostly from issuance of subordinated
capital debenture (Hybrid Bond) of PTTEP, amounting to Baht 32,207 million.
: A decrease of Baht 1,709 million of other comprehensive income.
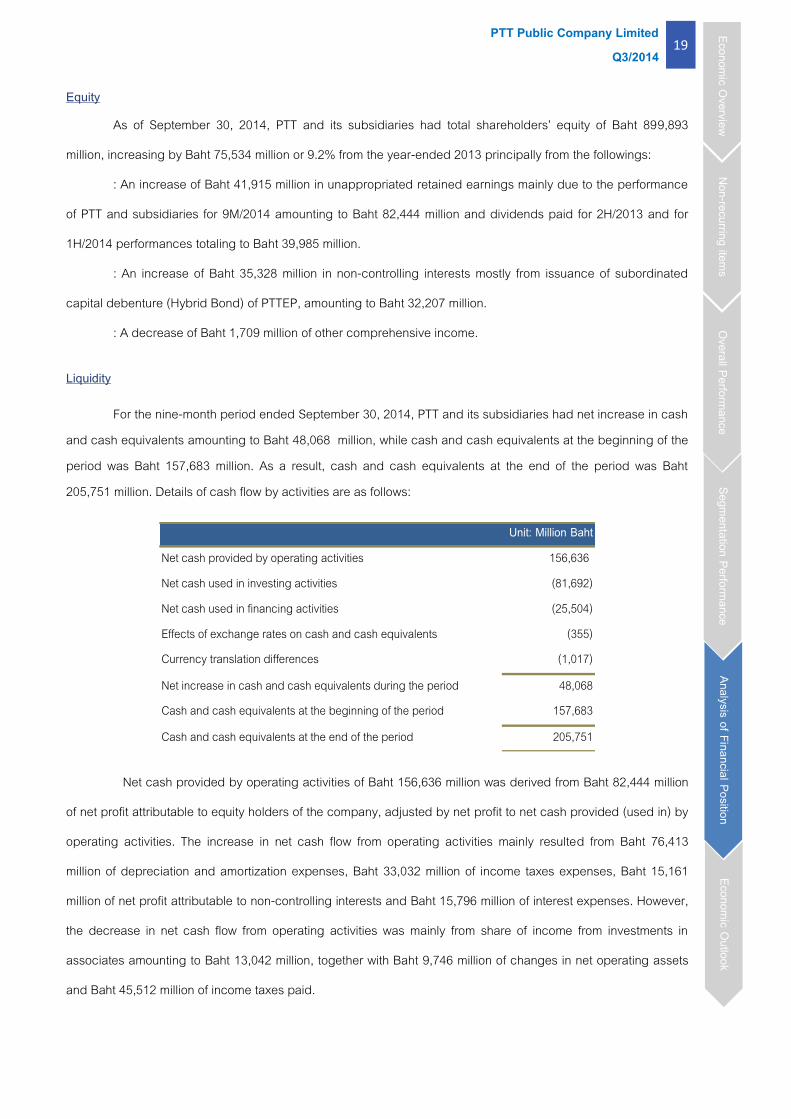
Liquidity
For the nine-month period ended September 30, 2014, PTT and its subsidiaries had net increase in cash and cash equivalents amounting to Baht 48,068 million, while cash and cash equivalents at the beginning of the period was Baht 157,683 million. As a result, cash and cash equivalents at the end of the period was Baht 205,751 million. Details of cash flow by activities are as follows:
Net cash provided by operating activities 156,636 Net cash used in investing activities (81,692)Net cash used in financing activities (25,504)Effects of exchange rates on cash and cash equivalents (355)Currency translation differences (1,017)
Net increase in cash and cash equivalents during the period 48,068Cash and cash equivalents at the beginning of the period 157,683
Cash and cash equivalents at the end of the period 205,751
Unit: Million Baht
Net cash provided by operating activities of Baht 156,636 million was derived from Baht 82,444 million
of net profit attributable to equity holders of the company, adjusted by net profit to net cash provided (used in) by
operating activities. The increase in net cash flow from operating activities mainly resulted from Baht 76,413
million of depreciation and amortization expenses, Baht 33,032 million of income taxes expenses, Baht 15,161
million of net profit attributable to non-controlling interests and Baht 15,796 million of interest expenses. However,
the decrease in net cash flow from operating activities was mainly from share of income from investments in
associates amounting to Baht 13,042 million, together with Baht 9,746 million of changes in net operating assets
and Baht 45,512 million of income taxes paid.
Economic Overview
Non-recurring items
Overall Performance Segm
entation Performance Analysis of Financial Position
Economic Outlook
PTT Public Company Limited 20
Q3/2014
Net cash used in investing activities was Baht 81,693 million resulting mainly from the followings:
: The cash outflow of investments in property, plant and equipment and intangible assets amounting to
Baht 85,098 million mainly due to the additional investments of PTTEP in petroleum exploration and production
assets and intangible assets totaling Baht 61,980 million mainly from the investments in Myanmar Zawtika, Arthit,
and Bongkot projects. In addition, there were investments in various projects of PTT amounting to Baht 21,637
million principally from the Nakorn Sawan pipeline and Nakorn Ratchasima pipeline projects.
: PTTEP’s payment of share acquisition of Hess Corporation’s subsidiaries amounting to Baht 26,338
million.
: PTTEP’s cash received from asset swaps of Canada Oil Sands KKD project totaling Baht 12,576 million.
: Cash received from dividends amounting to Baht 11,534 million.
: The proceeds of long-term investments amounting to Baht 2,696 million derived from Baht 144 million
and Baht 2,417 million of disposal of investments in NNEG and RPCL (30% and 15% shareholdings held by PTT,
respectively) to Global Power Synergy Co.,Ltd. (GPSC) and US$3.85 million or equivalent to Baht 122 million of
the disposal of investment in VLPG (45% shareholdings held by PTT) to PetroVietnam Southern Gas Joint Stock
Company.
Net cash used by financing activities was Baht 25,504 million resulting mainly from the followings:
: The repayment of loans and debentures totaling Baht 35,660 million, principally from the redemption of
PTT’s foreign currency debentures amounting to US$ 400 million, approximately Baht 12,900 million, and the
redemption of PTTEP’s Thai baht debentures amounting to Baht 11,668 million.
: The dividends payment amounting to Baht 31,701 million.
: The interest payment amounting to Baht 14,126 million.
: Cash received from the issuance of PTTEP’s subordinated capital debentures (Hybrid Bond) and Baht
currency debentures amounting to Baht 32,259 million and Baht 19,489 million, respectively.
Economic Overview
Non-recurring items
Overall Performance Segm
entation Performance Analysis of Financial Position
Economic Outlook
PTT Public Company Limited 21
Q3/2014
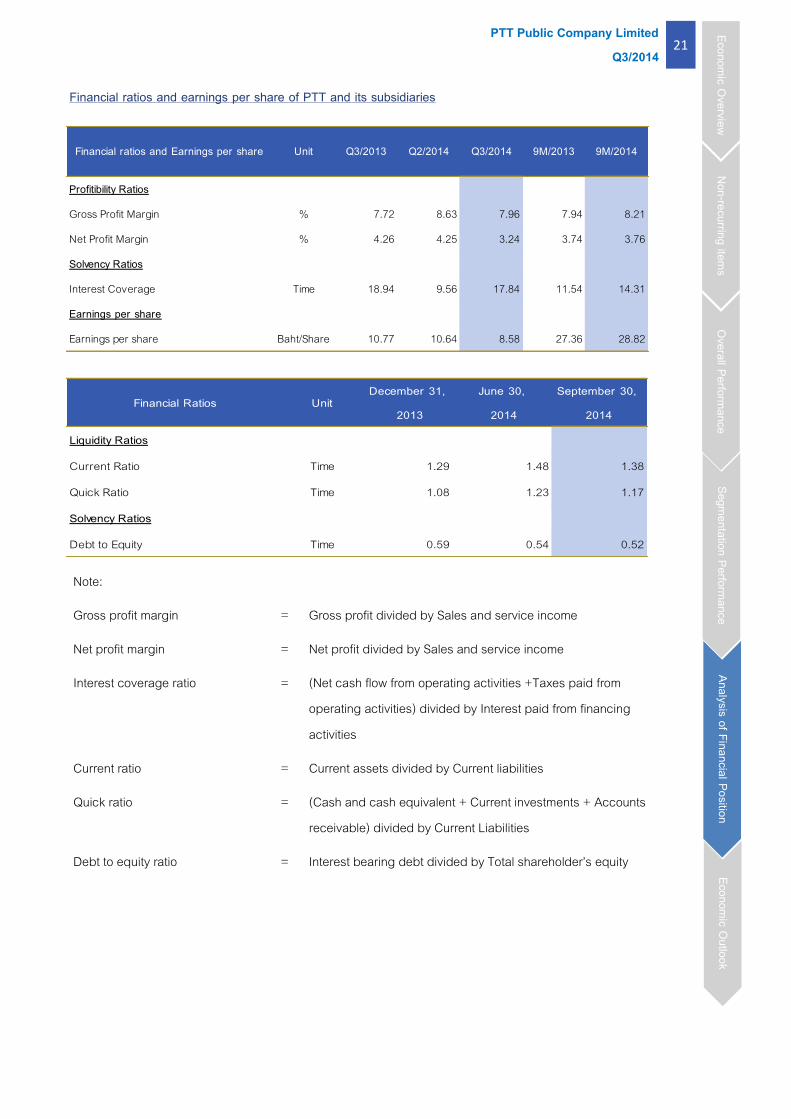
Financial ratios and earnings per share of PTT and its subsidiaries
Profitibility Ratios
Gross Profit Margin % 7.72 8.63 7.96 7.94 8.21
Net Profit Margin % 4.26 4.25 3.24 3.74 3.76
Solvency Ratios
Interest Coverage Time 18.94 9.56 17.84 11.54 14.31
Earnings per share
Earnings per share Baht/Share 10.77 10.64 8.58 27.36 28.82
Financial ratios and Earnings per share Unit Q3/2013 Q2/2014 Q3/2014 9M/2013 9M/2014
Financial Ratios UnitDecember 31,
2013
June 30,
2014
September 30,
2014
Liquidity Ratios
Current Ratio Time 1.29 1.48 1.38
Quick Ratio Time 1.08 1.23 1.17
Solvency Ratios
Debt to Equity Time 0.59 0.54 0.52
Note:
Gross profit margin = Gross profit divided by Sales and service income
Net profit margin = Net profit divided by Sales and service income
Interest coverage ratio = (Net cash flow from operating activities +Taxes paid from operating activities) divided by Interest paid from financing activities
Current ratio = Current assets divided by Current liabilities
Quick ratio = (Cash and cash equivalent + Current investments + Accounts receivable) divided by Current Liabilities
Debt to equity ratio = Interest bearing debt divided by Total shareholder’s equity
Economic Overview
Non-recurring items
Overall Performance Segm
entation Performance Analysis of Financial Position
Economic Outlook
PTT Public Company Limited 22
Q3/2014
Economic Outlook in the fourth quarter of 2014
The world economy in the fourth quarter of 2014 (Q4/2014) is expected to grow at a greater pace than Q3/2014. For advanced economies, economic activities in the US continue to recover especially private consumption, industrial sector and labor market. Therefore, the Fed decides in October to end its QE program but pledges to keep the interest rates low to support the economy. Meanwhile, the growth momentum in the euro area is expected to remain largely the same as in Q3/2014, for developing and emerging countries, the economic growth in China is expected to pick up steam. The government will likely to implement various stimulus measures by focusing real sector to maintain this year growth rate close to the target of 7.5%, such as providing loans to agriculture producers and small businesses and accelerating investments in infrastructure. Thus, risk factors that need to be monitored include geopolitical tensions in the Middle East and Ukraine, risk of deflation in the euro area, real estate slump in China, and monetary policy adjustment of the Fed.
Dubai crude oil price in Q4/2014 is estimated to drop to US$90 per barrel as a result of oversupplied oil market. The prices of petroleum products are expected to be lower than Q3/2014 in line with crude prices. Gasoline 95 price is forecast to shrink compared to the previous quarter on account of low seasonal demand and robust supply from resumed European and Asian refineries production. Diesel price is estimated to fall but the diesel crack is expected to remain stable, even though supply increasing, because winter seasonal demand will be counterbalanced by growing supply. Despite fuel oil price will be lower in Q4/2014, fuel oil crack is anticipated to gain from the plummet Dubai oil price.
Dubai crude cracking in Singapore in Q4/2014 is forecast to grow at around US$6.4 per barrel, resulting from a surge in diesel demand and a slump in crude price.
Olefins price in Q4/2014 is on a downward trend in parallel with declining crude and Naphtha prices. In addition, downstream demand is expected to be low as most buyers will purchase product only to meet short term demand after expecting a fall in price. HDPE and PP prices are expected at US$1,567 and US$1,558 per ton respectively. Likewise, Aromatics price tends to decline with Benzene price expected at US$1,201 per ton since Styrene demand continually weakened and the operating rate of Polystyrene producers estimated at 58% from 63% in Q3/2014. Paraxylene price will drop to US$1,196 per ton as a result of polyester sale tumbled.
The Thai economy in Q4/2014 is expected to expand at a greater pace than Q3/2014 due to government stimulus measures and accelerated budget disbursement will be the main growth drivers. In addition, private consumption and investment continue to rise as well as exports. Nevertheless, risk factors that need to be monitored include household debt that remains high, delays in public investment projects, and monetary policy adjustment of the Fed that may affect the Thai baht.
Economic Overview
Non-recurring items
Overall Performance Segm
entation Performance Analysis of Financial Position
Economic Outlook
PTT Public Company Limited 23
Q3/2014
Appendix
Natural gas business unit consists of PTT Natural Gas Distribution Co., Ltd. (PTTNGD), PTT LNG Co., Ltd
(PTTLNG), the proportionate consolidation of Trans Thai-Malaysia (Thailand) Co.,Ltd. (TTM (T)), Trans Thai-
Malaysia (Malaysia) Sdn. Bhd. (TTM (M)) and District Cooling System and Power Plant Co., Ltd. (DCAP).
Oil business unit consists of PTT (Cambodia) Co., Ltd. (PTTCL), Subic Bay Energy Co., Ltd. (SBECL), PTT Tank
Terminal Co., Ltd. (PTT TANK), PTT Retail Business Co., Ltd. (PTTRB) and the consolidated Thai Lube Blending
Company Limited (TLBC) due to the 100% TLBC’s shareholding acquisition by PTTRB and PTT, and PTT Oil
Myanmar Co., Ltd. (PTTOM).
International trading business unit consists of PTT international business unit and PTT International Trading Pte
Ltd (PTTT).
Petrochemical business unit consists of PTT Polymer Marketing Co., Ltd. (PTTPM), PTT Polymer Logistics Co.,
Ltd. (PTTPL) and PTT PMMA Co., Ltd. (PTTPMMA) and the proportionate consolidation of PTT Asahi Chemical
Co., Ltd. (PTTAC), HMC Polymers Co., Ltd. (HMC) and PTT MCC BioChem Co.,Ltd. (PTTMCC).
Coal business consists of Sakari Resources Ltd. (SAR), International Coal Holdings Pty Ltd (ICH), Straits (Brunei)
Pte Ltd (Straits (Brunei)), and Yoxford Holdings (94.58% shareholding in SAR and 100% shareholdings in the
others, held by PTT Mining Limited (PTTML), a 100% shareholding subsidiary of PTT Energy Resources Company
Limited (PTTER)(Former: PTT International Co., Ltd. (PTTI)).
Other business consists of Energy Complex Co., Ltd. (EnCo), Business Services Alliance Co., Ltd. (BSA), PTT
Green Energy Pte Ltd (PTTGE), PTT Energy Resources Company Limited (PTTER), and PTT Regional Treasury
Center Pte. Ltd. (PTTRTC).
Earnings per share is calculated by dividing net income attributable to ordinary shareholders by the weighted average number of ordinary shares which are held by third parties during the periods.


![PTT Multicasting Scheme [호환 모드] · 2 New PTT Group Add by Mouse right button click 3PTTGrouppg Name Setting 4 PTT Group Number Setting 5 PTT Server Setting 6 PTT Group Session](https://img.pdfslide.us/doc/110x75/5f727989ade5745a8a06acb0/ptt-multicasting-scheme-eeoe-2-new-ptt-group-add-by-mouse-right-button.jpg)