Embed Size (px)
Citation preview
MANAGEMENTPRESENTATION
Fourth Quarter 2020 Earnings
This presentation is complementary to the Company’s conference call to discuss fourthquarter 2020 earnings on February 11, 2021, and should be read in conjunction with theCompany’s earnings release dated February 10, 2021. See pages 11 through 13 forinformation about forward-looking statements, a glossary of defined terms and a relatedreconciliation of non-GAAP financial measures including the reconciliations of Earnings PerShare ("EPS") to Funds From Operations ("FFO") per share and Normalized Funds FromOperations ("Normalized FFO") per share.
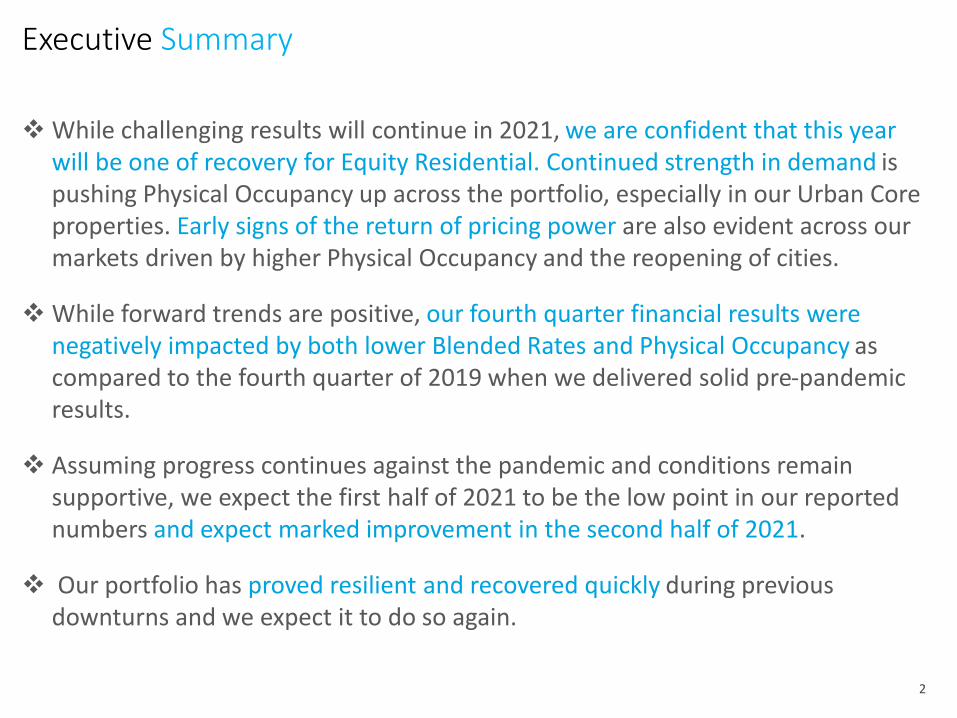
❖ While challenging results will continue in 2021, we are confident that this year will be one of recovery for Equity Residential. Continued strength in demand is pushing Physical Occupancy up across the portfolio, especially in our Urban Core properties. Early signs of the return of pricing power are also evident across our markets driven by higher Physical Occupancy and the reopening of cities.
❖ While forward trends are positive, our fourth quarter financial results were negatively impacted by both lower Blended Rates and Physical Occupancy as compared to the fourth quarter of 2019 when we delivered solid pre-pandemic results.
❖ Assuming progress continues against the pandemic and conditions remain supportive, we expect the first half of 2021 to be the low point in our reported numbers and expect marked improvement in the second half of 2021.
❖ Our portfolio has proved resilient and recovered quickly during previous downturns and we expect it to do so again.
Executive Summary
2
0
1,000
2,000
3,000
4,000
5,000
Jul Aug Sep Oct Nov Dec Jan
Move Outs Move Ins
0
1,000
2,000
3,000
4,000
5,000
Jul Aug Sep Oct Nov Dec Jan
2019-20 2020-21
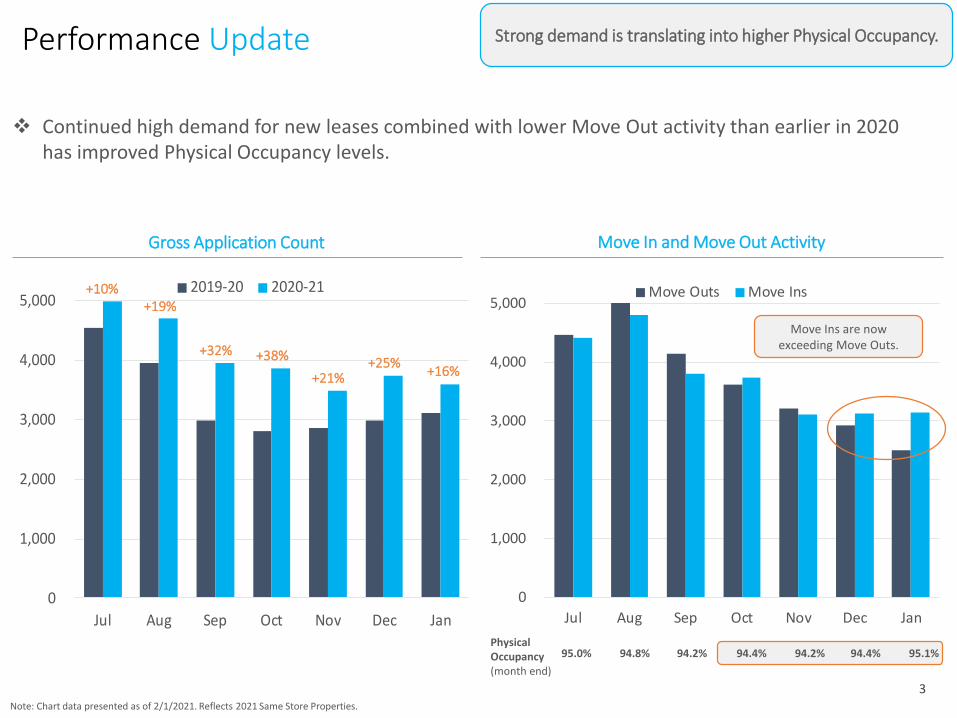
Strong demand is translating into higher Physical Occupancy.
+19%
+32%
+10%
+38%
❖ Continued high demand for new leases combined with lower Move Out activity than earlier in 2020 has improved Physical Occupancy levels.
Physical Occupancy(month end)
Gross Application Count Move In and Move Out Activity
95.0% 94.8% 94.2% 94.4% 94.2% 94.4% 95.1%
+21%+25%
Move Ins are now exceeding Move Outs.
Performance Update
Note: Chart data presented as of 2/1/2021. Reflects 2021 Same Store Properties.
+16%
3
35%
40%
45%
50%
55%
60%
65%
70%
75%
Jan Feb Mar Apr May Jun Jul Aug Sep Oct Nov Dec Jan
Jan 2019- Jan 2020 Jan 2020- Jan 2021
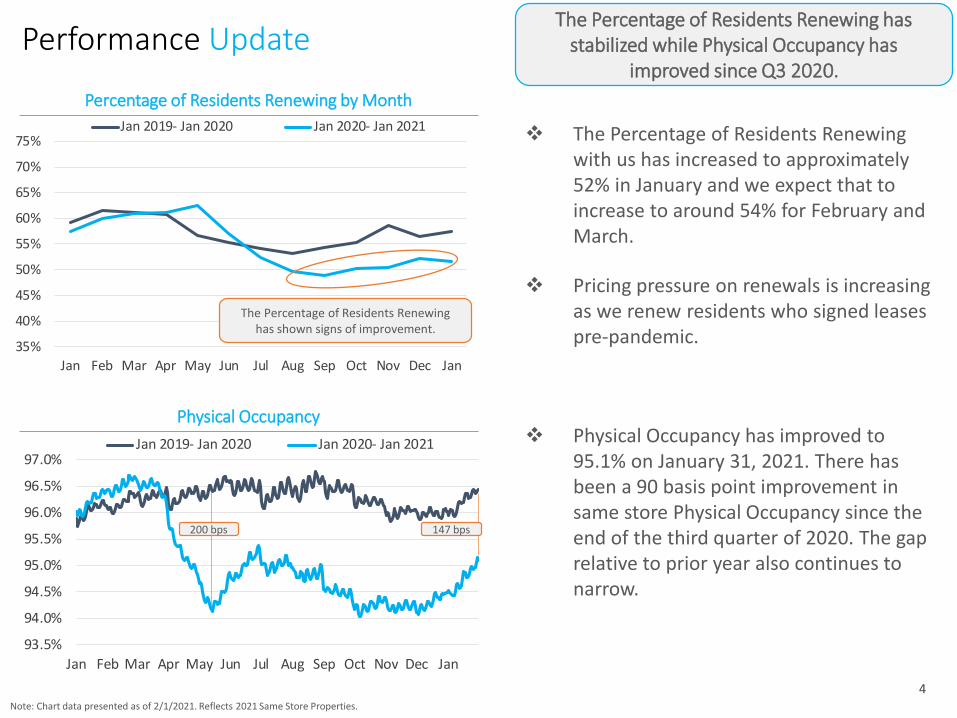
The Percentage of Residents Renewing has stabilized while Physical Occupancy has
improved since Q3 2020.
❖ The Percentage of Residents Renewing with us has increased to approximately 52% in January and we expect that to increase to around 54% for February and March.
❖ Pricing pressure on renewals is increasing as we renew residents who signed leases pre-pandemic.
❖ Physical Occupancy has improved to 95.1% on January 31, 2021. There has been a 90 basis point improvement in same store Physical Occupancy since the end of the third quarter of 2020. The gap relative to prior year also continues to narrow.
Performance Update
Percentage of Residents Renewing by Month
The Percentage of Residents Renewing has shown signs of improvement.
Physical Occupancy
93.5%
94.0%
94.5%
95.0%
95.5%
96.0%
96.5%
97.0%
Jan Feb Mar Apr May Jun Jul Aug Sep Oct Nov Dec Jan
Jan 2019- Jan 2020 Jan 2020- Jan 2021
200 bps 147 bps
Note: Chart data presented as of 2/1/2021. Reflects 2021 Same Store Properties.
4
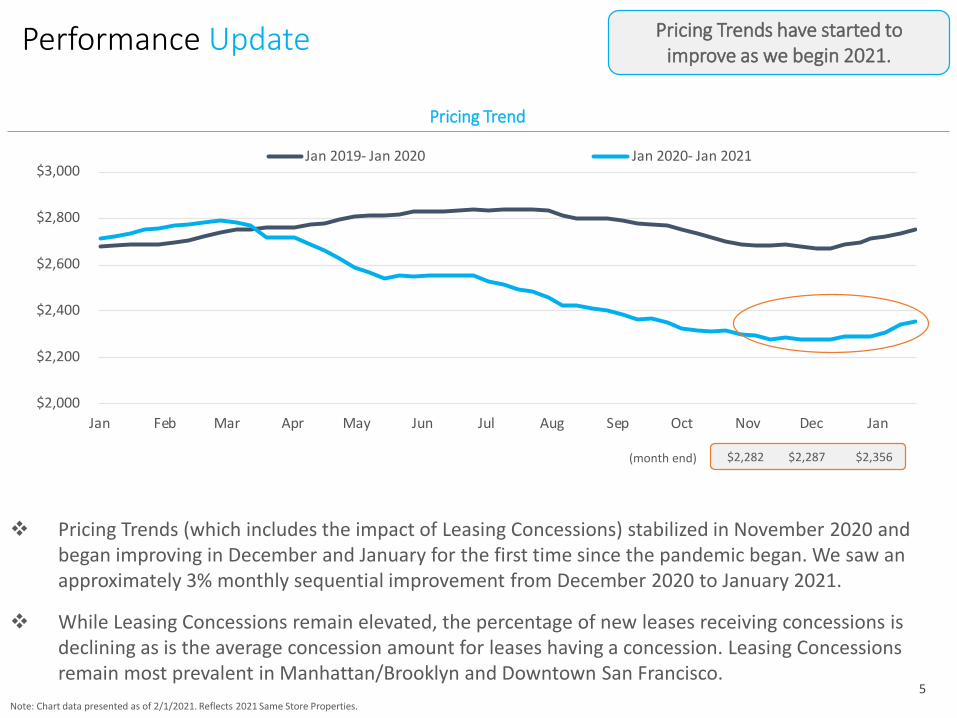
Pricing Trends have started to improve as we begin 2021.
Pricing Trend
❖ Pricing Trends (which includes the impact of Leasing Concessions) stabilized in November 2020 and began improving in December and January for the first time since the pandemic began. We saw an approximately 3% monthly sequential improvement from December 2020 to January 2021.
❖ While Leasing Concessions remain elevated, the percentage of new leases receiving concessions is declining as is the average concession amount for leases having a concession. Leasing Concessions remain most prevalent in Manhattan/Brooklyn and Downtown San Francisco.
Performance Update
$2,000
$2,200
$2,400
$2,600
$2,800
$3,000
Jan Feb Mar Apr May Jun Jul Aug Sep Oct Nov Dec Jan
Jan 2019- Jan 2020 Jan 2020- Jan 2021
(month end) $2,282 $2,287 $2,356
Note: Chart data presented as of 2/1/2021. Reflects 2021 Same Store Properties.
5
40%
45%
50%
55%
60%
65%
70%
75%
Jan Feb Mar Apr May Jun Jul Aug Sep Oct Nov Dec Jan
Jan 2019- Jan 2020 Jan 2020- Jan 2021
0
50
100
150
200
250
300
Jan Feb Mar Apr May Jun Jul Aug Sep Oct Nov Dec Jan
Jan 2019- Jan 2020 Jan 2020- Jan 2021
88.5%
89.5%
90.5%
91.5%
92.5%
93.5%
94.5%
95.5%
96.5%
97.5%
Jan Feb Mar Apr May Jun Jul Aug Sep Oct Nov Dec Jan
Jan 2019- Jan 2020 Jan 2020- Jan 2021
$2,700
$3,000
$3,300
$3,600
$3,900
$4,200
Jan Feb Mar Apr May Jun Jul Aug Sep Oct Nov Dec Jan
Jan 2019- Jan 2020 Jan 2020- Jan 2021
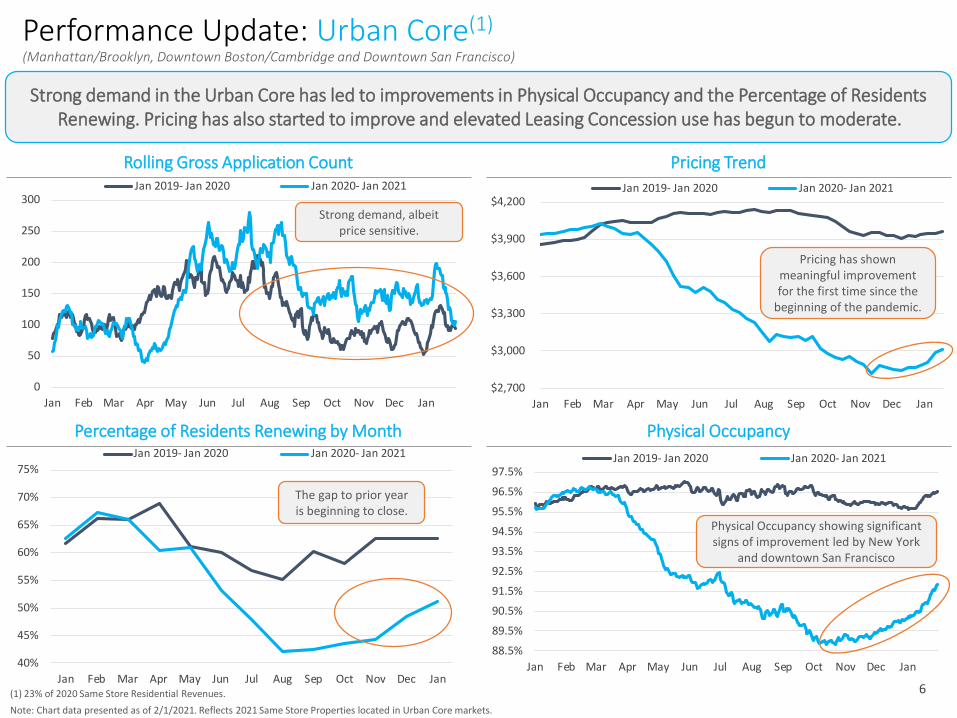
Performance Update: Urban Core(1)
(Manhattan/Brooklyn, Downtown Boston/Cambridge and Downtown San Francisco)
Strong demand in the Urban Core has led to improvements in Physical Occupancy and the Percentage of Residents Renewing. Pricing has also started to improve and elevated Leasing Concession use has begun to moderate.
Percentage of Residents Renewing by Month Physical Occupancy
Rolling Gross Application Count Pricing Trend
Strong demand, albeit price sensitive.
Pricing has shown meaningful improvement for the first time since the
beginning of the pandemic.
The gap to prior year is beginning to close.
Physical Occupancy showing significant signs of improvement led by New York
and downtown San Francisco
(1) 23% of 2020 Same Store Residential Revenues.
Note: Chart data presented as of 2/1/2021. Reflects 2021 Same Store Properties located in Urban Core markets.
6
40%
45%
50%
55%
60%
65%
Jan Feb Mar Apr May Jun Jul Aug Sep Oct Nov Dec Jan
Jan 2019- Jan 2020 Jan 2020- Jan 2021
$2,000
$2,100
$2,200
$2,300
$2,400
$2,500
$2,600
$2,700
Jan Feb Mar Apr May Jun Jul Aug Sep Oct Nov Dec Jan
Jan 2019- Jan 2020 Jan 2020- Jan 2021
0
100
200
300
400
500
600
Jan Feb Mar Apr May Jun Jul Aug Sep Oct Nov Dec Jan
Jan 2019- Jan 2020 Jan 2020- Jan 2021
93.5%
94.0%
94.5%
95.0%
95.5%
96.0%
96.5%
97.0%
Jan Feb Mar Apr May Jun Jul Aug Sep Oct Nov Dec Jan
Jan 2019- Jan 2020 Jan 2020- Jan 2021
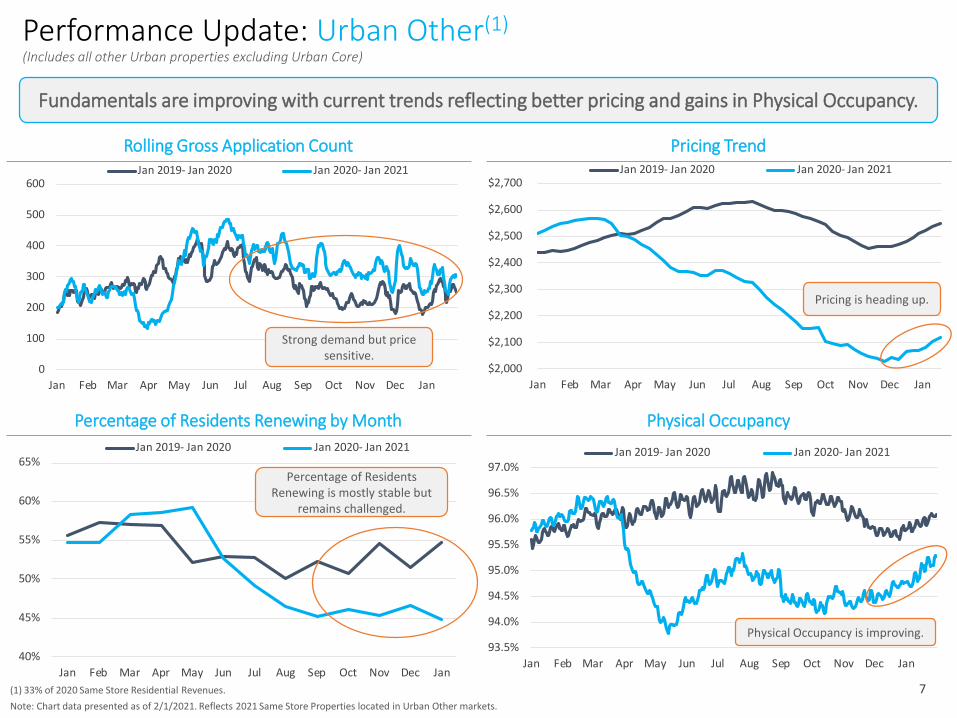
Performance Update: Urban Other(1)
(Includes all other Urban properties excluding Urban Core)
Fundamentals are improving with current trends reflecting better pricing and gains in Physical Occupancy.
Percentage of Residents Renewing by Month Physical Occupancy
Rolling Gross Application Count Pricing Trend
Strong demand but price sensitive.
Pricing is heading up.
Percentage of Residents Renewing is mostly stable but
remains challenged.
Physical Occupancy is improving.
Note: Chart data presented as of 2/1/2021. Reflects 2021 Same Store Properties located in Urban Other markets.
(1) 33% of 2020 Same Store Residential Revenues. 7
95.0%
95.5%
96.0%
96.5%
97.0%
97.5%
Jan Feb Mar Apr May Jun Jul Aug Sep Oct Nov Dec Jan
Jan 2019- Jan 2020 Jan 2020- Jan 2021
40%
45%
50%
55%
60%
65%
70%
Jan Feb Mar Apr May Jun Jul Aug Sep Oct Nov Dec Jan
Jan 2019- Jan 2020 Jan 2020- Jan 2021
$2,000
$2,100
$2,200
$2,300
$2,400
$2,500
$2,600
Jan Feb Mar Apr May Jun Jul Aug Sep Oct Nov Dec Jan
Jan 2019- Jan 2020 Jan 2020- Jan 2021
0
100
200
300
400
500
600
700
800
Jan Feb Mar Apr May Jun Jul Aug Sep Oct Nov Dec Jan
Jan 2019- Jan 2020 Jan 2020- Jan 2021
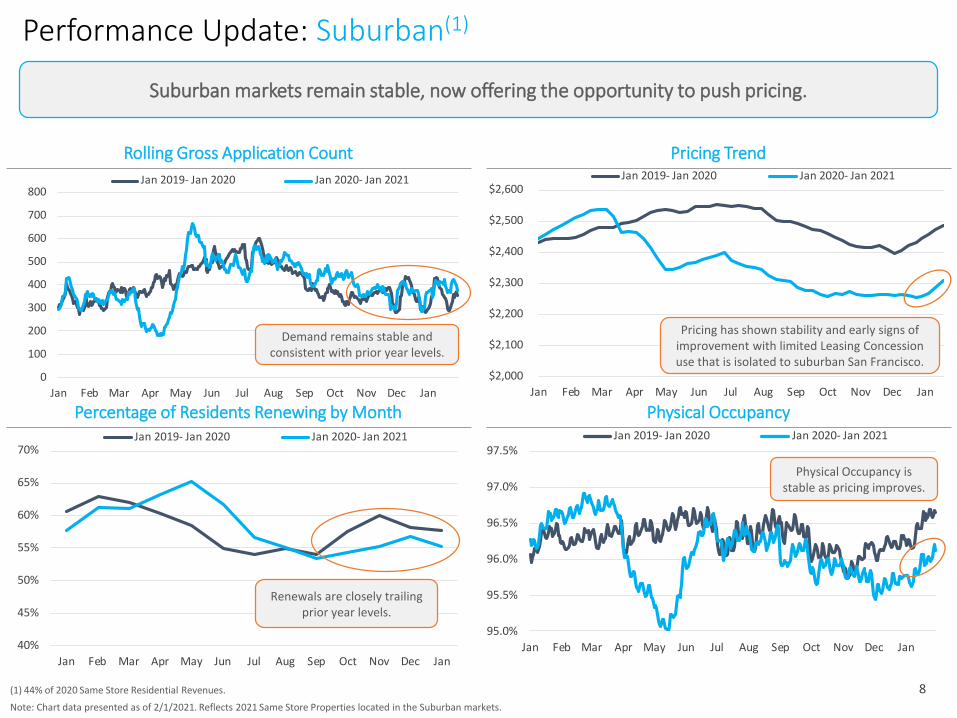
Note: Chart data presented as of 2/1/2021. Reflects 2021 Same Store Properties located in the Suburban markets.
Performance Update: Suburban(1)
Suburban markets remain stable, now offering the opportunity to push pricing.
Percentage of Residents Renewing by Month Physical Occupancy
Rolling Gross Application Count Pricing Trend
Demand remains stable and consistent with prior year levels.
Pricing has shown stability and early signs of improvement with limited Leasing Concession use that is isolated to suburban San Francisco.
Renewals are closely trailing prior year levels.
Physical Occupancy is stable as pricing improves.
(1) 44% of 2020 Same Store Residential Revenues. 8
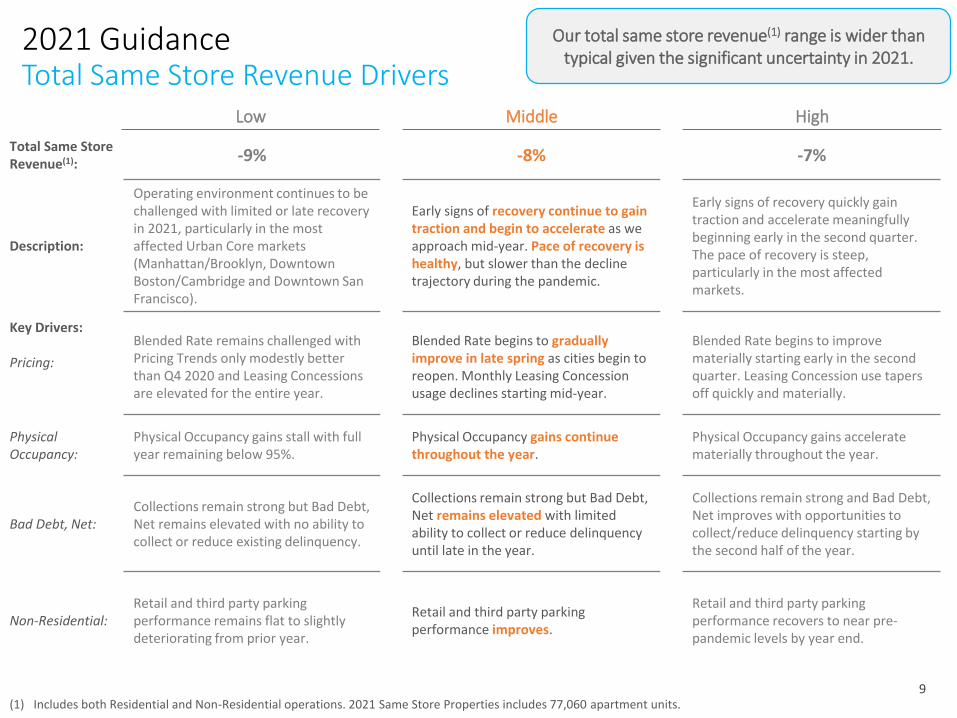
Total Same Store Revenue(1):
-9% -8% -7%
Description:
Operating environment continues to be challenged with limited or late recovery in 2021, particularly in the most affected Urban Core markets (Manhattan/Brooklyn, Downtown Boston/Cambridge and Downtown San Francisco).
Early signs of recovery continue to gain traction and begin to accelerate as we approach mid-year. Pace of recovery is healthy, but slower than the decline trajectory during the pandemic.
Early signs of recovery quickly gain traction and accelerate meaningfully beginning early in the second quarter. The pace of recovery is steep, particularly in the most affected markets.
Key Drivers:
Pricing:
Blended Rate remains challenged with Pricing Trends only modestly better than Q4 2020 and Leasing Concessions are elevated for the entire year.
Blended Rate begins to graduallyimprove in late spring as cities begin to reopen. Monthly Leasing Concession usage declines starting mid-year.
Blended Rate begins to improve materially starting early in the second quarter. Leasing Concession use tapers off quickly and materially.
Physical Occupancy:
Physical Occupancy gains stall with full year remaining below 95%.
Physical Occupancy gains continue throughout the year.
Physical Occupancy gains accelerate materially throughout the year.
Bad Debt, Net:Collections remain strong but Bad Debt, Net remains elevated with no ability to collect or reduce existing delinquency.
Collections remain strong but Bad Debt, Net remains elevated with limited ability to collect or reduce delinquency until late in the year.
Collections remain strong and Bad Debt, Net improves with opportunities to collect/reduce delinquency starting by the second half of the year.
Non-Residential:Retail and third party parking performance remains flat to slightly deteriorating from prior year.
Retail and third party parking performance improves.
Retail and third party parking performance recovers to near pre-pandemic levels by year end.
Our total same store revenue(1) range is wider than typical given the significant uncertainty in 2021.
Low HighMiddle
2021 GuidanceTotal Same Store Revenue Drivers
(1) Includes both Residential and Non-Residential operations. 2021 Same Store Properties includes 77,060 apartment units.9
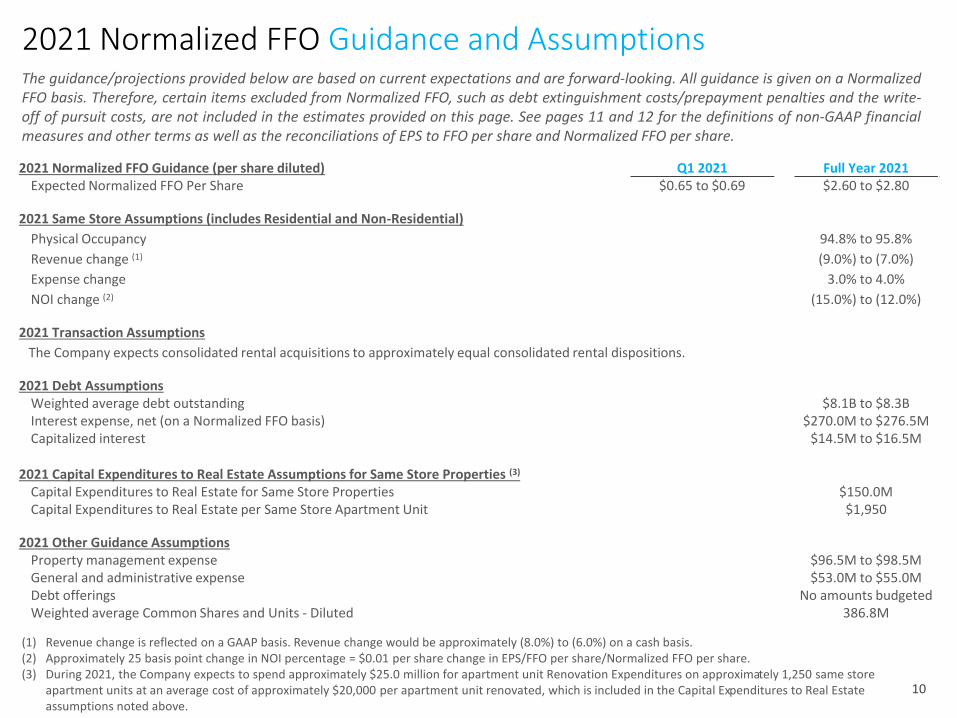
2021 Normalized FFO Guidance and AssumptionsThe guidance/projections provided below are based on current expectations and are forward-looking. All guidance is given on a NormalizedFFO basis. Therefore, certain items excluded from Normalized FFO, such as debt extinguishment costs/prepayment penalties and the write-off of pursuit costs, are not included in the estimates provided on this page. See pages 11 and 12 for the definitions of non-GAAP financialmeasures and other terms as well as the reconciliations of EPS to FFO per share and Normalized FFO per share.
(1) Revenue change is reflected on a GAAP basis. Revenue change would be approximately (8.0%) to (6.0%) on a cash basis.(2) Approximately 25 basis point change in NOI percentage = $0.01 per share change in EPS/FFO per share/Normalized FFO per share.(3) During 2021, the Company expects to spend approximately $25.0 million for apartment unit Renovation Expenditures on approximately 1,250 same store
apartment units at an average cost of approximately $20,000 per apartment unit renovated, which is included in the Capital Expenditures to Real Estate assumptions noted above.
10
2021 Normalized FFO Guidance (per share diluted) Q1 2021 Full Year 2021Expected Normalized FFO Per Share $0.65 to $0.69 $2.60 to $2.80
2021 Same Store Assumptions (includes Residential and Non-Residential)
Physical Occupancy 94.8% to 95.8%
Revenue change (1) (9.0%) to (7.0%)
Expense change 3.0% to 4.0%
NOI change (2) (15.0%) to (12.0%)
2021 Transaction Assumptions
The Company expects consolidated rental acquisitions to approximately equal consolidated rental dispositions.
2021 Debt AssumptionsWeighted average debt outstanding $8.1B to $8.3BInterest expense, net (on a Normalized FFO basis) $270.0M to $276.5MCapitalized interest $14.5M to $16.5M
2021 Capital Expenditures to Real Estate Assumptions for Same Store Properties (3)
Capital Expenditures to Real Estate for Same Store Properties $150.0MCapital Expenditures to Real Estate per Same Store Apartment Unit $1,950
2021 Other Guidance AssumptionsProperty management expense $96.5M to $98.5MGeneral and administrative expense $53.0M to $55.0MDebt offerings No amounts budgetedWeighted average Common Shares and Units - Diluted 386.8M
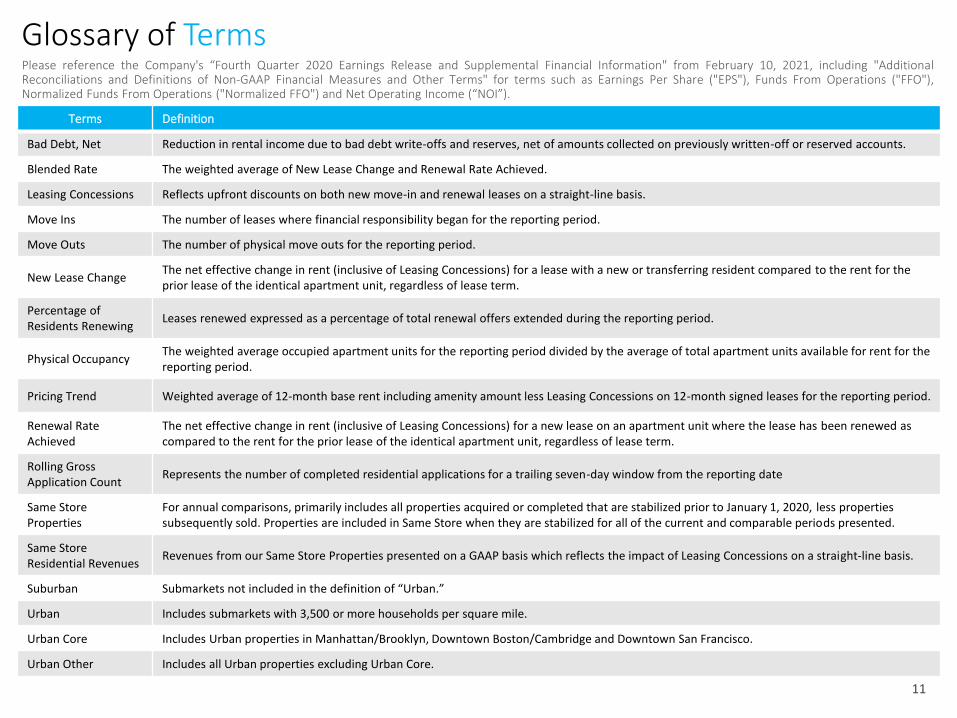
Glossary of Terms
Terms Definition
Bad Debt, Net Reduction in rental income due to bad debt write-offs and reserves, net of amounts collected on previously written-off or reserved accounts.
Blended Rate The weighted average of New Lease Change and Renewal Rate Achieved.
Leasing Concessions Reflects upfront discounts on both new move-in and renewal leases on a straight-line basis.
Move Ins The number of leases where financial responsibility began for the reporting period.
Move Outs The number of physical move outs for the reporting period.
New Lease ChangeThe net effective change in rent (inclusive of Leasing Concessions) for a lease with a new or transferring resident compared to the rent for the prior lease of the identical apartment unit, regardless of lease term.
Percentage of Residents Renewing
Leases renewed expressed as a percentage of total renewal offers extended during the reporting period.
Physical OccupancyThe weighted average occupied apartment units for the reporting period divided by the average of total apartment units available for rent for the reporting period.
Pricing Trend Weighted average of 12-month base rent including amenity amount less Leasing Concessions on 12-month signed leases for the reporting period.
Renewal Rate Achieved
The net effective change in rent (inclusive of Leasing Concessions) for a new lease on an apartment unit where the lease has been renewed as compared to the rent for the prior lease of the identical apartment unit, regardless of lease term.
Rolling Gross Application Count
Represents the number of completed residential applications for a trailing seven-day window from the reporting date
Same Store Properties
For annual comparisons, primarily includes all properties acquired or completed that are stabilized prior to January 1, 2020, less properties subsequently sold. Properties are included in Same Store when they are stabilized for all of the current and comparable periods presented.
Same Store Residential Revenues
Revenues from our Same Store Properties presented on a GAAP basis which reflects the impact of Leasing Concessions on a straight-line basis.
Suburban Submarkets not included in the definition of “Urban.”
Urban Includes submarkets with 3,500 or more households per square mile.
Urban Core Includes Urban properties in Manhattan/Brooklyn, Downtown Boston/Cambridge and Downtown San Francisco.
Urban Other Includes all Urban properties excluding Urban Core.
Please reference the Company's “Fourth Quarter 2020 Earnings Release and Supplemental Financial Information" from February 10, 2021, including "AdditionalReconciliations and Definitions of Non-GAAP Financial Measures and Other Terms" for terms such as Earnings Per Share ("EPS"), Funds From Operations ("FFO"),Normalized Funds From Operations ("Normalized FFO") and Net Operating Income (“NOI”).
11
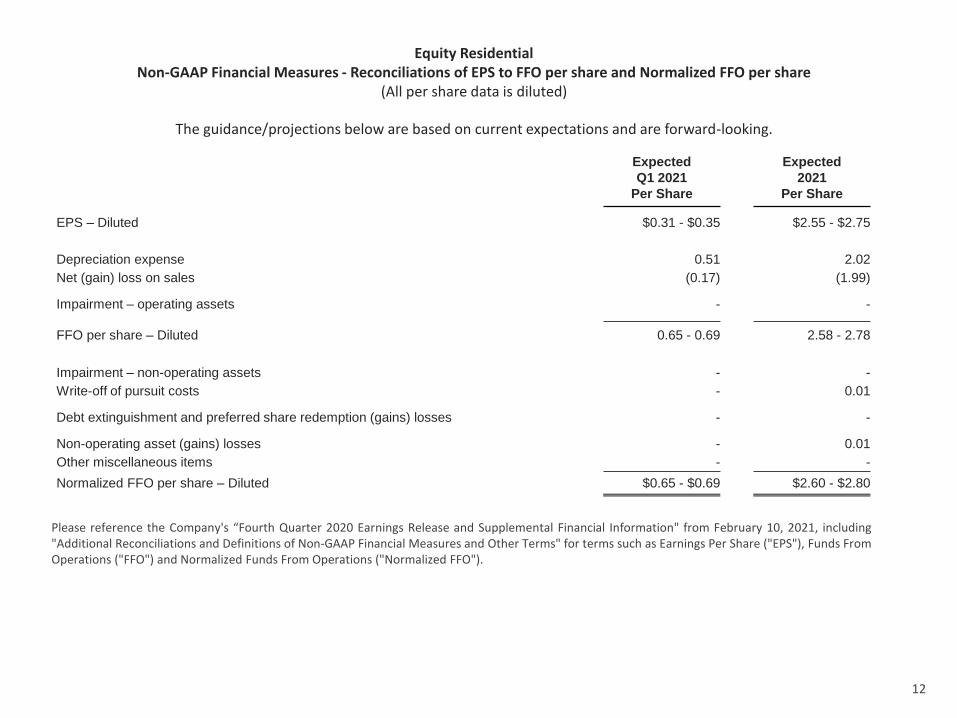
Please reference the Company's “Fourth Quarter 2020 Earnings Release and Supplemental Financial Information" from February 10, 2021, including"Additional Reconciliations and Definitions of Non-GAAP Financial Measures and Other Terms" for terms such as Earnings Per Share ("EPS"), Funds FromOperations ("FFO") and Normalized Funds From Operations ("Normalized FFO").
Equity ResidentialNon-GAAP Financial Measures - Reconciliations of EPS to FFO per share and Normalized FFO per share
(All per share data is diluted)
The guidance/projections below are based on current expectations and are forward-looking.
Expected
Q1 2021
Per Share
Expected
2021
Per Share
EPS – Diluted $0.31 - $0.35 $2.55 - $2.75
Depreciation expense 0.51 2.02
Net (gain) loss on sales (0.17) (1.99)
Impairment – operating assets - -
FFO per share – Diluted 0.65 - 0.69 2.58 - 2.78
Impairment – non-operating assets - -
Write-off of pursuit costs - 0.01
Debt extinguishment and preferred share redemption (gains) losses - -
Non-operating asset (gains) losses - 0.01
Other miscellaneous items - -
Normalized FFO per share – Diluted $0.65 - $0.69 $2.60 - $2.80
12
In addition to historical information, this presentation contains forward-looking statements and
information within the meaning of the federal securities laws. These statements are based on current
expectations, estimates, projections and assumptions made by management. While Equity Residential’s
management believes the assumptions underlying its forward-looking statements are reasonable, such
information is inherently subject to uncertainties and may involve certain risks, including, without
limitation, changes in general market conditions, including the rate of job growth and cost of labor and
construction material, the level of new multifamily construction and development, competition and local
government regulation. In addition, these forward-looking statements are subject to risks related to the
COVID-19 pandemic, many of which are unknown, including the duration and severity of the pandemic,
the extent of the adverse health impact on the general population and on our residents, customers and
employees in particular, its impact on the employment rate and the economy and the corresponding
impact on our residents’ and tenants’ ability to pay their rent on time or at all, the extent and impact of
governmental responses, the rollout and effectiveness of vaccines and the impact of operational changes
we have implemented and may implement in response to the pandemic. Other risks and uncertainties are
described under the heading “Risk Factors” in our Annual Report on Form 10-K and subsequent periodic
reports filed with the Securities and Exchange Commission (SEC) and available on our
website, www.equityapartments.com. Many of these uncertainties and risks are difficult to predict and
beyond management’s control. Forward-looking statements are not guarantees of future performance,
results or events. Equity Residential assumes no obligation to update or supplement forward-looking
statements that become untrue because of subsequent events.
Forward-Looking Statements
13


![INDEX [s1.q4cdn.com]s1.q4cdn.com/454432842/files/doc_financials/2018/Q1/a... · · 2017-05-23salesforce.com, inc. (Exact name of ... Deferred revenue 5,042,652 5,542,802 ... •](https://img.pdfslide.us/doc/110x75/5b0139c27f8b9af1148dd2d5/index-s1q4cdncoms1q4cdncom454432842filesdocfinancials2018q1a2017-05-.jpg)


![Welcome [s1.q4cdn.com]s1.q4cdn.com/238390398/files/events/2015/Investor-Day...Welcome ... 2015](https://img.pdfslide.us/doc/110x75/606d74afdb056960d75bcfbe/welcome-s1q4cdncoms1q4cdncom238390398filesevents2015investor-day-welcome.jpg)